Cities with the Highest Percentage of Cree Population in the United States
RELATED REPORTS & OPTIONS
Cree
United States
Compare Cities
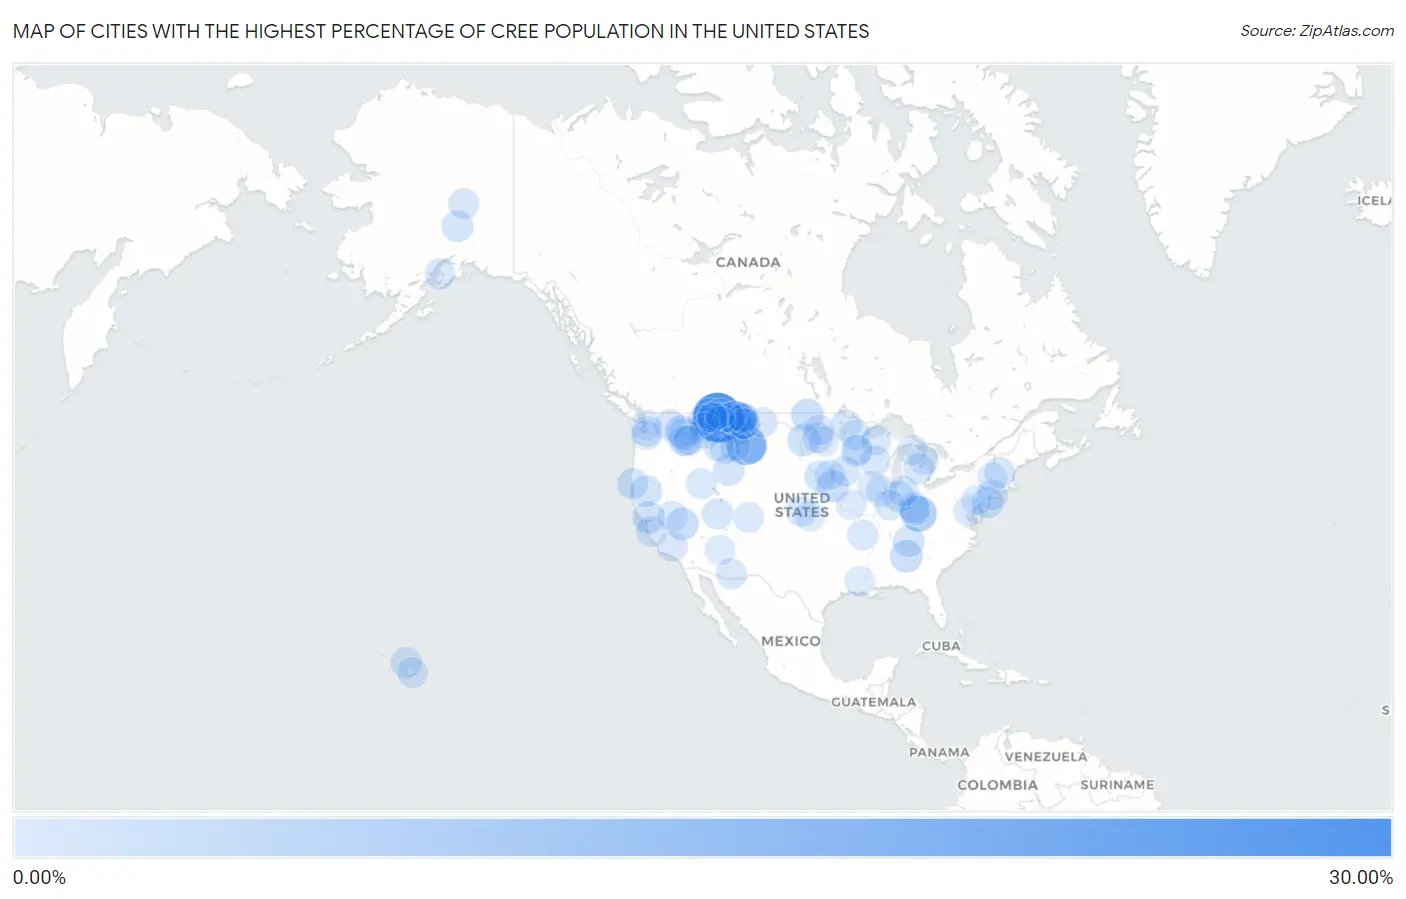
Map of Cities with the Highest Percentage of Cree Population in the United States
0.00%
30.00%
Cities with the Highest Percentage of Cree Population in the United States
| City | Cree | vs State | vs National | |
| 1. | Little Browning | 28.81% | 0.19%(+28.6)#1 | 0.0041%(+28.8)#1 |
| 2. | Shepherd | 14.25% | 0.19%(+14.1)#2 | 0.0041%(+14.2)#2 |
| 3. | Parker School | 13.70% | 0.19%(+13.5)#3 | 0.0041%(+13.7)#3 |
| 4. | Rocky Boy West | 11.53% | 0.19%(+11.3)#4 | 0.0041%(+11.5)#4 |
| 5. | Augusta | 8.38% | 0.0057%(+8.37)#1 | 0.0041%(+8.38)#5 |
| 6. | Dutton | 8.30% | 0.19%(+8.12)#5 | 0.0041%(+8.30)#6 |
| 7. | Heart Butte | 4.33% | 0.19%(+4.15)#6 | 0.0041%(+4.33)#7 |
| 8. | Green Acres | 3.93% | 0.021%(+3.91)#1 | 0.0041%(+3.92)#8 |
| 9. | Goldfield | 3.77% | 0.0041%(+3.77)#1 | 0.0041%(+3.77)#9 |
| 10. | Ballplay | 3.64% | 0.0013%(+3.64)#1 | 0.0041%(+3.64)#10 |
| 11. | Winifred | 3.59% | 0.19%(+3.40)#7 | 0.0041%(+3.59)#11 |
| 12. | Rosalia | 3.34% | 0.015%(+3.32)#1 | 0.0041%(+3.33)#12 |
| 13. | Allendale | 3.31% | 0.0043%(+3.31)#1 | 0.0041%(+3.31)#13 |
| 14. | Tekamah | 3.30% | 0.0040%(+3.30)#1 | 0.0041%(+3.30)#14 |
| 15. | Hazelton | 3.27% | 0.021%(+3.25)#2 | 0.0041%(+3.27)#15 |
| 16. | Arlee | 2.89% | 0.19%(+2.70)#8 | 0.0041%(+2.88)#16 |
| 17. | Farmington | 2.78% | 0.015%(+2.76)#2 | 0.0041%(+2.77)#17 |
| 18. | Browning | 2.76% | 0.19%(+2.57)#9 | 0.0041%(+2.75)#18 |
| 19. | Hardin | 2.71% | 0.19%(+2.52)#10 | 0.0041%(+2.70)#19 |
| 20. | Cantwell | 2.56% | 0.027%(+2.54)#1 | 0.0041%(+2.56)#20 |
| 21. | Dunsmuir | 2.45% | 0.0043%(+2.44)#2 | 0.0041%(+2.44)#21 |
| 22. | Spencer | 2.38% | 0.0012%(+2.38)#1 | 0.0041%(+2.38)#22 |
| 23. | Cedar Glen West | 2.26% | 0.0020%(+2.26)#1 | 0.0041%(+2.26)#23 |
| 24. | Babb | 2.21% | 0.19%(+2.03)#11 | 0.0041%(+2.21)#24 |
| 25. | Rafter J Ranch | 2.19% | 0.022%(+2.17)#1 | 0.0041%(+2.19)#25 |
| 26. | Mohawk | 2.14% | 0.0036%(+2.13)#1 | 0.0041%(+2.13)#26 |
| 27. | Santee | 1.91% | 0.0040%(+1.90)#2 | 0.0041%(+1.90)#27 |
| 28. | Harbor | 1.90% | 0.011%(+1.89)#1 | 0.0041%(+1.89)#28 |
| 29. | Azure | 1.81% | 0.19%(+1.63)#12 | 0.0041%(+1.81)#29 |
| 30. | Shelby | 1.73% | 0.19%(+1.55)#13 | 0.0041%(+1.73)#30 |
| 31. | Lodge Pole | 1.67% | 0.19%(+1.49)#14 | 0.0041%(+1.67)#31 |
| 32. | Meadow | 1.64% | 0.0019%(+1.64)#1 | 0.0041%(+1.64)#32 |
| 33. | Hana | 1.50% | 0.0030%(+1.50)#1 | 0.0041%(+1.50)#33 |
| 34. | Electric City | 1.50% | 0.015%(+1.49)#3 | 0.0041%(+1.50)#34 |
| 35. | Chena Ridge | 1.48% | 0.027%(+1.46)#2 | 0.0041%(+1.48)#35 |
| 36. | Reynolds | 1.47% | 0.0013%(+1.46)#1 | 0.0041%(+1.46)#36 |
| 37. | Shafer | 1.44% | 0.011%(+1.43)#1 | 0.0041%(+1.44)#37 |
| 38. | Northome | 1.39% | 0.011%(+1.38)#2 | 0.0041%(+1.38)#38 |
| 39. | Clarkston | 1.38% | 0.015%(+1.37)#4 | 0.0041%(+1.38)#39 |
| 40. | College Corner | 1.36% | 0.0015%(+1.35)#1 | 0.0041%(+1.35)#40 |
| 41. | Auburn | 1.35% | 0.0036%(+1.35)#2 | 0.0041%(+1.35)#41 |
| 42. | Elkhorn | 1.32% | 0.0043%(+1.32)#3 | 0.0041%(+1.32)#42 |
| 43. | Litchville | 1.32% | 0.021%(+1.29)#3 | 0.0041%(+1.31)#43 |
| 44. | Columbia Falls | 1.31% | 0.19%(+1.12)#15 | 0.0041%(+1.30)#44 |
| 45. | Babcock | 1.30% | 0.0049%(+1.29)#1 | 0.0041%(+1.29)#45 |
| 46. | Hays | 1.28% | 0.19%(+1.09)#16 | 0.0041%(+1.27)#46 |
| 47. | Saxtons River | 1.26% | 0.0089%(+1.25)#1 | 0.0041%(+1.26)#47 |
| 48. | Bureau Junction | 1.21% | 0.0018%(+1.21)#1 | 0.0041%(+1.21)#48 |
| 49. | Georgetown Quitman County Unified Government | 1.19% | 0.00050%(+1.19)#1 | 0.0041%(+1.19)#49 |
| 50. | New Burlington | 1.18% | 0.0015%(+1.18)#2 | 0.0041%(+1.18)#50 |
| 51. | Swea City | 1.16% | 0.0028%(+1.16)#1 | 0.0041%(+1.16)#51 |
| 52. | Mescal | 1.16% | 0.0053%(+1.15)#1 | 0.0041%(+1.15)#52 |
| 53. | Floodwood | 1.14% | 0.011%(+1.13)#3 | 0.0041%(+1.14)#53 |
| 54. | Viola | 1.11% | 0.0028%(+1.11)#1 | 0.0041%(+1.11)#54 |
| 55. | Jackpot | 1.07% | 0.0041%(+1.07)#2 | 0.0041%(+1.07)#55 |
| 56. | Bourbon | 1.03% | 0.0013%(+1.03)#2 | 0.0041%(+1.03)#56 |
| 57. | Brookville | 1.00% | 0.0023%(+1.00)#1 | 0.0041%(+1.000)#57 |
| 58. | Fern Forest | 0.97% | 0.0030%(+0.968)#2 | 0.0041%(+0.967)#58 |
| 59. | Wakefield | 0.97% | 0.0036%(+0.962)#3 | 0.0041%(+0.961)#59 |
| 60. | Bear Valley Springs | 0.95% | 0.0043%(+0.942)#4 | 0.0041%(+0.943)#60 |
| 61. | Montrose | 0.90% | 0.0086%(+0.894)#1 | 0.0041%(+0.898)#61 |
| 62. | Cohoe | 0.86% | 0.027%(+0.828)#3 | 0.0041%(+0.851)#62 |
| 63. | Polson | 0.84% | 0.19%(+0.656)#17 | 0.0041%(+0.839)#63 |
| 64. | Frazer | 0.82% | 0.19%(+0.635)#18 | 0.0041%(+0.818)#64 |
| 65. | Grainfield | 0.80% | 0.0067%(+0.793)#1 | 0.0041%(+0.796)#65 |
| 66. | Layhill | 0.80% | 0.0029%(+0.792)#1 | 0.0041%(+0.791)#66 |
| 67. | Gallatin Gateway | 0.79% | 0.19%(+0.603)#19 | 0.0041%(+0.786)#67 |
| 68. | Newman | 0.77% | 0.0018%(+0.767)#2 | 0.0041%(+0.765)#68 |
| 69. | Culdesac | 0.77% | 0.037%(+0.728)#1 | 0.0041%(+0.761)#69 |
| 70. | Jewett City Borough | 0.76% | 0.0048%(+0.757)#1 | 0.0041%(+0.757)#70 |
| 71. | Cooperstown | 0.75% | 0.021%(+0.726)#4 | 0.0041%(+0.743)#71 |
| 72. | Harlem | 0.70% | 0.19%(+0.510)#20 | 0.0041%(+0.692)#72 |
| 73. | Verde Village | 0.67% | 0.0053%(+0.669)#2 | 0.0041%(+0.671)#73 |
| 74. | Whitfield | 0.66% | 0.00065%(+0.664)#1 | 0.0041%(+0.660)#74 |
| 75. | Hawthorne | 0.66% | 0.0041%(+0.653)#3 | 0.0041%(+0.653)#75 |
| 76. | Stonebridge | 0.65% | 0.0020%(+0.648)#2 | 0.0041%(+0.646)#76 |
| 77. | Chillicothe | 0.64% | 0.0027%(+0.635)#1 | 0.0041%(+0.634)#77 |
| 78. | Hawarden | 0.64% | 0.0028%(+0.633)#2 | 0.0041%(+0.632)#78 |
| 79. | Pimlico | 0.63% | 0.0014%(+0.626)#1 | 0.0041%(+0.623)#79 |
| 80. | Fort Belknap Agency | 0.61% | 0.19%(+0.424)#21 | 0.0041%(+0.607)#80 |
| 81. | Peck | 0.61% | 0.037%(+0.569)#2 | 0.0041%(+0.602)#81 |
| 82. | La Crosse | 0.60% | 0.0067%(+0.596)#2 | 0.0041%(+0.598)#82 |
| 83. | Milnor | 0.60% | 0.021%(+0.580)#5 | 0.0041%(+0.597)#83 |
| 84. | Au Sable | 0.60% | 0.0036%(+0.596)#4 | 0.0041%(+0.596)#84 |
| 85. | Lake Stickney | 0.59% | 0.015%(+0.578)#5 | 0.0041%(+0.589)#85 |
| 86. | Big Timber | 0.59% | 0.19%(+0.401)#22 | 0.0041%(+0.583)#86 |
| 87. | Wynantskill | 0.57% | 0.0023%(+0.568)#2 | 0.0041%(+0.566)#87 |
| 88. | Mccausland | 0.57% | 0.0028%(+0.565)#3 | 0.0041%(+0.564)#88 |
| 89. | Pacific | 0.56% | 0.015%(+0.549)#6 | 0.0041%(+0.560)#89 |
| 90. | Harbor Springs | 0.55% | 0.0036%(+0.546)#5 | 0.0041%(+0.546)#90 |
| 91. | Rudyard | 0.54% | 0.19%(+0.349)#23 | 0.0041%(+0.532)#91 |
| 92. | Conrad | 0.53% | 0.19%(+0.343)#24 | 0.0041%(+0.526)#92 |
| 93. | Eatonville | 0.53% | 0.015%(+0.512)#7 | 0.0041%(+0.523)#93 |
| 94. | Sunburst | 0.51% | 0.19%(+0.323)#25 | 0.0041%(+0.506)#94 |
| 95. | Woodlawn Cdp Fairfax County | 0.51% | 0.0020%(+0.503)#1 | 0.0041%(+0.501)#95 |
| 96. | Taylors Falls | 0.49% | 0.011%(+0.481)#4 | 0.0041%(+0.488)#96 |
| 97. | South Browning | 0.48% | 0.19%(+0.297)#26 | 0.0041%(+0.480)#97 |
| 98. | Timberline-Fernwood | 0.45% | 0.0053%(+0.442)#3 | 0.0041%(+0.443)#98 |
| 99. | Whitehall | 0.44% | 0.19%(+0.256)#27 | 0.0041%(+0.439)#99 |
| 100. | Cheneyville | 0.44% | 0.00084%(+0.441)#1 | 0.0041%(+0.438)#100 |
Common Questions
What are the Top 10 Cities with the Highest Percentage of Cree Population in the United States?
Top 10 Cities with the Highest Percentage of Cree Population in the United States are:
#1
28.81%
#2
14.25%
#3
13.70%
#4
11.53%
#5
8.38%
#6
8.30%
#7
4.33%
#8
3.93%
#9
3.77%
#10
3.64%
What city has the Highest Percentage of Cree Population in the United States?
Little Browning has the Highest Percentage of Cree Population in the United States with 28.81%.
What is the Percentage of Cree Population in the United States?
Percentage of Cree Population in the United States is 0.0041%.