Cities with the Highest Percentage of Immigrants from Kuwait in the United States
RELATED REPORTS & OPTIONS
Kuwait
United States
Compare Cities
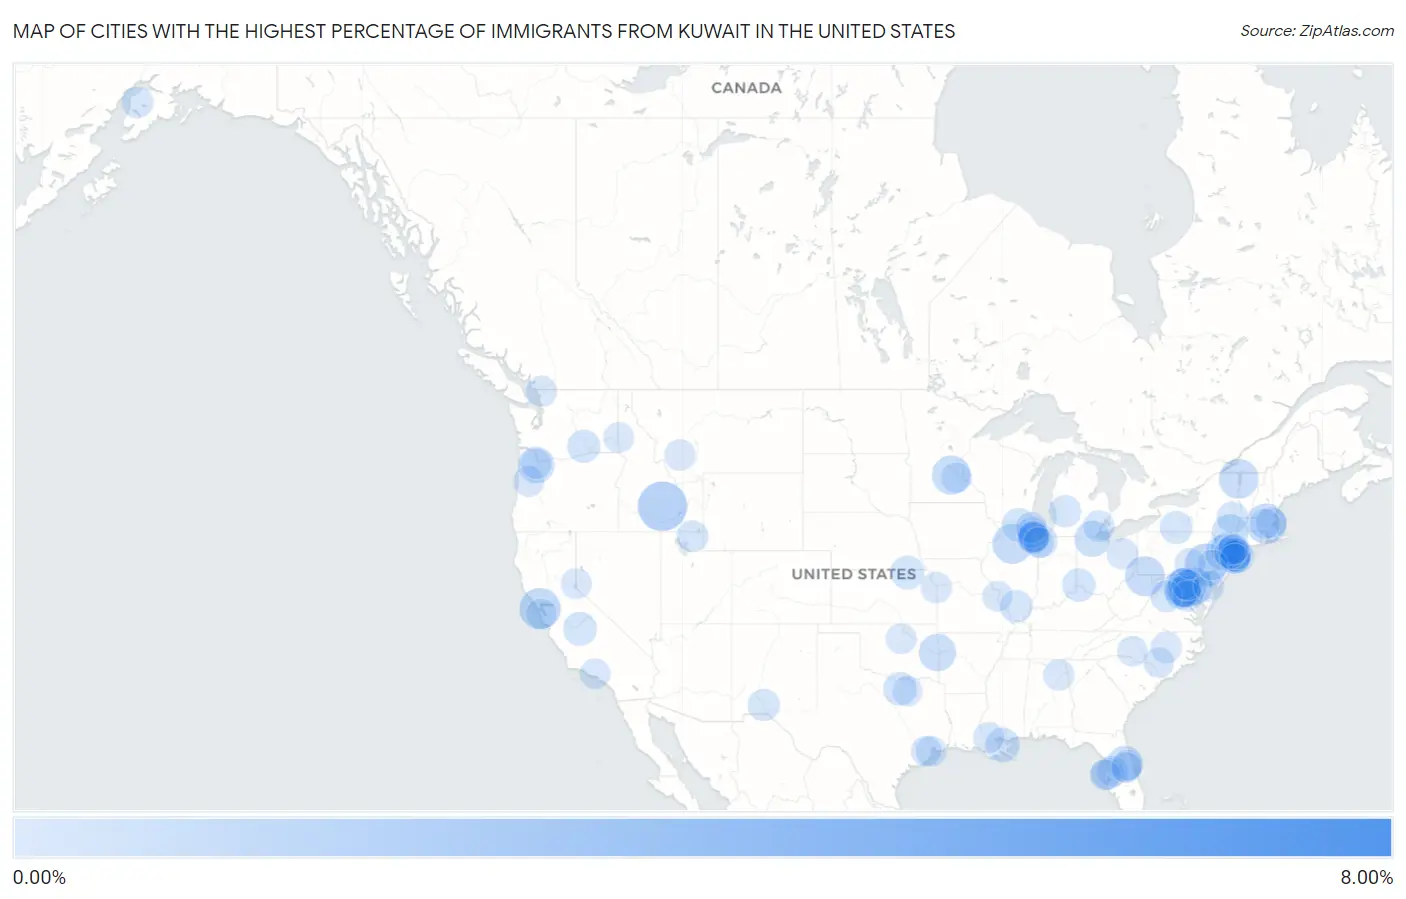
Map of Cities with the Highest Percentage of Immigrants from Kuwait in the United States
0.00%
8.00%
Cities with the Highest Percentage of Immigrants from Kuwait in the United States
| City | Kuwait | vs State | vs National | |
| 1. | Hartwick Seminary | 7.90% | 0.0093%(+7.89)#-1 | 0.011%(+7.89)#0 |
| 2. | Goose Creek | 3.52% | 0.012%(+3.50)#-1 | 0.011%(+3.51)#1 |
| 3. | Carey | 2.09% | 0.0090%(+2.08)#-1 | 0.011%(+2.08)#2 |
| 4. | Halfway House | 1.45% | 0.0054%(+1.44)#-1 | 0.011%(+1.44)#3 |
| 5. | Marin City | 1.29% | 0.016%(+1.27)#-1 | 0.011%(+1.28)#4 |
| 6. | Maynard | 1.21% | 0.016%(+1.19)#-1 | 0.011%(+1.20)#5 |
| 7. | Seatonville | 1.16% | 0.013%(+1.14)#-1 | 0.011%(+1.15)#6 |
| 8. | Morgantown | 1.14% | 0.032%(+1.11)#-1 | 0.011%(+1.13)#7 |
| 9. | Cumberland Head | 1.11% | 0.0093%(+1.10)#0 | 0.011%(+1.09)#8 |
| 10. | Shorewood | 1.04% | 0.010%(+1.03)#-1 | 0.011%(+1.03)#9 |
| 11. | North Chevy Chase | 1.03% | 0.012%(+1.02)#-1 | 0.011%(+1.02)#10 |
| 12. | Tarsney Lakes | 0.97% | 0.0066%(+0.964)#-1 | 0.011%(+0.960)#11 |
| 13. | Hamburg Borough | 0.97% | 0.0054%(+0.962)#0 | 0.011%(+0.957)#12 |
| 14. | Arden On The Severn | 0.95% | 0.012%(+0.941)#0 | 0.011%(+0.943)#13 |
| 15. | Lowes Island | 0.94% | 0.012%(+0.929)#3 | 0.011%(+0.930)#27 |
| 16. | Muldrow | 0.88% | 0.012%(+0.868)#-1 | 0.011%(+0.870)#28 |
| 17. | Durham | 0.81% | 0.013%(+0.794)#3 | 0.011%(+0.796)#140 |
| 18. | Lincoln Park | 0.80% | 0.0093%(+0.791)#1 | 0.011%(+0.789)#141 |
| 19. | Ottawa Hills | 0.77% | 0.010%(+0.763)#-1 | 0.011%(+0.763)#142 |
| 20. | Heathrow | 0.76% | 0.011%(+0.751)#-1 | 0.011%(+0.752)#143 |
| 21. | White Meadow Lake | 0.63% | 0.015%(+0.614)#-1 | 0.011%(+0.618)#144 |
| 22. | Timberlane | 0.60% | 0.012%(+0.593)#-1 | 0.011%(+0.594)#145 |
| 23. | Bellerose | 0.60% | 0.0093%(+0.591)#2 | 0.011%(+0.590)#146 |
| 24. | Tysons | 0.58% | 0.012%(+0.564)#49 | 0.011%(+0.565)#432 |
| 25. | Poplar Grove | 0.57% | 0.013%(+0.558)#0 | 0.011%(+0.560)#433 |
| 26. | Krum | 0.53% | 0.015%(+0.518)#-1 | 0.011%(+0.522)#434 |
| 27. | Hillburn | 0.53% | 0.0093%(+0.521)#3 | 0.011%(+0.520)#435 |
| 28. | Marysville | 0.53% | 0.015%(+0.512)#-1 | 0.011%(+0.516)#436 |
| 29. | Sunnyside | 0.53% | 0.016%(+0.510)#0 | 0.011%(+0.515)#437 |
| 30. | Plainedge | 0.51% | 0.0093%(+0.504)#4 | 0.011%(+0.502)#438 |
| 31. | Monfort Heights | 0.49% | 0.010%(+0.481)#0 | 0.011%(+0.480)#439 |
| 32. | Roslyn Heights | 0.48% | 0.0093%(+0.468)#5 | 0.011%(+0.466)#440 |
| 33. | West Richland | 0.47% | 0.0076%(+0.464)#-1 | 0.011%(+0.461)#441 |
| 34. | Manassas Park | 0.46% | 0.012%(+0.450)#50 | 0.011%(+0.451)#442 |
| 35. | Alfred | 0.46% | 0.0093%(+0.450)#6 | 0.011%(+0.448)#443 |
| 36. | Chicago Ridge | 0.45% | 0.013%(+0.435)#11 | 0.011%(+0.437)#444 |
| 37. | Merrillville | 0.44% | 0.0091%(+0.427)#10 | 0.011%(+0.426)#1,237 |
| 38. | North City | 0.43% | 0.013%(+0.418)#12 | 0.011%(+0.420)#1,238 |
| 39. | Willow Springs | 0.41% | 0.013%(+0.397)#13 | 0.011%(+0.399)#1,239 |
| 40. | North Springfield | 0.40% | 0.012%(+0.393)#51 | 0.011%(+0.394)#1,240 |
| 41. | Las Cruces | 0.40% | 0.022%(+0.374)#-1 | 0.011%(+0.385)#1,241 |
| 42. | Northview | 0.39% | 0.013%(+0.376)#-1 | 0.011%(+0.378)#1,242 |
| 43. | Hackensack | 0.37% | 0.015%(+0.359)#0 | 0.011%(+0.363)#1,243 |
| 44. | Clarksburg | 0.37% | 0.012%(+0.358)#1 | 0.011%(+0.360)#1,244 |
| 45. | Keystone | 0.36% | 0.011%(+0.353)#0 | 0.011%(+0.354)#1,245 |
| 46. | North Logan | 0.35% | 0.0097%(+0.336)#-1 | 0.011%(+0.335)#1,246 |
| 47. | Silverado | 0.34% | 0.016%(+0.326)#1 | 0.011%(+0.331)#1,247 |
| 48. | Dearborn | 0.33% | 0.013%(+0.322)#9 | 0.011%(+0.324)#1,248 |
| 49. | Colonie | 0.33% | 0.0093%(+0.325)#25 | 0.011%(+0.324)#1,249 |
| 50. | Sterling | 0.33% | 0.0029%(+0.330)#-1 | 0.011%(+0.322)#1,250 |
| 51. | Stanley | 0.33% | 0.012%(+0.320)#52 | 0.011%(+0.321)#1,251 |
| 52. | Butte Silver Bow Balance | 0.32% | 0.010%(+0.307)#-1 | 0.011%(+0.307)#1,252 |
| 53. | Merriam | 0.32% | 0.015%(+0.301)#3 | 0.011%(+0.305)#1,253 |
| 54. | Schiller Park | 0.31% | 0.013%(+0.298)#14 | 0.011%(+0.300)#1,254 |
| 55. | North New Hyde Park | 0.31% | 0.0093%(+0.298)#26 | 0.011%(+0.296)#1,255 |
| 56. | Justice | 0.30% | 0.013%(+0.291)#15 | 0.011%(+0.293)#1,256 |
| 57. | North Caldwell Borough | 0.30% | 0.015%(+0.287)#1 | 0.011%(+0.291)#1,257 |
| 58. | Indian Creek | 0.30% | 0.013%(+0.288)#16 | 0.011%(+0.290)#1,258 |
| 59. | Canal Fulton | 0.30% | 0.010%(+0.291)#1 | 0.011%(+0.290)#1,259 |
| 60. | Lynden | 0.30% | 0.0076%(+0.291)#0 | 0.011%(+0.288)#1,260 |
| 61. | Clayton | 0.29% | 0.0086%(+0.286)#-1 | 0.011%(+0.284)#1,261 |
| 62. | Pasadena Hills | 0.29% | 0.011%(+0.281)#1 | 0.011%(+0.282)#1,262 |
| 63. | Reece City | 0.28% | 0.0026%(+0.279)#-1 | 0.011%(+0.271)#1,263 |
| 64. | Shenandoah | 0.27% | 0.012%(+0.263)#1 | 0.011%(+0.264)#1,264 |
| 65. | La Plata | 0.27% | 0.012%(+0.260)#2 | 0.011%(+0.262)#1,265 |
| 66. | Ashton Sandy Spring | 0.27% | 0.012%(+0.256)#3 | 0.011%(+0.258)#1,266 |
| 67. | Corvallis | 0.27% | 0.013%(+0.254)#17 | 0.011%(+0.256)#1,267 |
| 68. | Upper Brookville | 0.27% | 0.0093%(+0.257)#27 | 0.011%(+0.255)#1,268 |
| 69. | Hasbrouck Heights Borough | 0.26% | 0.015%(+0.250)#2 | 0.011%(+0.254)#1,269 |
| 70. | El Lago | 0.26% | 0.015%(+0.248)#0 | 0.011%(+0.252)#1,270 |
| 71. | Calabasas | 0.25% | 0.016%(+0.235)#27 | 0.011%(+0.240)#1,271 |
| 72. | Incline Village | 0.25% | 0.0017%(+0.249)#-1 | 0.011%(+0.240)#1,272 |
| 73. | Ridgefield Park | 0.25% | 0.015%(+0.236)#9 | 0.011%(+0.240)#1,273 |
| 74. | Linglestown | 0.25% | 0.0054%(+0.245)#1 | 0.011%(+0.240)#1,274 |
| 75. | Elmsford | 0.25% | 0.0093%(+0.241)#28 | 0.011%(+0.240)#1,275 |
| 76. | Thornwood | 0.25% | 0.0093%(+0.241)#29 | 0.011%(+0.239)#1,276 |
| 77. | Whitehall Borough | 0.25% | 0.0054%(+0.243)#2 | 0.011%(+0.237)#1,277 |
| 78. | Bridgeview | 0.25% | 0.013%(+0.235)#17 | 0.011%(+0.237)#1,278 |
| 79. | Oviedo | 0.25% | 0.011%(+0.236)#2 | 0.011%(+0.237)#1,279 |
| 80. | Dover Base Housing | 0.25% | 0.0026%(+0.243)#-1 | 0.011%(+0.234)#1,280 |
| 81. | California Polytechnic State University | 0.24% | 0.016%(+0.227)#28 | 0.011%(+0.233)#1,281 |
| 82. | Stillwater | 0.24% | 0.012%(+0.230)#2 | 0.011%(+0.232)#1,282 |
| 83. | Schererville | 0.24% | 0.0091%(+0.231)#11 | 0.011%(+0.229)#1,283 |
| 84. | Montgomeryville | 0.24% | 0.0054%(+0.233)#3 | 0.011%(+0.228)#1,284 |
| 85. | Palm Harbor | 0.24% | 0.011%(+0.226)#3 | 0.011%(+0.226)#1,285 |
| 86. | Noroton | 0.23% | 0.0057%(+0.226)#-1 | 0.011%(+0.221)#1,286 |
| 87. | Stoneham | 0.23% | 0.016%(+0.214)#0 | 0.011%(+0.220)#1,287 |
| 88. | Rio Pinar | 0.23% | 0.011%(+0.218)#4 | 0.011%(+0.219)#1,288 |
| 89. | Sappington | 0.23% | 0.0066%(+0.221)#0 | 0.011%(+0.217)#1,289 |
| 90. | Moscow | 0.23% | 0.0090%(+0.217)#0 | 0.011%(+0.216)#1,290 |
| 91. | Burnsville | 0.23% | 0.010%(+0.216)#23 | 0.011%(+0.216)#1,291 |
| 92. | Garden Home Whitford | 0.23% | 0.013%(+0.213)#18 | 0.011%(+0.215)#1,292 |
| 93. | St Pauls | 0.22% | 0.0086%(+0.213)#0 | 0.011%(+0.210)#1,293 |
| 94. | Cornelius | 0.22% | 0.0086%(+0.211)#1 | 0.011%(+0.209)#1,294 |
| 95. | Millbrae | 0.22% | 0.016%(+0.203)#34 | 0.011%(+0.208)#1,295 |
| 96. | Long Beach | 0.22% | 0.0093%(+0.210)#30 | 0.011%(+0.208)#1,296 |
| 97. | Pearland | 0.22% | 0.015%(+0.201)#58 | 0.011%(+0.205)#1,297 |
| 98. | Allen | 0.22% | 0.015%(+0.200)#59 | 0.011%(+0.205)#1,298 |
| 99. | Hudson | 0.21% | 0.016%(+0.196)#2 | 0.011%(+0.202)#1,299 |
| 100. | New Britain Borough | 0.21% | 0.0054%(+0.205)#4 | 0.011%(+0.200)#1,300 |
Common Questions
What are the Top 10 Cities with the Highest Percentage of Immigrants from Kuwait in the United States?
Top 10 Cities with the Highest Percentage of Immigrants from Kuwait in the United States are:
#1
2.09%
#2
1.45%
#3
1.29%
#4
1.21%
#5
1.16%
#6
1.14%
#7
1.11%
#8
1.04%
#9
1.03%
#10
0.95%
What city has the Highest Percentage of Immigrants from Kuwait in the United States?
Carey has the Highest Percentage of Immigrants from Kuwait in the United States with 2.09%.
What is the Percentage of Immigrants from Kuwait in the United States?
Percentage of Immigrants from Kuwait in the United States is 0.011%.