Cities with the Highest Percentage of Households Heated by Coal or Coke in the United States
RELATED REPORTS & OPTIONS
Coal / Coke Heating
United States
Compare Cities
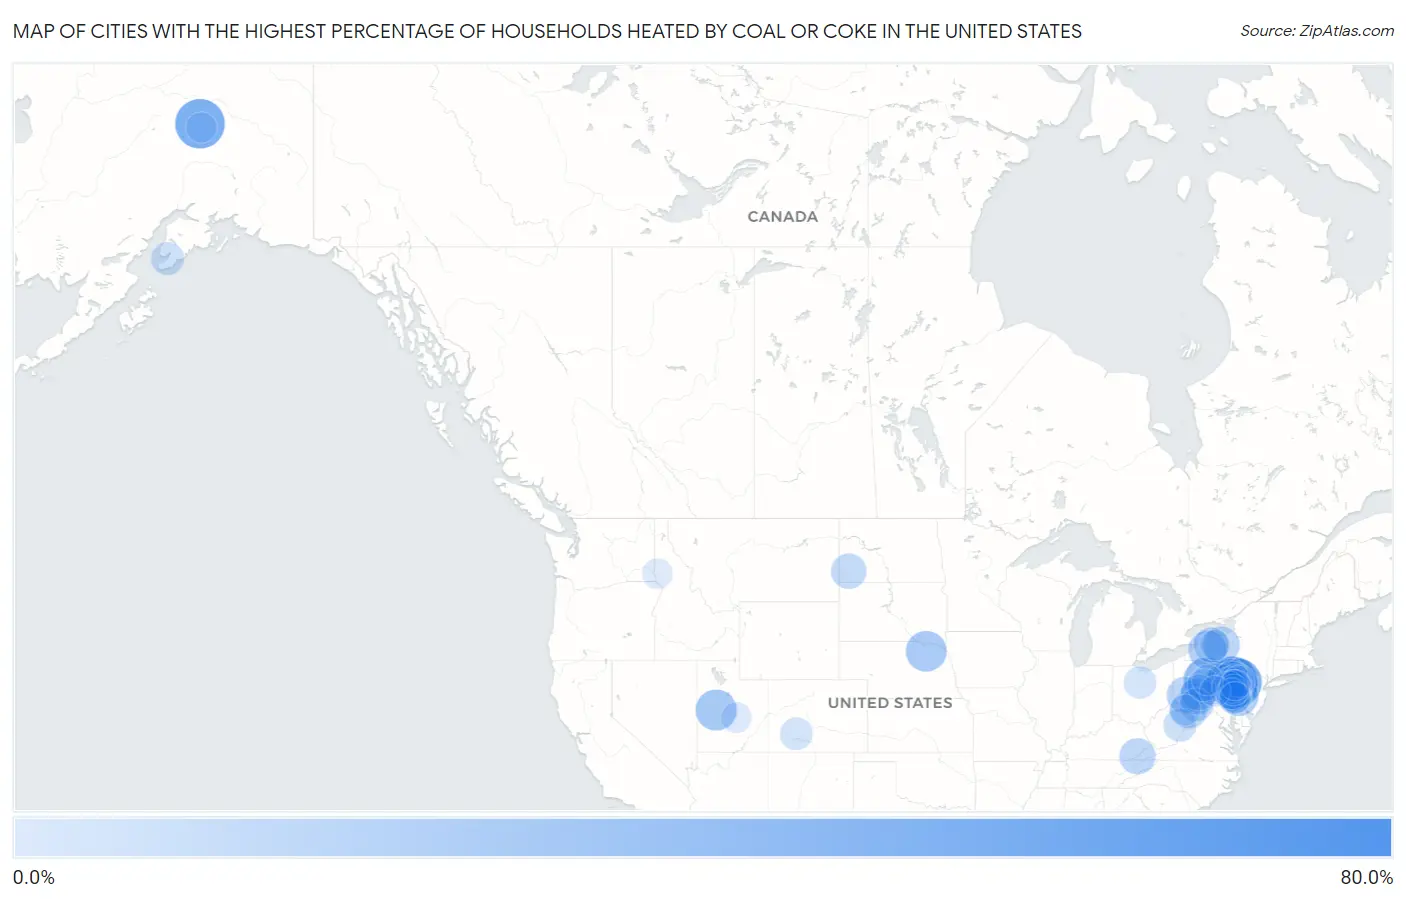
Map of Cities with the Highest Percentage of Households Heated by Coal or Coke in the United States
0.0%
80.0%
Cities with the Highest Percentage of Households Heated by Coal or Coke in the United States
| City | Coal / Coke Heating | vs State | vs National | |
| 1. | Fisherville | 66.7% | 0.90%(+65.8)#1 | 0.10%(+66.6)#1 |
| 2. | Yarnell | 51.4% | 0.90%(+50.5)#2 | 0.10%(+51.3)#2 |
| 3. | Slabtown | 50.0% | 0.90%(+49.1)#3 | 0.10%(+49.9)#3 |
| 4. | Ferry | 50.0% | 0.20%(+49.8)#1 | 0.10%(+49.9)#4 |
| 5. | Brockway | 50.0% | 0.10%(+49.9)#1 | 0.10%(+49.9)#5 |
| 6. | Grier City | 47.9% | 0.90%(+47.0)#4 | 0.10%(+47.8)#6 |
| 7. | Allport | 41.2% | 0.90%(+40.3)#5 | 0.10%(+41.1)#7 |
| 8. | Locustdale | 39.7% | 0.90%(+38.8)#6 | 0.10%(+39.6)#8 |
| 9. | Keystone | 38.5% | 0.10%(+38.4)#1 | 0.10%(+38.4)#9 |
| 10. | Cumbola | 38.1% | 0.90%(+37.2)#7 | 0.10%(+38.0)#10 |
| 11. | Callimont Borough | 38.1% | 0.90%(+37.2)#8 | 0.10%(+38.0)#11 |
| 12. | Jugtown | 37.5% | 0.90%(+36.6)#9 | 0.10%(+37.4)#12 |
| 13. | Ravine | 37.1% | 0.90%(+36.2)#10 | 0.10%(+37.0)#13 |
| 14. | Landingville Borough | 36.9% | 0.90%(+36.0)#11 | 0.10%(+36.8)#14 |
| 15. | Somerset | 34.1% | 0.0%(+34.1)#1 | 0.10%(+34.0)#15 |
| 16. | Sutherland | 34.0% | 0.10%(+33.9)#1 | 0.10%(+33.9)#16 |
| 17. | Bazile Mills | 33.3% | 0.0%(+33.3)#1 | 0.10%(+33.2)#17 |
| 18. | Lavelle | 31.6% | 0.90%(+30.7)#12 | 0.10%(+31.5)#18 |
| 19. | Churchtown | 30.7% | 0.90%(+29.8)#13 | 0.10%(+30.6)#19 |
| 20. | Donaldson | 29.8% | 0.90%(+28.9)#14 | 0.10%(+29.7)#20 |
| 21. | Pike | 29.1% | 0.20%(+28.9)#1 | 0.10%(+29.0)#21 |
| 22. | Paxtonville | 29.1% | 0.90%(+28.2)#15 | 0.10%(+29.0)#22 |
| 23. | Ontario | 28.3% | 0.10%(+28.2)#2 | 0.10%(+28.2)#23 |
| 24. | North Pownal | 28.0% | 0.20%(+27.8)#1 | 0.10%(+27.9)#24 |
| 25. | Jerseytown | 26.9% | 0.90%(+26.0)#16 | 0.10%(+26.8)#25 |
| 26. | Glen Hope Borough | 26.8% | 0.90%(+25.9)#17 | 0.10%(+26.7)#26 |
| 27. | Gorham | 26.6% | 0.20%(+26.4)#2 | 0.10%(+26.5)#27 |
| 28. | Crellin | 26.4% | 0.10%(+26.3)#1 | 0.10%(+26.3)#28 |
| 29. | Wyano | 25.7% | 0.90%(+24.8)#18 | 0.10%(+25.6)#29 |
| 30. | Cairnbrook | 25.4% | 0.90%(+24.5)#19 | 0.10%(+25.3)#30 |
| 31. | Muir | 25.0% | 0.90%(+24.1)#20 | 0.10%(+24.9)#31 |
| 32. | St Charles | 25.0% | 0.0%(+25.0)#1 | 0.10%(+24.9)#32 |
| 33. | Sidman | 24.0% | 0.90%(+23.1)#21 | 0.10%(+23.9)#33 |
| 34. | Amidon | 23.5% | 0.10%(+23.4)#1 | 0.10%(+23.4)#34 |
| 35. | Retsof | 23.2% | 0.20%(+23.0)#3 | 0.10%(+23.1)#35 |
| 36. | Girardville Borough | 22.4% | 0.90%(+21.5)#22 | 0.10%(+22.3)#36 |
| 37. | Benson Borough | 22.4% | 0.90%(+21.5)#23 | 0.10%(+22.3)#37 |
| 38. | Buck Run | 22.0% | 0.90%(+21.1)#24 | 0.10%(+21.9)#38 |
| 39. | Mahaffey Borough | 21.9% | 0.90%(+21.0)#25 | 0.10%(+21.8)#39 |
| 40. | Blue Knob | 21.4% | 0.90%(+20.5)#26 | 0.10%(+21.3)#40 |
| 41. | Aaronsburg Cdp Centre County | 21.0% | 0.90%(+20.1)#27 | 0.10%(+20.9)#41 |
| 42. | Bird In Hand | 20.5% | 0.90%(+19.6)#28 | 0.10%(+20.4)#42 |
| 43. | Georgetown Cdp Lancaster County | 20.4% | 0.90%(+19.5)#29 | 0.10%(+20.3)#43 |
| 44. | Tuscarora | 20.2% | 0.90%(+19.3)#30 | 0.10%(+20.1)#44 |
| 45. | Wilburton Number One | 20.2% | 0.90%(+19.3)#31 | 0.10%(+20.1)#45 |
| 46. | Tremont Borough | 20.1% | 0.90%(+19.2)#32 | 0.10%(+20.0)#46 |
| 47. | Wilburton Number Two | 20.0% | 0.90%(+19.1)#33 | 0.10%(+19.9)#47 |
| 48. | Carlos | 20.0% | 0.10%(+19.9)#2 | 0.10%(+19.9)#48 |
| 49. | Grampian Borough | 19.7% | 0.90%(+18.8)#34 | 0.10%(+19.6)#49 |
| 50. | Halibut Cove | 19.5% | 0.20%(+19.3)#2 | 0.10%(+19.4)#50 |
| 51. | Morea | 19.4% | 0.90%(+18.5)#35 | 0.10%(+19.3)#51 |
| 52. | Mill Run | 19.4% | 0.90%(+18.5)#36 | 0.10%(+19.3)#52 |
| 53. | Valley Head | 19.4% | 0.40%(+19.0)#1 | 0.10%(+19.3)#53 |
| 54. | Trevorton | 19.3% | 0.90%(+18.4)#37 | 0.10%(+19.2)#54 |
| 55. | Houtzdale Borough | 19.2% | 0.90%(+18.3)#38 | 0.10%(+19.1)#55 |
| 56. | Marlin | 19.2% | 0.90%(+18.3)#39 | 0.10%(+19.1)#56 |
| 57. | Nuremberg | 19.1% | 0.90%(+18.2)#40 | 0.10%(+19.0)#57 |
| 58. | Summit Station | 18.9% | 0.90%(+18.0)#41 | 0.10%(+18.8)#58 |
| 59. | Rohrsburg | 18.8% | 0.90%(+17.9)#42 | 0.10%(+18.7)#59 |
| 60. | Penryn | 18.6% | 0.90%(+17.7)#43 | 0.10%(+18.5)#60 |
| 61. | Blandburg | 18.6% | 0.90%(+17.7)#44 | 0.10%(+18.5)#61 |
| 62. | South Fork Borough | 18.3% | 0.90%(+17.4)#45 | 0.10%(+18.2)#62 |
| 63. | Port Clinton Borough | 18.3% | 0.90%(+17.4)#46 | 0.10%(+18.2)#63 |
| 64. | Hopeland | 18.2% | 0.90%(+17.3)#47 | 0.10%(+18.1)#64 |
| 65. | Middleport Borough | 18.2% | 0.90%(+17.3)#48 | 0.10%(+18.1)#65 |
| 66. | Cathedral | 18.2% | 0.0%(+18.2)#2 | 0.10%(+18.1)#66 |
| 67. | Newtown | 18.1% | 0.90%(+17.2)#49 | 0.10%(+18.0)#67 |
| 68. | Wiconsico | 17.9% | 0.90%(+17.0)#50 | 0.10%(+17.8)#68 |
| 69. | Sulphur Springs | 17.9% | 0.10%(+17.8)#1 | 0.10%(+17.8)#69 |
| 70. | Liberty Center | 17.9% | 0.10%(+17.8)#3 | 0.10%(+17.8)#71 |
| 71. | Shanksville Borough | 17.9% | 0.90%(+17.0)#51 | 0.10%(+17.8)#72 |
| 72. | Ronks | 17.2% | 0.90%(+16.3)#52 | 0.10%(+17.1)#73 |
| 73. | Otter Lake | 17.2% | 0.20%(+17.0)#4 | 0.10%(+17.1)#74 |
| 74. | Valley View Cdp Schuylkill County | 17.0% | 0.90%(+16.1)#53 | 0.10%(+16.9)#75 |
| 75. | Cassandra Borough | 17.0% | 0.90%(+16.1)#54 | 0.10%(+16.9)#76 |
| 76. | Ramey Borough | 16.8% | 0.90%(+15.9)#55 | 0.10%(+16.7)#77 |
| 77. | Ehrenfeld Borough | 16.5% | 0.90%(+15.6)#56 | 0.10%(+16.4)#78 |
| 78. | Central City Borough | 16.3% | 0.90%(+15.4)#57 | 0.10%(+16.2)#79 |
| 79. | Palo Alto Borough | 16.2% | 0.90%(+15.3)#58 | 0.10%(+16.1)#80 |
| 80. | Tresckow | 16.0% | 0.90%(+15.1)#59 | 0.10%(+15.9)#81 |
| 81. | Newfoundland | 15.8% | 0.0%(+15.8)#1 | 0.10%(+15.7)#82 |
| 82. | Irvona Borough | 15.8% | 0.90%(+14.9)#60 | 0.10%(+15.7)#83 |
| 83. | Snydertown Borough | 15.7% | 0.90%(+14.8)#61 | 0.10%(+15.6)#84 |
| 84. | Tunnelton | 15.6% | 0.40%(+15.2)#2 | 0.10%(+15.5)#85 |
| 85. | Bear Creek Village Borough | 15.3% | 0.90%(+14.4)#62 | 0.10%(+15.2)#86 |
| 86. | Mount Gretna Heights | 15.2% | 0.90%(+14.3)#63 | 0.10%(+15.1)#87 |
| 87. | Grassflat | 15.0% | 0.90%(+14.1)#64 | 0.10%(+14.9)#88 |
| 88. | Rehrersburg | 14.9% | 0.90%(+14.0)#65 | 0.10%(+14.8)#89 |
| 89. | East Waterford | 14.9% | 0.90%(+14.0)#66 | 0.10%(+14.8)#90 |
| 90. | Clintondale | 14.8% | 0.90%(+13.9)#67 | 0.10%(+14.7)#91 |
| 91. | Witmer | 14.6% | 0.90%(+13.7)#68 | 0.10%(+14.5)#92 |
| 92. | Mechanicsville Borough | 14.5% | 0.90%(+13.6)#69 | 0.10%(+14.4)#93 |
| 93. | Emery | 14.5% | 0.10%(+14.4)#2 | 0.10%(+14.4)#94 |
| 94. | Marion Heights Borough | 14.4% | 0.90%(+13.5)#70 | 0.10%(+14.3)#95 |
| 95. | Healy | 14.3% | 0.20%(+14.1)#3 | 0.10%(+14.2)#96 |
| 96. | Seltzer | 14.3% | 0.90%(+13.4)#71 | 0.10%(+14.2)#97 |
| 97. | Livonia Center | 14.3% | 0.20%(+14.1)#5 | 0.10%(+14.2)#98 |
| 98. | Sweetwater | 14.3% | 0.0%(+14.3)#1 | 0.10%(+14.2)#99 |
| 99. | Casselman Borough | 14.3% | 0.90%(+13.4)#72 | 0.10%(+14.2)#100 |
| 100. | Mckee | 14.0% | 0.90%(+13.1)#73 | 0.10%(+13.9)#101 |
Common Questions
What are the Top 10 Cities with the Highest Percentage of Households Heated by Coal or Coke in the United States?
Top 10 Cities with the Highest Percentage of Households Heated by Coal or Coke in the United States are:
#1
50.0%
#2
50.0%
#3
47.9%
#4
41.2%
#5
39.7%
#6
38.1%
#7
37.1%
#8
34.0%
#9
33.3%
#10
31.6%
What city has the Highest Percentage of Households Heated by Coal or Coke in the United States?
Slabtown has the Highest Percentage of Households Heated by Coal or Coke in the United States with 50.0%.
What is the Percentage of Households Heated by Coal or Coke in the United States?
Percentage of Households Heated by Coal or Coke in the United States is 0.10%.