Cities with the Highest Per Capita Income in the United States
RELATED REPORTS & OPTIONS
Highest Per Capita Income
United States
Compare Cities
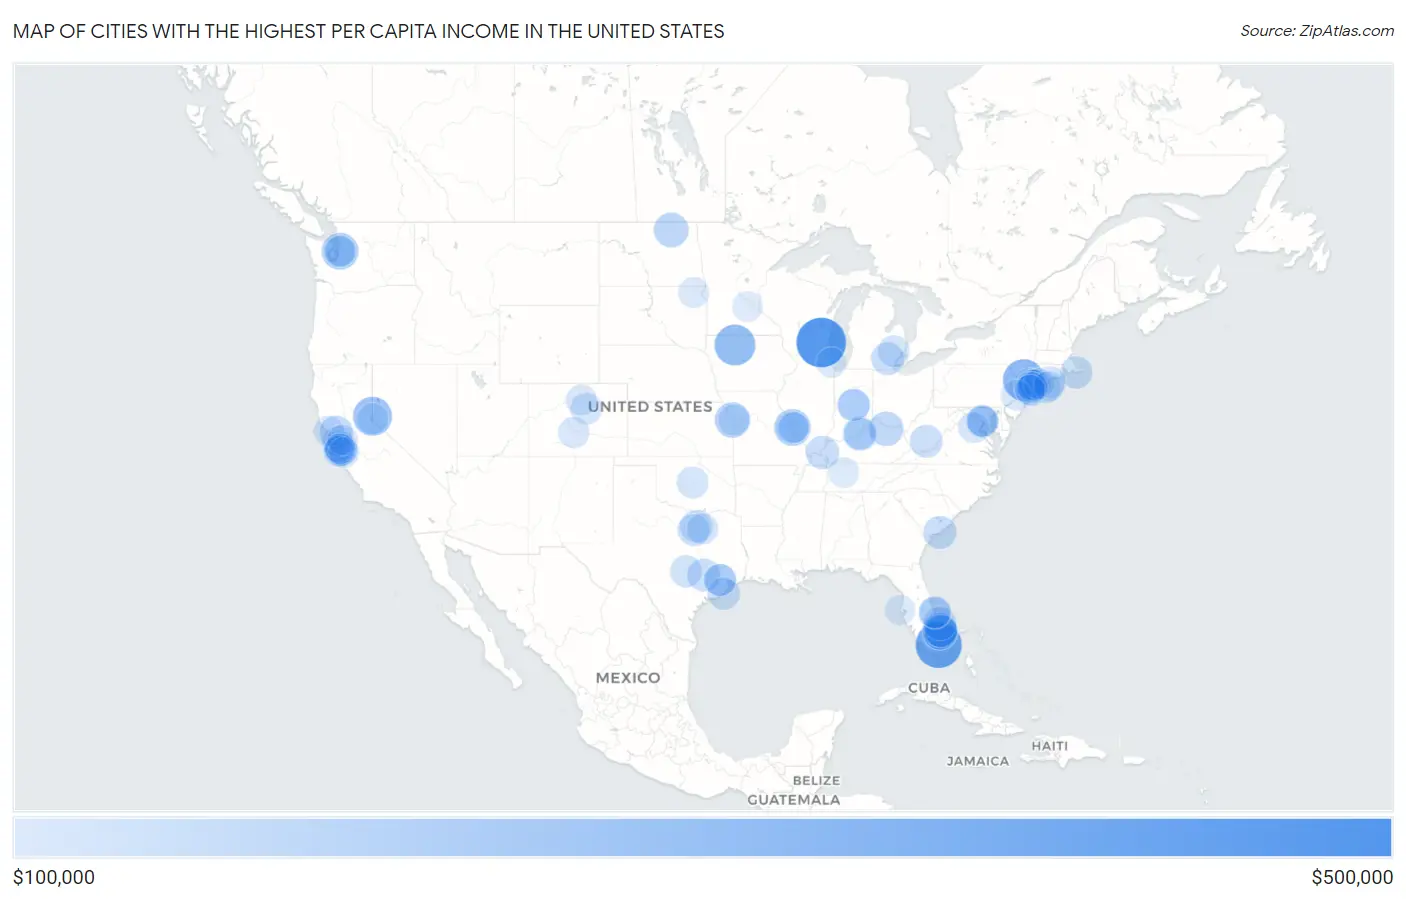
Map of Cities with the Highest Per Capita Income in the United States
$0
$500,000
Cities with the Highest Per Capita Income in the United States
| City | Per Capita Income | vs State | vs National | |
| 1. | Tavistock Borough | $487,017 | $50,995(+436k)#1 | $41,261(+446k)#1 |
| 2. | Chenequa | $477,831 | $40,130(+438k)#1 | $41,261(+437k)#2 |
| 3. | Fisher Island | $418,363 | $38,850(+380k)#1 | $41,261(+377k)#3 |
| 4. | Tuxedo Park | $340,699 | $47,173(+294k)#1 | $41,261(+299k)#4 |
| 5. | Rodman | $327,588 | $37,949(+290k)#1 | $41,261(+286k)#5 |
| 6. | Crystal Bay | $295,845 | $37,945(+258k)#1 | $41,261(+255k)#6 |
| 7. | Keswick | $267,252 | $47,210(+220k)#1 | $41,261(+226k)#7 |
| 8. | Hunts Point | $258,149 | $48,685(+209k)#1 | $41,261(+217k)#8 |
| 9. | Country Life Acres | $256,098 | $36,754(+219k)#1 | $41,261(+215k)#9 |
| 10. | Indian Field | $243,196 | $52,034(+191k)#1 | $41,261(+202k)#10 |
| 11. | Schooner Bay | $242,849 | $47,210(+196k)#2 | $41,261(+202k)#11 |
| 12. | Mission Hills | $235,738 | $38,108(+198k)#1 | $41,261(+194k)#12 |
| 13. | Fenwick Borough | $233,490 | $52,034(+181k)#2 | $41,261(+192k)#13 |
| 14. | Calio | $227,233 | $40,748(+186k)#1 | $41,261(+186k)#14 |
| 15. | Dixie | $226,072 | $37,836(+188k)#1 | $41,261(+185k)#15 |
| 16. | Cass | $225,916 | $35,578(+190k)#1 | $41,261(+185k)#16 |
| 17. | Leesburg | $225,482 | $50,995(+174k)#2 | $41,261(+184k)#17 |
| 18. | Golf | $222,810 | $38,850(+184k)#2 | $41,261(+182k)#18 |
| 19. | Mays Lick | $221,303 | $33,515(+188k)#1 | $41,261(+180k)#19 |
| 20. | Gulf Stream | $219,550 | $38,850(+181k)#3 | $41,261(+178k)#20 |
| 21. | Glenview | $216,503 | $33,515(+183k)#2 | $41,261(+175k)#21 |
| 22. | Palm Beach | $215,141 | $38,850(+176k)#4 | $41,261(+174k)#22 |
| 23. | Oak Hills | $213,977 | $37,949(+176k)#2 | $41,261(+173k)#23 |
| 24. | Glen Ellen | $205,652 | $45,591(+160k)#1 | $41,261(+164k)#24 |
| 25. | Burna | $201,437 | $33,515(+168k)#3 | $41,261(+160k)#25 |
| 26. | Jupiter Island | $201,240 | $38,850(+162k)#5 | $41,261(+160k)#26 |
| 27. | Kiawah Island | $197,853 | $36,072(+162k)#1 | $41,261(+157k)#27 |
| 28. | Manalapan | $194,570 | $38,850(+156k)#6 | $41,261(+153k)#28 |
| 29. | Barton Hills | $194,386 | $37,929(+156k)#1 | $41,261(+153k)#29 |
| 30. | Prince | $193,191 | $31,462(+162k)#1 | $41,261(+152k)#30 |
| 31. | Windsor | $192,294 | $38,850(+153k)#7 | $41,261(+151k)#31 |
| 32. | Chevy Chase Village | $191,804 | $49,865(+142k)#1 | $41,261(+151k)#32 |
| 33. | Round Top | $191,799 | $37,514(+154k)#1 | $41,261(+151k)#33 |
| 34. | Popponesset Island | $189,099 | $53,513(+136k)#1 | $41,261(+148k)#34 |
| 35. | La Tierra | $188,342 | $32,667(+156k)#1 | $41,261(+147k)#35 |
| 36. | Piney Point Village | $187,796 | $37,514(+150k)#2 | $41,261(+147k)#36 |
| 37. | Atherton | $186,810 | $45,591(+141k)#2 | $41,261(+146k)#37 |
| 38. | Quintana | $185,624 | $37,514(+148k)#3 | $41,261(+144k)#38 |
| 39. | Rock Ridge | $184,824 | $52,034(+133k)#3 | $41,261(+144k)#39 |
| 40. | Crows Nest | $184,742 | $35,578(+149k)#2 | $41,261(+143k)#40 |
| 41. | Westlake | $184,242 | $37,514(+147k)#4 | $41,261(+143k)#41 |
| 42. | Westwood | $184,242 | $36,754(+147k)#2 | $41,261(+143k)#42 |
| 43. | Barton Creek | $184,151 | $37,514(+147k)#5 | $41,261(+143k)#43 |
| 44. | Cove Neck | $182,753 | $47,173(+136k)#2 | $41,261(+141k)#44 |
| 45. | Mamanasco Lake | $182,179 | $52,034(+130k)#4 | $41,261(+141k)#45 |
| 46. | Hewlett Bay Park | $181,937 | $47,173(+135k)#3 | $41,261(+141k)#46 |
| 47. | Westover Hills | $181,408 | $37,514(+144k)#6 | $41,261(+140k)#47 |
| 48. | Portola Valley | $180,793 | $45,591(+135k)#3 | $41,261(+140k)#48 |
| 49. | Clyde Hill | $179,910 | $48,685(+131k)#2 | $41,261(+139k)#49 |
| 50. | Tokeneke | $179,043 | $52,034(+127k)#5 | $41,261(+138k)#50 |
| 51. | Lake Angelus | $178,962 | $37,929(+141k)#2 | $41,261(+138k)#51 |
| 52. | North Crows Nest | $178,162 | $35,578(+143k)#3 | $41,261(+137k)#52 |
| 53. | Hunters Creek Village | $178,130 | $37,514(+141k)#7 | $41,261(+137k)#53 |
| 54. | North Haven | $177,262 | $47,173(+130k)#4 | $41,261(+136k)#54 |
| 55. | Lake Aluma | $174,642 | $33,630(+141k)#1 | $41,261(+133k)#55 |
| 56. | Scarsdale | $173,050 | $47,173(+126k)#5 | $41,261(+132k)#56 |
| 57. | Mockingbird Valley | $172,916 | $33,515(+139k)#4 | $41,261(+132k)#57 |
| 58. | Martin S Additions | $172,692 | $49,865(+123k)#2 | $41,261(+131k)#58 |
| 59. | West Hampton Dunes | $172,312 | $47,173(+125k)#6 | $41,261(+131k)#59 |
| 60. | Cherry Hills Village | $171,655 | $47,346(+124k)#1 | $41,261(+130k)#60 |
| 61. | Highland Park | $171,411 | $37,514(+134k)#8 | $41,261(+130k)#61 |
| 62. | Los Altos Hills | $170,801 | $45,591(+125k)#4 | $41,261(+130k)#62 |
| 63. | Plandome | $169,729 | $47,173(+123k)#7 | $41,261(+128k)#63 |
| 64. | Glenbrook | $168,572 | $37,945(+131k)#2 | $41,261(+127k)#64 |
| 65. | Orchid | $168,542 | $38,850(+130k)#8 | $41,261(+127k)#65 |
| 66. | Hillsborough | $168,494 | $45,591(+123k)#5 | $41,261(+127k)#66 |
| 67. | Huntington Bay | $167,757 | $47,173(+121k)#8 | $41,261(+126k)#67 |
| 68. | Coaldale | $167,688 | $47,346(+120k)#2 | $41,261(+126k)#68 |
| 69. | Mission Woods | $166,879 | $38,108(+129k)#2 | $41,261(+126k)#69 |
| 70. | Grandfather | $165,807 | $37,641(+128k)#1 | $41,261(+125k)#70 |
| 71. | Belvedere | $165,410 | $45,591(+120k)#6 | $41,261(+124k)#71 |
| 72. | Centre Island | $164,825 | $47,173(+118k)#9 | $41,261(+124k)#72 |
| 73. | Calverton | $164,700 | $47,210(+117k)#3 | $41,261(+123k)#73 |
| 74. | Dunthorpe | $163,705 | $41,805(+122k)#1 | $41,261(+122k)#74 |
| 75. | Altona | $163,096 | $47,346(+116k)#3 | $41,261(+122k)#75 |
| 76. | Old Field | $161,297 | $47,173(+114k)#10 | $41,261(+120k)#76 |
| 77. | Eden | $161,264 | $36,850(+124k)#1 | $41,261(+120k)#77 |
| 78. | West Mountain | $161,079 | $52,034(+109k)#6 | $41,261(+120k)#78 |
| 79. | Southampton | $160,632 | $47,173(+113k)#11 | $41,261(+119k)#79 |
| 80. | Sereno Del Mar | $160,488 | $45,591(+115k)#7 | $41,261(+119k)#80 |
| 81. | Old Hill | $159,952 | $52,034(+108k)#7 | $41,261(+119k)#81 |
| 82. | Loma Mar | $159,724 | $45,591(+114k)#8 | $41,261(+118k)#82 |
| 83. | Mantoloking Borough | $159,649 | $50,995(+109k)#3 | $41,261(+118k)#83 |
| 84. | Shell Ridge | $159,039 | $45,591(+113k)#9 | $41,261(+118k)#84 |
| 85. | Blawenburg | $158,670 | $50,995(+108k)#4 | $41,261(+117k)#85 |
| 86. | Monte Sereno | $157,911 | $45,591(+112k)#10 | $41,261(+117k)#86 |
| 87. | Brookville | $157,836 | $47,173(+111k)#12 | $41,261(+117k)#87 |
| 88. | Emerald Lake Hills | $157,698 | $45,591(+112k)#11 | $41,261(+116k)#88 |
| 89. | Sewickley Heights Borough | $157,017 | $41,234(+116k)#1 | $41,261(+116k)#89 |
| 90. | Tancred | $157,012 | $45,591(+111k)#12 | $41,261(+116k)#90 |
| 91. | Medina | $156,124 | $48,685(+107k)#3 | $41,261(+115k)#91 |
| 92. | Woodsburgh | $155,988 | $47,173(+109k)#13 | $41,261(+115k)#92 |
| 93. | Hawleyville | $155,853 | $52,034(+104k)#8 | $41,261(+115k)#93 |
| 94. | Ladue | $155,813 | $36,754(+119k)#3 | $41,261(+115k)#94 |
| 95. | New Lisbon | $155,223 | $35,578(+120k)#4 | $41,261(+114k)#95 |
| 96. | Somerset | $154,723 | $49,865(+105k)#3 | $41,261(+113k)#96 |
| 97. | Winnetka | $154,576 | $43,198(+111k)#1 | $41,261(+113k)#97 |
| 98. | Minnetonka Beach | $154,556 | $44,947(+110k)#1 | $41,261(+113k)#98 |
| 99. | Belle Meade | $154,324 | $36,040(+118k)#1 | $41,261(+113k)#99 |
| 100. | Belleair Shore | $154,318 | $38,850(+115k)#9 | $41,261(+113k)#100 |
Common Questions
What are the Top 10 Cities with the Highest Per Capita Income in the United States?
Top 10 Cities with the Highest Per Capita Income in the United States are:
#1
$477,831
#2
$418,363
#3
$340,699
#4
$327,588
#5
$295,845
#6
$258,149
#7
$256,098
#8
$235,738
#9
$227,233
#10
$222,810
What city has the Highest Per Capita Income in the United States?
Chenequa has the Highest Per Capita Income in the United States with $477,831.
What is the Per Capita Income in the United States?
Per Capita Income in the United States is $41,261.