Warren County, NY Map & Demographics
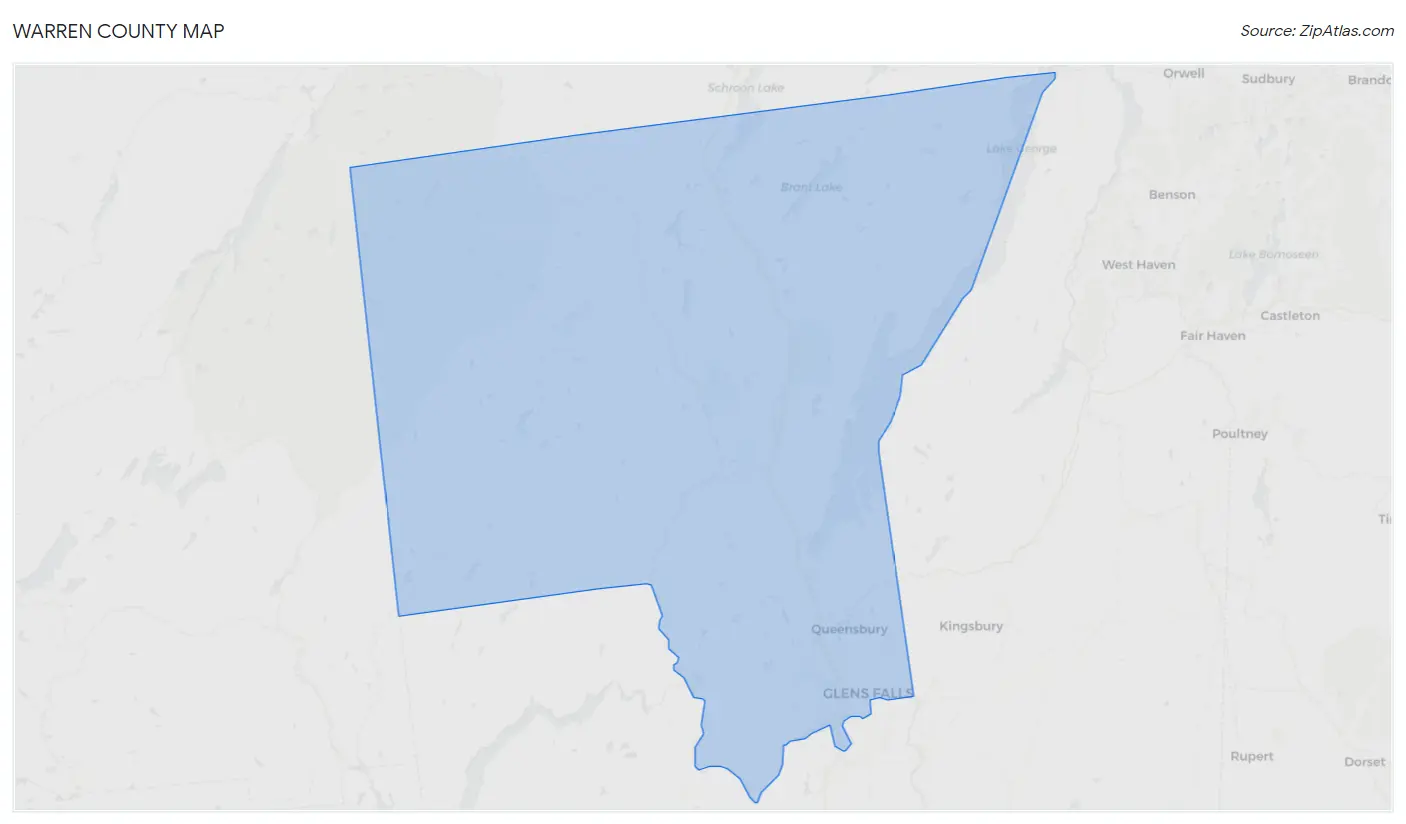
Warren County Map
Warren County Overview
$44,183
PER CAPITA INCOME
$97,947
AVG FAMILY INCOME
$74,531
AVG HOUSEHOLD INCOME
21.8%
WAGE / INCOME GAP [ % ]
78.2¢/ $1
WAGE / INCOME GAP [ $ ]
$8,673
FAMILY INCOME DEFICIT
0.44
INEQUALITY / GINI INDEX
65,684
TOTAL POPULATION
32,658
MALE POPULATION
33,026
FEMALE POPULATION
98.89
MALES / 100 FEMALES
101.13
FEMALES / 100 MALES
46.7
MEDIAN AGE
2.7
AVG FAMILY SIZE
2.2
AVG HOUSEHOLD SIZE
33,437
LABOR FORCE [ PEOPLE ]
60.1%
PERCENT IN LABOR FORCE
4.2%
UNEMPLOYMENT RATE
Warren County Area Codes
Income in Warren County
Income Overview in Warren County
Per Capita Income in Warren County is $44,183, while median incomes of families and households are $97,947 and $74,531 respectively.
| Characteristic | Number | Measure |
| Per Capita Income | 65,684 | $44,183 |
| Median Family Income | 17,897 | $97,947 |
| Mean Family Income | 17,897 | $121,694 |
| Median Household Income | 29,782 | $74,531 |
| Mean Household Income | 29,782 | $97,659 |
| Income Deficit | 17,897 | $8,673 |
| Wage / Income Gap (%) | 65,684 | 21.80% |
| Wage / Income Gap ($) | 65,684 | 78.20¢ per $1 |
| Gini / Inequality Index | 65,684 | 0.44 |
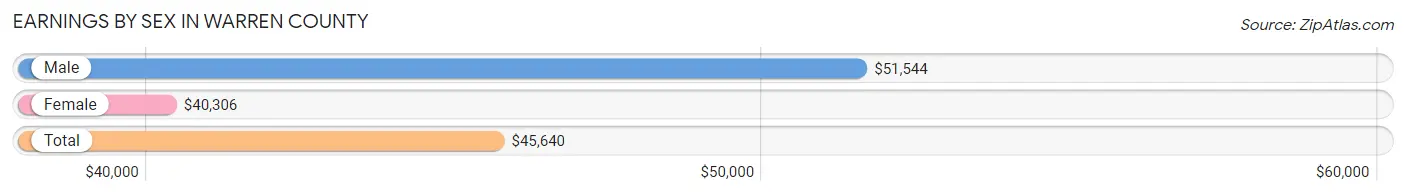
Earnings by Sex in Warren County
Average Earnings in Warren County are $45,640, $51,544 for men and $40,306 for women, a difference of 21.8%.
| Sex | Number | Average Earnings |
| Male | 18,771 (52.2%) | $51,544 |
| Female | 17,157 (47.7%) | $40,306 |
| Total | 35,928 (100.0%) | $45,640 |
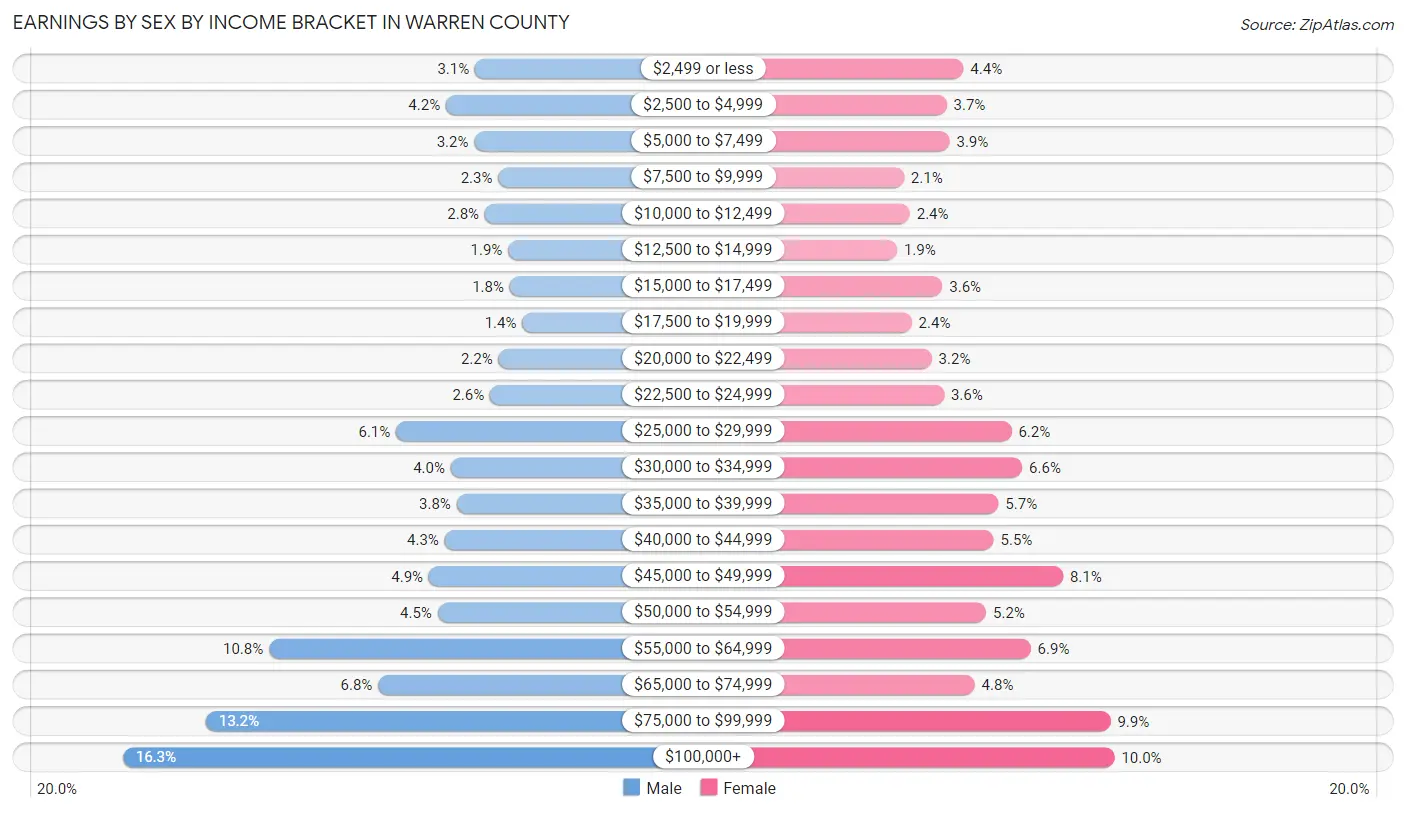
Earnings by Sex by Income Bracket in Warren County
The most common earnings brackets in Warren County are $100,000+ for men (3,064 | 16.3%) and $100,000+ for women (1,720 | 10.0%).
| Income | Male | Female |
| $2,499 or less | 585 (3.1%) | 749 (4.4%) |
| $2,500 to $4,999 | 790 (4.2%) | 641 (3.7%) |
| $5,000 to $7,499 | 592 (3.2%) | 661 (3.8%) |
| $7,500 to $9,999 | 422 (2.2%) | 367 (2.1%) |
| $10,000 to $12,499 | 517 (2.8%) | 405 (2.4%) |
| $12,500 to $14,999 | 352 (1.9%) | 323 (1.9%) |
| $15,000 to $17,499 | 342 (1.8%) | 615 (3.6%) |
| $17,500 to $19,999 | 253 (1.3%) | 417 (2.4%) |
| $20,000 to $22,499 | 421 (2.2%) | 545 (3.2%) |
| $22,500 to $24,999 | 480 (2.6%) | 625 (3.6%) |
| $25,000 to $29,999 | 1,142 (6.1%) | 1,059 (6.2%) |
| $30,000 to $34,999 | 756 (4.0%) | 1,128 (6.6%) |
| $35,000 to $39,999 | 716 (3.8%) | 975 (5.7%) |
| $40,000 to $44,999 | 799 (4.3%) | 943 (5.5%) |
| $45,000 to $49,999 | 911 (4.9%) | 1,390 (8.1%) |
| $50,000 to $54,999 | 848 (4.5%) | 896 (5.2%) |
| $55,000 to $64,999 | 2,035 (10.8%) | 1,182 (6.9%) |
| $65,000 to $74,999 | 1,267 (6.8%) | 821 (4.8%) |
| $75,000 to $99,999 | 2,479 (13.2%) | 1,695 (9.9%) |
| $100,000+ | 3,064 (16.3%) | 1,720 (10.0%) |
| Total | 18,771 (100.0%) | 17,157 (100.0%) |
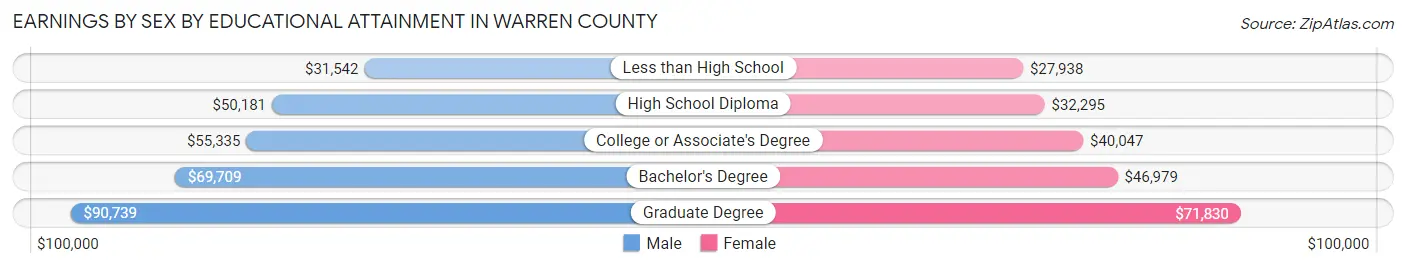
Earnings by Sex by Educational Attainment in Warren County
Average earnings in Warren County are $57,101 for men and $45,359 for women, a difference of 20.6%. Men with an educational attainment of graduate degree enjoy the highest average annual earnings of $90,739, while those with less than high school education earn the least with $31,542. Women with an educational attainment of graduate degree earn the most with the average annual earnings of $71,830, while those with less than high school education have the smallest earnings of $27,938.
| Educational Attainment | Male Income | Female Income |
| Less than High School | $31,542 | $27,938 |
| High School Diploma | $50,181 | $32,295 |
| College or Associate's Degree | $55,335 | $40,047 |
| Bachelor's Degree | $69,709 | $46,979 |
| Graduate Degree | $90,739 | $71,830 |
| Total | $57,101 | $45,359 |
Family Income in Warren County
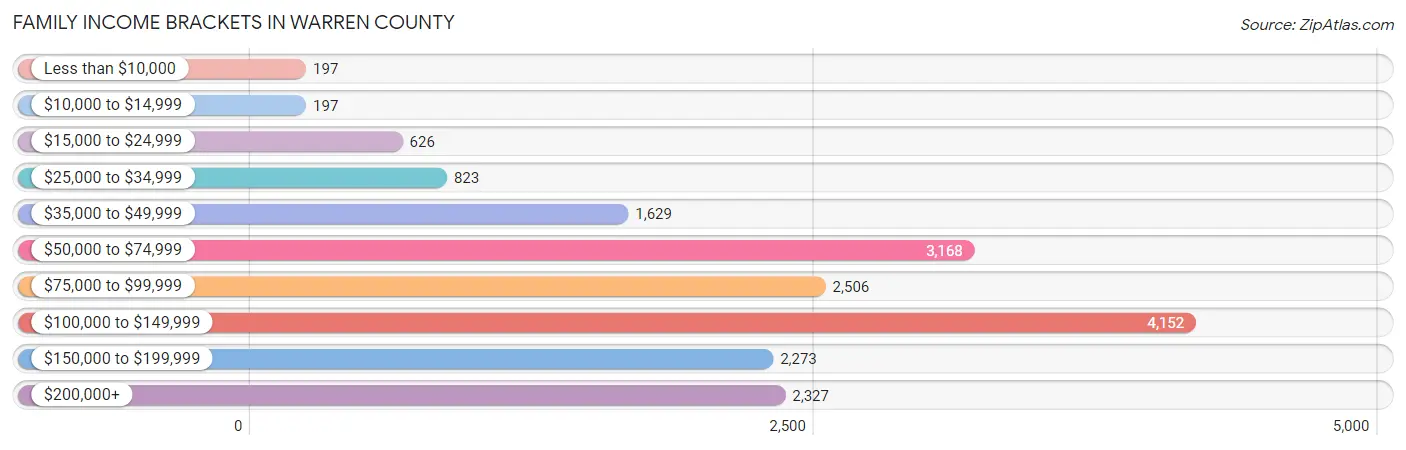
Family Income Brackets in Warren County
According to the Warren County family income data, there are 4,152 families falling into the $100,000 to $149,999 income range, which is the most common income bracket and makes up 23.2% of all families. Conversely, the less than $10,000 income bracket is the least frequent group with only 197 families (1.1%) belonging to this category.
| Income Bracket | # Families | % Families |
| Less than $10,000 | 197 | 1.1% |
| $10,000 to $14,999 | 197 | 1.1% |
| $15,000 to $24,999 | 626 | 3.5% |
| $25,000 to $34,999 | 823 | 4.6% |
| $35,000 to $49,999 | 1,629 | 9.1% |
| $50,000 to $74,999 | 3,168 | 17.7% |
| $75,000 to $99,999 | 2,506 | 14.0% |
| $100,000 to $149,999 | 4,152 | 23.2% |
| $150,000 to $199,999 | 2,273 | 12.7% |
| $200,000+ | 2,327 | 13.0% |
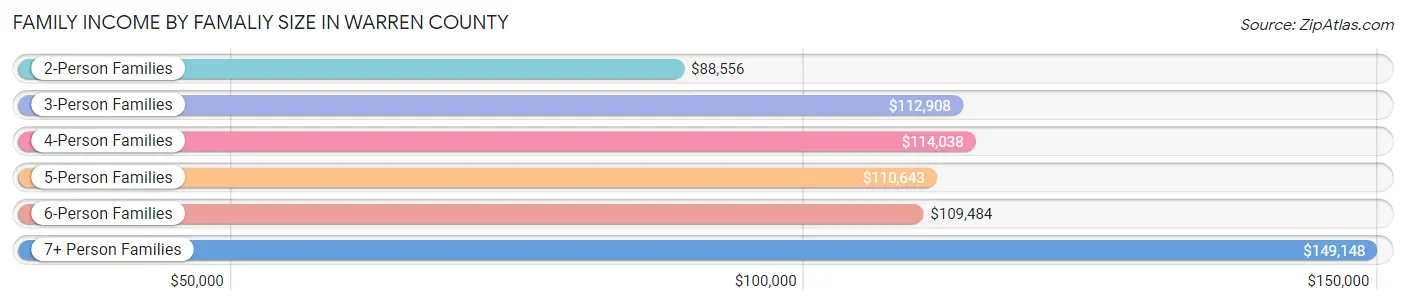
Family Income by Famaliy Size in Warren County
7+ person families (43 | 0.2%) account for the highest median family income in Warren County with $149,148 per family, while 2-person families (10,455 | 58.4%) have the highest median income of $44,278 per family member.
| Income Bracket | # Families | Median Income |
| 2-Person Families | 10,455 (58.4%) | $88,556 |
| 3-Person Families | 3,616 (20.2%) | $112,908 |
| 4-Person Families | 2,592 (14.5%) | $114,038 |
| 5-Person Families | 984 (5.5%) | $110,643 |
| 6-Person Families | 207 (1.2%) | $109,484 |
| 7+ Person Families | 43 (0.2%) | $149,148 |
| Total | 17,897 (100.0%) | $97,947 |
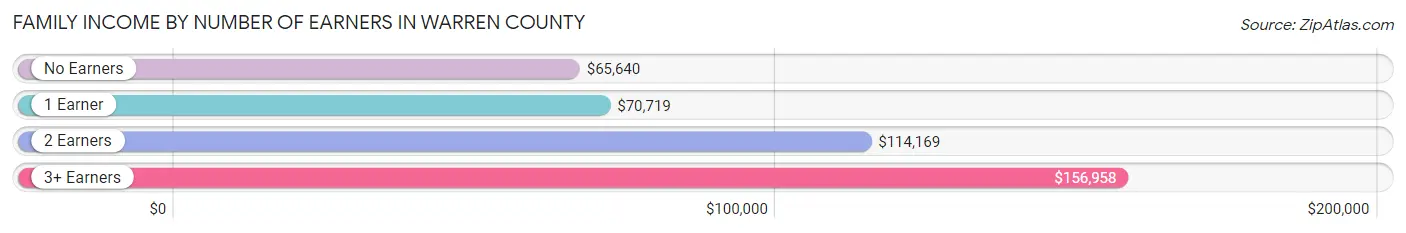
Family Income by Number of Earners in Warren County
The median family income in Warren County is $97,947, with families comprising 3+ earners (1,739) having the highest median family income of $156,958, while families with no earners (3,234) have the lowest median family income of $65,640, accounting for 9.7% and 18.1% of families, respectively.
| Number of Earners | # Families | Median Income |
| No Earners | 3,234 (18.1%) | $65,640 |
| 1 Earner | 5,139 (28.7%) | $70,719 |
| 2 Earners | 7,785 (43.5%) | $114,169 |
| 3+ Earners | 1,739 (9.7%) | $156,958 |
| Total | 17,897 (100.0%) | $97,947 |
Household Income in Warren County
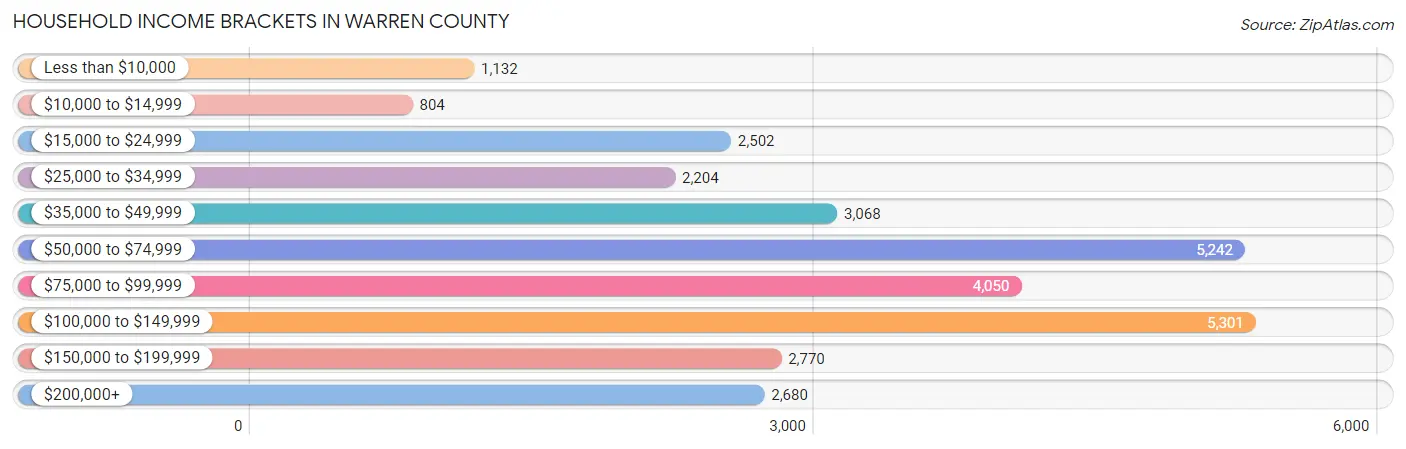
Household Income Brackets in Warren County
With 5,301 households falling in the category, the $100,000 to $149,999 income range is the most frequent in Warren County, accounting for 17.8% of all households. In contrast, only 804 households (2.7%) fall into the $10,000 to $14,999 income bracket, making it the least populous group.
| Income Bracket | # Households | % Households |
| Less than $10,000 | 1,132 | 3.8% |
| $10,000 to $14,999 | 804 | 2.7% |
| $15,000 to $24,999 | 2,502 | 8.4% |
| $25,000 to $34,999 | 2,204 | 7.4% |
| $35,000 to $49,999 | 3,068 | 10.3% |
| $50,000 to $74,999 | 5,242 | 17.6% |
| $75,000 to $99,999 | 4,050 | 13.6% |
| $100,000 to $149,999 | 5,301 | 17.8% |
| $150,000 to $199,999 | 2,770 | 9.3% |
| $200,000+ | 2,680 | 9.0% |
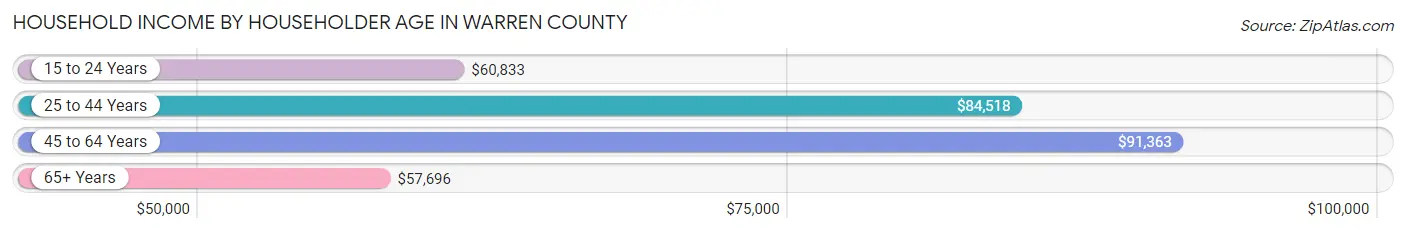
Household Income by Householder Age in Warren County
The median household income in Warren County is $74,531, with the highest median household income of $91,363 found in the 45 to 64 years age bracket for the primary householder. A total of 11,067 households (37.2%) fall into this category. Meanwhile, the 65+ years age bracket for the primary householder has the lowest median household income of $57,696, with 10,053 households (33.8%) in this group.
| Income Bracket | # Households | Median Income |
| 15 to 24 Years | 1,014 (3.4%) | $60,833 |
| 25 to 44 Years | 7,648 (25.7%) | $84,518 |
| 45 to 64 Years | 11,067 (37.2%) | $91,363 |
| 65+ Years | 10,053 (33.8%) | $57,696 |
| Total | 29,782 (100.0%) | $74,531 |
Poverty in Warren County
Income Below Poverty by Sex and Age in Warren County
With 8.7% poverty level for males and 8.6% for females among the residents of Warren County, 18 to 24 year old males and 15 year old females are the most vulnerable to poverty, with 360 males (14.7%) and 35 females (14.0%) in their respective age groups living below the poverty level.
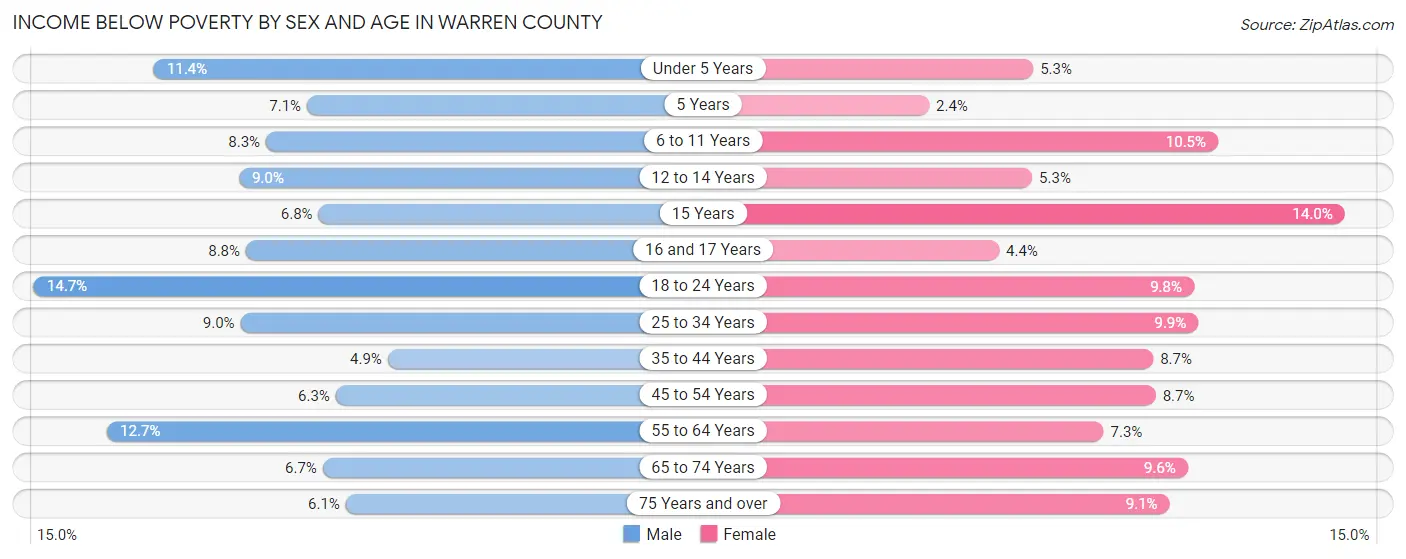
| Age Bracket | Male | Female |
| Under 5 Years | 156 (11.4%) | 75 (5.3%) |
| 5 Years | 22 (7.1%) | 8 (2.4%) |
| 6 to 11 Years | 182 (8.3%) | 208 (10.5%) |
| 12 to 14 Years | 81 (9.0%) | 50 (5.3%) |
| 15 Years | 15 (6.8%) | 35 (14.0%) |
| 16 and 17 Years | 78 (8.8%) | 31 (4.4%) |
| 18 to 24 Years | 360 (14.7%) | 219 (9.8%) |
| 25 to 34 Years | 353 (9.0%) | 376 (9.9%) |
| 35 to 44 Years | 181 (4.9%) | 308 (8.7%) |
| 45 to 54 Years | 265 (6.3%) | 364 (8.7%) |
| 55 to 64 Years | 649 (12.7%) | 402 (7.3%) |
| 65 to 74 Years | 301 (6.7%) | 435 (9.6%) |
| 75 Years and over | 154 (6.1%) | 299 (9.1%) |
| Total | 2,797 (8.7%) | 2,810 (8.6%) |
Income Above Poverty by Sex and Age in Warren County
According to the poverty statistics in Warren County, males aged 35 to 44 years and females aged 5 years are the age groups that are most secure financially, with 95.1% of males and 97.6% of females in these age groups living above the poverty line.
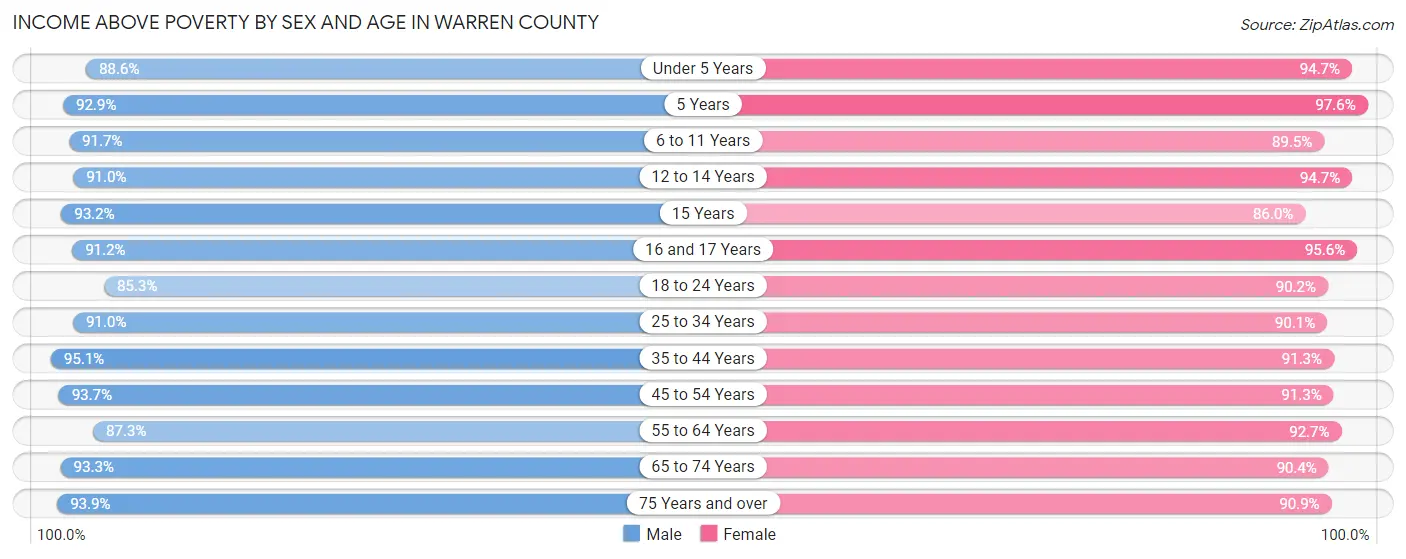
| Age Bracket | Male | Female |
| Under 5 Years | 1,213 (88.6%) | 1,332 (94.7%) |
| 5 Years | 286 (92.9%) | 321 (97.6%) |
| 6 to 11 Years | 2,015 (91.7%) | 1,779 (89.5%) |
| 12 to 14 Years | 816 (91.0%) | 894 (94.7%) |
| 15 Years | 205 (93.2%) | 215 (86.0%) |
| 16 and 17 Years | 804 (91.2%) | 676 (95.6%) |
| 18 to 24 Years | 2,082 (85.3%) | 2,015 (90.2%) |
| 25 to 34 Years | 3,572 (91.0%) | 3,415 (90.1%) |
| 35 to 44 Years | 3,517 (95.1%) | 3,246 (91.3%) |
| 45 to 54 Years | 3,914 (93.7%) | 3,800 (91.3%) |
| 55 to 64 Years | 4,461 (87.3%) | 5,115 (92.7%) |
| 65 to 74 Years | 4,191 (93.3%) | 4,081 (90.4%) |
| 75 Years and over | 2,388 (93.9%) | 2,979 (90.9%) |
| Total | 29,464 (91.3%) | 29,868 (91.4%) |
Income Below Poverty Among Married-Couple Families in Warren County
The poverty statistics for married-couple families in Warren County show that 2.9% or 397 of the total 13,771 families live below the poverty line. Families with 3 or 4 children have the highest poverty rate of 7.3%, comprising of 51 families. On the other hand, families with 1 or 2 children have the lowest poverty rate of 2.5%, which includes 93 families.
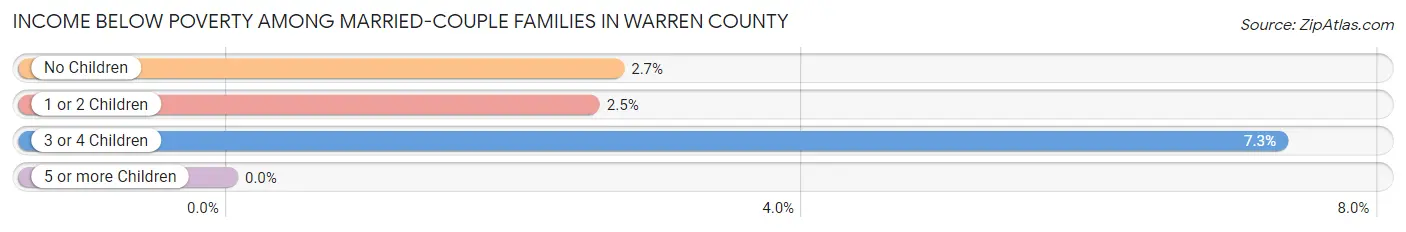
| Children | Above Poverty | Below Poverty |
| No Children | 9,135 (97.3%) | 253 (2.7%) |
| 1 or 2 Children | 3,592 (97.5%) | 93 (2.5%) |
| 3 or 4 Children | 647 (92.7%) | 51 (7.3%) |
| 5 or more Children | 0 (0.0%) | 0 (0.0%) |
| Total | 13,374 (97.1%) | 397 (2.9%) |
Income Below Poverty Among Single-Parent Households in Warren County
According to the poverty data in Warren County, 8.9% or 124 single-father households and 11.2% or 306 single-mother households are living below the poverty line. Among single-father households, those with 3 or 4 children have the highest poverty rate, with 11 households (14.1%) experiencing poverty. Likewise, among single-mother households, those with 3 or 4 children have the highest poverty rate, with 96 households (35.6%) falling below the poverty line.
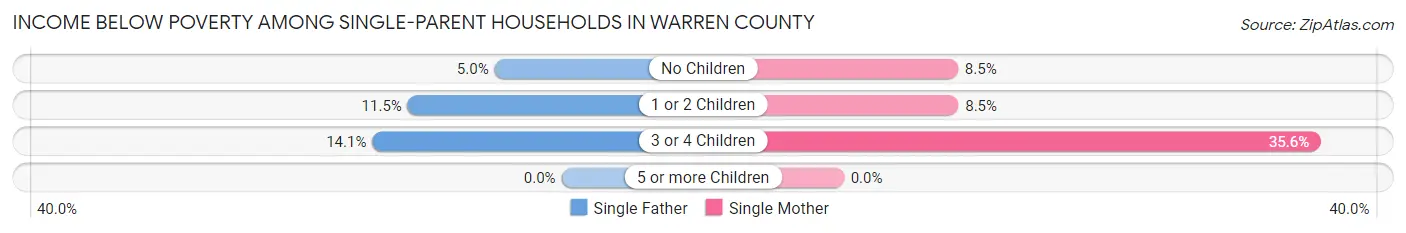
| Children | Single Father | Single Mother |
| No Children | 29 (5.0%) | 118 (8.5%) |
| 1 or 2 Children | 84 (11.5%) | 92 (8.5%) |
| 3 or 4 Children | 11 (14.1%) | 96 (35.6%) |
| 5 or more Children | 0 (0.0%) | 0 (0.0%) |
| Total | 124 (8.9%) | 306 (11.2%) |
Income Below Poverty Among Married-Couple vs Single-Parent Households in Warren County
The poverty data for Warren County shows that 397 of the married-couple family households (2.9%) and 430 of the single-parent households (10.4%) are living below the poverty level. Within the married-couple family households, those with 3 or 4 children have the highest poverty rate, with 51 households (7.3%) falling below the poverty line. Among the single-parent households, those with 3 or 4 children have the highest poverty rate, with 107 household (30.7%) living below poverty.
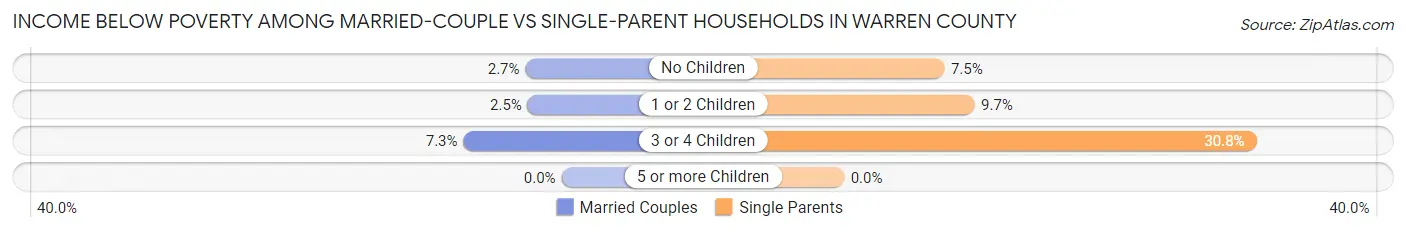
| Children | Married-Couple Families | Single-Parent Households |
| No Children | 253 (2.7%) | 147 (7.5%) |
| 1 or 2 Children | 93 (2.5%) | 176 (9.7%) |
| 3 or 4 Children | 51 (7.3%) | 107 (30.7%) |
| 5 or more Children | 0 (0.0%) | 0 (0.0%) |
| Total | 397 (2.9%) | 430 (10.4%) |
Race in Warren County
The most populous races in Warren County are White / Caucasian (61,373 | 93.4%), Two or more Races (2,579 | 3.9%), and Hispanic or Latino (1,909 | 2.9%).
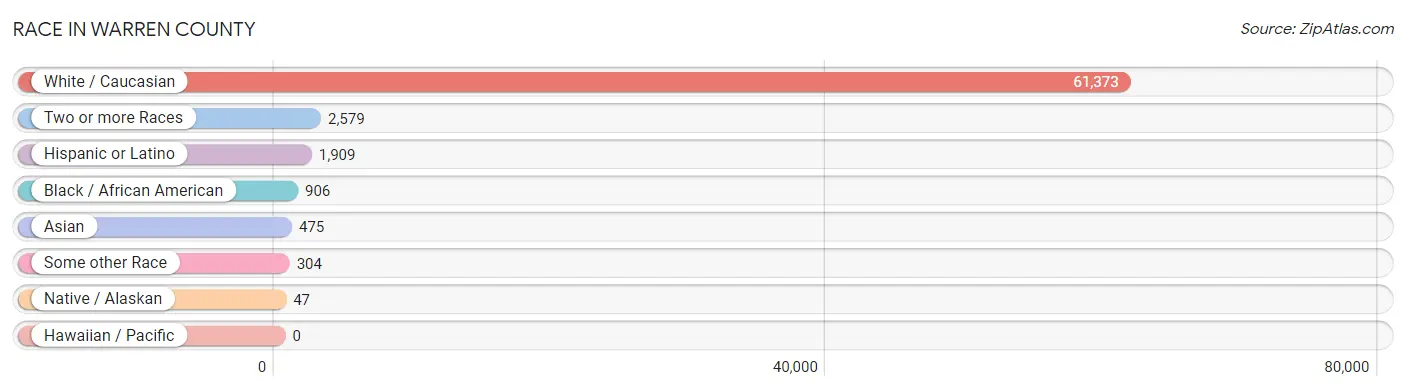
| Race | # Population | % Population |
| Asian | 475 | 0.7% |
| Black / African American | 906 | 1.4% |
| Hawaiian / Pacific | 0 | 0.0% |
| Hispanic or Latino | 1,909 | 2.9% |
| Native / Alaskan | 47 | 0.1% |
| White / Caucasian | 61,373 | 93.4% |
| Two or more Races | 2,579 | 3.9% |
| Some other Race | 304 | 0.5% |
| Total | 65,684 | 100.0% |
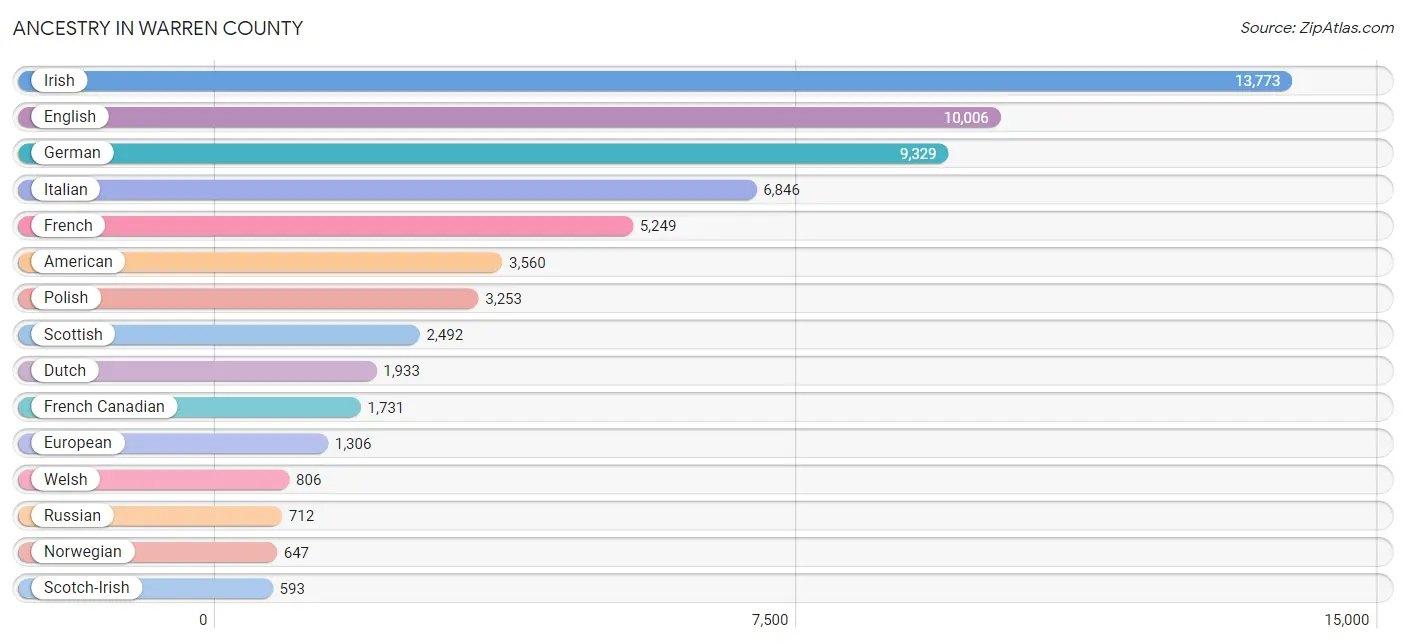
Ancestry in Warren County
The most populous ancestries reported in Warren County are Irish (13,773 | 21.0%), English (10,006 | 15.2%), German (9,329 | 14.2%), Italian (6,846 | 10.4%), and French (5,249 | 8.0%), together accounting for 68.8% of all Warren County residents.
| Ancestry | # Population | % Population |
| African | 26 | 0.0% |
| Alaska Native | 3 | 0.0% |
| American | 3,560 | 5.4% |
| Arab | 413 | 0.6% |
| Argentinean | 67 | 0.1% |
| Armenian | 28 | 0.0% |
| Austrian | 206 | 0.3% |
| Barbadian | 7 | 0.0% |
| Belgian | 20 | 0.0% |
| Bhutanese | 84 | 0.1% |
| Blackfeet | 59 | 0.1% |
| Brazilian | 10 | 0.0% |
| British | 415 | 0.6% |
| Burmese | 144 | 0.2% |
| Canadian | 568 | 0.9% |
| Central American | 309 | 0.5% |
| Central American Indian | 3 | 0.0% |
| Cherokee | 18 | 0.0% |
| Cheyenne | 2 | 0.0% |
| Chilean | 69 | 0.1% |
| Colombian | 42 | 0.1% |
| Costa Rican | 9 | 0.0% |
| Croatian | 17 | 0.0% |
| Cuban | 8 | 0.0% |
| Czech | 113 | 0.2% |
| Czechoslovakian | 85 | 0.1% |
| Danish | 89 | 0.1% |
| Dominican | 196 | 0.3% |
| Dutch | 1,933 | 2.9% |
| Eastern European | 156 | 0.2% |
| Ecuadorian | 121 | 0.2% |
| English | 10,006 | 15.2% |
| European | 1,306 | 2.0% |
| Finnish | 110 | 0.2% |
| French | 5,249 | 8.0% |
| French American Indian | 18 | 0.0% |
| French Canadian | 1,731 | 2.6% |
| German | 9,329 | 14.2% |
| Greek | 257 | 0.4% |
| Guatemalan | 48 | 0.1% |
| Guyanese | 46 | 0.1% |
| Haitian | 21 | 0.0% |
| Honduran | 67 | 0.1% |
| Hungarian | 345 | 0.5% |
| Indian (Asian) | 208 | 0.3% |
| Indonesian | 5 | 0.0% |
| Iranian | 15 | 0.0% |
| Irish | 13,773 | 21.0% |
| Iroquois | 74 | 0.1% |
| Israeli | 42 | 0.1% |
| Italian | 6,846 | 10.4% |
| Jamaican | 48 | 0.1% |
| Jordanian | 75 | 0.1% |
| Kenyan | 2 | 0.0% |
| Korean | 261 | 0.4% |
| Laotian | 67 | 0.1% |
| Latvian | 7 | 0.0% |
| Lebanese | 57 | 0.1% |
| Lithuanian | 184 | 0.3% |
| Mexican | 323 | 0.5% |
| Mexican American Indian | 19 | 0.0% |
| Moroccan | 4 | 0.0% |
| Native Hawaiian | 9 | 0.0% |
| Navajo | 15 | 0.0% |
| Nicaraguan | 8 | 0.0% |
| Nigerian | 19 | 0.0% |
| Northern European | 108 | 0.2% |
| Norwegian | 647 | 1.0% |
| Pakistani | 2 | 0.0% |
| Palestinian | 23 | 0.0% |
| Panamanian | 11 | 0.0% |
| Pennsylvania German | 11 | 0.0% |
| Peruvian | 112 | 0.2% |
| Polish | 3,253 | 5.0% |
| Portuguese | 89 | 0.1% |
| Puerto Rican | 385 | 0.6% |
| Romanian | 122 | 0.2% |
| Russian | 712 | 1.1% |
| Salvadoran | 166 | 0.3% |
| Scandinavian | 248 | 0.4% |
| Scotch-Irish | 593 | 0.9% |
| Scottish | 2,492 | 3.8% |
| Slavic | 30 | 0.1% |
| Slovak | 176 | 0.3% |
| Slovene | 20 | 0.0% |
| South African | 66 | 0.1% |
| South American | 414 | 0.6% |
| South American Indian | 25 | 0.0% |
| Spaniard | 99 | 0.2% |
| Spanish | 121 | 0.2% |
| Subsaharan African | 113 | 0.2% |
| Swedish | 464 | 0.7% |
| Swiss | 91 | 0.1% |
| Syrian | 207 | 0.3% |
| Thai | 189 | 0.3% |
| Trinidadian and Tobagonian | 15 | 0.0% |
| Turkish | 13 | 0.0% |
| Ukrainian | 170 | 0.3% |
| Venezuelan | 3 | 0.0% |
| Vietnamese | 47 | 0.1% |
| Welsh | 806 | 1.2% |
| West Indian | 48 | 0.1% |
| Yugoslavian | 64 | 0.1% | View All 103 Rows |
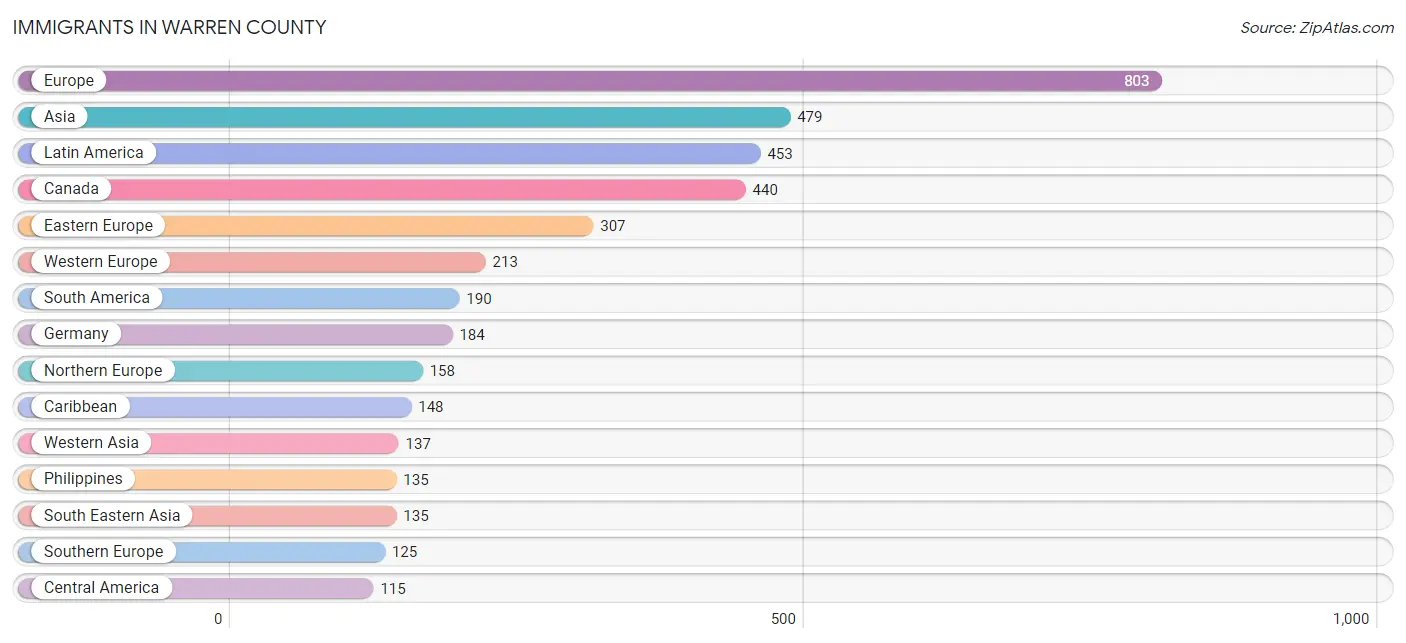
Immigrants in Warren County
The most numerous immigrant groups reported in Warren County came from Europe (803 | 1.2%), Asia (479 | 0.7%), Latin America (453 | 0.7%), Canada (440 | 0.7%), and Eastern Europe (307 | 0.5%), together accounting for 3.8% of all Warren County residents.
| Immigration Origin | # Population | % Population |
| Africa | 107 | 0.2% |
| Argentina | 46 | 0.1% |
| Asia | 479 | 0.7% |
| Austria | 16 | 0.0% |
| Bangladesh | 47 | 0.1% |
| Barbados | 3 | 0.0% |
| Belarus | 49 | 0.1% |
| Canada | 440 | 0.7% |
| Caribbean | 148 | 0.2% |
| Central America | 115 | 0.2% |
| China | 69 | 0.1% |
| Colombia | 6 | 0.0% |
| Czechoslovakia | 10 | 0.0% |
| Dominican Republic | 57 | 0.1% |
| Eastern Africa | 2 | 0.0% |
| Eastern Asia | 95 | 0.1% |
| Eastern Europe | 307 | 0.5% |
| Ecuador | 96 | 0.2% |
| El Salvador | 41 | 0.1% |
| England | 44 | 0.1% |
| Europe | 803 | 1.2% |
| Germany | 184 | 0.3% |
| Guyana | 11 | 0.0% |
| Honduras | 14 | 0.0% |
| Hungary | 31 | 0.1% |
| India | 33 | 0.1% |
| Iran | 15 | 0.0% |
| Ireland | 12 | 0.0% |
| Italy | 35 | 0.1% |
| Jamaica | 73 | 0.1% |
| Japan | 12 | 0.0% |
| Jordan | 75 | 0.1% |
| Kenya | 2 | 0.0% |
| Korea | 14 | 0.0% |
| Kuwait | 7 | 0.0% |
| Latin America | 453 | 0.7% |
| Mexico | 60 | 0.1% |
| Netherlands | 2 | 0.0% |
| Nigeria | 1 | 0.0% |
| Northern Europe | 158 | 0.2% |
| Pakistan | 17 | 0.0% |
| Peru | 31 | 0.1% |
| Philippines | 135 | 0.2% |
| Poland | 98 | 0.2% |
| Romania | 36 | 0.1% |
| Russia | 76 | 0.1% |
| Saudi Arabia | 13 | 0.0% |
| Scotland | 45 | 0.1% |
| South Africa | 96 | 0.2% |
| South America | 190 | 0.3% |
| South Central Asia | 112 | 0.2% |
| South Eastern Asia | 135 | 0.2% |
| Southern Europe | 125 | 0.2% |
| Spain | 90 | 0.1% |
| Switzerland | 11 | 0.0% |
| Syria | 29 | 0.0% |
| Trinidad and Tobago | 15 | 0.0% |
| Turkey | 13 | 0.0% |
| Western Africa | 9 | 0.0% |
| Western Asia | 137 | 0.2% |
| Western Europe | 213 | 0.3% | View All 61 Rows |
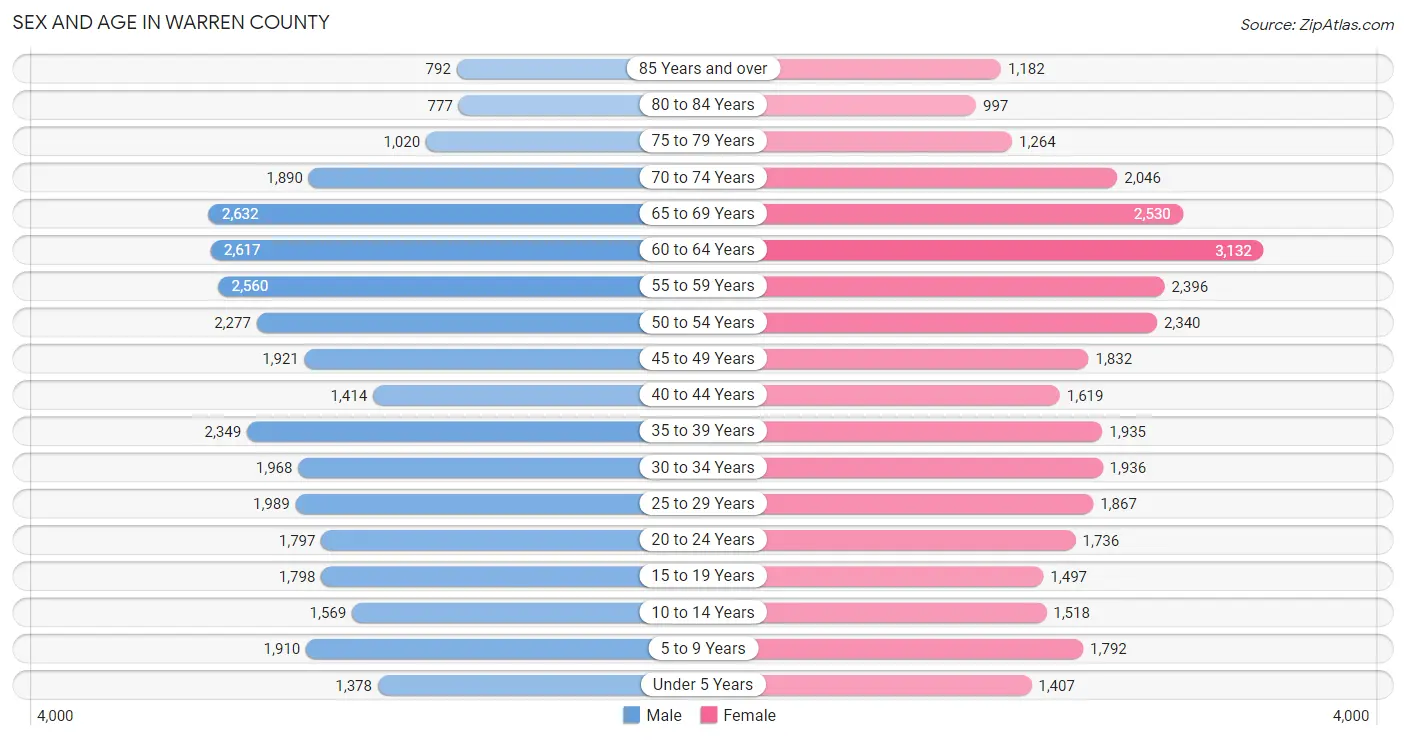
Sex and Age in Warren County
Sex and Age in Warren County
The most populous age groups in Warren County are 65 to 69 Years (2,632 | 8.1%) for men and 60 to 64 Years (3,132 | 9.5%) for women.
| Age Bracket | Male | Female |
| Under 5 Years | 1,378 (4.2%) | 1,407 (4.3%) |
| 5 to 9 Years | 1,910 (5.9%) | 1,792 (5.4%) |
| 10 to 14 Years | 1,569 (4.8%) | 1,518 (4.6%) |
| 15 to 19 Years | 1,798 (5.5%) | 1,497 (4.5%) |
| 20 to 24 Years | 1,797 (5.5%) | 1,736 (5.3%) |
| 25 to 29 Years | 1,989 (6.1%) | 1,867 (5.7%) |
| 30 to 34 Years | 1,968 (6.0%) | 1,936 (5.9%) |
| 35 to 39 Years | 2,349 (7.2%) | 1,935 (5.9%) |
| 40 to 44 Years | 1,414 (4.3%) | 1,619 (4.9%) |
| 45 to 49 Years | 1,921 (5.9%) | 1,832 (5.6%) |
| 50 to 54 Years | 2,277 (7.0%) | 2,340 (7.1%) |
| 55 to 59 Years | 2,560 (7.8%) | 2,396 (7.2%) |
| 60 to 64 Years | 2,617 (8.0%) | 3,132 (9.5%) |
| 65 to 69 Years | 2,632 (8.1%) | 2,530 (7.7%) |
| 70 to 74 Years | 1,890 (5.8%) | 2,046 (6.2%) |
| 75 to 79 Years | 1,020 (3.1%) | 1,264 (3.8%) |
| 80 to 84 Years | 777 (2.4%) | 997 (3.0%) |
| 85 Years and over | 792 (2.4%) | 1,182 (3.6%) |
| Total | 32,658 (100.0%) | 33,026 (100.0%) |
Families and Households in Warren County
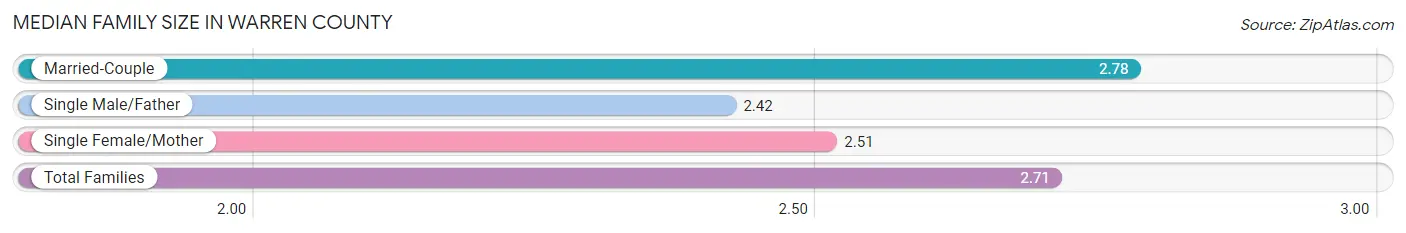
Median Family Size in Warren County
The median family size in Warren County is 2.71 persons per family, with married-couple families (13,771 | 76.9%) accounting for the largest median family size of 2.78 persons per family. On the other hand, single male/father families (1,392 | 7.8%) represent the smallest median family size with 2.42 persons per family.
| Family Type | # Families | Family Size |
| Married-Couple | 13,771 (76.9%) | 2.78 |
| Single Male/Father | 1,392 (7.8%) | 2.42 |
| Single Female/Mother | 2,734 (15.3%) | 2.51 |
| Total Families | 17,897 (100.0%) | 2.71 |
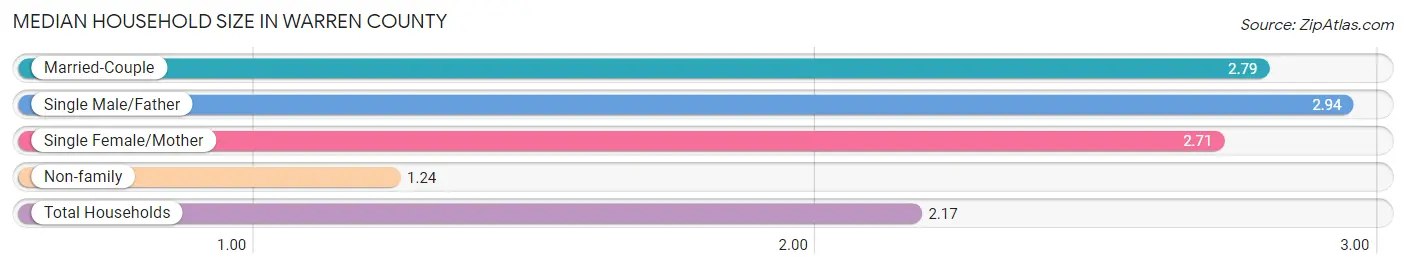
Median Household Size in Warren County
The median household size in Warren County is 2.17 persons per household, with single male/father households (1,392 | 4.7%) accounting for the largest median household size of 2.94 persons per household. non-family households (11,885 | 39.9%) represent the smallest median household size with 1.24 persons per household.
| Household Type | # Households | Household Size |
| Married-Couple | 13,771 (46.2%) | 2.79 |
| Single Male/Father | 1,392 (4.7%) | 2.94 |
| Single Female/Mother | 2,734 (9.2%) | 2.71 |
| Non-family | 11,885 (39.9%) | 1.24 |
| Total Households | 29,782 (100.0%) | 2.17 |
Household Size by Marriage Status in Warren County
Out of a total of 29,782 households in Warren County, 17,897 (60.1%) are family households, while 11,885 (39.9%) are nonfamily households. The most numerous type of family households are 2-person households, comprising 9,617, and the most common type of nonfamily households are 1-person households, comprising 9,424.
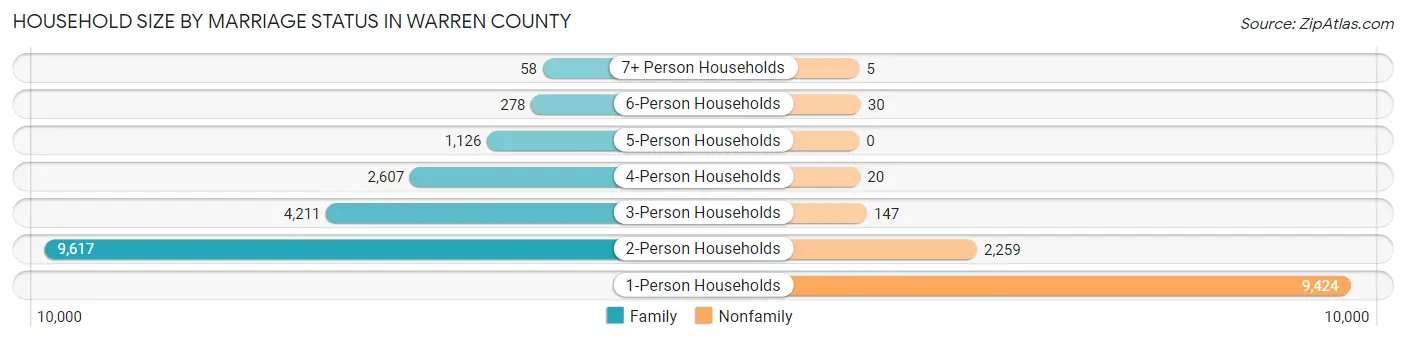
| Household Size | Family Households | Nonfamily Households |
| 1-Person Households | - | 9,424 (31.6%) |
| 2-Person Households | 9,617 (32.3%) | 2,259 (7.6%) |
| 3-Person Households | 4,211 (14.1%) | 147 (0.5%) |
| 4-Person Households | 2,607 (8.7%) | 20 (0.1%) |
| 5-Person Households | 1,126 (3.8%) | 0 (0.0%) |
| 6-Person Households | 278 (0.9%) | 30 (0.1%) |
| 7+ Person Households | 58 (0.2%) | 5 (0.0%) |
| Total | 17,897 (60.1%) | 11,885 (39.9%) |
Female Fertility in Warren County
Fertility by Age in Warren County
Average fertility rate in Warren County is 61.0 births per 1,000 women. Women in the age bracket of 20 to 34 years have the highest fertility rate with 95.0 births per 1,000 women. Women in the age bracket of 20 to 34 years acount for 67.3% of all women with births.
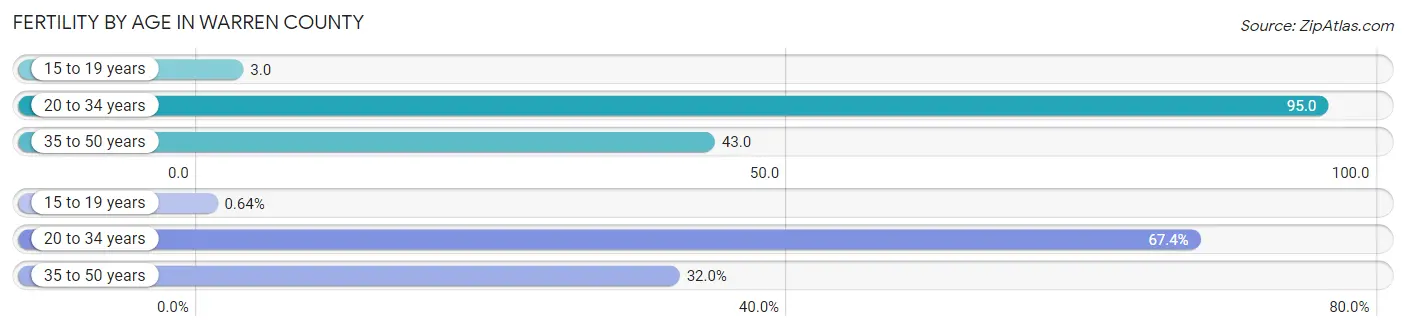
| Age Bracket | Women with Births | Births / 1,000 Women |
| 15 to 19 years | 5 (0.6%) | 3.0 |
| 20 to 34 years | 526 (67.3%) | 95.0 |
| 35 to 50 years | 250 (32.0%) | 43.0 |
| Total | 781 (100.0%) | 61.0 |
Fertility by Age by Marriage Status in Warren County
58.0% of women with births (781) in Warren County are married. The highest percentage of unmarried women with births falls into 15 to 19 years age bracket with 100.0% of them unmarried at the time of birth, while the lowest percentage of unmarried women with births belong to 35 to 50 years age bracket with 19.2% of them unmarried.
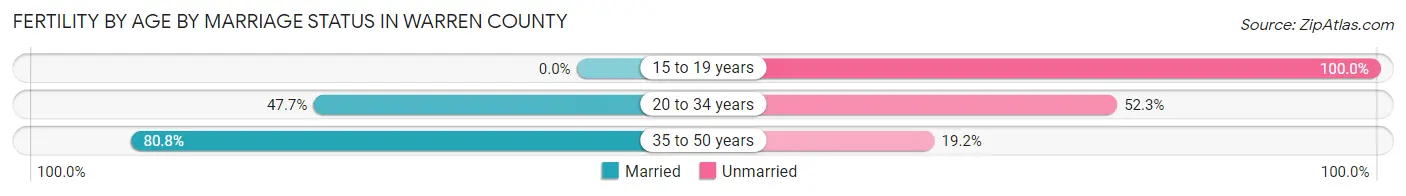
| Age Bracket | Married | Unmarried |
| 15 to 19 years | 0 (0.0%) | 5 (100.0%) |
| 20 to 34 years | 251 (47.7%) | 275 (52.3%) |
| 35 to 50 years | 202 (80.8%) | 48 (19.2%) |
| Total | 453 (58.0%) | 328 (42.0%) |
Fertility by Education in Warren County
Average fertility rate in Warren County is 61.0 births per 1,000 women. Women with the education attainment of graduate degree have the highest fertility rate of 83.0 births per 1,000 women, while women with the education attainment of less than high school have the lowest fertility at 28.0 births per 1,000 women. Women with the education attainment of college or associate's degree represent 37.5% of all women with births.
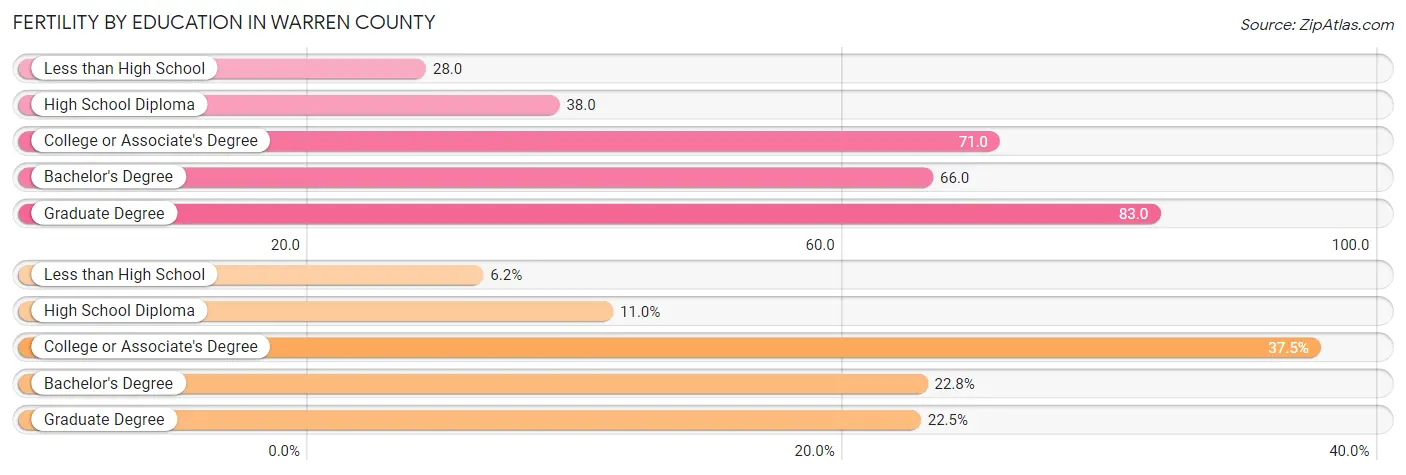
| Educational Attainment | Women with Births | Births / 1,000 Women |
| Less than High School | 48 (6.1%) | 28.0 |
| High School Diploma | 86 (11.0%) | 38.0 |
| College or Associate's Degree | 293 (37.5%) | 71.0 |
| Bachelor's Degree | 178 (22.8%) | 66.0 |
| Graduate Degree | 176 (22.5%) | 83.0 |
| Total | 781 (100.0%) | 61.0 |
Fertility by Education by Marriage Status in Warren County
42.0% of women with births in Warren County are unmarried. Women with the educational attainment of graduate degree are most likely to be married with 100.0% of them married at childbirth, while women with the educational attainment of less than high school are least likely to be married with 100.0% of them unmarried at childbirth.
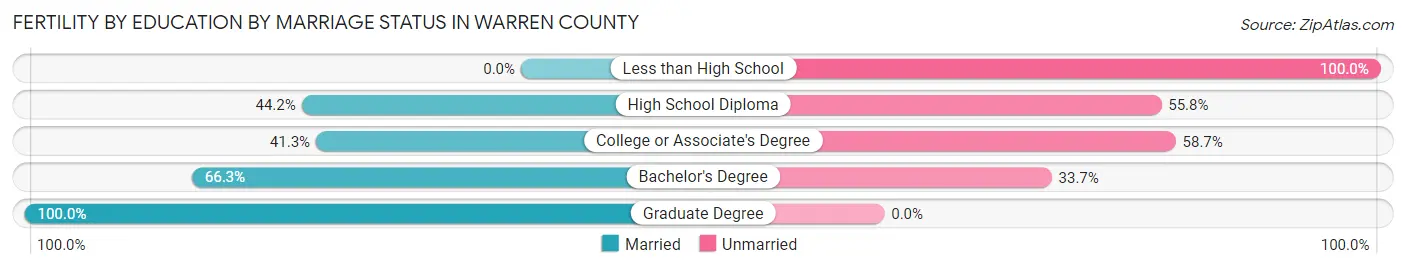
| Educational Attainment | Married | Unmarried |
| Less than High School | 0 (0.0%) | 48 (100.0%) |
| High School Diploma | 38 (44.2%) | 48 (55.8%) |
| College or Associate's Degree | 121 (41.3%) | 172 (58.7%) |
| Bachelor's Degree | 118 (66.3%) | 60 (33.7%) |
| Graduate Degree | 176 (100.0%) | 0 (0.0%) |
| Total | 453 (58.0%) | 328 (42.0%) |
Employment Characteristics in Warren County
Employment by Class of Employer in Warren County
Among the 31,577 employed individuals in Warren County, private company employees (18,138 | 57.4%), not-for-profit organizations (3,866 | 12.2%), and local government employees (3,834 | 12.1%) make up the most common classes of employment.
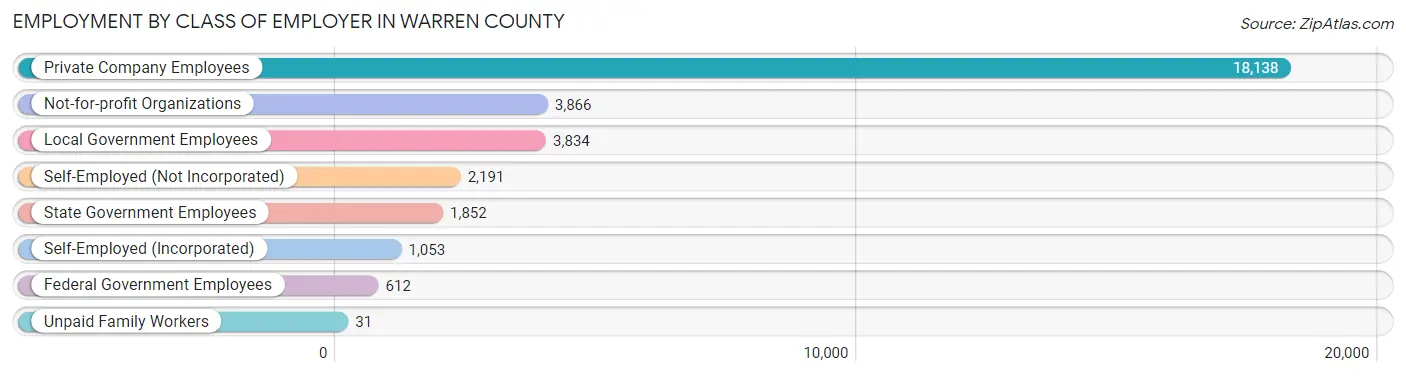
| Employer Class | # Employees | % Employees |
| Private Company Employees | 18,138 | 57.4% |
| Self-Employed (Incorporated) | 1,053 | 3.3% |
| Self-Employed (Not Incorporated) | 2,191 | 6.9% |
| Not-for-profit Organizations | 3,866 | 12.2% |
| Local Government Employees | 3,834 | 12.1% |
| State Government Employees | 1,852 | 5.9% |
| Federal Government Employees | 612 | 1.9% |
| Unpaid Family Workers | 31 | 0.1% |
| Total | 31,577 | 100.0% |
Employment Status by Age in Warren County
According to the labor force statistics for Warren County, out of the total population over 16 years of age (55,636), 60.1% or 33,437 individuals are in the labor force, with 4.2% or 1,404 of them unemployed. The age group with the highest labor force participation rate is 30 to 34 years, with 86.9% or 3,393 individuals in the labor force. Within the labor force, the 16 to 19 years age range has the highest percentage of unemployed individuals, with 17.4% or 216 of them being unemployed.
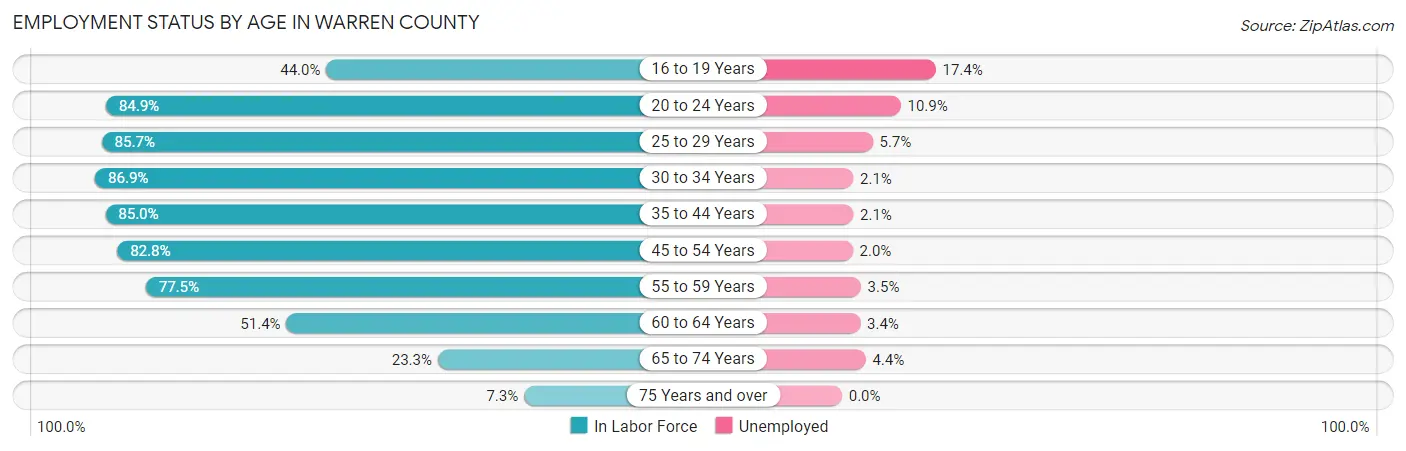
| Age Bracket | In Labor Force | Unemployed |
| 16 to 19 Years | 1,241 (44.0%) | 216 (17.4%) |
| 20 to 24 Years | 3,000 (84.9%) | 327 (10.9%) |
| 25 to 29 Years | 3,305 (85.7%) | 188 (5.7%) |
| 30 to 34 Years | 3,393 (86.9%) | 71 (2.1%) |
| 35 to 44 Years | 6,219 (85.0%) | 131 (2.1%) |
| 45 to 54 Years | 6,930 (82.8%) | 139 (2.0%) |
| 55 to 59 Years | 3,841 (77.5%) | 134 (3.5%) |
| 60 to 64 Years | 2,955 (51.4%) | 100 (3.4%) |
| 65 to 74 Years | 2,120 (23.3%) | 93 (4.4%) |
| 75 Years and over | 440 (7.3%) | 0 (0.0%) |
| Total | 33,437 (60.1%) | 1,404 (4.2%) |
Employment Status by Educational Attainment in Warren County
According to labor force statistics for Warren County, 78.0% of individuals (26,639) out of the total population between 25 and 64 years of age (34,152) are in the labor force, with 2.9% or 773 of them being unemployed. The group with the highest labor force participation rate are those with the educational attainment of bachelor's degree or higher, with 86.4% or 9,811 individuals in the labor force. Within the labor force, individuals with college / associate degree education have the highest percentage of unemployment, with 3.8% or 305 of them being unemployed.
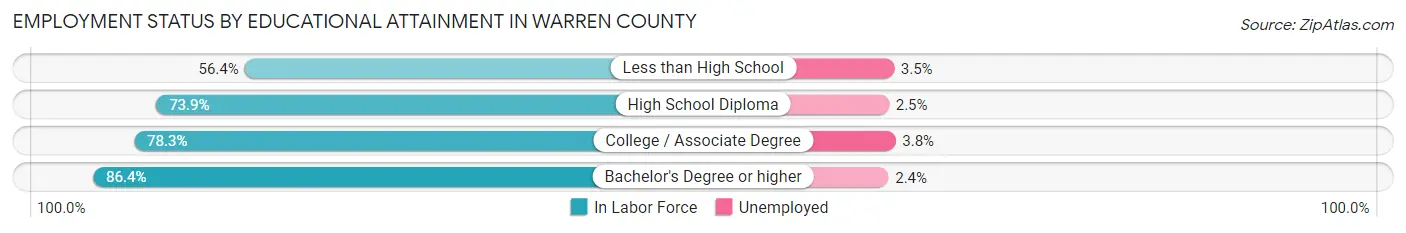
| Educational Attainment | In Labor Force | Unemployed |
| Less than High School | 1,526 (56.4%) | 95 (3.5%) |
| High School Diploma | 7,269 (73.9%) | 246 (2.5%) |
| College / Associate Degree | 8,030 (78.3%) | 390 (3.8%) |
| Bachelor's Degree or higher | 9,811 (86.4%) | 273 (2.4%) |
| Total | 26,639 (78.0%) | 990 (2.9%) |
Employment Occupations by Sex in Warren County
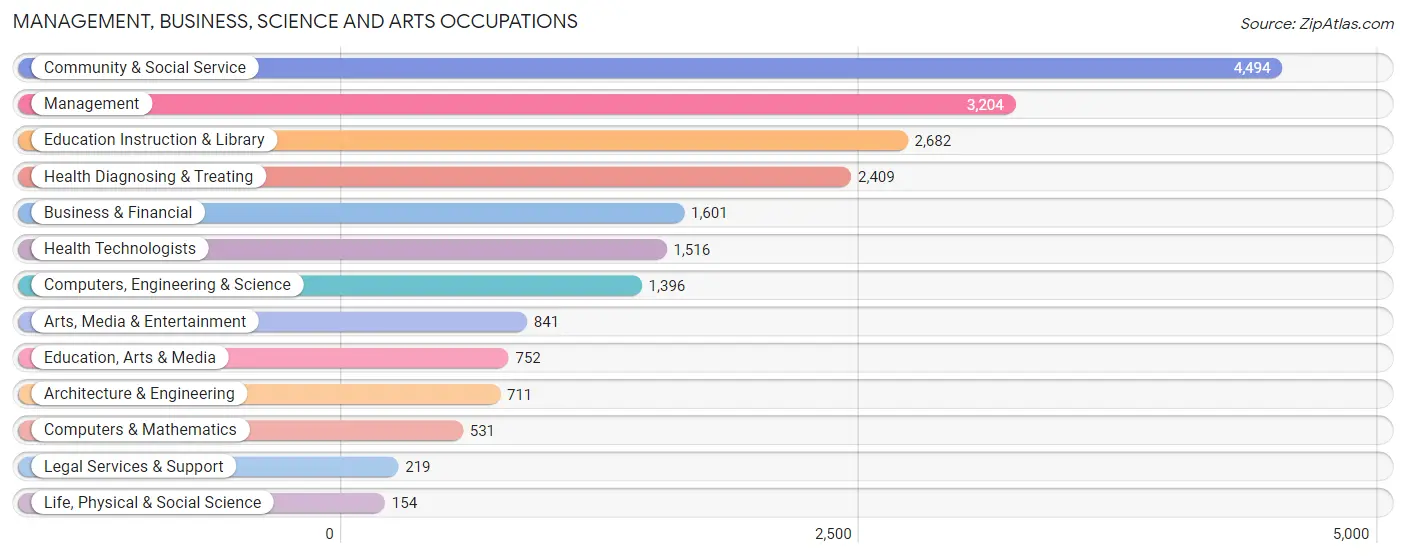
Management, Business, Science and Arts Occupations
The most common Management, Business, Science and Arts occupations in Warren County are Community & Social Service (4,494 | 14.1%), Management (3,204 | 10.1%), Education Instruction & Library (2,682 | 8.4%), Health Diagnosing & Treating (2,409 | 7.6%), and Business & Financial (1,601 | 5.0%).
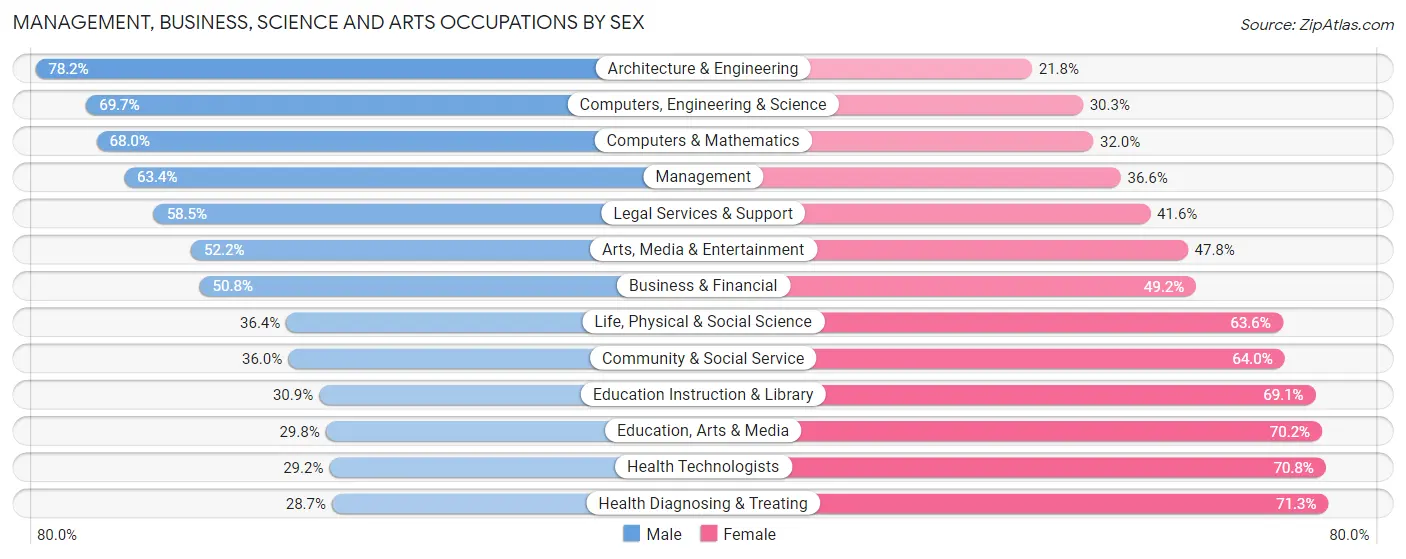
Management, Business, Science and Arts Occupations by Sex
Within the Management, Business, Science and Arts occupations in Warren County, the most male-oriented occupations are Architecture & Engineering (78.2%), Computers, Engineering & Science (69.7%), and Computers & Mathematics (68.0%), while the most female-oriented occupations are Health Diagnosing & Treating (71.3%), Health Technologists (70.8%), and Education, Arts & Media (70.2%).
| Occupation | Male | Female |
| Management | 2,031 (63.4%) | 1,173 (36.6%) |
| Business & Financial | 813 (50.8%) | 788 (49.2%) |
| Computers, Engineering & Science | 973 (69.7%) | 423 (30.3%) |
| Computers & Mathematics | 361 (68.0%) | 170 (32.0%) |
| Architecture & Engineering | 556 (78.2%) | 155 (21.8%) |
| Life, Physical & Social Science | 56 (36.4%) | 98 (63.6%) |
| Community & Social Service | 1,619 (36.0%) | 2,875 (64.0%) |
| Education, Arts & Media | 224 (29.8%) | 528 (70.2%) |
| Legal Services & Support | 128 (58.5%) | 91 (41.5%) |
| Education Instruction & Library | 828 (30.9%) | 1,854 (69.1%) |
| Arts, Media & Entertainment | 439 (52.2%) | 402 (47.8%) |
| Health Diagnosing & Treating | 692 (28.7%) | 1,717 (71.3%) |
| Health Technologists | 442 (29.2%) | 1,074 (70.8%) |
| Total (Category) | 6,128 (46.8%) | 6,976 (53.2%) |
| Total (Overall) | 16,611 (52.1%) | 15,273 (47.9%) |
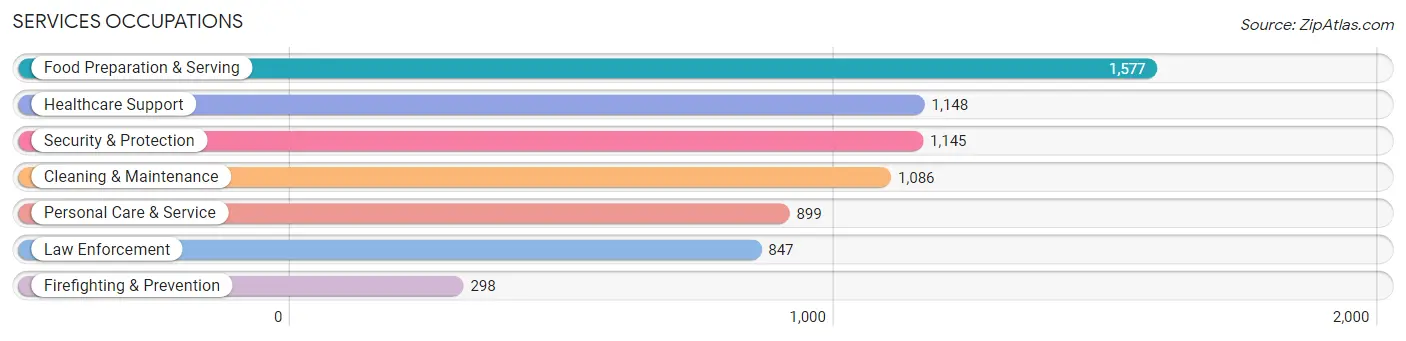
Services Occupations
The most common Services occupations in Warren County are Food Preparation & Serving (1,577 | 5.0%), Healthcare Support (1,148 | 3.6%), Security & Protection (1,145 | 3.6%), Cleaning & Maintenance (1,086 | 3.4%), and Personal Care & Service (899 | 2.8%).
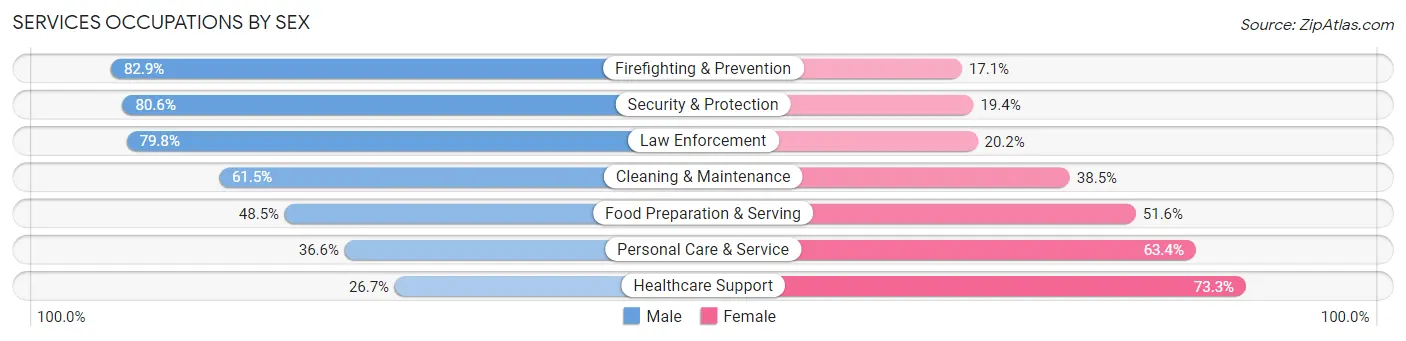
Services Occupations by Sex
Within the Services occupations in Warren County, the most male-oriented occupations are Firefighting & Prevention (82.9%), Security & Protection (80.6%), and Law Enforcement (79.8%), while the most female-oriented occupations are Healthcare Support (73.3%), Personal Care & Service (63.4%), and Food Preparation & Serving (51.5%).
| Occupation | Male | Female |
| Healthcare Support | 306 (26.7%) | 842 (73.3%) |
| Security & Protection | 923 (80.6%) | 222 (19.4%) |
| Firefighting & Prevention | 247 (82.9%) | 51 (17.1%) |
| Law Enforcement | 676 (79.8%) | 171 (20.2%) |
| Food Preparation & Serving | 764 (48.4%) | 813 (51.5%) |
| Cleaning & Maintenance | 668 (61.5%) | 418 (38.5%) |
| Personal Care & Service | 329 (36.6%) | 570 (63.4%) |
| Total (Category) | 2,990 (51.1%) | 2,865 (48.9%) |
| Total (Overall) | 16,611 (52.1%) | 15,273 (47.9%) |
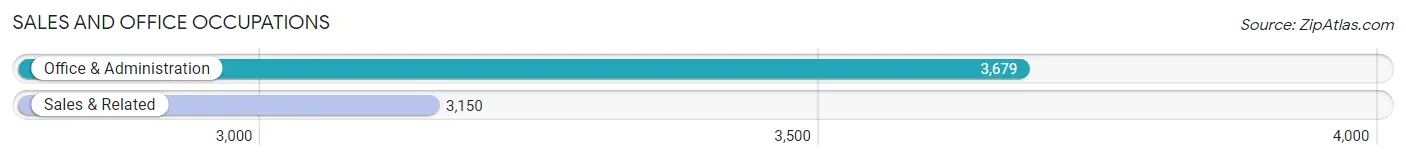
Sales and Office Occupations
The most common Sales and Office occupations in Warren County are Office & Administration (3,679 | 11.5%), and Sales & Related (3,150 | 9.9%).
Sales and Office Occupations by Sex
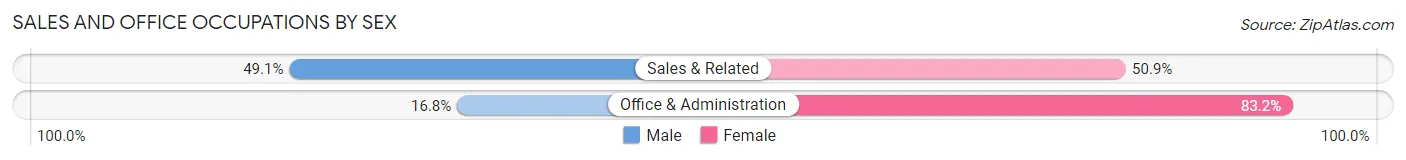
| Occupation | Male | Female |
| Sales & Related | 1,547 (49.1%) | 1,603 (50.9%) |
| Office & Administration | 619 (16.8%) | 3,060 (83.2%) |
| Total (Category) | 2,166 (31.7%) | 4,663 (68.3%) |
| Total (Overall) | 16,611 (52.1%) | 15,273 (47.9%) |
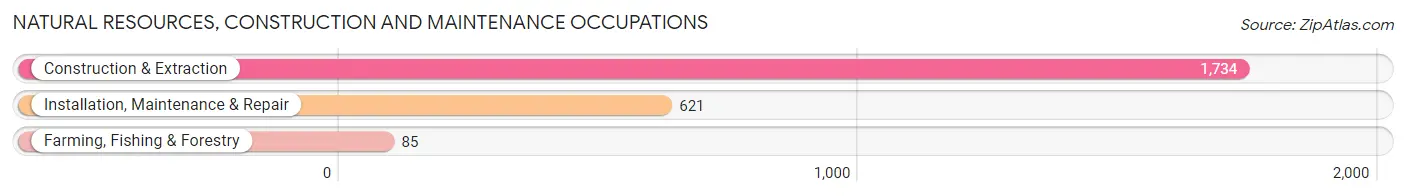
Natural Resources, Construction and Maintenance Occupations
The most common Natural Resources, Construction and Maintenance occupations in Warren County are Construction & Extraction (1,734 | 5.4%), Installation, Maintenance & Repair (621 | 1.9%), and Farming, Fishing & Forestry (85 | 0.3%).
Natural Resources, Construction and Maintenance Occupations by Sex
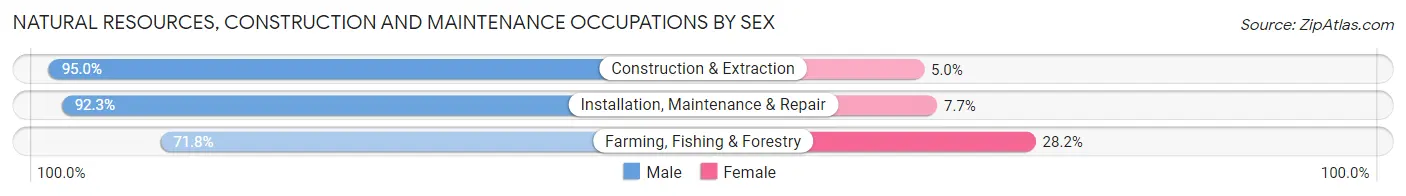
| Occupation | Male | Female |
| Farming, Fishing & Forestry | 61 (71.8%) | 24 (28.2%) |
| Construction & Extraction | 1,647 (95.0%) | 87 (5.0%) |
| Installation, Maintenance & Repair | 573 (92.3%) | 48 (7.7%) |
| Total (Category) | 2,281 (93.5%) | 159 (6.5%) |
| Total (Overall) | 16,611 (52.1%) | 15,273 (47.9%) |
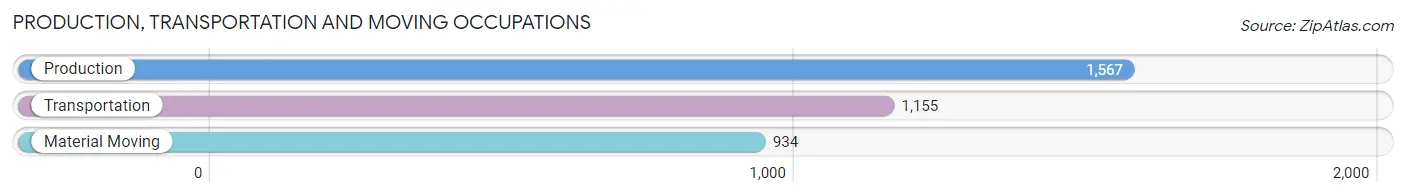
Production, Transportation and Moving Occupations
The most common Production, Transportation and Moving occupations in Warren County are Production (1,567 | 4.9%), Transportation (1,155 | 3.6%), and Material Moving (934 | 2.9%).
Production, Transportation and Moving Occupations by Sex
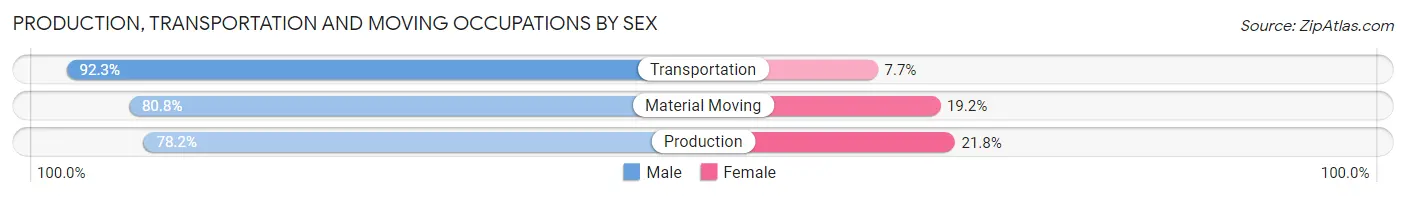
| Occupation | Male | Female |
| Production | 1,225 (78.2%) | 342 (21.8%) |
| Transportation | 1,066 (92.3%) | 89 (7.7%) |
| Material Moving | 755 (80.8%) | 179 (19.2%) |
| Total (Category) | 3,046 (83.3%) | 610 (16.7%) |
| Total (Overall) | 16,611 (52.1%) | 15,273 (47.9%) |
Employment Industries by Sex in Warren County
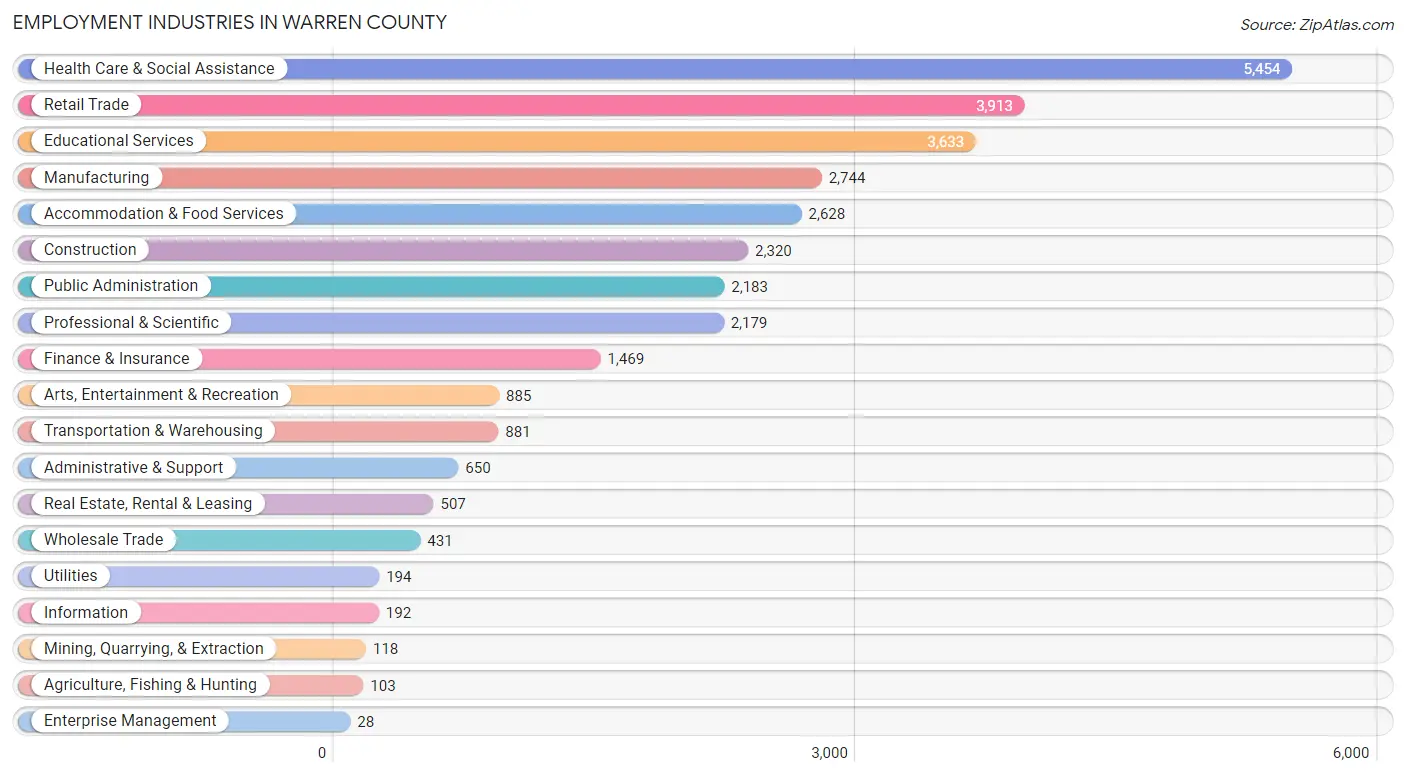
Employment Industries in Warren County
The major employment industries in Warren County include Health Care & Social Assistance (5,454 | 17.1%), Retail Trade (3,913 | 12.3%), Educational Services (3,633 | 11.4%), Manufacturing (2,744 | 8.6%), and Accommodation & Food Services (2,628 | 8.2%).
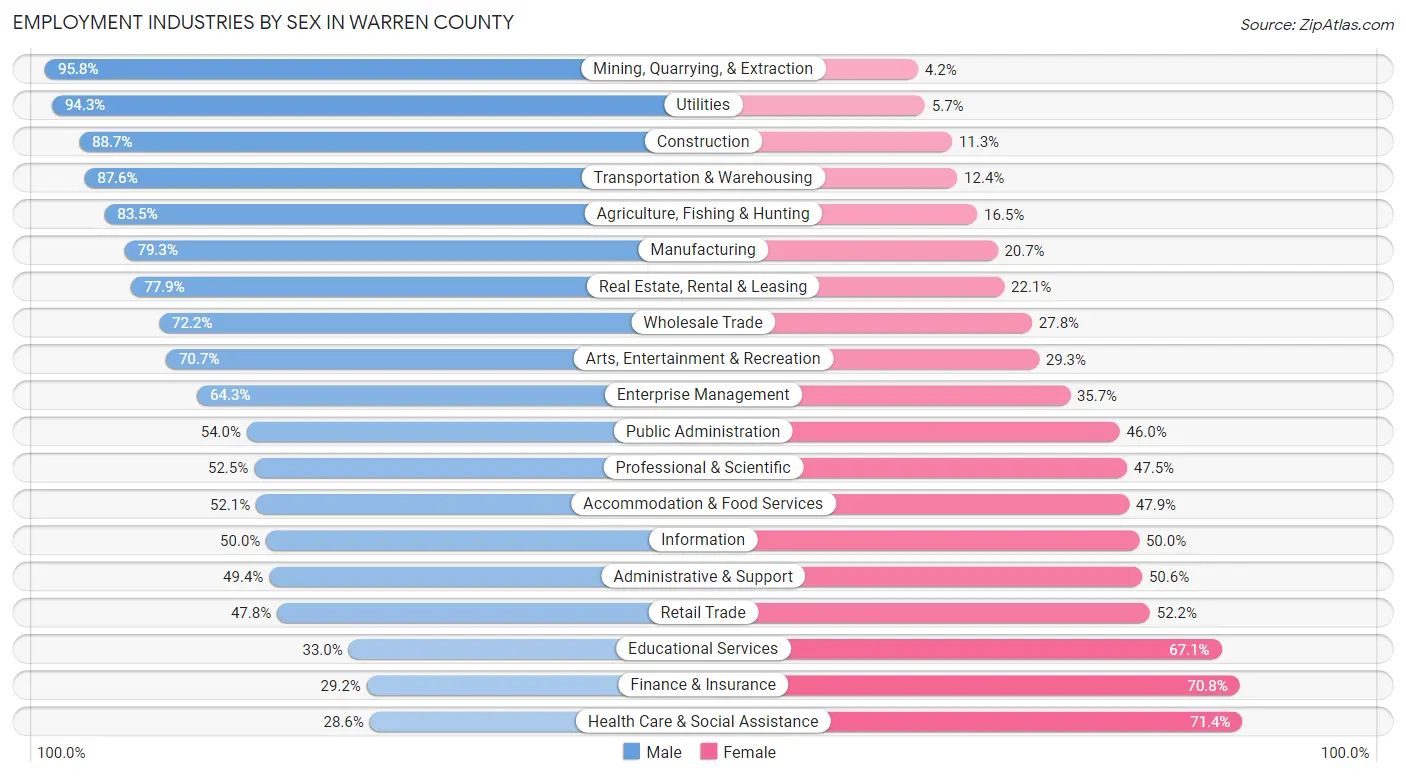
Employment Industries by Sex in Warren County
The Warren County industries that see more men than women are Mining, Quarrying, & Extraction (95.8%), Utilities (94.3%), and Construction (88.7%), whereas the industries that tend to have a higher number of women are Health Care & Social Assistance (71.4%), Finance & Insurance (70.8%), and Educational Services (67.0%).
| Industry | Male | Female |
| Agriculture, Fishing & Hunting | 86 (83.5%) | 17 (16.5%) |
| Mining, Quarrying, & Extraction | 113 (95.8%) | 5 (4.2%) |
| Construction | 2,058 (88.7%) | 262 (11.3%) |
| Manufacturing | 2,176 (79.3%) | 568 (20.7%) |
| Wholesale Trade | 311 (72.2%) | 120 (27.8%) |
| Retail Trade | 1,869 (47.8%) | 2,044 (52.2%) |
| Transportation & Warehousing | 772 (87.6%) | 109 (12.4%) |
| Utilities | 183 (94.3%) | 11 (5.7%) |
| Information | 96 (50.0%) | 96 (50.0%) |
| Finance & Insurance | 429 (29.2%) | 1,040 (70.8%) |
| Real Estate, Rental & Leasing | 395 (77.9%) | 112 (22.1%) |
| Professional & Scientific | 1,144 (52.5%) | 1,035 (47.5%) |
| Enterprise Management | 18 (64.3%) | 10 (35.7%) |
| Administrative & Support | 321 (49.4%) | 329 (50.6%) |
| Educational Services | 1,197 (33.0%) | 2,436 (67.0%) |
| Health Care & Social Assistance | 1,560 (28.6%) | 3,894 (71.4%) |
| Arts, Entertainment & Recreation | 626 (70.7%) | 259 (29.3%) |
| Accommodation & Food Services | 1,369 (52.1%) | 1,259 (47.9%) |
| Public Administration | 1,179 (54.0%) | 1,004 (46.0%) |
| Total | 16,611 (52.1%) | 15,273 (47.9%) |
Education in Warren County
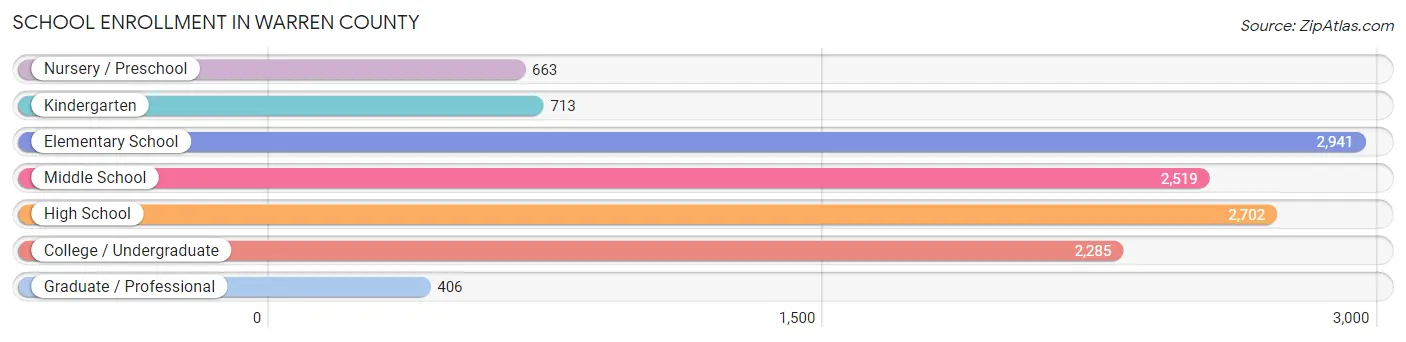
School Enrollment in Warren County
The most common levels of schooling among the 12,229 students in Warren County are elementary school (2,941 | 24.0%), high school (2,702 | 22.1%), and middle school (2,519 | 20.6%).
| School Level | # Students | % Students |
| Nursery / Preschool | 663 | 5.4% |
| Kindergarten | 713 | 5.8% |
| Elementary School | 2,941 | 24.0% |
| Middle School | 2,519 | 20.6% |
| High School | 2,702 | 22.1% |
| College / Undergraduate | 2,285 | 18.7% |
| Graduate / Professional | 406 | 3.3% |
| Total | 12,229 | 100.0% |
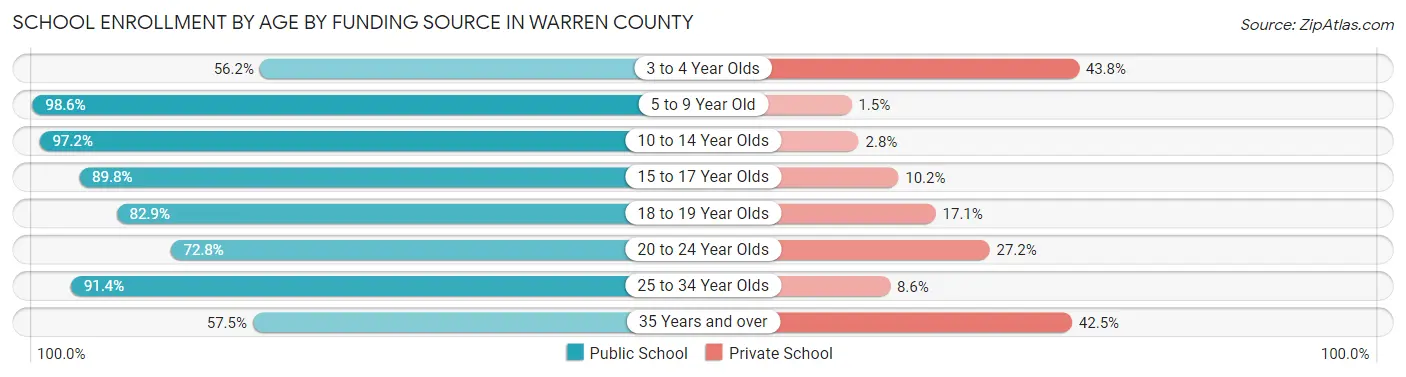
School Enrollment by Age by Funding Source in Warren County
Out of a total of 12,229 students who are enrolled in schools in Warren County, 1,321 (10.8%) attend a private institution, while the remaining 10,908 (89.2%) are enrolled in public schools. The age group of 3 to 4 year olds has the highest likelihood of being enrolled in private schools, with 233 (43.8% in the age bracket) enrolled. Conversely, the age group of 5 to 9 year old has the lowest likelihood of being enrolled in a private school, with 3,525 (98.6% in the age bracket) attending a public institution.
| Age Bracket | Public School | Private School |
| 3 to 4 Year Olds | 299 (56.2%) | 233 (43.8%) |
| 5 to 9 Year Old | 3,525 (98.6%) | 52 (1.5%) |
| 10 to 14 Year Olds | 2,903 (97.2%) | 83 (2.8%) |
| 15 to 17 Year Olds | 1,775 (89.8%) | 201 (10.2%) |
| 18 to 19 Year Olds | 774 (82.9%) | 160 (17.1%) |
| 20 to 24 Year Olds | 721 (72.8%) | 269 (27.2%) |
| 25 to 34 Year Olds | 530 (91.4%) | 50 (8.6%) |
| 35 Years and over | 376 (57.5%) | 278 (42.5%) |
| Total | 10,908 (89.2%) | 1,321 (10.8%) |
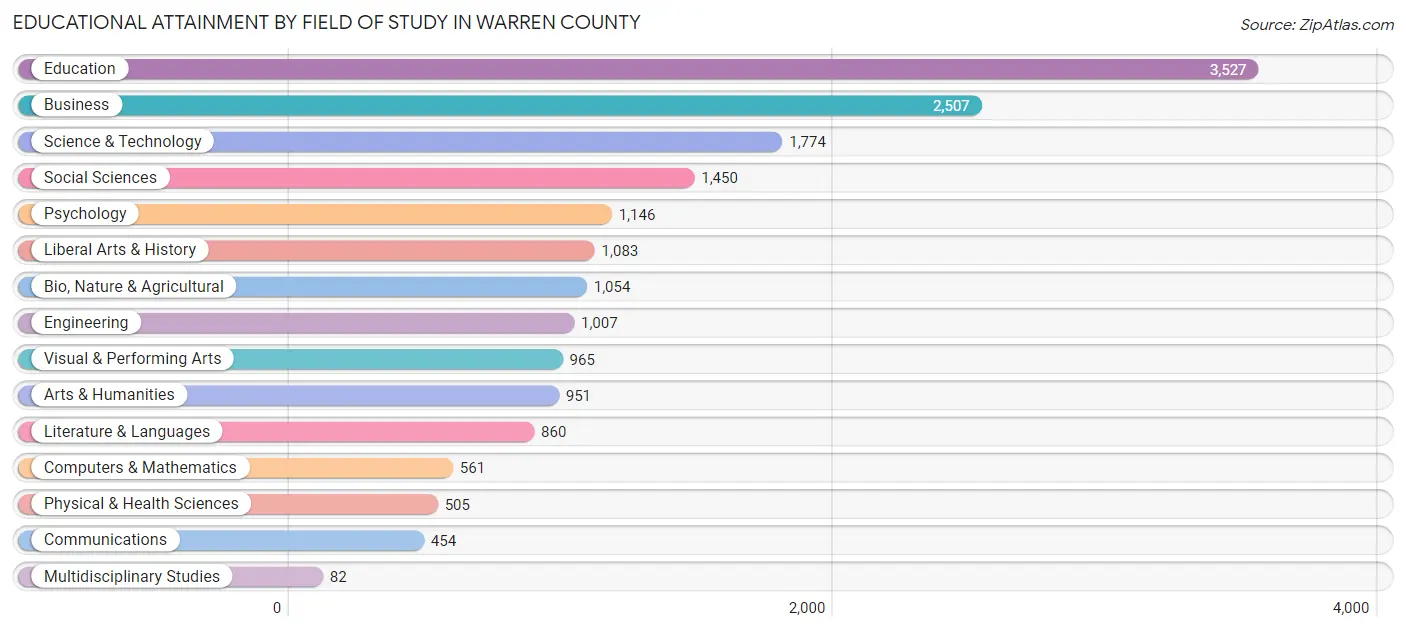
Educational Attainment by Field of Study in Warren County
Education (3,527 | 19.7%), business (2,507 | 14.0%), science & technology (1,774 | 9.9%), social sciences (1,450 | 8.1%), and psychology (1,146 | 6.4%) are the most common fields of study among 17,926 individuals in Warren County who have obtained a bachelor's degree or higher.
| Field of Study | # Graduates | % Graduates |
| Computers & Mathematics | 561 | 3.1% |
| Bio, Nature & Agricultural | 1,054 | 5.9% |
| Physical & Health Sciences | 505 | 2.8% |
| Psychology | 1,146 | 6.4% |
| Social Sciences | 1,450 | 8.1% |
| Engineering | 1,007 | 5.6% |
| Multidisciplinary Studies | 82 | 0.5% |
| Science & Technology | 1,774 | 9.9% |
| Business | 2,507 | 14.0% |
| Education | 3,527 | 19.7% |
| Literature & Languages | 860 | 4.8% |
| Liberal Arts & History | 1,083 | 6.0% |
| Visual & Performing Arts | 965 | 5.4% |
| Communications | 454 | 2.5% |
| Arts & Humanities | 951 | 5.3% |
| Total | 17,926 | 100.0% |
Transportation & Commute in Warren County
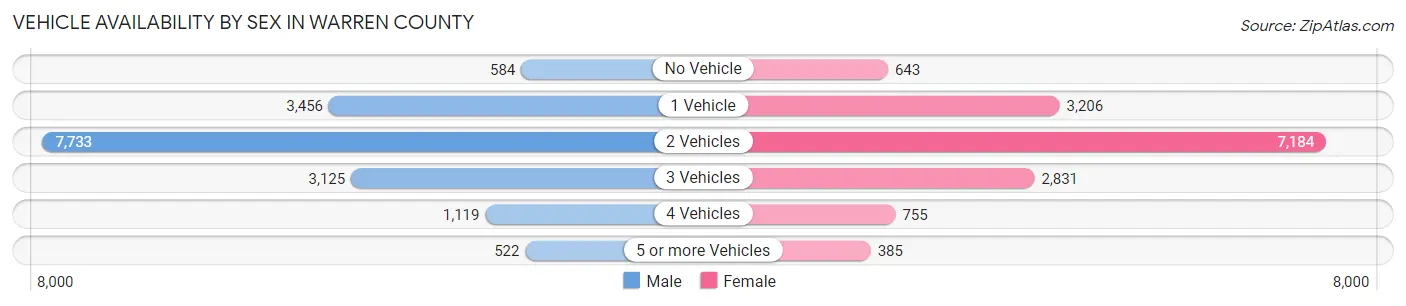
Vehicle Availability by Sex in Warren County
The most prevalent vehicle ownership categories in Warren County are males with 2 vehicles (7,733, accounting for 46.8%) and females with 2 vehicles (7,184, making up 51.5%).
| Vehicles Available | Male | Female |
| No Vehicle | 584 (3.5%) | 643 (4.3%) |
| 1 Vehicle | 3,456 (20.9%) | 3,206 (21.4%) |
| 2 Vehicles | 7,733 (46.8%) | 7,184 (47.9%) |
| 3 Vehicles | 3,125 (18.9%) | 2,831 (18.9%) |
| 4 Vehicles | 1,119 (6.8%) | 755 (5.0%) |
| 5 or more Vehicles | 522 (3.2%) | 385 (2.6%) |
| Total | 16,539 (100.0%) | 15,004 (100.0%) |
Commute Time in Warren County
The most frequently occuring commute durations in Warren County are 10 to 14 minutes (5,050 commuters, 17.3%), 15 to 19 minutes (4,706 commuters, 16.1%), and 5 to 9 minutes (4,484 commuters, 15.4%).
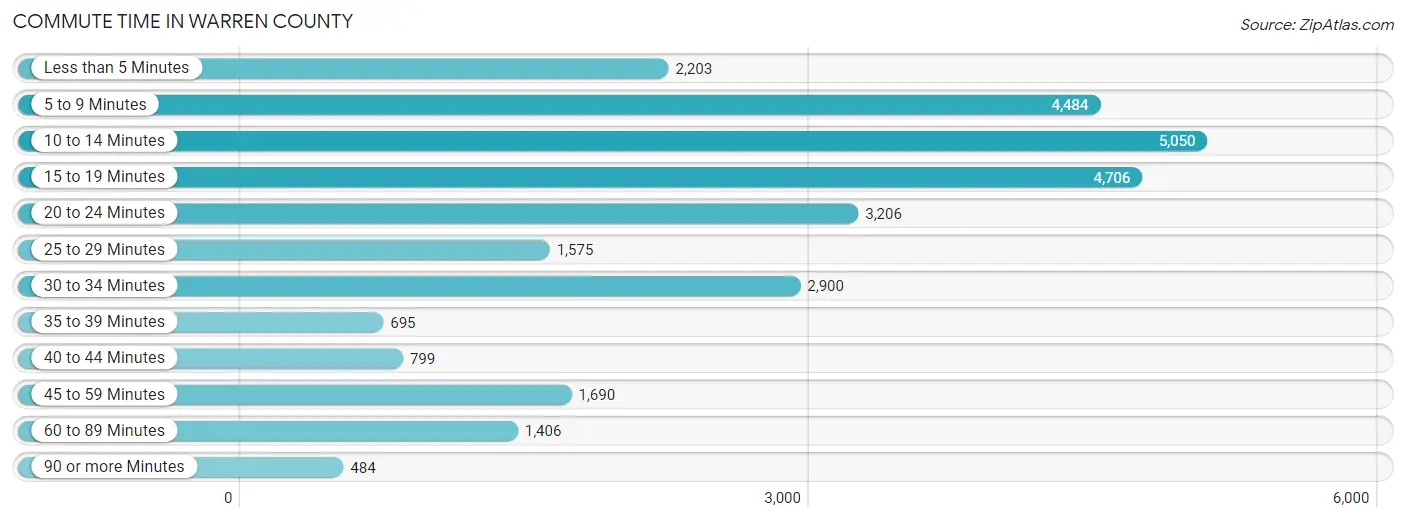
| Commute Time | # Commuters | % Commuters |
| Less than 5 Minutes | 2,203 | 7.5% |
| 5 to 9 Minutes | 4,484 | 15.4% |
| 10 to 14 Minutes | 5,050 | 17.3% |
| 15 to 19 Minutes | 4,706 | 16.1% |
| 20 to 24 Minutes | 3,206 | 11.0% |
| 25 to 29 Minutes | 1,575 | 5.4% |
| 30 to 34 Minutes | 2,900 | 9.9% |
| 35 to 39 Minutes | 695 | 2.4% |
| 40 to 44 Minutes | 799 | 2.7% |
| 45 to 59 Minutes | 1,690 | 5.8% |
| 60 to 89 Minutes | 1,406 | 4.8% |
| 90 or more Minutes | 484 | 1.7% |
Commute Time by Sex in Warren County
The most common commute times in Warren County are 10 to 14 minutes (2,624 commuters, 16.9%) for males and 5 to 9 minutes (2,453 commuters, 17.9%) for females.
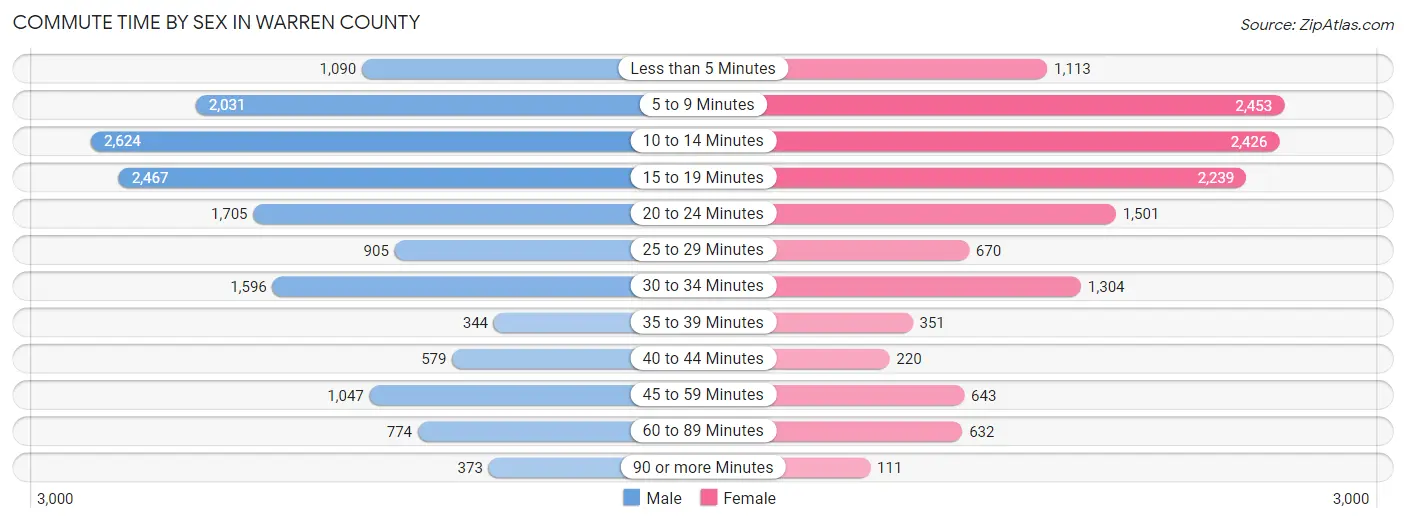
| Commute Time | Male | Female |
| Less than 5 Minutes | 1,090 (7.0%) | 1,113 (8.2%) |
| 5 to 9 Minutes | 2,031 (13.1%) | 2,453 (17.9%) |
| 10 to 14 Minutes | 2,624 (16.9%) | 2,426 (17.8%) |
| 15 to 19 Minutes | 2,467 (15.9%) | 2,239 (16.4%) |
| 20 to 24 Minutes | 1,705 (11.0%) | 1,501 (11.0%) |
| 25 to 29 Minutes | 905 (5.8%) | 670 (4.9%) |
| 30 to 34 Minutes | 1,596 (10.3%) | 1,304 (9.5%) |
| 35 to 39 Minutes | 344 (2.2%) | 351 (2.6%) |
| 40 to 44 Minutes | 579 (3.7%) | 220 (1.6%) |
| 45 to 59 Minutes | 1,047 (6.7%) | 643 (4.7%) |
| 60 to 89 Minutes | 774 (5.0%) | 632 (4.6%) |
| 90 or more Minutes | 373 (2.4%) | 111 (0.8%) |
Time of Departure to Work by Sex in Warren County
The most frequent times of departure to work in Warren County are 7:00 AM to 7:29 AM (1,963, 12.6%) for males and 7:30 AM to 7:59 AM (2,967, 21.7%) for females.
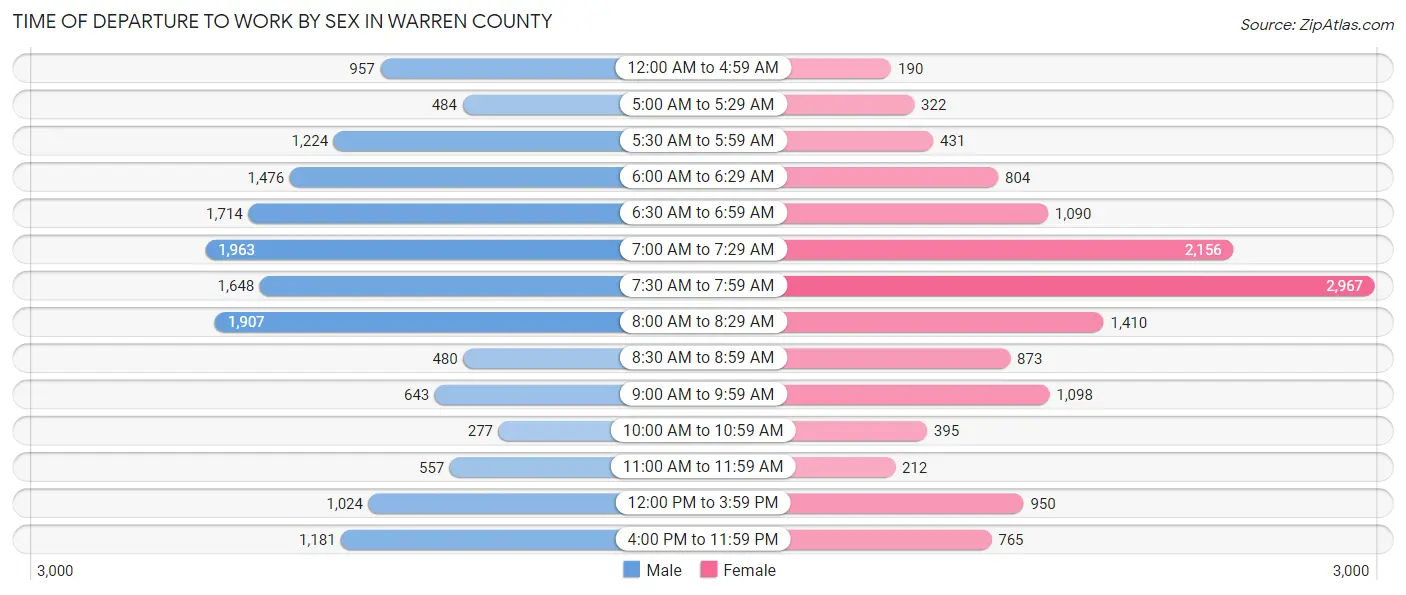
| Time of Departure | Male | Female |
| 12:00 AM to 4:59 AM | 957 (6.2%) | 190 (1.4%) |
| 5:00 AM to 5:29 AM | 484 (3.1%) | 322 (2.4%) |
| 5:30 AM to 5:59 AM | 1,224 (7.9%) | 431 (3.2%) |
| 6:00 AM to 6:29 AM | 1,476 (9.5%) | 804 (5.9%) |
| 6:30 AM to 6:59 AM | 1,714 (11.0%) | 1,090 (8.0%) |
| 7:00 AM to 7:29 AM | 1,963 (12.6%) | 2,156 (15.8%) |
| 7:30 AM to 7:59 AM | 1,648 (10.6%) | 2,967 (21.7%) |
| 8:00 AM to 8:29 AM | 1,907 (12.3%) | 1,410 (10.3%) |
| 8:30 AM to 8:59 AM | 480 (3.1%) | 873 (6.4%) |
| 9:00 AM to 9:59 AM | 643 (4.1%) | 1,098 (8.0%) |
| 10:00 AM to 10:59 AM | 277 (1.8%) | 395 (2.9%) |
| 11:00 AM to 11:59 AM | 557 (3.6%) | 212 (1.5%) |
| 12:00 PM to 3:59 PM | 1,024 (6.6%) | 950 (7.0%) |
| 4:00 PM to 11:59 PM | 1,181 (7.6%) | 765 (5.6%) |
| Total | 15,535 (100.0%) | 13,663 (100.0%) |
Housing Occupancy in Warren County
Occupancy by Ownership in Warren County
Of the total 29,782 dwellings in Warren County, owner-occupied units account for 21,036 (70.6%), while renter-occupied units make up 8,746 (29.4%).
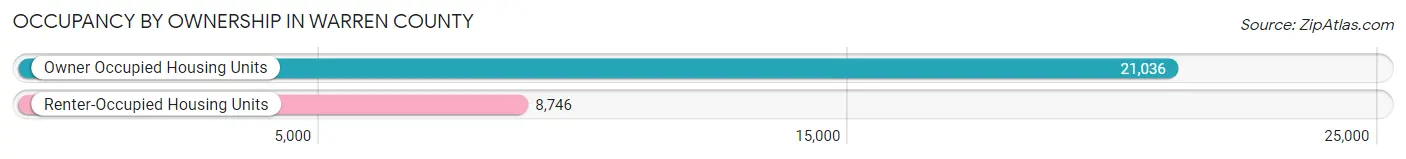
| Occupancy | # Housing Units | % Housing Units |
| Owner Occupied Housing Units | 21,036 | 70.6% |
| Renter-Occupied Housing Units | 8,746 | 29.4% |
| Total Occupied Housing Units | 29,782 | 100.0% |
Occupancy by Household Size in Warren County
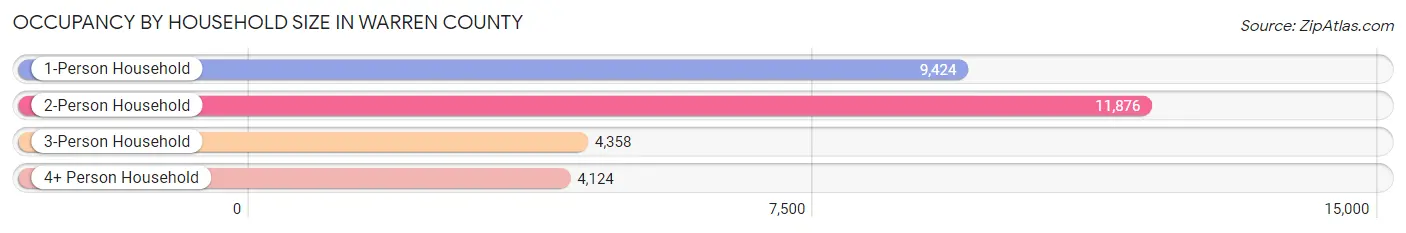
| Household Size | # Housing Units | % Housing Units |
| 1-Person Household | 9,424 | 31.6% |
| 2-Person Household | 11,876 | 39.9% |
| 3-Person Household | 4,358 | 14.6% |
| 4+ Person Household | 4,124 | 13.9% |
| Total Housing Units | 29,782 | 100.0% |
Occupancy by Ownership by Household Size in Warren County
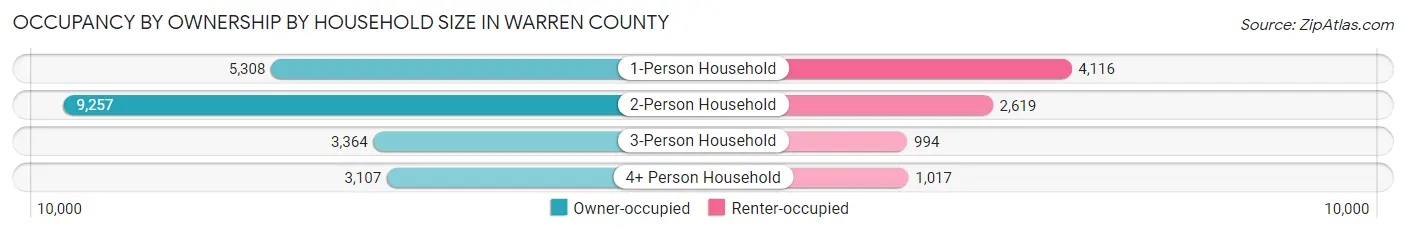
| Household Size | Owner-occupied | Renter-occupied |
| 1-Person Household | 5,308 (56.3%) | 4,116 (43.7%) |
| 2-Person Household | 9,257 (77.9%) | 2,619 (22.1%) |
| 3-Person Household | 3,364 (77.2%) | 994 (22.8%) |
| 4+ Person Household | 3,107 (75.3%) | 1,017 (24.7%) |
| Total Housing Units | 21,036 (70.6%) | 8,746 (29.4%) |
Occupancy by Educational Attainment in Warren County
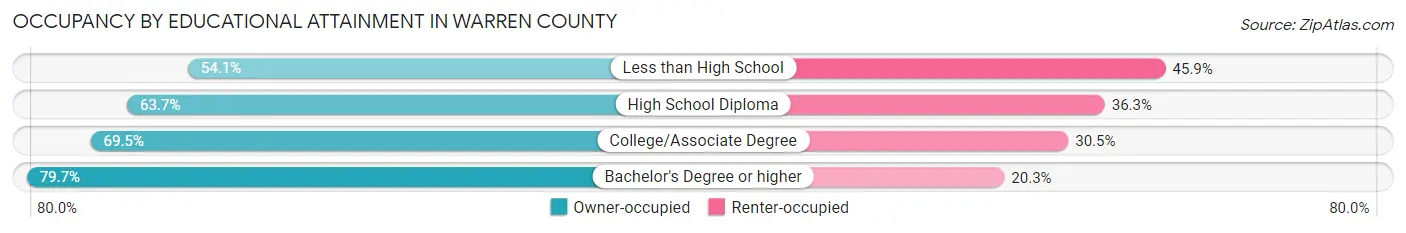
| Household Size | Owner-occupied | Renter-occupied |
| Less than High School | 1,098 (54.1%) | 932 (45.9%) |
| High School Diploma | 4,827 (63.7%) | 2,746 (36.3%) |
| College/Associate Degree | 6,602 (69.5%) | 2,895 (30.5%) |
| Bachelor's Degree or higher | 8,509 (79.7%) | 2,173 (20.3%) |
Occupancy by Age of Householder in Warren County
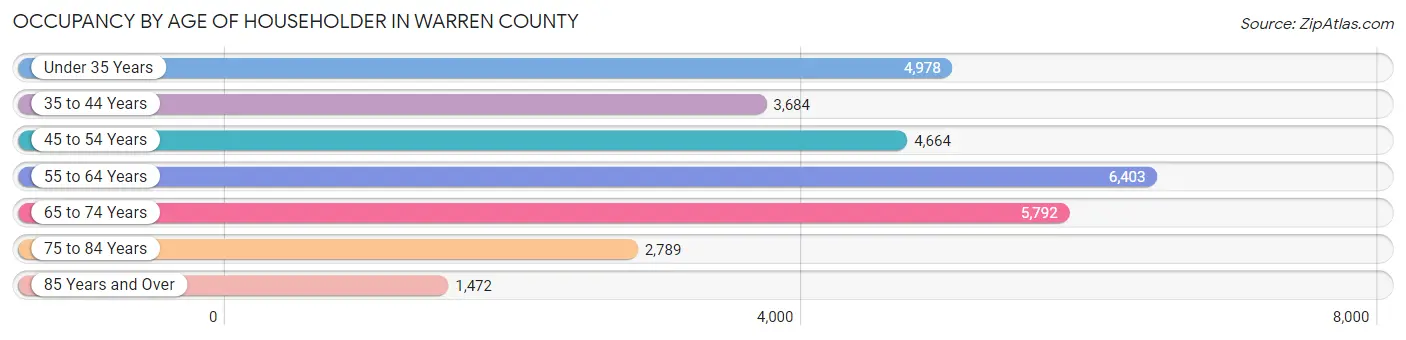
| Age Bracket | # Households | % Households |
| Under 35 Years | 4,978 | 16.7% |
| 35 to 44 Years | 3,684 | 12.4% |
| 45 to 54 Years | 4,664 | 15.7% |
| 55 to 64 Years | 6,403 | 21.5% |
| 65 to 74 Years | 5,792 | 19.5% |
| 75 to 84 Years | 2,789 | 9.4% |
| 85 Years and Over | 1,472 | 4.9% |
| Total | 29,782 | 100.0% |
Housing Finances in Warren County
Median Income by Occupancy in Warren County
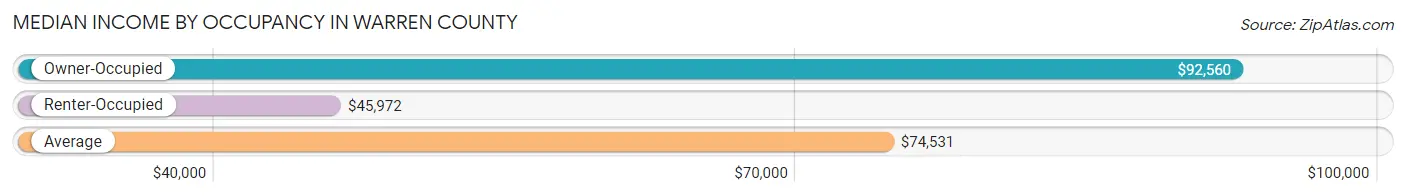
| Occupancy Type | # Households | Median Income |
| Owner-Occupied | 21,036 (70.6%) | $92,560 |
| Renter-Occupied | 8,746 (29.4%) | $45,972 |
| Average | 29,782 (100.0%) | $74,531 |
Occupancy by Householder Income Bracket in Warren County
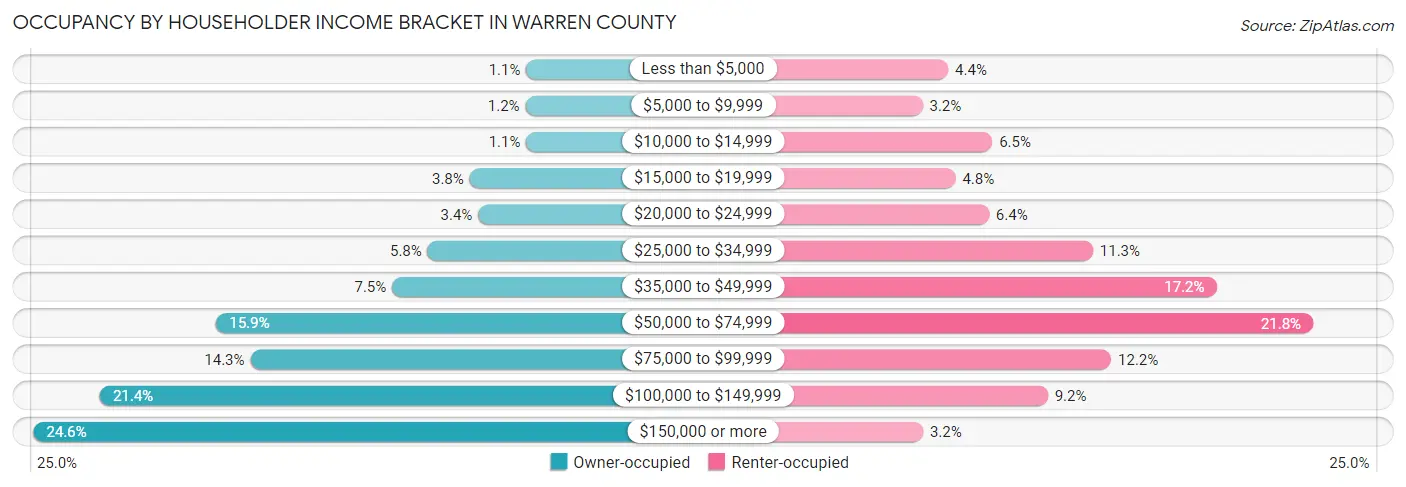
| Income Bracket | Owner-occupied | Renter-occupied |
| Less than $5,000 | 234 (1.1%) | 386 (4.4%) |
| $5,000 to $9,999 | 242 (1.1%) | 279 (3.2%) |
| $10,000 to $14,999 | 233 (1.1%) | 569 (6.5%) |
| $15,000 to $19,999 | 802 (3.8%) | 416 (4.8%) |
| $20,000 to $24,999 | 715 (3.4%) | 555 (6.4%) |
| $25,000 to $34,999 | 1,223 (5.8%) | 988 (11.3%) |
| $35,000 to $49,999 | 1,577 (7.5%) | 1,503 (17.2%) |
| $50,000 to $74,999 | 3,339 (15.9%) | 1,905 (21.8%) |
| $75,000 to $99,999 | 2,997 (14.2%) | 1,064 (12.2%) |
| $100,000 to $149,999 | 4,503 (21.4%) | 800 (9.1%) |
| $150,000 or more | 5,171 (24.6%) | 281 (3.2%) |
| Total | 21,036 (100.0%) | 8,746 (100.0%) |
Monthly Housing Cost Tiers in Warren County
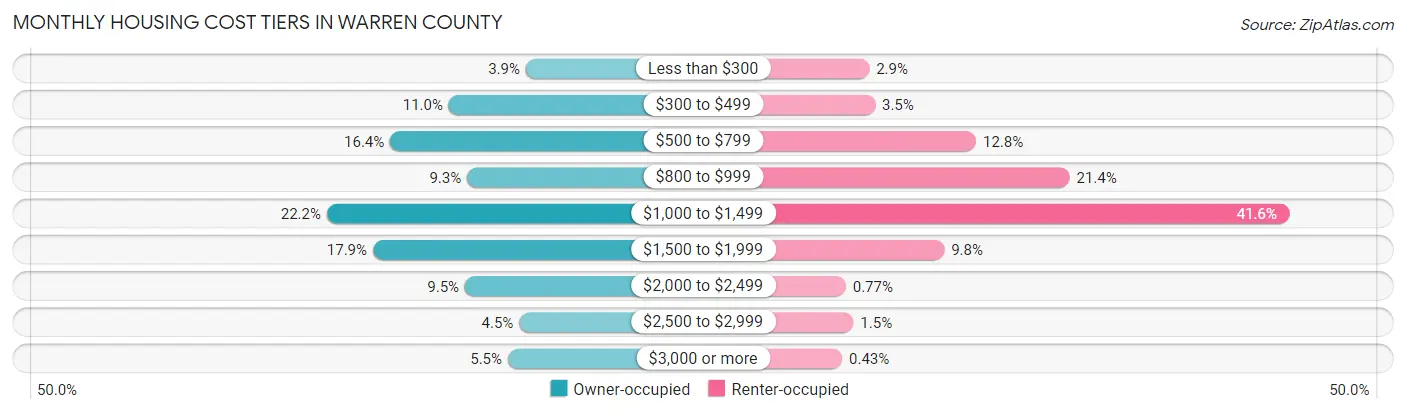
| Monthly Cost | Owner-occupied | Renter-occupied |
| Less than $300 | 813 (3.9%) | 256 (2.9%) |
| $300 to $499 | 2,303 (11.0%) | 303 (3.5%) |
| $500 to $799 | 3,440 (16.4%) | 1,116 (12.8%) |
| $800 to $999 | 1,949 (9.3%) | 1,869 (21.4%) |
| $1,000 to $1,499 | 4,666 (22.2%) | 3,634 (41.5%) |
| $1,500 to $1,999 | 3,774 (17.9%) | 860 (9.8%) |
| $2,000 to $2,499 | 1,990 (9.5%) | 67 (0.8%) |
| $2,500 to $2,999 | 941 (4.5%) | 129 (1.5%) |
| $3,000 or more | 1,160 (5.5%) | 38 (0.4%) |
| Total | 21,036 (100.0%) | 8,746 (100.0%) |
Physical Housing Characteristics in Warren County
Housing Structures in Warren County
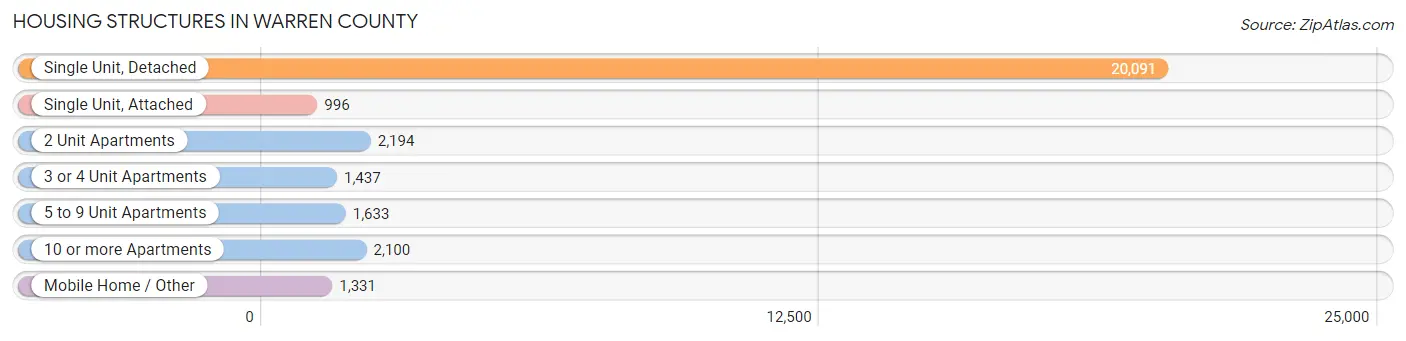
| Structure Type | # Housing Units | % Housing Units |
| Single Unit, Detached | 20,091 | 67.5% |
| Single Unit, Attached | 996 | 3.3% |
| 2 Unit Apartments | 2,194 | 7.4% |
| 3 or 4 Unit Apartments | 1,437 | 4.8% |
| 5 to 9 Unit Apartments | 1,633 | 5.5% |
| 10 or more Apartments | 2,100 | 7.0% |
| Mobile Home / Other | 1,331 | 4.5% |
| Total | 29,782 | 100.0% |
Housing Structures by Occupancy in Warren County
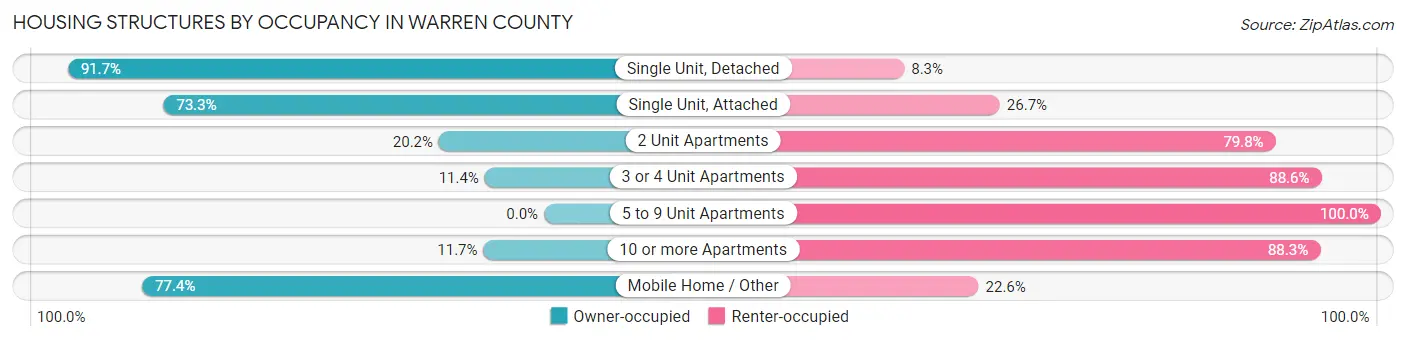
| Structure Type | Owner-occupied | Renter-occupied |
| Single Unit, Detached | 18,423 (91.7%) | 1,668 (8.3%) |
| Single Unit, Attached | 730 (73.3%) | 266 (26.7%) |
| 2 Unit Apartments | 444 (20.2%) | 1,750 (79.8%) |
| 3 or 4 Unit Apartments | 164 (11.4%) | 1,273 (88.6%) |
| 5 to 9 Unit Apartments | 0 (0.0%) | 1,633 (100.0%) |
| 10 or more Apartments | 245 (11.7%) | 1,855 (88.3%) |
| Mobile Home / Other | 1,030 (77.4%) | 301 (22.6%) |
| Total | 21,036 (70.6%) | 8,746 (29.4%) |
Housing Structures by Number of Rooms in Warren County
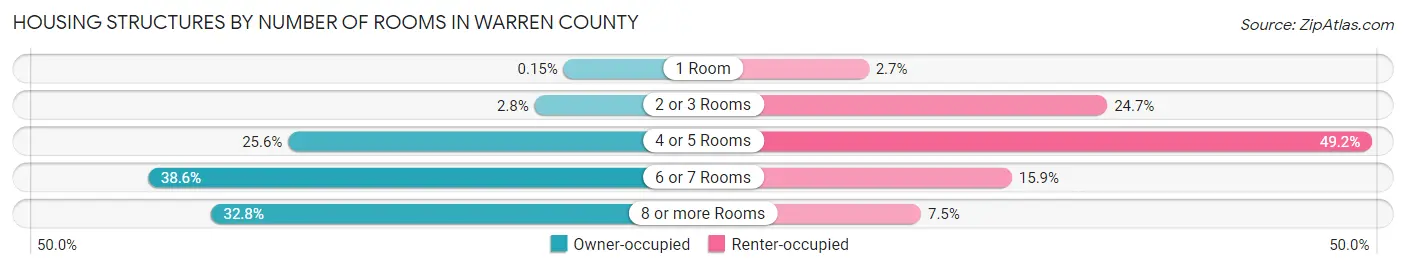
| Number of Rooms | Owner-occupied | Renter-occupied |
| 1 Room | 31 (0.2%) | 233 (2.7%) |
| 2 or 3 Rooms | 596 (2.8%) | 2,162 (24.7%) |
| 4 or 5 Rooms | 5,390 (25.6%) | 4,304 (49.2%) |
| 6 or 7 Rooms | 8,119 (38.6%) | 1,391 (15.9%) |
| 8 or more Rooms | 6,900 (32.8%) | 656 (7.5%) |
| Total | 21,036 (100.0%) | 8,746 (100.0%) |
Housing Structure by Heating Type in Warren County
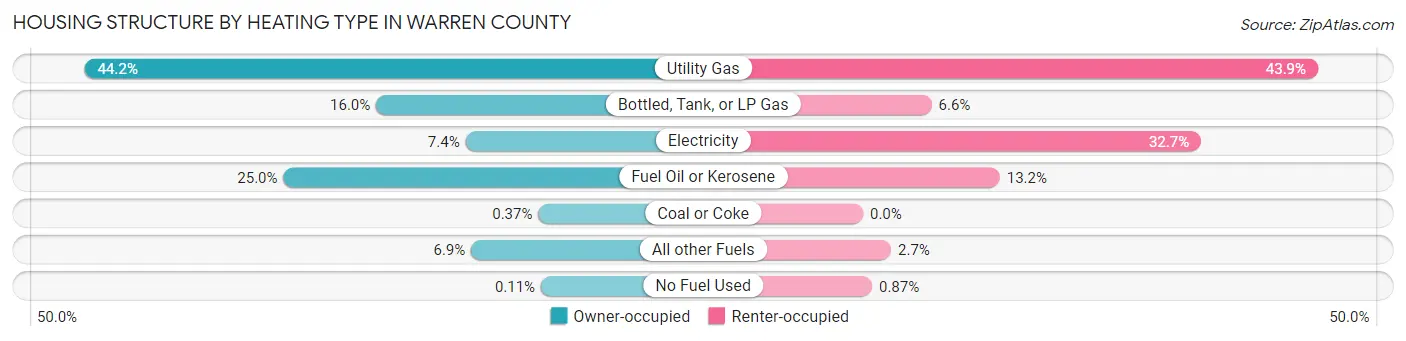
| Heating Type | Owner-occupied | Renter-occupied |
| Utility Gas | 9,300 (44.2%) | 3,843 (43.9%) |
| Bottled, Tank, or LP Gas | 3,375 (16.0%) | 579 (6.6%) |
| Electricity | 1,556 (7.4%) | 2,856 (32.7%) |
| Fuel Oil or Kerosene | 5,260 (25.0%) | 1,155 (13.2%) |
| Coal or Coke | 77 (0.4%) | 0 (0.0%) |
| All other Fuels | 1,444 (6.9%) | 237 (2.7%) |
| No Fuel Used | 24 (0.1%) | 76 (0.9%) |
| Total | 21,036 (100.0%) | 8,746 (100.0%) |
Household Vehicle Usage in Warren County
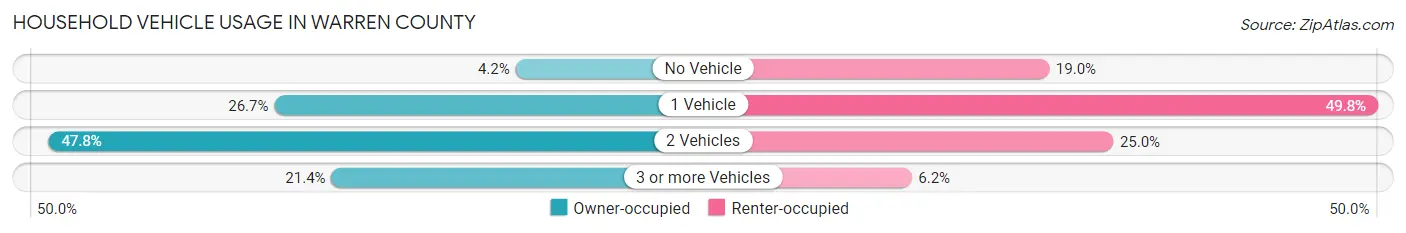
| Vehicles per Household | Owner-occupied | Renter-occupied |
| No Vehicle | 878 (4.2%) | 1,665 (19.0%) |
| 1 Vehicle | 5,615 (26.7%) | 4,351 (49.7%) |
| 2 Vehicles | 10,049 (47.8%) | 2,188 (25.0%) |
| 3 or more Vehicles | 4,494 (21.4%) | 542 (6.2%) |
| Total | 21,036 (100.0%) | 8,746 (100.0%) |
Real Estate & Mortgages in Warren County
Real Estate and Mortgage Overview in Warren County
| Characteristic | Without Mortgage | With Mortgage |
| Housing Units | 8,566 | 12,470 |
| Median Property Value | $239,000 | $241,400 |
| Median Household Income | $64,468 | $3,675 |
| Monthly Housing Costs | $612 | $1,117 |
| Real Estate Taxes | $3,439 | $459 |
Property Value by Mortgage Status in Warren County
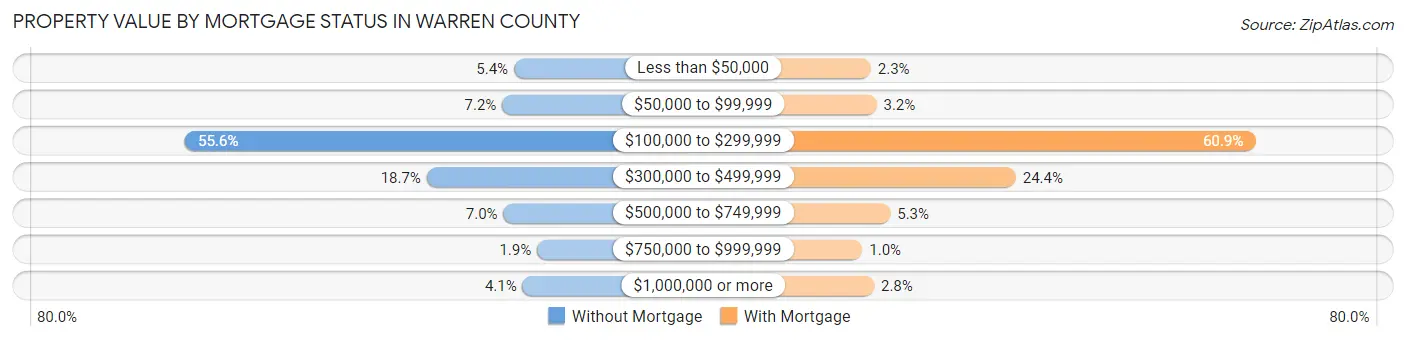
| Property Value | Without Mortgage | With Mortgage |
| Less than $50,000 | 465 (5.4%) | 290 (2.3%) |
| $50,000 to $99,999 | 619 (7.2%) | 399 (3.2%) |
| $100,000 to $299,999 | 4,758 (55.5%) | 7,594 (60.9%) |
| $300,000 to $499,999 | 1,604 (18.7%) | 3,045 (24.4%) |
| $500,000 to $749,999 | 603 (7.0%) | 660 (5.3%) |
| $750,000 to $999,999 | 164 (1.9%) | 130 (1.0%) |
| $1,000,000 or more | 353 (4.1%) | 352 (2.8%) |
| Total | 8,566 (100.0%) | 12,470 (100.0%) |
Household Income by Mortgage Status in Warren County
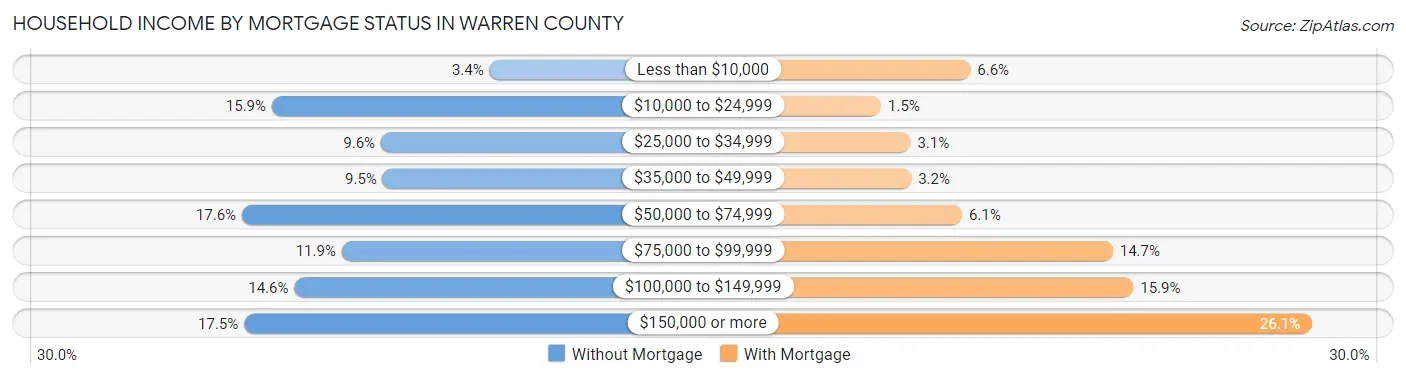
| Household Income | Without Mortgage | With Mortgage |
| Less than $10,000 | 294 (3.4%) | 818 (6.6%) |
| $10,000 to $24,999 | 1,359 (15.9%) | 182 (1.5%) |
| $25,000 to $34,999 | 826 (9.6%) | 391 (3.1%) |
| $35,000 to $49,999 | 817 (9.5%) | 397 (3.2%) |
| $50,000 to $74,999 | 1,506 (17.6%) | 760 (6.1%) |
| $75,000 to $99,999 | 1,018 (11.9%) | 1,833 (14.7%) |
| $100,000 to $149,999 | 1,250 (14.6%) | 1,979 (15.9%) |
| $150,000 or more | 1,496 (17.5%) | 3,253 (26.1%) |
| Total | 8,566 (100.0%) | 12,470 (100.0%) |
Property Value to Household Income Ratio in Warren County
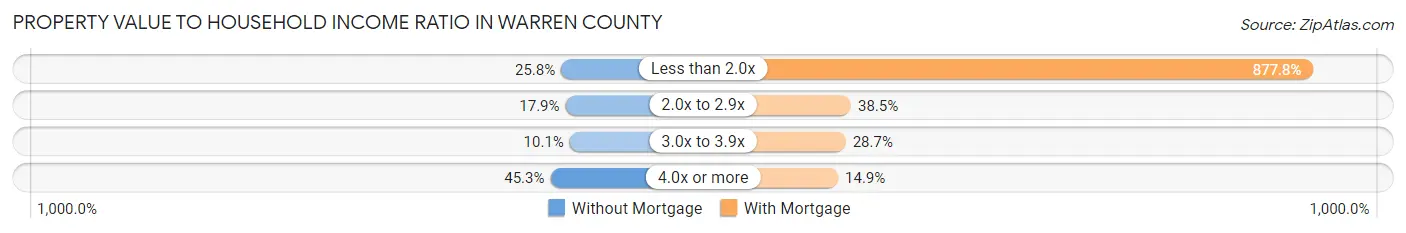
| Value-to-Income Ratio | Without Mortgage | With Mortgage |
| Less than 2.0x | 2,212 (25.8%) | 109,459 (877.8%) |
| 2.0x to 2.9x | 1,533 (17.9%) | 4,795 (38.5%) |
| 3.0x to 3.9x | 864 (10.1%) | 3,579 (28.7%) |
| 4.0x or more | 3,880 (45.3%) | 1,862 (14.9%) |
| Total | 8,566 (100.0%) | 12,470 (100.0%) |
Real Estate Taxes by Mortgage Status in Warren County
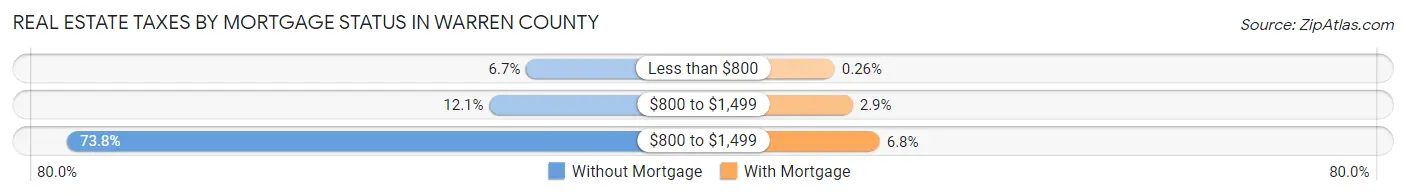
| Property Taxes | Without Mortgage | With Mortgage |
| Less than $800 | 574 (6.7%) | 32 (0.3%) |
| $800 to $1,499 | 1,036 (12.1%) | 359 (2.9%) |
| $800 to $1,499 | 6,321 (73.8%) | 852 (6.8%) |
| Total | 8,566 (100.0%) | 12,470 (100.0%) |
Health & Disability in Warren County
Health Insurance Coverage by Age in Warren County
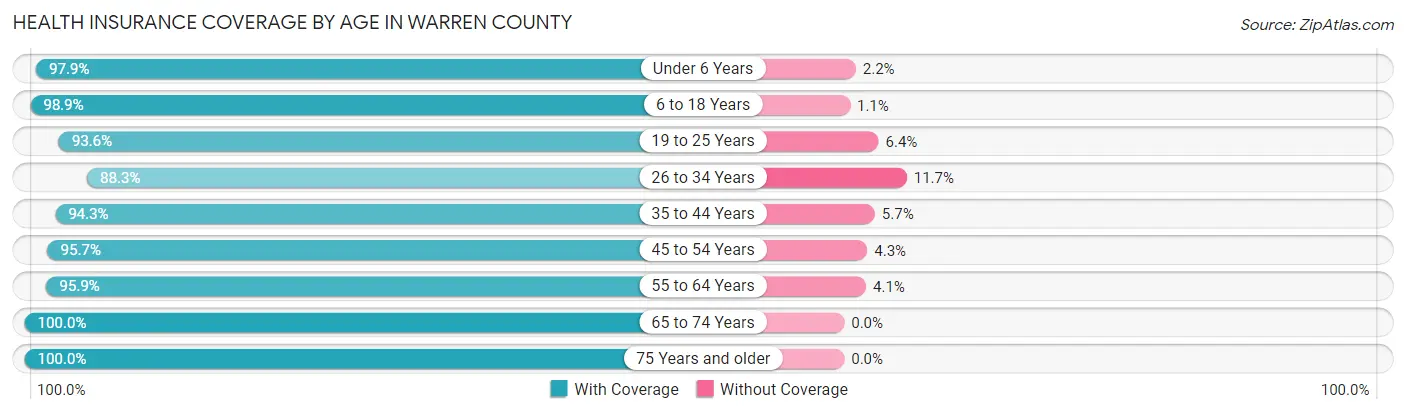
| Age Bracket | With Coverage | Without Coverage |
| Under 6 Years | 3,372 (97.9%) | 74 (2.1%) |
| 6 to 18 Years | 8,673 (98.9%) | 94 (1.1%) |
| 19 to 25 Years | 4,674 (93.6%) | 319 (6.4%) |
| 26 to 34 Years | 5,987 (88.3%) | 790 (11.7%) |
| 35 to 44 Years | 6,838 (94.3%) | 414 (5.7%) |
| 45 to 54 Years | 7,939 (95.7%) | 357 (4.3%) |
| 55 to 64 Years | 10,194 (95.9%) | 433 (4.1%) |
| 65 to 74 Years | 9,008 (100.0%) | 0 (0.0%) |
| 75 Years and older | 5,820 (100.0%) | 0 (0.0%) |
| Total | 62,505 (96.2%) | 2,481 (3.8%) |
Health Insurance Coverage by Citizenship Status in Warren County
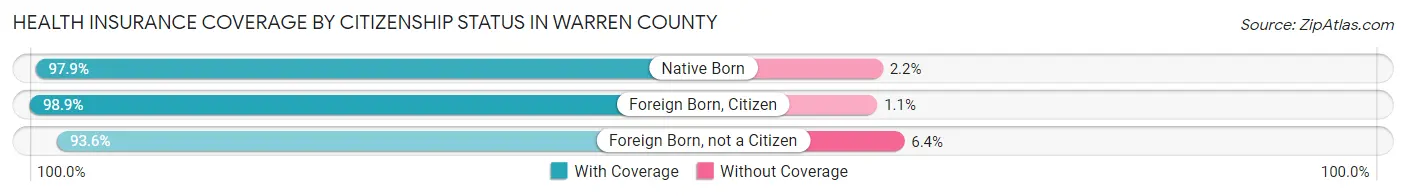
| Citizenship Status | With Coverage | Without Coverage |
| Native Born | 3,372 (97.9%) | 74 (2.1%) |
| Foreign Born, Citizen | 8,673 (98.9%) | 94 (1.1%) |
| Foreign Born, not a Citizen | 4,674 (93.6%) | 319 (6.4%) |
Health Insurance Coverage by Household Income in Warren County
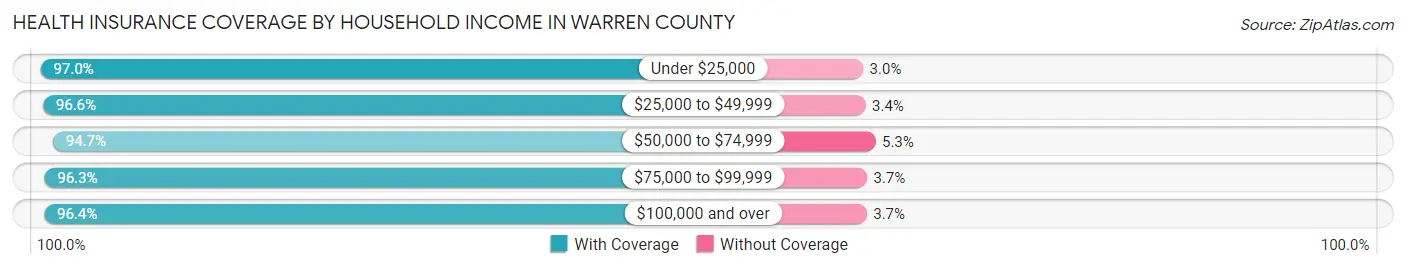
| Household Income | With Coverage | Without Coverage |
| Under $25,000 | 6,144 (97.0%) | 188 (3.0%) |
| $25,000 to $49,999 | 8,945 (96.6%) | 318 (3.4%) |
| $50,000 to $74,999 | 9,900 (94.7%) | 553 (5.3%) |
| $75,000 to $99,999 | 9,016 (96.3%) | 346 (3.7%) |
| $100,000 and over | 28,007 (96.4%) | 1,061 (3.6%) |
Public vs Private Health Insurance Coverage by Age in Warren County
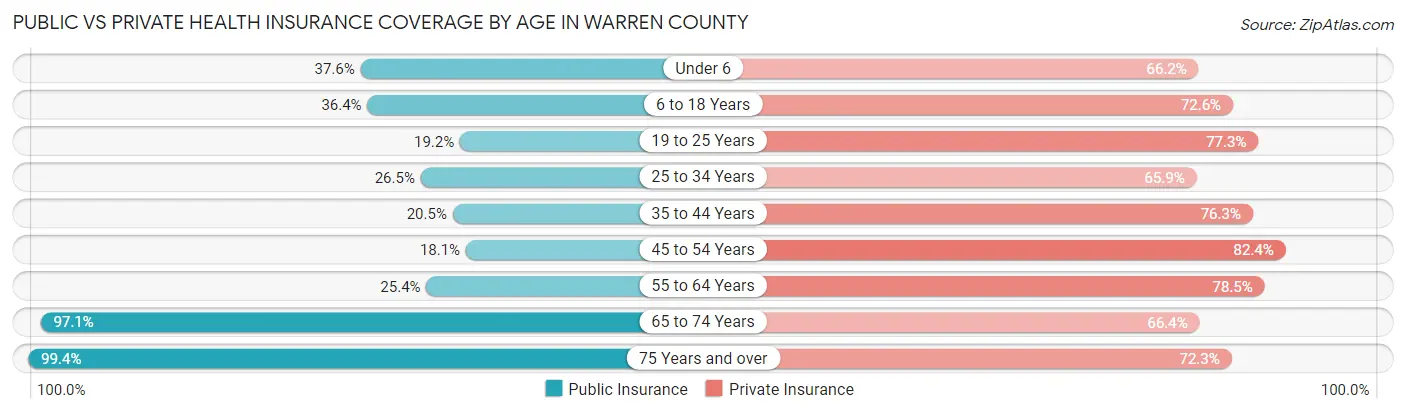
| Age Bracket | Public Insurance | Private Insurance |
| Under 6 | 1,297 (37.6%) | 2,282 (66.2%) |
| 6 to 18 Years | 3,188 (36.4%) | 6,365 (72.6%) |
| 19 to 25 Years | 957 (19.2%) | 3,859 (77.3%) |
| 25 to 34 Years | 1,794 (26.5%) | 4,463 (65.9%) |
| 35 to 44 Years | 1,489 (20.5%) | 5,531 (76.3%) |
| 45 to 54 Years | 1,500 (18.1%) | 6,834 (82.4%) |
| 55 to 64 Years | 2,701 (25.4%) | 8,340 (78.5%) |
| 65 to 74 Years | 8,742 (97.1%) | 5,980 (66.4%) |
| 75 Years and over | 5,782 (99.4%) | 4,210 (72.3%) |
| Total | 27,450 (42.2%) | 47,864 (73.7%) |
Disability Status by Sex by Age in Warren County
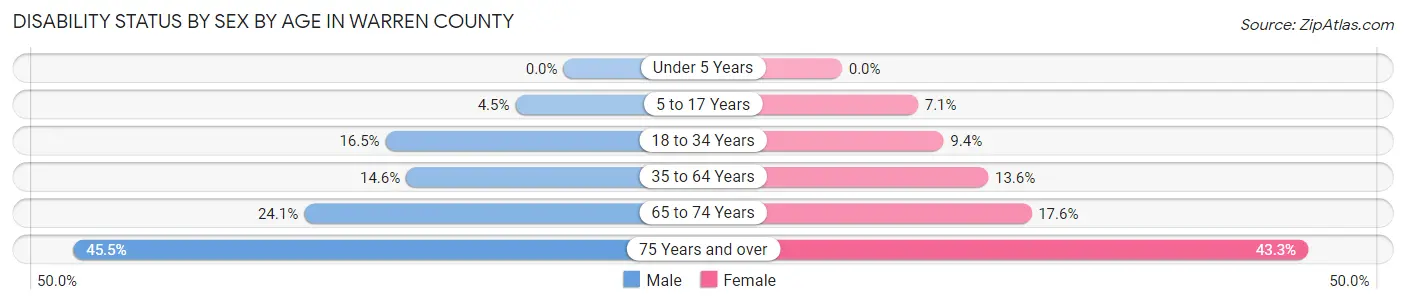
| Age Bracket | Male | Female |
| Under 5 Years | 0 (0.0%) | 0 (0.0%) |
| 5 to 17 Years | 204 (4.5%) | 301 (7.0%) |
| 18 to 34 Years | 1,038 (16.5%) | 572 (9.4%) |
| 35 to 64 Years | 1,890 (14.6%) | 1,795 (13.6%) |
| 65 to 74 Years | 1,081 (24.1%) | 794 (17.6%) |
| 75 Years and over | 1,156 (45.5%) | 1,418 (43.3%) |
Disability Class by Sex by Age in Warren County
Disability Class: Hearing Difficulty
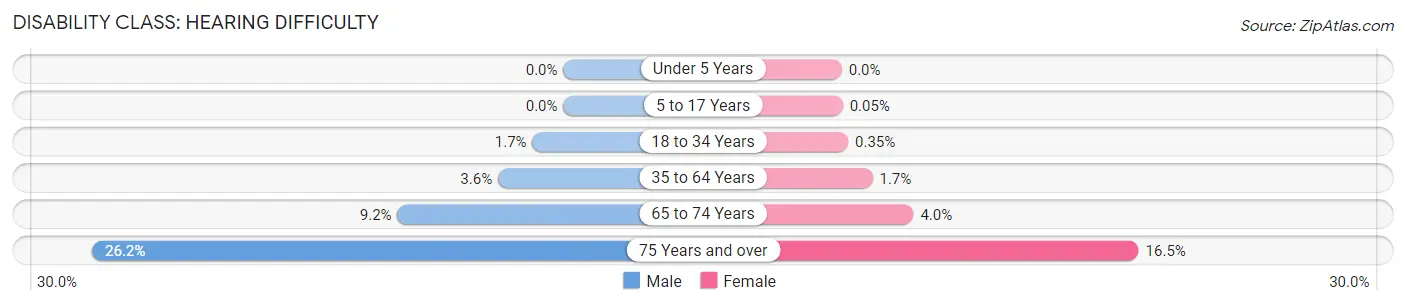
| Age Bracket | Male | Female |
| Under 5 Years | 0 (0.0%) | 0 (0.0%) |
| 5 to 17 Years | 0 (0.0%) | 2 (0.1%) |
| 18 to 34 Years | 108 (1.7%) | 21 (0.4%) |
| 35 to 64 Years | 471 (3.6%) | 226 (1.7%) |
| 65 to 74 Years | 415 (9.2%) | 180 (4.0%) |
| 75 Years and over | 667 (26.2%) | 542 (16.5%) |
Disability Class: Vision Difficulty
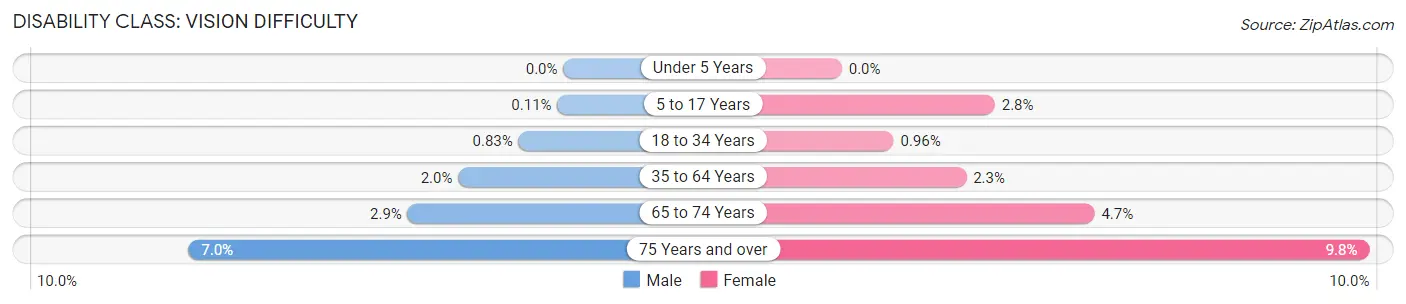
| Age Bracket | Male | Female |
| Under 5 Years | 0 (0.0%) | 0 (0.0%) |
| 5 to 17 Years | 5 (0.1%) | 121 (2.8%) |
| 18 to 34 Years | 52 (0.8%) | 58 (1.0%) |
| 35 to 64 Years | 252 (1.9%) | 305 (2.3%) |
| 65 to 74 Years | 130 (2.9%) | 212 (4.7%) |
| 75 Years and over | 177 (7.0%) | 321 (9.8%) |
Disability Class: Cognitive Difficulty
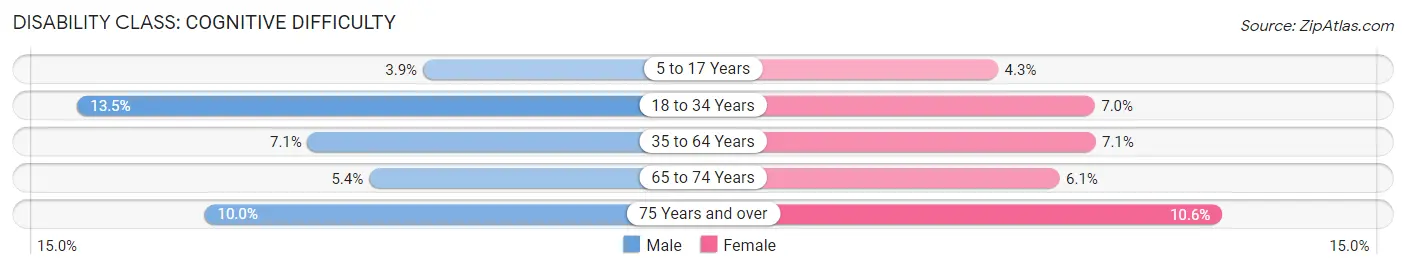
| Age Bracket | Male | Female |
| 5 to 17 Years | 179 (3.9%) | 185 (4.3%) |
| 18 to 34 Years | 851 (13.5%) | 426 (7.0%) |
| 35 to 64 Years | 922 (7.1%) | 933 (7.0%) |
| 65 to 74 Years | 243 (5.4%) | 273 (6.0%) |
| 75 Years and over | 254 (10.0%) | 347 (10.6%) |
Disability Class: Ambulatory Difficulty
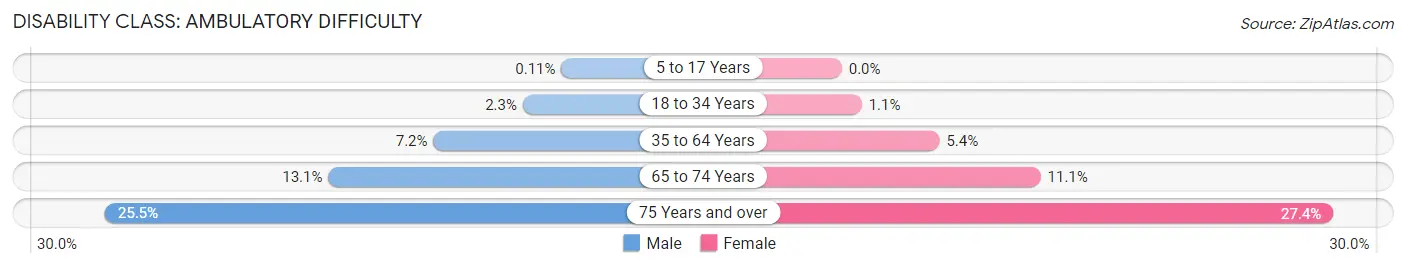
| Age Bracket | Male | Female |
| 5 to 17 Years | 5 (0.1%) | 0 (0.0%) |
| 18 to 34 Years | 142 (2.3%) | 67 (1.1%) |
| 35 to 64 Years | 937 (7.2%) | 719 (5.4%) |
| 65 to 74 Years | 588 (13.1%) | 500 (11.1%) |
| 75 Years and over | 649 (25.5%) | 897 (27.4%) |
Disability Class: Self-Care Difficulty
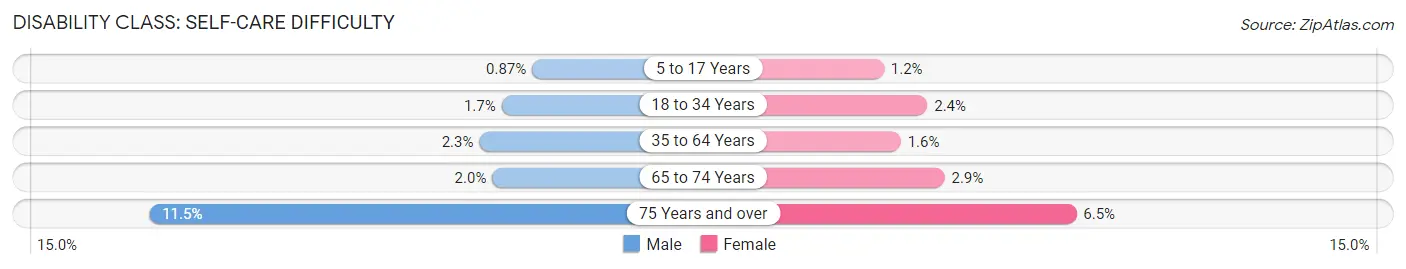
| Age Bracket | Male | Female |
| 5 to 17 Years | 40 (0.9%) | 50 (1.2%) |
| 18 to 34 Years | 108 (1.7%) | 144 (2.4%) |
| 35 to 64 Years | 303 (2.3%) | 217 (1.6%) |
| 65 to 74 Years | 89 (2.0%) | 129 (2.9%) |
| 75 Years and over | 293 (11.5%) | 214 (6.5%) |
Technology Access in Warren County
Computing Device Access in Warren County
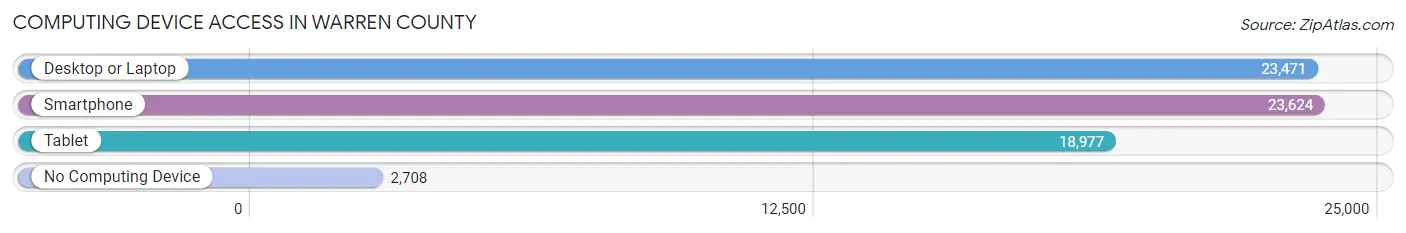
| Device Type | # Households | % Households |
| Desktop or Laptop | 23,471 | 78.8% |
| Smartphone | 23,624 | 79.3% |
| Tablet | 18,977 | 63.7% |
| No Computing Device | 2,708 | 9.1% |
| Total | 29,782 | 100.0% |
Internet Access in Warren County
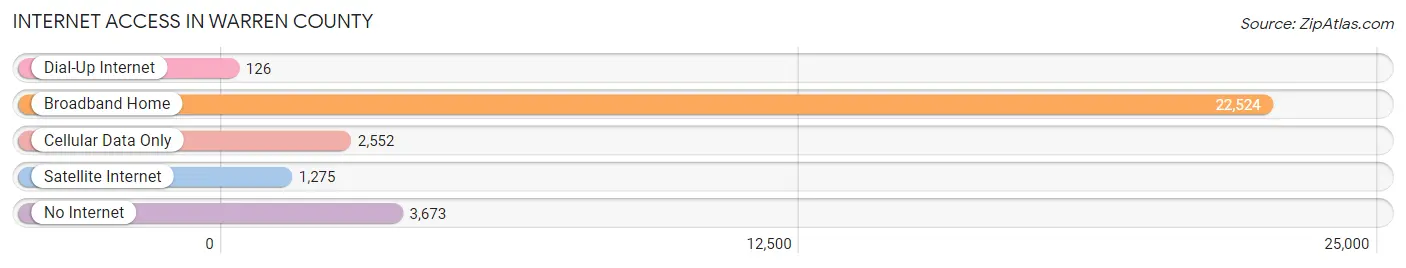
| Internet Type | # Households | % Households |
| Dial-Up Internet | 126 | 0.4% |
| Broadband Home | 22,524 | 75.6% |
| Cellular Data Only | 2,552 | 8.6% |
| Satellite Internet | 1,275 | 4.3% |
| No Internet | 3,673 | 12.3% |
| Total | 29,782 | 100.0% |
Warren County Summary
Warren County is located in the Adirondack region of New York State, and is bordered by the counties of Washington, Saratoga, Hamilton, Essex, and Clinton. The county seat is located in the city of Lake George. The county was established in 1813 and is named after General Joseph Warren, a hero of the Revolutionary War.
Geography
Warren County covers an area of 1,821 square miles and is the largest county in the Adirondack region. The terrain is mostly mountainous, with the highest point being Crane Mountain at an elevation of 3,890 feet. The county is home to numerous lakes, rivers, and streams, including Lake George, the Schroon River, and the Hudson River. The county is also home to several state parks, including Lake George Battlefield Park, Moreau Lake State Park, and the Adirondack State Park.
Demographics
As of the 2010 census, Warren County had a population of 65,707. The population is spread out with a median age of 43.7 years. The racial makeup of the county is 94.2% White, 1.7% African American, 0.5% Native American, 1.2% Asian, 0.1% Pacific Islander, 1.2% from other races, and 1.1% from two or more races. Hispanic or Latino of any race were 3.3% of the population.
Economy
The economy of Warren County is largely based on tourism, with the county being home to numerous resorts, hotels, and attractions. The county is also home to several manufacturing companies, including Glens Falls National Bank, Glens Falls Insurance, and Glens Falls Manufacturing. Agriculture is also an important part of the economy, with dairy farming being the primary agricultural activity.
History
The area that is now Warren County was originally inhabited by the Mohawk and Iroquois Native American tribes. The first European settlers arrived in the area in the late 17th century, and the county was officially established in 1813. During the 19th century, the county was an important center for the lumber industry, and the county seat of Lake George was a popular tourist destination. In the 20th century, the county continued to be a popular tourist destination, and the economy shifted to focus more on tourism and manufacturing.
Today, Warren County is a popular tourist destination, with numerous resorts, hotels, and attractions. The county is also home to several state parks, and is a popular destination for outdoor recreation. The county is also home to several manufacturing companies, and agriculture is still an important part of the economy.
Common Questions
What is Per Capita Income in Warren County?
Per Capita income in Warren County is $44,183.
What is the Median Family Income in Warren County?
Median Family Income in Warren County is $97,947.
What is the Median Household income in Warren County?
Median Household Income in Warren County is $74,531.
What is Income or Wage Gap in Warren County?
Income or Wage Gap in Warren County is 21.8%.
Women in Warren County earn 78.2 cents for every dollar earned by a man.
What is Family Income Deficit in Warren County?
Family Income Deficit in Warren County is $8,673.
Families that are below poverty line in Warren County earn $8,673 less on average than the poverty threshold level.
What is Inequality or Gini Index in Warren County?
Inequality or Gini Index in Warren County is 0.44.
What is the Total Population of Warren County?
Total Population of Warren County is 65,684.
What is the Total Male Population of Warren County?
Total Male Population of Warren County is 32,658.
What is the Total Female Population of Warren County?
Total Female Population of Warren County is 33,026.
What is the Ratio of Males per 100 Females in Warren County?
There are 98.89 Males per 100 Females in Warren County.
What is the Ratio of Females per 100 Males in Warren County?
There are 101.13 Females per 100 Males in Warren County.
What is the Median Population Age in Warren County?
Median Population Age in Warren County is 46.7 Years.
What is the Average Family Size in Warren County
Average Family Size in Warren County is 2.7 People.
What is the Average Household Size in Warren County
Average Household Size in Warren County is 2.2 People.
How Large is the Labor Force in Warren County?
There are 33,437 People in the Labor Forcein in Warren County.
What is the Percentage of People in the Labor Force in Warren County?
60.1% of People are in the Labor Force in Warren County.
What is the Unemployment Rate in Warren County?
Unemployment Rate in Warren County is 4.2%.