Tompkins County, NY Map & Demographics
Tompkins County Map
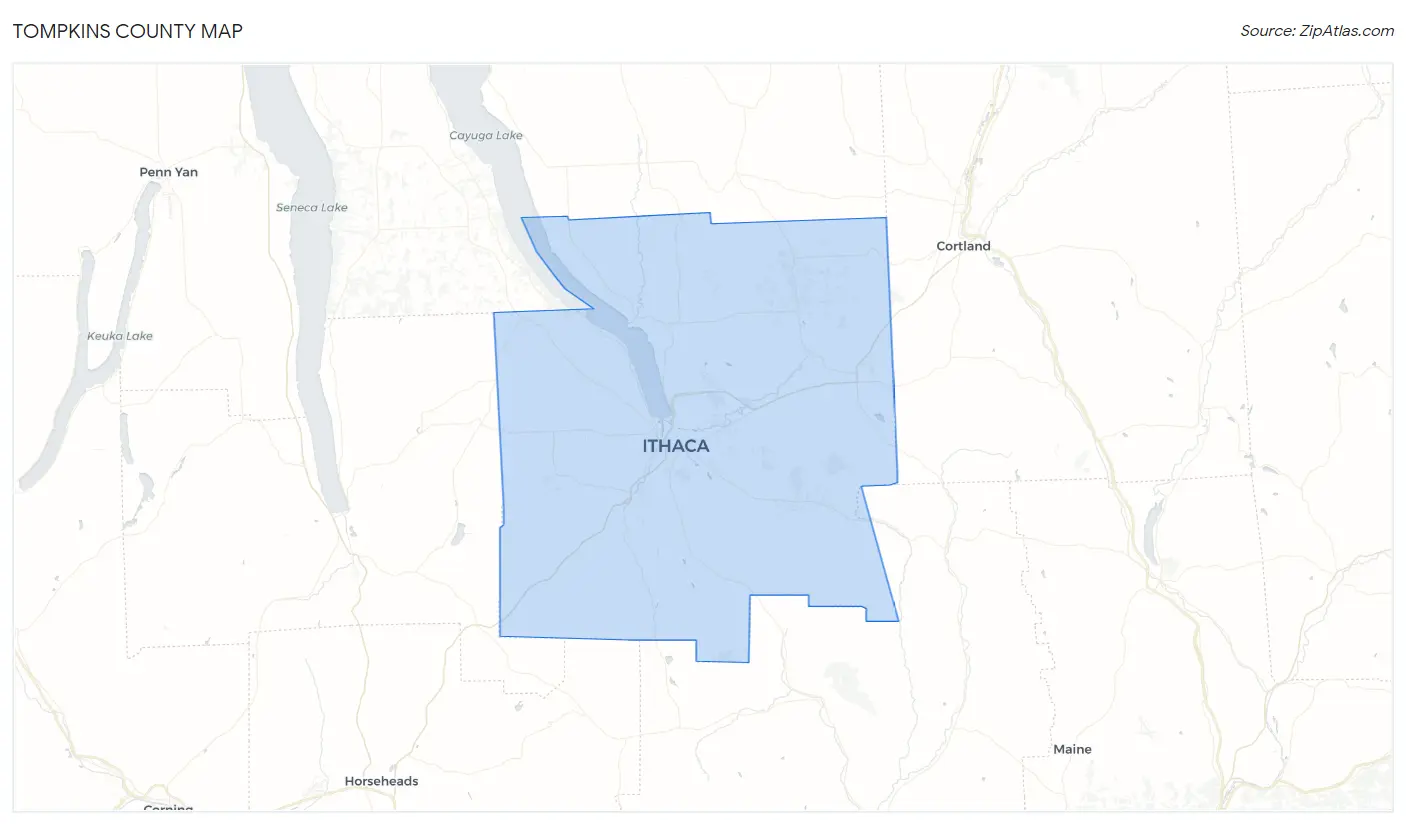
Tompkins County Overview
$40,781
PER CAPITA INCOME
$106,005
AVG FAMILY INCOME
$69,995
AVG HOUSEHOLD INCOME
17.8%
WAGE / INCOME GAP [ % ]
82.2¢/ $1
WAGE / INCOME GAP [ $ ]
$12,625
FAMILY INCOME DEFICIT
0.49
INEQUALITY / GINI INDEX
102,555
TOTAL POPULATION
50,314
MALE POPULATION
52,241
FEMALE POPULATION
96.31
MALES / 100 FEMALES
103.83
FEMALES / 100 MALES
32.6
MEDIAN AGE
2.6
AVG FAMILY SIZE
2.1
AVG HOUSEHOLD SIZE
51,883
LABOR FORCE [ PEOPLE ]
58.1%
PERCENT IN LABOR FORCE
4.7%
UNEMPLOYMENT RATE
Tompkins County Area Codes
Income in Tompkins County
Income Overview in Tompkins County
Per Capita Income in Tompkins County is $40,781, while median incomes of families and households are $106,005 and $69,995 respectively.
| Characteristic | Number | Measure |
| Per Capita Income | 102,555 | $40,781 |
| Median Family Income | 21,506 | $106,005 |
| Mean Family Income | 21,506 | $134,910 |
| Median Household Income | 42,984 | $69,995 |
| Mean Household Income | 42,984 | $98,898 |
| Income Deficit | 21,506 | $12,625 |
| Wage / Income Gap (%) | 102,555 | 17.81% |
| Wage / Income Gap ($) | 102,555 | 82.19¢ per $1 |
| Gini / Inequality Index | 102,555 | 0.49 |
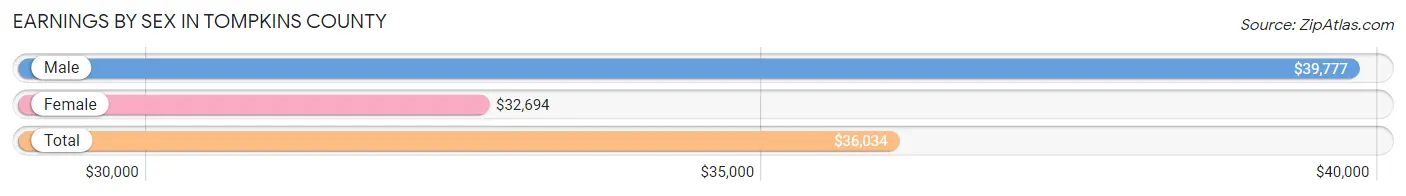
Earnings by Sex in Tompkins County
Average Earnings in Tompkins County are $36,034, $39,777 for men and $32,694 for women, a difference of 17.8%.
| Sex | Number | Average Earnings |
| Male | 29,795 (50.6%) | $39,777 |
| Female | 29,050 (49.4%) | $32,694 |
| Total | 58,845 (100.0%) | $36,034 |
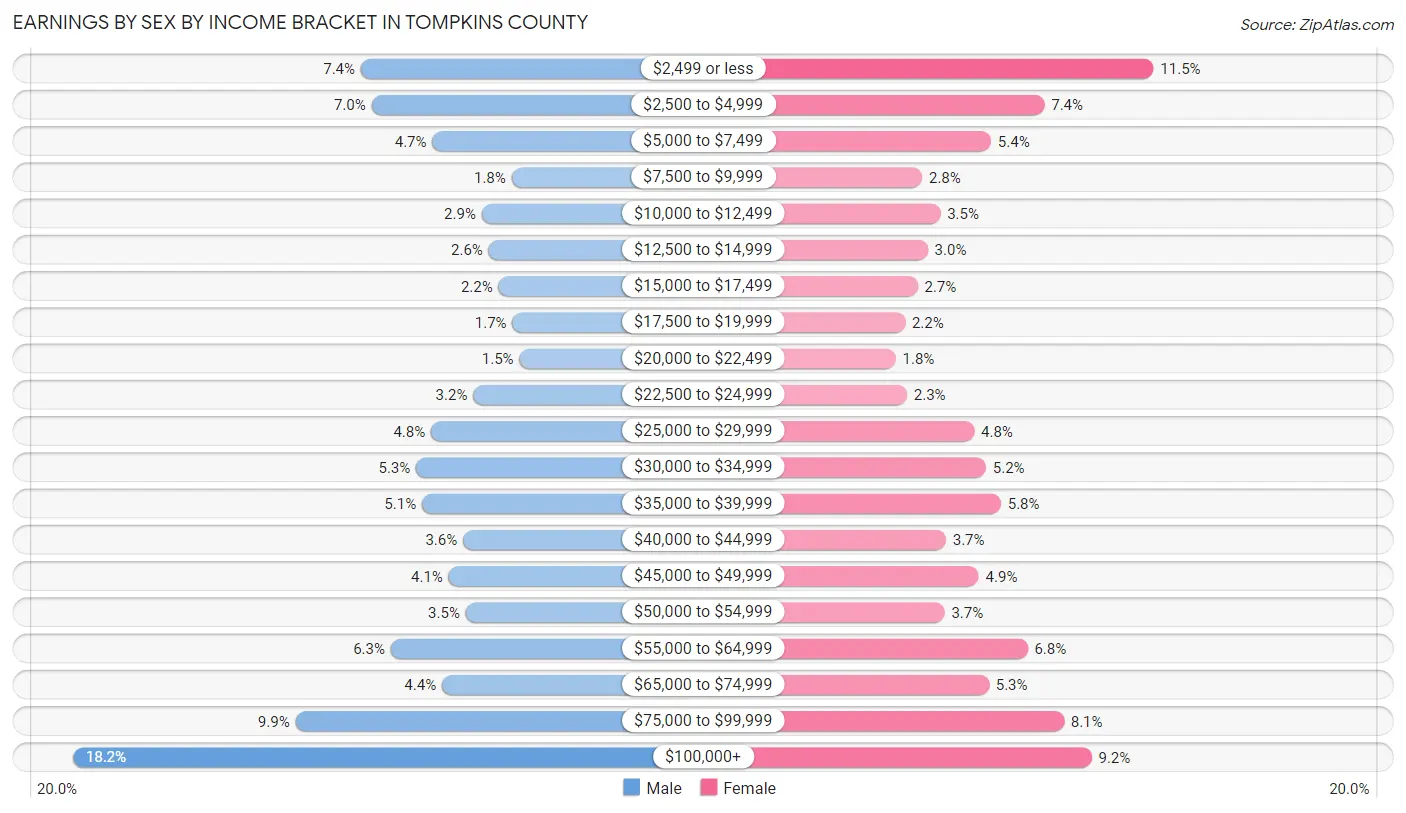
Earnings by Sex by Income Bracket in Tompkins County
The most common earnings brackets in Tompkins County are $100,000+ for men (5,421 | 18.2%) and $2,499 or less for women (3,338 | 11.5%).
| Income | Male | Female |
| $2,499 or less | 2,205 (7.4%) | 3,338 (11.5%) |
| $2,500 to $4,999 | 2,087 (7.0%) | 2,150 (7.4%) |
| $5,000 to $7,499 | 1,407 (4.7%) | 1,569 (5.4%) |
| $7,500 to $9,999 | 521 (1.8%) | 818 (2.8%) |
| $10,000 to $12,499 | 854 (2.9%) | 1,017 (3.5%) |
| $12,500 to $14,999 | 777 (2.6%) | 881 (3.0%) |
| $15,000 to $17,499 | 668 (2.2%) | 770 (2.6%) |
| $17,500 to $19,999 | 513 (1.7%) | 632 (2.2%) |
| $20,000 to $22,499 | 434 (1.5%) | 531 (1.8%) |
| $22,500 to $24,999 | 950 (3.2%) | 654 (2.2%) |
| $25,000 to $29,999 | 1,422 (4.8%) | 1,387 (4.8%) |
| $30,000 to $34,999 | 1,587 (5.3%) | 1,513 (5.2%) |
| $35,000 to $39,999 | 1,523 (5.1%) | 1,675 (5.8%) |
| $40,000 to $44,999 | 1,063 (3.6%) | 1,079 (3.7%) |
| $45,000 to $49,999 | 1,226 (4.1%) | 1,434 (4.9%) |
| $50,000 to $54,999 | 1,034 (3.5%) | 1,063 (3.7%) |
| $55,000 to $64,999 | 1,870 (6.3%) | 1,967 (6.8%) |
| $65,000 to $74,999 | 1,298 (4.4%) | 1,546 (5.3%) |
| $75,000 to $99,999 | 2,935 (9.9%) | 2,362 (8.1%) |
| $100,000+ | 5,421 (18.2%) | 2,664 (9.2%) |
| Total | 29,795 (100.0%) | 29,050 (100.0%) |
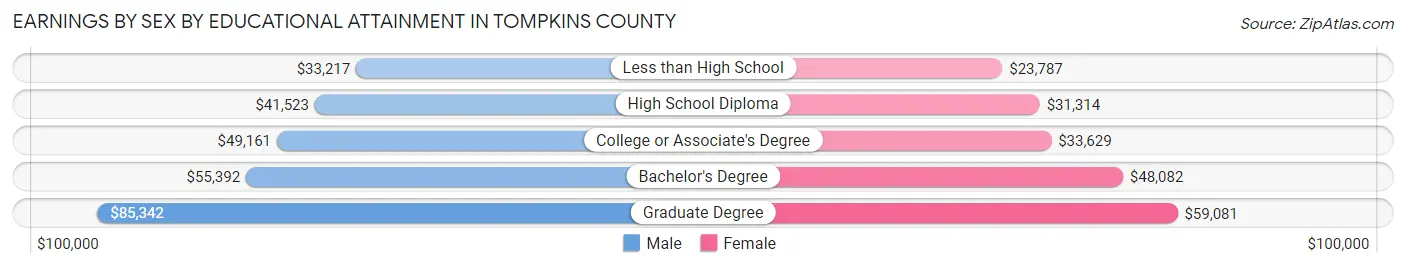
Earnings by Sex by Educational Attainment in Tompkins County
Average earnings in Tompkins County are $56,148 for men and $45,127 for women, a difference of 19.6%. Men with an educational attainment of graduate degree enjoy the highest average annual earnings of $85,342, while those with less than high school education earn the least with $33,217. Women with an educational attainment of graduate degree earn the most with the average annual earnings of $59,081, while those with less than high school education have the smallest earnings of $23,787.
| Educational Attainment | Male Income | Female Income |
| Less than High School | $33,217 | $23,787 |
| High School Diploma | $41,523 | $31,314 |
| College or Associate's Degree | $49,161 | $33,629 |
| Bachelor's Degree | $55,392 | $48,082 |
| Graduate Degree | $85,342 | $59,081 |
| Total | $56,148 | $45,127 |
Family Income in Tompkins County
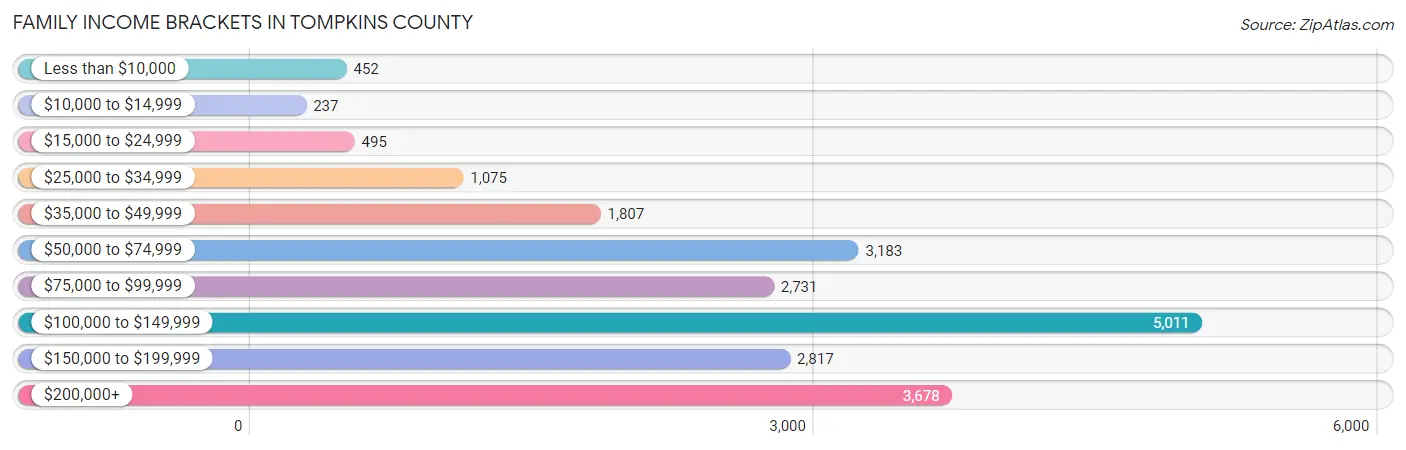
Family Income Brackets in Tompkins County
According to the Tompkins County family income data, there are 5,011 families falling into the $100,000 to $149,999 income range, which is the most common income bracket and makes up 23.3% of all families. Conversely, the $10,000 to $14,999 income bracket is the least frequent group with only 237 families (1.1%) belonging to this category.
| Income Bracket | # Families | % Families |
| Less than $10,000 | 452 | 2.1% |
| $10,000 to $14,999 | 237 | 1.1% |
| $15,000 to $24,999 | 495 | 2.3% |
| $25,000 to $34,999 | 1,075 | 5.0% |
| $35,000 to $49,999 | 1,807 | 8.4% |
| $50,000 to $74,999 | 3,183 | 14.8% |
| $75,000 to $99,999 | 2,731 | 12.7% |
| $100,000 to $149,999 | 5,011 | 23.3% |
| $150,000 to $199,999 | 2,817 | 13.1% |
| $200,000+ | 3,678 | 17.1% |
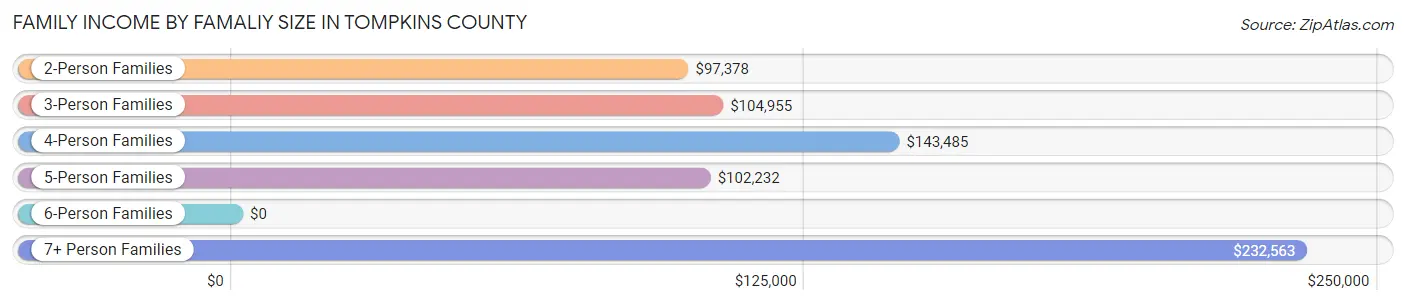
Family Income by Famaliy Size in Tompkins County
7+ person families (105 | 0.5%) account for the highest median family income in Tompkins County with $232,563 per family, while 2-person families (12,168 | 56.6%) have the highest median income of $48,689 per family member.
| Income Bracket | # Families | Median Income |
| 2-Person Families | 12,168 (56.6%) | $97,378 |
| 3-Person Families | 4,443 (20.7%) | $104,955 |
| 4-Person Families | 3,044 (14.1%) | $143,485 |
| 5-Person Families | 1,483 (6.9%) | $102,232 |
| 6-Person Families | 263 (1.2%) | $0 |
| 7+ Person Families | 105 (0.5%) | $232,563 |
| Total | 21,506 (100.0%) | $106,005 |
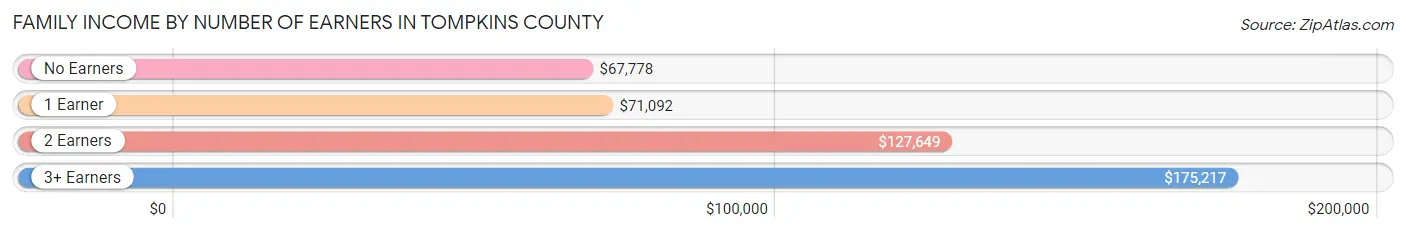
Family Income by Number of Earners in Tompkins County
The median family income in Tompkins County is $106,005, with families comprising 3+ earners (1,782) having the highest median family income of $175,217, while families with no earners (3,396) have the lowest median family income of $67,778, accounting for 8.3% and 15.8% of families, respectively.
| Number of Earners | # Families | Median Income |
| No Earners | 3,396 (15.8%) | $67,778 |
| 1 Earner | 6,706 (31.2%) | $71,092 |
| 2 Earners | 9,622 (44.7%) | $127,649 |
| 3+ Earners | 1,782 (8.3%) | $175,217 |
| Total | 21,506 (100.0%) | $106,005 |
Household Income in Tompkins County
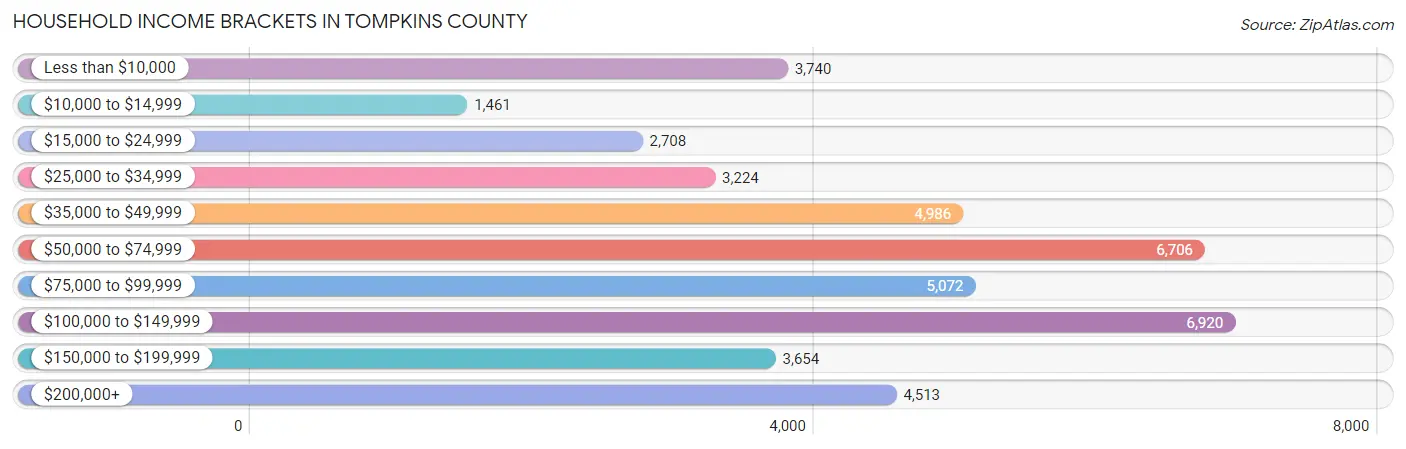
Household Income Brackets in Tompkins County
With 6,920 households falling in the category, the $100,000 to $149,999 income range is the most frequent in Tompkins County, accounting for 16.1% of all households. In contrast, only 1,461 households (3.4%) fall into the $10,000 to $14,999 income bracket, making it the least populous group.
| Income Bracket | # Households | % Households |
| Less than $10,000 | 3,740 | 8.7% |
| $10,000 to $14,999 | 1,461 | 3.4% |
| $15,000 to $24,999 | 2,708 | 6.3% |
| $25,000 to $34,999 | 3,224 | 7.5% |
| $35,000 to $49,999 | 4,986 | 11.6% |
| $50,000 to $74,999 | 6,706 | 15.6% |
| $75,000 to $99,999 | 5,072 | 11.8% |
| $100,000 to $149,999 | 6,920 | 16.1% |
| $150,000 to $199,999 | 3,654 | 8.5% |
| $200,000+ | 4,513 | 10.5% |
Household Income by Householder Age in Tompkins County
The median household income in Tompkins County is $69,995, with the highest median household income of $104,823 found in the 45 to 64 years age bracket for the primary householder. A total of 12,847 households (29.9%) fall into this category. Meanwhile, the 15 to 24 years age bracket for the primary householder has the lowest median household income of $25,318, with 6,382 households (14.8%) in this group.
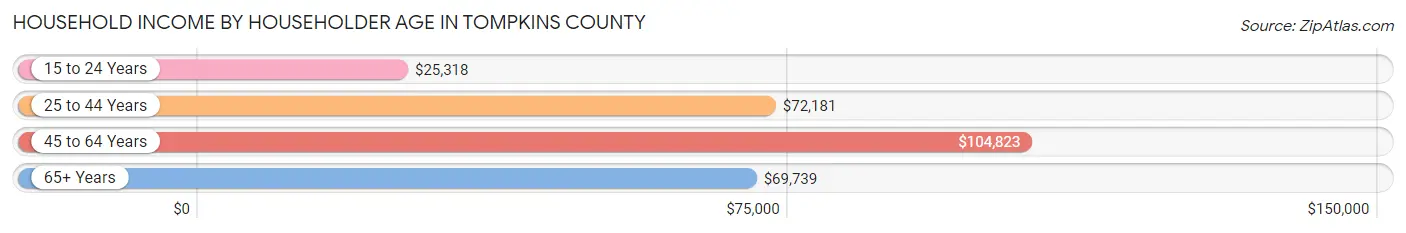
| Income Bracket | # Households | Median Income |
| 15 to 24 Years | 6,382 (14.8%) | $25,318 |
| 25 to 44 Years | 13,234 (30.8%) | $72,181 |
| 45 to 64 Years | 12,847 (29.9%) | $104,823 |
| 65+ Years | 10,521 (24.5%) | $69,739 |
| Total | 42,984 (100.0%) | $69,995 |
Poverty in Tompkins County
Income Below Poverty by Sex and Age in Tompkins County
With 14.6% poverty level for males and 17.4% for females among the residents of Tompkins County, 18 to 24 year old males and 18 to 24 year old females are the most vulnerable to poverty, with 3,691 males (50.4%) and 4,021 females (58.2%) in their respective age groups living below the poverty level.
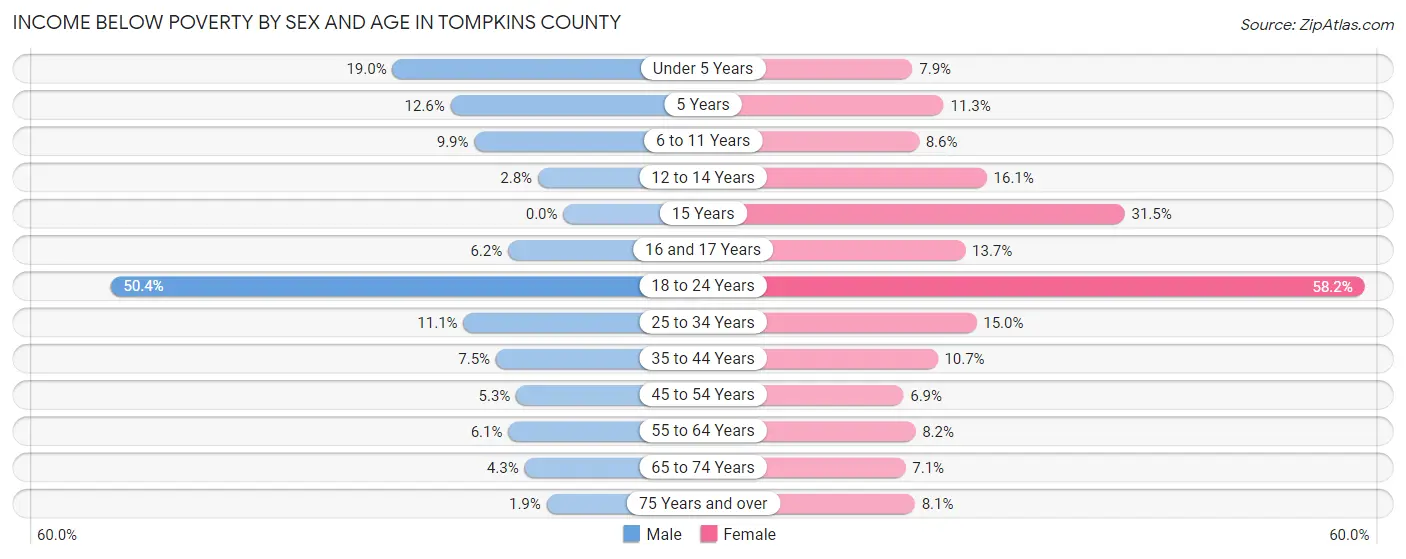
| Age Bracket | Male | Female |
| Under 5 Years | 389 (19.0%) | 126 (7.9%) |
| 5 Years | 52 (12.6%) | 60 (11.3%) |
| 6 to 11 Years | 207 (9.9%) | 208 (8.6%) |
| 12 to 14 Years | 38 (2.8%) | 201 (16.1%) |
| 15 Years | 0 (0.0%) | 188 (31.5%) |
| 16 and 17 Years | 43 (6.2%) | 89 (13.7%) |
| 18 to 24 Years | 3,691 (50.4%) | 4,021 (58.2%) |
| 25 to 34 Years | 657 (11.1%) | 929 (15.0%) |
| 35 to 44 Years | 388 (7.5%) | 614 (10.6%) |
| 45 to 54 Years | 261 (5.2%) | 355 (6.9%) |
| 55 to 64 Years | 339 (6.1%) | 485 (8.2%) |
| 65 to 74 Years | 199 (4.3%) | 354 (7.1%) |
| 75 Years and over | 48 (1.9%) | 290 (8.1%) |
| Total | 6,312 (14.6%) | 7,920 (17.4%) |
Income Above Poverty by Sex and Age in Tompkins County
According to the poverty statistics in Tompkins County, males aged 15 years and females aged 45 to 54 years are the age groups that are most secure financially, with 100.0% of males and 93.1% of females in these age groups living above the poverty line.
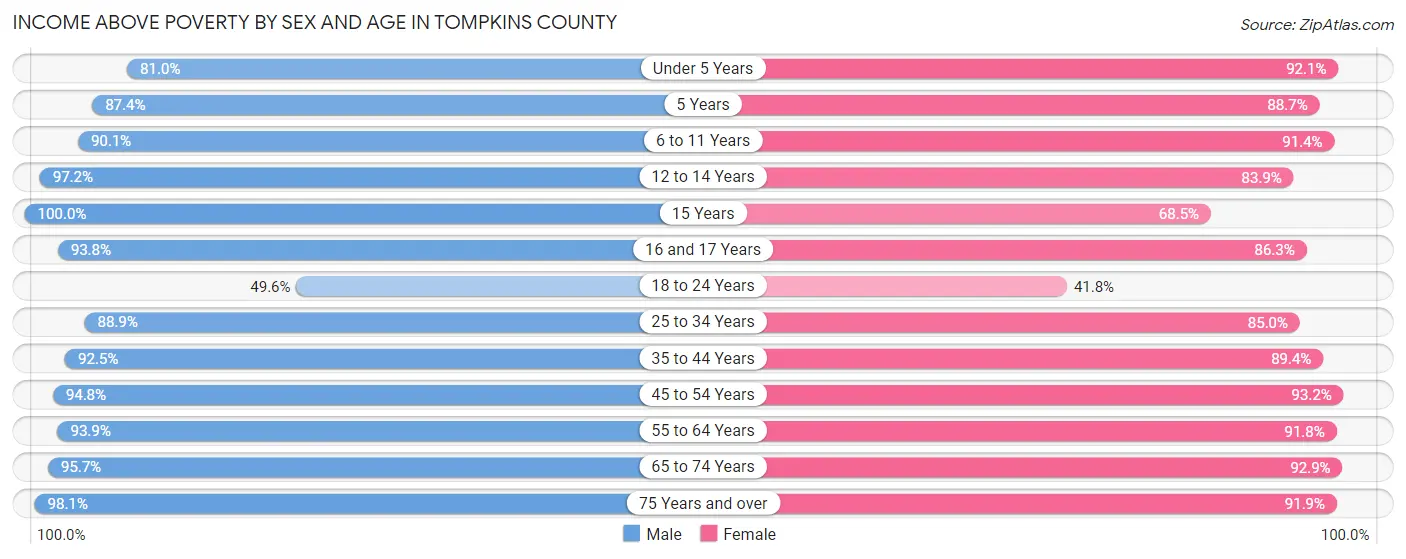
| Age Bracket | Male | Female |
| Under 5 Years | 1,655 (81.0%) | 1,477 (92.1%) |
| 5 Years | 362 (87.4%) | 469 (88.7%) |
| 6 to 11 Years | 1,881 (90.1%) | 2,219 (91.4%) |
| 12 to 14 Years | 1,303 (97.2%) | 1,045 (83.9%) |
| 15 Years | 495 (100.0%) | 409 (68.5%) |
| 16 and 17 Years | 655 (93.8%) | 559 (86.3%) |
| 18 to 24 Years | 3,627 (49.6%) | 2,887 (41.8%) |
| 25 to 34 Years | 5,245 (88.9%) | 5,273 (85.0%) |
| 35 to 44 Years | 4,779 (92.5%) | 5,152 (89.3%) |
| 45 to 54 Years | 4,710 (94.8%) | 4,830 (93.1%) |
| 55 to 64 Years | 5,189 (93.9%) | 5,444 (91.8%) |
| 65 to 74 Years | 4,392 (95.7%) | 4,648 (92.9%) |
| 75 Years and over | 2,534 (98.1%) | 3,280 (91.9%) |
| Total | 36,827 (85.4%) | 37,692 (82.6%) |
Income Below Poverty Among Married-Couple Families in Tompkins County
The poverty statistics for married-couple families in Tompkins County show that 1.6% or 276 of the total 16,958 families live below the poverty line. Families with 3 or 4 children have the highest poverty rate of 7.6%, comprising of 81 families. On the other hand, families with no children have the lowest poverty rate of 1.1%, which includes 122 families.
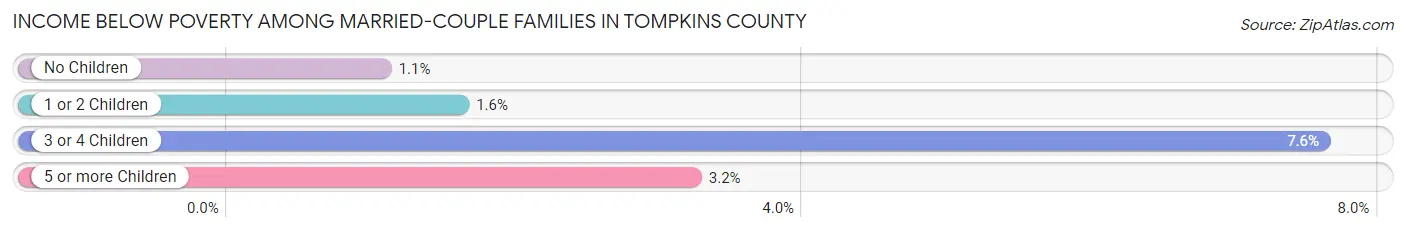
| Children | Above Poverty | Below Poverty |
| No Children | 11,271 (98.9%) | 122 (1.1%) |
| 1 or 2 Children | 4,398 (98.4%) | 72 (1.6%) |
| 3 or 4 Children | 983 (92.4%) | 81 (7.6%) |
| 5 or more Children | 30 (96.8%) | 1 (3.2%) |
| Total | 16,682 (98.4%) | 276 (1.6%) |
Income Below Poverty Among Single-Parent Households in Tompkins County
According to the poverty data in Tompkins County, 8.2% or 101 single-father households and 19.9% or 659 single-mother households are living below the poverty line. Among single-father households, those with 1 or 2 children have the highest poverty rate, with 79 households (10.3%) experiencing poverty. Likewise, among single-mother households, those with 5 or more children have the highest poverty rate, with 4 households (100.0%) falling below the poverty line.
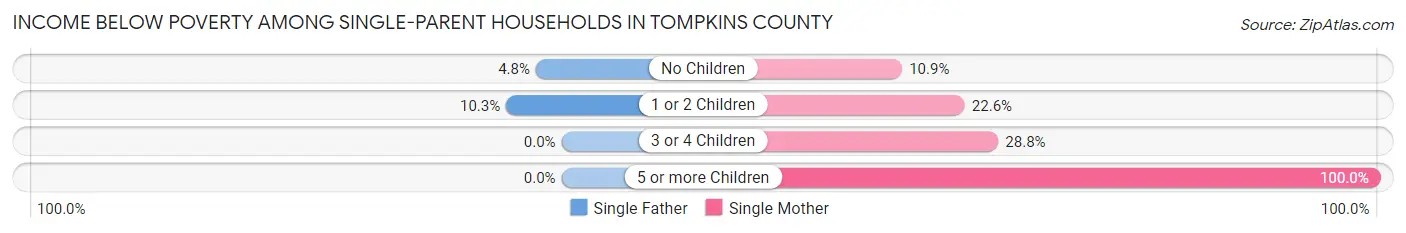
| Children | Single Father | Single Mother |
| No Children | 22 (4.8%) | 110 (10.9%) |
| 1 or 2 Children | 79 (10.3%) | 430 (22.6%) |
| 3 or 4 Children | 0 (0.0%) | 115 (28.8%) |
| 5 or more Children | 0 (0.0%) | 4 (100.0%) |
| Total | 101 (8.2%) | 659 (19.9%) |
Income Below Poverty Among Married-Couple vs Single-Parent Households in Tompkins County
The poverty data for Tompkins County shows that 276 of the married-couple family households (1.6%) and 760 of the single-parent households (16.7%) are living below the poverty level. Within the married-couple family households, those with 3 or 4 children have the highest poverty rate, with 81 households (7.6%) falling below the poverty line. Among the single-parent households, those with 5 or more children have the highest poverty rate, with 4 household (100.0%) living below poverty.
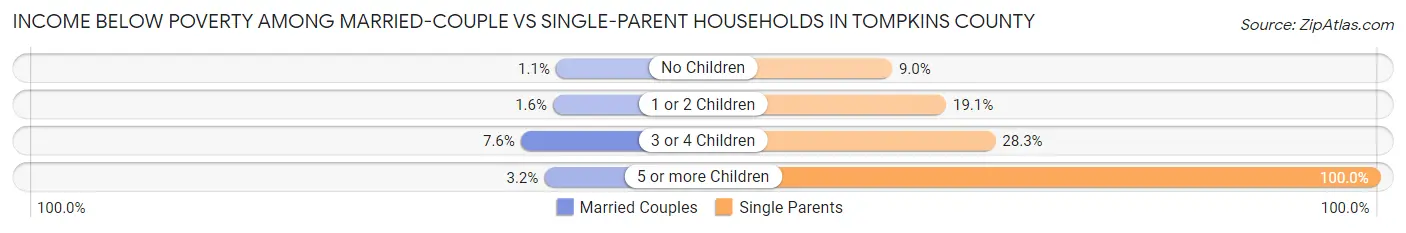
| Children | Married-Couple Families | Single-Parent Households |
| No Children | 122 (1.1%) | 132 (9.0%) |
| 1 or 2 Children | 72 (1.6%) | 509 (19.1%) |
| 3 or 4 Children | 81 (7.6%) | 115 (28.3%) |
| 5 or more Children | 1 (3.2%) | 4 (100.0%) |
| Total | 276 (1.6%) | 760 (16.7%) |
Race in Tompkins County
The most populous races in Tompkins County are White / Caucasian (80,182 | 78.2%), Asian (9,871 | 9.6%), and Two or more Races (5,643 | 5.5%).
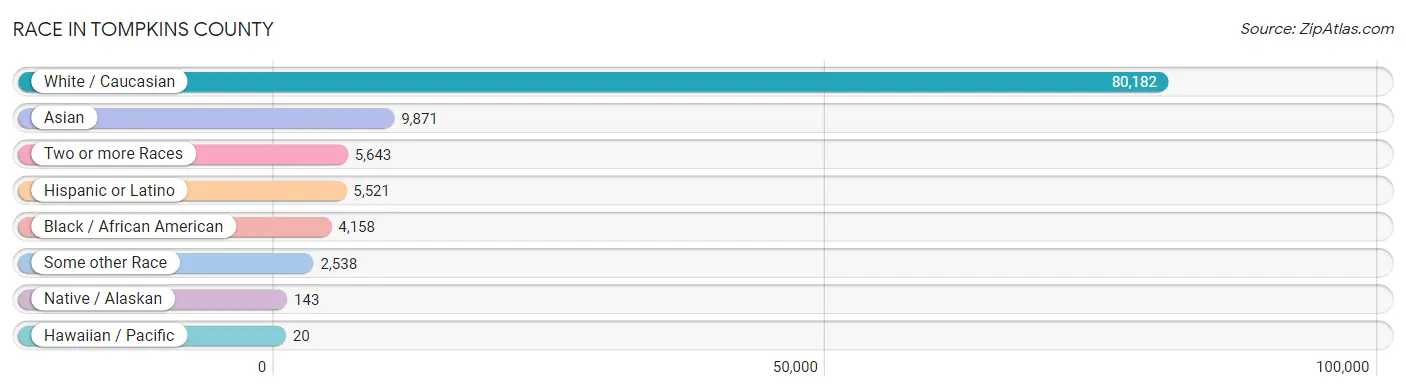
| Race | # Population | % Population |
| Asian | 9,871 | 9.6% |
| Black / African American | 4,158 | 4.1% |
| Hawaiian / Pacific | 20 | 0.0% |
| Hispanic or Latino | 5,521 | 5.4% |
| Native / Alaskan | 143 | 0.1% |
| White / Caucasian | 80,182 | 78.2% |
| Two or more Races | 5,643 | 5.5% |
| Some other Race | 2,538 | 2.5% |
| Total | 102,555 | 100.0% |
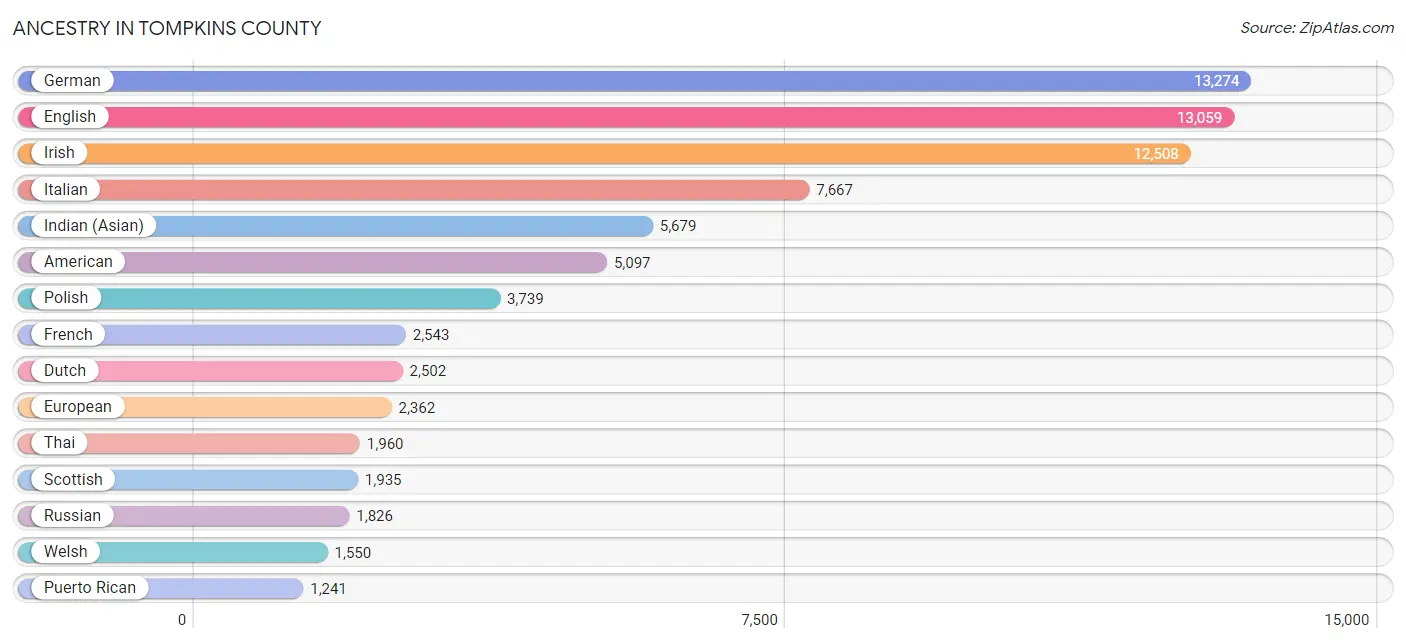
Ancestry in Tompkins County
The most populous ancestries reported in Tompkins County are German (13,274 | 12.9%), English (13,059 | 12.7%), Irish (12,508 | 12.2%), Italian (7,667 | 7.5%), and Indian (Asian) (5,679 | 5.5%), together accounting for 50.9% of all Tompkins County residents.
| Ancestry | # Population | % Population |
| African | 54 | 0.1% |
| American | 5,097 | 5.0% |
| Apache | 65 | 0.1% |
| Arab | 996 | 1.0% |
| Argentinean | 58 | 0.1% |
| Armenian | 120 | 0.1% |
| Australian | 46 | 0.0% |
| Austrian | 258 | 0.3% |
| Belgian | 235 | 0.2% |
| Belizean | 14 | 0.0% |
| Bhutanese | 764 | 0.7% |
| Blackfeet | 256 | 0.3% |
| Bolivian | 51 | 0.1% |
| Brazilian | 62 | 0.1% |
| British | 1,097 | 1.1% |
| British West Indian | 3 | 0.0% |
| Bulgarian | 181 | 0.2% |
| Burmese | 892 | 0.9% |
| Canadian | 613 | 0.6% |
| Cape Verdean | 22 | 0.0% |
| Carpatho Rusyn | 33 | 0.0% |
| Celtic | 7 | 0.0% |
| Central American | 410 | 0.4% |
| Central American Indian | 54 | 0.1% |
| Cherokee | 114 | 0.1% |
| Chickasaw | 10 | 0.0% |
| Chilean | 22 | 0.0% |
| Chippewa | 2 | 0.0% |
| Choctaw | 10 | 0.0% |
| Colombian | 131 | 0.1% |
| Comanche | 14 | 0.0% |
| Costa Rican | 88 | 0.1% |
| Croatian | 195 | 0.2% |
| Cuban | 356 | 0.4% |
| Cypriot | 29 | 0.0% |
| Czech | 507 | 0.5% |
| Czechoslovakian | 122 | 0.1% |
| Danish | 248 | 0.2% |
| Delaware | 8 | 0.0% |
| Dominican | 425 | 0.4% |
| Dutch | 2,502 | 2.4% |
| Eastern European | 1,035 | 1.0% |
| Ecuadorian | 182 | 0.2% |
| Egyptian | 97 | 0.1% |
| English | 13,059 | 12.7% |
| Estonian | 4 | 0.0% |
| Ethiopian | 53 | 0.1% |
| European | 2,362 | 2.3% |
| Filipino | 230 | 0.2% |
| Finnish | 398 | 0.4% |
| French | 2,543 | 2.5% |
| French American Indian | 4 | 0.0% |
| French Canadian | 949 | 0.9% |
| German | 13,274 | 12.9% |
| German Russian | 8 | 0.0% |
| Ghanaian | 111 | 0.1% |
| Greek | 651 | 0.6% |
| Guatemalan | 171 | 0.2% |
| Guyanese | 142 | 0.1% |
| Haitian | 120 | 0.1% |
| Honduran | 64 | 0.1% |
| Hungarian | 1,091 | 1.1% |
| Icelander | 63 | 0.1% |
| Indian (Asian) | 5,679 | 5.5% |
| Indonesian | 213 | 0.2% |
| Iranian | 44 | 0.0% |
| Iraqi | 20 | 0.0% |
| Irish | 12,508 | 12.2% |
| Iroquois | 106 | 0.1% |
| Israeli | 148 | 0.1% |
| Italian | 7,667 | 7.5% |
| Jamaican | 65 | 0.1% |
| Japanese | 429 | 0.4% |
| Jordanian | 10 | 0.0% |
| Kenyan | 92 | 0.1% |
| Korean | 306 | 0.3% |
| Laotian | 34 | 0.0% |
| Latvian | 64 | 0.1% |
| Lebanese | 271 | 0.3% |
| Lithuanian | 285 | 0.3% |
| Lumbee | 8 | 0.0% |
| Luxembourger | 21 | 0.0% |
| Macedonian | 35 | 0.0% |
| Malaysian | 82 | 0.1% |
| Maltese | 14 | 0.0% |
| Mexican | 993 | 1.0% |
| Mongolian | 19 | 0.0% |
| Moroccan | 50 | 0.1% |
| Native Hawaiian | 86 | 0.1% |
| Navajo | 84 | 0.1% |
| Nicaraguan | 4 | 0.0% |
| Nigerian | 110 | 0.1% |
| Northern European | 274 | 0.3% |
| Norwegian | 727 | 0.7% |
| Okinawan | 34 | 0.0% |
| Pakistani | 130 | 0.1% |
| Panamanian | 10 | 0.0% |
| Pennsylvania German | 93 | 0.1% |
| Peruvian | 162 | 0.2% |
| Polish | 3,739 | 3.6% |
| Portuguese | 234 | 0.2% |
| Puerto Rican | 1,241 | 1.2% |
| Romanian | 309 | 0.3% |
| Russian | 1,826 | 1.8% |
| Salvadoran | 73 | 0.1% |
| Samoan | 5 | 0.0% |
| Scandinavian | 356 | 0.4% |
| Scotch-Irish | 808 | 0.8% |
| Scottish | 1,935 | 1.9% |
| Senegalese | 6 | 0.0% |
| Serbian | 85 | 0.1% |
| Sierra Leonean | 11 | 0.0% |
| Slavic | 51 | 0.1% |
| Slovak | 209 | 0.2% |
| Slovene | 66 | 0.1% |
| Somali | 8 | 0.0% |
| South African | 21 | 0.0% |
| South American | 657 | 0.6% |
| South American Indian | 65 | 0.1% |
| Spaniard | 185 | 0.2% |
| Spanish | 110 | 0.1% |
| Sri Lankan | 156 | 0.2% |
| Subsaharan African | 658 | 0.6% |
| Swedish | 1,137 | 1.1% |
| Swiss | 462 | 0.4% |
| Syrian | 213 | 0.2% |
| Taiwanese | 7 | 0.0% |
| Thai | 1,960 | 1.9% |
| Tlingit-Haida | 21 | 0.0% |
| Trinidadian and Tobagonian | 53 | 0.1% |
| Turkish | 249 | 0.2% |
| Ugandan | 14 | 0.0% |
| Ukrainian | 768 | 0.7% |
| Venezuelan | 40 | 0.0% |
| Vietnamese | 156 | 0.2% |
| Welsh | 1,550 | 1.5% |
| West Indian | 3 | 0.0% |
| Yugoslavian | 47 | 0.1% | View All 138 Rows |
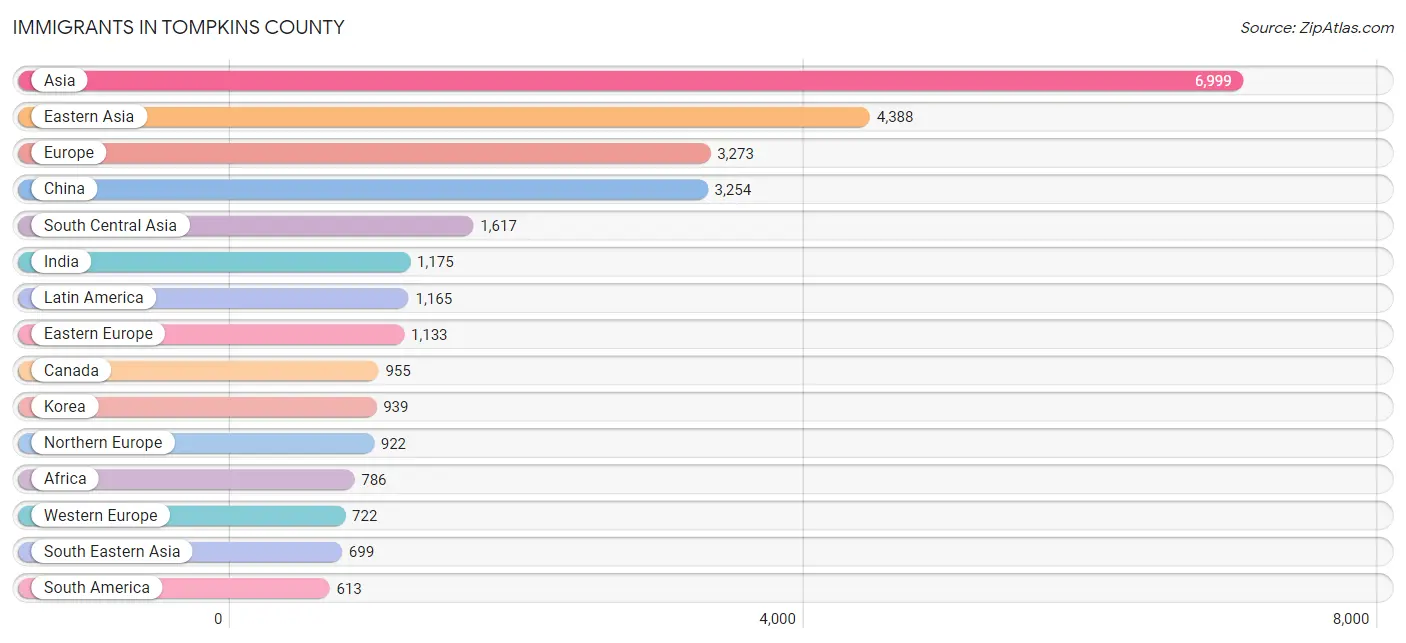
Immigrants in Tompkins County
The most numerous immigrant groups reported in Tompkins County came from Asia (6,999 | 6.8%), Eastern Asia (4,388 | 4.3%), Europe (3,273 | 3.2%), China (3,254 | 3.2%), and South Central Asia (1,617 | 1.6%), together accounting for 19.0% of all Tompkins County residents.
| Immigration Origin | # Population | % Population |
| Africa | 786 | 0.8% |
| Albania | 7 | 0.0% |
| Argentina | 25 | 0.0% |
| Asia | 6,999 | 6.8% |
| Australia | 101 | 0.1% |
| Austria | 55 | 0.1% |
| Bangladesh | 127 | 0.1% |
| Belarus | 116 | 0.1% |
| Belgium | 103 | 0.1% |
| Belize | 10 | 0.0% |
| Bolivia | 17 | 0.0% |
| Brazil | 259 | 0.3% |
| Bulgaria | 135 | 0.1% |
| Cambodia | 178 | 0.2% |
| Canada | 955 | 0.9% |
| Caribbean | 255 | 0.3% |
| Central America | 297 | 0.3% |
| China | 3,254 | 3.2% |
| Colombia | 61 | 0.1% |
| Costa Rica | 54 | 0.1% |
| Croatia | 14 | 0.0% |
| Cuba | 8 | 0.0% |
| Czechoslovakia | 15 | 0.0% |
| Denmark | 16 | 0.0% |
| Dominican Republic | 152 | 0.2% |
| Eastern Africa | 263 | 0.3% |
| Eastern Asia | 4,388 | 4.3% |
| Eastern Europe | 1,133 | 1.1% |
| Ecuador | 15 | 0.0% |
| Egypt | 86 | 0.1% |
| El Salvador | 60 | 0.1% |
| England | 276 | 0.3% |
| Ethiopia | 45 | 0.0% |
| Europe | 3,273 | 3.2% |
| France | 73 | 0.1% |
| Germany | 335 | 0.3% |
| Ghana | 139 | 0.1% |
| Greece | 120 | 0.1% |
| Guatemala | 18 | 0.0% |
| Guyana | 99 | 0.1% |
| Hong Kong | 408 | 0.4% |
| Hungary | 49 | 0.1% |
| India | 1,175 | 1.1% |
| Indonesia | 42 | 0.0% |
| Iran | 77 | 0.1% |
| Iraq | 20 | 0.0% |
| Ireland | 28 | 0.0% |
| Israel | 49 | 0.1% |
| Italy | 281 | 0.3% |
| Jamaica | 42 | 0.0% |
| Japan | 195 | 0.2% |
| Jordan | 10 | 0.0% |
| Kenya | 93 | 0.1% |
| Korea | 939 | 0.9% |
| Laos | 56 | 0.1% |
| Latin America | 1,165 | 1.1% |
| Latvia | 2 | 0.0% |
| Liberia | 1 | 0.0% |
| Malaysia | 66 | 0.1% |
| Mexico | 136 | 0.1% |
| Middle Africa | 3 | 0.0% |
| Moldova | 8 | 0.0% |
| Morocco | 79 | 0.1% |
| Nepal | 114 | 0.1% |
| Netherlands | 139 | 0.1% |
| Nigeria | 62 | 0.1% |
| North Macedonia | 17 | 0.0% |
| Northern Africa | 176 | 0.2% |
| Northern Europe | 922 | 0.9% |
| Oceania | 118 | 0.1% |
| Panama | 19 | 0.0% |
| Peru | 130 | 0.1% |
| Philippines | 52 | 0.1% |
| Poland | 56 | 0.1% |
| Portugal | 50 | 0.1% |
| Romania | 140 | 0.1% |
| Russia | 206 | 0.2% |
| Saudi Arabia | 17 | 0.0% |
| Scotland | 12 | 0.0% |
| Serbia | 26 | 0.0% |
| Singapore | 23 | 0.0% |
| South Africa | 37 | 0.0% |
| South America | 613 | 0.6% |
| South Central Asia | 1,617 | 1.6% |
| South Eastern Asia | 699 | 0.7% |
| Southern Europe | 496 | 0.5% |
| Spain | 31 | 0.0% |
| Sri Lanka | 52 | 0.1% |
| Sweden | 20 | 0.0% |
| Switzerland | 17 | 0.0% |
| Syria | 6 | 0.0% |
| Taiwan | 243 | 0.2% |
| Thailand | 119 | 0.1% |
| Trinidad and Tobago | 44 | 0.0% |
| Turkey | 99 | 0.1% |
| Uganda | 9 | 0.0% |
| Ukraine | 309 | 0.3% |
| Uzbekistan | 40 | 0.0% |
| Venezuela | 7 | 0.0% |
| Vietnam | 83 | 0.1% |
| Western Africa | 307 | 0.3% |
| Western Asia | 295 | 0.3% |
| Western Europe | 722 | 0.7% |
| Yemen | 1 | 0.0% |
| Zimbabwe | 11 | 0.0% | View All 105 Rows |
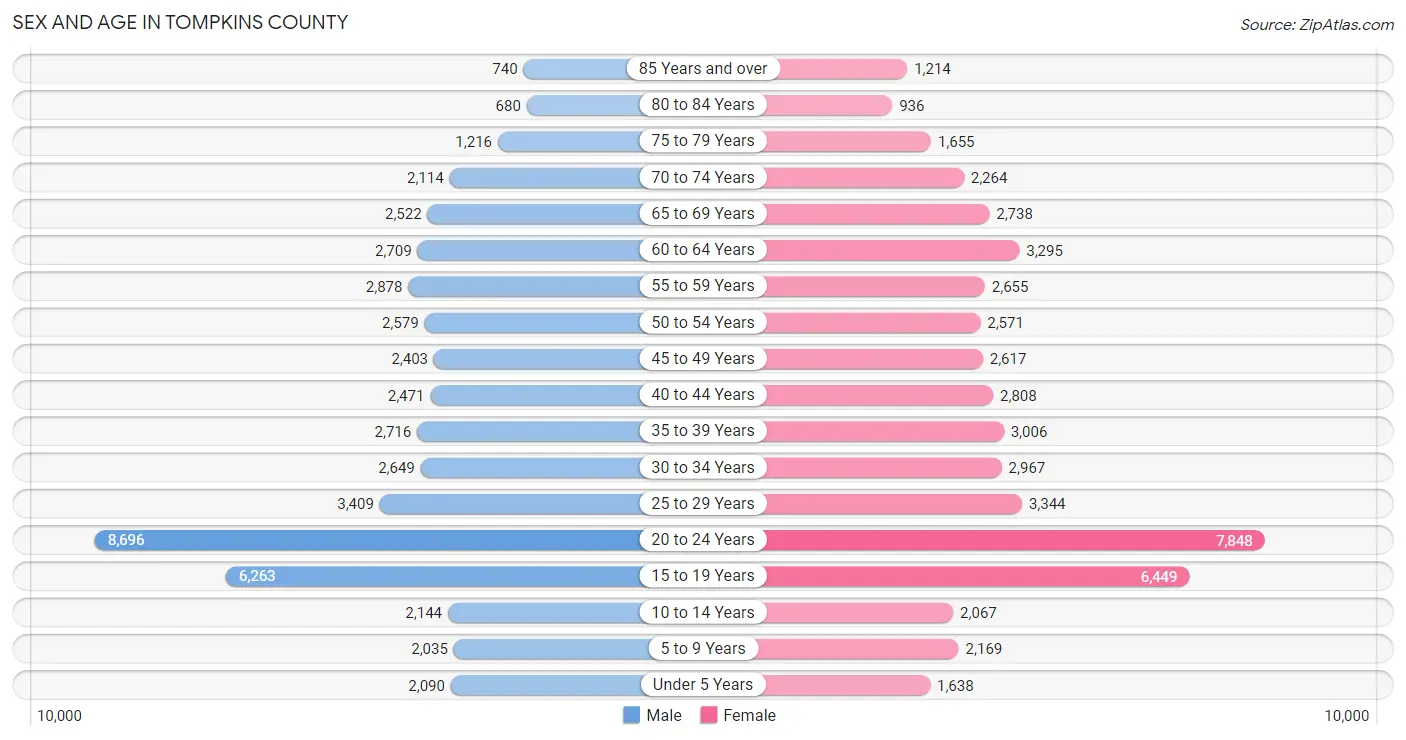
Sex and Age in Tompkins County
Sex and Age in Tompkins County
The most populous age groups in Tompkins County are 20 to 24 Years (8,696 | 17.3%) for men and 20 to 24 Years (7,848 | 15.0%) for women.
| Age Bracket | Male | Female |
| Under 5 Years | 2,090 (4.2%) | 1,638 (3.1%) |
| 5 to 9 Years | 2,035 (4.0%) | 2,169 (4.2%) |
| 10 to 14 Years | 2,144 (4.3%) | 2,067 (4.0%) |
| 15 to 19 Years | 6,263 (12.4%) | 6,449 (12.3%) |
| 20 to 24 Years | 8,696 (17.3%) | 7,848 (15.0%) |
| 25 to 29 Years | 3,409 (6.8%) | 3,344 (6.4%) |
| 30 to 34 Years | 2,649 (5.3%) | 2,967 (5.7%) |
| 35 to 39 Years | 2,716 (5.4%) | 3,006 (5.8%) |
| 40 to 44 Years | 2,471 (4.9%) | 2,808 (5.4%) |
| 45 to 49 Years | 2,403 (4.8%) | 2,617 (5.0%) |
| 50 to 54 Years | 2,579 (5.1%) | 2,571 (4.9%) |
| 55 to 59 Years | 2,878 (5.7%) | 2,655 (5.1%) |
| 60 to 64 Years | 2,709 (5.4%) | 3,295 (6.3%) |
| 65 to 69 Years | 2,522 (5.0%) | 2,738 (5.2%) |
| 70 to 74 Years | 2,114 (4.2%) | 2,264 (4.3%) |
| 75 to 79 Years | 1,216 (2.4%) | 1,655 (3.2%) |
| 80 to 84 Years | 680 (1.3%) | 936 (1.8%) |
| 85 Years and over | 740 (1.5%) | 1,214 (2.3%) |
| Total | 50,314 (100.0%) | 52,241 (100.0%) |
Families and Households in Tompkins County
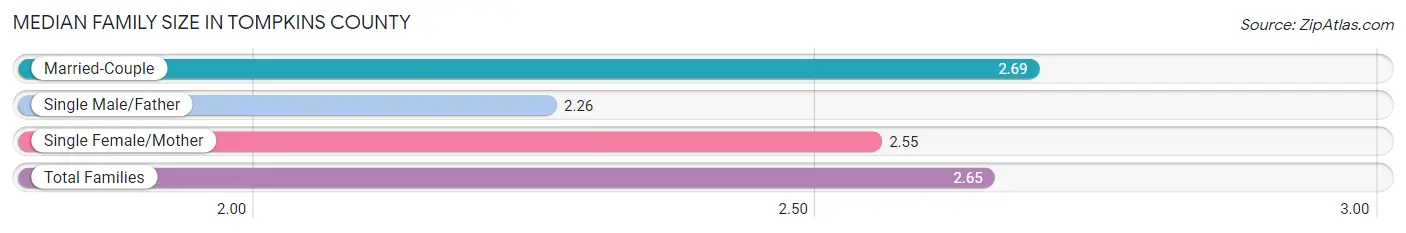
Median Family Size in Tompkins County
The median family size in Tompkins County is 2.65 persons per family, with married-couple families (16,958 | 78.8%) accounting for the largest median family size of 2.69 persons per family. On the other hand, single male/father families (1,233 | 5.7%) represent the smallest median family size with 2.26 persons per family.
| Family Type | # Families | Family Size |
| Married-Couple | 16,958 (78.8%) | 2.69 |
| Single Male/Father | 1,233 (5.7%) | 2.26 |
| Single Female/Mother | 3,315 (15.4%) | 2.55 |
| Total Families | 21,506 (100.0%) | 2.65 |
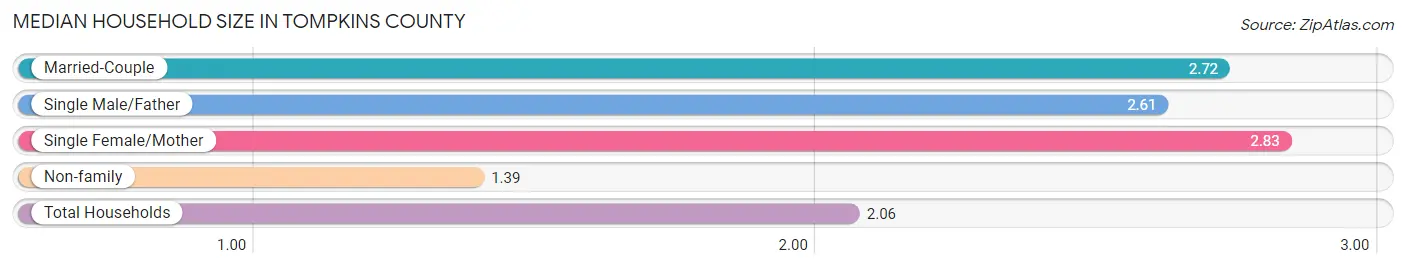
Median Household Size in Tompkins County
The median household size in Tompkins County is 2.06 persons per household, with single female/mother households (3,315 | 7.7%) accounting for the largest median household size of 2.83 persons per household. non-family households (21,478 | 50.0%) represent the smallest median household size with 1.39 persons per household.
| Household Type | # Households | Household Size |
| Married-Couple | 16,958 (39.5%) | 2.72 |
| Single Male/Father | 1,233 (2.9%) | 2.61 |
| Single Female/Mother | 3,315 (7.7%) | 2.83 |
| Non-family | 21,478 (50.0%) | 1.39 |
| Total Households | 42,984 (100.0%) | 2.06 |
Household Size by Marriage Status in Tompkins County
Out of a total of 42,984 households in Tompkins County, 21,506 (50.0%) are family households, while 21,478 (50.0%) are nonfamily households. The most numerous type of family households are 2-person households, comprising 10,962, and the most common type of nonfamily households are 1-person households, comprising 13,901.
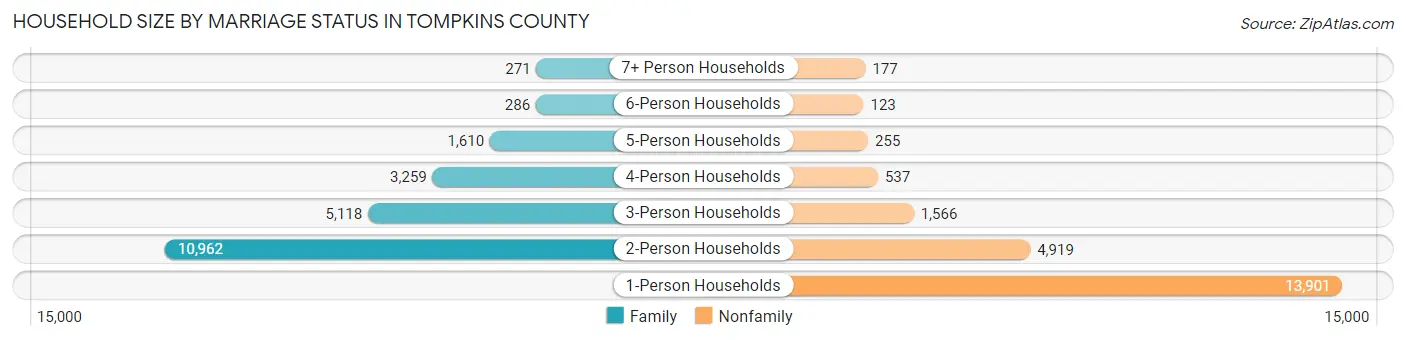
| Household Size | Family Households | Nonfamily Households |
| 1-Person Households | - | 13,901 (32.3%) |
| 2-Person Households | 10,962 (25.5%) | 4,919 (11.4%) |
| 3-Person Households | 5,118 (11.9%) | 1,566 (3.6%) |
| 4-Person Households | 3,259 (7.6%) | 537 (1.3%) |
| 5-Person Households | 1,610 (3.7%) | 255 (0.6%) |
| 6-Person Households | 286 (0.7%) | 123 (0.3%) |
| 7+ Person Households | 271 (0.6%) | 177 (0.4%) |
| Total | 21,506 (50.0%) | 21,478 (50.0%) |
Female Fertility in Tompkins County
Fertility by Age in Tompkins County
Average fertility rate in Tompkins County is 26.0 births per 1,000 women. Women in the age bracket of 35 to 50 years have the highest fertility rate with 46.0 births per 1,000 women. Women in the age bracket of 35 to 50 years acount for 52.9% of all women with births.
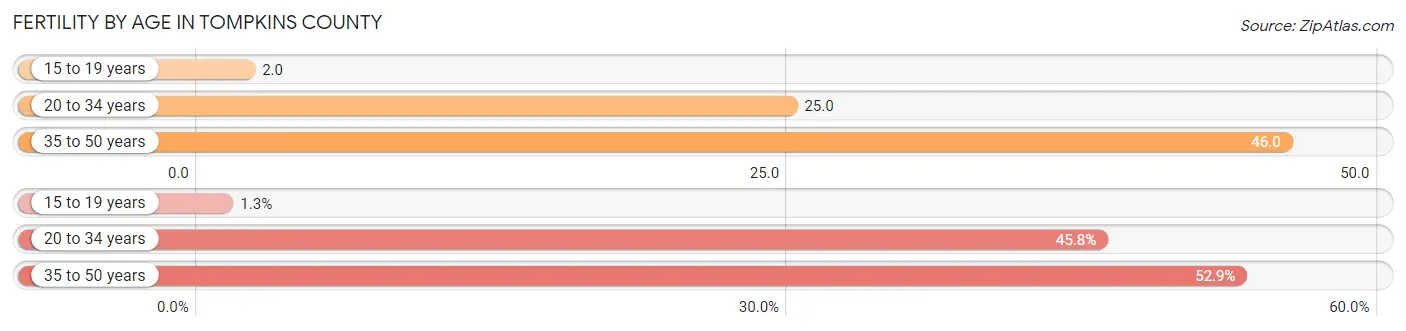
| Age Bracket | Women with Births | Births / 1,000 Women |
| 15 to 19 years | 10 (1.3%) | 2.0 |
| 20 to 34 years | 355 (45.8%) | 25.0 |
| 35 to 50 years | 410 (52.9%) | 46.0 |
| Total | 775 (100.0%) | 26.0 |
Fertility by Age by Marriage Status in Tompkins County
80.5% of women with births (775) in Tompkins County are married. The highest percentage of unmarried women with births falls into 15 to 19 years age bracket with 100.0% of them unmarried at the time of birth, while the lowest percentage of unmarried women with births belong to 20 to 34 years age bracket with 5.6% of them unmarried.
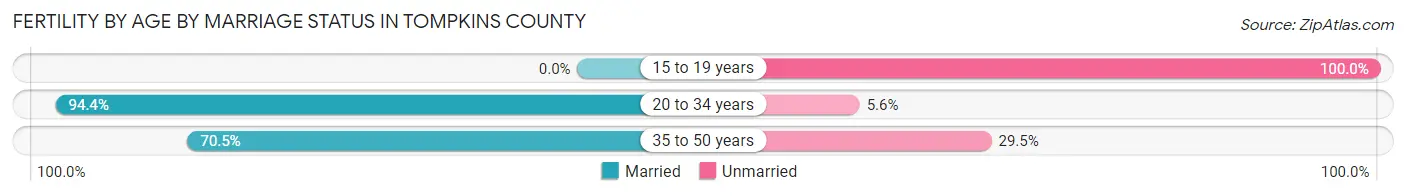
| Age Bracket | Married | Unmarried |
| 15 to 19 years | 0 (0.0%) | 10 (100.0%) |
| 20 to 34 years | 335 (94.4%) | 20 (5.6%) |
| 35 to 50 years | 289 (70.5%) | 121 (29.5%) |
| Total | 624 (80.5%) | 151 (19.5%) |
Fertility by Education in Tompkins County
Average fertility rate in Tompkins County is 26.0 births per 1,000 women. Women with the education attainment of less than high school have the highest fertility rate of 61.0 births per 1,000 women, while women with the education attainment of bachelor's degree have the lowest fertility at 12.0 births per 1,000 women. Women with the education attainment of graduate degree represent 36.3% of all women with births.
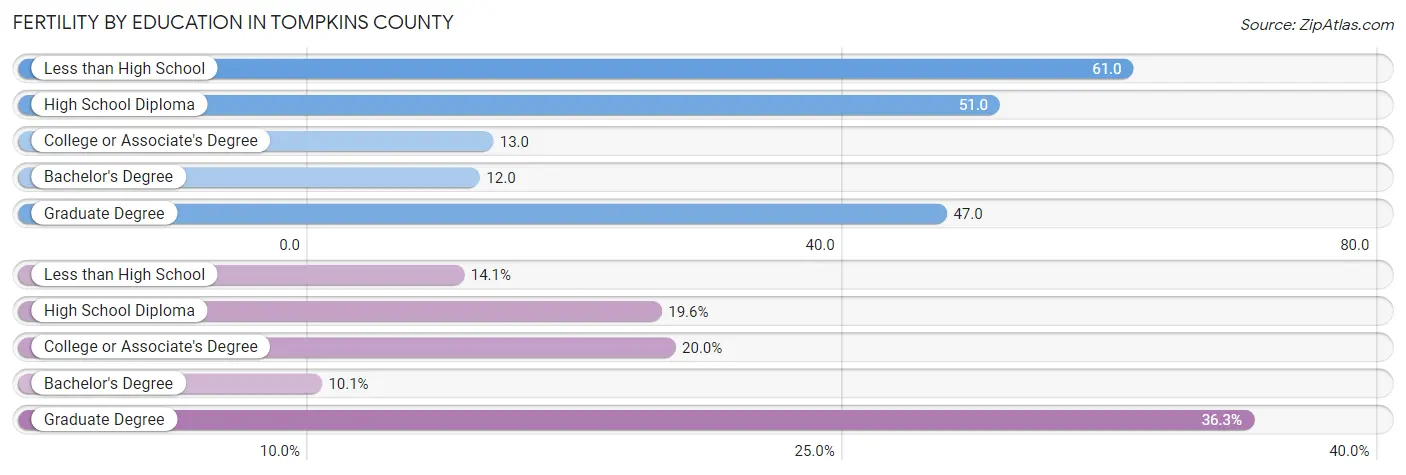
| Educational Attainment | Women with Births | Births / 1,000 Women |
| Less than High School | 109 (14.1%) | 61.0 |
| High School Diploma | 152 (19.6%) | 51.0 |
| College or Associate's Degree | 155 (20.0%) | 13.0 |
| Bachelor's Degree | 78 (10.1%) | 12.0 |
| Graduate Degree | 281 (36.3%) | 47.0 |
| Total | 775 (100.0%) | 26.0 |
Fertility by Education by Marriage Status in Tompkins County
19.5% of women with births in Tompkins County are unmarried. Women with the educational attainment of less than high school are most likely to be married with 86.2% of them married at childbirth, while women with the educational attainment of high school diploma are least likely to be married with 31.6% of them unmarried at childbirth.
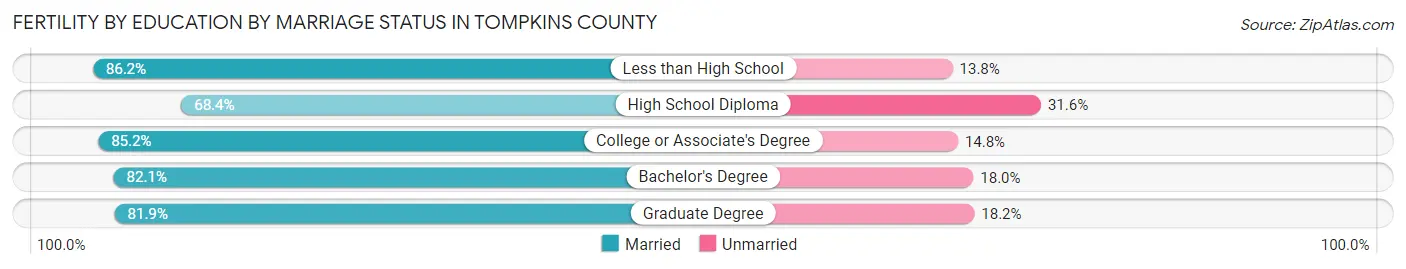
| Educational Attainment | Married | Unmarried |
| Less than High School | 94 (86.2%) | 15 (13.8%) |
| High School Diploma | 104 (68.4%) | 48 (31.6%) |
| College or Associate's Degree | 132 (85.2%) | 23 (14.8%) |
| Bachelor's Degree | 64 (82.1%) | 14 (17.9%) |
| Graduate Degree | 230 (81.9%) | 51 (18.1%) |
| Total | 624 (80.5%) | 151 (19.5%) |
Employment Characteristics in Tompkins County
Employment by Class of Employer in Tompkins County
Among the 48,267 employed individuals in Tompkins County, private company employees (22,110 | 45.8%), not-for-profit organizations (13,748 | 28.5%), and state government employees (3,649 | 7.6%) make up the most common classes of employment.
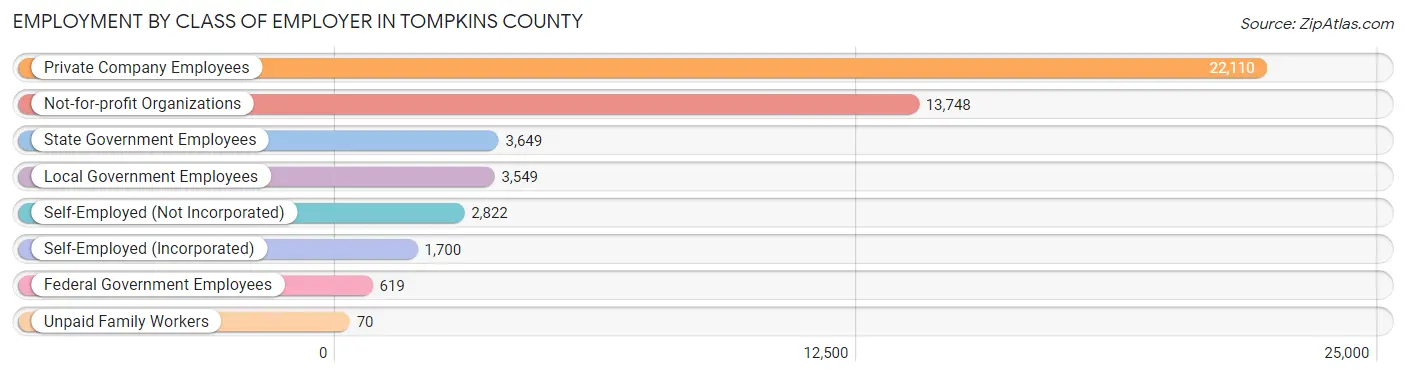
| Employer Class | # Employees | % Employees |
| Private Company Employees | 22,110 | 45.8% |
| Self-Employed (Incorporated) | 1,700 | 3.5% |
| Self-Employed (Not Incorporated) | 2,822 | 5.9% |
| Not-for-profit Organizations | 13,748 | 28.5% |
| Local Government Employees | 3,549 | 7.3% |
| State Government Employees | 3,649 | 7.6% |
| Federal Government Employees | 619 | 1.3% |
| Unpaid Family Workers | 70 | 0.2% |
| Total | 48,267 | 100.0% |
Employment Status by Age in Tompkins County
According to the labor force statistics for Tompkins County, out of the total population over 16 years of age (89,300), 58.1% or 51,883 individuals are in the labor force, with 4.7% or 2,439 of them unemployed. The age group with the highest labor force participation rate is 45 to 54 years, with 87.1% or 8,858 individuals in the labor force. Within the labor force, the 16 to 19 years age range has the highest percentage of unemployed individuals, with 9.3% or 202 of them being unemployed.
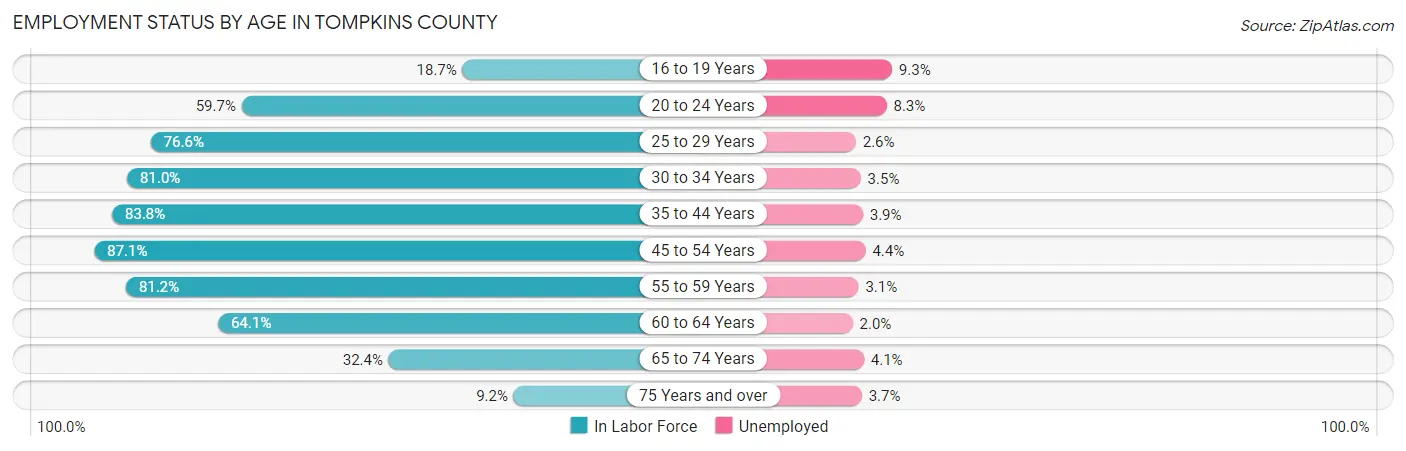
| Age Bracket | In Labor Force | Unemployed |
| 16 to 19 Years | 2,169 (18.7%) | 202 (9.3%) |
| 20 to 24 Years | 9,877 (59.7%) | 820 (8.3%) |
| 25 to 29 Years | 5,173 (76.6%) | 134 (2.6%) |
| 30 to 34 Years | 4,549 (81.0%) | 159 (3.5%) |
| 35 to 44 Years | 9,219 (83.8%) | 360 (3.9%) |
| 45 to 54 Years | 8,858 (87.1%) | 390 (4.4%) |
| 55 to 59 Years | 4,493 (81.2%) | 139 (3.1%) |
| 60 to 64 Years | 3,849 (64.1%) | 77 (2.0%) |
| 65 to 74 Years | 3,123 (32.4%) | 128 (4.1%) |
| 75 Years and over | 593 (9.2%) | 22 (3.7%) |
| Total | 51,883 (58.1%) | 2,439 (4.7%) |
Employment Status by Educational Attainment in Tompkins County
According to labor force statistics for Tompkins County, 80.2% of individuals (36,152) out of the total population between 25 and 64 years of age (45,077) are in the labor force, with 3.5% or 1,265 of them being unemployed. The group with the highest labor force participation rate are those with the educational attainment of bachelor's degree or higher, with 83.7% or 22,871 individuals in the labor force. Within the labor force, individuals with less than high school education have the highest percentage of unemployment, with 15.3% or 172 of them being unemployed.
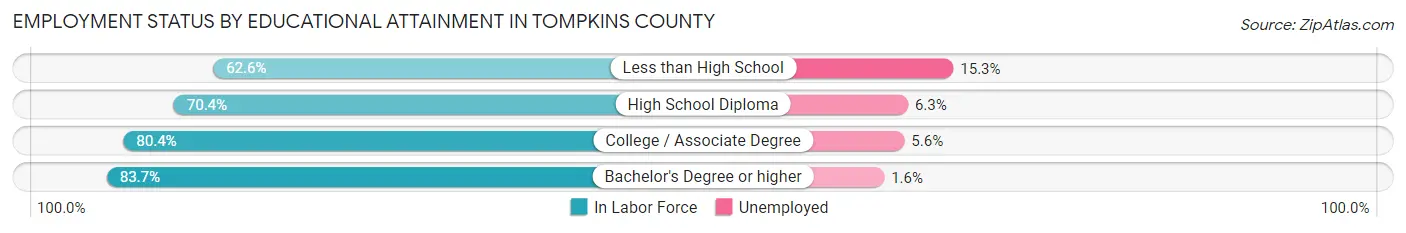
| Educational Attainment | In Labor Force | Unemployed |
| Less than High School | 1,121 (62.6%) | 274 (15.3%) |
| High School Diploma | 4,834 (70.4%) | 433 (6.3%) |
| College / Associate Degree | 7,313 (80.4%) | 509 (5.6%) |
| Bachelor's Degree or higher | 22,871 (83.7%) | 437 (1.6%) |
| Total | 36,152 (80.2%) | 1,578 (3.5%) |
Employment Occupations by Sex in Tompkins County
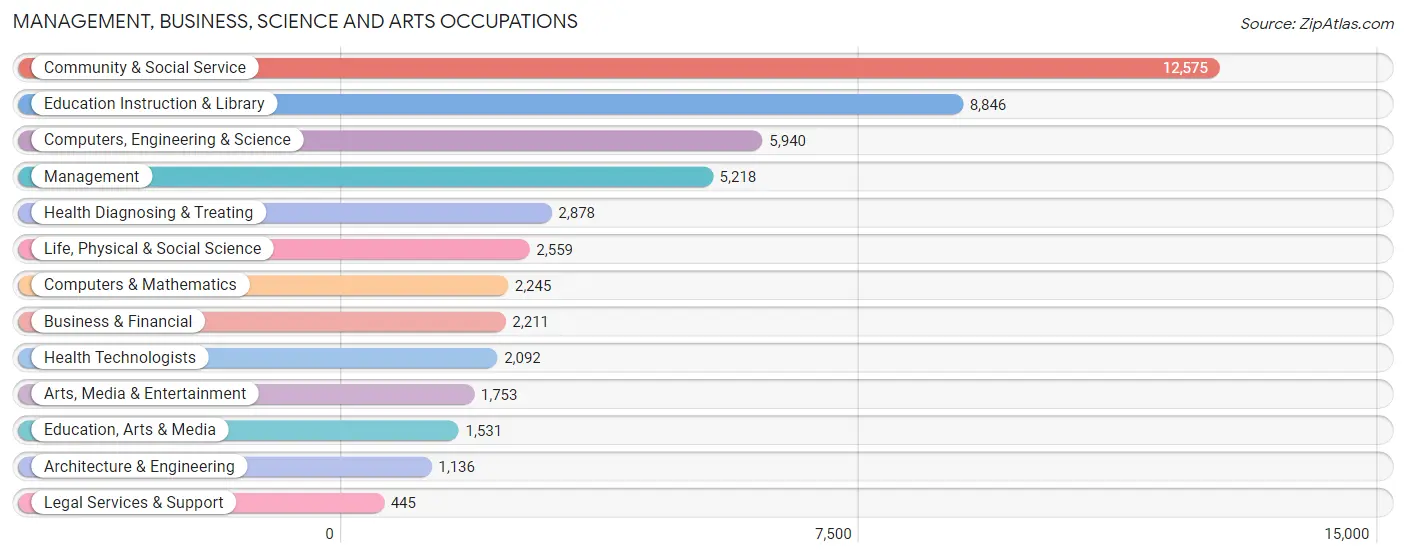
Management, Business, Science and Arts Occupations
The most common Management, Business, Science and Arts occupations in Tompkins County are Community & Social Service (12,575 | 25.5%), Education Instruction & Library (8,846 | 17.9%), Computers, Engineering & Science (5,940 | 12.0%), Management (5,218 | 10.6%), and Health Diagnosing & Treating (2,878 | 5.8%).
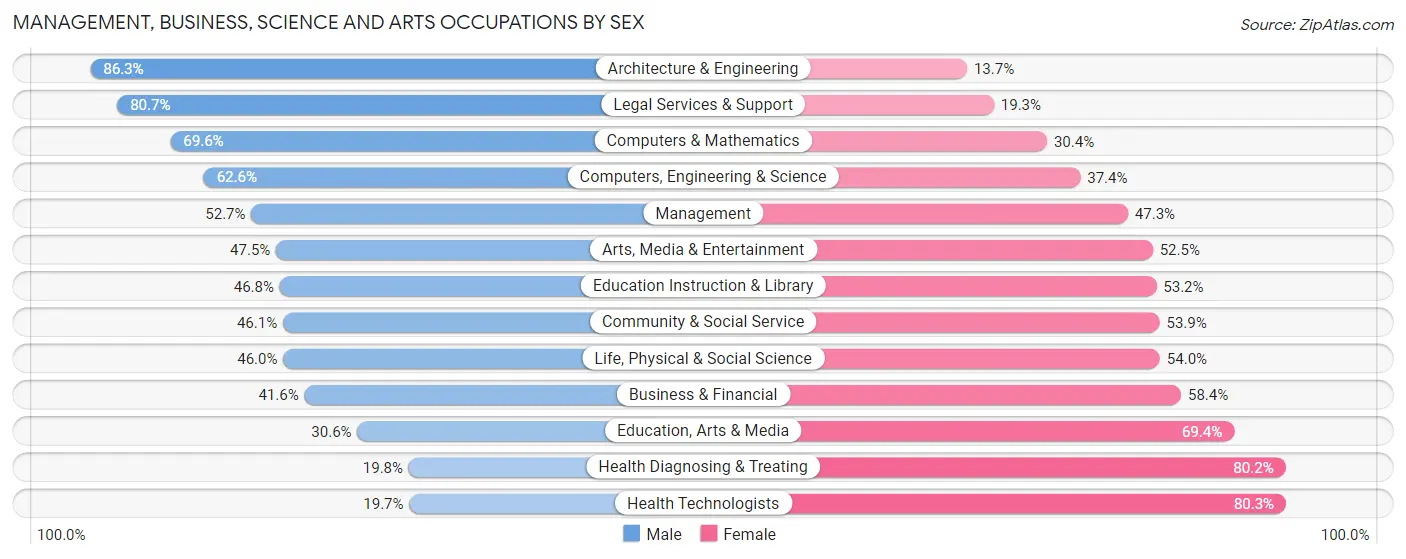
Management, Business, Science and Arts Occupations by Sex
Within the Management, Business, Science and Arts occupations in Tompkins County, the most male-oriented occupations are Architecture & Engineering (86.3%), Legal Services & Support (80.7%), and Computers & Mathematics (69.6%), while the most female-oriented occupations are Health Technologists (80.3%), Health Diagnosing & Treating (80.2%), and Education, Arts & Media (69.4%).
| Occupation | Male | Female |
| Management | 2,750 (52.7%) | 2,468 (47.3%) |
| Business & Financial | 920 (41.6%) | 1,291 (58.4%) |
| Computers, Engineering & Science | 3,720 (62.6%) | 2,220 (37.4%) |
| Computers & Mathematics | 1,562 (69.6%) | 683 (30.4%) |
| Architecture & Engineering | 980 (86.3%) | 156 (13.7%) |
| Life, Physical & Social Science | 1,178 (46.0%) | 1,381 (54.0%) |
| Community & Social Service | 5,797 (46.1%) | 6,778 (53.9%) |
| Education, Arts & Media | 468 (30.6%) | 1,063 (69.4%) |
| Legal Services & Support | 359 (80.7%) | 86 (19.3%) |
| Education Instruction & Library | 4,137 (46.8%) | 4,709 (53.2%) |
| Arts, Media & Entertainment | 833 (47.5%) | 920 (52.5%) |
| Health Diagnosing & Treating | 571 (19.8%) | 2,307 (80.2%) |
| Health Technologists | 413 (19.7%) | 1,679 (80.3%) |
| Total (Category) | 13,758 (47.7%) | 15,064 (52.3%) |
| Total (Overall) | 24,801 (50.2%) | 24,614 (49.8%) |
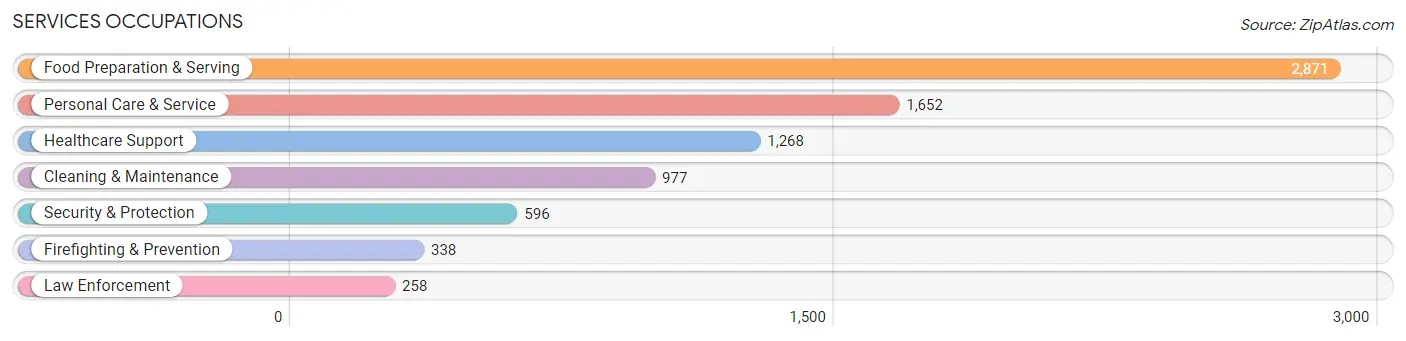
Services Occupations
The most common Services occupations in Tompkins County are Food Preparation & Serving (2,871 | 5.8%), Personal Care & Service (1,652 | 3.3%), Healthcare Support (1,268 | 2.6%), Cleaning & Maintenance (977 | 2.0%), and Security & Protection (596 | 1.2%).
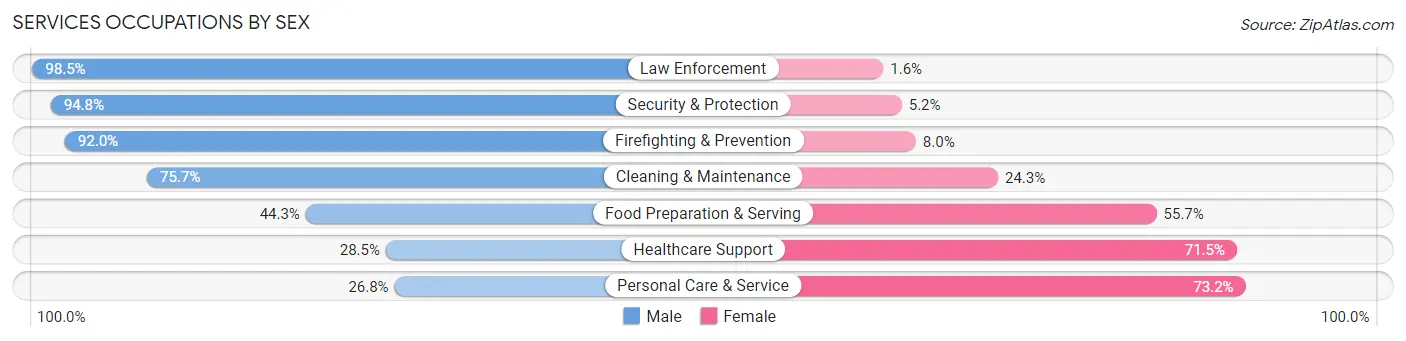
Services Occupations by Sex
Within the Services occupations in Tompkins County, the most male-oriented occupations are Law Enforcement (98.5%), Security & Protection (94.8%), and Firefighting & Prevention (92.0%), while the most female-oriented occupations are Personal Care & Service (73.2%), Healthcare Support (71.5%), and Food Preparation & Serving (55.7%).
| Occupation | Male | Female |
| Healthcare Support | 361 (28.5%) | 907 (71.5%) |
| Security & Protection | 565 (94.8%) | 31 (5.2%) |
| Firefighting & Prevention | 311 (92.0%) | 27 (8.0%) |
| Law Enforcement | 254 (98.5%) | 4 (1.5%) |
| Food Preparation & Serving | 1,273 (44.3%) | 1,598 (55.7%) |
| Cleaning & Maintenance | 740 (75.7%) | 237 (24.3%) |
| Personal Care & Service | 442 (26.8%) | 1,210 (73.2%) |
| Total (Category) | 3,381 (45.9%) | 3,983 (54.1%) |
| Total (Overall) | 24,801 (50.2%) | 24,614 (49.8%) |
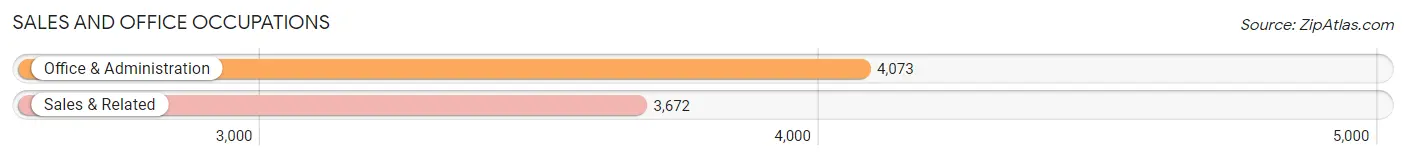
Sales and Office Occupations
The most common Sales and Office occupations in Tompkins County are Office & Administration (4,073 | 8.2%), and Sales & Related (3,672 | 7.4%).
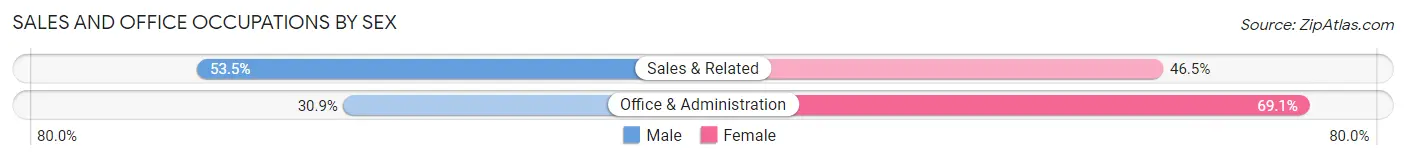
Sales and Office Occupations by Sex
| Occupation | Male | Female |
| Sales & Related | 1,963 (53.5%) | 1,709 (46.5%) |
| Office & Administration | 1,259 (30.9%) | 2,814 (69.1%) |
| Total (Category) | 3,222 (41.6%) | 4,523 (58.4%) |
| Total (Overall) | 24,801 (50.2%) | 24,614 (49.8%) |
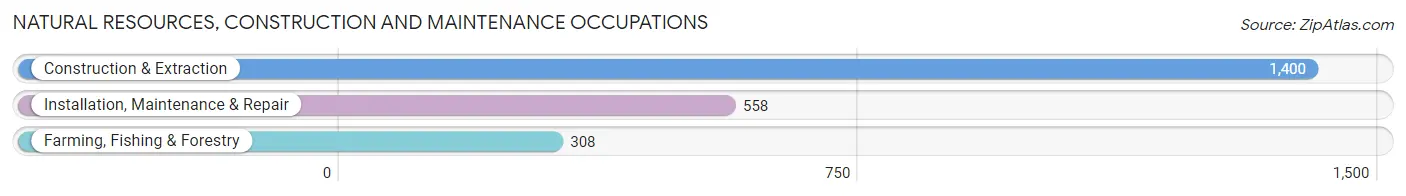
Natural Resources, Construction and Maintenance Occupations
The most common Natural Resources, Construction and Maintenance occupations in Tompkins County are Construction & Extraction (1,400 | 2.8%), Installation, Maintenance & Repair (558 | 1.1%), and Farming, Fishing & Forestry (308 | 0.6%).
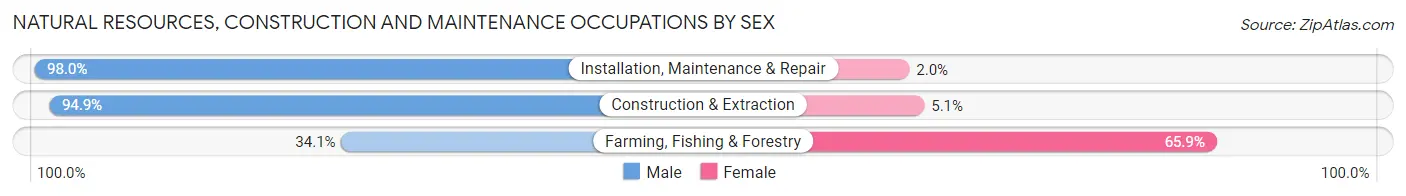
Natural Resources, Construction and Maintenance Occupations by Sex
| Occupation | Male | Female |
| Farming, Fishing & Forestry | 105 (34.1%) | 203 (65.9%) |
| Construction & Extraction | 1,329 (94.9%) | 71 (5.1%) |
| Installation, Maintenance & Repair | 547 (98.0%) | 11 (2.0%) |
| Total (Category) | 1,981 (87.4%) | 285 (12.6%) |
| Total (Overall) | 24,801 (50.2%) | 24,614 (49.8%) |
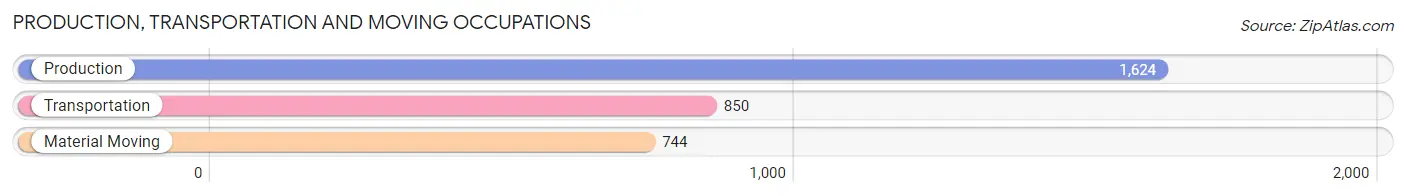
Production, Transportation and Moving Occupations
The most common Production, Transportation and Moving occupations in Tompkins County are Production (1,624 | 3.3%), Transportation (850 | 1.7%), and Material Moving (744 | 1.5%).
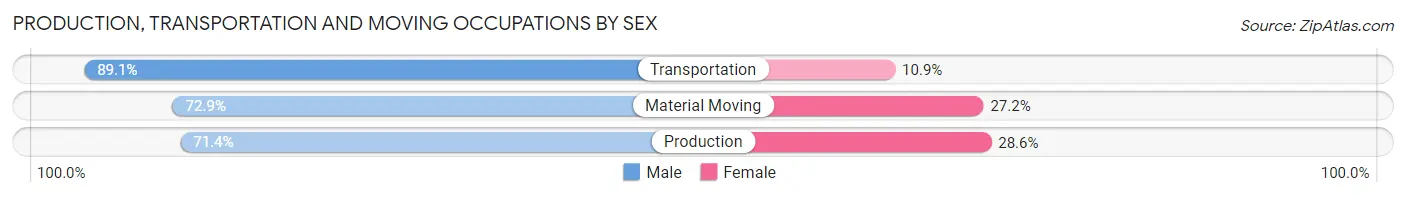
Production, Transportation and Moving Occupations by Sex
| Occupation | Male | Female |
| Production | 1,160 (71.4%) | 464 (28.6%) |
| Transportation | 757 (89.1%) | 93 (10.9%) |
| Material Moving | 542 (72.9%) | 202 (27.2%) |
| Total (Category) | 2,459 (76.4%) | 759 (23.6%) |
| Total (Overall) | 24,801 (50.2%) | 24,614 (49.8%) |
Employment Industries by Sex in Tompkins County
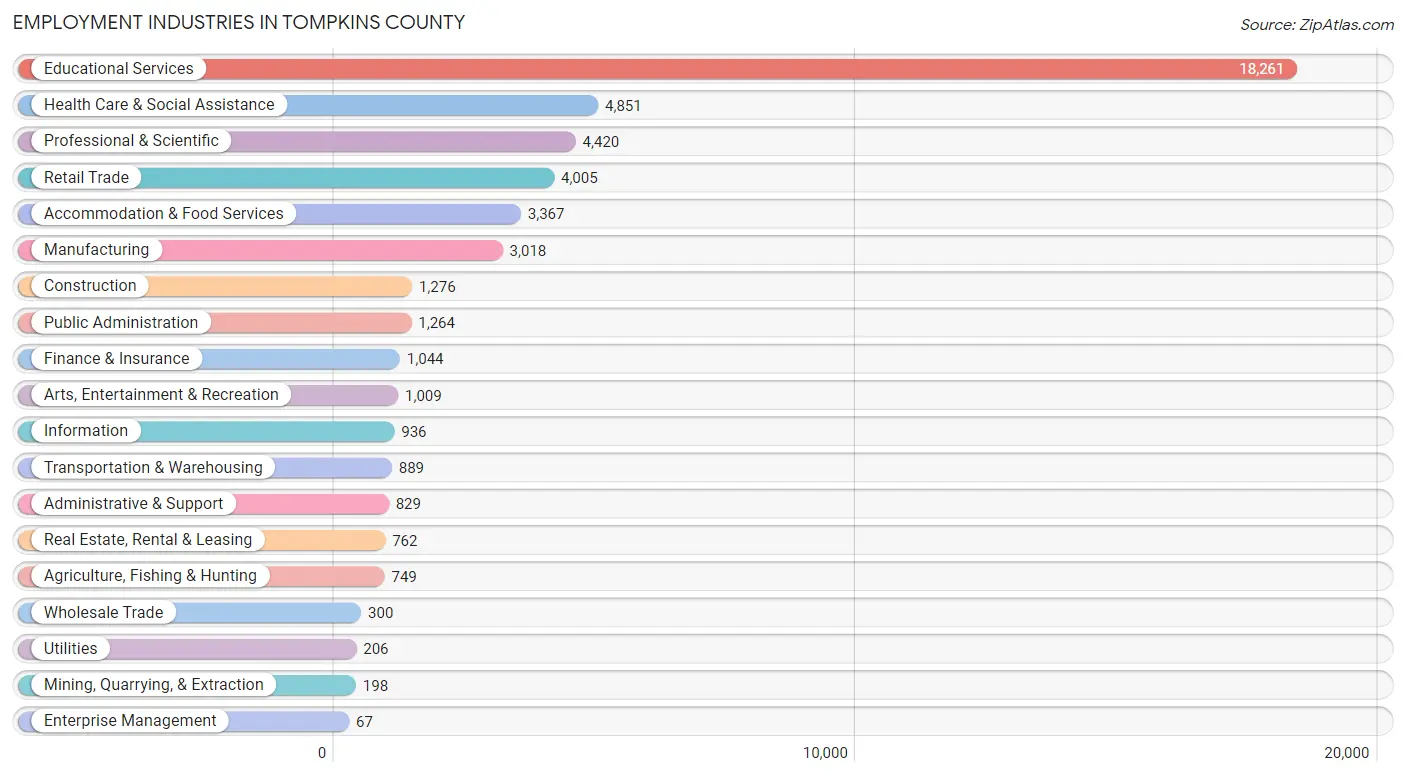
Employment Industries in Tompkins County
The major employment industries in Tompkins County include Educational Services (18,261 | 36.9%), Health Care & Social Assistance (4,851 | 9.8%), Professional & Scientific (4,420 | 8.9%), Retail Trade (4,005 | 8.1%), and Accommodation & Food Services (3,367 | 6.8%).
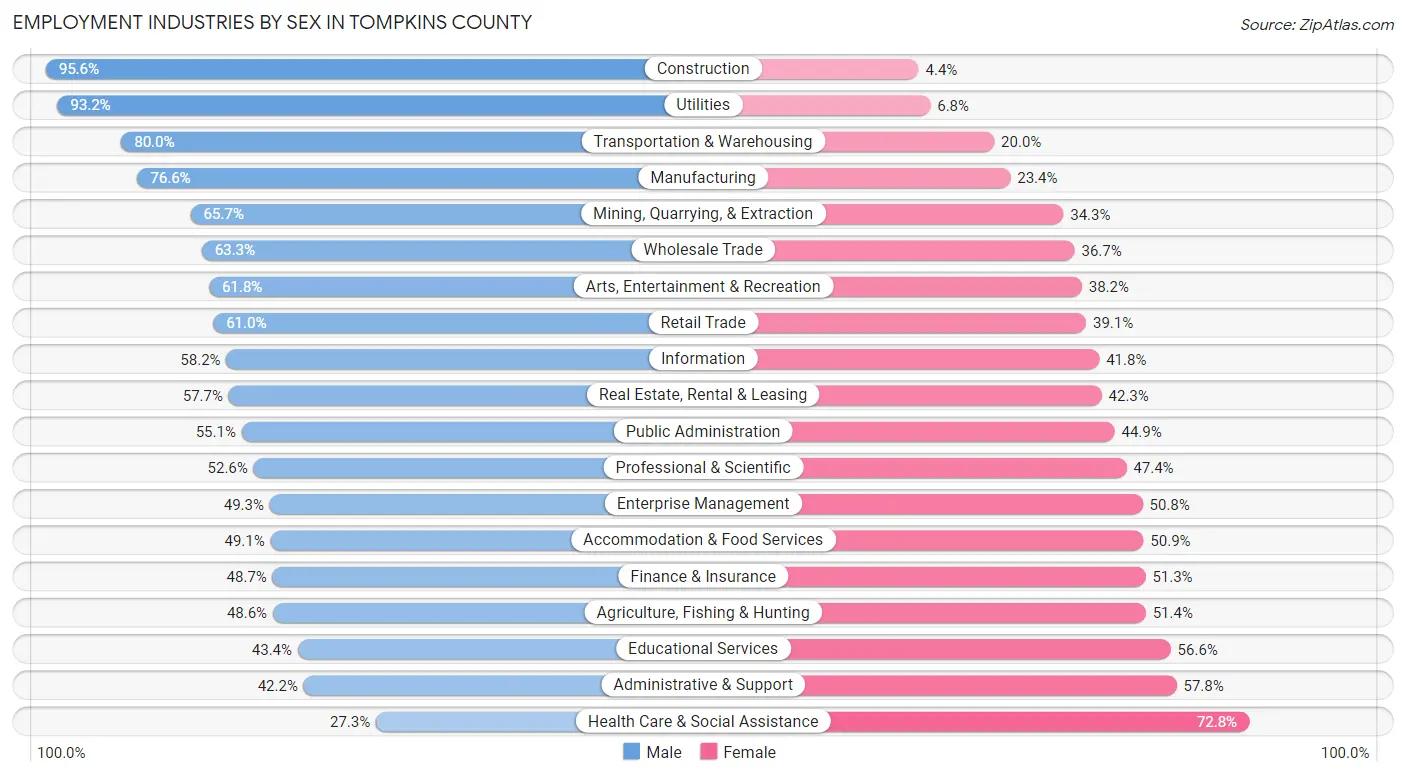
Employment Industries by Sex in Tompkins County
The Tompkins County industries that see more men than women are Construction (95.6%), Utilities (93.2%), and Transportation & Warehousing (80.0%), whereas the industries that tend to have a higher number of women are Health Care & Social Assistance (72.8%), Administrative & Support (57.8%), and Educational Services (56.6%).
| Industry | Male | Female |
| Agriculture, Fishing & Hunting | 364 (48.6%) | 385 (51.4%) |
| Mining, Quarrying, & Extraction | 130 (65.7%) | 68 (34.3%) |
| Construction | 1,220 (95.6%) | 56 (4.4%) |
| Manufacturing | 2,313 (76.6%) | 705 (23.4%) |
| Wholesale Trade | 190 (63.3%) | 110 (36.7%) |
| Retail Trade | 2,441 (61.0%) | 1,564 (39.1%) |
| Transportation & Warehousing | 711 (80.0%) | 178 (20.0%) |
| Utilities | 192 (93.2%) | 14 (6.8%) |
| Information | 545 (58.2%) | 391 (41.8%) |
| Finance & Insurance | 508 (48.7%) | 536 (51.3%) |
| Real Estate, Rental & Leasing | 440 (57.7%) | 322 (42.3%) |
| Professional & Scientific | 2,325 (52.6%) | 2,095 (47.4%) |
| Enterprise Management | 33 (49.2%) | 34 (50.7%) |
| Administrative & Support | 350 (42.2%) | 479 (57.8%) |
| Educational Services | 7,932 (43.4%) | 10,329 (56.6%) |
| Health Care & Social Assistance | 1,322 (27.3%) | 3,529 (72.8%) |
| Arts, Entertainment & Recreation | 624 (61.8%) | 385 (38.2%) |
| Accommodation & Food Services | 1,653 (49.1%) | 1,714 (50.9%) |
| Public Administration | 696 (55.1%) | 568 (44.9%) |
| Total | 24,801 (50.2%) | 24,614 (49.8%) |
Education in Tompkins County
School Enrollment in Tompkins County
The most common levels of schooling among the 39,567 students in Tompkins County are college / undergraduate (20,927 | 52.9%), graduate / professional (6,485 | 16.4%), and high school (3,476 | 8.8%).
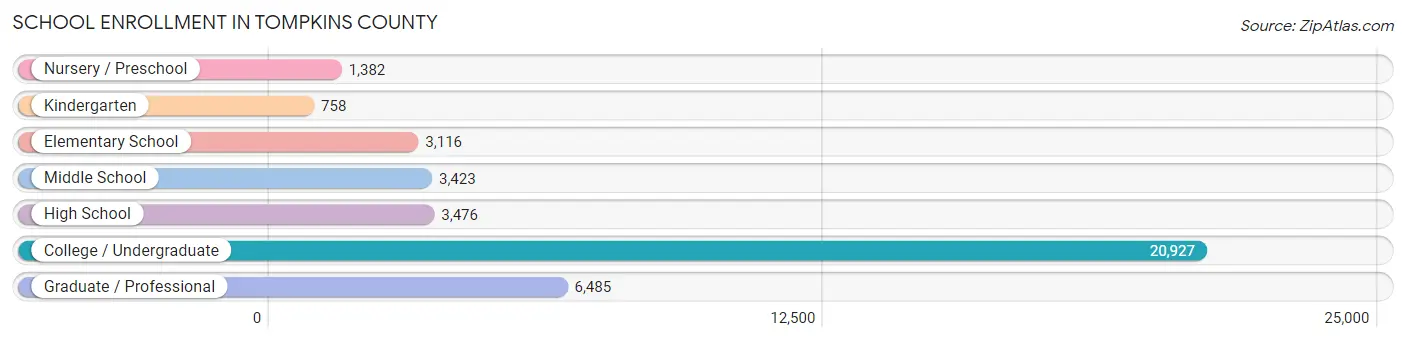
| School Level | # Students | % Students |
| Nursery / Preschool | 1,382 | 3.5% |
| Kindergarten | 758 | 1.9% |
| Elementary School | 3,116 | 7.9% |
| Middle School | 3,423 | 8.6% |
| High School | 3,476 | 8.8% |
| College / Undergraduate | 20,927 | 52.9% |
| Graduate / Professional | 6,485 | 16.4% |
| Total | 39,567 | 100.0% |
School Enrollment by Age by Funding Source in Tompkins County
Out of a total of 39,567 students who are enrolled in schools in Tompkins County, 24,888 (62.9%) attend a private institution, while the remaining 14,679 (37.1%) are enrolled in public schools. The age group of 18 to 19 year olds has the highest likelihood of being enrolled in private schools, with 8,655 (91.3% in the age bracket) enrolled. Conversely, the age group of 10 to 14 year olds has the lowest likelihood of being enrolled in a private school, with 3,736 (89.4% in the age bracket) attending a public institution.
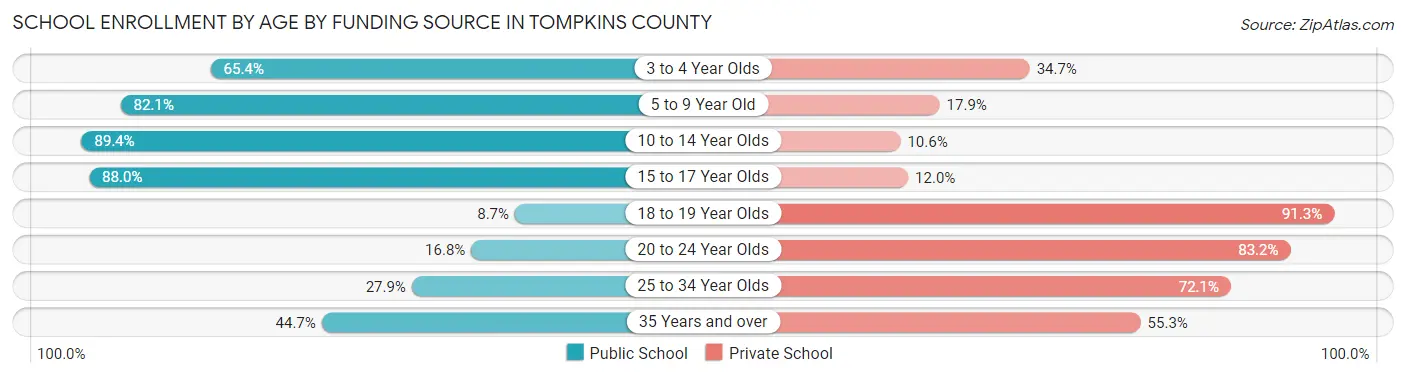
| Age Bracket | Public School | Private School |
| 3 to 4 Year Olds | 775 (65.3%) | 411 (34.6%) |
| 5 to 9 Year Old | 3,196 (82.1%) | 696 (17.9%) |
| 10 to 14 Year Olds | 3,736 (89.4%) | 442 (10.6%) |
| 15 to 17 Year Olds | 2,373 (88.0%) | 324 (12.0%) |
| 18 to 19 Year Olds | 823 (8.7%) | 8,655 (91.3%) |
| 20 to 24 Year Olds | 2,207 (16.8%) | 10,918 (83.2%) |
| 25 to 34 Year Olds | 1,112 (27.9%) | 2,874 (72.1%) |
| 35 Years and over | 458 (44.7%) | 567 (55.3%) |
| Total | 14,679 (37.1%) | 24,888 (62.9%) |
Educational Attainment by Field of Study in Tompkins County
Bio, nature & agricultural (5,146 | 13.0%), social sciences (4,604 | 11.6%), engineering (3,454 | 8.7%), literature & languages (3,223 | 8.1%), and science & technology (3,053 | 7.7%) are the most common fields of study among 39,636 individuals in Tompkins County who have obtained a bachelor's degree or higher.
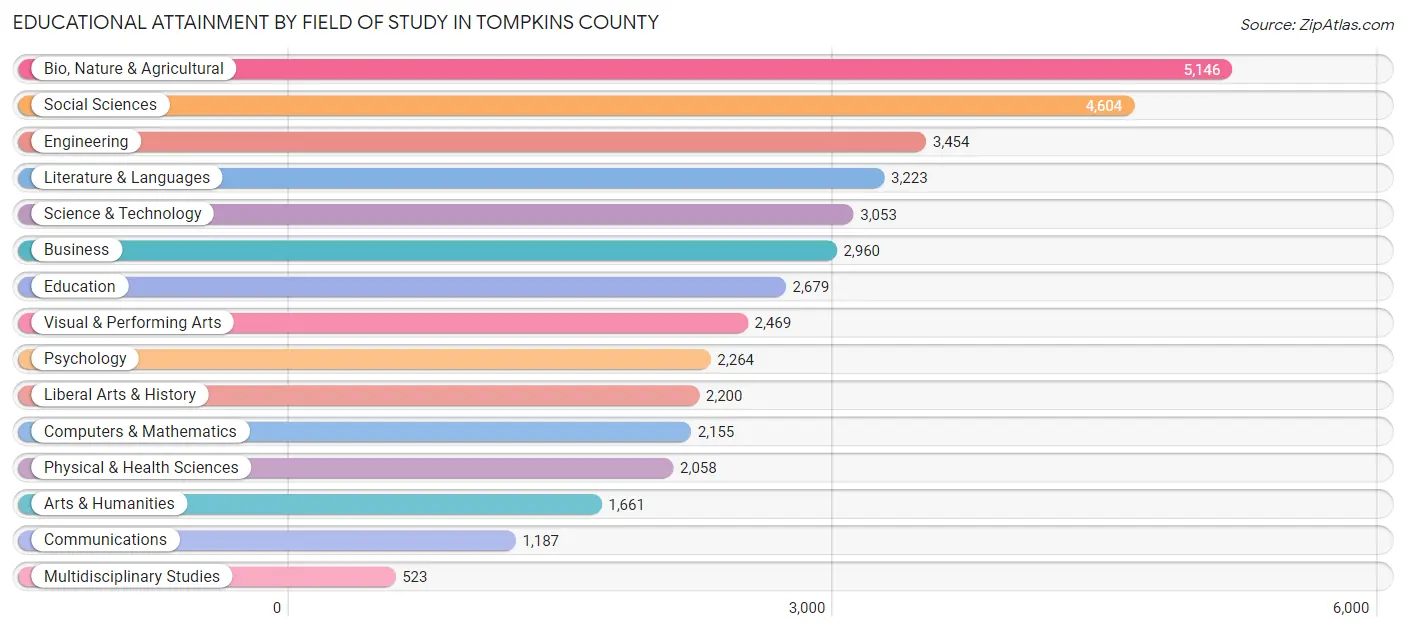
| Field of Study | # Graduates | % Graduates |
| Computers & Mathematics | 2,155 | 5.4% |
| Bio, Nature & Agricultural | 5,146 | 13.0% |
| Physical & Health Sciences | 2,058 | 5.2% |
| Psychology | 2,264 | 5.7% |
| Social Sciences | 4,604 | 11.6% |
| Engineering | 3,454 | 8.7% |
| Multidisciplinary Studies | 523 | 1.3% |
| Science & Technology | 3,053 | 7.7% |
| Business | 2,960 | 7.5% |
| Education | 2,679 | 6.8% |
| Literature & Languages | 3,223 | 8.1% |
| Liberal Arts & History | 2,200 | 5.6% |
| Visual & Performing Arts | 2,469 | 6.2% |
| Communications | 1,187 | 3.0% |
| Arts & Humanities | 1,661 | 4.2% |
| Total | 39,636 | 100.0% |
Transportation & Commute in Tompkins County
Vehicle Availability by Sex in Tompkins County
The most prevalent vehicle ownership categories in Tompkins County are males with 2 vehicles (9,882, accounting for 43.1%) and females with 2 vehicles (9,260, making up 44.4%).
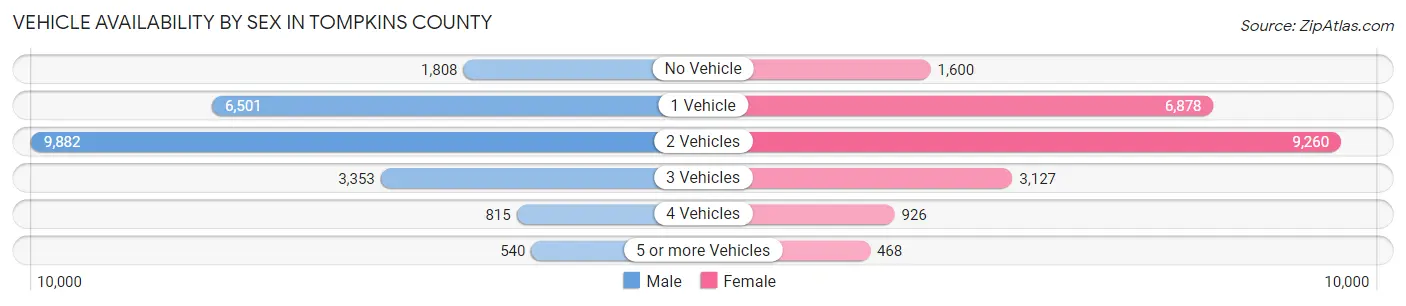
| Vehicles Available | Male | Female |
| No Vehicle | 1,808 (7.9%) | 1,600 (7.2%) |
| 1 Vehicle | 6,501 (28.4%) | 6,878 (30.9%) |
| 2 Vehicles | 9,882 (43.1%) | 9,260 (41.6%) |
| 3 Vehicles | 3,353 (14.6%) | 3,127 (14.1%) |
| 4 Vehicles | 815 (3.6%) | 926 (4.2%) |
| 5 or more Vehicles | 540 (2.4%) | 468 (2.1%) |
| Total | 22,899 (100.0%) | 22,259 (100.0%) |
Commute Time in Tompkins County
The most frequently occuring commute durations in Tompkins County are 15 to 19 minutes (8,592 commuters, 21.2%), 10 to 14 minutes (8,116 commuters, 20.0%), and 20 to 24 minutes (6,824 commuters, 16.8%).
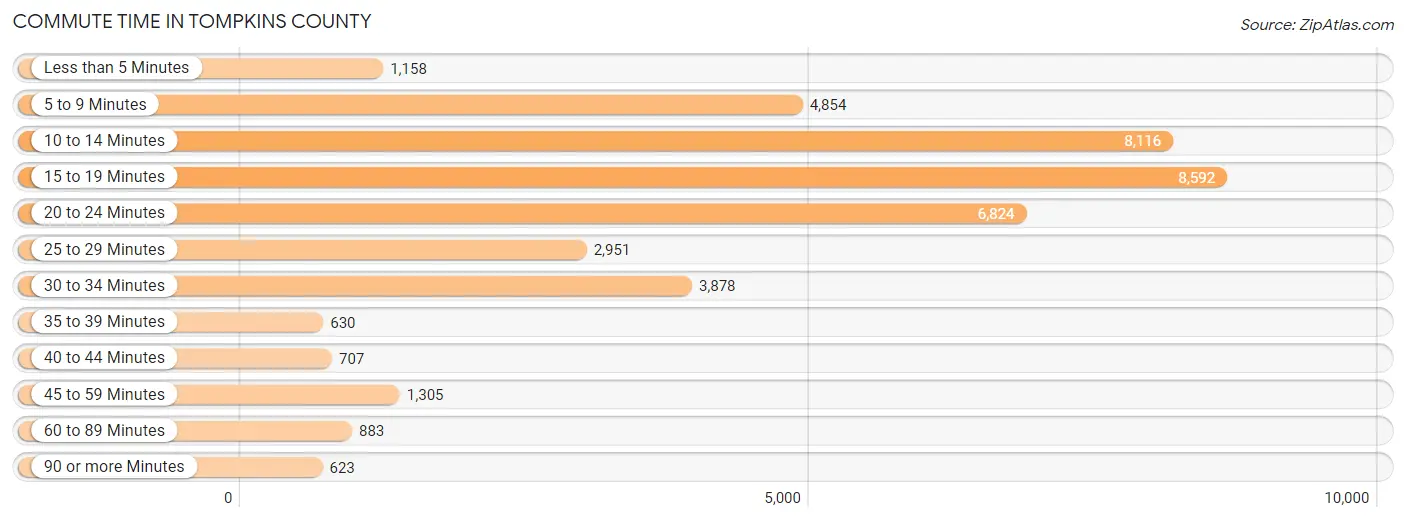
| Commute Time | # Commuters | % Commuters |
| Less than 5 Minutes | 1,158 | 2.9% |
| 5 to 9 Minutes | 4,854 | 12.0% |
| 10 to 14 Minutes | 8,116 | 20.0% |
| 15 to 19 Minutes | 8,592 | 21.2% |
| 20 to 24 Minutes | 6,824 | 16.8% |
| 25 to 29 Minutes | 2,951 | 7.3% |
| 30 to 34 Minutes | 3,878 | 9.6% |
| 35 to 39 Minutes | 630 | 1.5% |
| 40 to 44 Minutes | 707 | 1.7% |
| 45 to 59 Minutes | 1,305 | 3.2% |
| 60 to 89 Minutes | 883 | 2.2% |
| 90 or more Minutes | 623 | 1.5% |
Commute Time by Sex in Tompkins County
The most common commute times in Tompkins County are 15 to 19 minutes (4,424 commuters, 21.8%) for males and 15 to 19 minutes (4,168 commuters, 20.6%) for females.
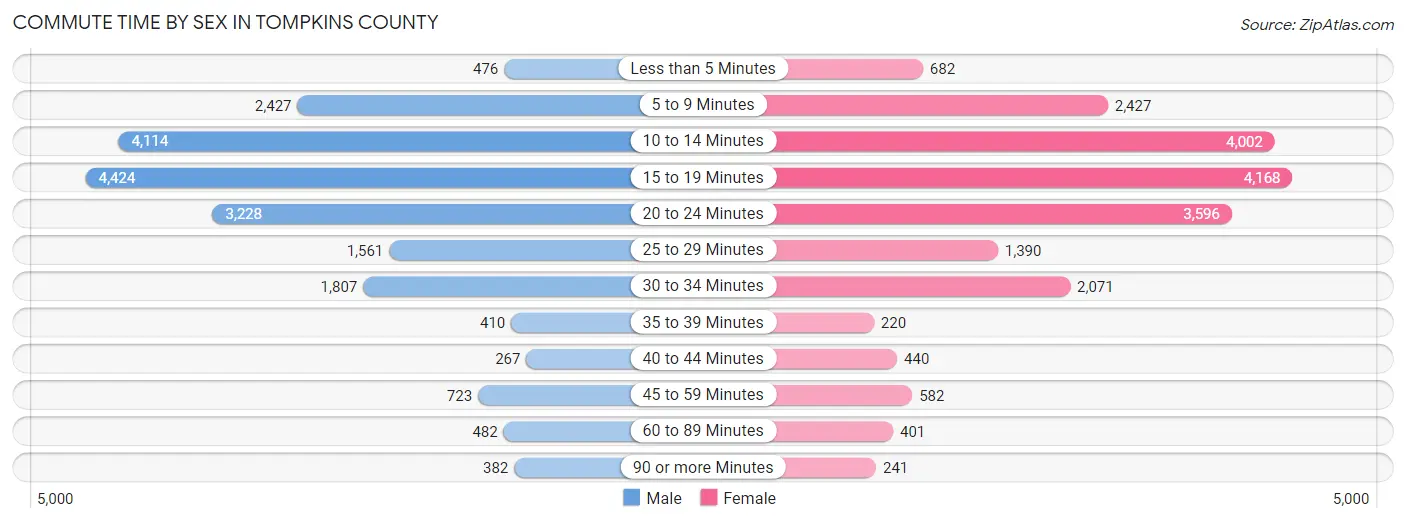
| Commute Time | Male | Female |
| Less than 5 Minutes | 476 (2.3%) | 682 (3.4%) |
| 5 to 9 Minutes | 2,427 (12.0%) | 2,427 (12.0%) |
| 10 to 14 Minutes | 4,114 (20.3%) | 4,002 (19.8%) |
| 15 to 19 Minutes | 4,424 (21.8%) | 4,168 (20.6%) |
| 20 to 24 Minutes | 3,228 (15.9%) | 3,596 (17.8%) |
| 25 to 29 Minutes | 1,561 (7.7%) | 1,390 (6.9%) |
| 30 to 34 Minutes | 1,807 (8.9%) | 2,071 (10.2%) |
| 35 to 39 Minutes | 410 (2.0%) | 220 (1.1%) |
| 40 to 44 Minutes | 267 (1.3%) | 440 (2.2%) |
| 45 to 59 Minutes | 723 (3.6%) | 582 (2.9%) |
| 60 to 89 Minutes | 482 (2.4%) | 401 (2.0%) |
| 90 or more Minutes | 382 (1.9%) | 241 (1.2%) |
Time of Departure to Work by Sex in Tompkins County
The most frequent times of departure to work in Tompkins County are 7:30 AM to 7:59 AM (2,873, 14.1%) for males and 8:00 AM to 8:29 AM (3,136, 15.5%) for females.
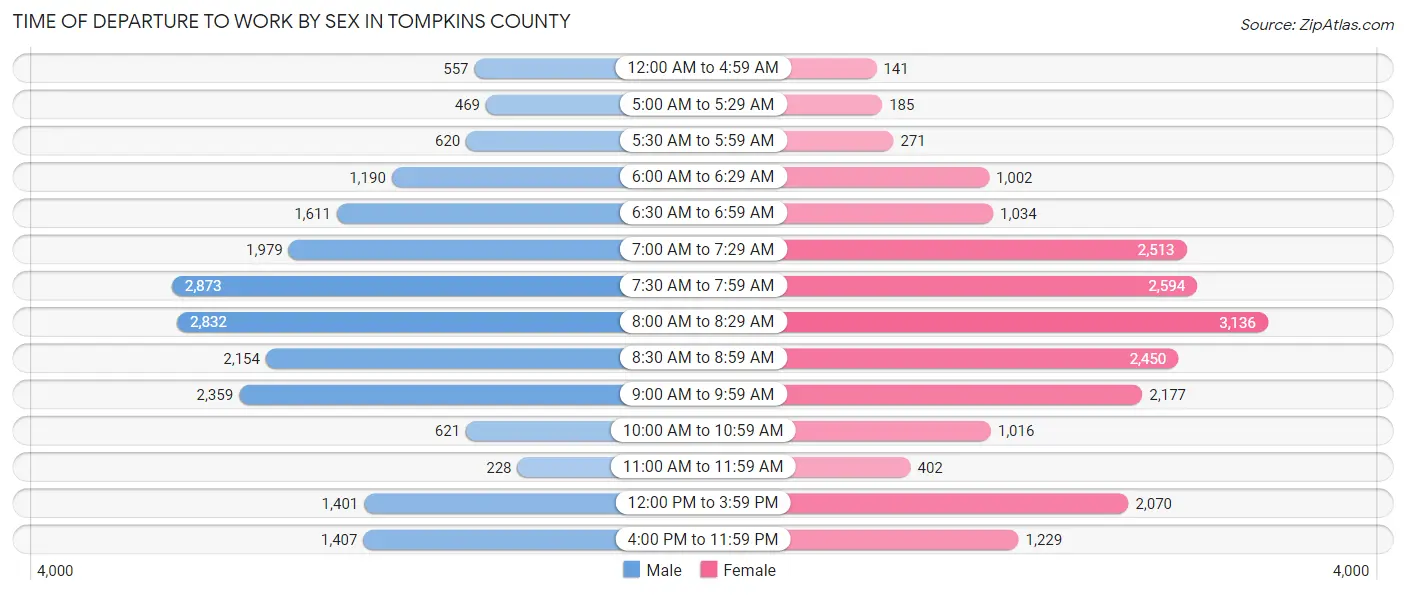
| Time of Departure | Male | Female |
| 12:00 AM to 4:59 AM | 557 (2.7%) | 141 (0.7%) |
| 5:00 AM to 5:29 AM | 469 (2.3%) | 185 (0.9%) |
| 5:30 AM to 5:59 AM | 620 (3.0%) | 271 (1.3%) |
| 6:00 AM to 6:29 AM | 1,190 (5.9%) | 1,002 (5.0%) |
| 6:30 AM to 6:59 AM | 1,611 (7.9%) | 1,034 (5.1%) |
| 7:00 AM to 7:29 AM | 1,979 (9.8%) | 2,513 (12.4%) |
| 7:30 AM to 7:59 AM | 2,873 (14.1%) | 2,594 (12.8%) |
| 8:00 AM to 8:29 AM | 2,832 (14.0%) | 3,136 (15.5%) |
| 8:30 AM to 8:59 AM | 2,154 (10.6%) | 2,450 (12.1%) |
| 9:00 AM to 9:59 AM | 2,359 (11.6%) | 2,177 (10.8%) |
| 10:00 AM to 10:59 AM | 621 (3.1%) | 1,016 (5.0%) |
| 11:00 AM to 11:59 AM | 228 (1.1%) | 402 (2.0%) |
| 12:00 PM to 3:59 PM | 1,401 (6.9%) | 2,070 (10.2%) |
| 4:00 PM to 11:59 PM | 1,407 (6.9%) | 1,229 (6.1%) |
| Total | 20,301 (100.0%) | 20,220 (100.0%) |
Housing Occupancy in Tompkins County
Occupancy by Ownership in Tompkins County
Of the total 42,984 dwellings in Tompkins County, owner-occupied units account for 23,328 (54.3%), while renter-occupied units make up 19,656 (45.7%).
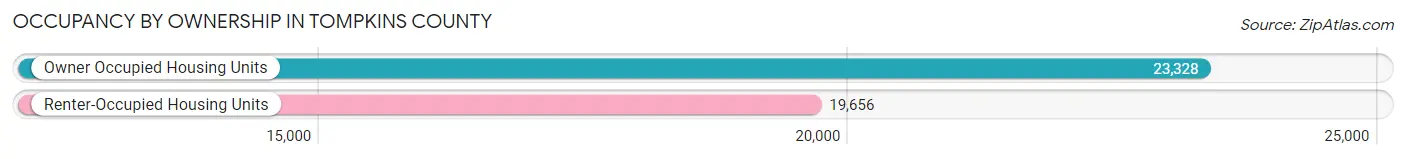
| Occupancy | # Housing Units | % Housing Units |
| Owner Occupied Housing Units | 23,328 | 54.3% |
| Renter-Occupied Housing Units | 19,656 | 45.7% |
| Total Occupied Housing Units | 42,984 | 100.0% |
Occupancy by Household Size in Tompkins County
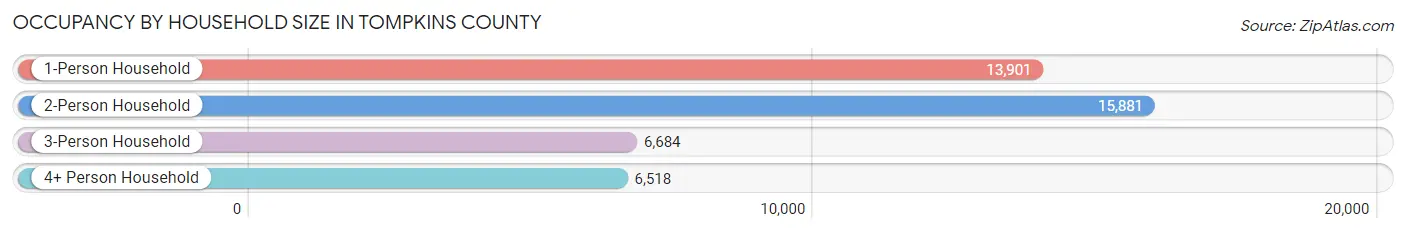
| Household Size | # Housing Units | % Housing Units |
| 1-Person Household | 13,901 | 32.3% |
| 2-Person Household | 15,881 | 36.9% |
| 3-Person Household | 6,684 | 15.5% |
| 4+ Person Household | 6,518 | 15.2% |
| Total Housing Units | 42,984 | 100.0% |
Occupancy by Ownership by Household Size in Tompkins County
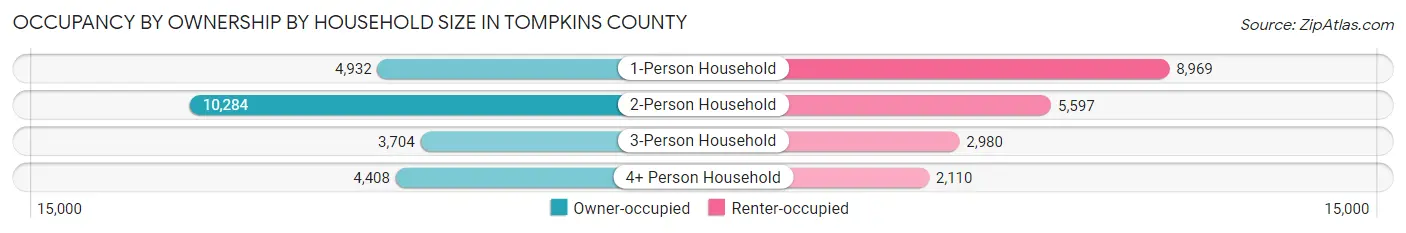
| Household Size | Owner-occupied | Renter-occupied |
| 1-Person Household | 4,932 (35.5%) | 8,969 (64.5%) |
| 2-Person Household | 10,284 (64.8%) | 5,597 (35.2%) |
| 3-Person Household | 3,704 (55.4%) | 2,980 (44.6%) |
| 4+ Person Household | 4,408 (67.6%) | 2,110 (32.4%) |
| Total Housing Units | 23,328 (54.3%) | 19,656 (45.7%) |
Occupancy by Educational Attainment in Tompkins County
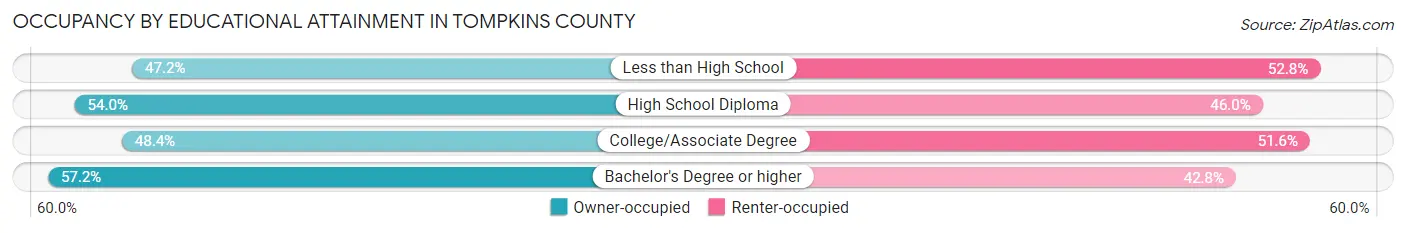
| Household Size | Owner-occupied | Renter-occupied |
| Less than High School | 591 (47.2%) | 661 (52.8%) |
| High School Diploma | 3,351 (54.0%) | 2,850 (46.0%) |
| College/Associate Degree | 5,203 (48.4%) | 5,543 (51.6%) |
| Bachelor's Degree or higher | 14,183 (57.2%) | 10,602 (42.8%) |
Occupancy by Age of Householder in Tompkins County
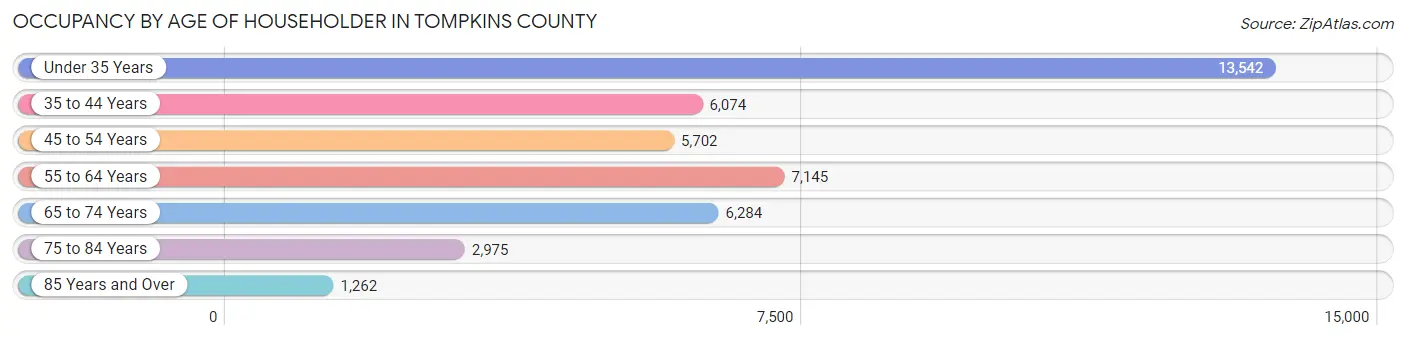
| Age Bracket | # Households | % Households |
| Under 35 Years | 13,542 | 31.5% |
| 35 to 44 Years | 6,074 | 14.1% |
| 45 to 54 Years | 5,702 | 13.3% |
| 55 to 64 Years | 7,145 | 16.6% |
| 65 to 74 Years | 6,284 | 14.6% |
| 75 to 84 Years | 2,975 | 6.9% |
| 85 Years and Over | 1,262 | 2.9% |
| Total | 42,984 | 100.0% |
Housing Finances in Tompkins County
Median Income by Occupancy in Tompkins County
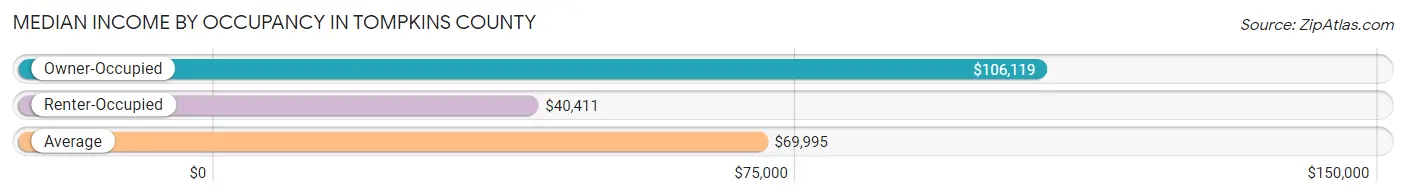
| Occupancy Type | # Households | Median Income |
| Owner-Occupied | 23,328 (54.3%) | $106,119 |
| Renter-Occupied | 19,656 (45.7%) | $40,411 |
| Average | 42,984 (100.0%) | $69,995 |
Occupancy by Householder Income Bracket in Tompkins County
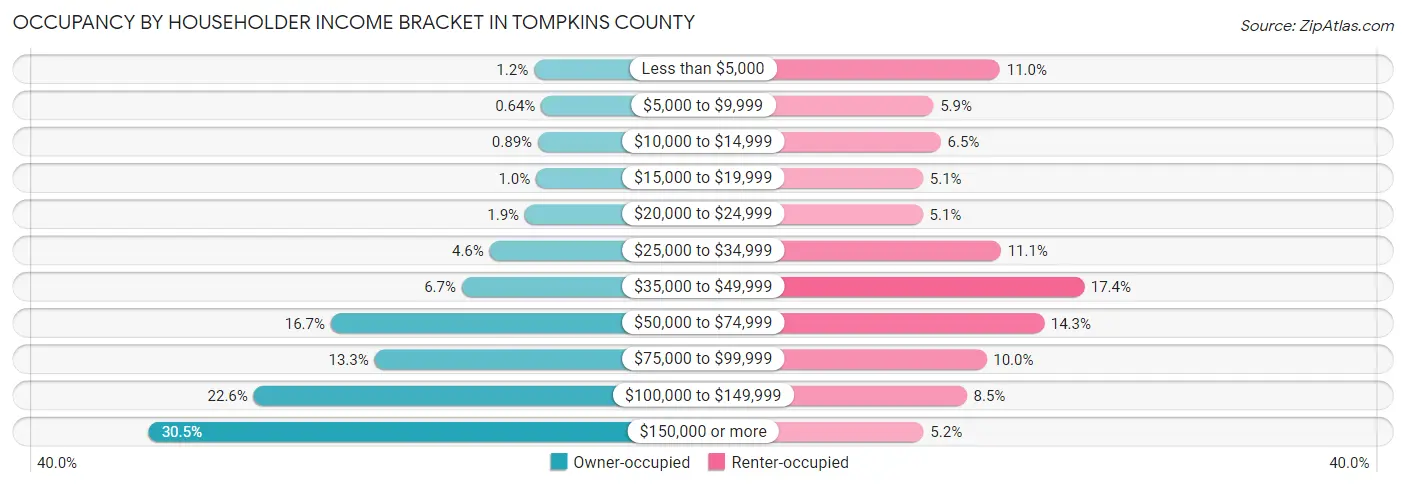
| Income Bracket | Owner-occupied | Renter-occupied |
| Less than $5,000 | 277 (1.2%) | 2,160 (11.0%) |
| $5,000 to $9,999 | 149 (0.6%) | 1,164 (5.9%) |
| $10,000 to $14,999 | 208 (0.9%) | 1,274 (6.5%) |
| $15,000 to $19,999 | 241 (1.0%) | 1,008 (5.1%) |
| $20,000 to $24,999 | 438 (1.9%) | 1,004 (5.1%) |
| $25,000 to $34,999 | 1,067 (4.6%) | 2,174 (11.1%) |
| $35,000 to $49,999 | 1,561 (6.7%) | 3,419 (17.4%) |
| $50,000 to $74,999 | 3,889 (16.7%) | 2,818 (14.3%) |
| $75,000 to $99,999 | 3,112 (13.3%) | 1,957 (10.0%) |
| $100,000 to $149,999 | 5,261 (22.6%) | 1,662 (8.5%) |
| $150,000 or more | 7,125 (30.5%) | 1,016 (5.2%) |
| Total | 23,328 (100.0%) | 19,656 (100.0%) |
Monthly Housing Cost Tiers in Tompkins County
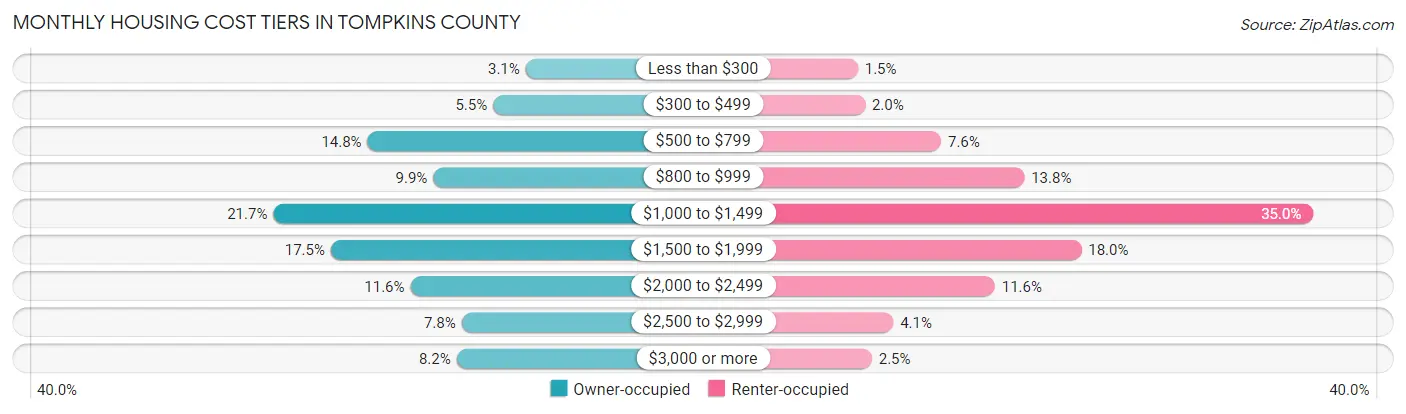
| Monthly Cost | Owner-occupied | Renter-occupied |
| Less than $300 | 723 (3.1%) | 294 (1.5%) |
| $300 to $499 | 1,282 (5.5%) | 399 (2.0%) |
| $500 to $799 | 3,441 (14.7%) | 1,500 (7.6%) |
| $800 to $999 | 2,312 (9.9%) | 2,704 (13.8%) |
| $1,000 to $1,499 | 5,060 (21.7%) | 6,887 (35.0%) |
| $1,500 to $1,999 | 4,071 (17.4%) | 3,531 (18.0%) |
| $2,000 to $2,499 | 2,704 (11.6%) | 2,278 (11.6%) |
| $2,500 to $2,999 | 1,824 (7.8%) | 808 (4.1%) |
| $3,000 or more | 1,911 (8.2%) | 497 (2.5%) |
| Total | 23,328 (100.0%) | 19,656 (100.0%) |
Physical Housing Characteristics in Tompkins County
Housing Structures in Tompkins County
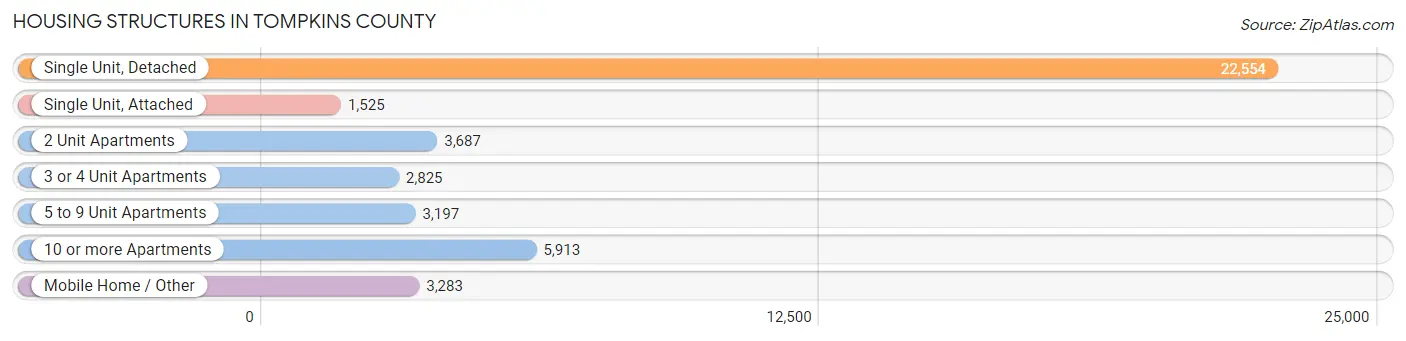
| Structure Type | # Housing Units | % Housing Units |
| Single Unit, Detached | 22,554 | 52.5% |
| Single Unit, Attached | 1,525 | 3.5% |
| 2 Unit Apartments | 3,687 | 8.6% |
| 3 or 4 Unit Apartments | 2,825 | 6.6% |
| 5 to 9 Unit Apartments | 3,197 | 7.4% |
| 10 or more Apartments | 5,913 | 13.8% |
| Mobile Home / Other | 3,283 | 7.6% |
| Total | 42,984 | 100.0% |
Housing Structures by Occupancy in Tompkins County
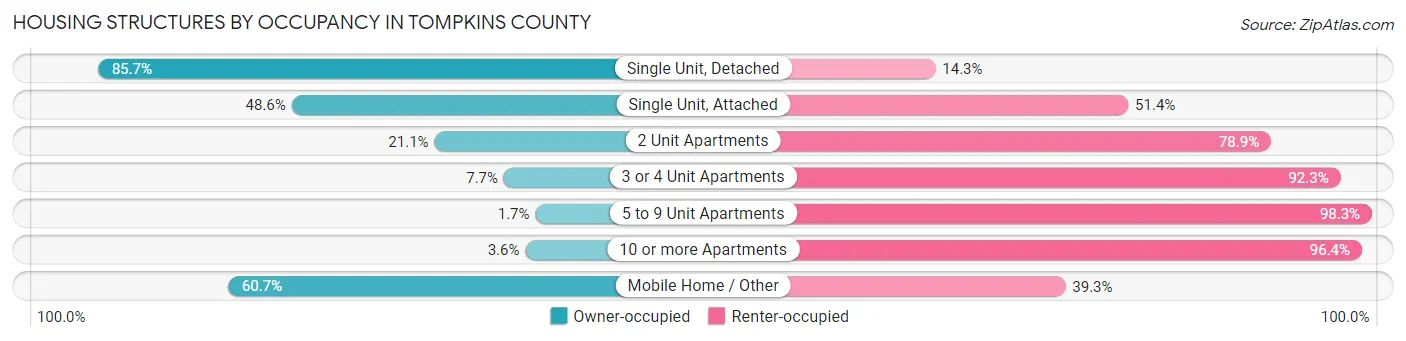
| Structure Type | Owner-occupied | Renter-occupied |
| Single Unit, Detached | 19,333 (85.7%) | 3,221 (14.3%) |
| Single Unit, Attached | 741 (48.6%) | 784 (51.4%) |
| 2 Unit Apartments | 778 (21.1%) | 2,909 (78.9%) |
| 3 or 4 Unit Apartments | 218 (7.7%) | 2,607 (92.3%) |
| 5 to 9 Unit Apartments | 53 (1.7%) | 3,144 (98.3%) |
| 10 or more Apartments | 213 (3.6%) | 5,700 (96.4%) |
| Mobile Home / Other | 1,992 (60.7%) | 1,291 (39.3%) |
| Total | 23,328 (54.3%) | 19,656 (45.7%) |
Housing Structures by Number of Rooms in Tompkins County
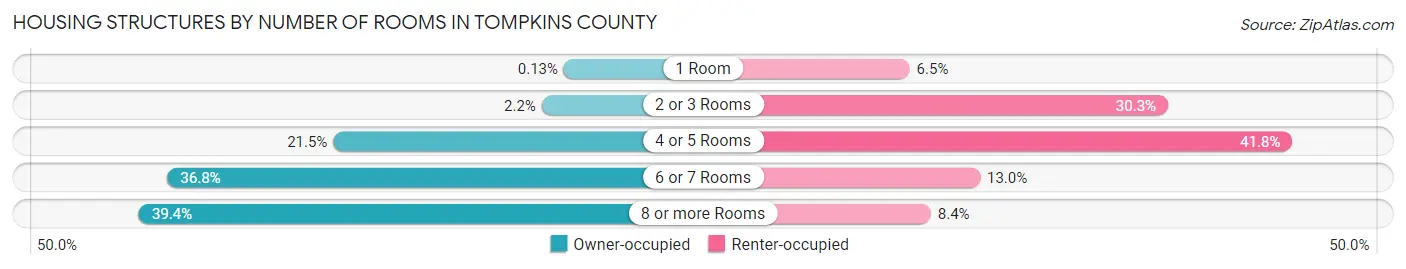
| Number of Rooms | Owner-occupied | Renter-occupied |
| 1 Room | 31 (0.1%) | 1,267 (6.5%) |
| 2 or 3 Rooms | 508 (2.2%) | 5,962 (30.3%) |
| 4 or 5 Rooms | 5,007 (21.5%) | 8,225 (41.8%) |
| 6 or 7 Rooms | 8,583 (36.8%) | 2,548 (13.0%) |
| 8 or more Rooms | 9,199 (39.4%) | 1,654 (8.4%) |
| Total | 23,328 (100.0%) | 19,656 (100.0%) |
Housing Structure by Heating Type in Tompkins County
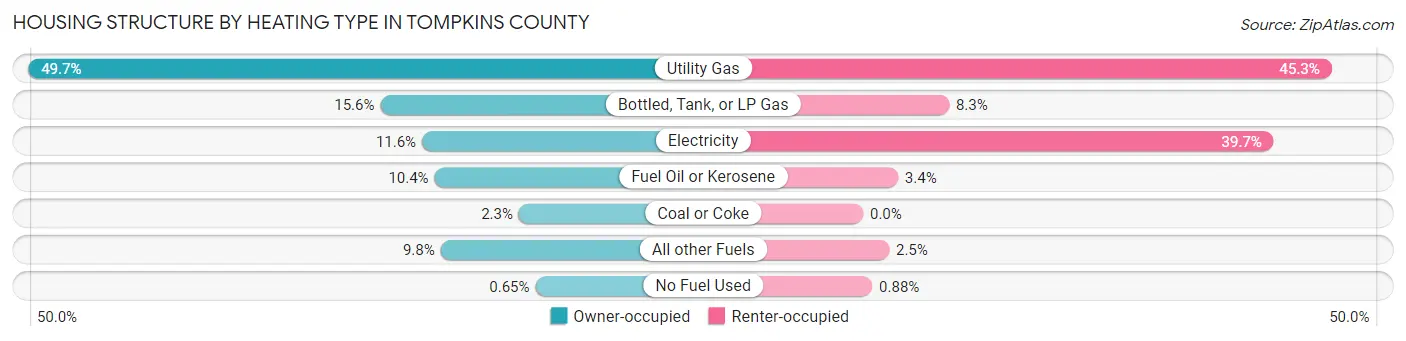
| Heating Type | Owner-occupied | Renter-occupied |
| Utility Gas | 11,582 (49.6%) | 8,899 (45.3%) |
| Bottled, Tank, or LP Gas | 3,646 (15.6%) | 1,631 (8.3%) |
| Electricity | 2,708 (11.6%) | 7,797 (39.7%) |
| Fuel Oil or Kerosene | 2,427 (10.4%) | 663 (3.4%) |
| Coal or Coke | 526 (2.2%) | 0 (0.0%) |
| All other Fuels | 2,288 (9.8%) | 494 (2.5%) |
| No Fuel Used | 151 (0.6%) | 172 (0.9%) |
| Total | 23,328 (100.0%) | 19,656 (100.0%) |
Household Vehicle Usage in Tompkins County
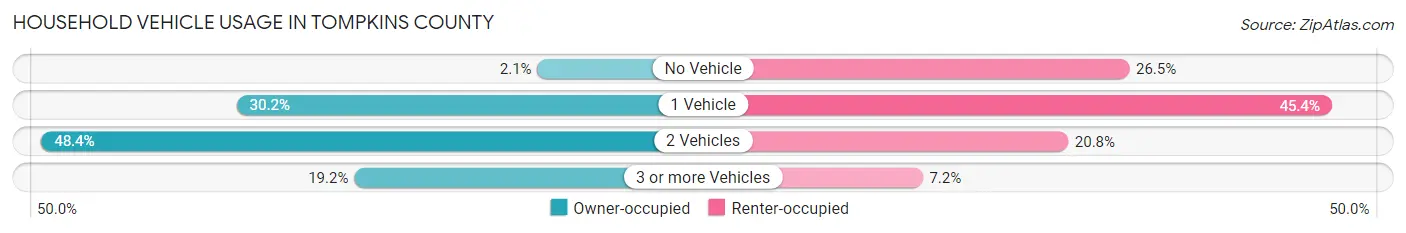
| Vehicles per Household | Owner-occupied | Renter-occupied |
| No Vehicle | 496 (2.1%) | 5,212 (26.5%) |
| 1 Vehicle | 7,046 (30.2%) | 8,931 (45.4%) |
| 2 Vehicles | 11,300 (48.4%) | 4,090 (20.8%) |
| 3 or more Vehicles | 4,486 (19.2%) | 1,423 (7.2%) |
| Total | 23,328 (100.0%) | 19,656 (100.0%) |
Real Estate & Mortgages in Tompkins County
Real Estate and Mortgage Overview in Tompkins County
| Characteristic | Without Mortgage | With Mortgage |
| Housing Units | 10,387 | 12,941 |
| Median Property Value | $251,600 | $271,800 |
| Median Household Income | $80,414 | $4,594 |
| Monthly Housing Costs | $808 | $1,854 |
| Real Estate Taxes | $5,905 | $180 |
Property Value by Mortgage Status in Tompkins County
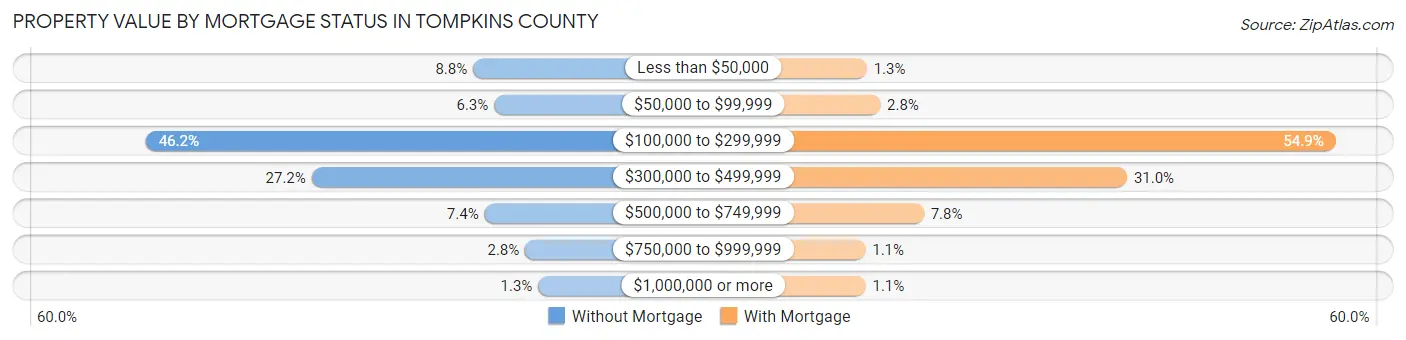
| Property Value | Without Mortgage | With Mortgage |
| Less than $50,000 | 909 (8.7%) | 165 (1.3%) |
| $50,000 to $99,999 | 659 (6.3%) | 363 (2.8%) |
| $100,000 to $299,999 | 4,794 (46.2%) | 7,099 (54.9%) |
| $300,000 to $499,999 | 2,825 (27.2%) | 4,014 (31.0%) |
| $500,000 to $749,999 | 773 (7.4%) | 1,008 (7.8%) |
| $750,000 to $999,999 | 291 (2.8%) | 144 (1.1%) |
| $1,000,000 or more | 136 (1.3%) | 148 (1.1%) |
| Total | 10,387 (100.0%) | 12,941 (100.0%) |
Household Income by Mortgage Status in Tompkins County
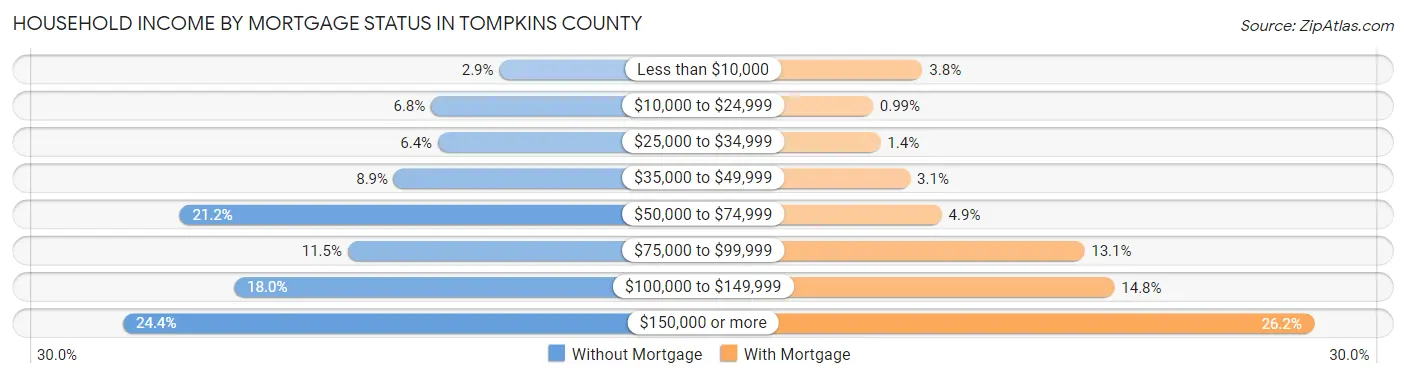
| Household Income | Without Mortgage | With Mortgage |
| Less than $10,000 | 298 (2.9%) | 494 (3.8%) |
| $10,000 to $24,999 | 703 (6.8%) | 128 (1.0%) |
| $25,000 to $34,999 | 663 (6.4%) | 184 (1.4%) |
| $35,000 to $49,999 | 924 (8.9%) | 404 (3.1%) |
| $50,000 to $74,999 | 2,197 (21.1%) | 637 (4.9%) |
| $75,000 to $99,999 | 1,198 (11.5%) | 1,692 (13.1%) |
| $100,000 to $149,999 | 1,873 (18.0%) | 1,914 (14.8%) |
| $150,000 or more | 2,531 (24.4%) | 3,388 (26.2%) |
| Total | 10,387 (100.0%) | 12,941 (100.0%) |
Property Value to Household Income Ratio in Tompkins County
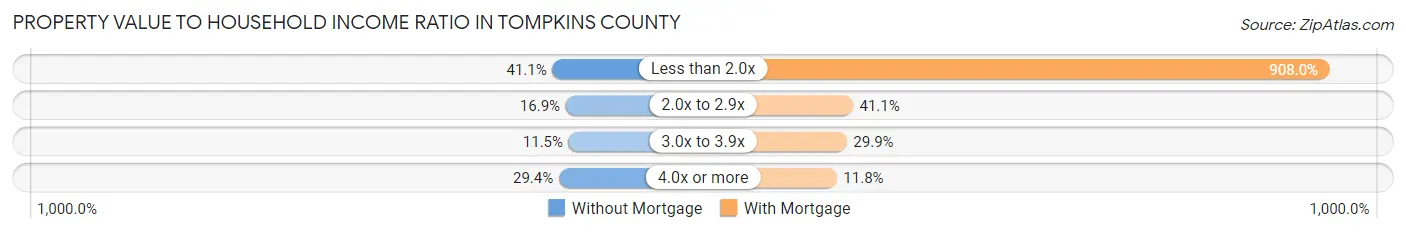
| Value-to-Income Ratio | Without Mortgage | With Mortgage |
| Less than 2.0x | 4,272 (41.1%) | 117,508 (908.0%) |
| 2.0x to 2.9x | 1,756 (16.9%) | 5,317 (41.1%) |
| 3.0x to 3.9x | 1,198 (11.5%) | 3,871 (29.9%) |
| 4.0x or more | 3,050 (29.4%) | 1,528 (11.8%) |
| Total | 10,387 (100.0%) | 12,941 (100.0%) |
Real Estate Taxes by Mortgage Status in Tompkins County
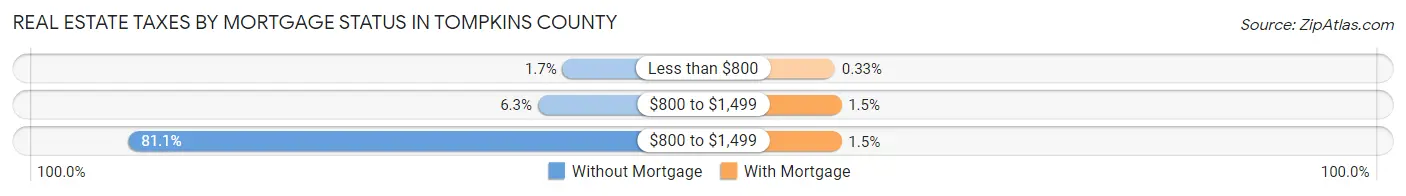
| Property Taxes | Without Mortgage | With Mortgage |
| Less than $800 | 181 (1.7%) | 43 (0.3%) |
| $800 to $1,499 | 651 (6.3%) | 193 (1.5%) |
| $800 to $1,499 | 8,420 (81.1%) | 198 (1.5%) |
| Total | 10,387 (100.0%) | 12,941 (100.0%) |
Health & Disability in Tompkins County
Health Insurance Coverage by Age in Tompkins County
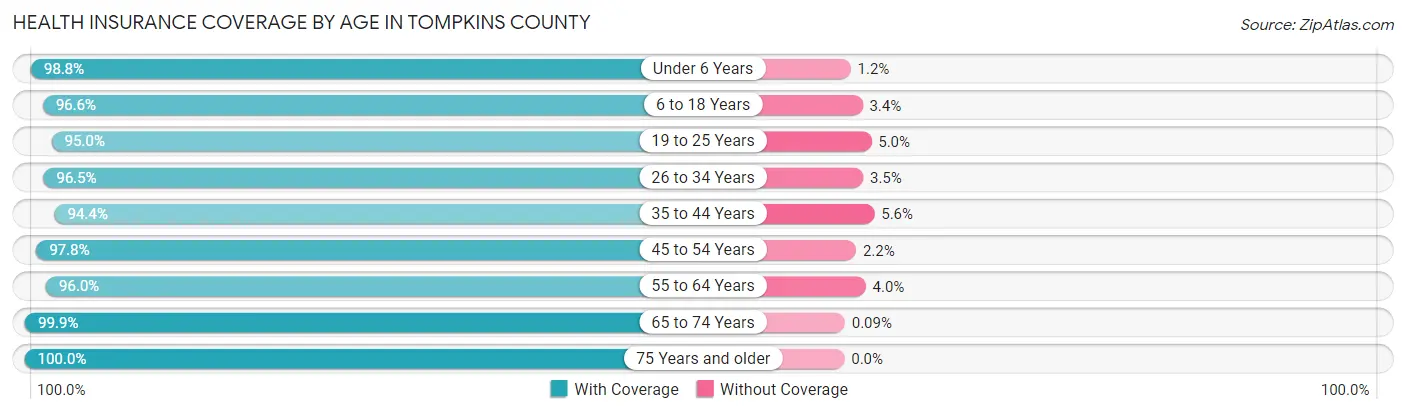
| Age Bracket | With Coverage | Without Coverage |
| Under 6 Years | 4,659 (98.8%) | 55 (1.2%) |
| 6 to 18 Years | 14,022 (96.6%) | 490 (3.4%) |
| 19 to 25 Years | 22,297 (95.0%) | 1,182 (5.0%) |
| 26 to 34 Years | 10,407 (96.5%) | 378 (3.5%) |
| 35 to 44 Years | 10,367 (94.4%) | 614 (5.6%) |
| 45 to 54 Years | 9,935 (97.8%) | 221 (2.2%) |
| 55 to 64 Years | 11,001 (96.0%) | 456 (4.0%) |
| 65 to 74 Years | 9,584 (99.9%) | 9 (0.1%) |
| 75 Years and older | 6,152 (100.0%) | 0 (0.0%) |
| Total | 98,424 (96.7%) | 3,405 (3.3%) |
Health Insurance Coverage by Citizenship Status in Tompkins County
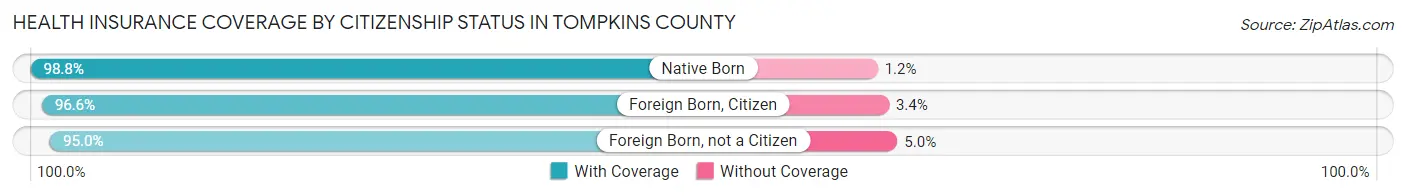
| Citizenship Status | With Coverage | Without Coverage |
| Native Born | 4,659 (98.8%) | 55 (1.2%) |
| Foreign Born, Citizen | 14,022 (96.6%) | 490 (3.4%) |
| Foreign Born, not a Citizen | 22,297 (95.0%) | 1,182 (5.0%) |
Health Insurance Coverage by Household Income in Tompkins County
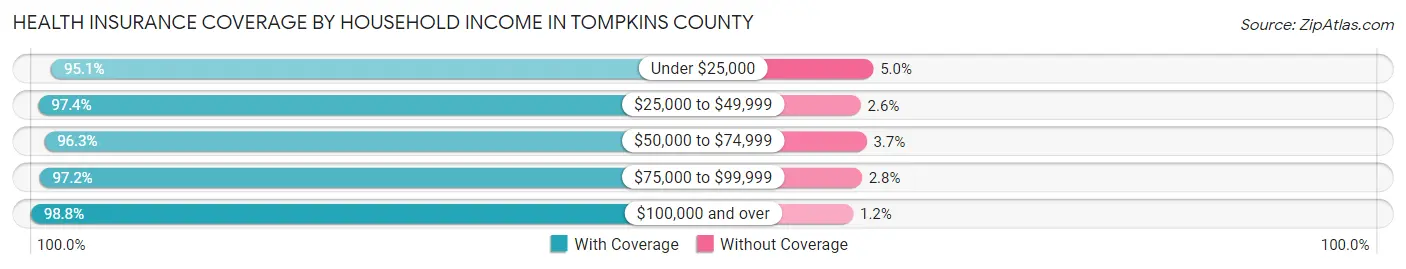
| Household Income | With Coverage | Without Coverage |
| Under $25,000 | 11,393 (95.1%) | 593 (5.0%) |
| $25,000 to $49,999 | 13,773 (97.4%) | 365 (2.6%) |
| $50,000 to $74,999 | 12,629 (96.3%) | 483 (3.7%) |
| $75,000 to $99,999 | 10,580 (97.2%) | 304 (2.8%) |
| $100,000 and over | 38,058 (98.8%) | 450 (1.2%) |
Public vs Private Health Insurance Coverage by Age in Tompkins County
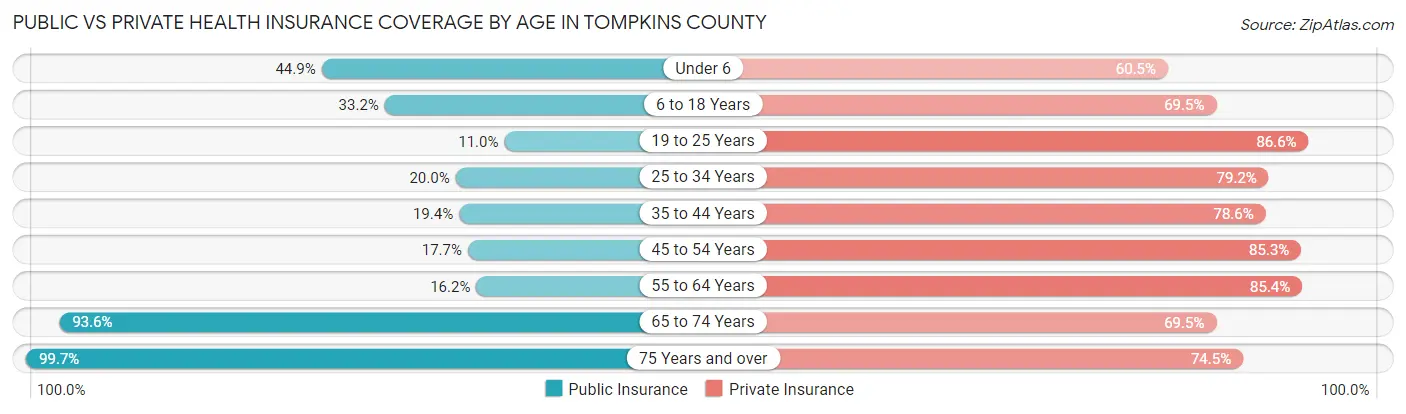
| Age Bracket | Public Insurance | Private Insurance |
| Under 6 | 2,116 (44.9%) | 2,853 (60.5%) |
| 6 to 18 Years | 4,814 (33.2%) | 10,085 (69.5%) |
| 19 to 25 Years | 2,575 (11.0%) | 20,336 (86.6%) |
| 25 to 34 Years | 2,159 (20.0%) | 8,545 (79.2%) |
| 35 to 44 Years | 2,127 (19.4%) | 8,636 (78.6%) |
| 45 to 54 Years | 1,802 (17.7%) | 8,659 (85.3%) |
| 55 to 64 Years | 1,853 (16.2%) | 9,788 (85.4%) |
| 65 to 74 Years | 8,976 (93.6%) | 6,667 (69.5%) |
| 75 Years and over | 6,136 (99.7%) | 4,581 (74.5%) |
| Total | 32,558 (32.0%) | 80,150 (78.7%) |
Disability Status by Sex by Age in Tompkins County
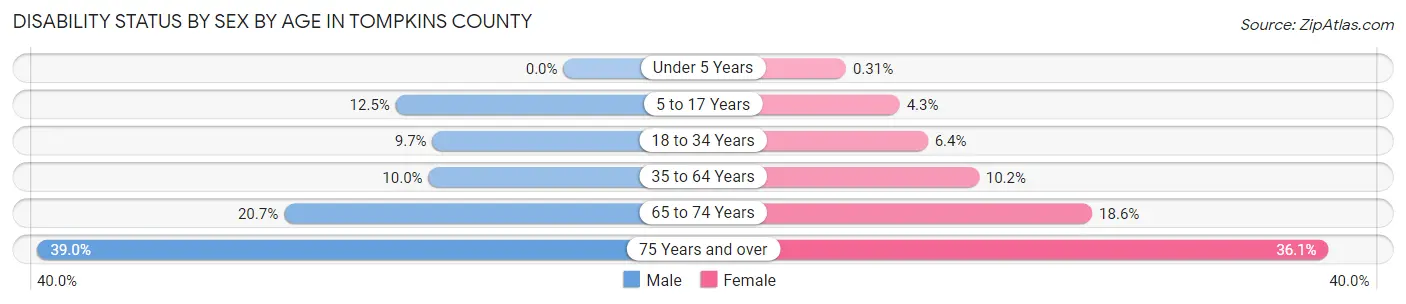
| Age Bracket | Male | Female |
| Under 5 Years | 0 (0.0%) | 5 (0.3%) |
| 5 to 17 Years | 672 (12.4%) | 240 (4.3%) |
| 18 to 34 Years | 1,898 (9.7%) | 1,229 (6.4%) |
| 35 to 64 Years | 1,570 (10.0%) | 1,722 (10.2%) |
| 65 to 74 Years | 952 (20.7%) | 930 (18.6%) |
| 75 Years and over | 1,008 (39.0%) | 1,290 (36.1%) |
Disability Class by Sex by Age in Tompkins County
Disability Class: Hearing Difficulty
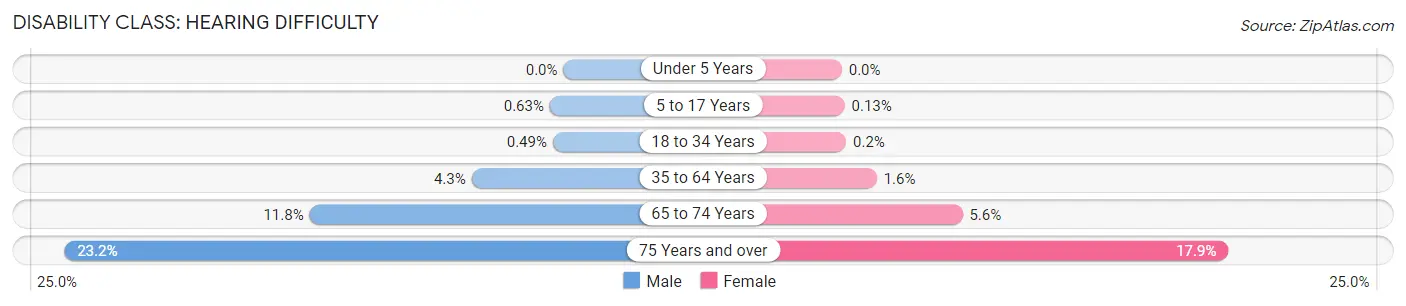
| Age Bracket | Male | Female |
| Under 5 Years | 0 (0.0%) | 0 (0.0%) |
| 5 to 17 Years | 34 (0.6%) | 7 (0.1%) |
| 18 to 34 Years | 96 (0.5%) | 38 (0.2%) |
| 35 to 64 Years | 668 (4.3%) | 274 (1.6%) |
| 65 to 74 Years | 541 (11.8%) | 280 (5.6%) |
| 75 Years and over | 598 (23.2%) | 640 (17.9%) |
Disability Class: Vision Difficulty
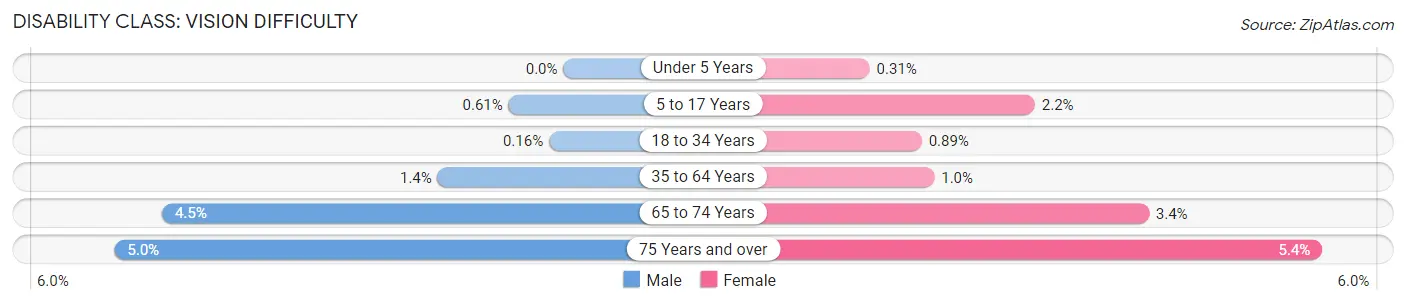
| Age Bracket | Male | Female |
| Under 5 Years | 0 (0.0%) | 5 (0.3%) |
| 5 to 17 Years | 33 (0.6%) | 120 (2.1%) |
| 18 to 34 Years | 31 (0.2%) | 172 (0.9%) |
| 35 to 64 Years | 220 (1.4%) | 175 (1.0%) |
| 65 to 74 Years | 205 (4.5%) | 171 (3.4%) |
| 75 Years and over | 129 (5.0%) | 191 (5.3%) |
Disability Class: Cognitive Difficulty
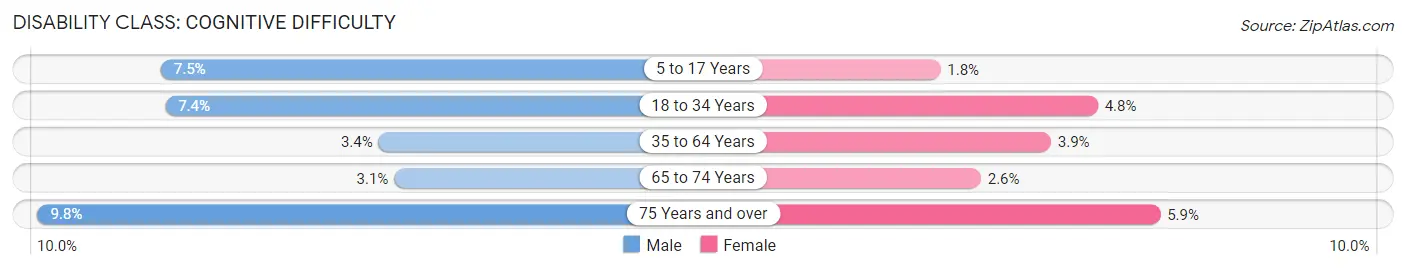
| Age Bracket | Male | Female |
| 5 to 17 Years | 403 (7.5%) | 102 (1.8%) |
| 18 to 34 Years | 1,443 (7.4%) | 914 (4.8%) |
| 35 to 64 Years | 537 (3.4%) | 657 (3.9%) |
| 65 to 74 Years | 144 (3.1%) | 129 (2.6%) |
| 75 Years and over | 252 (9.8%) | 211 (5.9%) |
Disability Class: Ambulatory Difficulty
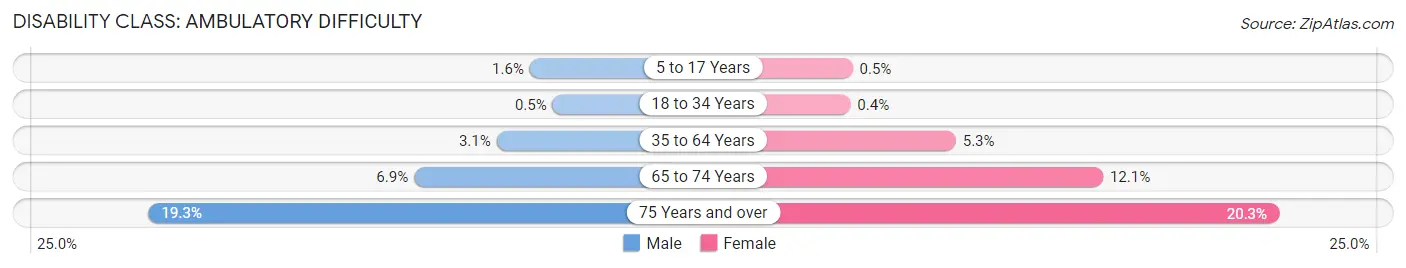
| Age Bracket | Male | Female |
| 5 to 17 Years | 84 (1.6%) | 28 (0.5%) |
| 18 to 34 Years | 97 (0.5%) | 77 (0.4%) |
| 35 to 64 Years | 486 (3.1%) | 895 (5.3%) |
| 65 to 74 Years | 318 (6.9%) | 606 (12.1%) |
| 75 Years and over | 497 (19.3%) | 724 (20.3%) |
Disability Class: Self-Care Difficulty
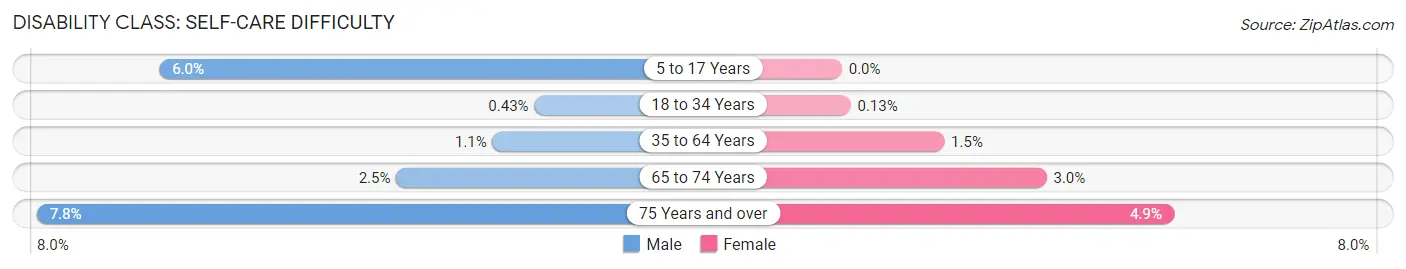
| Age Bracket | Male | Female |
| 5 to 17 Years | 324 (6.0%) | 0 (0.0%) |
| 18 to 34 Years | 84 (0.4%) | 26 (0.1%) |
| 35 to 64 Years | 165 (1.1%) | 257 (1.5%) |
| 65 to 74 Years | 114 (2.5%) | 152 (3.0%) |
| 75 Years and over | 202 (7.8%) | 176 (4.9%) |
Technology Access in Tompkins County
Computing Device Access in Tompkins County
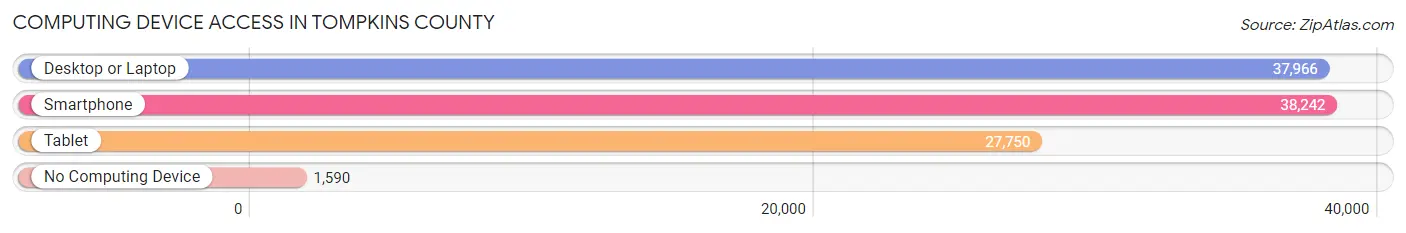
| Device Type | # Households | % Households |
| Desktop or Laptop | 37,966 | 88.3% |
| Smartphone | 38,242 | 89.0% |
| Tablet | 27,750 | 64.6% |
| No Computing Device | 1,590 | 3.7% |
| Total | 42,984 | 100.0% |
Internet Access in Tompkins County
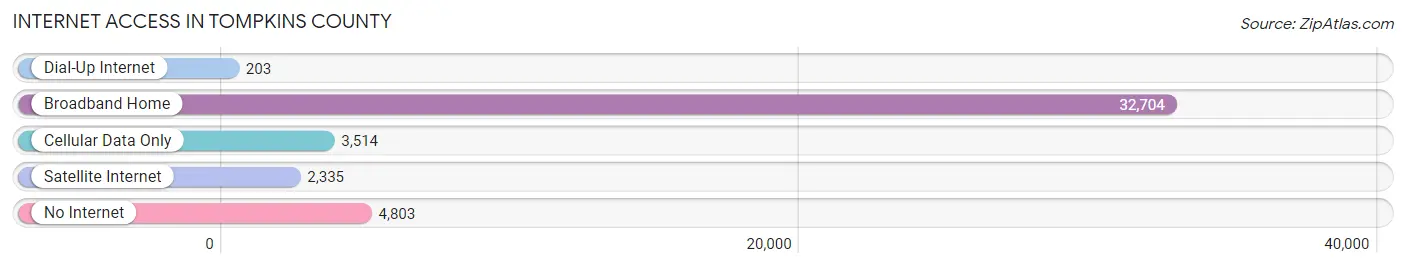
| Internet Type | # Households | % Households |
| Dial-Up Internet | 203 | 0.5% |
| Broadband Home | 32,704 | 76.1% |
| Cellular Data Only | 3,514 | 8.2% |
| Satellite Internet | 2,335 | 5.4% |
| No Internet | 4,803 | 11.2% |
| Total | 42,984 | 100.0% |
Tompkins County Summary
Tompkins County is located in the Finger Lakes region of New York State. It is bordered by Cayuga, Cortland, Tioga, and Seneca Counties. The county seat is Ithaca, which is also the largest city in the county. Tompkins County is home to Cornell University, Ithaca College, and Tompkins Cortland Community College.
History
Tompkins County was formed in 1817 from parts of Cayuga and Tioga Counties. It was named after Daniel D. Tompkins, who was the Governor of New York at the time. The county was originally home to the Cayuga and Seneca Native American tribes. The first settlers arrived in the area in the late 1700s.
The county was an important center of the abolitionist movement in the early 1800s. It was also a major stop on the Underground Railroad. In the mid-1800s, the county was a major producer of hops, which were used to make beer.
Geography
Tompkins County is located in the Finger Lakes region of New York State. It is bordered by Cayuga, Cortland, Tioga, and Seneca Counties. The county has a total area of 517 square miles, of which 498 square miles is land and 19 square miles is water. The highest point in the county is Cascadilla Hill, which has an elevation of 1,945 feet.
The county is home to several lakes, including Cayuga Lake, Seneca Lake, and Skaneateles Lake. The Finger Lakes National Forest is located in the county, as well as several state parks and wildlife management areas.
Economy
Tompkins County has a diverse economy. The largest employers in the county are Cornell University, Ithaca College, and Tompkins Cortland Community College. Other major employers include Wegmans, Cayuga Medical Center, and Tompkins Financial Corporation.
Agriculture is also an important part of the county’s economy. The county is home to several wineries, as well as dairy farms and hop farms. Tourism is also an important part of the economy, with visitors coming to the area to enjoy the Finger Lakes and the many outdoor activities available.
Demographics
As of the 2010 census, Tompkins County had a population of 101,564. The population was spread out with 24.3% under the age of 18, 16.2% from 18 to 24, 28.2% from 25 to 44, 20.2% from 45 to 64, and 11.1% who were 65 years of age or older. The median age was 30.7 years.
The racial makeup of the county was 87.2% White, 5.3% African American, 0.3% Native American, 4.2% Asian, 0.1% Pacific Islander, 1.2% from other races, and 1.7% from two or more races. Hispanic or Latino of any race were 6.7% of the population.
The median income for a household in the county was $45,868, and the median income for a family was $60,867. The per capita income for the county was $25,945. About 11.2% of families and 22.2% of the population were below the poverty line, including 17.2% of those under age 18 and 6.7% of those age 65 or over.
Common Questions
What is Per Capita Income in Tompkins County?
Per Capita income in Tompkins County is $40,781.
What is the Median Family Income in Tompkins County?
Median Family Income in Tompkins County is $106,005.
What is the Median Household income in Tompkins County?
Median Household Income in Tompkins County is $69,995.
What is Income or Wage Gap in Tompkins County?
Income or Wage Gap in Tompkins County is 17.8%.
Women in Tompkins County earn 82.2 cents for every dollar earned by a man.
What is Family Income Deficit in Tompkins County?
Family Income Deficit in Tompkins County is $12,625.
Families that are below poverty line in Tompkins County earn $12,625 less on average than the poverty threshold level.
What is Inequality or Gini Index in Tompkins County?
Inequality or Gini Index in Tompkins County is 0.49.
What is the Total Population of Tompkins County?
Total Population of Tompkins County is 102,555.
What is the Total Male Population of Tompkins County?
Total Male Population of Tompkins County is 50,314.
What is the Total Female Population of Tompkins County?
Total Female Population of Tompkins County is 52,241.
What is the Ratio of Males per 100 Females in Tompkins County?
There are 96.31 Males per 100 Females in Tompkins County.
What is the Ratio of Females per 100 Males in Tompkins County?
There are 103.83 Females per 100 Males in Tompkins County.
What is the Median Population Age in Tompkins County?
Median Population Age in Tompkins County is 32.6 Years.
What is the Average Family Size in Tompkins County
Average Family Size in Tompkins County is 2.6 People.
What is the Average Household Size in Tompkins County
Average Household Size in Tompkins County is 2.1 People.
How Large is the Labor Force in Tompkins County?
There are 51,883 People in the Labor Forcein in Tompkins County.
What is the Percentage of People in the Labor Force in Tompkins County?
58.1% of People are in the Labor Force in Tompkins County.
What is the Unemployment Rate in Tompkins County?
Unemployment Rate in Tompkins County is 4.7%.