Tioga County, NY Map & Demographics
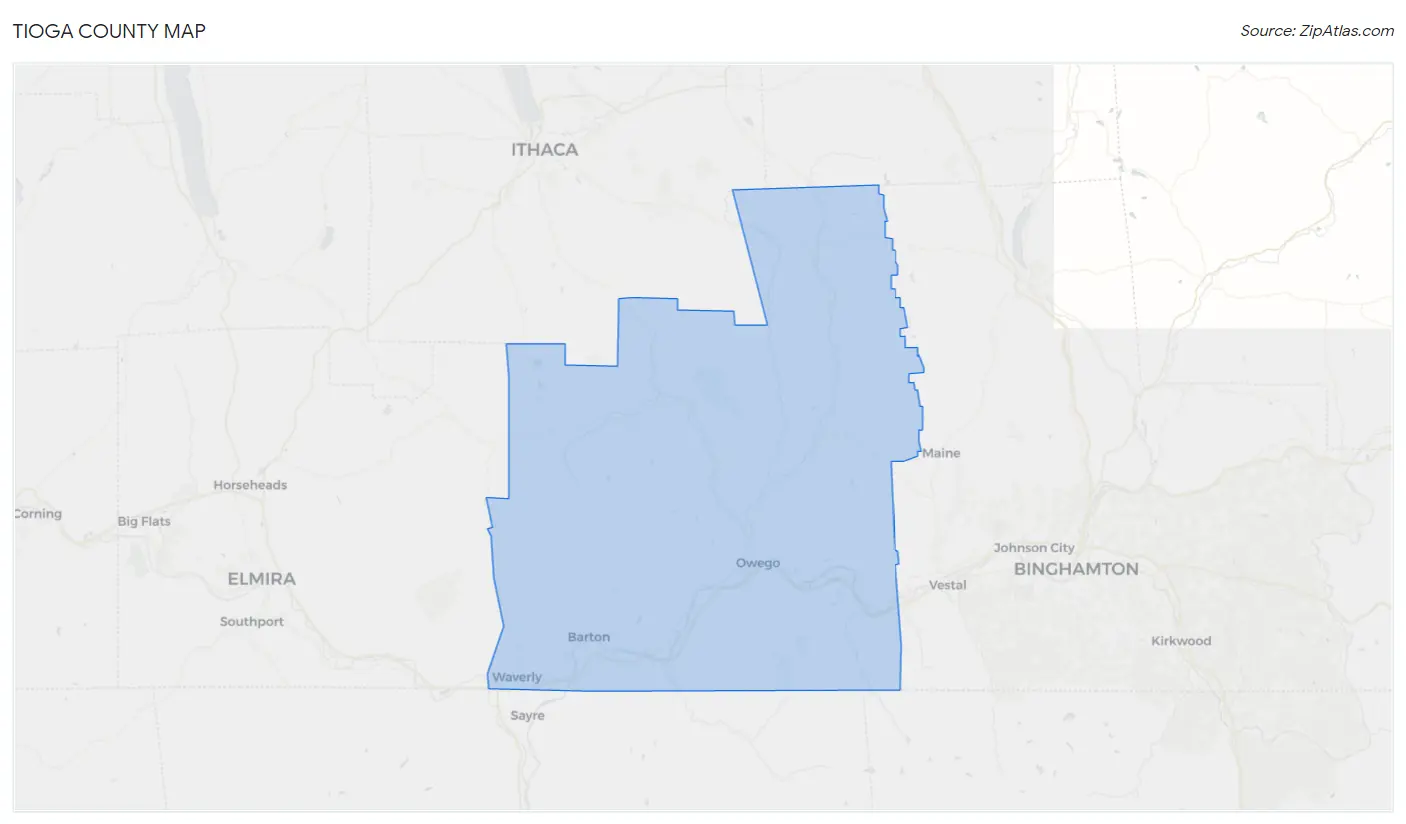
Tioga County Map
Tioga County Overview
$37,691
PER CAPITA INCOME
$83,276
AVG FAMILY INCOME
$70,427
AVG HOUSEHOLD INCOME
31.8%
WAGE / INCOME GAP [ % ]
68.2¢/ $1
WAGE / INCOME GAP [ $ ]
$9,577
FAMILY INCOME DEFICIT
0.43
INEQUALITY / GINI INDEX
48,344
TOTAL POPULATION
24,193
MALE POPULATION
24,151
FEMALE POPULATION
100.17
MALES / 100 FEMALES
99.83
FEMALES / 100 MALES
44.7
MEDIAN AGE
2.8
AVG FAMILY SIZE
2.4
AVG HOUSEHOLD SIZE
24,070
LABOR FORCE [ PEOPLE ]
60.6%
PERCENT IN LABOR FORCE
5.6%
UNEMPLOYMENT RATE
Tioga County Area Codes
Income in Tioga County
Income Overview in Tioga County
Per Capita Income in Tioga County is $37,691, while median incomes of families and households are $83,276 and $70,427 respectively.
| Characteristic | Number | Measure |
| Per Capita Income | 48,344 | $37,691 |
| Median Family Income | 13,486 | $83,276 |
| Mean Family Income | 13,486 | $102,874 |
| Median Household Income | 20,312 | $70,427 |
| Mean Household Income | 20,312 | $89,281 |
| Income Deficit | 13,486 | $9,577 |
| Wage / Income Gap (%) | 48,344 | 31.78% |
| Wage / Income Gap ($) | 48,344 | 68.22¢ per $1 |
| Gini / Inequality Index | 48,344 | 0.43 |
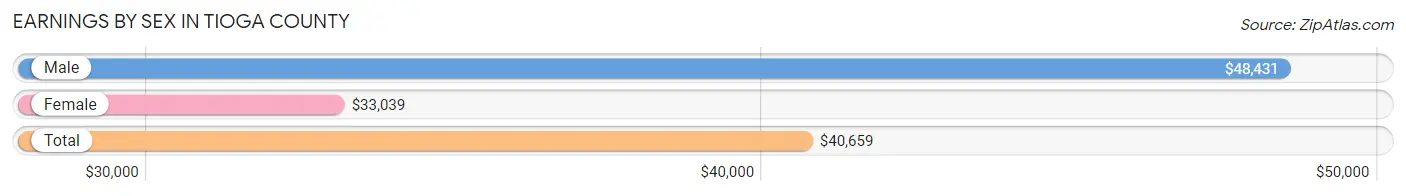
Earnings by Sex in Tioga County
Average Earnings in Tioga County are $40,659, $48,431 for men and $33,039 for women, a difference of 31.8%.
| Sex | Number | Average Earnings |
| Male | 13,576 (53.8%) | $48,431 |
| Female | 11,650 (46.2%) | $33,039 |
| Total | 25,226 (100.0%) | $40,659 |
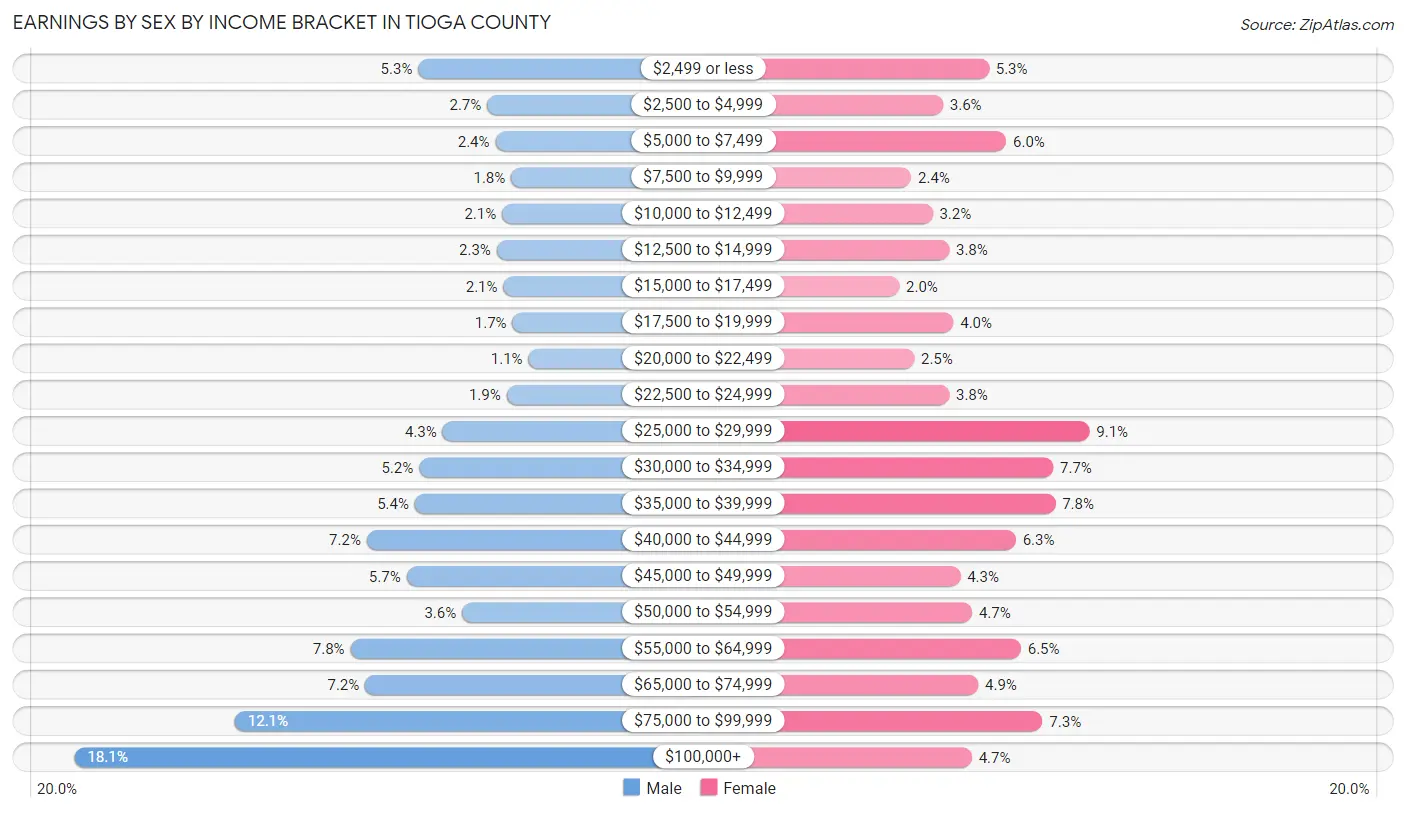
Earnings by Sex by Income Bracket in Tioga County
The most common earnings brackets in Tioga County are $100,000+ for men (2,461 | 18.1%) and $25,000 to $29,999 for women (1,059 | 9.1%).
| Income | Male | Female |
| $2,499 or less | 713 (5.2%) | 620 (5.3%) |
| $2,500 to $4,999 | 362 (2.7%) | 419 (3.6%) |
| $5,000 to $7,499 | 320 (2.4%) | 696 (6.0%) |
| $7,500 to $9,999 | 240 (1.8%) | 281 (2.4%) |
| $10,000 to $12,499 | 287 (2.1%) | 374 (3.2%) |
| $12,500 to $14,999 | 314 (2.3%) | 446 (3.8%) |
| $15,000 to $17,499 | 279 (2.1%) | 228 (2.0%) |
| $17,500 to $19,999 | 233 (1.7%) | 465 (4.0%) |
| $20,000 to $22,499 | 152 (1.1%) | 294 (2.5%) |
| $22,500 to $24,999 | 263 (1.9%) | 446 (3.8%) |
| $25,000 to $29,999 | 589 (4.3%) | 1,059 (9.1%) |
| $30,000 to $34,999 | 709 (5.2%) | 901 (7.7%) |
| $35,000 to $39,999 | 730 (5.4%) | 910 (7.8%) |
| $40,000 to $44,999 | 975 (7.2%) | 738 (6.3%) |
| $45,000 to $49,999 | 772 (5.7%) | 495 (4.3%) |
| $50,000 to $54,999 | 490 (3.6%) | 546 (4.7%) |
| $55,000 to $64,999 | 1,058 (7.8%) | 760 (6.5%) |
| $65,000 to $74,999 | 983 (7.2%) | 573 (4.9%) |
| $75,000 to $99,999 | 1,646 (12.1%) | 854 (7.3%) |
| $100,000+ | 2,461 (18.1%) | 545 (4.7%) |
| Total | 13,576 (100.0%) | 11,650 (100.0%) |
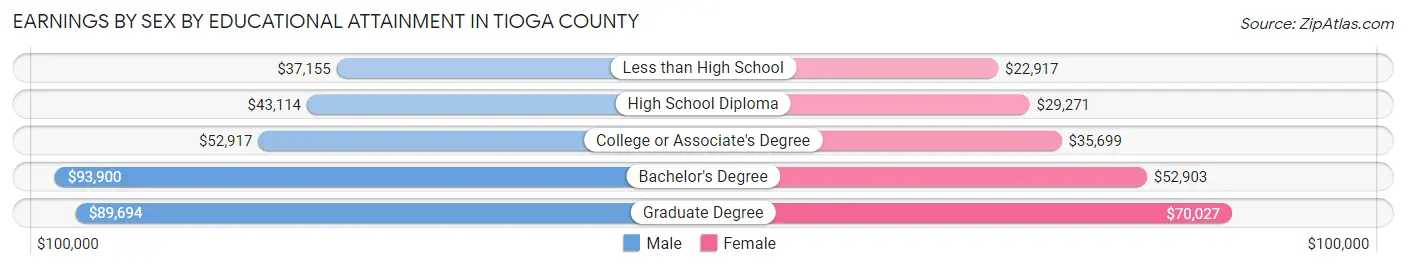
Earnings by Sex by Educational Attainment in Tioga County
Average earnings in Tioga County are $56,218 for men and $36,818 for women, a difference of 34.5%. Men with an educational attainment of bachelor's degree enjoy the highest average annual earnings of $93,900, while those with less than high school education earn the least with $37,155. Women with an educational attainment of graduate degree earn the most with the average annual earnings of $70,027, while those with less than high school education have the smallest earnings of $22,917.
| Educational Attainment | Male Income | Female Income |
| Less than High School | $37,155 | $22,917 |
| High School Diploma | $43,114 | $29,271 |
| College or Associate's Degree | $52,917 | $35,699 |
| Bachelor's Degree | $93,900 | $52,903 |
| Graduate Degree | $89,694 | $70,027 |
| Total | $56,218 | $36,818 |
Family Income in Tioga County
Family Income Brackets in Tioga County
According to the Tioga County family income data, there are 3,061 families falling into the $100,000 to $149,999 income range, which is the most common income bracket and makes up 22.7% of all families. Conversely, the $10,000 to $14,999 income bracket is the least frequent group with only 175 families (1.3%) belonging to this category.
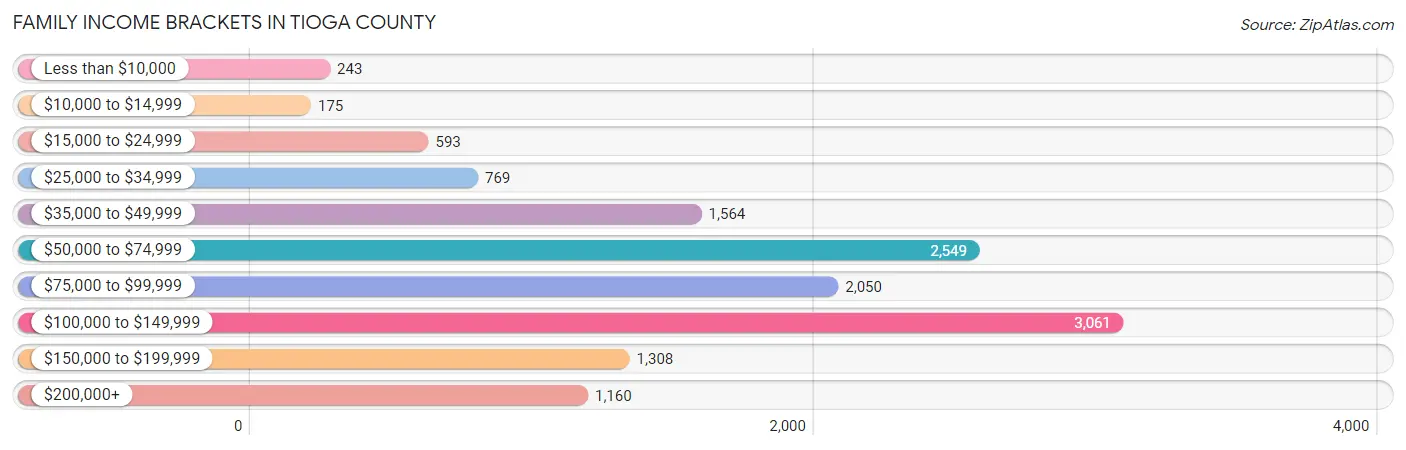
| Income Bracket | # Families | % Families |
| Less than $10,000 | 243 | 1.8% |
| $10,000 to $14,999 | 175 | 1.3% |
| $15,000 to $24,999 | 593 | 4.4% |
| $25,000 to $34,999 | 769 | 5.7% |
| $35,000 to $49,999 | 1,564 | 11.6% |
| $50,000 to $74,999 | 2,549 | 18.9% |
| $75,000 to $99,999 | 2,050 | 15.2% |
| $100,000 to $149,999 | 3,061 | 22.7% |
| $150,000 to $199,999 | 1,308 | 9.7% |
| $200,000+ | 1,160 | 8.6% |
Family Income by Famaliy Size in Tioga County
6-person families (152 | 1.1%) account for the highest median family income in Tioga County with $139,500 per family, while 2-person families (7,408 | 54.9%) have the highest median income of $37,185 per family member.
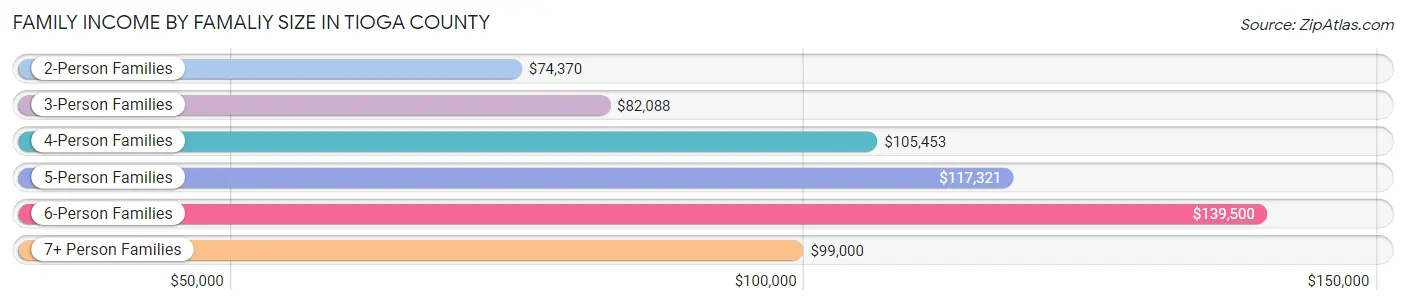
| Income Bracket | # Families | Median Income |
| 2-Person Families | 7,408 (54.9%) | $74,370 |
| 3-Person Families | 2,586 (19.2%) | $82,088 |
| 4-Person Families | 2,594 (19.2%) | $105,453 |
| 5-Person Families | 692 (5.1%) | $117,321 |
| 6-Person Families | 152 (1.1%) | $139,500 |
| 7+ Person Families | 54 (0.4%) | $99,000 |
| Total | 13,486 (100.0%) | $83,276 |
Family Income by Number of Earners in Tioga County
The median family income in Tioga County is $83,276, with families comprising 3+ earners (1,281) having the highest median family income of $128,694, while families with no earners (2,590) have the lowest median family income of $56,319, accounting for 9.5% and 19.2% of families, respectively.
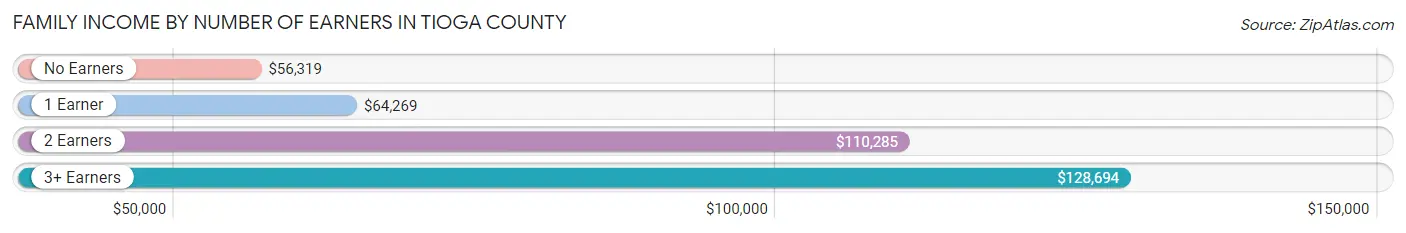
| Number of Earners | # Families | Median Income |
| No Earners | 2,590 (19.2%) | $56,319 |
| 1 Earner | 4,327 (32.1%) | $64,269 |
| 2 Earners | 5,288 (39.2%) | $110,285 |
| 3+ Earners | 1,281 (9.5%) | $128,694 |
| Total | 13,486 (100.0%) | $83,276 |
Household Income in Tioga County
Household Income Brackets in Tioga County
With 3,616 households falling in the category, the $100,000 to $149,999 income range is the most frequent in Tioga County, accounting for 17.8% of all households. In contrast, only 752 households (3.7%) fall into the less than $10,000 income bracket, making it the least populous group.
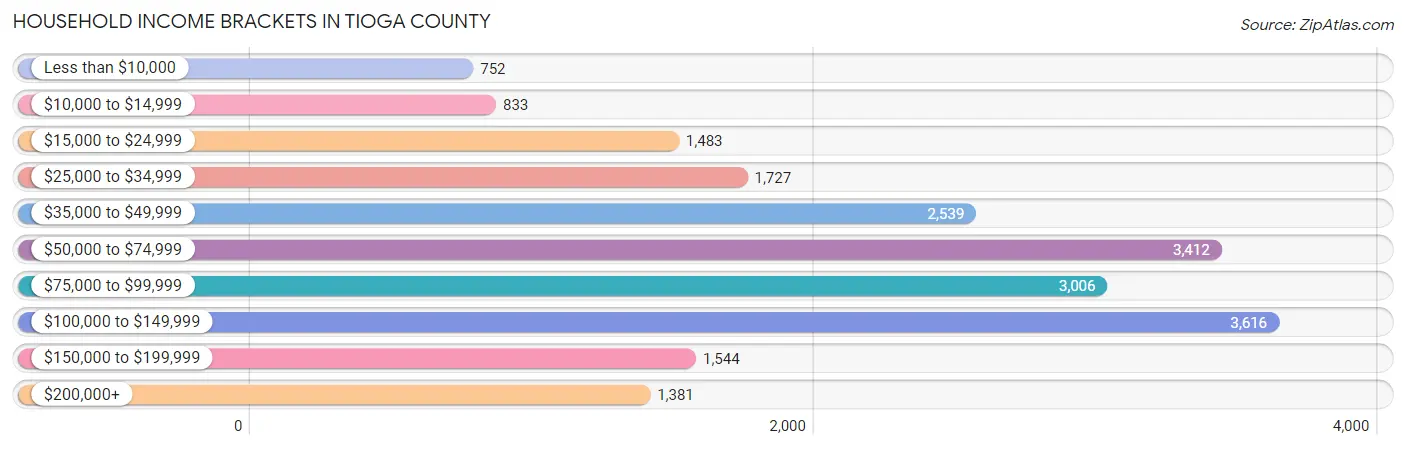
| Income Bracket | # Households | % Households |
| Less than $10,000 | 752 | 3.7% |
| $10,000 to $14,999 | 833 | 4.1% |
| $15,000 to $24,999 | 1,483 | 7.3% |
| $25,000 to $34,999 | 1,727 | 8.5% |
| $35,000 to $49,999 | 2,539 | 12.5% |
| $50,000 to $74,999 | 3,412 | 16.8% |
| $75,000 to $99,999 | 3,006 | 14.8% |
| $100,000 to $149,999 | 3,616 | 17.8% |
| $150,000 to $199,999 | 1,544 | 7.6% |
| $200,000+ | 1,381 | 6.8% |
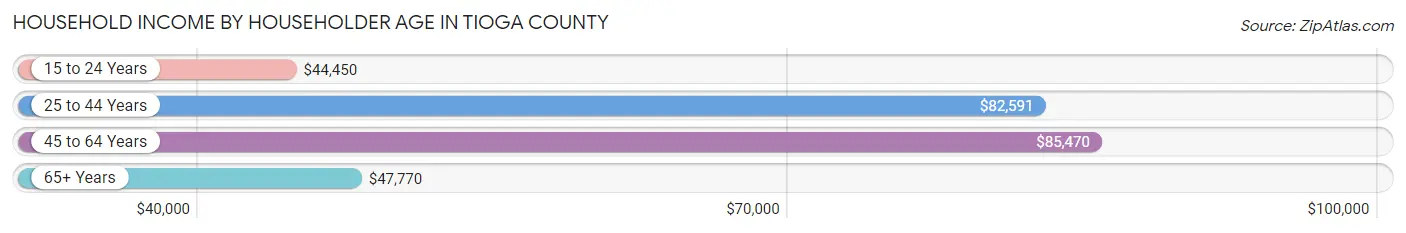
Household Income by Householder Age in Tioga County
The median household income in Tioga County is $70,427, with the highest median household income of $85,470 found in the 45 to 64 years age bracket for the primary householder. A total of 7,919 households (39.0%) fall into this category. Meanwhile, the 15 to 24 years age bracket for the primary householder has the lowest median household income of $44,450, with 787 households (3.9%) in this group.
| Income Bracket | # Households | Median Income |
| 15 to 24 Years | 787 (3.9%) | $44,450 |
| 25 to 44 Years | 5,038 (24.8%) | $82,591 |
| 45 to 64 Years | 7,919 (39.0%) | $85,470 |
| 65+ Years | 6,568 (32.3%) | $47,770 |
| Total | 20,312 (100.0%) | $70,427 |
Poverty in Tioga County
Income Below Poverty by Sex and Age in Tioga County
With 8.7% poverty level for males and 11.6% for females among the residents of Tioga County, 5 year old males and 18 to 24 year old females are the most vulnerable to poverty, with 49 males (33.6%) and 478 females (27.4%) in their respective age groups living below the poverty level.
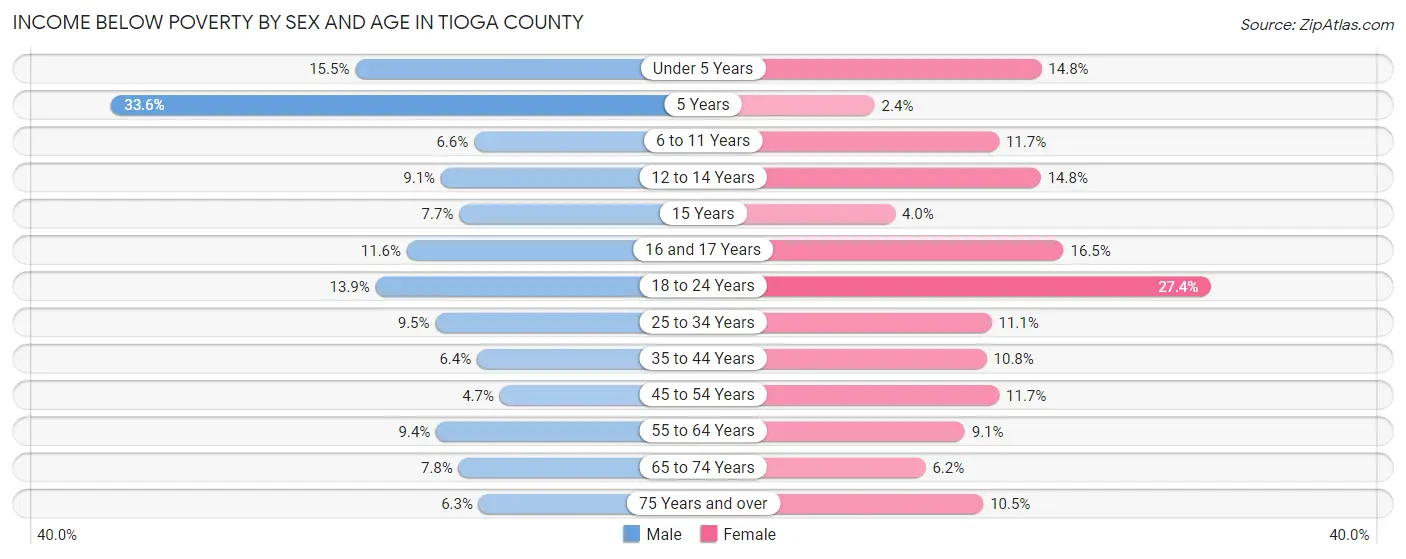
| Age Bracket | Male | Female |
| Under 5 Years | 196 (15.4%) | 173 (14.8%) |
| 5 Years | 49 (33.6%) | 7 (2.4%) |
| 6 to 11 Years | 103 (6.6%) | 171 (11.7%) |
| 12 to 14 Years | 95 (9.1%) | 110 (14.8%) |
| 15 Years | 29 (7.7%) | 12 (4.0%) |
| 16 and 17 Years | 71 (11.6%) | 99 (16.5%) |
| 18 to 24 Years | 276 (13.9%) | 478 (27.4%) |
| 25 to 34 Years | 239 (9.5%) | 293 (11.1%) |
| 35 to 44 Years | 179 (6.4%) | 290 (10.7%) |
| 45 to 54 Years | 145 (4.7%) | 342 (11.7%) |
| 55 to 64 Years | 365 (9.4%) | 369 (9.1%) |
| 65 to 74 Years | 220 (7.8%) | 176 (6.2%) |
| 75 Years and over | 123 (6.3%) | 238 (10.5%) |
| Total | 2,090 (8.7%) | 2,758 (11.6%) |
Income Above Poverty by Sex and Age in Tioga County
According to the poverty statistics in Tioga County, males aged 45 to 54 years and females aged 5 years are the age groups that are most secure financially, with 95.3% of males and 97.6% of females in these age groups living above the poverty line.
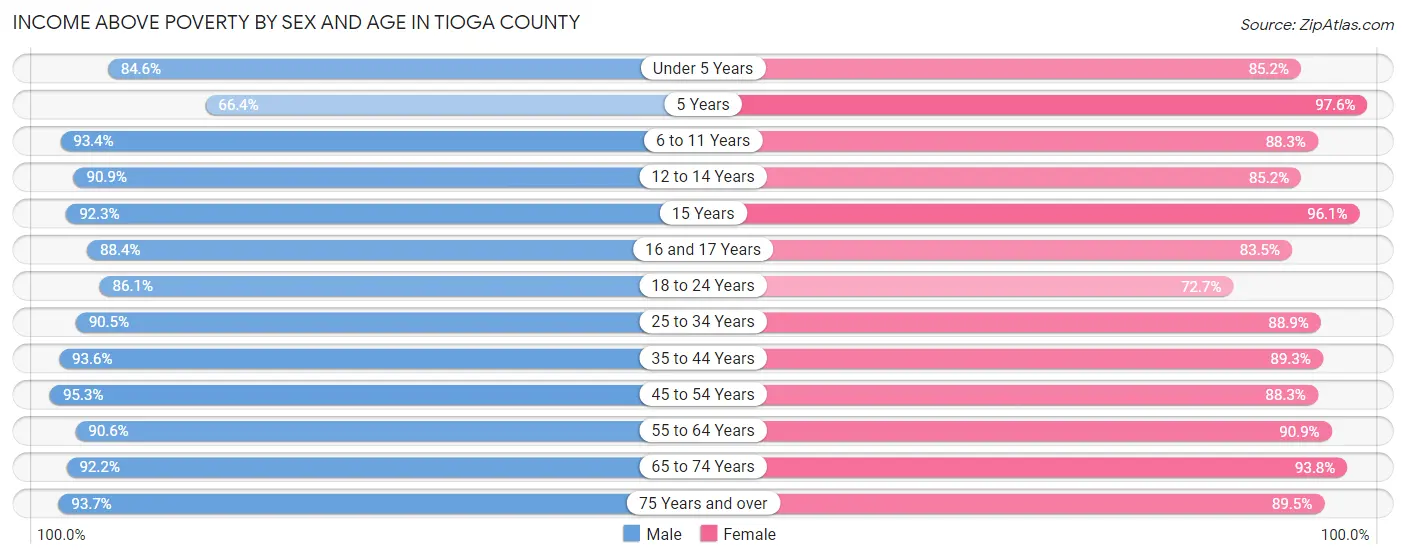
| Age Bracket | Male | Female |
| Under 5 Years | 1,073 (84.6%) | 994 (85.2%) |
| 5 Years | 97 (66.4%) | 280 (97.6%) |
| 6 to 11 Years | 1,450 (93.4%) | 1,294 (88.3%) |
| 12 to 14 Years | 950 (90.9%) | 635 (85.2%) |
| 15 Years | 346 (92.3%) | 292 (96.1%) |
| 16 and 17 Years | 540 (88.4%) | 502 (83.5%) |
| 18 to 24 Years | 1,704 (86.1%) | 1,270 (72.7%) |
| 25 to 34 Years | 2,277 (90.5%) | 2,342 (88.9%) |
| 35 to 44 Years | 2,612 (93.6%) | 2,407 (89.2%) |
| 45 to 54 Years | 2,929 (95.3%) | 2,587 (88.3%) |
| 55 to 64 Years | 3,503 (90.6%) | 3,671 (90.9%) |
| 65 to 74 Years | 2,606 (92.2%) | 2,656 (93.8%) |
| 75 Years and over | 1,836 (93.7%) | 2,028 (89.5%) |
| Total | 21,923 (91.3%) | 20,958 (88.4%) |
Income Below Poverty Among Married-Couple Families in Tioga County
The poverty statistics for married-couple families in Tioga County show that 2.9% or 300 of the total 10,329 families live below the poverty line. Families with 3 or 4 children have the highest poverty rate of 8.2%, comprising of 46 families. On the other hand, families with 5 or more children have the lowest poverty rate of 0.0%, which includes 0 families.
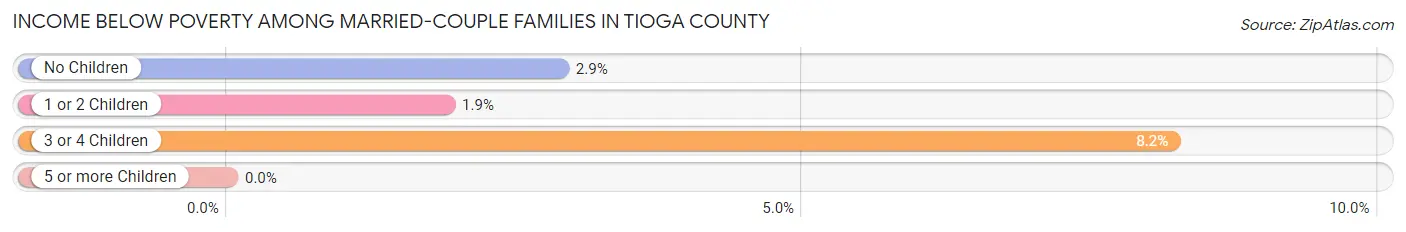
| Children | Above Poverty | Below Poverty |
| No Children | 6,843 (97.1%) | 203 (2.9%) |
| 1 or 2 Children | 2,653 (98.1%) | 51 (1.9%) |
| 3 or 4 Children | 515 (91.8%) | 46 (8.2%) |
| 5 or more Children | 18 (100.0%) | 0 (0.0%) |
| Total | 10,029 (97.1%) | 300 (2.9%) |
Income Below Poverty Among Single-Parent Households in Tioga County
According to the poverty data in Tioga County, 18.2% or 232 single-father households and 18.1% or 341 single-mother households are living below the poverty line. Among single-father households, those with 1 or 2 children have the highest poverty rate, with 153 households (20.3%) experiencing poverty. Likewise, among single-mother households, those with 3 or 4 children have the highest poverty rate, with 143 households (71.5%) falling below the poverty line.
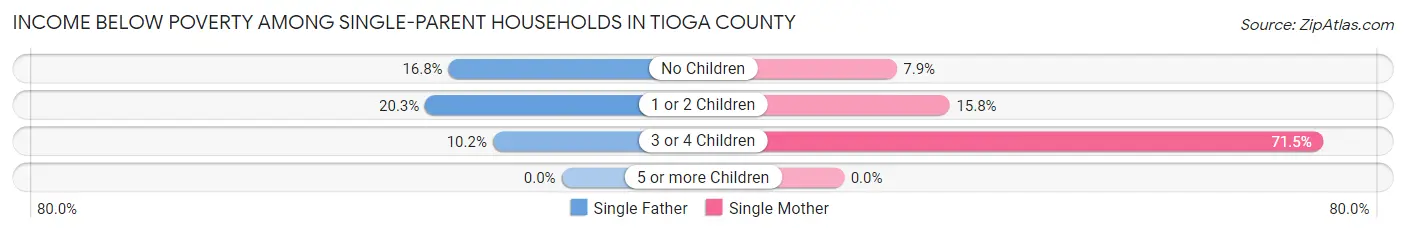
| Children | Single Father | Single Mother |
| No Children | 66 (16.8%) | 67 (7.9%) |
| 1 or 2 Children | 153 (20.3%) | 131 (15.8%) |
| 3 or 4 Children | 13 (10.2%) | 143 (71.5%) |
| 5 or more Children | 0 (0.0%) | 0 (0.0%) |
| Total | 232 (18.2%) | 341 (18.1%) |
Income Below Poverty Among Married-Couple vs Single-Parent Households in Tioga County
The poverty data for Tioga County shows that 300 of the married-couple family households (2.9%) and 573 of the single-parent households (18.1%) are living below the poverty level. Within the married-couple family households, those with 3 or 4 children have the highest poverty rate, with 46 households (8.2%) falling below the poverty line. Among the single-parent households, those with 3 or 4 children have the highest poverty rate, with 156 household (47.7%) living below poverty.
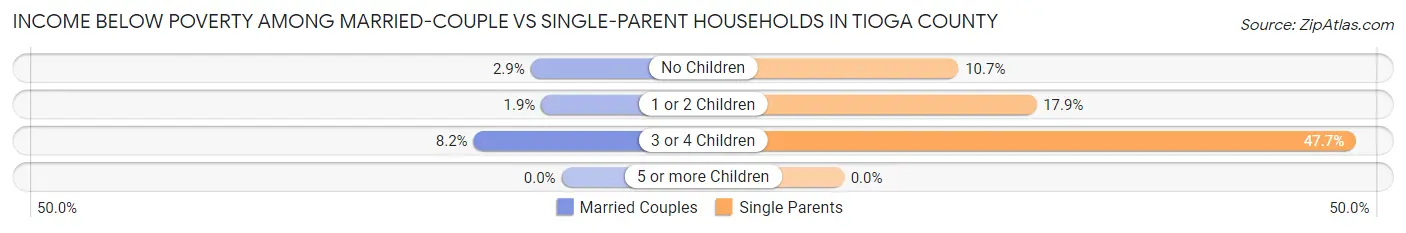
| Children | Married-Couple Families | Single-Parent Households |
| No Children | 203 (2.9%) | 133 (10.7%) |
| 1 or 2 Children | 51 (1.9%) | 284 (17.9%) |
| 3 or 4 Children | 46 (8.2%) | 156 (47.7%) |
| 5 or more Children | 0 (0.0%) | 0 (0.0%) |
| Total | 300 (2.9%) | 573 (18.1%) |
Race in Tioga County
The most populous races in Tioga County are White / Caucasian (45,662 | 94.5%), Two or more Races (1,093 | 2.3%), and Hispanic or Latino (1,043 | 2.2%).
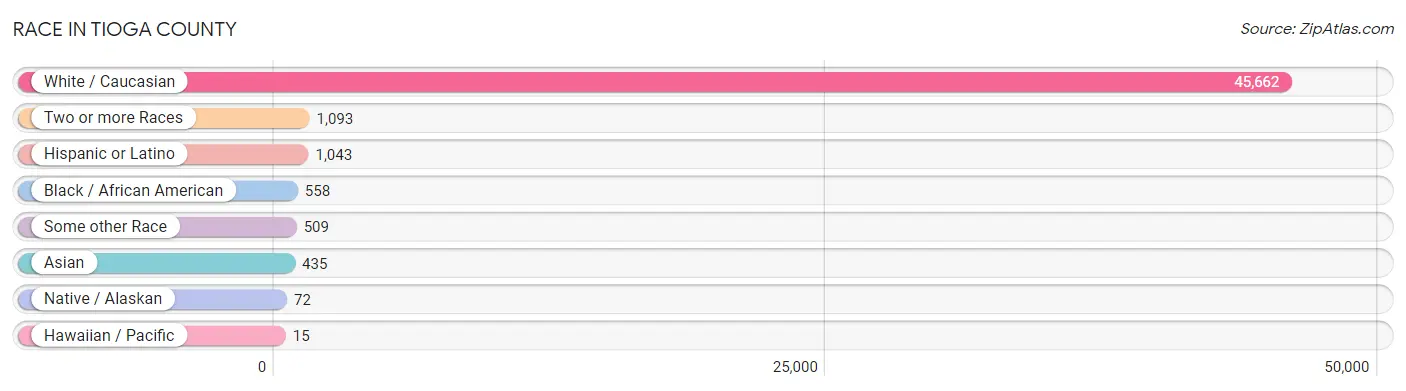
| Race | # Population | % Population |
| Asian | 435 | 0.9% |
| Black / African American | 558 | 1.1% |
| Hawaiian / Pacific | 15 | 0.0% |
| Hispanic or Latino | 1,043 | 2.2% |
| Native / Alaskan | 72 | 0.2% |
| White / Caucasian | 45,662 | 94.5% |
| Two or more Races | 1,093 | 2.3% |
| Some other Race | 509 | 1.1% |
| Total | 48,344 | 100.0% |
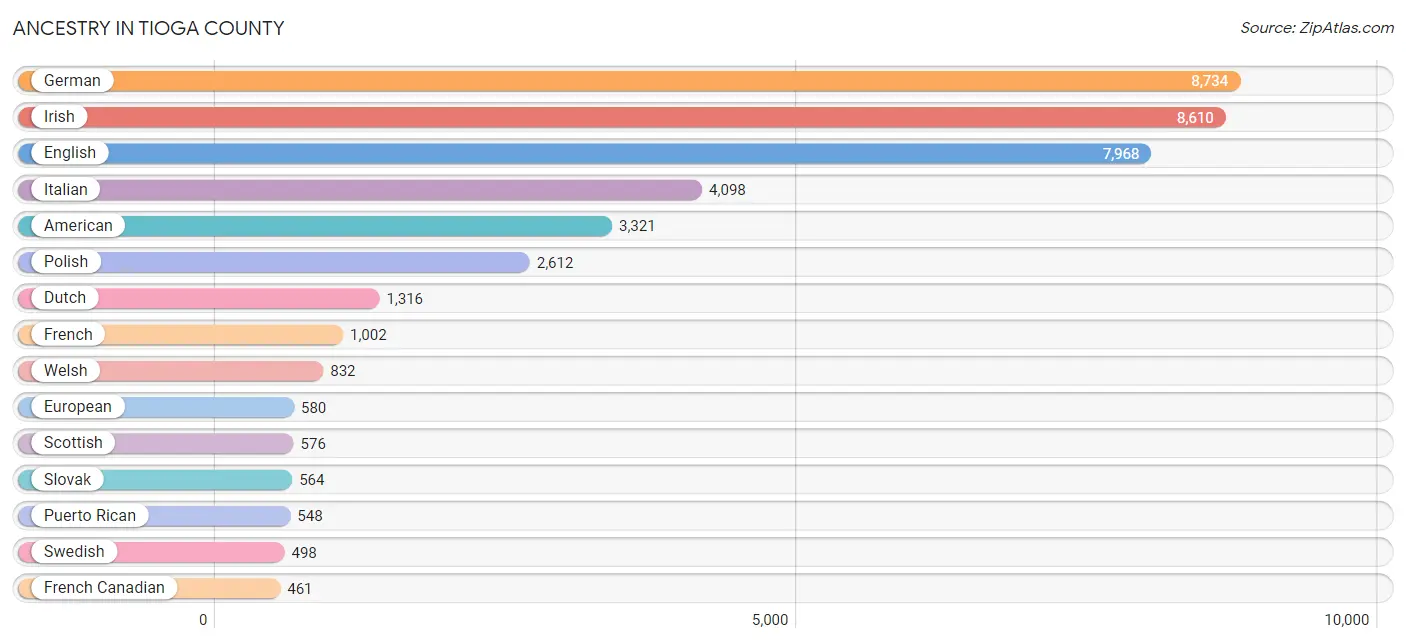
Ancestry in Tioga County
The most populous ancestries reported in Tioga County are German (8,734 | 18.1%), Irish (8,610 | 17.8%), English (7,968 | 16.5%), Italian (4,098 | 8.5%), and American (3,321 | 6.9%), together accounting for 67.7% of all Tioga County residents.
| Ancestry | # Population | % Population |
| African | 70 | 0.1% |
| American | 3,321 | 6.9% |
| Arab | 59 | 0.1% |
| Argentinean | 23 | 0.1% |
| Armenian | 160 | 0.3% |
| Austrian | 146 | 0.3% |
| Basque | 16 | 0.0% |
| Belgian | 75 | 0.2% |
| Bhutanese | 20 | 0.0% |
| Blackfeet | 15 | 0.0% |
| British | 127 | 0.3% |
| Burmese | 22 | 0.1% |
| Canadian | 82 | 0.2% |
| Carpatho Rusyn | 17 | 0.0% |
| Central American | 3 | 0.0% |
| Central American Indian | 7 | 0.0% |
| Cherokee | 62 | 0.1% |
| Chilean | 7 | 0.0% |
| Choctaw | 55 | 0.1% |
| Colombian | 44 | 0.1% |
| Croatian | 29 | 0.1% |
| Cuban | 32 | 0.1% |
| Czech | 202 | 0.4% |
| Czechoslovakian | 174 | 0.4% |
| Danish | 39 | 0.1% |
| Dominican | 47 | 0.1% |
| Dutch | 1,316 | 2.7% |
| Eastern European | 102 | 0.2% |
| Ecuadorian | 44 | 0.1% |
| English | 7,968 | 16.5% |
| European | 580 | 1.2% |
| Filipino | 24 | 0.1% |
| Finnish | 118 | 0.2% |
| French | 1,002 | 2.1% |
| French American Indian | 13 | 0.0% |
| French Canadian | 461 | 0.9% |
| German | 8,734 | 18.1% |
| Ghanaian | 35 | 0.1% |
| Greek | 85 | 0.2% |
| Guatemalan | 3 | 0.0% |
| Guyanese | 12 | 0.0% |
| Haitian | 2 | 0.0% |
| Hungarian | 216 | 0.4% |
| Indian (Asian) | 208 | 0.4% |
| Indonesian | 45 | 0.1% |
| Iranian | 6 | 0.0% |
| Irish | 8,610 | 17.8% |
| Iroquois | 10 | 0.0% |
| Italian | 4,098 | 8.5% |
| Jamaican | 3 | 0.0% |
| Korean | 101 | 0.2% |
| Lebanese | 46 | 0.1% |
| Lithuanian | 81 | 0.2% |
| Luxembourger | 2 | 0.0% |
| Mexican | 87 | 0.2% |
| Native Hawaiian | 15 | 0.0% |
| Navajo | 8 | 0.0% |
| Northern European | 55 | 0.1% |
| Norwegian | 277 | 0.6% |
| Pennsylvania German | 195 | 0.4% |
| Peruvian | 8 | 0.0% |
| Polish | 2,612 | 5.4% |
| Portuguese | 154 | 0.3% |
| Puerto Rican | 548 | 1.1% |
| Romanian | 21 | 0.0% |
| Russian | 419 | 0.9% |
| Scandinavian | 54 | 0.1% |
| Scotch-Irish | 334 | 0.7% |
| Scottish | 576 | 1.2% |
| Serbian | 59 | 0.1% |
| Sioux | 16 | 0.0% |
| Slavic | 36 | 0.1% |
| Slovak | 564 | 1.2% |
| Slovene | 2 | 0.0% |
| South American | 135 | 0.3% |
| Spanish | 138 | 0.3% |
| Sri Lankan | 61 | 0.1% |
| Subsaharan African | 154 | 0.3% |
| Swedish | 498 | 1.0% |
| Swiss | 108 | 0.2% |
| Syrian | 27 | 0.1% |
| Thai | 79 | 0.2% |
| Trinidadian and Tobagonian | 11 | 0.0% |
| Ukrainian | 356 | 0.7% |
| Uruguayan | 3 | 0.0% |
| Venezuelan | 6 | 0.0% |
| Welsh | 832 | 1.7% |
| Yugoslavian | 9 | 0.0% | View All 88 Rows |
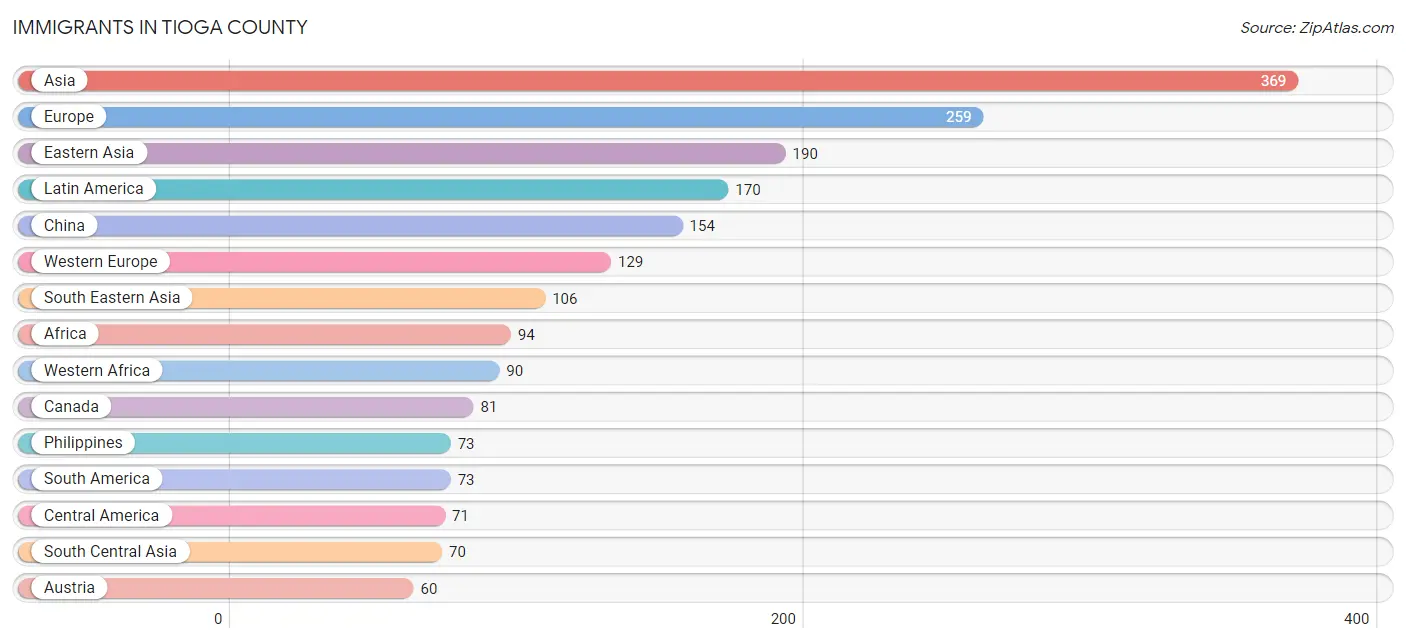
Immigrants in Tioga County
The most numerous immigrant groups reported in Tioga County came from Asia (369 | 0.8%), Europe (259 | 0.5%), Eastern Asia (190 | 0.4%), Latin America (170 | 0.4%), and China (154 | 0.3%), together accounting for 2.4% of all Tioga County residents.
| Immigration Origin | # Population | % Population |
| Africa | 94 | 0.2% |
| Argentina | 6 | 0.0% |
| Asia | 369 | 0.8% |
| Austria | 60 | 0.1% |
| Brazil | 7 | 0.0% |
| Canada | 81 | 0.2% |
| Caribbean | 26 | 0.1% |
| Central America | 71 | 0.2% |
| Chile | 7 | 0.0% |
| China | 154 | 0.3% |
| Colombia | 31 | 0.1% |
| Cuba | 1 | 0.0% |
| Dominican Republic | 12 | 0.0% |
| Eastern Africa | 4 | 0.0% |
| Eastern Asia | 190 | 0.4% |
| Eastern Europe | 34 | 0.1% |
| Ecuador | 10 | 0.0% |
| England | 24 | 0.1% |
| Europe | 259 | 0.5% |
| France | 10 | 0.0% |
| Germany | 59 | 0.1% |
| Guatemala | 52 | 0.1% |
| Haiti | 2 | 0.0% |
| Hong Kong | 12 | 0.0% |
| Hungary | 3 | 0.0% |
| India | 41 | 0.1% |
| Iran | 6 | 0.0% |
| Ireland | 8 | 0.0% |
| Italy | 24 | 0.1% |
| Japan | 20 | 0.0% |
| Kazakhstan | 4 | 0.0% |
| Korea | 16 | 0.0% |
| Latin America | 170 | 0.4% |
| Mexico | 19 | 0.0% |
| Nigeria | 2 | 0.0% |
| Northern Europe | 44 | 0.1% |
| Pakistan | 19 | 0.0% |
| Peru | 8 | 0.0% |
| Philippines | 73 | 0.2% |
| Portugal | 24 | 0.1% |
| Romania | 13 | 0.0% |
| Russia | 15 | 0.0% |
| South America | 73 | 0.2% |
| South Central Asia | 70 | 0.1% |
| South Eastern Asia | 106 | 0.2% |
| Southern Europe | 52 | 0.1% |
| Spain | 4 | 0.0% |
| Syria | 3 | 0.0% |
| Taiwan | 11 | 0.0% |
| Thailand | 11 | 0.0% |
| Trinidad and Tobago | 11 | 0.0% |
| Ukraine | 3 | 0.0% |
| Uruguay | 4 | 0.0% |
| Vietnam | 17 | 0.0% |
| Western Africa | 90 | 0.2% |
| Western Asia | 3 | 0.0% |
| Western Europe | 129 | 0.3% | View All 57 Rows |
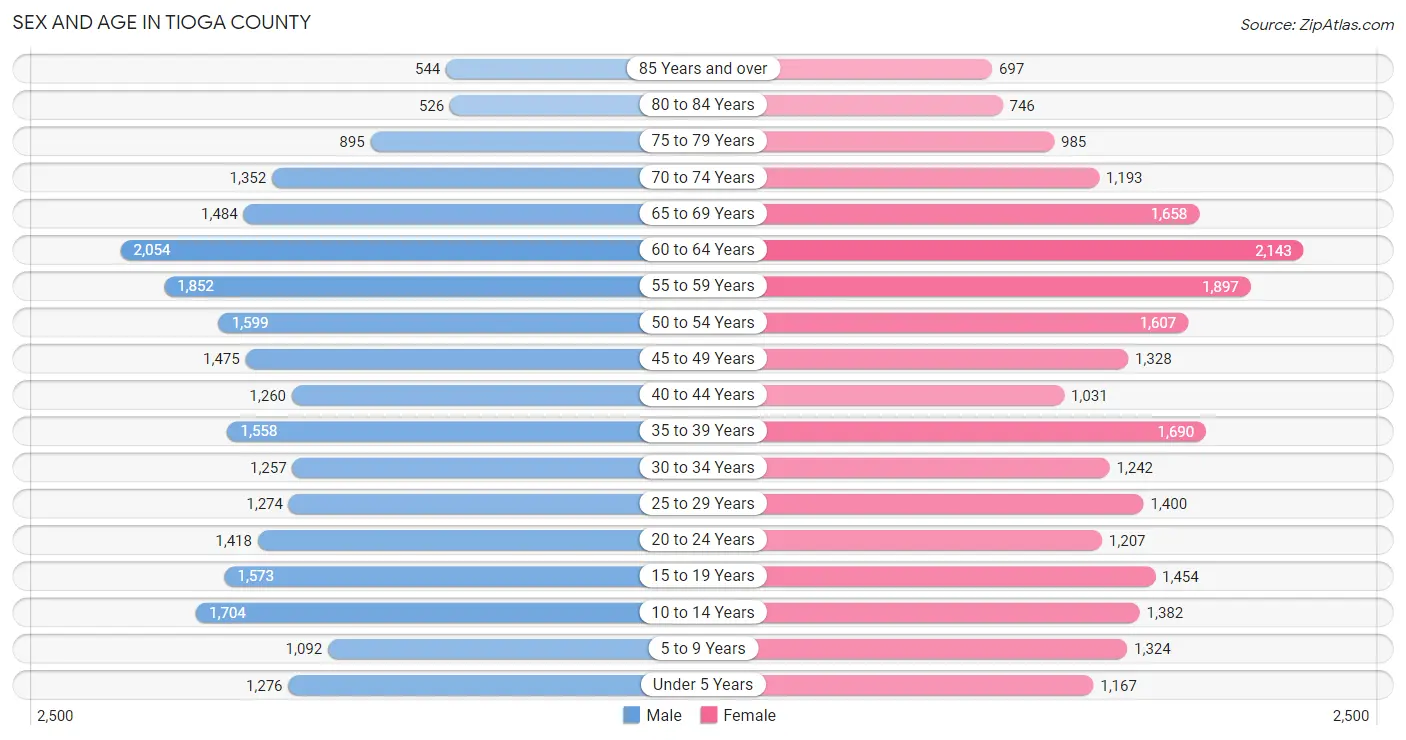
Sex and Age in Tioga County
Sex and Age in Tioga County
The most populous age groups in Tioga County are 60 to 64 Years (2,054 | 8.5%) for men and 60 to 64 Years (2,143 | 8.9%) for women.
| Age Bracket | Male | Female |
| Under 5 Years | 1,276 (5.3%) | 1,167 (4.8%) |
| 5 to 9 Years | 1,092 (4.5%) | 1,324 (5.5%) |
| 10 to 14 Years | 1,704 (7.0%) | 1,382 (5.7%) |
| 15 to 19 Years | 1,573 (6.5%) | 1,454 (6.0%) |
| 20 to 24 Years | 1,418 (5.9%) | 1,207 (5.0%) |
| 25 to 29 Years | 1,274 (5.3%) | 1,400 (5.8%) |
| 30 to 34 Years | 1,257 (5.2%) | 1,242 (5.1%) |
| 35 to 39 Years | 1,558 (6.4%) | 1,690 (7.0%) |
| 40 to 44 Years | 1,260 (5.2%) | 1,031 (4.3%) |
| 45 to 49 Years | 1,475 (6.1%) | 1,328 (5.5%) |
| 50 to 54 Years | 1,599 (6.6%) | 1,607 (6.7%) |
| 55 to 59 Years | 1,852 (7.7%) | 1,897 (7.9%) |
| 60 to 64 Years | 2,054 (8.5%) | 2,143 (8.9%) |
| 65 to 69 Years | 1,484 (6.1%) | 1,658 (6.9%) |
| 70 to 74 Years | 1,352 (5.6%) | 1,193 (4.9%) |
| 75 to 79 Years | 895 (3.7%) | 985 (4.1%) |
| 80 to 84 Years | 526 (2.2%) | 746 (3.1%) |
| 85 Years and over | 544 (2.2%) | 697 (2.9%) |
| Total | 24,193 (100.0%) | 24,151 (100.0%) |
Families and Households in Tioga County
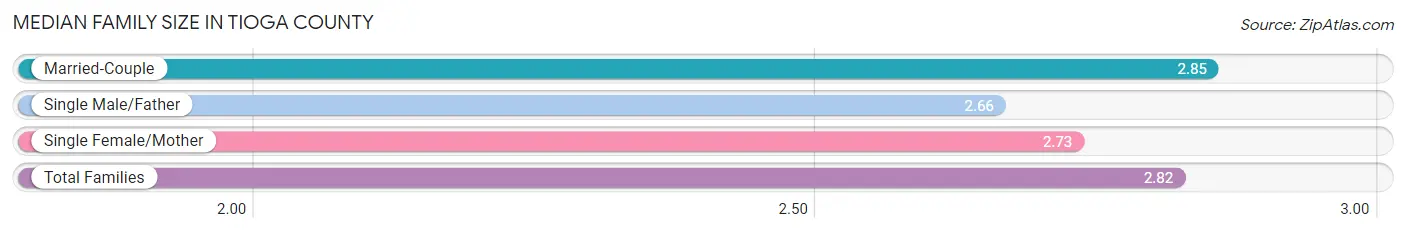
Median Family Size in Tioga County
The median family size in Tioga County is 2.82 persons per family, with married-couple families (10,329 | 76.6%) accounting for the largest median family size of 2.85 persons per family. On the other hand, single male/father families (1,272 | 9.4%) represent the smallest median family size with 2.66 persons per family.
| Family Type | # Families | Family Size |
| Married-Couple | 10,329 (76.6%) | 2.85 |
| Single Male/Father | 1,272 (9.4%) | 2.66 |
| Single Female/Mother | 1,885 (14.0%) | 2.73 |
| Total Families | 13,486 (100.0%) | 2.82 |
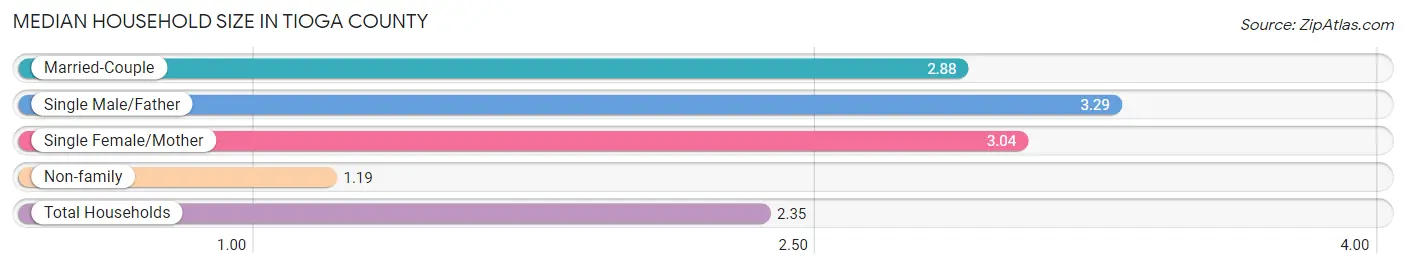
Median Household Size in Tioga County
The median household size in Tioga County is 2.35 persons per household, with single male/father households (1,272 | 6.3%) accounting for the largest median household size of 3.29 persons per household. non-family households (6,826 | 33.6%) represent the smallest median household size with 1.19 persons per household.
| Household Type | # Households | Household Size |
| Married-Couple | 10,329 (50.8%) | 2.88 |
| Single Male/Father | 1,272 (6.3%) | 3.29 |
| Single Female/Mother | 1,885 (9.3%) | 3.04 |
| Non-family | 6,826 (33.6%) | 1.19 |
| Total Households | 20,312 (100.0%) | 2.35 |
Household Size by Marriage Status in Tioga County
Out of a total of 20,312 households in Tioga County, 13,486 (66.4%) are family households, while 6,826 (33.6%) are nonfamily households. The most numerous type of family households are 2-person households, comprising 6,934, and the most common type of nonfamily households are 1-person households, comprising 5,714.
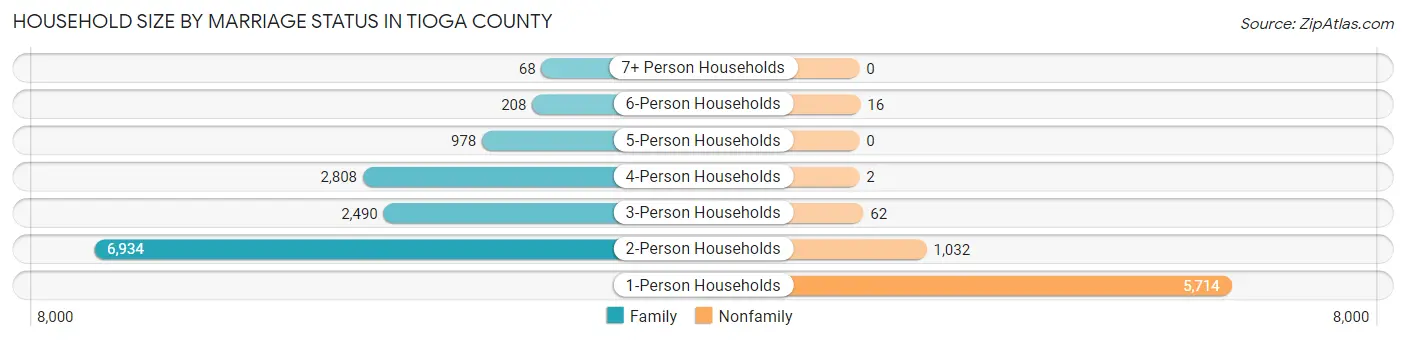
| Household Size | Family Households | Nonfamily Households |
| 1-Person Households | - | 5,714 (28.1%) |
| 2-Person Households | 6,934 (34.1%) | 1,032 (5.1%) |
| 3-Person Households | 2,490 (12.3%) | 62 (0.3%) |
| 4-Person Households | 2,808 (13.8%) | 2 (0.0%) |
| 5-Person Households | 978 (4.8%) | 0 (0.0%) |
| 6-Person Households | 208 (1.0%) | 16 (0.1%) |
| 7+ Person Households | 68 (0.3%) | 0 (0.0%) |
| Total | 13,486 (66.4%) | 6,826 (33.6%) |
Female Fertility in Tioga County
Fertility by Age in Tioga County
Average fertility rate in Tioga County is 53.0 births per 1,000 women. Women in the age bracket of 20 to 34 years have the highest fertility rate with 97.0 births per 1,000 women. Women in the age bracket of 20 to 34 years acount for 72.6% of all women with births.
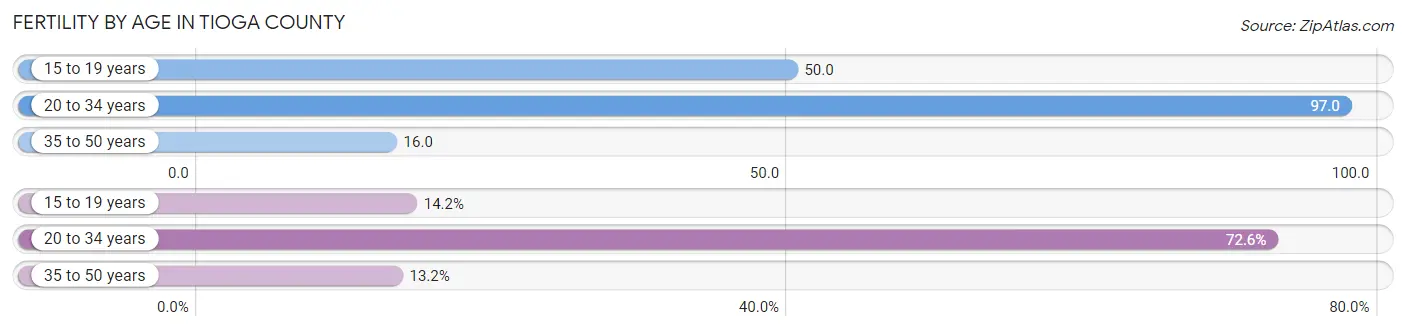
| Age Bracket | Women with Births | Births / 1,000 Women |
| 15 to 19 years | 73 (14.2%) | 50.0 |
| 20 to 34 years | 374 (72.6%) | 97.0 |
| 35 to 50 years | 68 (13.2%) | 16.0 |
| Total | 515 (100.0%) | 53.0 |
Fertility by Age by Marriage Status in Tioga County
75.7% of women with births (515) in Tioga County are married. The highest percentage of unmarried women with births falls into 15 to 19 years age bracket with 100.0% of them unmarried at the time of birth, while the lowest percentage of unmarried women with births belong to 35 to 50 years age bracket with 0.0% of them unmarried.
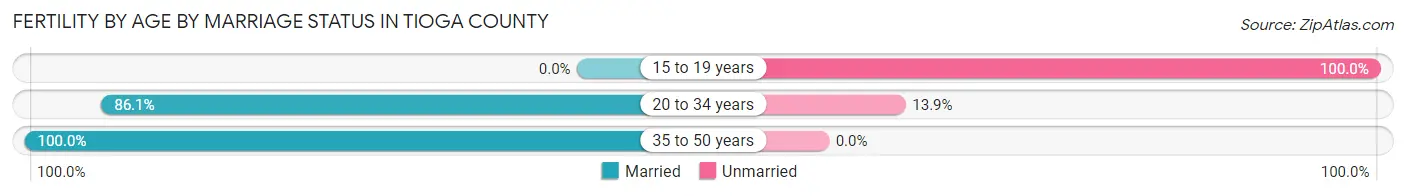
| Age Bracket | Married | Unmarried |
| 15 to 19 years | 0 (0.0%) | 73 (100.0%) |
| 20 to 34 years | 322 (86.1%) | 52 (13.9%) |
| 35 to 50 years | 68 (100.0%) | 0 (0.0%) |
| Total | 390 (75.7%) | 125 (24.3%) |
Fertility by Education in Tioga County
Average fertility rate in Tioga County is 53.0 births per 1,000 women. Women with the education attainment of graduate degree have the highest fertility rate of 83.0 births per 1,000 women, while women with the education attainment of less than high school have the lowest fertility at 33.0 births per 1,000 women. Women with the education attainment of college or associate's degree represent 29.7% of all women with births.
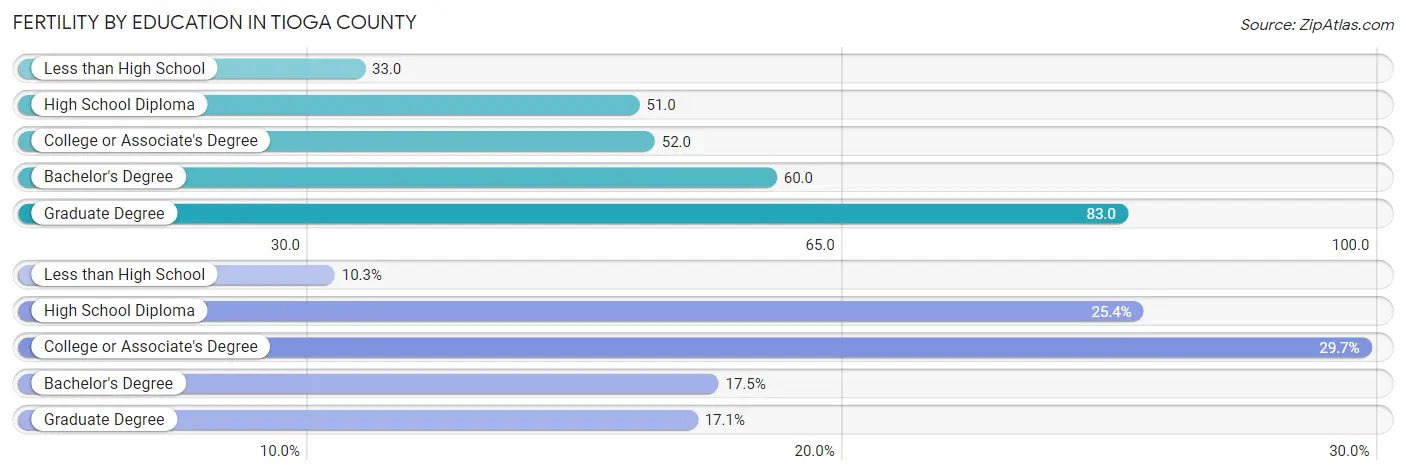
| Educational Attainment | Women with Births | Births / 1,000 Women |
| Less than High School | 53 (10.3%) | 33.0 |
| High School Diploma | 131 (25.4%) | 51.0 |
| College or Associate's Degree | 153 (29.7%) | 52.0 |
| Bachelor's Degree | 90 (17.5%) | 60.0 |
| Graduate Degree | 88 (17.1%) | 83.0 |
| Total | 515 (100.0%) | 53.0 |
Fertility by Education by Marriage Status in Tioga County
24.3% of women with births in Tioga County are unmarried. Women with the educational attainment of graduate degree are most likely to be married with 100.0% of them married at childbirth, while women with the educational attainment of high school diploma are least likely to be married with 57.3% of them unmarried at childbirth.
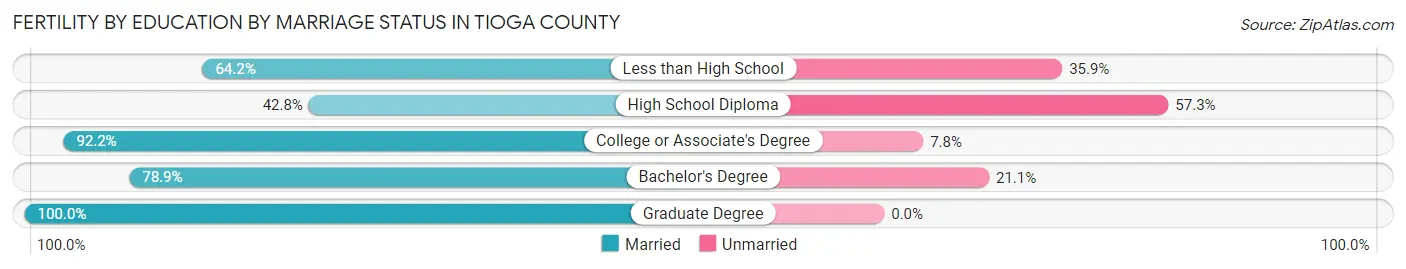
| Educational Attainment | Married | Unmarried |
| Less than High School | 34 (64.1%) | 19 (35.8%) |
| High School Diploma | 56 (42.7%) | 75 (57.3%) |
| College or Associate's Degree | 141 (92.2%) | 12 (7.8%) |
| Bachelor's Degree | 71 (78.9%) | 19 (21.1%) |
| Graduate Degree | 88 (100.0%) | 0 (0.0%) |
| Total | 390 (75.7%) | 125 (24.3%) |
Employment Characteristics in Tioga County
Employment by Class of Employer in Tioga County
Among the 22,405 employed individuals in Tioga County, private company employees (13,895 | 62.0%), not-for-profit organizations (3,042 | 13.6%), and local government employees (2,025 | 9.0%) make up the most common classes of employment.
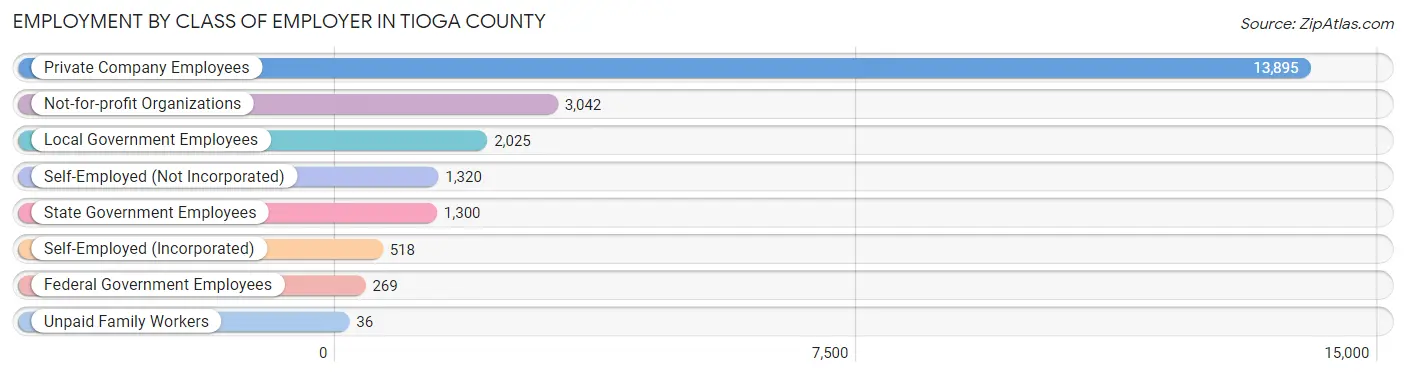
| Employer Class | # Employees | % Employees |
| Private Company Employees | 13,895 | 62.0% |
| Self-Employed (Incorporated) | 518 | 2.3% |
| Self-Employed (Not Incorporated) | 1,320 | 5.9% |
| Not-for-profit Organizations | 3,042 | 13.6% |
| Local Government Employees | 2,025 | 9.0% |
| State Government Employees | 1,300 | 5.8% |
| Federal Government Employees | 269 | 1.2% |
| Unpaid Family Workers | 36 | 0.2% |
| Total | 22,405 | 100.0% |
Employment Status by Age in Tioga County
According to the labor force statistics for Tioga County, out of the total population over 16 years of age (39,720), 60.6% or 24,070 individuals are in the labor force, with 5.6% or 1,348 of them unemployed. The age group with the highest labor force participation rate is 25 to 29 years, with 88.0% or 2,353 individuals in the labor force. Within the labor force, the 25 to 29 years age range has the highest percentage of unemployed individuals, with 8.9% or 209 of them being unemployed.
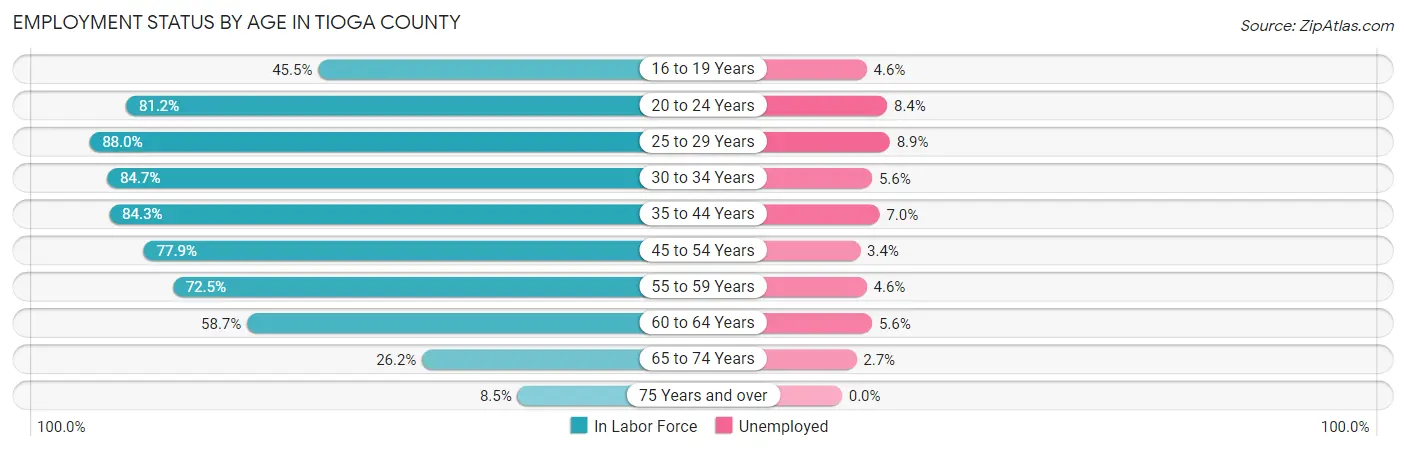
| Age Bracket | In Labor Force | Unemployed |
| 16 to 19 Years | 1,068 (45.5%) | 49 (4.6%) |
| 20 to 24 Years | 2,132 (81.2%) | 179 (8.4%) |
| 25 to 29 Years | 2,353 (88.0%) | 209 (8.9%) |
| 30 to 34 Years | 2,117 (84.7%) | 119 (5.6%) |
| 35 to 44 Years | 4,669 (84.3%) | 327 (7.0%) |
| 45 to 54 Years | 4,681 (77.9%) | 159 (3.4%) |
| 55 to 59 Years | 2,718 (72.5%) | 125 (4.6%) |
| 60 to 64 Years | 2,464 (58.7%) | 138 (5.6%) |
| 65 to 74 Years | 1,490 (26.2%) | 40 (2.7%) |
| 75 Years and over | 373 (8.5%) | 0 (0.0%) |
| Total | 24,070 (60.6%) | 1,348 (5.6%) |
Employment Status by Educational Attainment in Tioga County
According to labor force statistics for Tioga County, 77.0% of individuals (18,994) out of the total population between 25 and 64 years of age (24,667) are in the labor force, with 5.7% or 1,083 of them being unemployed. The group with the highest labor force participation rate are those with the educational attainment of bachelor's degree or higher, with 82.8% or 5,689 individuals in the labor force. Within the labor force, individuals with high school diploma education have the highest percentage of unemployment, with 8.5% or 516 of them being unemployed.
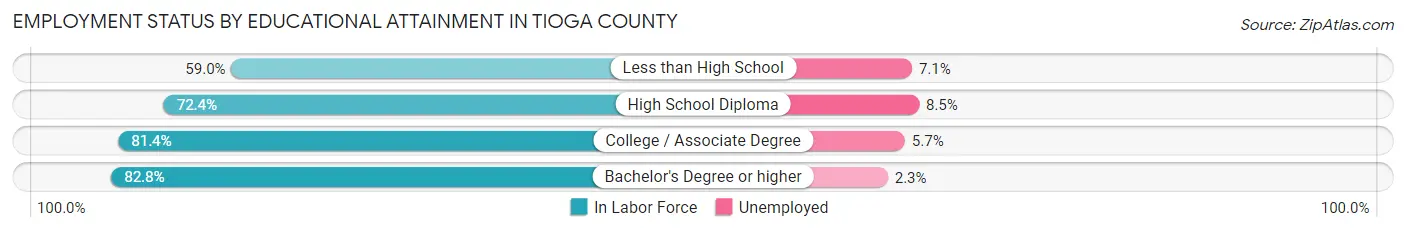
| Educational Attainment | In Labor Force | Unemployed |
| Less than High School | 1,081 (59.0%) | 130 (7.1%) |
| High School Diploma | 6,071 (72.4%) | 713 (8.5%) |
| College / Associate Degree | 6,168 (81.4%) | 432 (5.7%) |
| Bachelor's Degree or higher | 5,689 (82.8%) | 158 (2.3%) |
| Total | 18,994 (77.0%) | 1,406 (5.7%) |
Employment Occupations by Sex in Tioga County
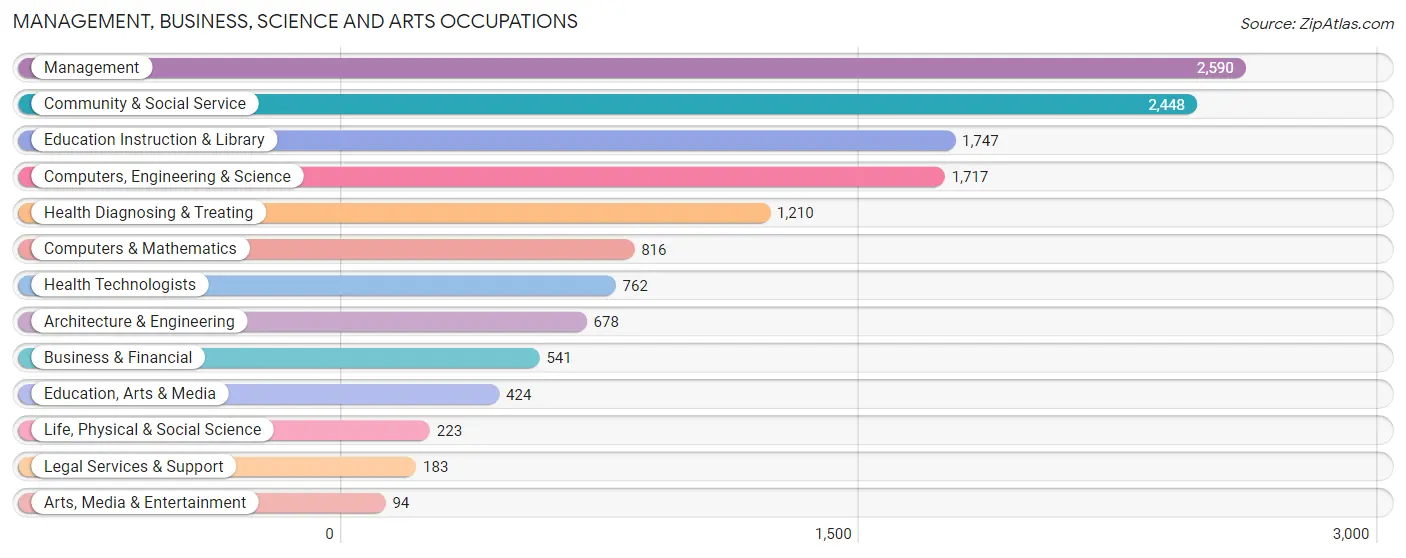
Management, Business, Science and Arts Occupations
The most common Management, Business, Science and Arts occupations in Tioga County are Management (2,590 | 11.4%), Community & Social Service (2,448 | 10.8%), Education Instruction & Library (1,747 | 7.7%), Computers, Engineering & Science (1,717 | 7.6%), and Health Diagnosing & Treating (1,210 | 5.3%).
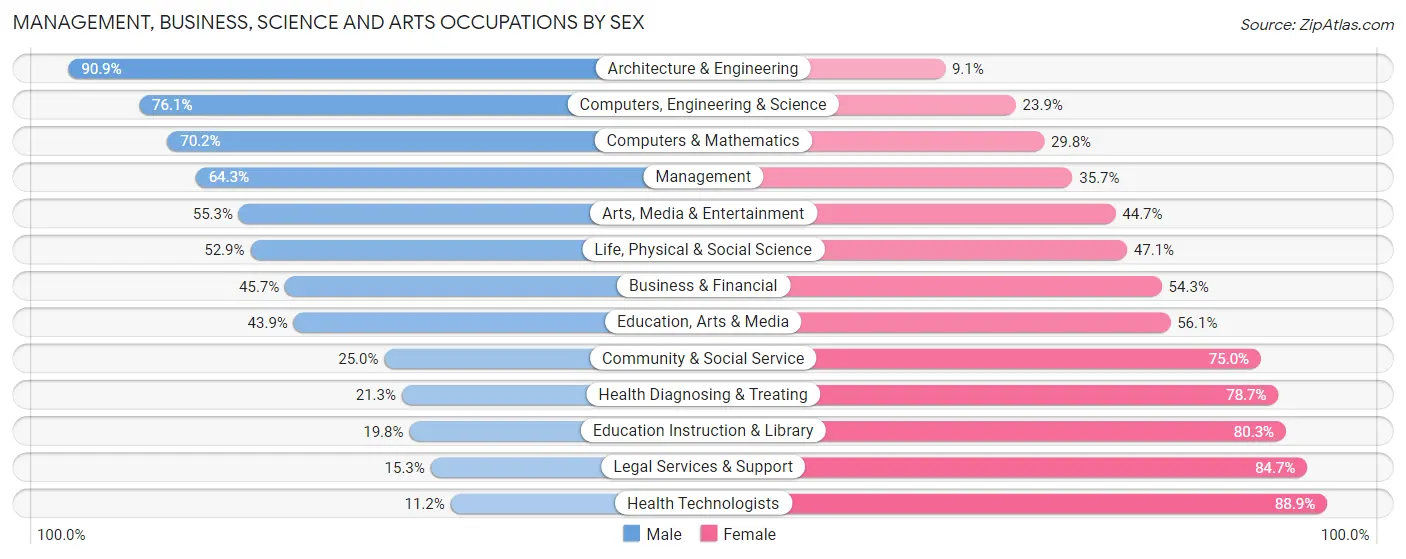
Management, Business, Science and Arts Occupations by Sex
Within the Management, Business, Science and Arts occupations in Tioga County, the most male-oriented occupations are Architecture & Engineering (90.9%), Computers, Engineering & Science (76.1%), and Computers & Mathematics (70.2%), while the most female-oriented occupations are Health Technologists (88.8%), Legal Services & Support (84.7%), and Education Instruction & Library (80.2%).
| Occupation | Male | Female |
| Management | 1,665 (64.3%) | 925 (35.7%) |
| Business & Financial | 247 (45.7%) | 294 (54.3%) |
| Computers, Engineering & Science | 1,307 (76.1%) | 410 (23.9%) |
| Computers & Mathematics | 573 (70.2%) | 243 (29.8%) |
| Architecture & Engineering | 616 (90.9%) | 62 (9.1%) |
| Life, Physical & Social Science | 118 (52.9%) | 105 (47.1%) |
| Community & Social Service | 611 (25.0%) | 1,837 (75.0%) |
| Education, Arts & Media | 186 (43.9%) | 238 (56.1%) |
| Legal Services & Support | 28 (15.3%) | 155 (84.7%) |
| Education Instruction & Library | 345 (19.8%) | 1,402 (80.2%) |
| Arts, Media & Entertainment | 52 (55.3%) | 42 (44.7%) |
| Health Diagnosing & Treating | 258 (21.3%) | 952 (78.7%) |
| Health Technologists | 85 (11.2%) | 677 (88.8%) |
| Total (Category) | 4,088 (48.1%) | 4,418 (51.9%) |
| Total (Overall) | 12,367 (54.4%) | 10,355 (45.6%) |
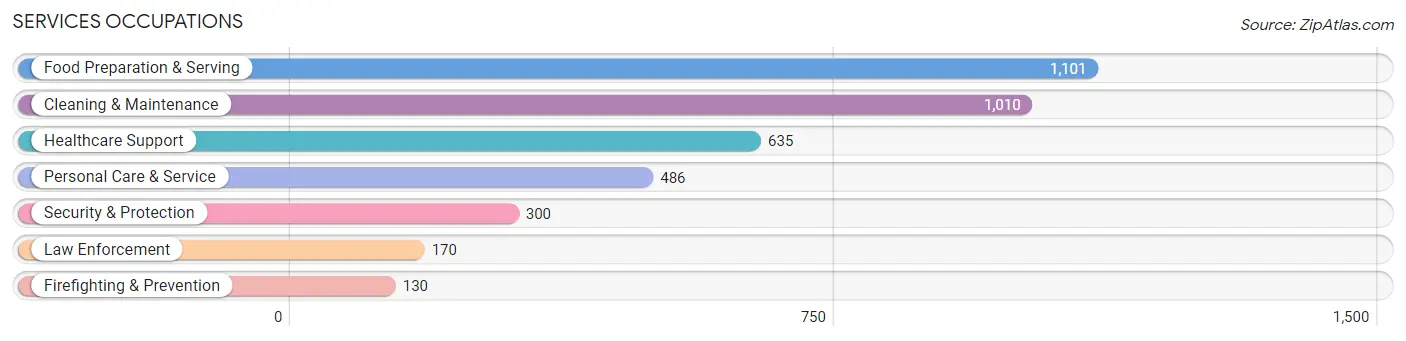
Services Occupations
The most common Services occupations in Tioga County are Food Preparation & Serving (1,101 | 4.9%), Cleaning & Maintenance (1,010 | 4.4%), Healthcare Support (635 | 2.8%), Personal Care & Service (486 | 2.1%), and Security & Protection (300 | 1.3%).
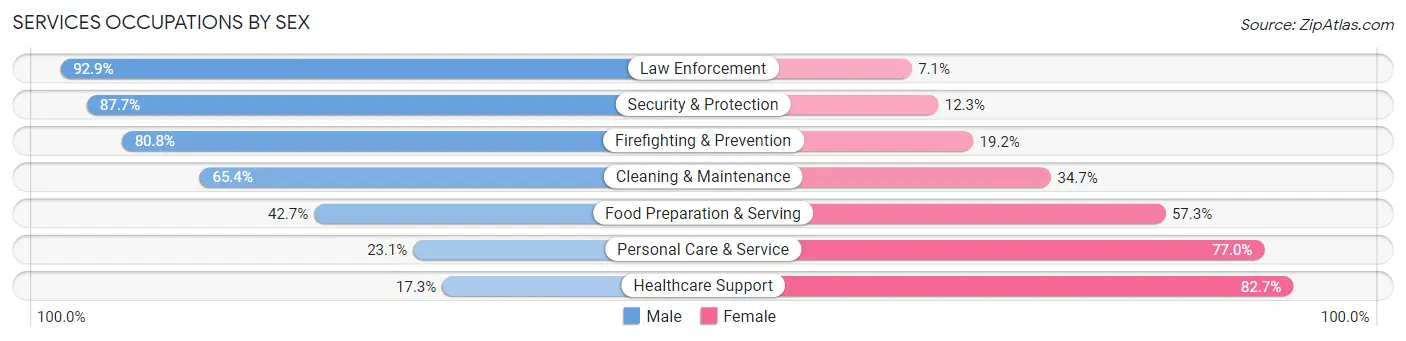
Services Occupations by Sex
Within the Services occupations in Tioga County, the most male-oriented occupations are Law Enforcement (92.9%), Security & Protection (87.7%), and Firefighting & Prevention (80.8%), while the most female-oriented occupations are Healthcare Support (82.7%), Personal Care & Service (76.9%), and Food Preparation & Serving (57.3%).
| Occupation | Male | Female |
| Healthcare Support | 110 (17.3%) | 525 (82.7%) |
| Security & Protection | 263 (87.7%) | 37 (12.3%) |
| Firefighting & Prevention | 105 (80.8%) | 25 (19.2%) |
| Law Enforcement | 158 (92.9%) | 12 (7.1%) |
| Food Preparation & Serving | 470 (42.7%) | 631 (57.3%) |
| Cleaning & Maintenance | 660 (65.3%) | 350 (34.6%) |
| Personal Care & Service | 112 (23.1%) | 374 (76.9%) |
| Total (Category) | 1,615 (45.7%) | 1,917 (54.3%) |
| Total (Overall) | 12,367 (54.4%) | 10,355 (45.6%) |
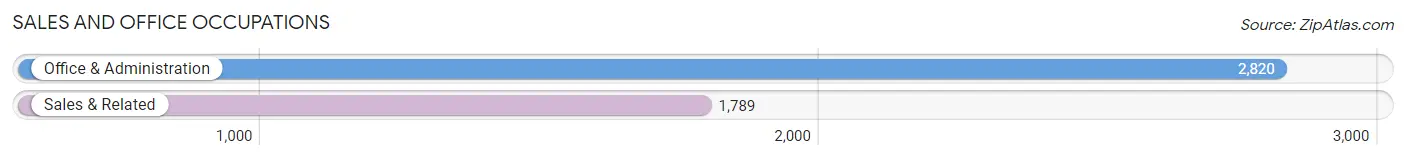
Sales and Office Occupations
The most common Sales and Office occupations in Tioga County are Office & Administration (2,820 | 12.4%), and Sales & Related (1,789 | 7.9%).
Sales and Office Occupations by Sex
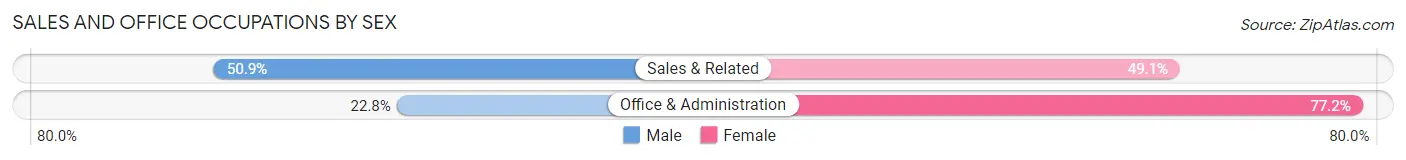
| Occupation | Male | Female |
| Sales & Related | 910 (50.9%) | 879 (49.1%) |
| Office & Administration | 642 (22.8%) | 2,178 (77.2%) |
| Total (Category) | 1,552 (33.7%) | 3,057 (66.3%) |
| Total (Overall) | 12,367 (54.4%) | 10,355 (45.6%) |
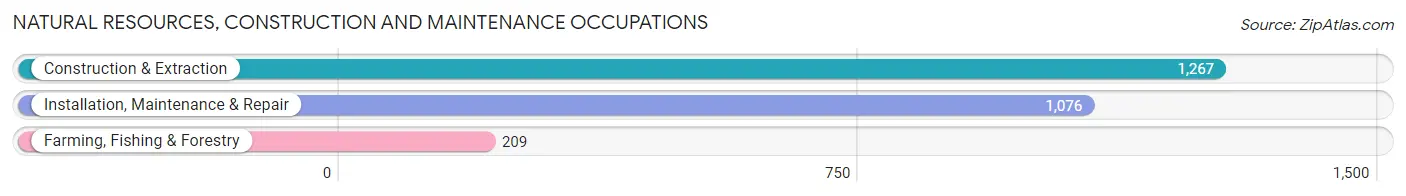
Natural Resources, Construction and Maintenance Occupations
The most common Natural Resources, Construction and Maintenance occupations in Tioga County are Construction & Extraction (1,267 | 5.6%), Installation, Maintenance & Repair (1,076 | 4.7%), and Farming, Fishing & Forestry (209 | 0.9%).
Natural Resources, Construction and Maintenance Occupations by Sex
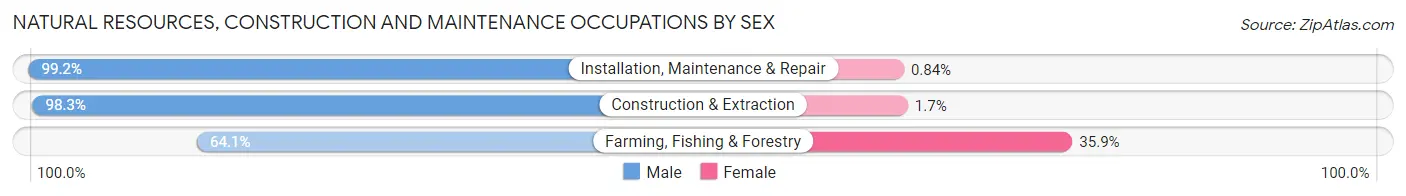
| Occupation | Male | Female |
| Farming, Fishing & Forestry | 134 (64.1%) | 75 (35.9%) |
| Construction & Extraction | 1,246 (98.3%) | 21 (1.7%) |
| Installation, Maintenance & Repair | 1,067 (99.2%) | 9 (0.8%) |
| Total (Category) | 2,447 (95.9%) | 105 (4.1%) |
| Total (Overall) | 12,367 (54.4%) | 10,355 (45.6%) |
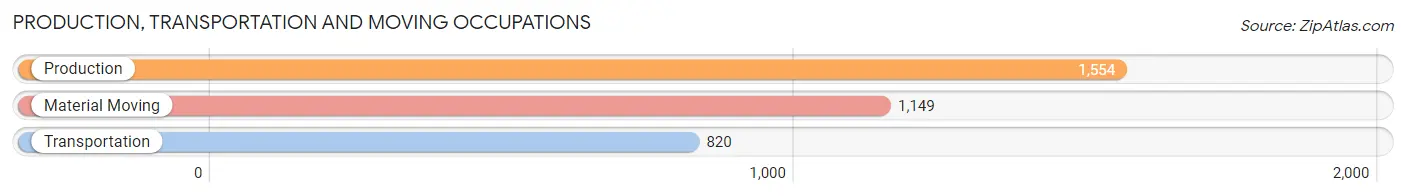
Production, Transportation and Moving Occupations
The most common Production, Transportation and Moving occupations in Tioga County are Production (1,554 | 6.8%), Material Moving (1,149 | 5.1%), and Transportation (820 | 3.6%).
Production, Transportation and Moving Occupations by Sex
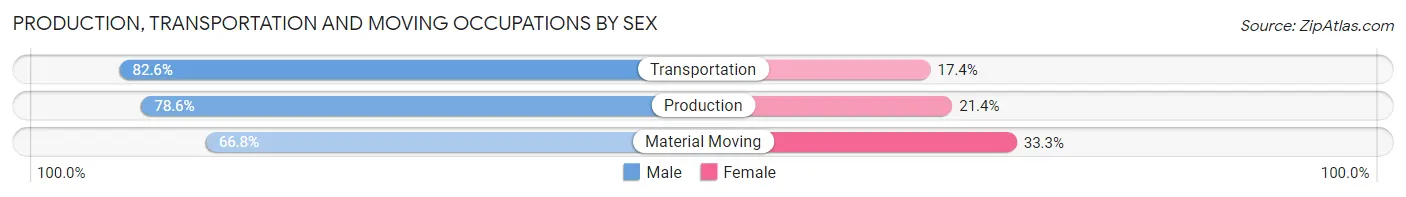
| Occupation | Male | Female |
| Production | 1,221 (78.6%) | 333 (21.4%) |
| Transportation | 677 (82.6%) | 143 (17.4%) |
| Material Moving | 767 (66.7%) | 382 (33.3%) |
| Total (Category) | 2,665 (75.6%) | 858 (24.3%) |
| Total (Overall) | 12,367 (54.4%) | 10,355 (45.6%) |
Employment Industries by Sex in Tioga County
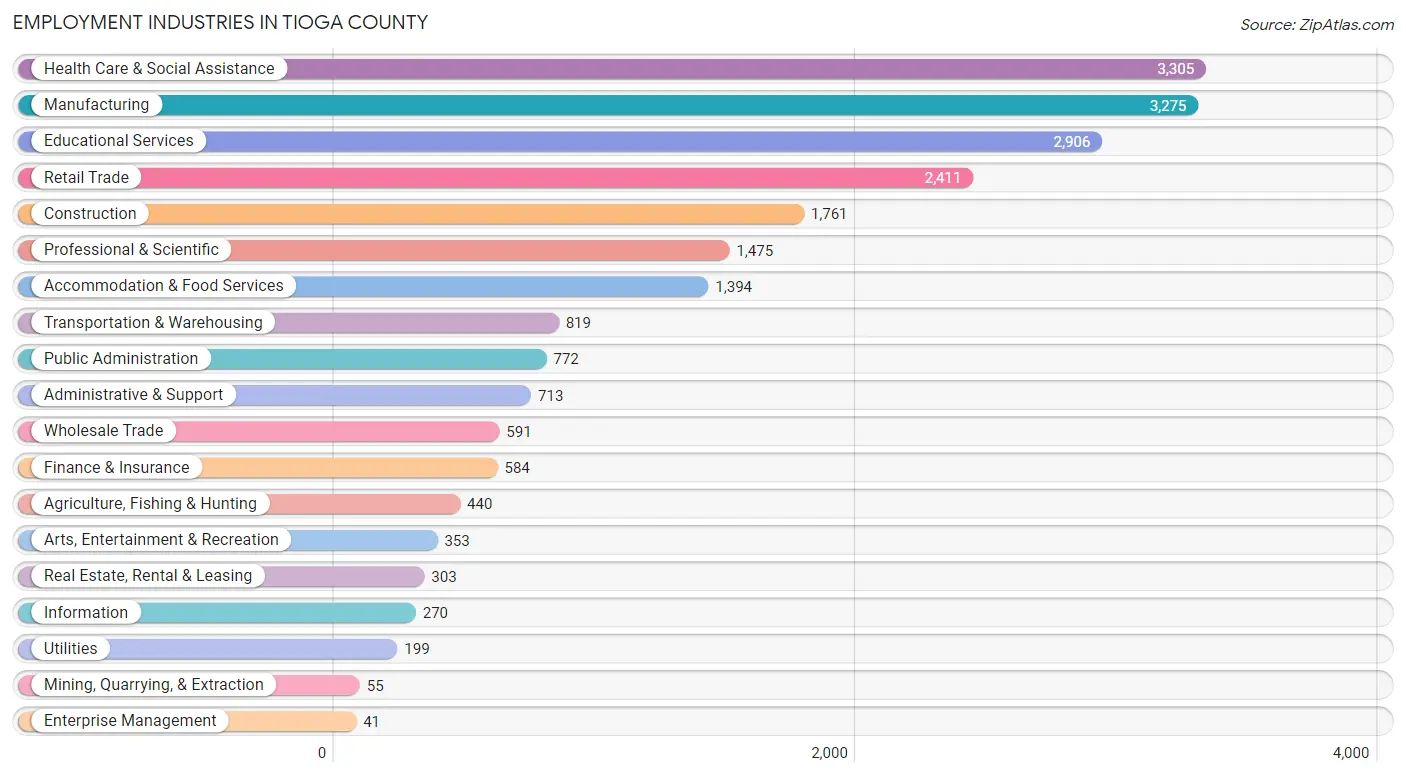
Employment Industries in Tioga County
The major employment industries in Tioga County include Health Care & Social Assistance (3,305 | 14.5%), Manufacturing (3,275 | 14.4%), Educational Services (2,906 | 12.8%), Retail Trade (2,411 | 10.6%), and Construction (1,761 | 7.7%).
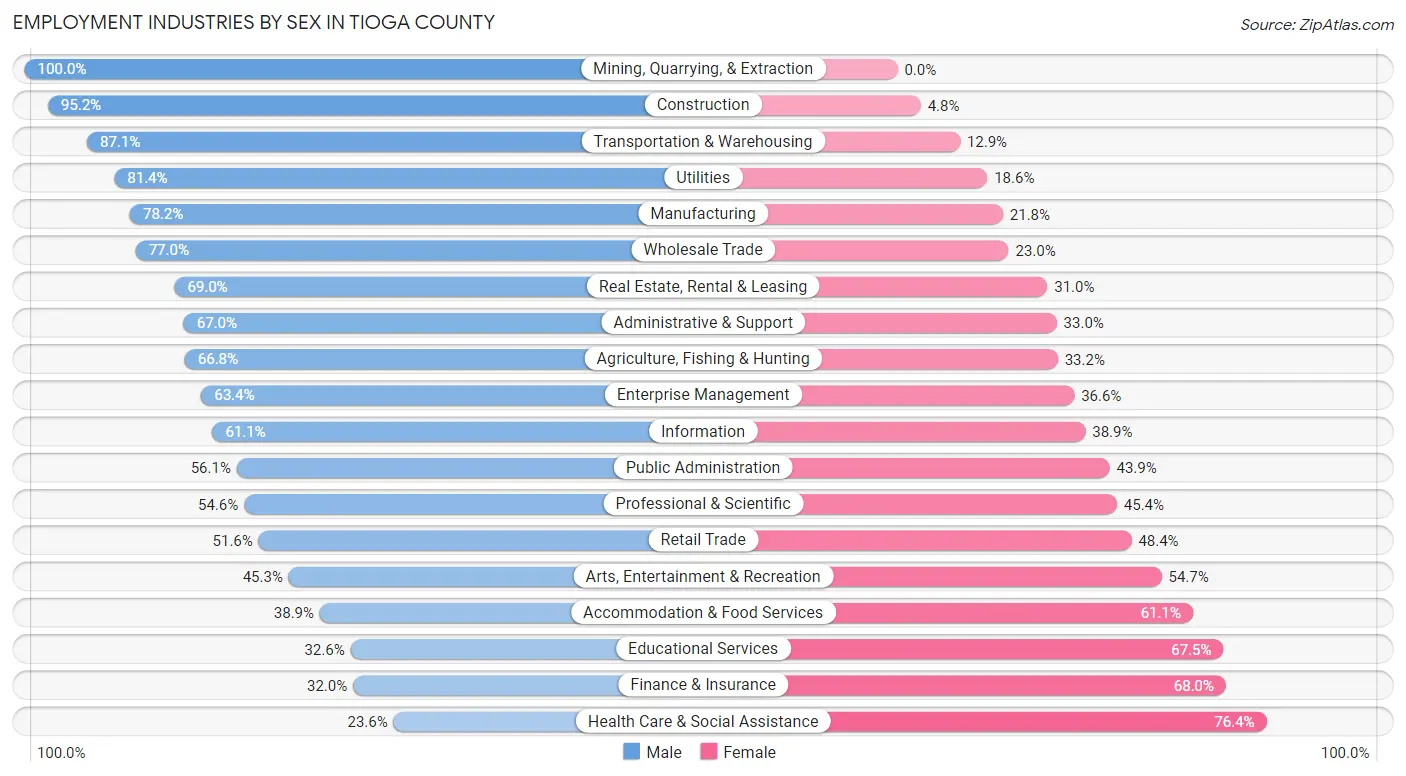
Employment Industries by Sex in Tioga County
The Tioga County industries that see more men than women are Mining, Quarrying, & Extraction (100.0%), Construction (95.2%), and Transportation & Warehousing (87.1%), whereas the industries that tend to have a higher number of women are Health Care & Social Assistance (76.4%), Finance & Insurance (68.0%), and Educational Services (67.4%).
| Industry | Male | Female |
| Agriculture, Fishing & Hunting | 294 (66.8%) | 146 (33.2%) |
| Mining, Quarrying, & Extraction | 55 (100.0%) | 0 (0.0%) |
| Construction | 1,676 (95.2%) | 85 (4.8%) |
| Manufacturing | 2,560 (78.2%) | 715 (21.8%) |
| Wholesale Trade | 455 (77.0%) | 136 (23.0%) |
| Retail Trade | 1,243 (51.6%) | 1,168 (48.4%) |
| Transportation & Warehousing | 713 (87.1%) | 106 (12.9%) |
| Utilities | 162 (81.4%) | 37 (18.6%) |
| Information | 165 (61.1%) | 105 (38.9%) |
| Finance & Insurance | 187 (32.0%) | 397 (68.0%) |
| Real Estate, Rental & Leasing | 209 (69.0%) | 94 (31.0%) |
| Professional & Scientific | 805 (54.6%) | 670 (45.4%) |
| Enterprise Management | 26 (63.4%) | 15 (36.6%) |
| Administrative & Support | 478 (67.0%) | 235 (33.0%) |
| Educational Services | 946 (32.6%) | 1,960 (67.4%) |
| Health Care & Social Assistance | 781 (23.6%) | 2,524 (76.4%) |
| Arts, Entertainment & Recreation | 160 (45.3%) | 193 (54.7%) |
| Accommodation & Food Services | 542 (38.9%) | 852 (61.1%) |
| Public Administration | 433 (56.1%) | 339 (43.9%) |
| Total | 12,367 (54.4%) | 10,355 (45.6%) |
Education in Tioga County
School Enrollment in Tioga County
The most common levels of schooling among the 9,831 students in Tioga County are middle school (2,420 | 24.6%), high school (2,241 | 22.8%), and elementary school (2,106 | 21.4%).
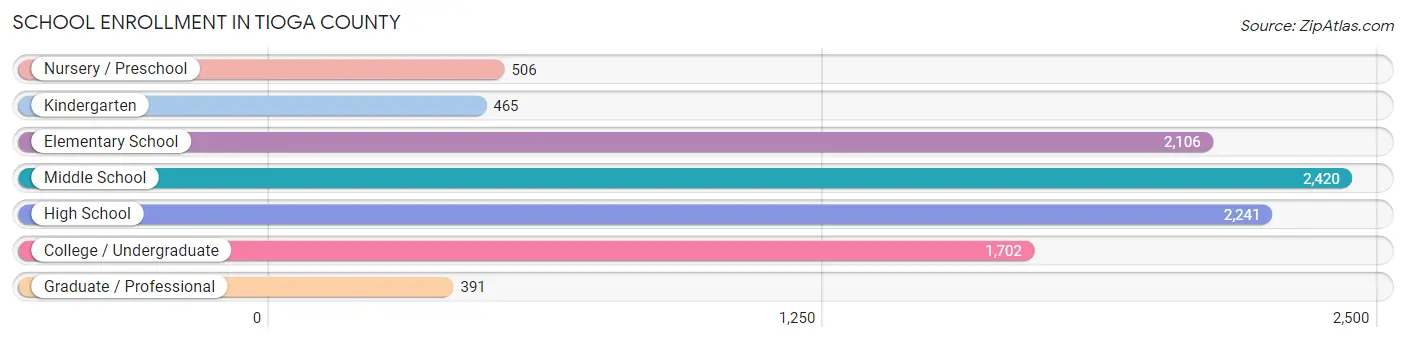
| School Level | # Students | % Students |
| Nursery / Preschool | 506 | 5.1% |
| Kindergarten | 465 | 4.7% |
| Elementary School | 2,106 | 21.4% |
| Middle School | 2,420 | 24.6% |
| High School | 2,241 | 22.8% |
| College / Undergraduate | 1,702 | 17.3% |
| Graduate / Professional | 391 | 4.0% |
| Total | 9,831 | 100.0% |
School Enrollment by Age by Funding Source in Tioga County
Out of a total of 9,831 students who are enrolled in schools in Tioga County, 983 (10.0%) attend a private institution, while the remaining 8,848 (90.0%) are enrolled in public schools. The age group of 35 years and over has the highest likelihood of being enrolled in private schools, with 120 (34.8% in the age bracket) enrolled. Conversely, the age group of 25 to 34 year olds has the lowest likelihood of being enrolled in a private school, with 427 (97.5% in the age bracket) attending a public institution.
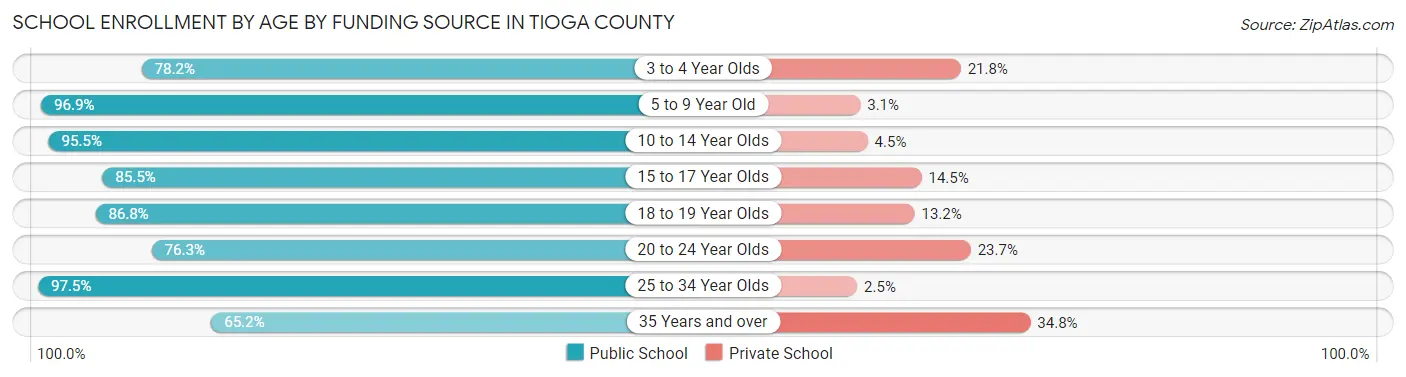
| Age Bracket | Public School | Private School |
| 3 to 4 Year Olds | 348 (78.2%) | 97 (21.8%) |
| 5 to 9 Year Old | 2,261 (96.9%) | 72 (3.1%) |
| 10 to 14 Year Olds | 2,888 (95.5%) | 135 (4.5%) |
| 15 to 17 Year Olds | 1,516 (85.5%) | 257 (14.5%) |
| 18 to 19 Year Olds | 447 (86.8%) | 68 (13.2%) |
| 20 to 24 Year Olds | 732 (76.3%) | 227 (23.7%) |
| 25 to 34 Year Olds | 427 (97.5%) | 11 (2.5%) |
| 35 Years and over | 225 (65.2%) | 120 (34.8%) |
| Total | 8,848 (90.0%) | 983 (10.0%) |
Educational Attainment by Field of Study in Tioga County
Education (1,694 | 17.0%), business (1,379 | 13.9%), science & technology (1,168 | 11.7%), engineering (1,131 | 11.4%), and computers & mathematics (667 | 6.7%) are the most common fields of study among 9,957 individuals in Tioga County who have obtained a bachelor's degree or higher.
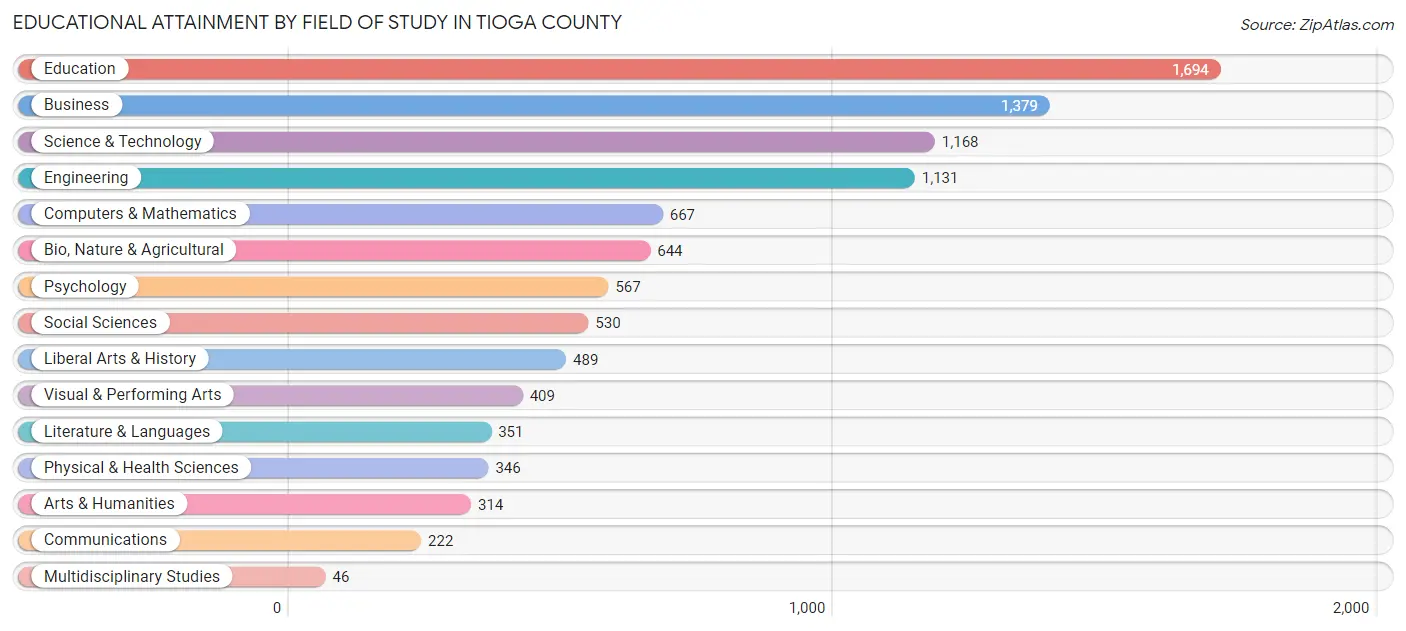
| Field of Study | # Graduates | % Graduates |
| Computers & Mathematics | 667 | 6.7% |
| Bio, Nature & Agricultural | 644 | 6.5% |
| Physical & Health Sciences | 346 | 3.5% |
| Psychology | 567 | 5.7% |
| Social Sciences | 530 | 5.3% |
| Engineering | 1,131 | 11.4% |
| Multidisciplinary Studies | 46 | 0.5% |
| Science & Technology | 1,168 | 11.7% |
| Business | 1,379 | 13.9% |
| Education | 1,694 | 17.0% |
| Literature & Languages | 351 | 3.5% |
| Liberal Arts & History | 489 | 4.9% |
| Visual & Performing Arts | 409 | 4.1% |
| Communications | 222 | 2.2% |
| Arts & Humanities | 314 | 3.2% |
| Total | 9,957 | 100.0% |
Transportation & Commute in Tioga County
Vehicle Availability by Sex in Tioga County
The most prevalent vehicle ownership categories in Tioga County are males with 2 vehicles (5,410, accounting for 44.3%) and females with 2 vehicles (4,014, making up 53.4%).
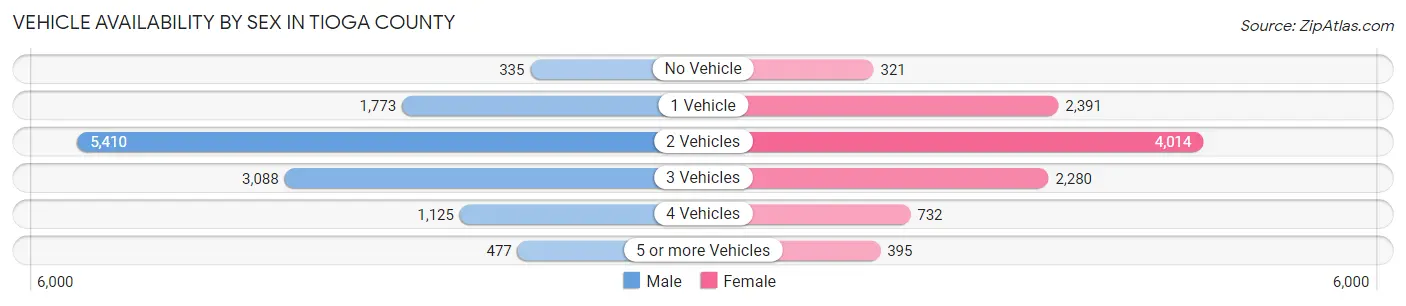
| Vehicles Available | Male | Female |
| No Vehicle | 335 (2.7%) | 321 (3.2%) |
| 1 Vehicle | 1,773 (14.5%) | 2,391 (23.6%) |
| 2 Vehicles | 5,410 (44.3%) | 4,014 (39.6%) |
| 3 Vehicles | 3,088 (25.3%) | 2,280 (22.5%) |
| 4 Vehicles | 1,125 (9.2%) | 732 (7.2%) |
| 5 or more Vehicles | 477 (3.9%) | 395 (3.9%) |
| Total | 12,208 (100.0%) | 10,133 (100.0%) |
Commute Time in Tioga County
The most frequently occuring commute durations in Tioga County are 30 to 34 minutes (3,189 commuters, 15.3%), 15 to 19 minutes (2,992 commuters, 14.4%), and 5 to 9 minutes (2,899 commuters, 13.9%).
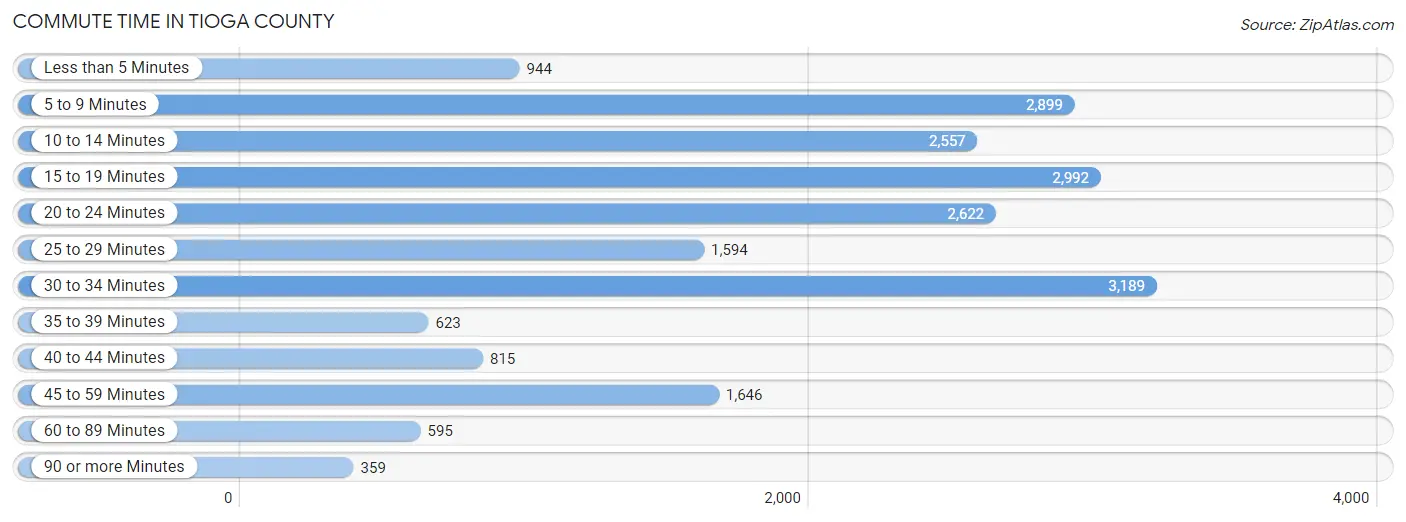
| Commute Time | # Commuters | % Commuters |
| Less than 5 Minutes | 944 | 4.5% |
| 5 to 9 Minutes | 2,899 | 13.9% |
| 10 to 14 Minutes | 2,557 | 12.3% |
| 15 to 19 Minutes | 2,992 | 14.4% |
| 20 to 24 Minutes | 2,622 | 12.6% |
| 25 to 29 Minutes | 1,594 | 7.6% |
| 30 to 34 Minutes | 3,189 | 15.3% |
| 35 to 39 Minutes | 623 | 3.0% |
| 40 to 44 Minutes | 815 | 3.9% |
| 45 to 59 Minutes | 1,646 | 7.9% |
| 60 to 89 Minutes | 595 | 2.9% |
| 90 or more Minutes | 359 | 1.7% |
Commute Time by Sex in Tioga County
The most common commute times in Tioga County are 30 to 34 minutes (1,919 commuters, 16.7%) for males and 15 to 19 minutes (1,472 commuters, 15.7%) for females.
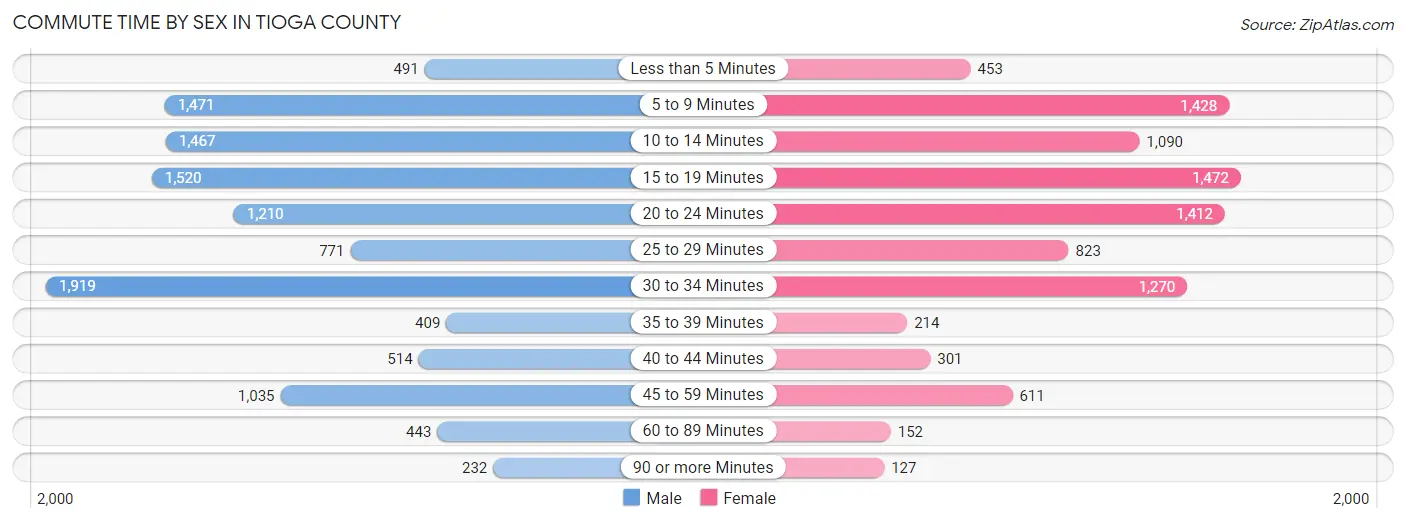
| Commute Time | Male | Female |
| Less than 5 Minutes | 491 (4.3%) | 453 (4.8%) |
| 5 to 9 Minutes | 1,471 (12.8%) | 1,428 (15.3%) |
| 10 to 14 Minutes | 1,467 (12.8%) | 1,090 (11.7%) |
| 15 to 19 Minutes | 1,520 (13.2%) | 1,472 (15.7%) |
| 20 to 24 Minutes | 1,210 (10.5%) | 1,412 (15.1%) |
| 25 to 29 Minutes | 771 (6.7%) | 823 (8.8%) |
| 30 to 34 Minutes | 1,919 (16.7%) | 1,270 (13.6%) |
| 35 to 39 Minutes | 409 (3.6%) | 214 (2.3%) |
| 40 to 44 Minutes | 514 (4.5%) | 301 (3.2%) |
| 45 to 59 Minutes | 1,035 (9.0%) | 611 (6.5%) |
| 60 to 89 Minutes | 443 (3.9%) | 152 (1.6%) |
| 90 or more Minutes | 232 (2.0%) | 127 (1.4%) |
Time of Departure to Work by Sex in Tioga County
The most frequent times of departure to work in Tioga County are 7:30 AM to 7:59 AM (1,496, 13.0%) for males and 7:00 AM to 7:29 AM (1,799, 19.2%) for females.
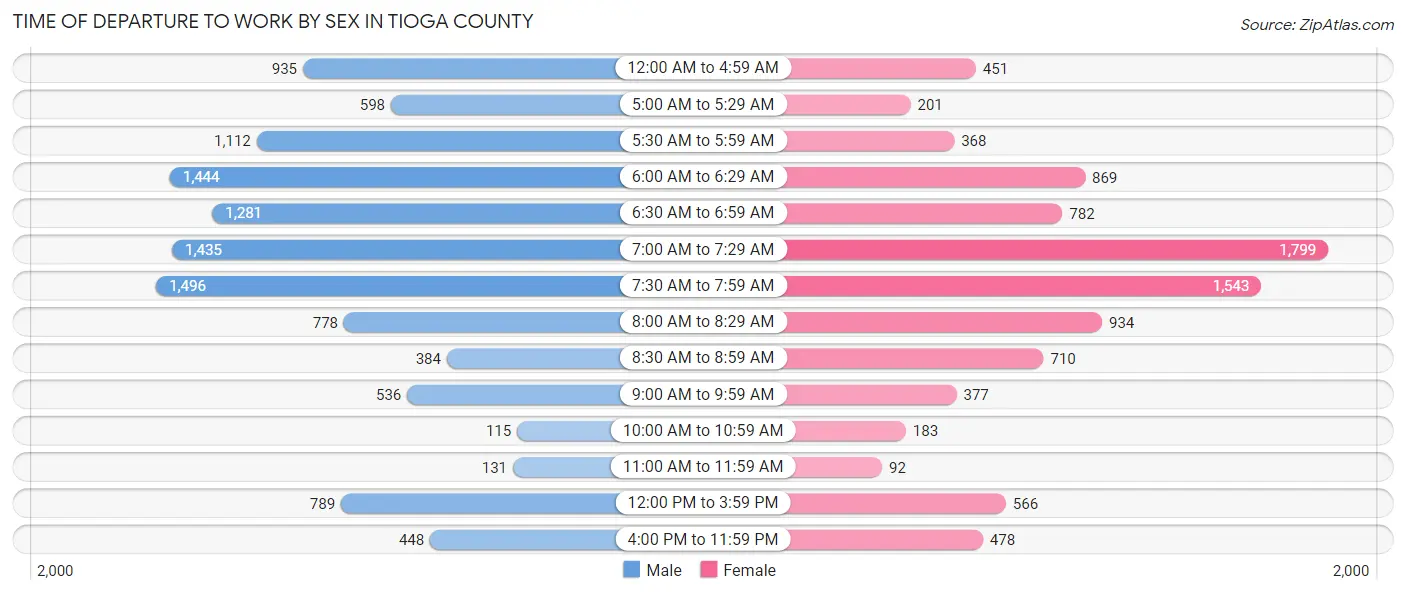
| Time of Departure | Male | Female |
| 12:00 AM to 4:59 AM | 935 (8.1%) | 451 (4.8%) |
| 5:00 AM to 5:29 AM | 598 (5.2%) | 201 (2.1%) |
| 5:30 AM to 5:59 AM | 1,112 (9.7%) | 368 (3.9%) |
| 6:00 AM to 6:29 AM | 1,444 (12.6%) | 869 (9.3%) |
| 6:30 AM to 6:59 AM | 1,281 (11.2%) | 782 (8.4%) |
| 7:00 AM to 7:29 AM | 1,435 (12.5%) | 1,799 (19.2%) |
| 7:30 AM to 7:59 AM | 1,496 (13.0%) | 1,543 (16.5%) |
| 8:00 AM to 8:29 AM | 778 (6.8%) | 934 (10.0%) |
| 8:30 AM to 8:59 AM | 384 (3.3%) | 710 (7.6%) |
| 9:00 AM to 9:59 AM | 536 (4.7%) | 377 (4.0%) |
| 10:00 AM to 10:59 AM | 115 (1.0%) | 183 (2.0%) |
| 11:00 AM to 11:59 AM | 131 (1.1%) | 92 (1.0%) |
| 12:00 PM to 3:59 PM | 789 (6.9%) | 566 (6.0%) |
| 4:00 PM to 11:59 PM | 448 (3.9%) | 478 (5.1%) |
| Total | 11,482 (100.0%) | 9,353 (100.0%) |
Housing Occupancy in Tioga County
Occupancy by Ownership in Tioga County
Of the total 20,312 dwellings in Tioga County, owner-occupied units account for 15,821 (77.9%), while renter-occupied units make up 4,491 (22.1%).
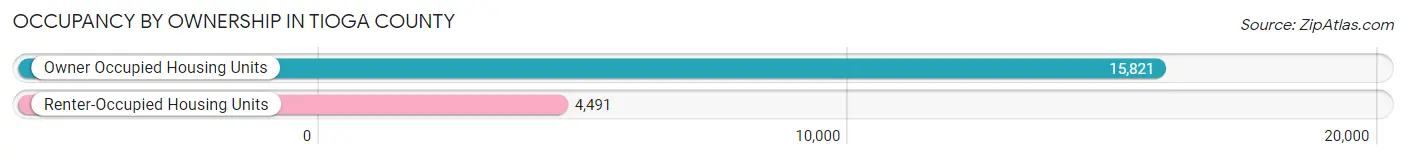
| Occupancy | # Housing Units | % Housing Units |
| Owner Occupied Housing Units | 15,821 | 77.9% |
| Renter-Occupied Housing Units | 4,491 | 22.1% |
| Total Occupied Housing Units | 20,312 | 100.0% |
Occupancy by Household Size in Tioga County
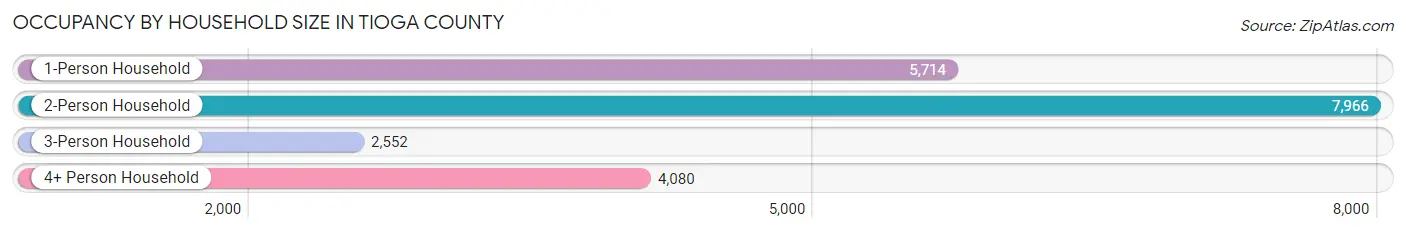
| Household Size | # Housing Units | % Housing Units |
| 1-Person Household | 5,714 | 28.1% |
| 2-Person Household | 7,966 | 39.2% |
| 3-Person Household | 2,552 | 12.6% |
| 4+ Person Household | 4,080 | 20.1% |
| Total Housing Units | 20,312 | 100.0% |
Occupancy by Ownership by Household Size in Tioga County
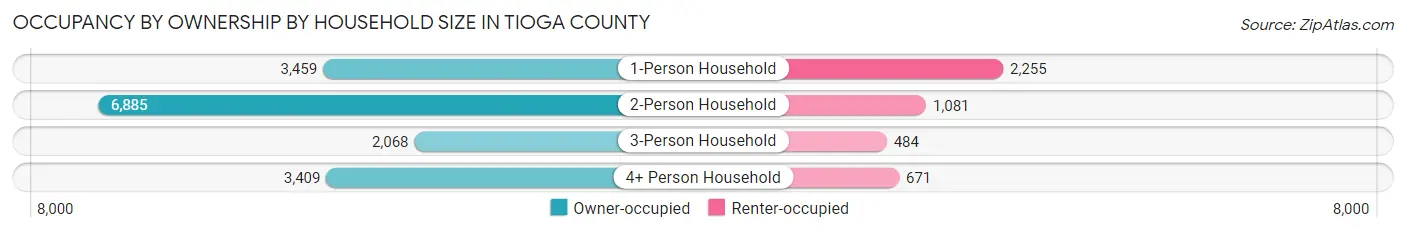
| Household Size | Owner-occupied | Renter-occupied |
| 1-Person Household | 3,459 (60.5%) | 2,255 (39.5%) |
| 2-Person Household | 6,885 (86.4%) | 1,081 (13.6%) |
| 3-Person Household | 2,068 (81.0%) | 484 (19.0%) |
| 4+ Person Household | 3,409 (83.6%) | 671 (16.5%) |
| Total Housing Units | 15,821 (77.9%) | 4,491 (22.1%) |
Occupancy by Educational Attainment in Tioga County
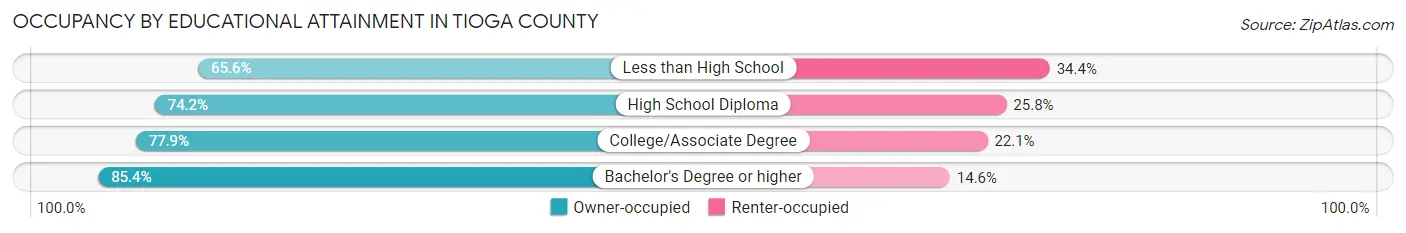
| Household Size | Owner-occupied | Renter-occupied |
| Less than High School | 993 (65.6%) | 521 (34.4%) |
| High School Diploma | 4,860 (74.2%) | 1,692 (25.8%) |
| College/Associate Degree | 5,117 (77.9%) | 1,448 (22.1%) |
| Bachelor's Degree or higher | 4,851 (85.4%) | 830 (14.6%) |
Occupancy by Age of Householder in Tioga County
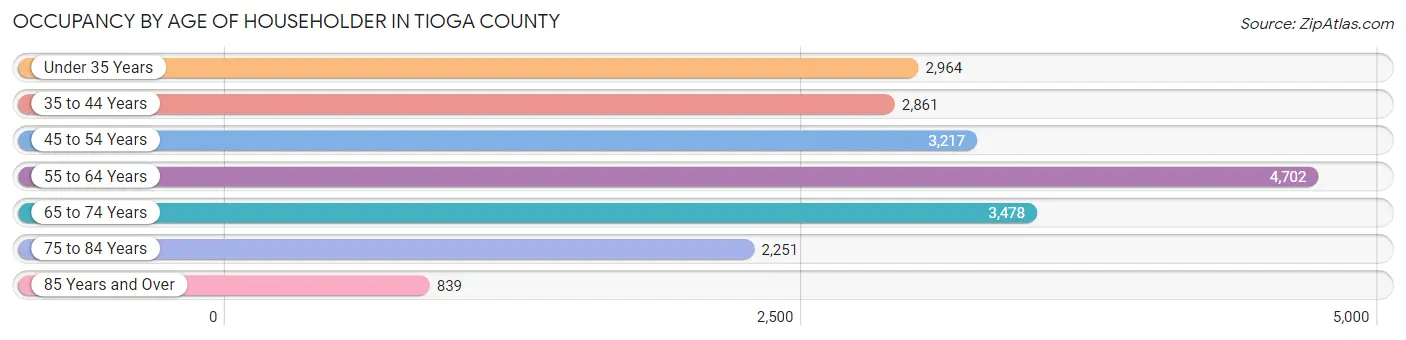
| Age Bracket | # Households | % Households |
| Under 35 Years | 2,964 | 14.6% |
| 35 to 44 Years | 2,861 | 14.1% |
| 45 to 54 Years | 3,217 | 15.8% |
| 55 to 64 Years | 4,702 | 23.2% |
| 65 to 74 Years | 3,478 | 17.1% |
| 75 to 84 Years | 2,251 | 11.1% |
| 85 Years and Over | 839 | 4.1% |
| Total | 20,312 | 100.0% |
Housing Finances in Tioga County
Median Income by Occupancy in Tioga County
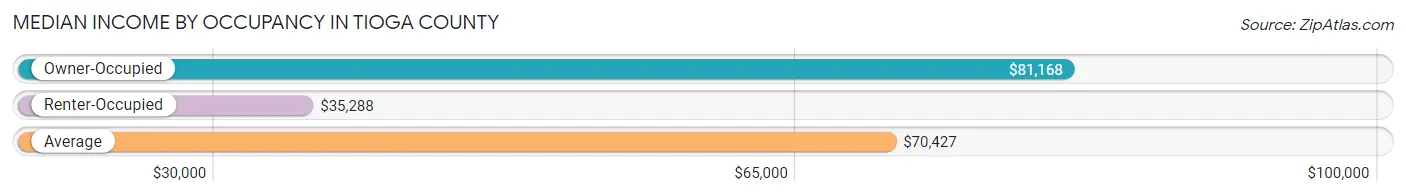
| Occupancy Type | # Households | Median Income |
| Owner-Occupied | 15,821 (77.9%) | $81,168 |
| Renter-Occupied | 4,491 (22.1%) | $35,288 |
| Average | 20,312 (100.0%) | $70,427 |
Occupancy by Householder Income Bracket in Tioga County
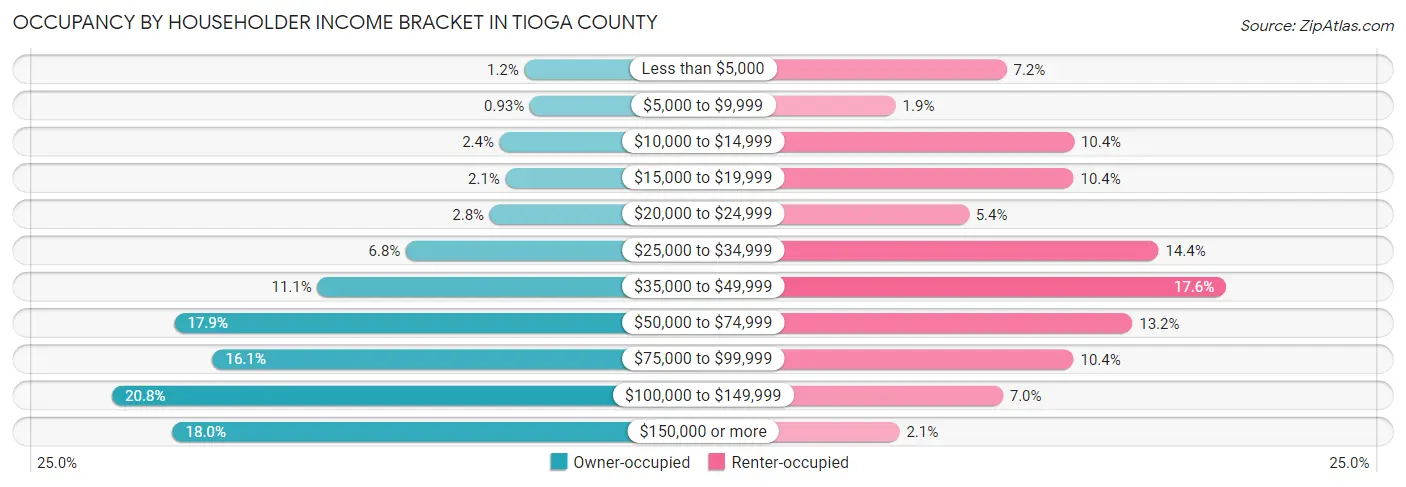
| Income Bracket | Owner-occupied | Renter-occupied |
| Less than $5,000 | 189 (1.2%) | 323 (7.2%) |
| $5,000 to $9,999 | 147 (0.9%) | 86 (1.9%) |
| $10,000 to $14,999 | 375 (2.4%) | 467 (10.4%) |
| $15,000 to $19,999 | 330 (2.1%) | 466 (10.4%) |
| $20,000 to $24,999 | 450 (2.8%) | 242 (5.4%) |
| $25,000 to $34,999 | 1,081 (6.8%) | 648 (14.4%) |
| $35,000 to $49,999 | 1,749 (11.1%) | 792 (17.6%) |
| $50,000 to $74,999 | 2,825 (17.9%) | 592 (13.2%) |
| $75,000 to $99,999 | 2,540 (16.1%) | 466 (10.4%) |
| $100,000 to $149,999 | 3,295 (20.8%) | 315 (7.0%) |
| $150,000 or more | 2,840 (17.9%) | 94 (2.1%) |
| Total | 15,821 (100.0%) | 4,491 (100.0%) |
Monthly Housing Cost Tiers in Tioga County
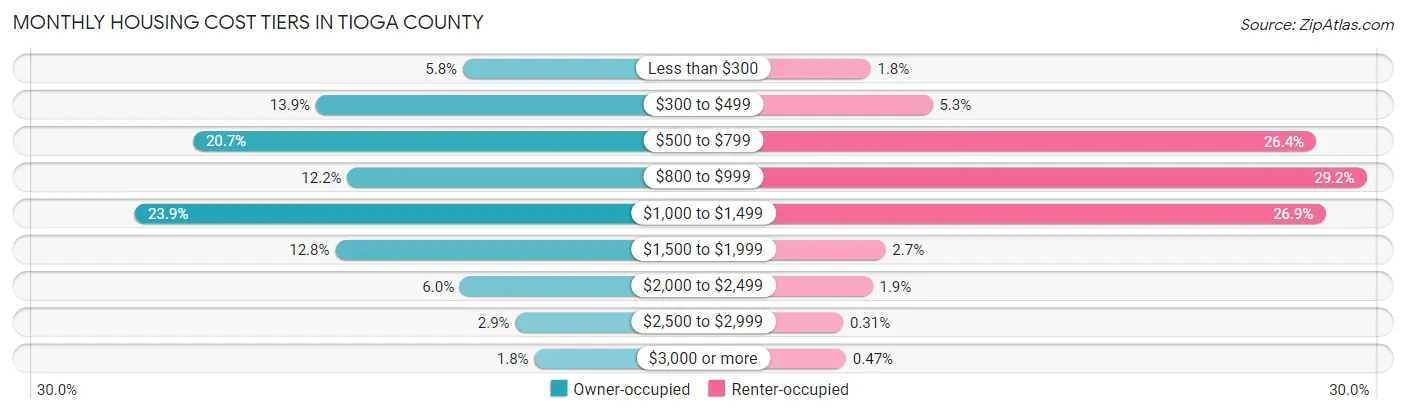
| Monthly Cost | Owner-occupied | Renter-occupied |
| Less than $300 | 916 (5.8%) | 82 (1.8%) |
| $300 to $499 | 2,201 (13.9%) | 236 (5.2%) |
| $500 to $799 | 3,275 (20.7%) | 1,187 (26.4%) |
| $800 to $999 | 1,926 (12.2%) | 1,312 (29.2%) |
| $1,000 to $1,499 | 3,781 (23.9%) | 1,210 (26.9%) |
| $1,500 to $1,999 | 2,032 (12.8%) | 119 (2.6%) |
| $2,000 to $2,499 | 942 (5.9%) | 87 (1.9%) |
| $2,500 to $2,999 | 457 (2.9%) | 14 (0.3%) |
| $3,000 or more | 291 (1.8%) | 21 (0.5%) |
| Total | 15,821 (100.0%) | 4,491 (100.0%) |
Physical Housing Characteristics in Tioga County
Housing Structures in Tioga County
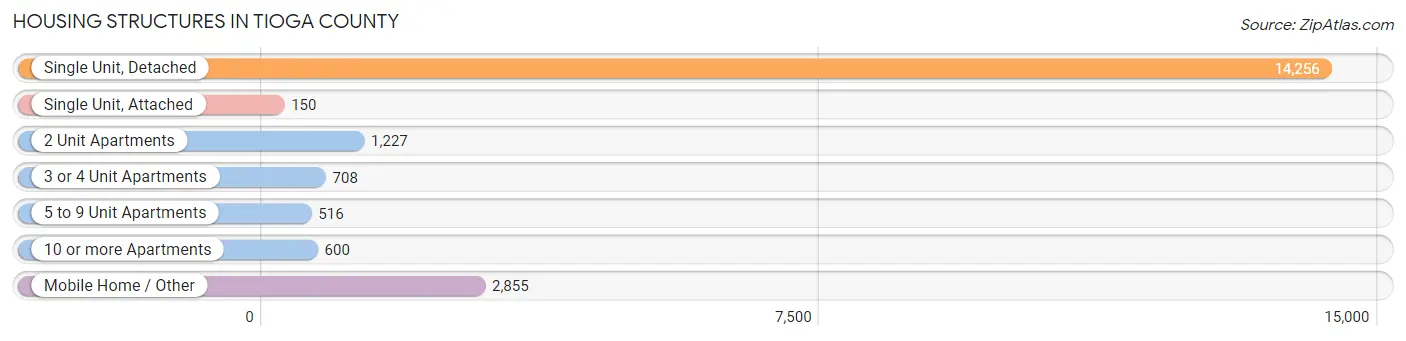
| Structure Type | # Housing Units | % Housing Units |
| Single Unit, Detached | 14,256 | 70.2% |
| Single Unit, Attached | 150 | 0.7% |
| 2 Unit Apartments | 1,227 | 6.0% |
| 3 or 4 Unit Apartments | 708 | 3.5% |
| 5 to 9 Unit Apartments | 516 | 2.5% |
| 10 or more Apartments | 600 | 2.9% |
| Mobile Home / Other | 2,855 | 14.1% |
| Total | 20,312 | 100.0% |
Housing Structures by Occupancy in Tioga County
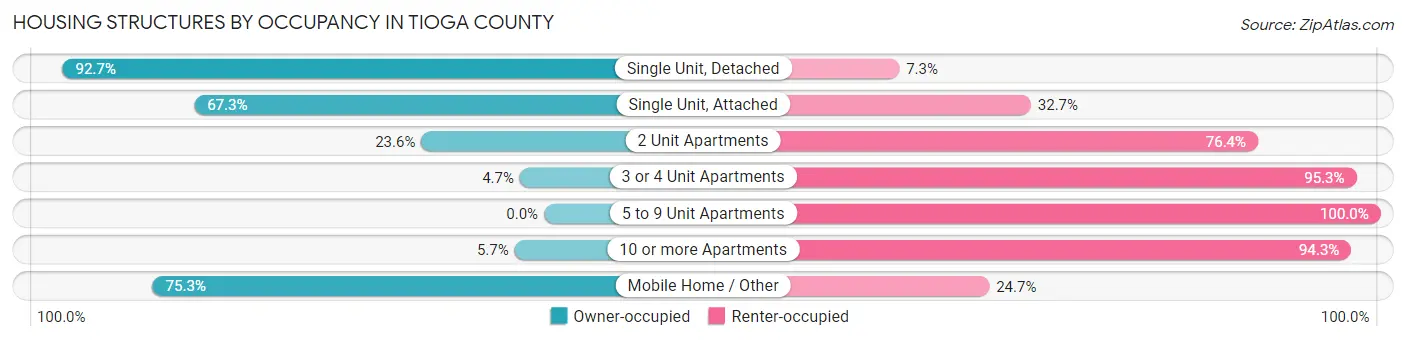
| Structure Type | Owner-occupied | Renter-occupied |
| Single Unit, Detached | 13,212 (92.7%) | 1,044 (7.3%) |
| Single Unit, Attached | 101 (67.3%) | 49 (32.7%) |
| 2 Unit Apartments | 290 (23.6%) | 937 (76.4%) |
| 3 or 4 Unit Apartments | 33 (4.7%) | 675 (95.3%) |
| 5 to 9 Unit Apartments | 0 (0.0%) | 516 (100.0%) |
| 10 or more Apartments | 34 (5.7%) | 566 (94.3%) |
| Mobile Home / Other | 2,151 (75.3%) | 704 (24.7%) |
| Total | 15,821 (77.9%) | 4,491 (22.1%) |
Housing Structures by Number of Rooms in Tioga County
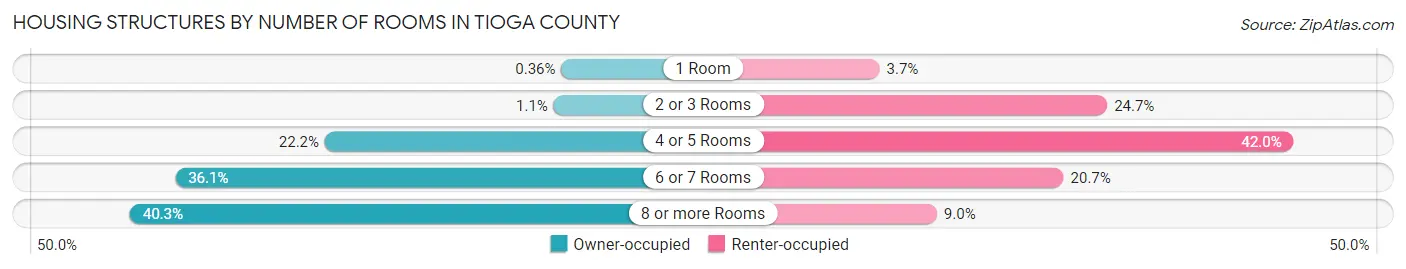
| Number of Rooms | Owner-occupied | Renter-occupied |
| 1 Room | 57 (0.4%) | 165 (3.7%) |
| 2 or 3 Rooms | 170 (1.1%) | 1,110 (24.7%) |
| 4 or 5 Rooms | 3,517 (22.2%) | 1,884 (41.9%) |
| 6 or 7 Rooms | 5,706 (36.1%) | 929 (20.7%) |
| 8 or more Rooms | 6,371 (40.3%) | 403 (9.0%) |
| Total | 15,821 (100.0%) | 4,491 (100.0%) |
Housing Structure by Heating Type in Tioga County
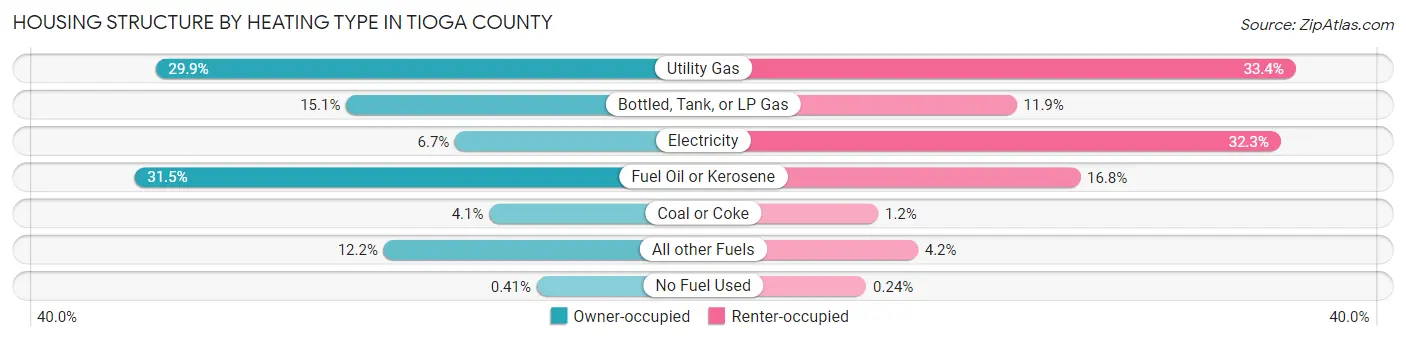
| Heating Type | Owner-occupied | Renter-occupied |
| Utility Gas | 4,729 (29.9%) | 1,502 (33.4%) |
| Bottled, Tank, or LP Gas | 2,395 (15.1%) | 533 (11.9%) |
| Electricity | 1,063 (6.7%) | 1,450 (32.3%) |
| Fuel Oil or Kerosene | 4,987 (31.5%) | 753 (16.8%) |
| Coal or Coke | 646 (4.1%) | 52 (1.2%) |
| All other Fuels | 1,936 (12.2%) | 190 (4.2%) |
| No Fuel Used | 65 (0.4%) | 11 (0.2%) |
| Total | 15,821 (100.0%) | 4,491 (100.0%) |
Household Vehicle Usage in Tioga County
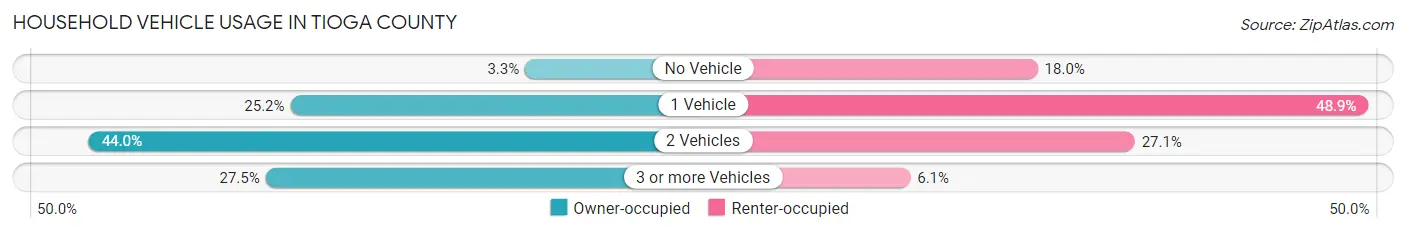
| Vehicles per Household | Owner-occupied | Renter-occupied |
| No Vehicle | 519 (3.3%) | 808 (18.0%) |
| 1 Vehicle | 3,986 (25.2%) | 2,194 (48.8%) |
| 2 Vehicles | 6,963 (44.0%) | 1,215 (27.1%) |
| 3 or more Vehicles | 4,353 (27.5%) | 274 (6.1%) |
| Total | 15,821 (100.0%) | 4,491 (100.0%) |
Real Estate & Mortgages in Tioga County
Real Estate and Mortgage Overview in Tioga County
| Characteristic | Without Mortgage | With Mortgage |
| Housing Units | 7,933 | 7,888 |
| Median Property Value | $136,800 | $150,500 |
| Median Household Income | $63,319 | $1,706 |
| Monthly Housing Costs | $579 | $277 |
| Real Estate Taxes | $3,367 | $271 |
Property Value by Mortgage Status in Tioga County
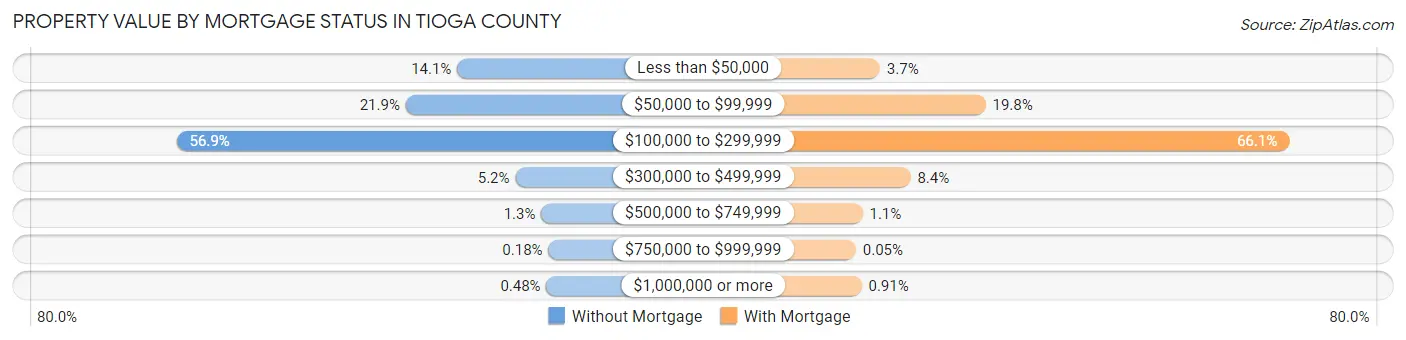
| Property Value | Without Mortgage | With Mortgage |
| Less than $50,000 | 1,117 (14.1%) | 293 (3.7%) |
| $50,000 to $99,999 | 1,739 (21.9%) | 1,563 (19.8%) |
| $100,000 to $299,999 | 4,511 (56.9%) | 5,212 (66.1%) |
| $300,000 to $499,999 | 414 (5.2%) | 660 (8.4%) |
| $500,000 to $749,999 | 100 (1.3%) | 84 (1.1%) |
| $750,000 to $999,999 | 14 (0.2%) | 4 (0.1%) |
| $1,000,000 or more | 38 (0.5%) | 72 (0.9%) |
| Total | 7,933 (100.0%) | 7,888 (100.0%) |
Household Income by Mortgage Status in Tioga County
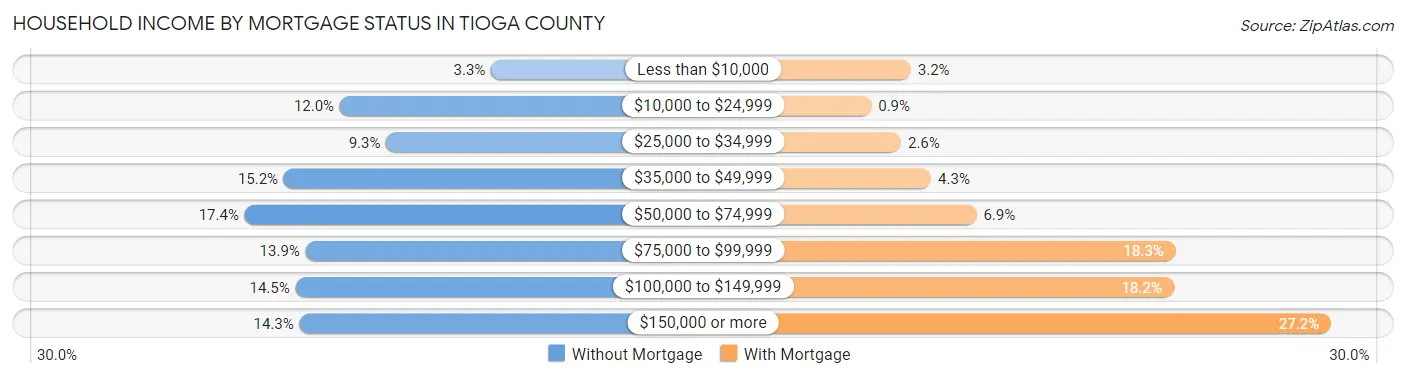
| Household Income | Without Mortgage | With Mortgage |
| Less than $10,000 | 265 (3.3%) | 249 (3.2%) |
| $10,000 to $24,999 | 950 (12.0%) | 71 (0.9%) |
| $25,000 to $34,999 | 740 (9.3%) | 205 (2.6%) |
| $35,000 to $49,999 | 1,204 (15.2%) | 341 (4.3%) |
| $50,000 to $74,999 | 1,382 (17.4%) | 545 (6.9%) |
| $75,000 to $99,999 | 1,106 (13.9%) | 1,443 (18.3%) |
| $100,000 to $149,999 | 1,152 (14.5%) | 1,434 (18.2%) |
| $150,000 or more | 1,134 (14.3%) | 2,143 (27.2%) |
| Total | 7,933 (100.0%) | 7,888 (100.0%) |
Property Value to Household Income Ratio in Tioga County
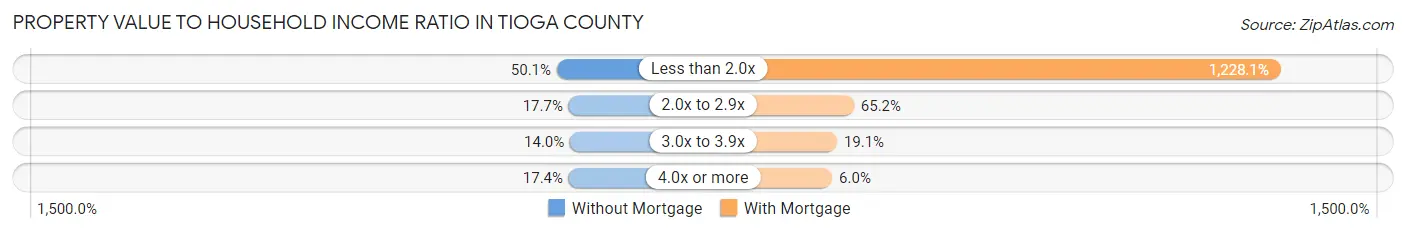
| Value-to-Income Ratio | Without Mortgage | With Mortgage |
| Less than 2.0x | 3,975 (50.1%) | 96,875 (1,228.1%) |
| 2.0x to 2.9x | 1,405 (17.7%) | 5,139 (65.1%) |
| 3.0x to 3.9x | 1,108 (14.0%) | 1,510 (19.1%) |
| 4.0x or more | 1,379 (17.4%) | 476 (6.0%) |
| Total | 7,933 (100.0%) | 7,888 (100.0%) |
Real Estate Taxes by Mortgage Status in Tioga County
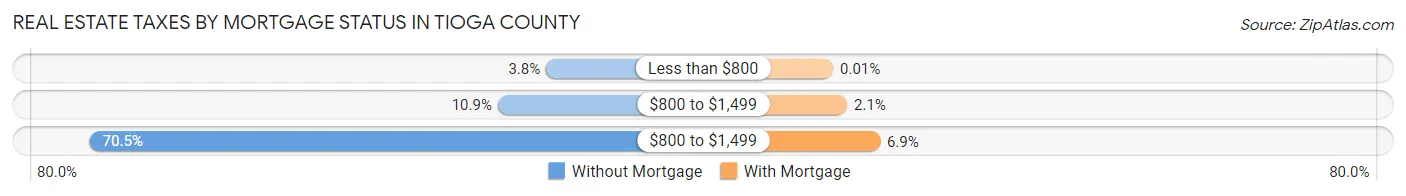
| Property Taxes | Without Mortgage | With Mortgage |
| Less than $800 | 302 (3.8%) | 1 (0.0%) |
| $800 to $1,499 | 862 (10.9%) | 162 (2.1%) |
| $800 to $1,499 | 5,592 (70.5%) | 541 (6.9%) |
| Total | 7,933 (100.0%) | 7,888 (100.0%) |
Health & Disability in Tioga County
Health Insurance Coverage by Age in Tioga County
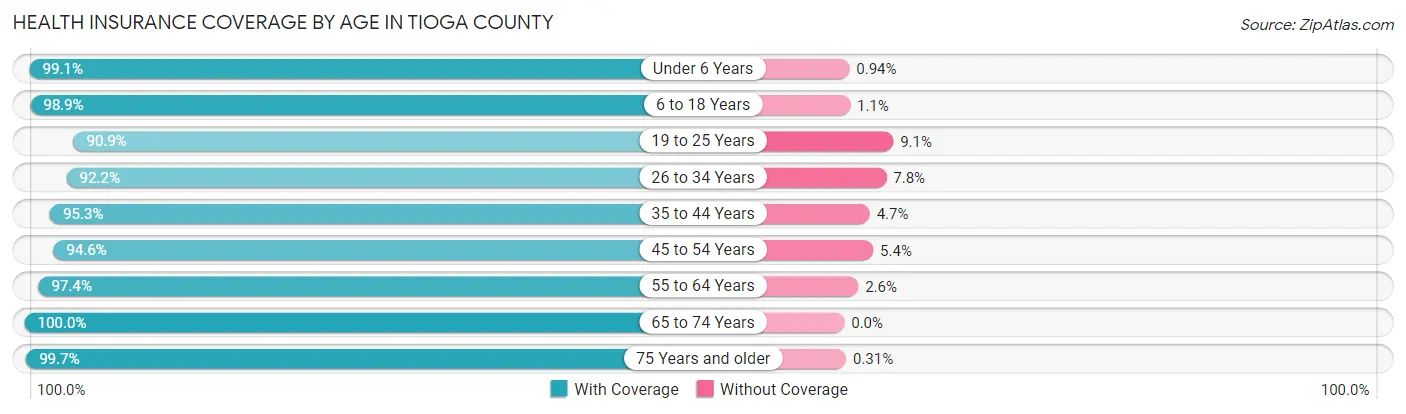
| Age Bracket | With Coverage | Without Coverage |
| Under 6 Years | 2,849 (99.1%) | 27 (0.9%) |
| 6 to 18 Years | 7,398 (98.9%) | 80 (1.1%) |
| 19 to 25 Years | 3,437 (90.9%) | 345 (9.1%) |
| 26 to 34 Years | 4,220 (92.2%) | 359 (7.8%) |
| 35 to 44 Years | 5,228 (95.3%) | 260 (4.7%) |
| 45 to 54 Years | 5,680 (94.6%) | 323 (5.4%) |
| 55 to 64 Years | 7,702 (97.4%) | 206 (2.6%) |
| 65 to 74 Years | 5,658 (100.0%) | 0 (0.0%) |
| 75 Years and older | 4,212 (99.7%) | 13 (0.3%) |
| Total | 46,384 (96.6%) | 1,613 (3.4%) |
Health Insurance Coverage by Citizenship Status in Tioga County
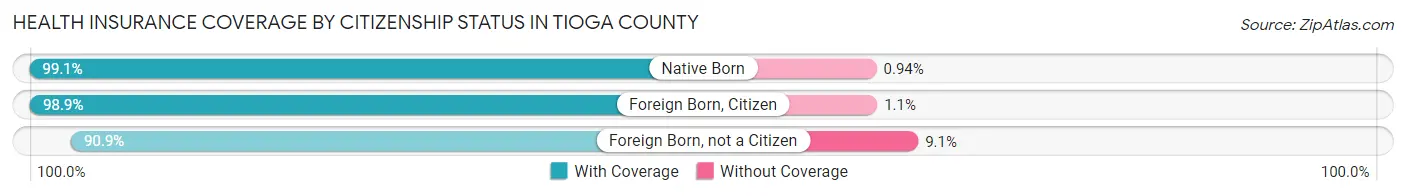
| Citizenship Status | With Coverage | Without Coverage |
| Native Born | 2,849 (99.1%) | 27 (0.9%) |
| Foreign Born, Citizen | 7,398 (98.9%) | 80 (1.1%) |
| Foreign Born, not a Citizen | 3,437 (90.9%) | 345 (9.1%) |
Health Insurance Coverage by Household Income in Tioga County
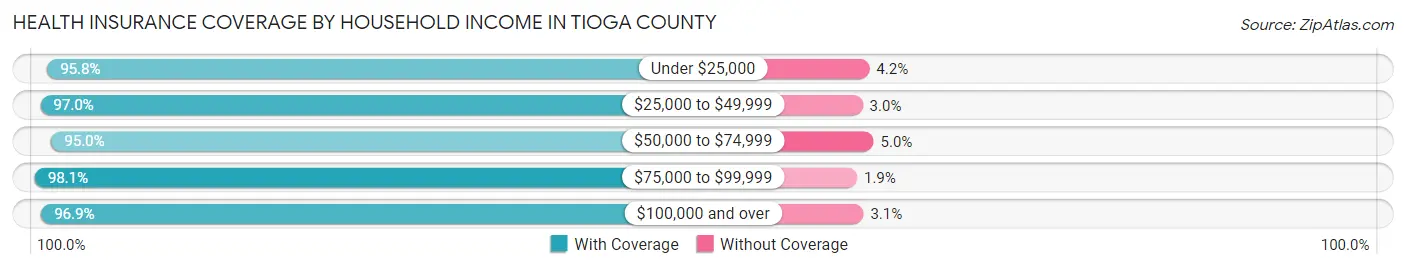
| Household Income | With Coverage | Without Coverage |
| Under $25,000 | 4,247 (95.8%) | 188 (4.2%) |
| $25,000 to $49,999 | 8,482 (97.0%) | 260 (3.0%) |
| $50,000 to $74,999 | 7,563 (95.0%) | 400 (5.0%) |
| $75,000 to $99,999 | 7,142 (98.1%) | 140 (1.9%) |
| $100,000 and over | 18,746 (96.9%) | 604 (3.1%) |
Public vs Private Health Insurance Coverage by Age in Tioga County
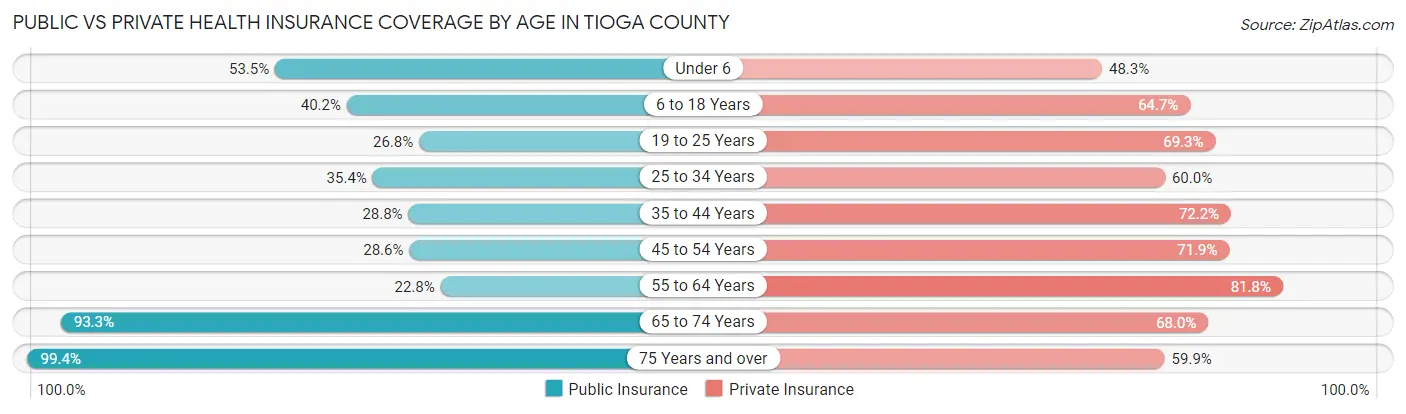
| Age Bracket | Public Insurance | Private Insurance |
| Under 6 | 1,539 (53.5%) | 1,389 (48.3%) |
| 6 to 18 Years | 3,006 (40.2%) | 4,835 (64.7%) |
| 19 to 25 Years | 1,013 (26.8%) | 2,622 (69.3%) |
| 25 to 34 Years | 1,621 (35.4%) | 2,747 (60.0%) |
| 35 to 44 Years | 1,578 (28.7%) | 3,964 (72.2%) |
| 45 to 54 Years | 1,717 (28.6%) | 4,318 (71.9%) |
| 55 to 64 Years | 1,803 (22.8%) | 6,472 (81.8%) |
| 65 to 74 Years | 5,278 (93.3%) | 3,848 (68.0%) |
| 75 Years and over | 4,201 (99.4%) | 2,532 (59.9%) |
| Total | 21,756 (45.3%) | 32,727 (68.2%) |
Disability Status by Sex by Age in Tioga County
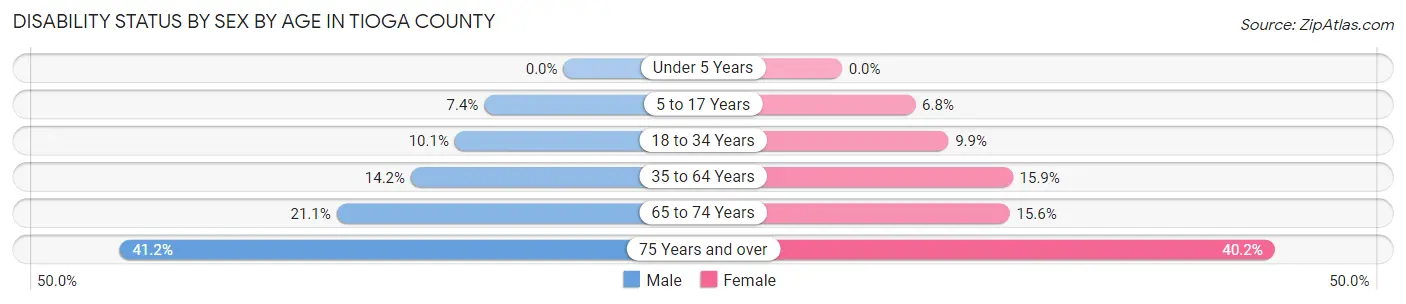
| Age Bracket | Male | Female |
| Under 5 Years | 0 (0.0%) | 0 (0.0%) |
| 5 to 17 Years | 278 (7.3%) | 246 (6.8%) |
| 18 to 34 Years | 453 (10.1%) | 433 (9.9%) |
| 35 to 64 Years | 1,377 (14.1%) | 1,532 (15.9%) |
| 65 to 74 Years | 595 (21.0%) | 441 (15.6%) |
| 75 Years and over | 807 (41.2%) | 910 (40.2%) |
Disability Class by Sex by Age in Tioga County
Disability Class: Hearing Difficulty
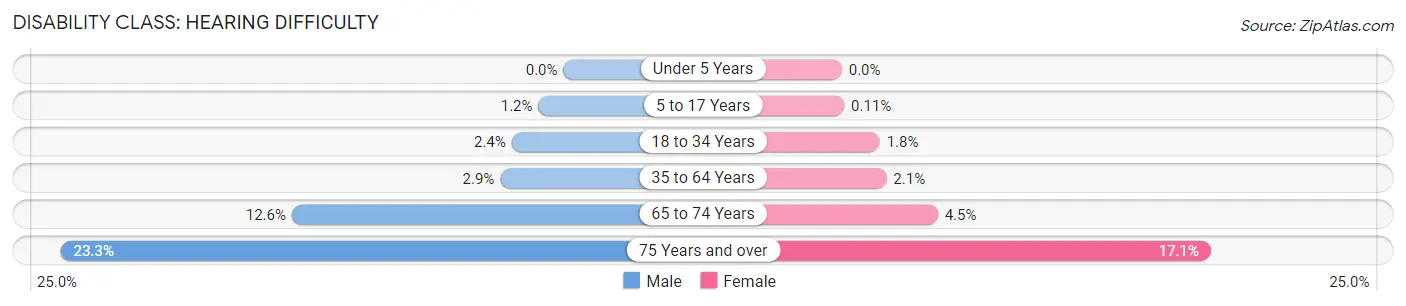
| Age Bracket | Male | Female |
| Under 5 Years | 0 (0.0%) | 0 (0.0%) |
| 5 to 17 Years | 44 (1.2%) | 4 (0.1%) |
| 18 to 34 Years | 108 (2.4%) | 77 (1.8%) |
| 35 to 64 Years | 285 (2.9%) | 200 (2.1%) |
| 65 to 74 Years | 356 (12.6%) | 126 (4.4%) |
| 75 Years and over | 457 (23.3%) | 388 (17.1%) |
Disability Class: Vision Difficulty
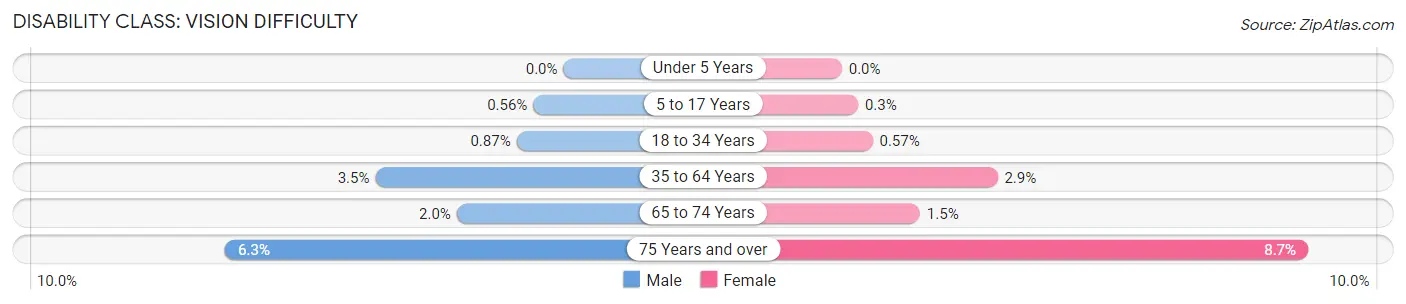
| Age Bracket | Male | Female |
| Under 5 Years | 0 (0.0%) | 0 (0.0%) |
| 5 to 17 Years | 21 (0.6%) | 11 (0.3%) |
| 18 to 34 Years | 39 (0.9%) | 25 (0.6%) |
| 35 to 64 Years | 340 (3.5%) | 279 (2.9%) |
| 65 to 74 Years | 56 (2.0%) | 41 (1.5%) |
| 75 Years and over | 123 (6.3%) | 196 (8.6%) |
Disability Class: Cognitive Difficulty
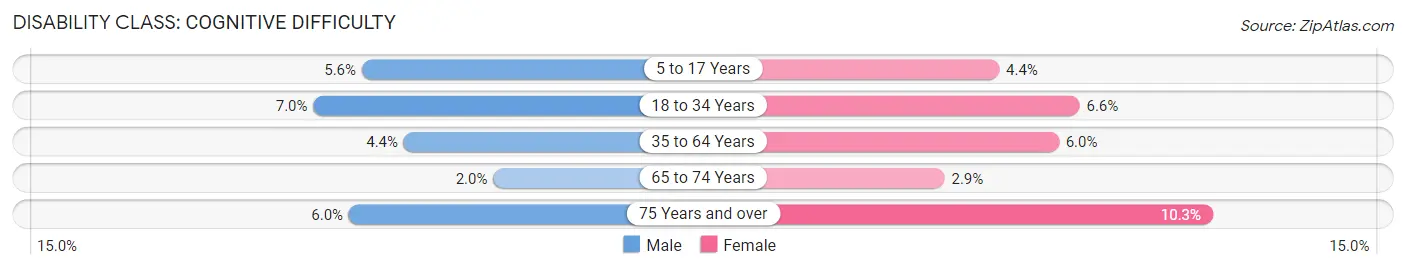
| Age Bracket | Male | Female |
| 5 to 17 Years | 212 (5.6%) | 158 (4.4%) |
| 18 to 34 Years | 313 (7.0%) | 290 (6.6%) |
| 35 to 64 Years | 432 (4.4%) | 584 (6.0%) |
| 65 to 74 Years | 55 (1.9%) | 81 (2.9%) |
| 75 Years and over | 117 (6.0%) | 234 (10.3%) |
Disability Class: Ambulatory Difficulty
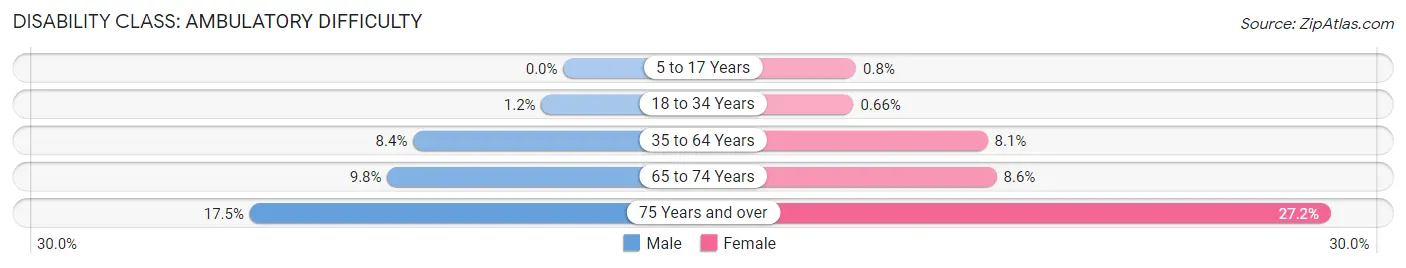
| Age Bracket | Male | Female |
| 5 to 17 Years | 0 (0.0%) | 29 (0.8%) |
| 18 to 34 Years | 55 (1.2%) | 29 (0.7%) |
| 35 to 64 Years | 814 (8.4%) | 785 (8.1%) |
| 65 to 74 Years | 277 (9.8%) | 244 (8.6%) |
| 75 Years and over | 342 (17.5%) | 617 (27.2%) |
Disability Class: Self-Care Difficulty
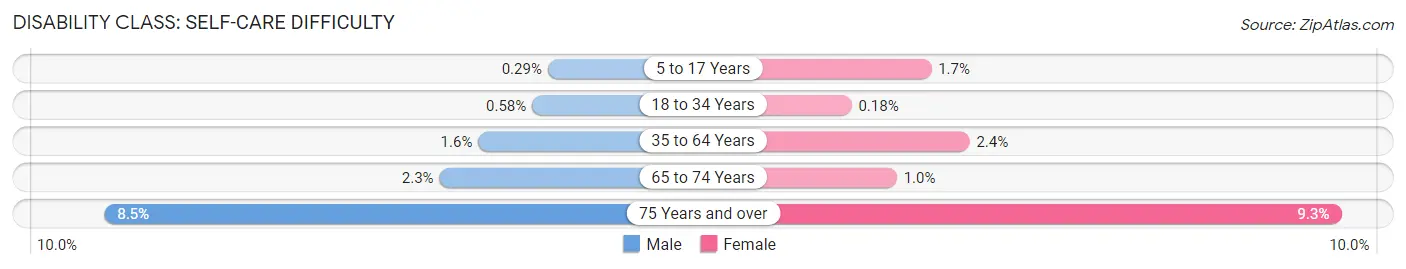
| Age Bracket | Male | Female |
| 5 to 17 Years | 11 (0.3%) | 60 (1.7%) |
| 18 to 34 Years | 26 (0.6%) | 8 (0.2%) |
| 35 to 64 Years | 154 (1.6%) | 229 (2.4%) |
| 65 to 74 Years | 65 (2.3%) | 29 (1.0%) |
| 75 Years and over | 167 (8.5%) | 210 (9.3%) |
Technology Access in Tioga County
Computing Device Access in Tioga County
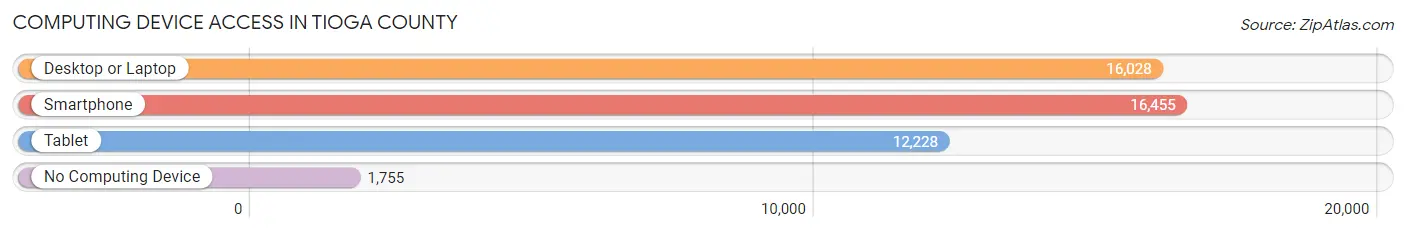
| Device Type | # Households | % Households |
| Desktop or Laptop | 16,028 | 78.9% |
| Smartphone | 16,455 | 81.0% |
| Tablet | 12,228 | 60.2% |
| No Computing Device | 1,755 | 8.6% |
| Total | 20,312 | 100.0% |
Internet Access in Tioga County
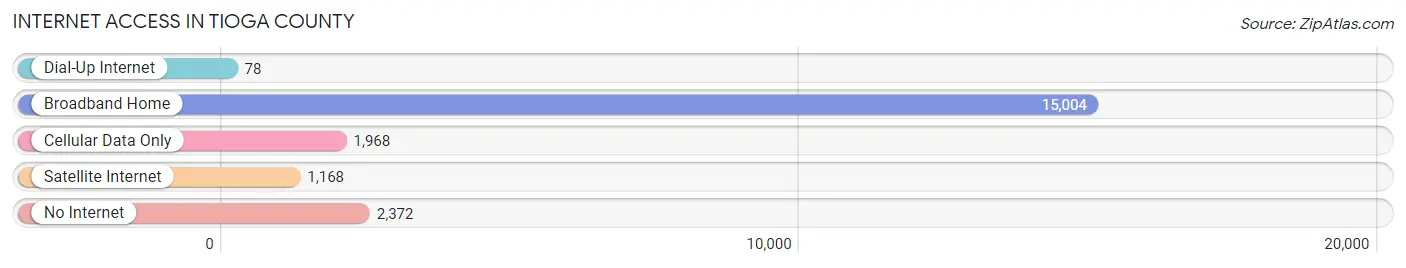
| Internet Type | # Households | % Households |
| Dial-Up Internet | 78 | 0.4% |
| Broadband Home | 15,004 | 73.9% |
| Cellular Data Only | 1,968 | 9.7% |
| Satellite Internet | 1,168 | 5.8% |
| No Internet | 2,372 | 11.7% |
| Total | 20,312 | 100.0% |
Tioga County Summary
Tioga County is located in the south-central region of New York State, and is part of the Southern Tier region. It is bordered by Broome County to the east, Chemung County to the south, and Steuben County to the west. The county seat is Owego, and the largest city is Binghamton. The county has a total area of 545 square miles, and a population of 51,125 as of the 2010 census.
History
Tioga County was formed in 1806 from parts of Chemung and Steuben counties. It was named after the Tioga River, which flows through the county. The first settlers in the area were the Iroquois, who were followed by the Susquehannock and then the Seneca. The first European settlers arrived in the late 1700s, and the county was officially established in 1806.
The county was an important part of the Underground Railroad, with many of the county's residents helping to hide and transport escaped slaves. During the Civil War, the county was home to several regiments of the Union Army.
Geography
Tioga County is located in the south-central region of New York State, and is part of the Southern Tier region. It is bordered by Broome County to the east, Chemung County to the south, and Steuben County to the west. The county has a total area of 545 square miles, and is mostly rural. The terrain is mostly rolling hills, with the highest point being 2,037 feet at the summit of Mount Prospect.
The Tioga River flows through the county, and is the main waterway. Other major waterways include the Susquehanna River, the Chemung River, and the Chenango River. The county is home to several state parks, including Tioga State Forest, Tioga Point State Park, and Tioga Point Wildlife Management Area.
Economy
The economy of Tioga County is largely based on agriculture and manufacturing. The county is home to several large farms, and is a major producer of dairy products, vegetables, and fruits. The county is also home to several manufacturing companies, including Endicott Johnson Corporation, which produces shoes, and IBM, which produces computer components.
The county is also home to several tourist attractions, including the Tioga County Historical Society Museum, the Tioga Downs Casino, and the Tioga County Fair.
Demographics
As of the 2010 census, the population of Tioga County was 51,125. The racial makeup of the county was 94.3% White, 2.2% African American, 0.5% Native American, 0.7% Asian, 0.1% Pacific Islander, 0.7% from other races, and 1.5% from two or more races. Hispanic or Latino of any race were 2.7% of the population.
The median income for a household in the county was $45,945, and the median income for a family was $54,945. The per capita income for the county was $22,945. About 8.7% of families and 11.7% of the population were below the poverty line, including 15.2% of those under age 18 and 8.2% of those age 65 or over.
Common Questions
What is Per Capita Income in Tioga County?
Per Capita income in Tioga County is $37,691.
What is the Median Family Income in Tioga County?
Median Family Income in Tioga County is $83,276.
What is the Median Household income in Tioga County?
Median Household Income in Tioga County is $70,427.
What is Income or Wage Gap in Tioga County?
Income or Wage Gap in Tioga County is 31.8%.
Women in Tioga County earn 68.2 cents for every dollar earned by a man.
What is Family Income Deficit in Tioga County?
Family Income Deficit in Tioga County is $9,577.
Families that are below poverty line in Tioga County earn $9,577 less on average than the poverty threshold level.
What is Inequality or Gini Index in Tioga County?
Inequality or Gini Index in Tioga County is 0.43.
What is the Total Population of Tioga County?
Total Population of Tioga County is 48,344.
What is the Total Male Population of Tioga County?
Total Male Population of Tioga County is 24,193.
What is the Total Female Population of Tioga County?
Total Female Population of Tioga County is 24,151.
What is the Ratio of Males per 100 Females in Tioga County?
There are 100.17 Males per 100 Females in Tioga County.
What is the Ratio of Females per 100 Males in Tioga County?
There are 99.83 Females per 100 Males in Tioga County.
What is the Median Population Age in Tioga County?
Median Population Age in Tioga County is 44.7 Years.
What is the Average Family Size in Tioga County
Average Family Size in Tioga County is 2.8 People.
What is the Average Household Size in Tioga County
Average Household Size in Tioga County is 2.4 People.
How Large is the Labor Force in Tioga County?
There are 24,070 People in the Labor Forcein in Tioga County.
What is the Percentage of People in the Labor Force in Tioga County?
60.6% of People are in the Labor Force in Tioga County.
What is the Unemployment Rate in Tioga County?
Unemployment Rate in Tioga County is 5.6%.