Sullivan County, NY Map & Demographics
Sullivan County Map
Sullivan County Overview
$37,854
PER CAPITA INCOME
$82,555
AVG FAMILY INCOME
$67,841
AVG HOUSEHOLD INCOME
24.3%
WAGE / INCOME GAP [ % ]
75.7¢/ $1
WAGE / INCOME GAP [ $ ]
$11,234
FAMILY INCOME DEFICIT
0.49
INEQUALITY / GINI INDEX
78,725
TOTAL POPULATION
40,863
MALE POPULATION
37,862
FEMALE POPULATION
107.93
MALES / 100 FEMALES
92.66
FEMALES / 100 MALES
41.9
MEDIAN AGE
3.2
AVG FAMILY SIZE
2.5
AVG HOUSEHOLD SIZE
37,171
LABOR FORCE [ PEOPLE ]
58.1%
PERCENT IN LABOR FORCE
7.2%
UNEMPLOYMENT RATE
Income in Sullivan County
Income Overview in Sullivan County
Per Capita Income in Sullivan County is $37,854, while median incomes of families and households are $82,555 and $67,841 respectively.
| Characteristic | Number | Measure |
| Per Capita Income | 78,725 | $37,854 |
| Median Family Income | 17,842 | $82,555 |
| Mean Family Income | 17,842 | $113,631 |
| Median Household Income | 29,895 | $67,841 |
| Mean Household Income | 29,895 | $95,336 |
| Income Deficit | 17,842 | $11,234 |
| Wage / Income Gap (%) | 78,725 | 24.33% |
| Wage / Income Gap ($) | 78,725 | 75.67¢ per $1 |
| Gini / Inequality Index | 78,725 | 0.49 |
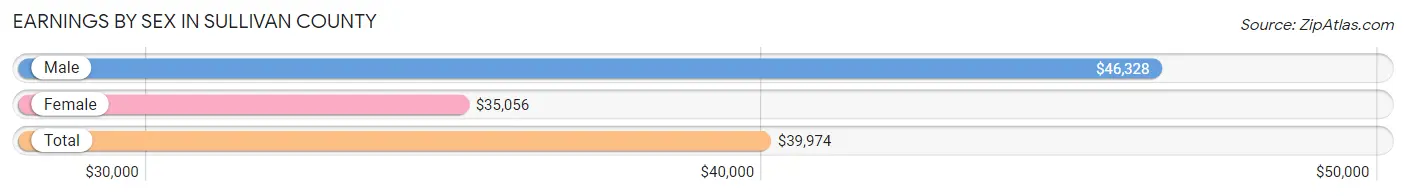
Earnings by Sex in Sullivan County
Average Earnings in Sullivan County are $39,974, $46,328 for men and $35,056 for women, a difference of 24.3%.
| Sex | Number | Average Earnings |
| Male | 20,893 (52.7%) | $46,328 |
| Female | 18,715 (47.2%) | $35,056 |
| Total | 39,608 (100.0%) | $39,974 |
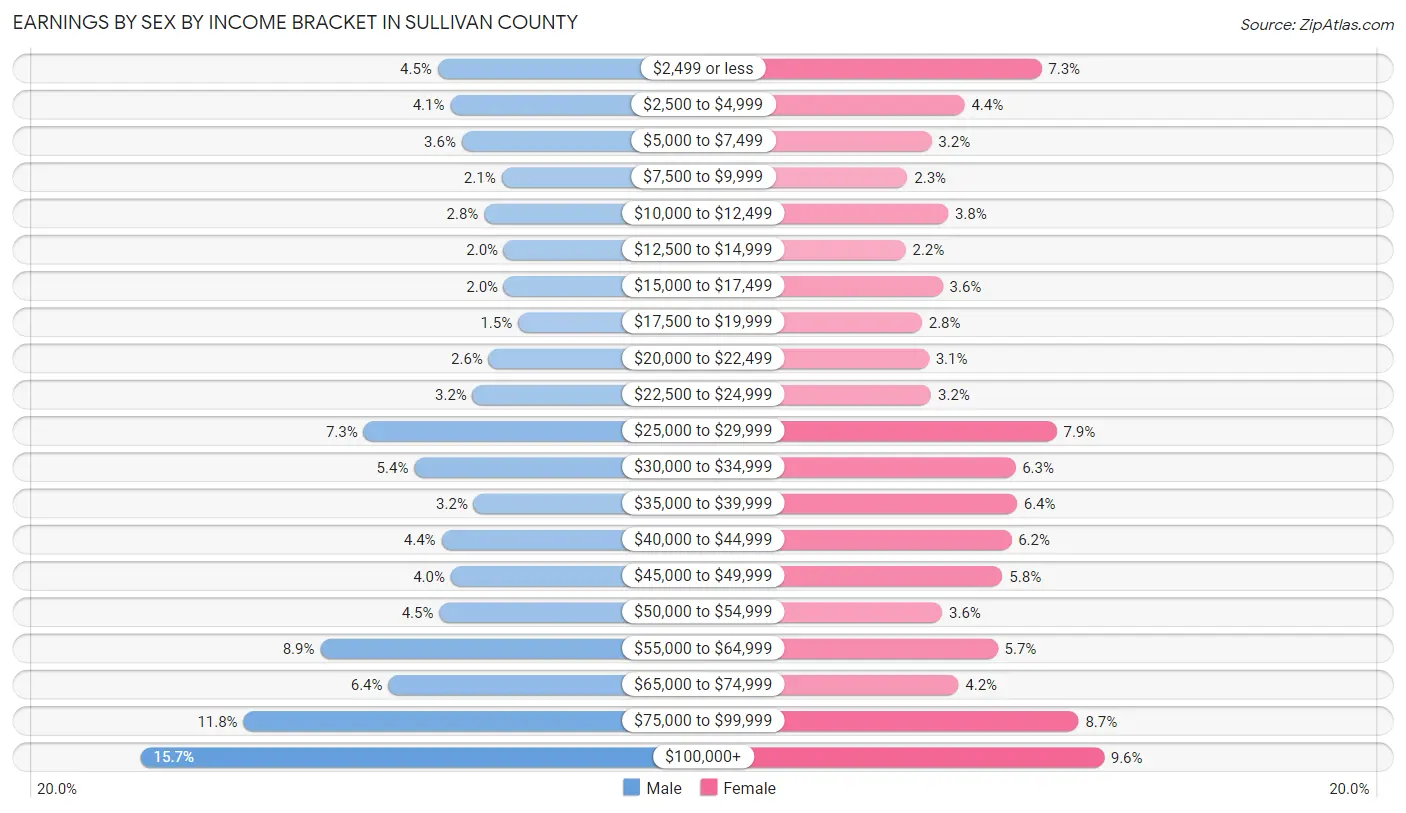
Earnings by Sex by Income Bracket in Sullivan County
The most common earnings brackets in Sullivan County are $100,000+ for men (3,269 | 15.7%) and $100,000+ for women (1,803 | 9.6%).
| Income | Male | Female |
| $2,499 or less | 945 (4.5%) | 1,364 (7.3%) |
| $2,500 to $4,999 | 847 (4.1%) | 825 (4.4%) |
| $5,000 to $7,499 | 757 (3.6%) | 593 (3.2%) |
| $7,500 to $9,999 | 446 (2.1%) | 424 (2.3%) |
| $10,000 to $12,499 | 581 (2.8%) | 710 (3.8%) |
| $12,500 to $14,999 | 426 (2.0%) | 411 (2.2%) |
| $15,000 to $17,499 | 426 (2.0%) | 672 (3.6%) |
| $17,500 to $19,999 | 316 (1.5%) | 526 (2.8%) |
| $20,000 to $22,499 | 545 (2.6%) | 575 (3.1%) |
| $22,500 to $24,999 | 671 (3.2%) | 591 (3.2%) |
| $25,000 to $29,999 | 1,525 (7.3%) | 1,471 (7.9%) |
| $30,000 to $34,999 | 1,129 (5.4%) | 1,180 (6.3%) |
| $35,000 to $39,999 | 663 (3.2%) | 1,193 (6.4%) |
| $40,000 to $44,999 | 915 (4.4%) | 1,152 (6.2%) |
| $45,000 to $49,999 | 841 (4.0%) | 1,092 (5.8%) |
| $50,000 to $54,999 | 932 (4.5%) | 668 (3.6%) |
| $55,000 to $64,999 | 1,863 (8.9%) | 1,058 (5.7%) |
| $65,000 to $74,999 | 1,331 (6.4%) | 782 (4.2%) |
| $75,000 to $99,999 | 2,465 (11.8%) | 1,625 (8.7%) |
| $100,000+ | 3,269 (15.7%) | 1,803 (9.6%) |
| Total | 20,893 (100.0%) | 18,715 (100.0%) |
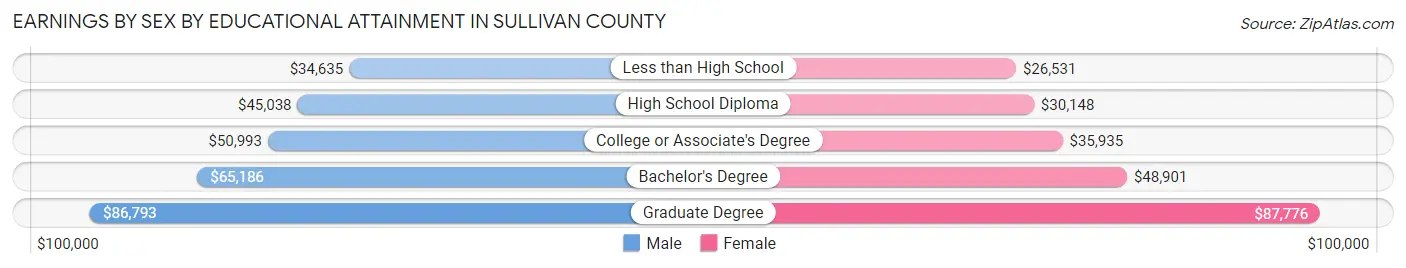
Earnings by Sex by Educational Attainment in Sullivan County
Average earnings in Sullivan County are $52,286 for men and $39,004 for women, a difference of 25.4%. Men with an educational attainment of graduate degree enjoy the highest average annual earnings of $86,793, while those with less than high school education earn the least with $34,635. Women with an educational attainment of graduate degree earn the most with the average annual earnings of $87,776, while those with less than high school education have the smallest earnings of $26,531.
| Educational Attainment | Male Income | Female Income |
| Less than High School | $34,635 | $26,531 |
| High School Diploma | $45,038 | $30,148 |
| College or Associate's Degree | $50,993 | $35,935 |
| Bachelor's Degree | $65,186 | $48,901 |
| Graduate Degree | $86,793 | $87,776 |
| Total | $52,286 | $39,004 |
Family Income in Sullivan County
Family Income Brackets in Sullivan County
According to the Sullivan County family income data, there are 3,122 families falling into the $100,000 to $149,999 income range, which is the most common income bracket and makes up 17.5% of all families. Conversely, the $10,000 to $14,999 income bracket is the least frequent group with only 393 families (2.2%) belonging to this category.
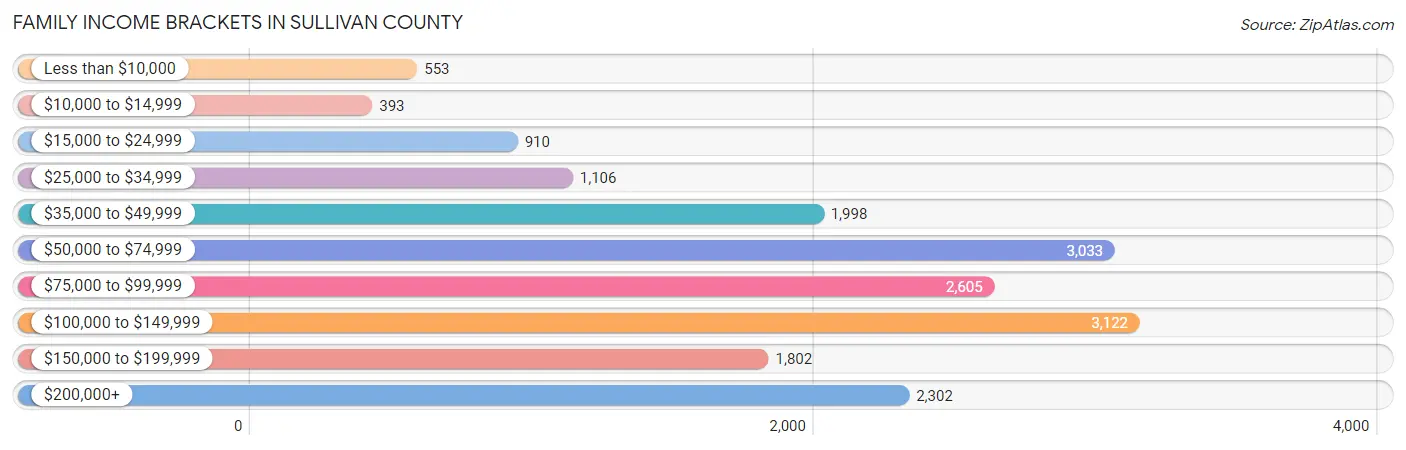
| Income Bracket | # Families | % Families |
| Less than $10,000 | 553 | 3.1% |
| $10,000 to $14,999 | 393 | 2.2% |
| $15,000 to $24,999 | 910 | 5.1% |
| $25,000 to $34,999 | 1,106 | 6.2% |
| $35,000 to $49,999 | 1,998 | 11.2% |
| $50,000 to $74,999 | 3,033 | 17.0% |
| $75,000 to $99,999 | 2,605 | 14.6% |
| $100,000 to $149,999 | 3,122 | 17.5% |
| $150,000 to $199,999 | 1,802 | 10.1% |
| $200,000+ | 2,302 | 12.9% |
Family Income by Famaliy Size in Sullivan County
5-person families (1,550 | 8.7%) account for the highest median family income in Sullivan County with $130,833 per family, while 2-person families (8,560 | 48.0%) have the highest median income of $40,320 per family member.
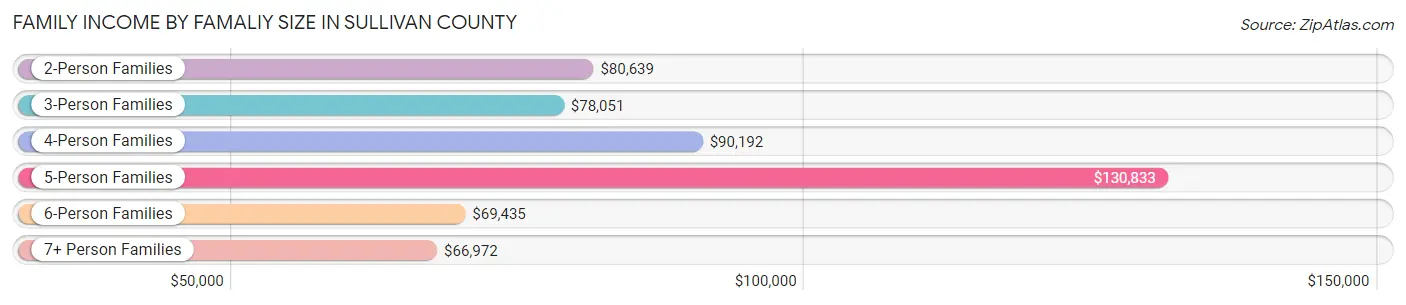
| Income Bracket | # Families | Median Income |
| 2-Person Families | 8,560 (48.0%) | $80,639 |
| 3-Person Families | 3,905 (21.9%) | $78,051 |
| 4-Person Families | 2,926 (16.4%) | $90,192 |
| 5-Person Families | 1,550 (8.7%) | $130,833 |
| 6-Person Families | 474 (2.7%) | $69,435 |
| 7+ Person Families | 427 (2.4%) | $66,972 |
| Total | 17,842 (100.0%) | $82,555 |
Family Income by Number of Earners in Sullivan County
The median family income in Sullivan County is $82,555, with families comprising 3+ earners (2,046) having the highest median family income of $168,548, while families with no earners (2,792) have the lowest median family income of $41,336, accounting for 11.5% and 15.7% of families, respectively.
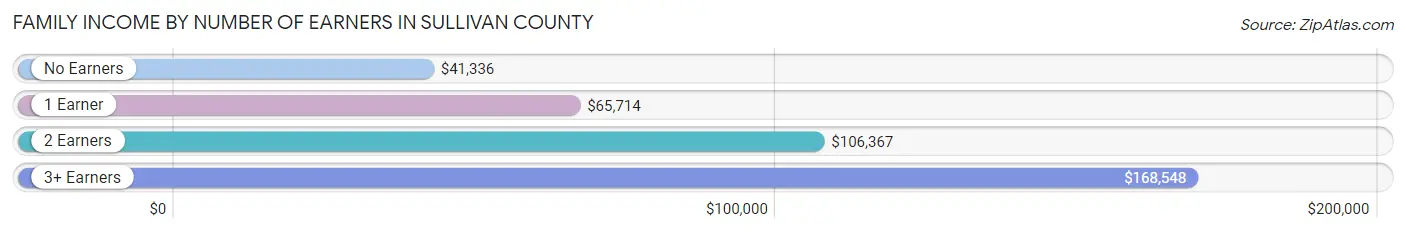
| Number of Earners | # Families | Median Income |
| No Earners | 2,792 (15.7%) | $41,336 |
| 1 Earner | 6,018 (33.7%) | $65,714 |
| 2 Earners | 6,986 (39.2%) | $106,367 |
| 3+ Earners | 2,046 (11.5%) | $168,548 |
| Total | 17,842 (100.0%) | $82,555 |
Household Income in Sullivan County
Household Income Brackets in Sullivan County
With 5,142 households falling in the category, the $50,000 to $74,999 income range is the most frequent in Sullivan County, accounting for 17.2% of all households. In contrast, only 1,256 households (4.2%) fall into the less than $10,000 income bracket, making it the least populous group.
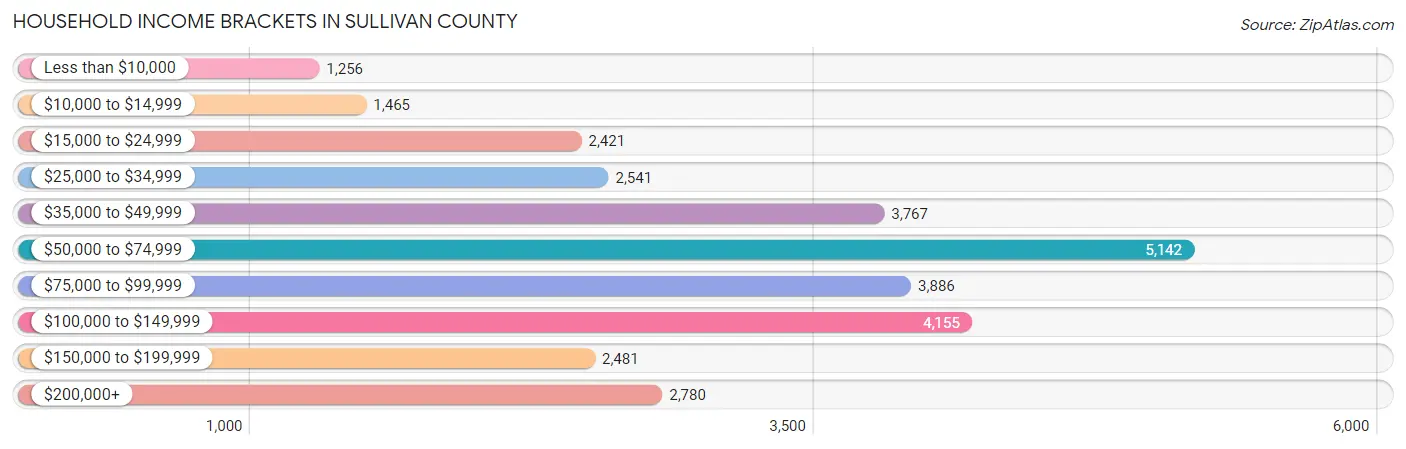
| Income Bracket | # Households | % Households |
| Less than $10,000 | 1,256 | 4.2% |
| $10,000 to $14,999 | 1,465 | 4.9% |
| $15,000 to $24,999 | 2,421 | 8.1% |
| $25,000 to $34,999 | 2,541 | 8.5% |
| $35,000 to $49,999 | 3,767 | 12.6% |
| $50,000 to $74,999 | 5,142 | 17.2% |
| $75,000 to $99,999 | 3,886 | 13.0% |
| $100,000 to $149,999 | 4,155 | 13.9% |
| $150,000 to $199,999 | 2,481 | 8.3% |
| $200,000+ | 2,780 | 9.3% |
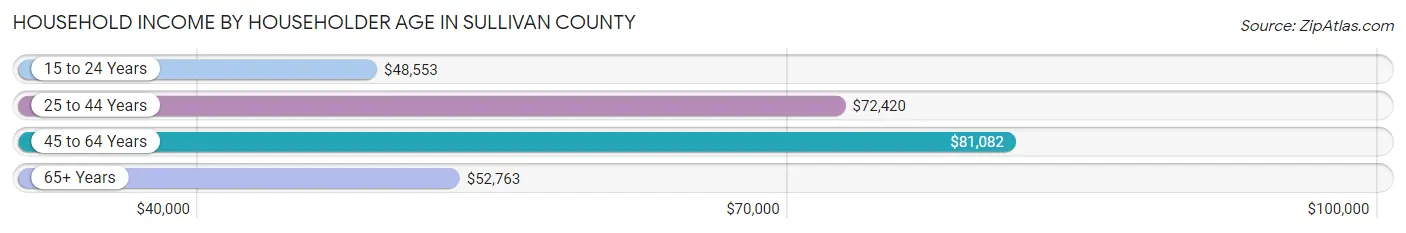
Household Income by Householder Age in Sullivan County
The median household income in Sullivan County is $67,841, with the highest median household income of $81,082 found in the 45 to 64 years age bracket for the primary householder. A total of 11,814 households (39.5%) fall into this category. Meanwhile, the 15 to 24 years age bracket for the primary householder has the lowest median household income of $48,553, with 990 households (3.3%) in this group.
| Income Bracket | # Households | Median Income |
| 15 to 24 Years | 990 (3.3%) | $48,553 |
| 25 to 44 Years | 7,579 (25.4%) | $72,420 |
| 45 to 64 Years | 11,814 (39.5%) | $81,082 |
| 65+ Years | 9,512 (31.8%) | $52,763 |
| Total | 29,895 (100.0%) | $67,841 |
Poverty in Sullivan County
Income Below Poverty by Sex and Age in Sullivan County
With 12.8% poverty level for males and 17.0% for females among the residents of Sullivan County, 5 year old males and 6 to 11 year old females are the most vulnerable to poverty, with 216 males (42.3%) and 857 females (36.6%) in their respective age groups living below the poverty level.
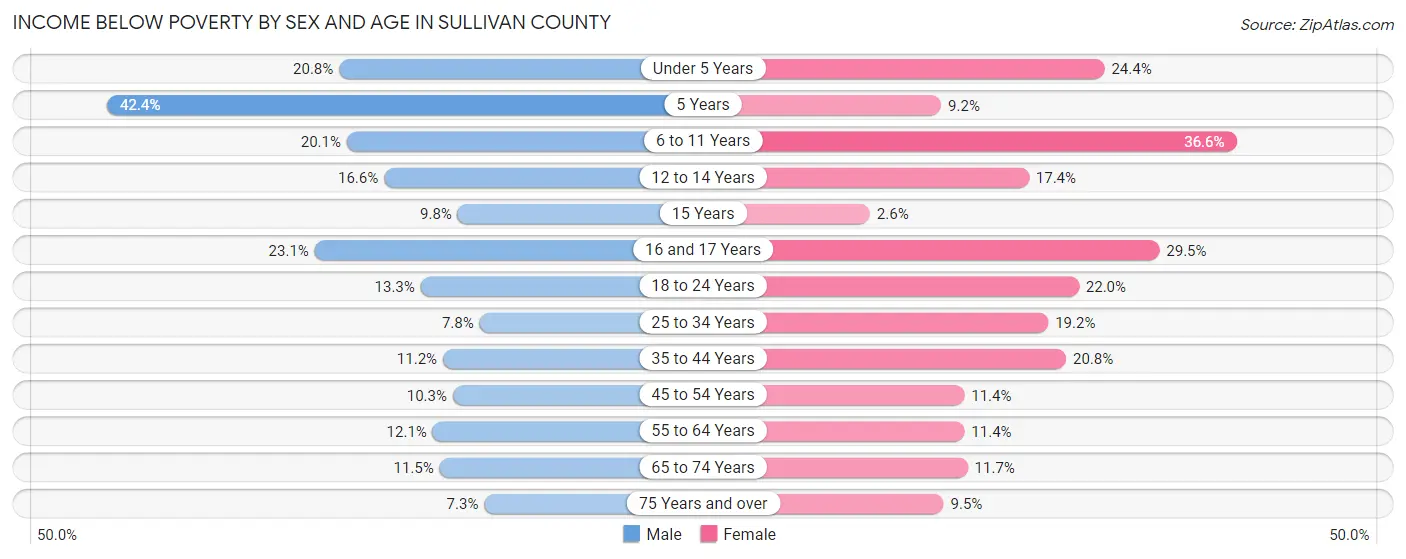
| Age Bracket | Male | Female |
| Under 5 Years | 470 (20.8%) | 512 (24.4%) |
| 5 Years | 216 (42.3%) | 70 (9.2%) |
| 6 to 11 Years | 548 (20.1%) | 857 (36.6%) |
| 12 to 14 Years | 245 (16.6%) | 214 (17.4%) |
| 15 Years | 63 (9.8%) | 12 (2.6%) |
| 16 and 17 Years | 174 (23.1%) | 290 (29.5%) |
| 18 to 24 Years | 436 (13.3%) | 639 (22.0%) |
| 25 to 34 Years | 364 (7.8%) | 839 (19.2%) |
| 35 to 44 Years | 473 (11.2%) | 925 (20.8%) |
| 45 to 54 Years | 521 (10.3%) | 527 (11.4%) |
| 55 to 64 Years | 667 (12.1%) | 636 (11.4%) |
| 65 to 74 Years | 516 (11.5%) | 523 (11.7%) |
| 75 Years and over | 190 (7.3%) | 284 (9.5%) |
| Total | 4,883 (12.8%) | 6,328 (17.0%) |
Income Above Poverty by Sex and Age in Sullivan County
According to the poverty statistics in Sullivan County, males aged 75 years and over and females aged 15 years are the age groups that are most secure financially, with 92.7% of males and 97.4% of females in these age groups living above the poverty line.
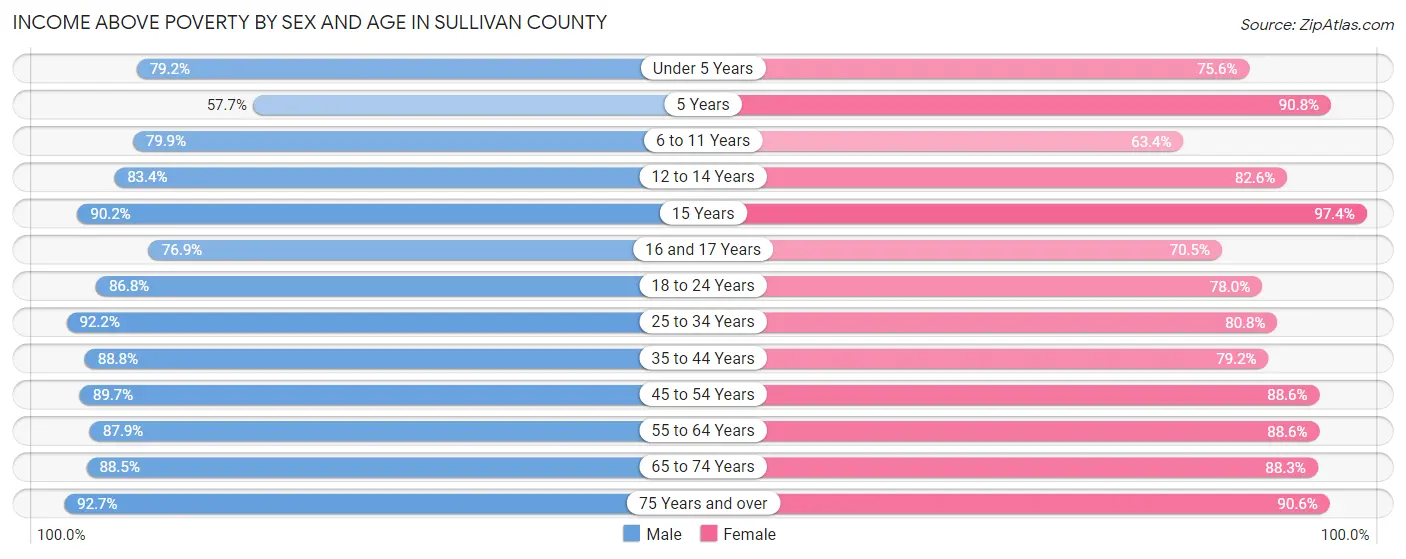
| Age Bracket | Male | Female |
| Under 5 Years | 1,788 (79.2%) | 1,588 (75.6%) |
| 5 Years | 294 (57.7%) | 689 (90.8%) |
| 6 to 11 Years | 2,179 (79.9%) | 1,484 (63.4%) |
| 12 to 14 Years | 1,227 (83.4%) | 1,019 (82.6%) |
| 15 Years | 579 (90.2%) | 447 (97.4%) |
| 16 and 17 Years | 580 (76.9%) | 694 (70.5%) |
| 18 to 24 Years | 2,854 (86.8%) | 2,266 (78.0%) |
| 25 to 34 Years | 4,316 (92.2%) | 3,541 (80.8%) |
| 35 to 44 Years | 3,759 (88.8%) | 3,519 (79.2%) |
| 45 to 54 Years | 4,557 (89.7%) | 4,108 (88.6%) |
| 55 to 64 Years | 4,834 (87.9%) | 4,954 (88.6%) |
| 65 to 74 Years | 3,976 (88.5%) | 3,955 (88.3%) |
| 75 Years and over | 2,397 (92.7%) | 2,722 (90.5%) |
| Total | 33,340 (87.2%) | 30,986 (83.0%) |
Income Below Poverty Among Married-Couple Families in Sullivan County
The poverty statistics for married-couple families in Sullivan County show that 6.2% or 765 of the total 12,299 families live below the poverty line. Families with 5 or more children have the highest poverty rate of 50.2%, comprising of 128 families. On the other hand, families with no children have the lowest poverty rate of 3.0%, which includes 216 families.
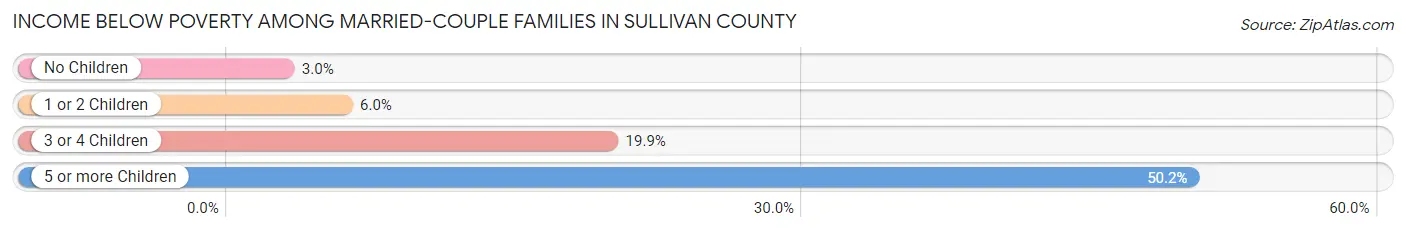
| Children | Above Poverty | Below Poverty |
| No Children | 7,061 (97.0%) | 216 (3.0%) |
| 1 or 2 Children | 3,568 (94.0%) | 228 (6.0%) |
| 3 or 4 Children | 778 (80.1%) | 193 (19.9%) |
| 5 or more Children | 127 (49.8%) | 128 (50.2%) |
| Total | 11,534 (93.8%) | 765 (6.2%) |
Income Below Poverty Among Single-Parent Households in Sullivan County
According to the poverty data in Sullivan County, 7.7% or 137 single-father households and 25.5% or 963 single-mother households are living below the poverty line. Among single-father households, those with 5 or more children have the highest poverty rate, with 6 households (21.4%) experiencing poverty. Likewise, among single-mother households, those with 5 or more children have the highest poverty rate, with 15 households (100.0%) falling below the poverty line.
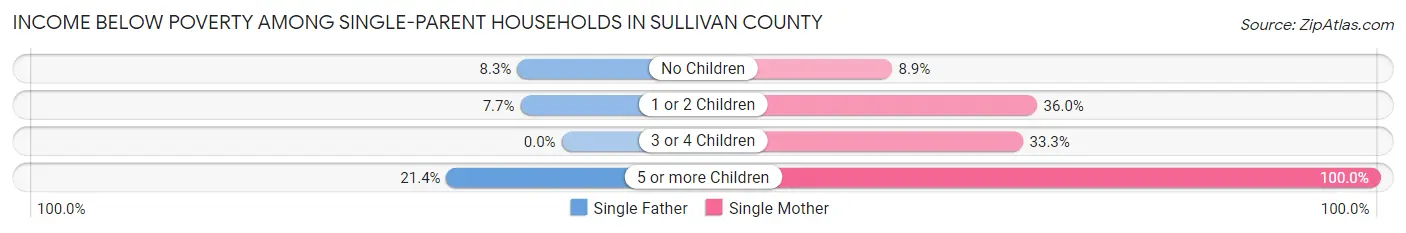
| Children | Single Father | Single Mother |
| No Children | 63 (8.3%) | 130 (8.9%) |
| 1 or 2 Children | 68 (7.7%) | 695 (35.9%) |
| 3 or 4 Children | 0 (0.0%) | 123 (33.3%) |
| 5 or more Children | 6 (21.4%) | 15 (100.0%) |
| Total | 137 (7.7%) | 963 (25.5%) |
Income Below Poverty Among Married-Couple vs Single-Parent Households in Sullivan County
The poverty data for Sullivan County shows that 765 of the married-couple family households (6.2%) and 1,100 of the single-parent households (19.8%) are living below the poverty level. Within the married-couple family households, those with 5 or more children have the highest poverty rate, with 128 households (50.2%) falling below the poverty line. Among the single-parent households, those with 5 or more children have the highest poverty rate, with 21 household (48.8%) living below poverty.
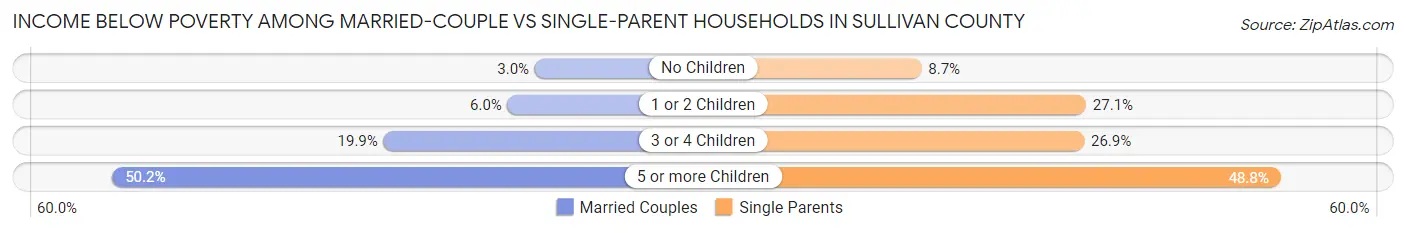
| Children | Married-Couple Families | Single-Parent Households |
| No Children | 216 (3.0%) | 193 (8.7%) |
| 1 or 2 Children | 228 (6.0%) | 763 (27.1%) |
| 3 or 4 Children | 193 (19.9%) | 123 (26.9%) |
| 5 or more Children | 128 (50.2%) | 21 (48.8%) |
| Total | 765 (6.2%) | 1,100 (19.8%) |
Race in Sullivan County
The most populous races in Sullivan County are White / Caucasian (58,757 | 74.6%), Hispanic or Latino (13,663 | 17.4%), and Black / African American (6,628 | 8.4%).
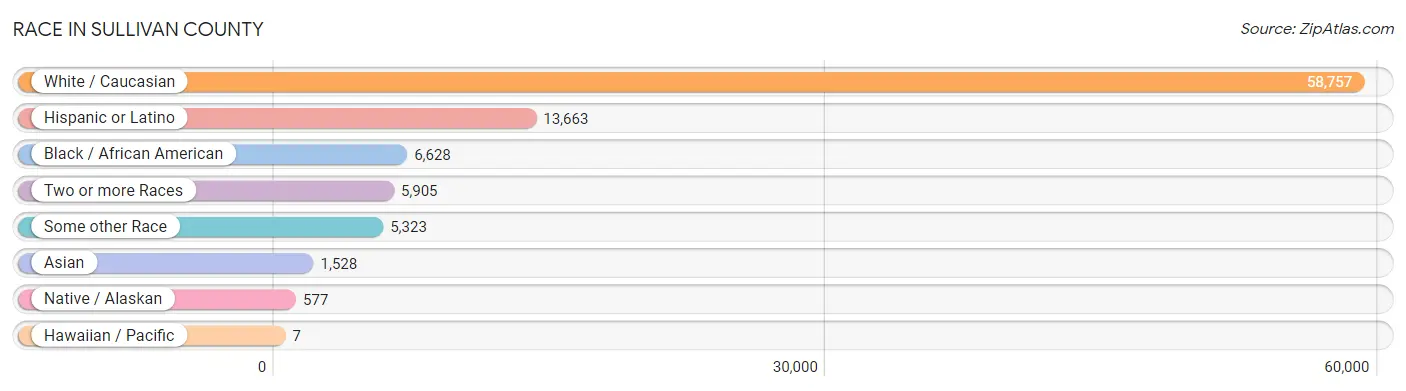
| Race | # Population | % Population |
| Asian | 1,528 | 1.9% |
| Black / African American | 6,628 | 8.4% |
| Hawaiian / Pacific | 7 | 0.0% |
| Hispanic or Latino | 13,663 | 17.4% |
| Native / Alaskan | 577 | 0.7% |
| White / Caucasian | 58,757 | 74.6% |
| Two or more Races | 5,905 | 7.5% |
| Some other Race | 5,323 | 6.8% |
| Total | 78,725 | 100.0% |
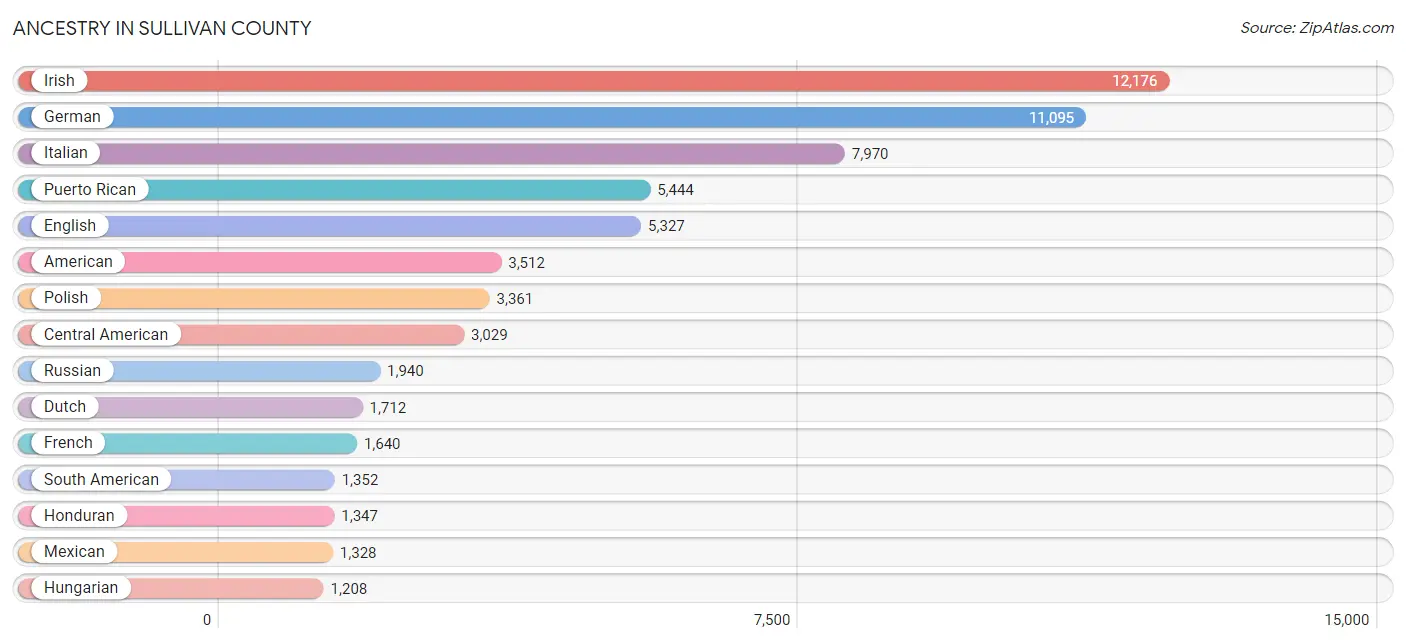
Ancestry in Sullivan County
The most populous ancestries reported in Sullivan County are Irish (12,176 | 15.5%), German (11,095 | 14.1%), Italian (7,970 | 10.1%), Puerto Rican (5,444 | 6.9%), and English (5,327 | 6.8%), together accounting for 53.4% of all Sullivan County residents.
| Ancestry | # Population | % Population |
| Afghan | 8 | 0.0% |
| African | 329 | 0.4% |
| Albanian | 403 | 0.5% |
| American | 3,512 | 4.5% |
| Arab | 271 | 0.3% |
| Argentinean | 54 | 0.1% |
| Armenian | 70 | 0.1% |
| Australian | 21 | 0.0% |
| Austrian | 685 | 0.9% |
| Belgian | 46 | 0.1% |
| Bhutanese | 273 | 0.4% |
| Blackfeet | 172 | 0.2% |
| Brazilian | 324 | 0.4% |
| British | 375 | 0.5% |
| British West Indian | 120 | 0.2% |
| Bulgarian | 41 | 0.1% |
| Burmese | 110 | 0.1% |
| Canadian | 65 | 0.1% |
| Celtic | 20 | 0.0% |
| Central American | 3,029 | 3.8% |
| Central American Indian | 388 | 0.5% |
| Cherokee | 197 | 0.3% |
| Cheyenne | 66 | 0.1% |
| Chilean | 22 | 0.0% |
| Choctaw | 26 | 0.0% |
| Colombian | 692 | 0.9% |
| Costa Rican | 43 | 0.1% |
| Cree | 8 | 0.0% |
| Creek | 13 | 0.0% |
| Croatian | 76 | 0.1% |
| Crow | 8 | 0.0% |
| Cuban | 248 | 0.3% |
| Czech | 443 | 0.6% |
| Czechoslovakian | 28 | 0.0% |
| Danish | 255 | 0.3% |
| Delaware | 223 | 0.3% |
| Dominican | 838 | 1.1% |
| Dutch | 1,712 | 2.2% |
| Dutch West Indian | 51 | 0.1% |
| Eastern European | 456 | 0.6% |
| Ecuadorian | 292 | 0.4% |
| Egyptian | 23 | 0.0% |
| English | 5,327 | 6.8% |
| European | 1,124 | 1.4% |
| Filipino | 15 | 0.0% |
| Finnish | 34 | 0.0% |
| French | 1,640 | 2.1% |
| French American Indian | 1 | 0.0% |
| French Canadian | 273 | 0.4% |
| German | 11,095 | 14.1% |
| Ghanaian | 47 | 0.1% |
| Greek | 476 | 0.6% |
| Guamanian / Chamorro | 42 | 0.1% |
| Guatemalan | 812 | 1.0% |
| Guyanese | 164 | 0.2% |
| Haitian | 92 | 0.1% |
| Honduran | 1,347 | 1.7% |
| Hungarian | 1,208 | 1.5% |
| Indian (Asian) | 641 | 0.8% |
| Indonesian | 26 | 0.0% |
| Iranian | 12 | 0.0% |
| Irish | 12,176 | 15.5% |
| Iroquois | 30 | 0.0% |
| Israeli | 12 | 0.0% |
| Italian | 7,970 | 10.1% |
| Jamaican | 468 | 0.6% |
| Japanese | 34 | 0.0% |
| Jordanian | 68 | 0.1% |
| Korean | 172 | 0.2% |
| Laotian | 14 | 0.0% |
| Latvian | 41 | 0.1% |
| Lebanese | 46 | 0.1% |
| Lithuanian | 254 | 0.3% |
| Macedonian | 99 | 0.1% |
| Mexican | 1,328 | 1.7% |
| Mexican American Indian | 165 | 0.2% |
| Mongolian | 23 | 0.0% |
| Moroccan | 55 | 0.1% |
| Native Hawaiian | 42 | 0.1% |
| Navajo | 3 | 0.0% |
| Nigerian | 19 | 0.0% |
| Northern European | 485 | 0.6% |
| Norwegian | 488 | 0.6% |
| Panamanian | 76 | 0.1% |
| Pennsylvania German | 21 | 0.0% |
| Peruvian | 120 | 0.2% |
| Polish | 3,361 | 4.3% |
| Portuguese | 564 | 0.7% |
| Puerto Rican | 5,444 | 6.9% |
| Romanian | 302 | 0.4% |
| Russian | 1,940 | 2.5% |
| Salvadoran | 751 | 0.9% |
| Scandinavian | 119 | 0.2% |
| Scotch-Irish | 479 | 0.6% |
| Scottish | 945 | 1.2% |
| Serbian | 9 | 0.0% |
| Sierra Leonean | 122 | 0.2% |
| Sioux | 20 | 0.0% |
| Slavic | 66 | 0.1% |
| Slovak | 81 | 0.1% |
| Slovene | 18 | 0.0% |
| South African | 1 | 0.0% |
| South American | 1,352 | 1.7% |
| South American Indian | 80 | 0.1% |
| Soviet Union | 6 | 0.0% |
| Spaniard | 93 | 0.1% |
| Spanish | 662 | 0.8% |
| Sri Lankan | 44 | 0.1% |
| Subsaharan African | 513 | 0.6% |
| Swedish | 412 | 0.5% |
| Swiss | 377 | 0.5% |
| Syrian | 11 | 0.0% |
| Thai | 554 | 0.7% |
| Trinidadian and Tobagonian | 89 | 0.1% |
| Turkish | 66 | 0.1% |
| Ukrainian | 507 | 0.6% |
| Uruguayan | 37 | 0.1% |
| Venezuelan | 135 | 0.2% |
| Vietnamese | 1 | 0.0% |
| Welsh | 495 | 0.6% |
| West Indian | 11 | 0.0% |
| Yugoslavian | 122 | 0.2% | View All 122 Rows |
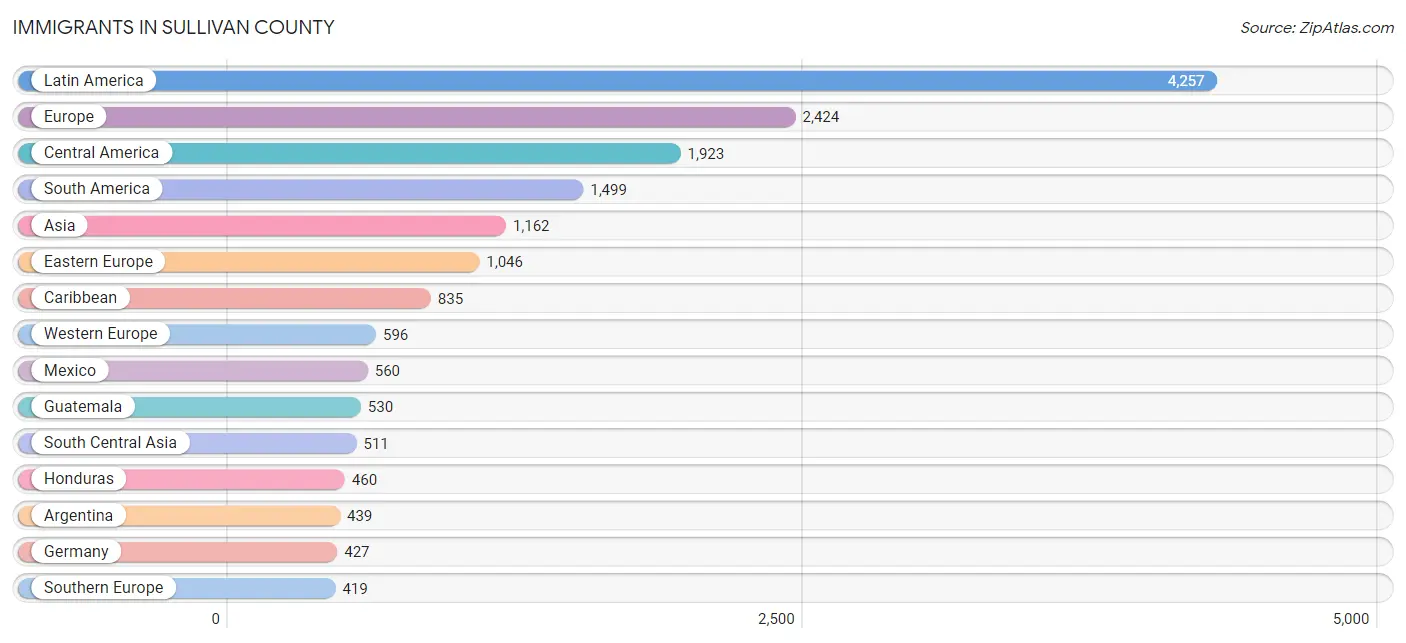
Immigrants in Sullivan County
The most numerous immigrant groups reported in Sullivan County came from Latin America (4,257 | 5.4%), Europe (2,424 | 3.1%), Central America (1,923 | 2.4%), South America (1,499 | 1.9%), and Asia (1,162 | 1.5%), together accounting for 14.3% of all Sullivan County residents.
| Immigration Origin | # Population | % Population |
| Afghanistan | 8 | 0.0% |
| Africa | 177 | 0.2% |
| Albania | 26 | 0.0% |
| Argentina | 439 | 0.6% |
| Asia | 1,162 | 1.5% |
| Australia | 37 | 0.1% |
| Austria | 18 | 0.0% |
| Bangladesh | 105 | 0.1% |
| Belarus | 61 | 0.1% |
| Bosnia and Herzegovina | 6 | 0.0% |
| Brazil | 331 | 0.4% |
| Bulgaria | 41 | 0.1% |
| Cambodia | 14 | 0.0% |
| Canada | 197 | 0.3% |
| Caribbean | 835 | 1.1% |
| Central America | 1,923 | 2.4% |
| Chile | 80 | 0.1% |
| China | 199 | 0.3% |
| Colombia | 160 | 0.2% |
| Cuba | 53 | 0.1% |
| Czechoslovakia | 34 | 0.0% |
| Dominican Republic | 235 | 0.3% |
| Eastern Africa | 12 | 0.0% |
| Eastern Asia | 366 | 0.5% |
| Eastern Europe | 1,046 | 1.3% |
| Ecuador | 307 | 0.4% |
| Egypt | 7 | 0.0% |
| El Salvador | 344 | 0.4% |
| England | 103 | 0.1% |
| Europe | 2,424 | 3.1% |
| France | 84 | 0.1% |
| Germany | 427 | 0.5% |
| Ghana | 15 | 0.0% |
| Greece | 91 | 0.1% |
| Grenada | 66 | 0.1% |
| Guatemala | 530 | 0.7% |
| Guyana | 86 | 0.1% |
| Haiti | 104 | 0.1% |
| Honduras | 460 | 0.6% |
| Hong Kong | 11 | 0.0% |
| Hungary | 19 | 0.0% |
| India | 278 | 0.4% |
| Indonesia | 13 | 0.0% |
| Iran | 6 | 0.0% |
| Ireland | 54 | 0.1% |
| Israel | 97 | 0.1% |
| Italy | 218 | 0.3% |
| Jamaica | 285 | 0.4% |
| Japan | 60 | 0.1% |
| Kazakhstan | 27 | 0.0% |
| Korea | 107 | 0.1% |
| Latin America | 4,257 | 5.4% |
| Latvia | 17 | 0.0% |
| Liberia | 35 | 0.0% |
| Malaysia | 28 | 0.0% |
| Mexico | 560 | 0.7% |
| Moldova | 19 | 0.0% |
| Nepal | 21 | 0.0% |
| Netherlands | 20 | 0.0% |
| Nigeria | 52 | 0.1% |
| Northern Africa | 7 | 0.0% |
| Northern Europe | 363 | 0.5% |
| Oceania | 37 | 0.1% |
| Pakistan | 19 | 0.0% |
| Panama | 29 | 0.0% |
| Peru | 36 | 0.1% |
| Philippines | 58 | 0.1% |
| Poland | 307 | 0.4% |
| Portugal | 99 | 0.1% |
| Romania | 61 | 0.1% |
| Russia | 76 | 0.1% |
| Scotland | 23 | 0.0% |
| Serbia | 19 | 0.0% |
| South Africa | 1 | 0.0% |
| South America | 1,499 | 1.9% |
| South Central Asia | 511 | 0.6% |
| South Eastern Asia | 173 | 0.2% |
| Southern Europe | 419 | 0.5% |
| Spain | 11 | 0.0% |
| St. Vincent and the Grenadines | 6 | 0.0% |
| Sweden | 33 | 0.0% |
| Switzerland | 47 | 0.1% |
| Taiwan | 8 | 0.0% |
| Thailand | 5 | 0.0% |
| Trinidad and Tobago | 21 | 0.0% |
| Turkey | 15 | 0.0% |
| Ukraine | 146 | 0.2% |
| Uruguay | 15 | 0.0% |
| Uzbekistan | 17 | 0.0% |
| Venezuela | 45 | 0.1% |
| Vietnam | 29 | 0.0% |
| West Indies | 7 | 0.0% |
| Western Africa | 157 | 0.2% |
| Western Asia | 112 | 0.1% |
| Western Europe | 596 | 0.8% | View All 95 Rows |
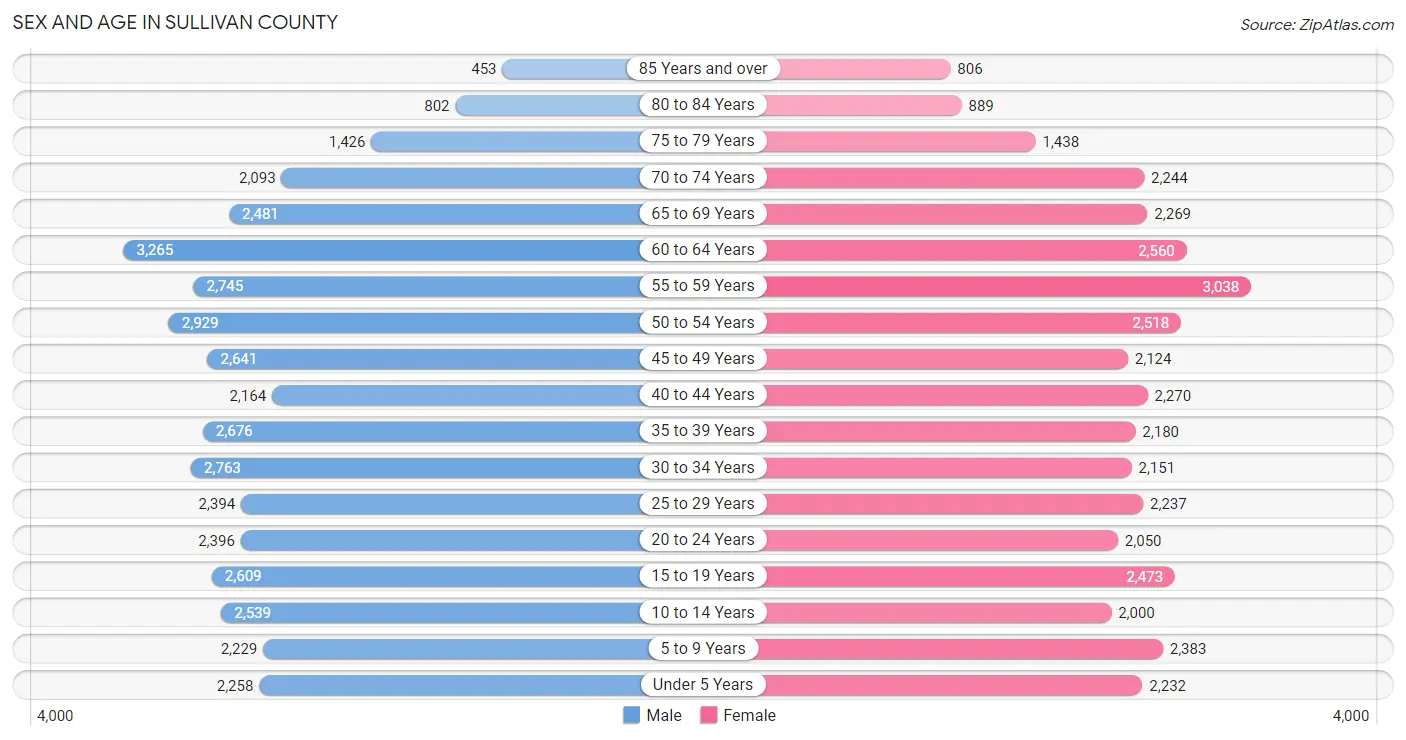
Sex and Age in Sullivan County
Sex and Age in Sullivan County
The most populous age groups in Sullivan County are 60 to 64 Years (3,265 | 8.0%) for men and 55 to 59 Years (3,038 | 8.0%) for women.
| Age Bracket | Male | Female |
| Under 5 Years | 2,258 (5.5%) | 2,232 (5.9%) |
| 5 to 9 Years | 2,229 (5.4%) | 2,383 (6.3%) |
| 10 to 14 Years | 2,539 (6.2%) | 2,000 (5.3%) |
| 15 to 19 Years | 2,609 (6.4%) | 2,473 (6.5%) |
| 20 to 24 Years | 2,396 (5.9%) | 2,050 (5.4%) |
| 25 to 29 Years | 2,394 (5.9%) | 2,237 (5.9%) |
| 30 to 34 Years | 2,763 (6.8%) | 2,151 (5.7%) |
| 35 to 39 Years | 2,676 (6.6%) | 2,180 (5.8%) |
| 40 to 44 Years | 2,164 (5.3%) | 2,270 (6.0%) |
| 45 to 49 Years | 2,641 (6.5%) | 2,124 (5.6%) |
| 50 to 54 Years | 2,929 (7.2%) | 2,518 (6.7%) |
| 55 to 59 Years | 2,745 (6.7%) | 3,038 (8.0%) |
| 60 to 64 Years | 3,265 (8.0%) | 2,560 (6.8%) |
| 65 to 69 Years | 2,481 (6.1%) | 2,269 (6.0%) |
| 70 to 74 Years | 2,093 (5.1%) | 2,244 (5.9%) |
| 75 to 79 Years | 1,426 (3.5%) | 1,438 (3.8%) |
| 80 to 84 Years | 802 (2.0%) | 889 (2.4%) |
| 85 Years and over | 453 (1.1%) | 806 (2.1%) |
| Total | 40,863 (100.0%) | 37,862 (100.0%) |
Families and Households in Sullivan County
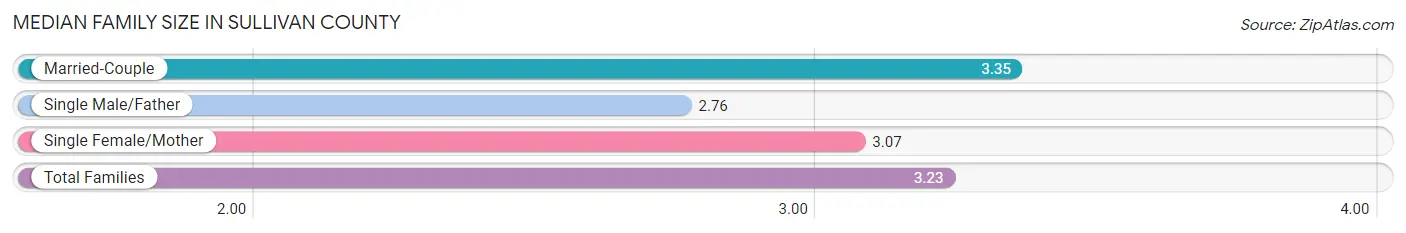
Median Family Size in Sullivan County
The median family size in Sullivan County is 3.23 persons per family, with married-couple families (12,299 | 68.9%) accounting for the largest median family size of 3.35 persons per family. On the other hand, single male/father families (1,767 | 9.9%) represent the smallest median family size with 2.76 persons per family.
| Family Type | # Families | Family Size |
| Married-Couple | 12,299 (68.9%) | 3.35 |
| Single Male/Father | 1,767 (9.9%) | 2.76 |
| Single Female/Mother | 3,776 (21.2%) | 3.07 |
| Total Families | 17,842 (100.0%) | 3.23 |
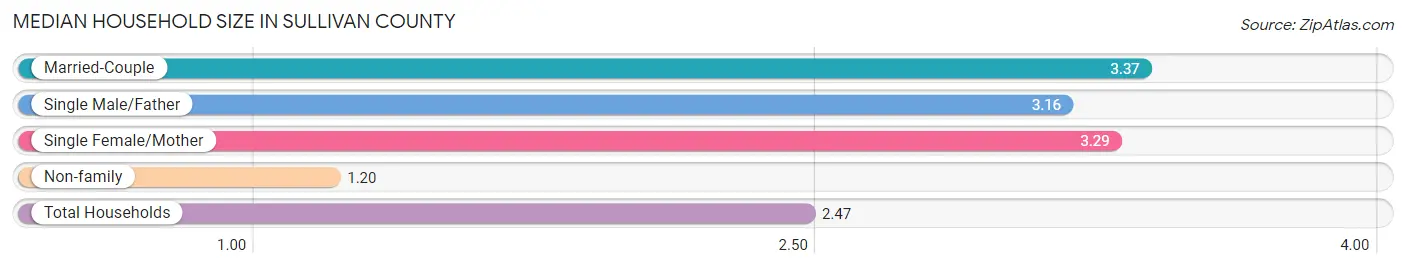
Median Household Size in Sullivan County
The median household size in Sullivan County is 2.47 persons per household, with married-couple households (12,299 | 41.1%) accounting for the largest median household size of 3.37 persons per household. non-family households (12,053 | 40.3%) represent the smallest median household size with 1.20 persons per household.
| Household Type | # Households | Household Size |
| Married-Couple | 12,299 (41.1%) | 3.37 |
| Single Male/Father | 1,767 (5.9%) | 3.16 |
| Single Female/Mother | 3,776 (12.6%) | 3.29 |
| Non-family | 12,053 (40.3%) | 1.20 |
| Total Households | 29,895 (100.0%) | 2.47 |
Household Size by Marriage Status in Sullivan County
Out of a total of 29,895 households in Sullivan County, 17,842 (59.7%) are family households, while 12,053 (40.3%) are nonfamily households. The most numerous type of family households are 2-person households, comprising 7,686, and the most common type of nonfamily households are 1-person households, comprising 9,861.
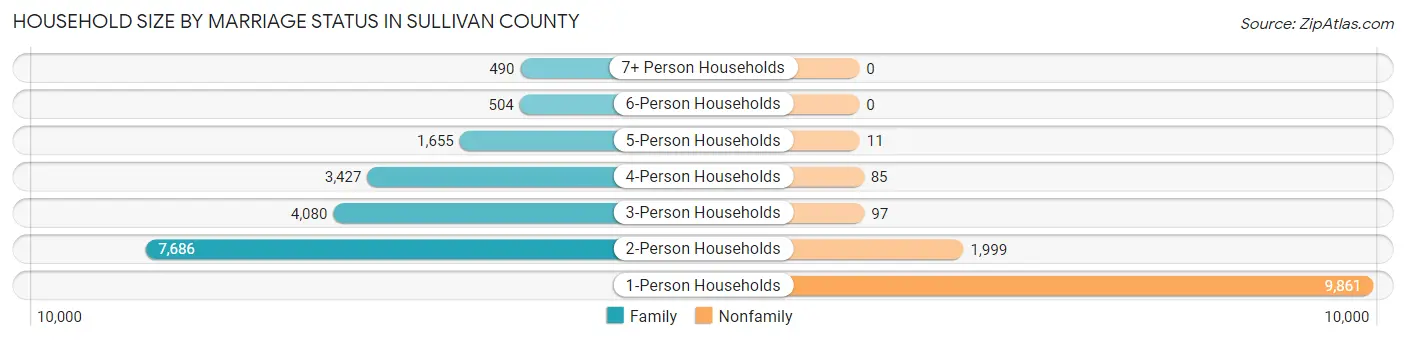
| Household Size | Family Households | Nonfamily Households |
| 1-Person Households | - | 9,861 (33.0%) |
| 2-Person Households | 7,686 (25.7%) | 1,999 (6.7%) |
| 3-Person Households | 4,080 (13.7%) | 97 (0.3%) |
| 4-Person Households | 3,427 (11.5%) | 85 (0.3%) |
| 5-Person Households | 1,655 (5.5%) | 11 (0.0%) |
| 6-Person Households | 504 (1.7%) | 0 (0.0%) |
| 7+ Person Households | 490 (1.6%) | 0 (0.0%) |
| Total | 17,842 (59.7%) | 12,053 (40.3%) |
Female Fertility in Sullivan County
Fertility by Age in Sullivan County
Average fertility rate in Sullivan County is 67.0 births per 1,000 women. Women in the age bracket of 20 to 34 years have the highest fertility rate with 103.0 births per 1,000 women. Women in the age bracket of 20 to 34 years acount for 61.3% of all women with births.
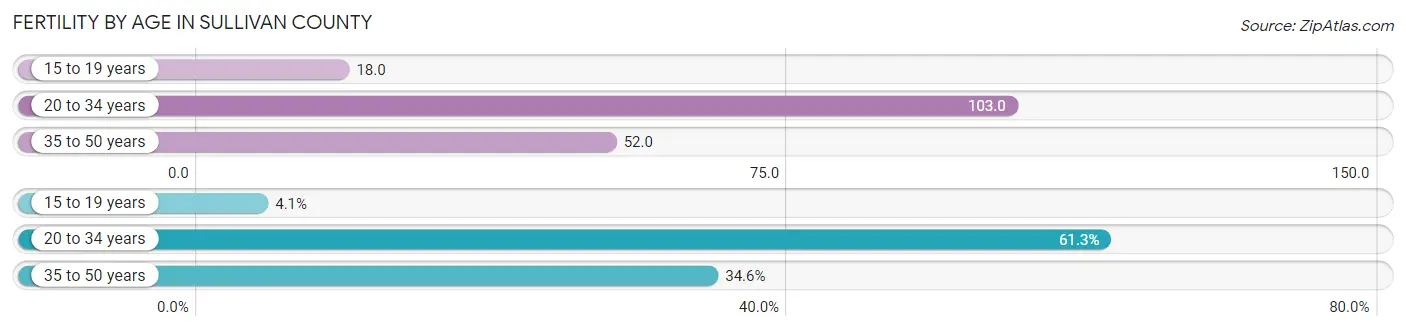
| Age Bracket | Women with Births | Births / 1,000 Women |
| 15 to 19 years | 44 (4.1%) | 18.0 |
| 20 to 34 years | 660 (61.3%) | 103.0 |
| 35 to 50 years | 373 (34.6%) | 52.0 |
| Total | 1,077 (100.0%) | 67.0 |
Fertility by Age by Marriage Status in Sullivan County
69.6% of women with births (1,077) in Sullivan County are married. The highest percentage of unmarried women with births falls into 15 to 19 years age bracket with 100.0% of them unmarried at the time of birth, while the lowest percentage of unmarried women with births belong to 35 to 50 years age bracket with 3.7% of them unmarried.
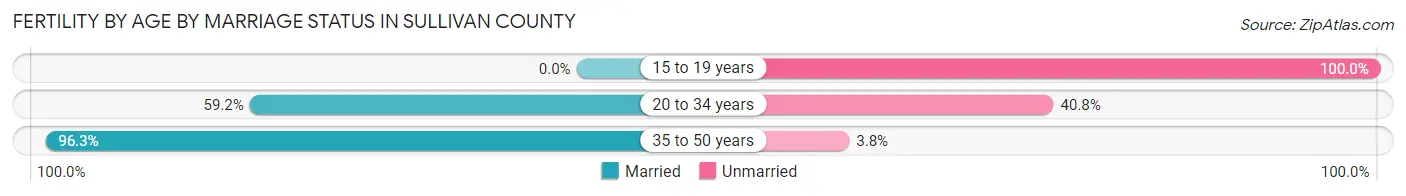
| Age Bracket | Married | Unmarried |
| 15 to 19 years | 0 (0.0%) | 44 (100.0%) |
| 20 to 34 years | 391 (59.2%) | 269 (40.8%) |
| 35 to 50 years | 359 (96.3%) | 14 (3.7%) |
| Total | 750 (69.6%) | 327 (30.4%) |
Fertility by Education in Sullivan County
Average fertility rate in Sullivan County is 67.0 births per 1,000 women. Women with the education attainment of college or associate's degree have the highest fertility rate of 89.0 births per 1,000 women, while women with the education attainment of bachelor's degree have the lowest fertility at 37.0 births per 1,000 women. Women with the education attainment of college or associate's degree represent 41.7% of all women with births.
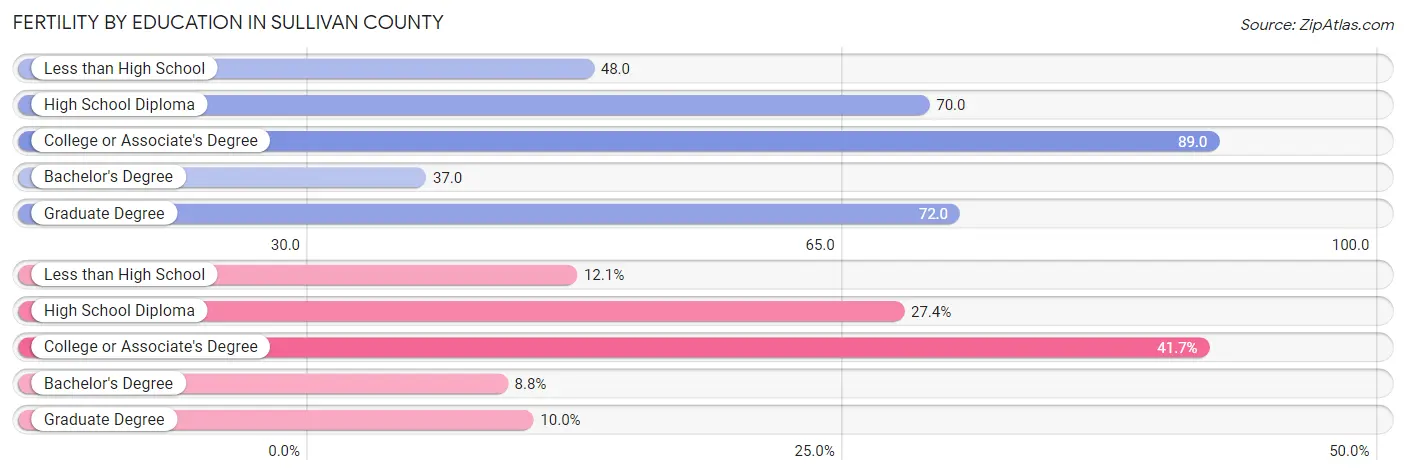
| Educational Attainment | Women with Births | Births / 1,000 Women |
| Less than High School | 130 (12.1%) | 48.0 |
| High School Diploma | 295 (27.4%) | 70.0 |
| College or Associate's Degree | 449 (41.7%) | 89.0 |
| Bachelor's Degree | 95 (8.8%) | 37.0 |
| Graduate Degree | 108 (10.0%) | 72.0 |
| Total | 1,077 (100.0%) | 67.0 |
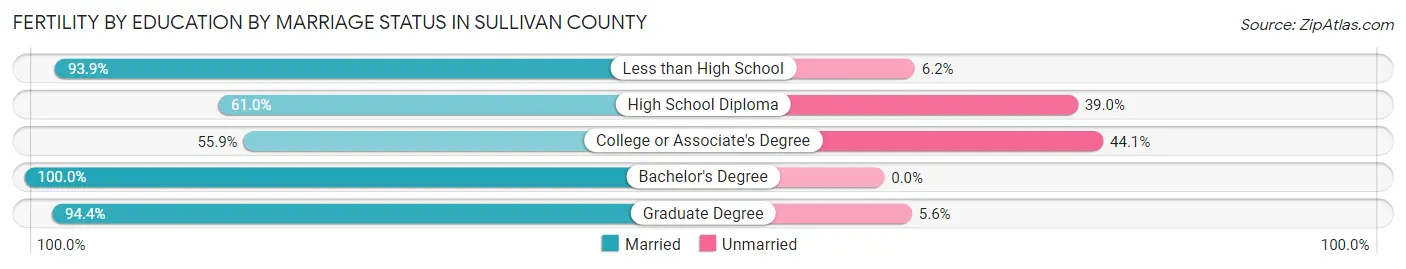
Fertility by Education by Marriage Status in Sullivan County
30.4% of women with births in Sullivan County are unmarried. Women with the educational attainment of bachelor's degree are most likely to be married with 100.0% of them married at childbirth, while women with the educational attainment of college or associate's degree are least likely to be married with 44.1% of them unmarried at childbirth.
| Educational Attainment | Married | Unmarried |
| Less than High School | 122 (93.9%) | 8 (6.1%) |
| High School Diploma | 180 (61.0%) | 115 (39.0%) |
| College or Associate's Degree | 251 (55.9%) | 198 (44.1%) |
| Bachelor's Degree | 95 (100.0%) | 0 (0.0%) |
| Graduate Degree | 102 (94.4%) | 6 (5.6%) |
| Total | 750 (69.6%) | 327 (30.4%) |
Employment Characteristics in Sullivan County
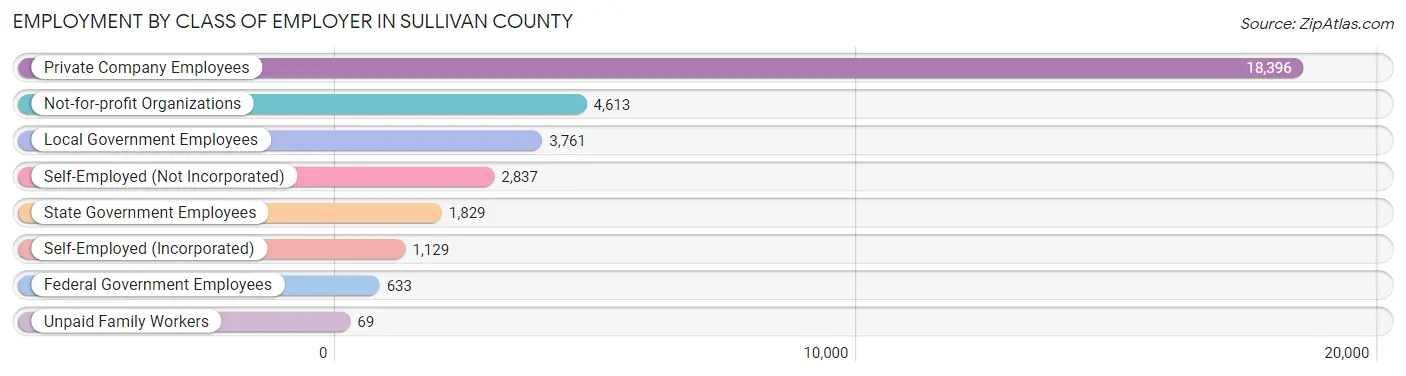
Employment by Class of Employer in Sullivan County
Among the 33,267 employed individuals in Sullivan County, private company employees (18,396 | 55.3%), not-for-profit organizations (4,613 | 13.9%), and local government employees (3,761 | 11.3%) make up the most common classes of employment.
| Employer Class | # Employees | % Employees |
| Private Company Employees | 18,396 | 55.3% |
| Self-Employed (Incorporated) | 1,129 | 3.4% |
| Self-Employed (Not Incorporated) | 2,837 | 8.5% |
| Not-for-profit Organizations | 4,613 | 13.9% |
| Local Government Employees | 3,761 | 11.3% |
| State Government Employees | 1,829 | 5.5% |
| Federal Government Employees | 633 | 1.9% |
| Unpaid Family Workers | 69 | 0.2% |
| Total | 33,267 | 100.0% |
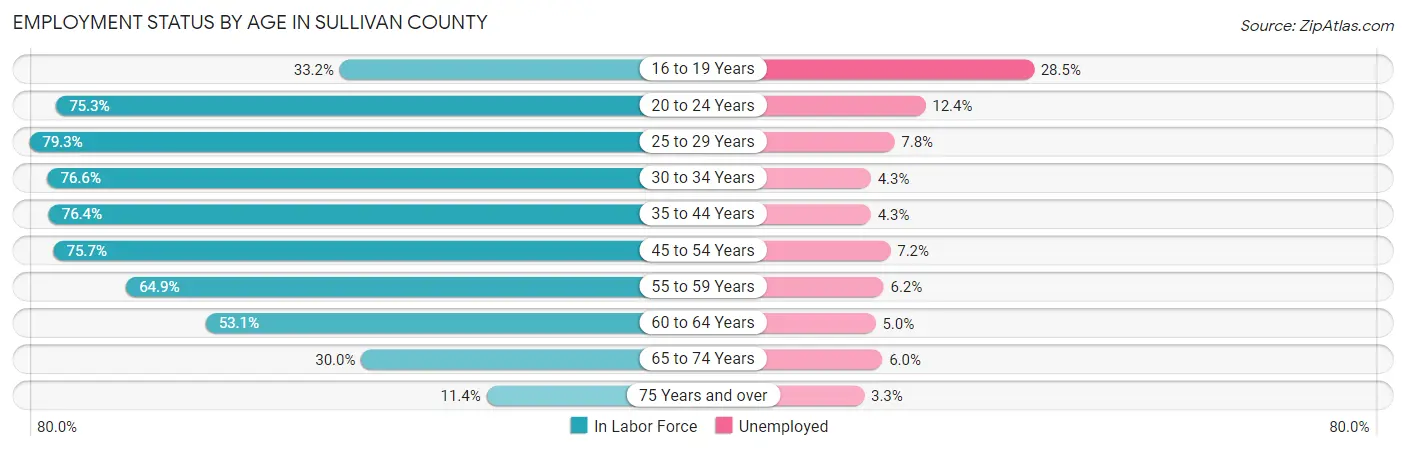
Employment Status by Age in Sullivan County
According to the labor force statistics for Sullivan County, out of the total population over 16 years of age (63,978), 58.1% or 37,171 individuals are in the labor force, with 7.2% or 2,676 of them unemployed. The age group with the highest labor force participation rate is 25 to 29 years, with 79.3% or 3,672 individuals in the labor force. Within the labor force, the 16 to 19 years age range has the highest percentage of unemployed individuals, with 28.5% or 376 of them being unemployed.
| Age Bracket | In Labor Force | Unemployed |
| 16 to 19 Years | 1,320 (33.2%) | 376 (28.5%) |
| 20 to 24 Years | 3,348 (75.3%) | 415 (12.4%) |
| 25 to 29 Years | 3,672 (79.3%) | 286 (7.8%) |
| 30 to 34 Years | 3,764 (76.6%) | 162 (4.3%) |
| 35 to 44 Years | 7,098 (76.4%) | 305 (4.3%) |
| 45 to 54 Years | 7,730 (75.7%) | 557 (7.2%) |
| 55 to 59 Years | 3,753 (64.9%) | 233 (6.2%) |
| 60 to 64 Years | 3,093 (53.1%) | 155 (5.0%) |
| 65 to 74 Years | 2,726 (30.0%) | 164 (6.0%) |
| 75 Years and over | 663 (11.4%) | 22 (3.3%) |
| Total | 37,171 (58.1%) | 2,676 (7.2%) |
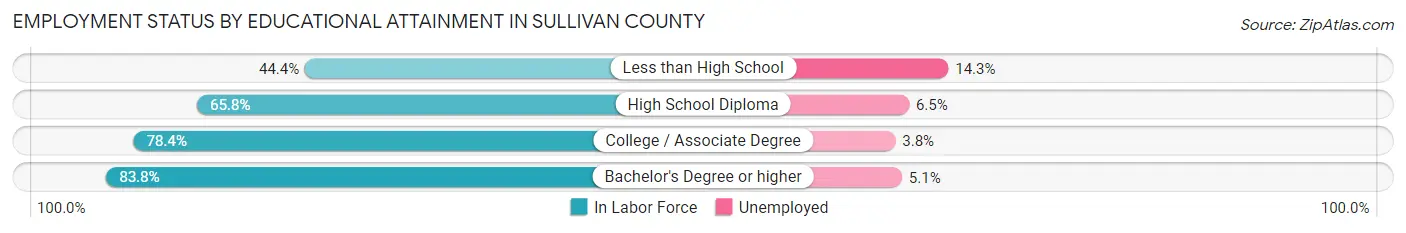
Employment Status by Educational Attainment in Sullivan County
According to labor force statistics for Sullivan County, 71.6% of individuals (29,109) out of the total population between 25 and 64 years of age (40,655) are in the labor force, with 5.8% or 1,688 of them being unemployed. The group with the highest labor force participation rate are those with the educational attainment of bachelor's degree or higher, with 83.8% or 9,297 individuals in the labor force. Within the labor force, individuals with less than high school education have the highest percentage of unemployment, with 14.3% or 332 of them being unemployed.
| Educational Attainment | In Labor Force | Unemployed |
| Less than High School | 2,324 (44.4%) | 749 (14.3%) |
| High School Diploma | 8,340 (65.8%) | 824 (6.5%) |
| College / Associate Degree | 9,134 (78.4%) | 443 (3.8%) |
| Bachelor's Degree or higher | 9,297 (83.8%) | 566 (5.1%) |
| Total | 29,109 (71.6%) | 2,358 (5.8%) |
Employment Occupations by Sex in Sullivan County
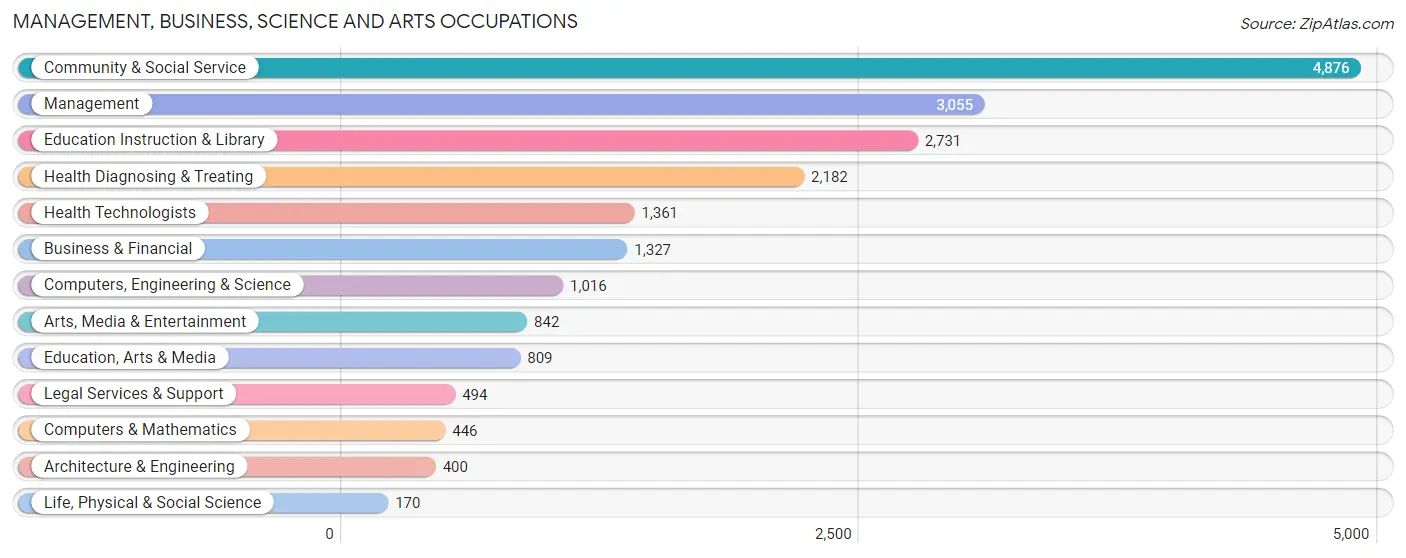
Management, Business, Science and Arts Occupations
The most common Management, Business, Science and Arts occupations in Sullivan County are Community & Social Service (4,876 | 14.1%), Management (3,055 | 8.9%), Education Instruction & Library (2,731 | 7.9%), Health Diagnosing & Treating (2,182 | 6.3%), and Health Technologists (1,361 | 4.0%).
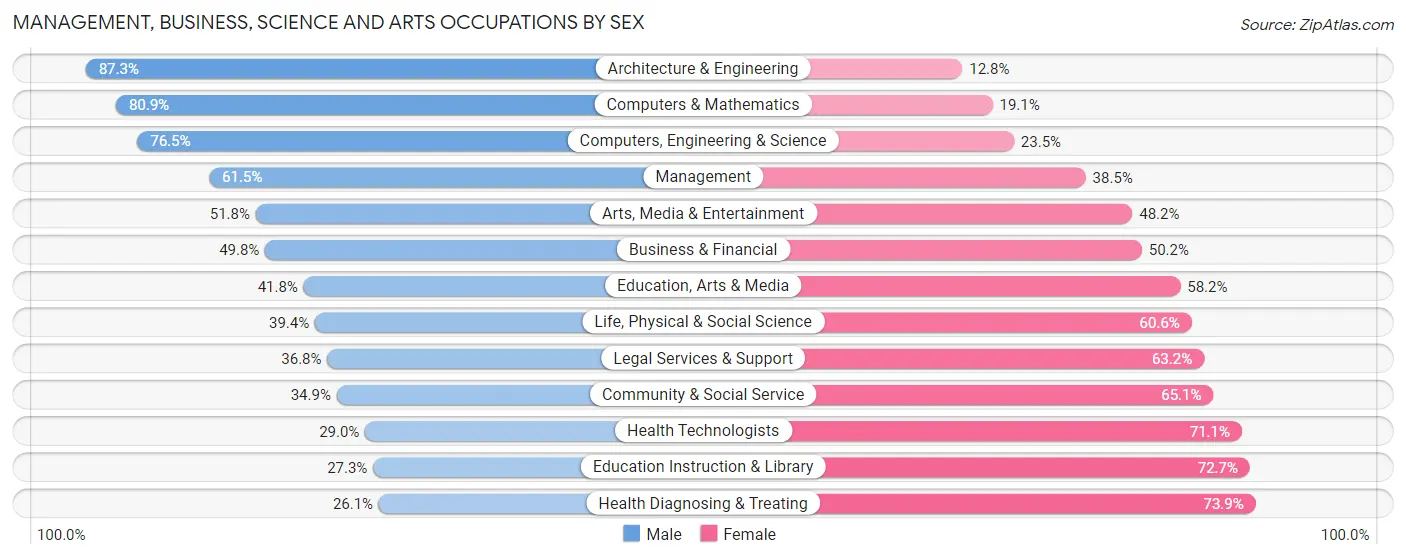
Management, Business, Science and Arts Occupations by Sex
Within the Management, Business, Science and Arts occupations in Sullivan County, the most male-oriented occupations are Architecture & Engineering (87.3%), Computers & Mathematics (80.9%), and Computers, Engineering & Science (76.5%), while the most female-oriented occupations are Health Diagnosing & Treating (73.9%), Education Instruction & Library (72.7%), and Health Technologists (71.1%).
| Occupation | Male | Female |
| Management | 1,879 (61.5%) | 1,176 (38.5%) |
| Business & Financial | 661 (49.8%) | 666 (50.2%) |
| Computers, Engineering & Science | 777 (76.5%) | 239 (23.5%) |
| Computers & Mathematics | 361 (80.9%) | 85 (19.1%) |
| Architecture & Engineering | 349 (87.3%) | 51 (12.8%) |
| Life, Physical & Social Science | 67 (39.4%) | 103 (60.6%) |
| Community & Social Service | 1,701 (34.9%) | 3,175 (65.1%) |
| Education, Arts & Media | 338 (41.8%) | 471 (58.2%) |
| Legal Services & Support | 182 (36.8%) | 312 (63.2%) |
| Education Instruction & Library | 745 (27.3%) | 1,986 (72.7%) |
| Arts, Media & Entertainment | 436 (51.8%) | 406 (48.2%) |
| Health Diagnosing & Treating | 569 (26.1%) | 1,613 (73.9%) |
| Health Technologists | 394 (28.9%) | 967 (71.1%) |
| Total (Category) | 5,587 (44.9%) | 6,869 (55.1%) |
| Total (Overall) | 18,347 (53.2%) | 16,127 (46.8%) |
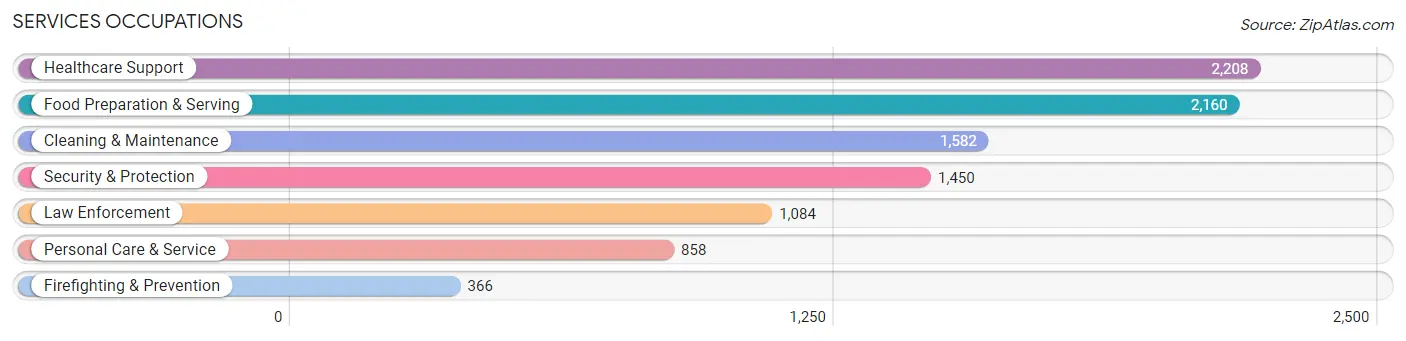
Services Occupations
The most common Services occupations in Sullivan County are Healthcare Support (2,208 | 6.4%), Food Preparation & Serving (2,160 | 6.3%), Cleaning & Maintenance (1,582 | 4.6%), Security & Protection (1,450 | 4.2%), and Law Enforcement (1,084 | 3.1%).
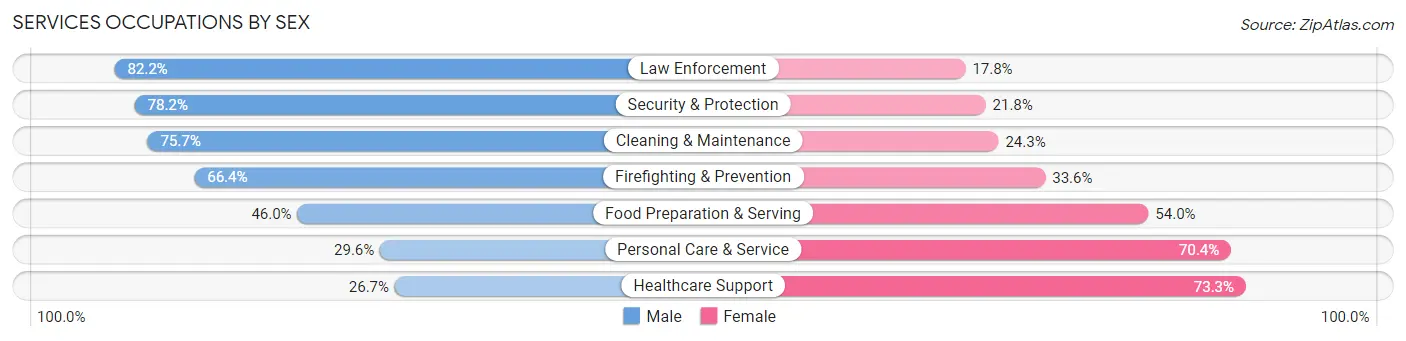
Services Occupations by Sex
Within the Services occupations in Sullivan County, the most male-oriented occupations are Law Enforcement (82.2%), Security & Protection (78.2%), and Cleaning & Maintenance (75.7%), while the most female-oriented occupations are Healthcare Support (73.3%), Personal Care & Service (70.4%), and Food Preparation & Serving (54.0%).
| Occupation | Male | Female |
| Healthcare Support | 589 (26.7%) | 1,619 (73.3%) |
| Security & Protection | 1,134 (78.2%) | 316 (21.8%) |
| Firefighting & Prevention | 243 (66.4%) | 123 (33.6%) |
| Law Enforcement | 891 (82.2%) | 193 (17.8%) |
| Food Preparation & Serving | 993 (46.0%) | 1,167 (54.0%) |
| Cleaning & Maintenance | 1,197 (75.7%) | 385 (24.3%) |
| Personal Care & Service | 254 (29.6%) | 604 (70.4%) |
| Total (Category) | 4,167 (50.5%) | 4,091 (49.5%) |
| Total (Overall) | 18,347 (53.2%) | 16,127 (46.8%) |
Sales and Office Occupations
The most common Sales and Office occupations in Sullivan County are Office & Administration (3,400 | 9.9%), and Sales & Related (2,980 | 8.6%).

Sales and Office Occupations by Sex
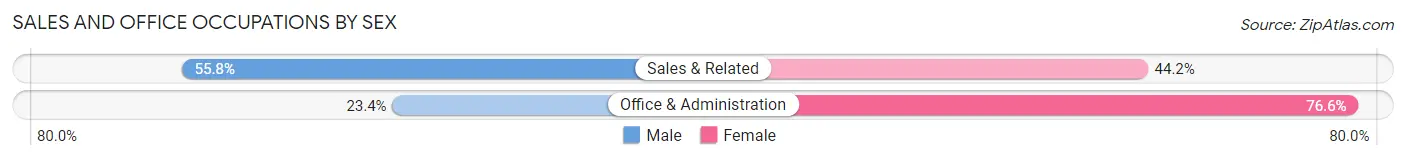
| Occupation | Male | Female |
| Sales & Related | 1,664 (55.8%) | 1,316 (44.2%) |
| Office & Administration | 796 (23.4%) | 2,604 (76.6%) |
| Total (Category) | 2,460 (38.6%) | 3,920 (61.4%) |
| Total (Overall) | 18,347 (53.2%) | 16,127 (46.8%) |
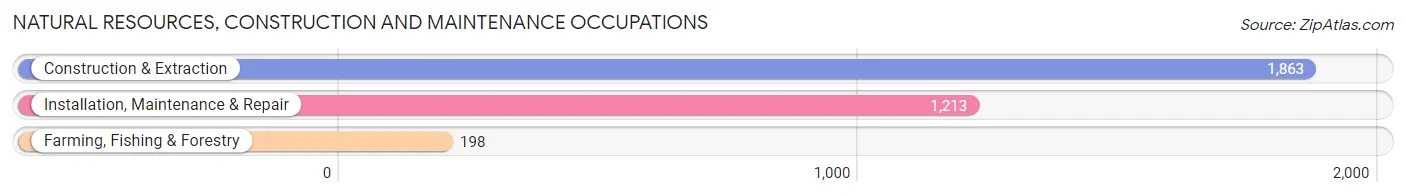
Natural Resources, Construction and Maintenance Occupations
The most common Natural Resources, Construction and Maintenance occupations in Sullivan County are Construction & Extraction (1,863 | 5.4%), Installation, Maintenance & Repair (1,213 | 3.5%), and Farming, Fishing & Forestry (198 | 0.6%).
Natural Resources, Construction and Maintenance Occupations by Sex
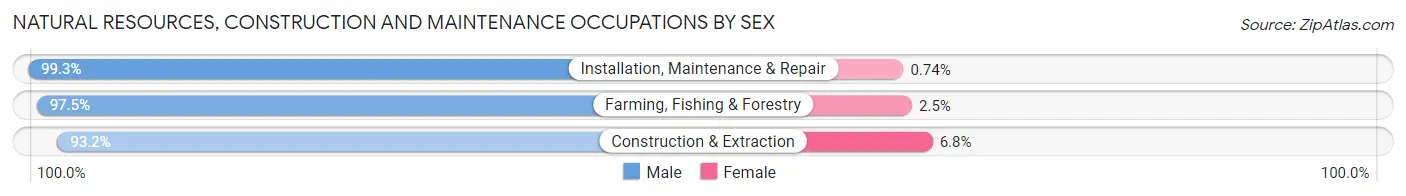
| Occupation | Male | Female |
| Farming, Fishing & Forestry | 193 (97.5%) | 5 (2.5%) |
| Construction & Extraction | 1,736 (93.2%) | 127 (6.8%) |
| Installation, Maintenance & Repair | 1,204 (99.3%) | 9 (0.7%) |
| Total (Category) | 3,133 (95.7%) | 141 (4.3%) |
| Total (Overall) | 18,347 (53.2%) | 16,127 (46.8%) |
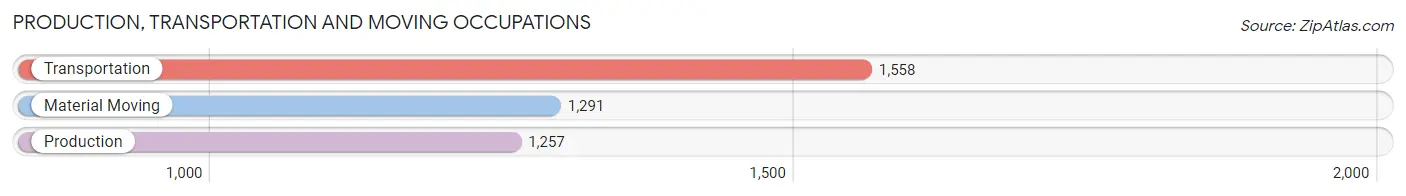
Production, Transportation and Moving Occupations
The most common Production, Transportation and Moving occupations in Sullivan County are Transportation (1,558 | 4.5%), Material Moving (1,291 | 3.7%), and Production (1,257 | 3.6%).
Production, Transportation and Moving Occupations by Sex
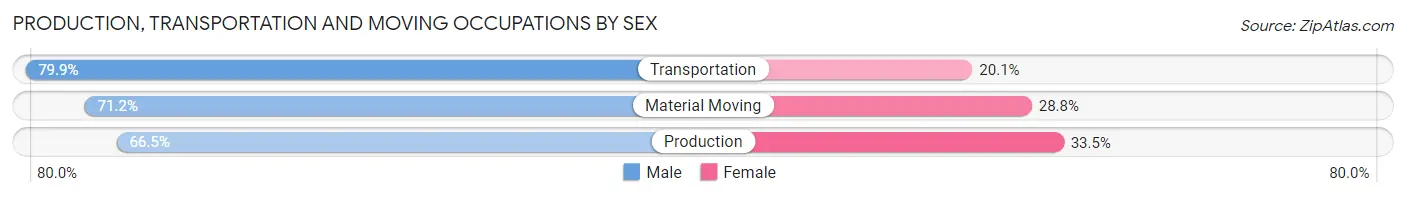
| Occupation | Male | Female |
| Production | 836 (66.5%) | 421 (33.5%) |
| Transportation | 1,245 (79.9%) | 313 (20.1%) |
| Material Moving | 919 (71.2%) | 372 (28.8%) |
| Total (Category) | 3,000 (73.1%) | 1,106 (26.9%) |
| Total (Overall) | 18,347 (53.2%) | 16,127 (46.8%) |
Employment Industries by Sex in Sullivan County
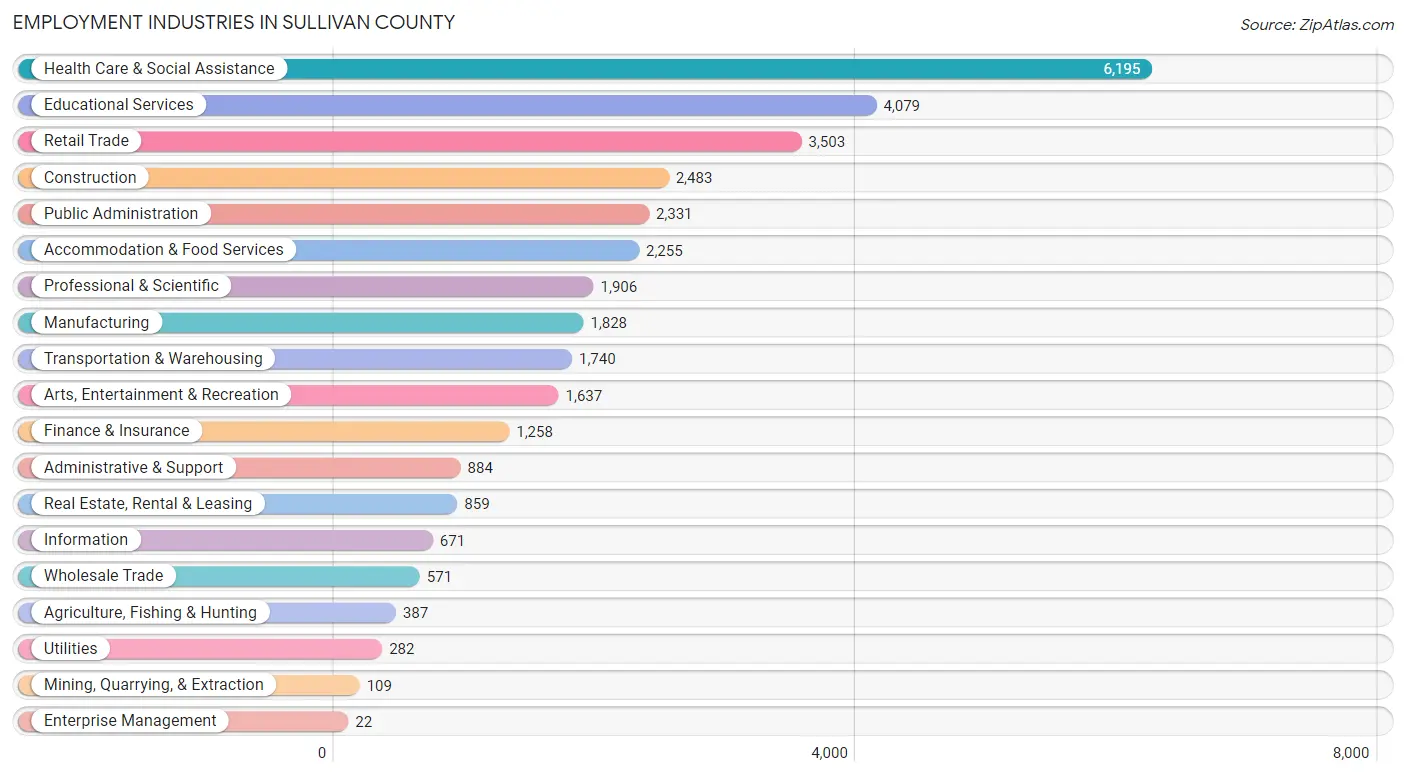
Employment Industries in Sullivan County
The major employment industries in Sullivan County include Health Care & Social Assistance (6,195 | 18.0%), Educational Services (4,079 | 11.8%), Retail Trade (3,503 | 10.2%), Construction (2,483 | 7.2%), and Public Administration (2,331 | 6.8%).
Employment Industries by Sex in Sullivan County
The Sullivan County industries that see more men than women are Mining, Quarrying, & Extraction (100.0%), Construction (92.3%), and Utilities (88.6%), whereas the industries that tend to have a higher number of women are Enterprise Management (100.0%), Health Care & Social Assistance (74.1%), and Educational Services (67.3%).
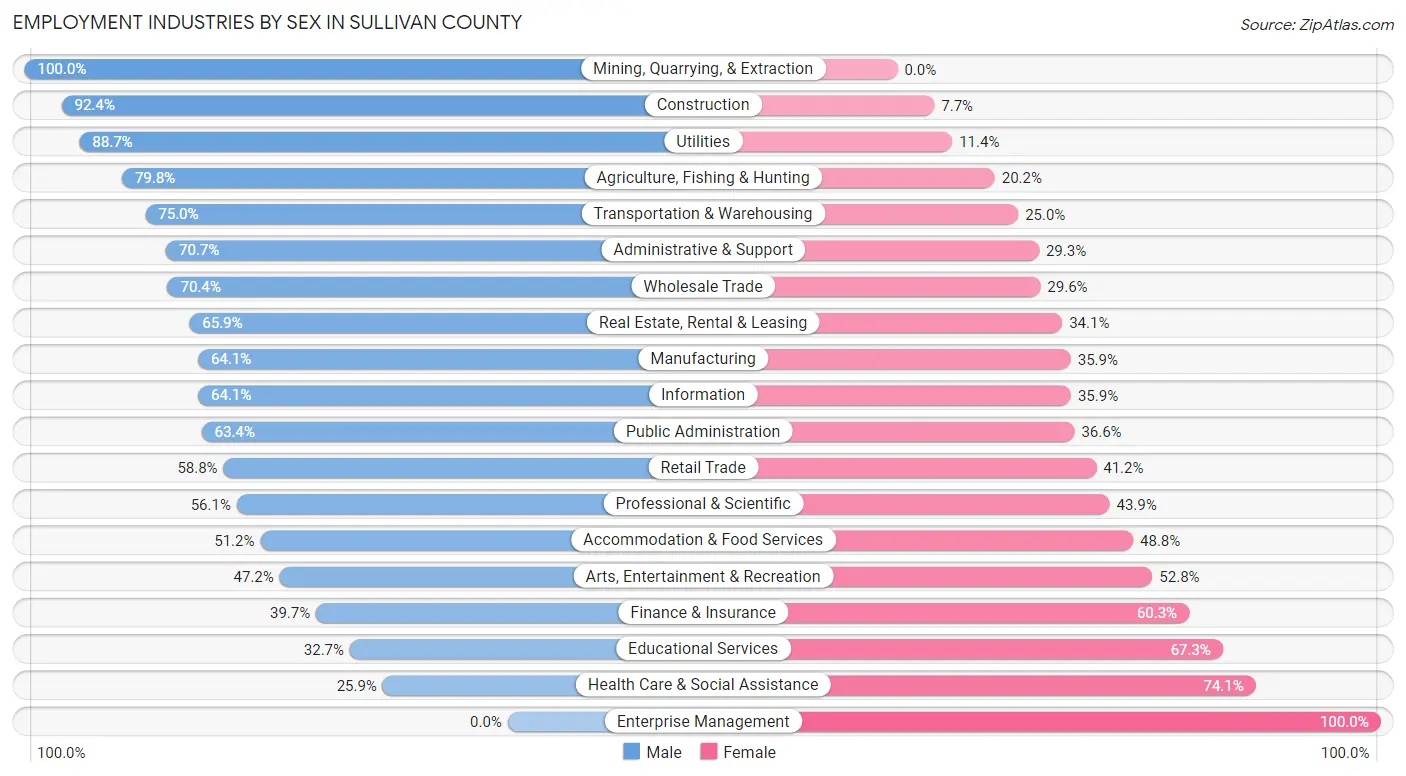
| Industry | Male | Female |
| Agriculture, Fishing & Hunting | 309 (79.8%) | 78 (20.2%) |
| Mining, Quarrying, & Extraction | 109 (100.0%) | 0 (0.0%) |
| Construction | 2,293 (92.3%) | 190 (7.6%) |
| Manufacturing | 1,172 (64.1%) | 656 (35.9%) |
| Wholesale Trade | 402 (70.4%) | 169 (29.6%) |
| Retail Trade | 2,061 (58.8%) | 1,442 (41.2%) |
| Transportation & Warehousing | 1,305 (75.0%) | 435 (25.0%) |
| Utilities | 250 (88.6%) | 32 (11.4%) |
| Information | 430 (64.1%) | 241 (35.9%) |
| Finance & Insurance | 499 (39.7%) | 759 (60.3%) |
| Real Estate, Rental & Leasing | 566 (65.9%) | 293 (34.1%) |
| Professional & Scientific | 1,069 (56.1%) | 837 (43.9%) |
| Enterprise Management | 0 (0.0%) | 22 (100.0%) |
| Administrative & Support | 625 (70.7%) | 259 (29.3%) |
| Educational Services | 1,333 (32.7%) | 2,746 (67.3%) |
| Health Care & Social Assistance | 1,603 (25.9%) | 4,592 (74.1%) |
| Arts, Entertainment & Recreation | 773 (47.2%) | 864 (52.8%) |
| Accommodation & Food Services | 1,155 (51.2%) | 1,100 (48.8%) |
| Public Administration | 1,477 (63.4%) | 854 (36.6%) |
| Total | 18,347 (53.2%) | 16,127 (46.8%) |
Education in Sullivan County
School Enrollment in Sullivan County
The most common levels of schooling among the 15,997 students in Sullivan County are high school (3,765 | 23.5%), middle school (3,676 | 23.0%), and elementary school (3,372 | 21.1%).
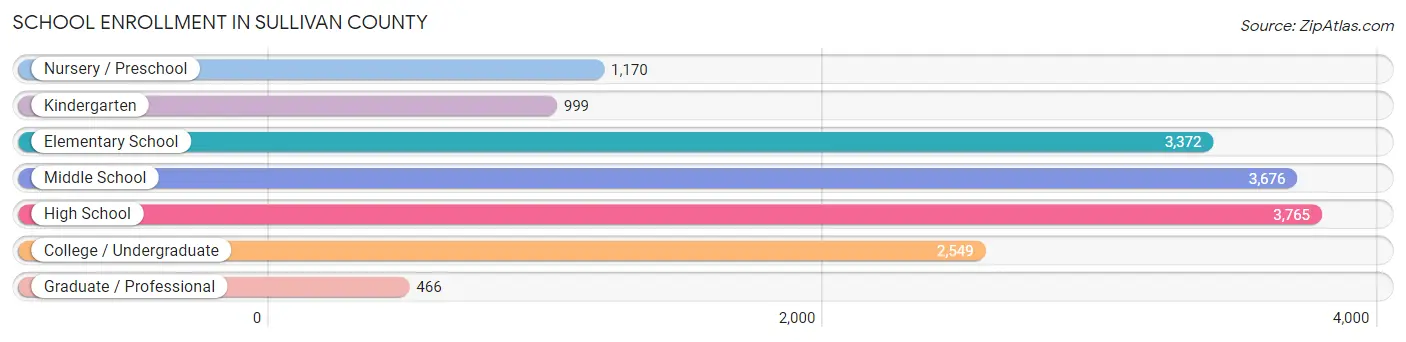
| School Level | # Students | % Students |
| Nursery / Preschool | 1,170 | 7.3% |
| Kindergarten | 999 | 6.2% |
| Elementary School | 3,372 | 21.1% |
| Middle School | 3,676 | 23.0% |
| High School | 3,765 | 23.5% |
| College / Undergraduate | 2,549 | 15.9% |
| Graduate / Professional | 466 | 2.9% |
| Total | 15,997 | 100.0% |
School Enrollment by Age by Funding Source in Sullivan County
Out of a total of 15,997 students who are enrolled in schools in Sullivan County, 3,023 (18.9%) attend a private institution, while the remaining 12,974 (81.1%) are enrolled in public schools. The age group of 3 to 4 year olds has the highest likelihood of being enrolled in private schools, with 382 (38.7% in the age bracket) enrolled. Conversely, the age group of 15 to 17 year olds has the lowest likelihood of being enrolled in a private school, with 2,396 (89.1% in the age bracket) attending a public institution.
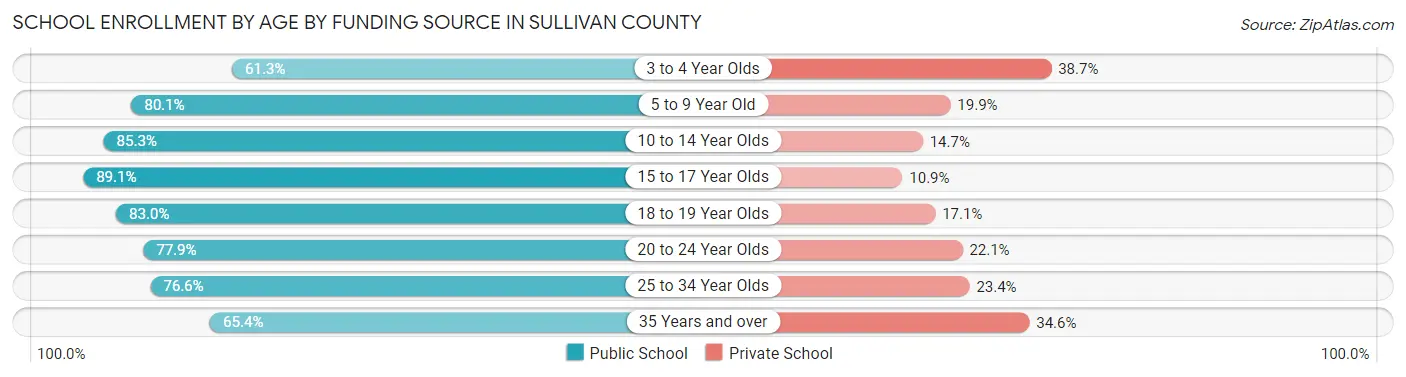
| Age Bracket | Public School | Private School |
| 3 to 4 Year Olds | 606 (61.3%) | 382 (38.7%) |
| 5 to 9 Year Old | 3,409 (80.1%) | 846 (19.9%) |
| 10 to 14 Year Olds | 3,779 (85.3%) | 653 (14.7%) |
| 15 to 17 Year Olds | 2,396 (89.1%) | 294 (10.9%) |
| 18 to 19 Year Olds | 949 (83.0%) | 195 (17.1%) |
| 20 to 24 Year Olds | 1,000 (77.9%) | 284 (22.1%) |
| 25 to 34 Year Olds | 366 (76.6%) | 112 (23.4%) |
| 35 Years and over | 475 (65.4%) | 251 (34.6%) |
| Total | 12,974 (81.1%) | 3,023 (18.9%) |
Educational Attainment by Field of Study in Sullivan County
Education (2,584 | 15.6%), business (1,806 | 10.9%), science & technology (1,552 | 9.4%), visual & performing arts (1,462 | 8.8%), and arts & humanities (1,242 | 7.5%) are the most common fields of study among 16,586 individuals in Sullivan County who have obtained a bachelor's degree or higher.
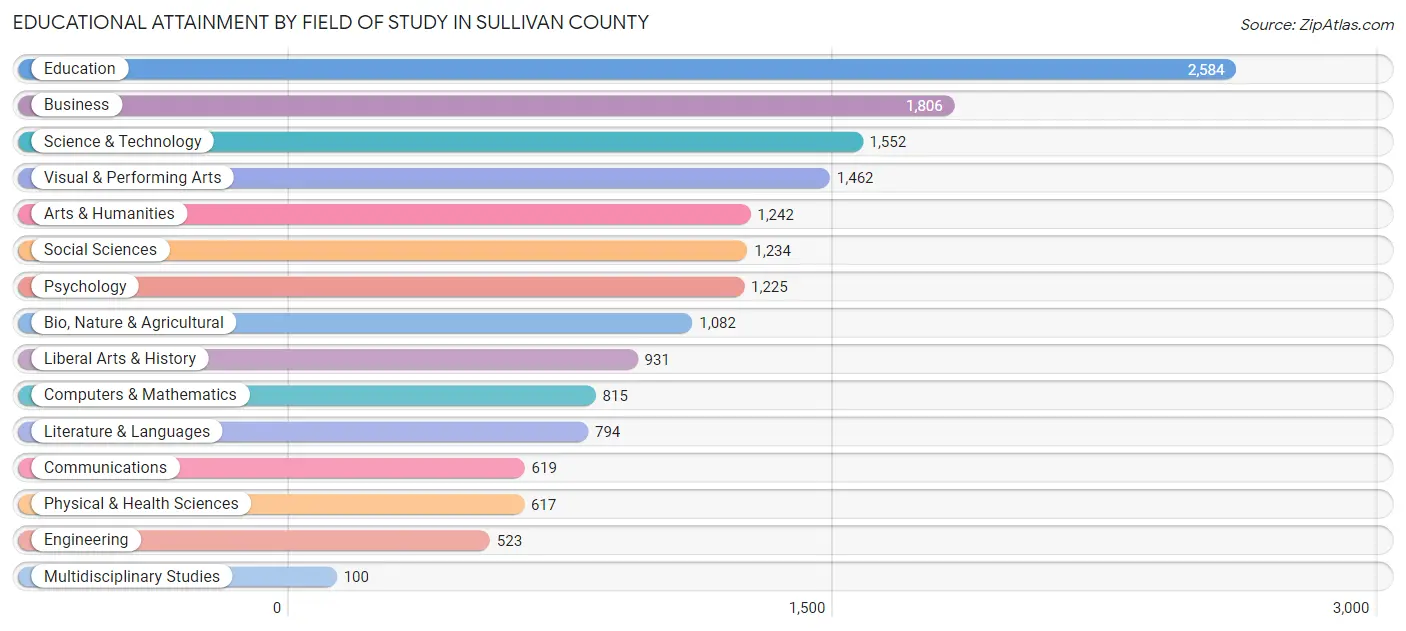
| Field of Study | # Graduates | % Graduates |
| Computers & Mathematics | 815 | 4.9% |
| Bio, Nature & Agricultural | 1,082 | 6.5% |
| Physical & Health Sciences | 617 | 3.7% |
| Psychology | 1,225 | 7.4% |
| Social Sciences | 1,234 | 7.4% |
| Engineering | 523 | 3.2% |
| Multidisciplinary Studies | 100 | 0.6% |
| Science & Technology | 1,552 | 9.4% |
| Business | 1,806 | 10.9% |
| Education | 2,584 | 15.6% |
| Literature & Languages | 794 | 4.8% |
| Liberal Arts & History | 931 | 5.6% |
| Visual & Performing Arts | 1,462 | 8.8% |
| Communications | 619 | 3.7% |
| Arts & Humanities | 1,242 | 7.5% |
| Total | 16,586 | 100.0% |
Transportation & Commute in Sullivan County
Vehicle Availability by Sex in Sullivan County
The most prevalent vehicle ownership categories in Sullivan County are males with 2 vehicles (6,702, accounting for 37.8%) and females with 2 vehicles (5,827, making up 44.1%).
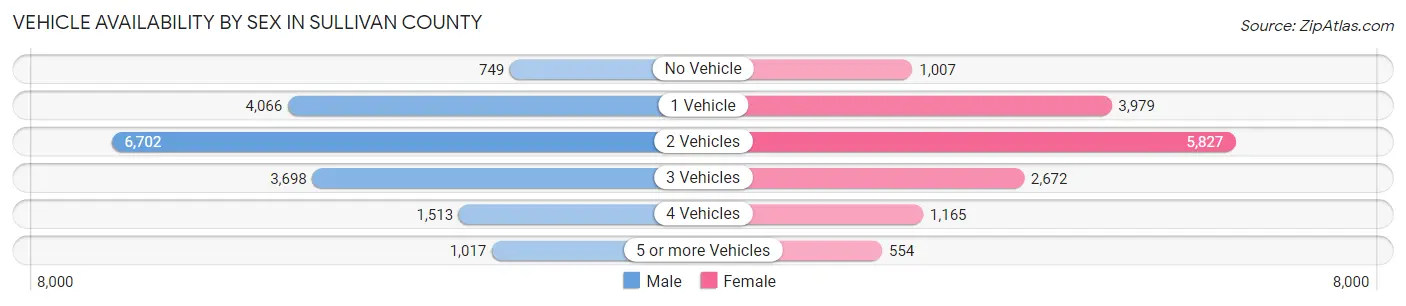
| Vehicles Available | Male | Female |
| No Vehicle | 749 (4.2%) | 1,007 (6.6%) |
| 1 Vehicle | 4,066 (22.9%) | 3,979 (26.2%) |
| 2 Vehicles | 6,702 (37.8%) | 5,827 (38.3%) |
| 3 Vehicles | 3,698 (20.8%) | 2,672 (17.6%) |
| 4 Vehicles | 1,513 (8.5%) | 1,165 (7.7%) |
| 5 or more Vehicles | 1,017 (5.7%) | 554 (3.6%) |
| Total | 17,745 (100.0%) | 15,204 (100.0%) |
Commute Time in Sullivan County
The most frequently occuring commute durations in Sullivan County are 15 to 19 minutes (4,679 commuters, 15.6%), 10 to 14 minutes (4,553 commuters, 15.2%), and 20 to 24 minutes (4,333 commuters, 14.4%).
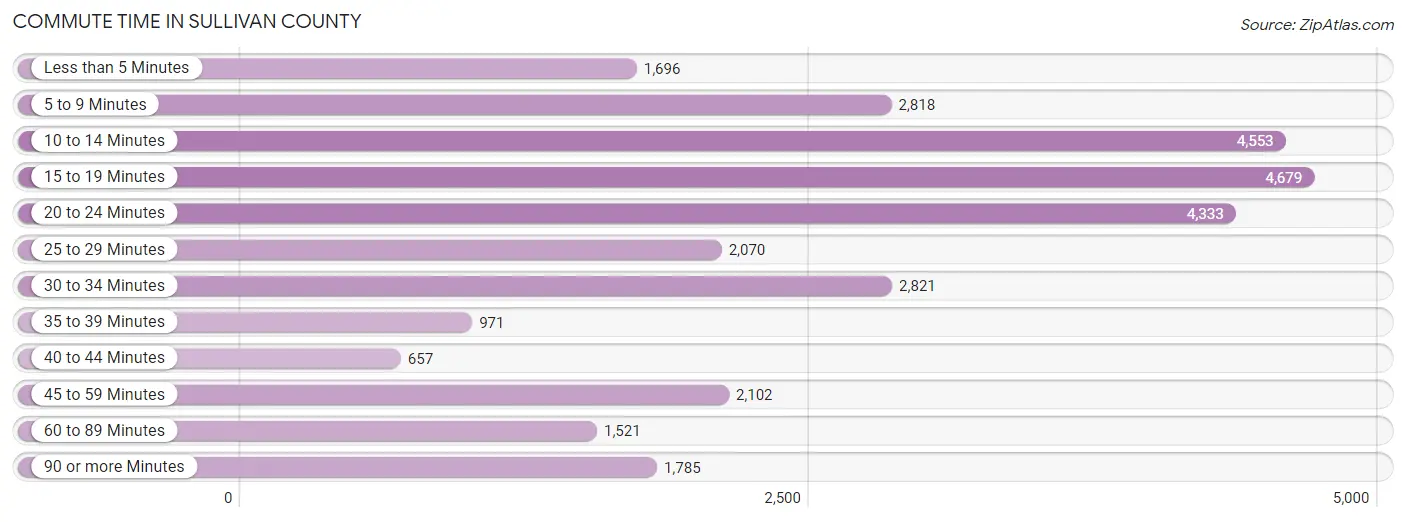
| Commute Time | # Commuters | % Commuters |
| Less than 5 Minutes | 1,696 | 5.7% |
| 5 to 9 Minutes | 2,818 | 9.4% |
| 10 to 14 Minutes | 4,553 | 15.2% |
| 15 to 19 Minutes | 4,679 | 15.6% |
| 20 to 24 Minutes | 4,333 | 14.4% |
| 25 to 29 Minutes | 2,070 | 6.9% |
| 30 to 34 Minutes | 2,821 | 9.4% |
| 35 to 39 Minutes | 971 | 3.2% |
| 40 to 44 Minutes | 657 | 2.2% |
| 45 to 59 Minutes | 2,102 | 7.0% |
| 60 to 89 Minutes | 1,521 | 5.1% |
| 90 or more Minutes | 1,785 | 5.9% |
Commute Time by Sex in Sullivan County
The most common commute times in Sullivan County are 15 to 19 minutes (2,321 commuters, 14.4%) for males and 10 to 14 minutes (2,384 commuters, 17.2%) for females.
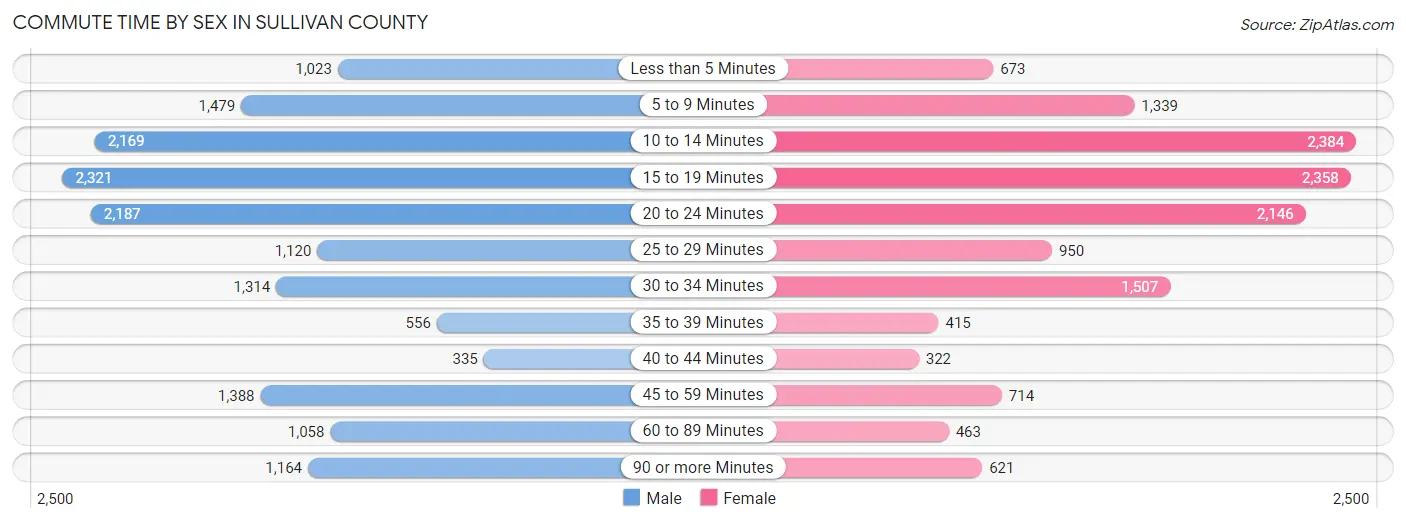
| Commute Time | Male | Female |
| Less than 5 Minutes | 1,023 (6.4%) | 673 (4.8%) |
| 5 to 9 Minutes | 1,479 (9.2%) | 1,339 (9.6%) |
| 10 to 14 Minutes | 2,169 (13.5%) | 2,384 (17.2%) |
| 15 to 19 Minutes | 2,321 (14.4%) | 2,358 (17.0%) |
| 20 to 24 Minutes | 2,187 (13.6%) | 2,146 (15.4%) |
| 25 to 29 Minutes | 1,120 (7.0%) | 950 (6.8%) |
| 30 to 34 Minutes | 1,314 (8.2%) | 1,507 (10.8%) |
| 35 to 39 Minutes | 556 (3.5%) | 415 (3.0%) |
| 40 to 44 Minutes | 335 (2.1%) | 322 (2.3%) |
| 45 to 59 Minutes | 1,388 (8.6%) | 714 (5.1%) |
| 60 to 89 Minutes | 1,058 (6.6%) | 463 (3.3%) |
| 90 or more Minutes | 1,164 (7.2%) | 621 (4.5%) |
Time of Departure to Work by Sex in Sullivan County
The most frequent times of departure to work in Sullivan County are 12:00 PM to 3:59 PM (1,839, 11.4%) for males and 7:30 AM to 7:59 AM (2,031, 14.6%) for females.
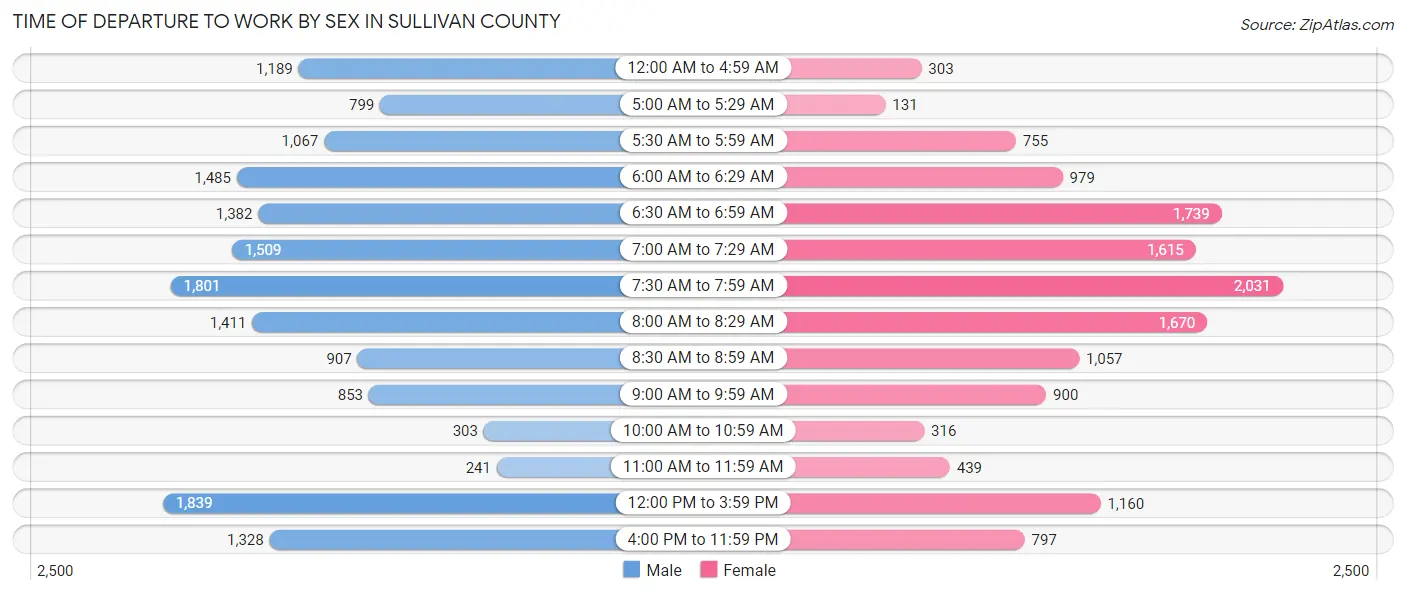
| Time of Departure | Male | Female |
| 12:00 AM to 4:59 AM | 1,189 (7.4%) | 303 (2.2%) |
| 5:00 AM to 5:29 AM | 799 (5.0%) | 131 (0.9%) |
| 5:30 AM to 5:59 AM | 1,067 (6.6%) | 755 (5.4%) |
| 6:00 AM to 6:29 AM | 1,485 (9.2%) | 979 (7.0%) |
| 6:30 AM to 6:59 AM | 1,382 (8.6%) | 1,739 (12.5%) |
| 7:00 AM to 7:29 AM | 1,509 (9.4%) | 1,615 (11.6%) |
| 7:30 AM to 7:59 AM | 1,801 (11.2%) | 2,031 (14.6%) |
| 8:00 AM to 8:29 AM | 1,411 (8.8%) | 1,670 (12.0%) |
| 8:30 AM to 8:59 AM | 907 (5.6%) | 1,057 (7.6%) |
| 9:00 AM to 9:59 AM | 853 (5.3%) | 900 (6.5%) |
| 10:00 AM to 10:59 AM | 303 (1.9%) | 316 (2.3%) |
| 11:00 AM to 11:59 AM | 241 (1.5%) | 439 (3.2%) |
| 12:00 PM to 3:59 PM | 1,839 (11.4%) | 1,160 (8.4%) |
| 4:00 PM to 11:59 PM | 1,328 (8.2%) | 797 (5.7%) |
| Total | 16,114 (100.0%) | 13,892 (100.0%) |
Housing Occupancy in Sullivan County
Occupancy by Ownership in Sullivan County
Of the total 29,895 dwellings in Sullivan County, owner-occupied units account for 20,660 (69.1%), while renter-occupied units make up 9,235 (30.9%).
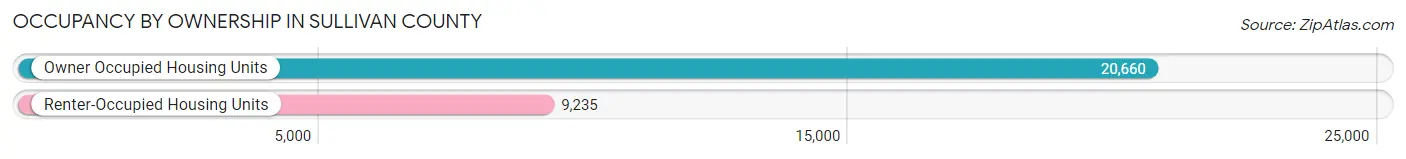
| Occupancy | # Housing Units | % Housing Units |
| Owner Occupied Housing Units | 20,660 | 69.1% |
| Renter-Occupied Housing Units | 9,235 | 30.9% |
| Total Occupied Housing Units | 29,895 | 100.0% |
Occupancy by Household Size in Sullivan County
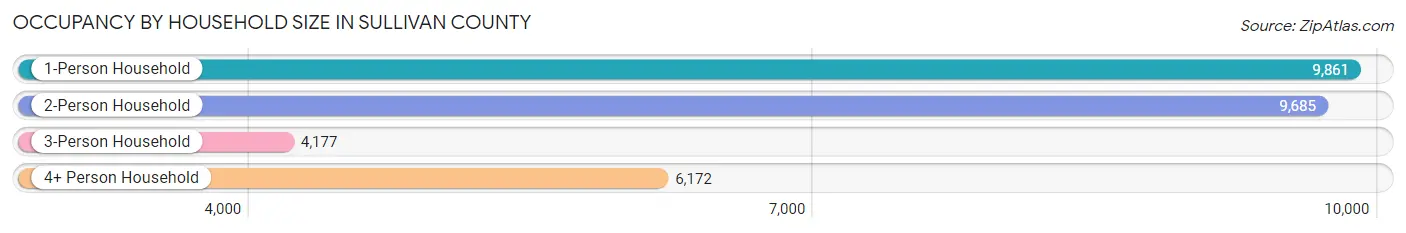
| Household Size | # Housing Units | % Housing Units |
| 1-Person Household | 9,861 | 33.0% |
| 2-Person Household | 9,685 | 32.4% |
| 3-Person Household | 4,177 | 14.0% |
| 4+ Person Household | 6,172 | 20.6% |
| Total Housing Units | 29,895 | 100.0% |
Occupancy by Ownership by Household Size in Sullivan County
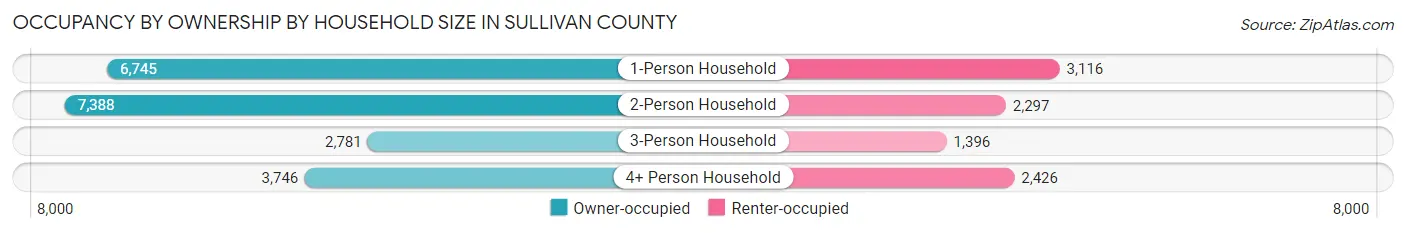
| Household Size | Owner-occupied | Renter-occupied |
| 1-Person Household | 6,745 (68.4%) | 3,116 (31.6%) |
| 2-Person Household | 7,388 (76.3%) | 2,297 (23.7%) |
| 3-Person Household | 2,781 (66.6%) | 1,396 (33.4%) |
| 4+ Person Household | 3,746 (60.7%) | 2,426 (39.3%) |
| Total Housing Units | 20,660 (69.1%) | 9,235 (30.9%) |
Occupancy by Educational Attainment in Sullivan County
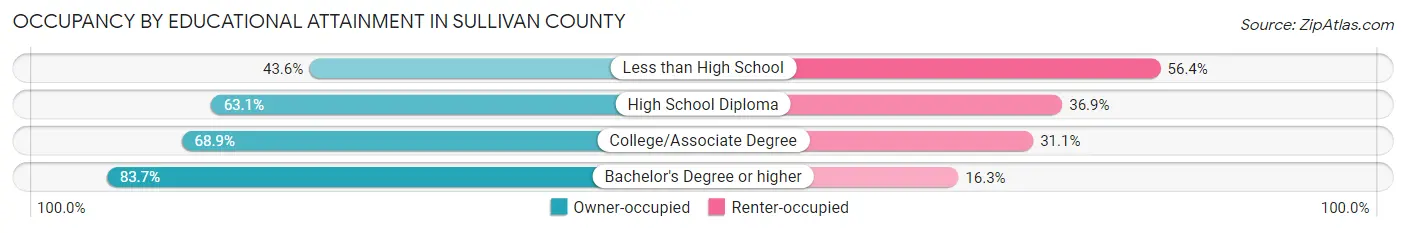
| Household Size | Owner-occupied | Renter-occupied |
| Less than High School | 1,333 (43.6%) | 1,724 (56.4%) |
| High School Diploma | 5,222 (63.1%) | 3,055 (36.9%) |
| College/Associate Degree | 6,642 (68.9%) | 3,003 (31.1%) |
| Bachelor's Degree or higher | 7,463 (83.7%) | 1,453 (16.3%) |
Occupancy by Age of Householder in Sullivan County
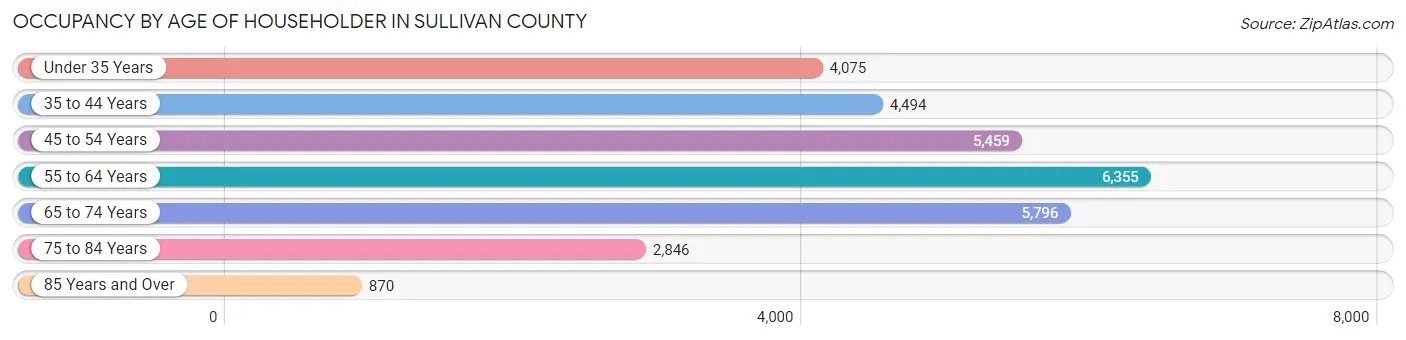
| Age Bracket | # Households | % Households |
| Under 35 Years | 4,075 | 13.6% |
| 35 to 44 Years | 4,494 | 15.0% |
| 45 to 54 Years | 5,459 | 18.3% |
| 55 to 64 Years | 6,355 | 21.3% |
| 65 to 74 Years | 5,796 | 19.4% |
| 75 to 84 Years | 2,846 | 9.5% |
| 85 Years and Over | 870 | 2.9% |
| Total | 29,895 | 100.0% |
Housing Finances in Sullivan County
Median Income by Occupancy in Sullivan County
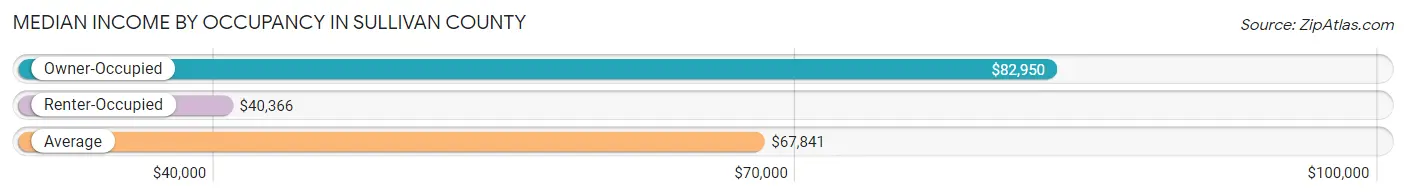
| Occupancy Type | # Households | Median Income |
| Owner-Occupied | 20,660 (69.1%) | $82,950 |
| Renter-Occupied | 9,235 (30.9%) | $40,366 |
| Average | 29,895 (100.0%) | $67,841 |
Occupancy by Householder Income Bracket in Sullivan County
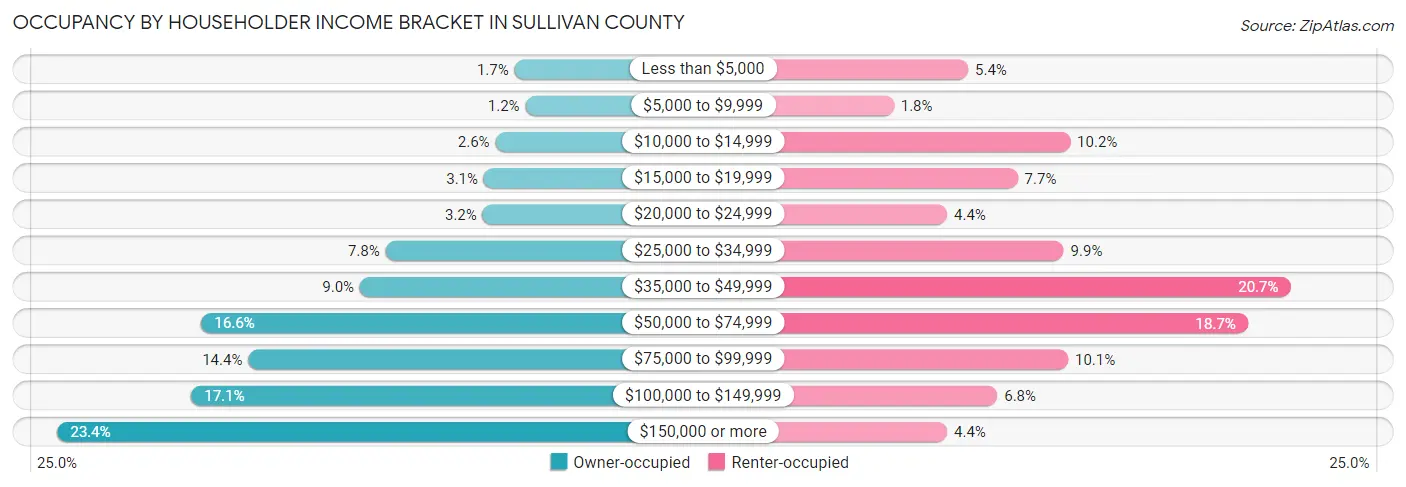
| Income Bracket | Owner-occupied | Renter-occupied |
| Less than $5,000 | 346 (1.7%) | 495 (5.4%) |
| $5,000 to $9,999 | 238 (1.1%) | 168 (1.8%) |
| $10,000 to $14,999 | 533 (2.6%) | 944 (10.2%) |
| $15,000 to $19,999 | 647 (3.1%) | 713 (7.7%) |
| $20,000 to $24,999 | 660 (3.2%) | 403 (4.4%) |
| $25,000 to $34,999 | 1,613 (7.8%) | 915 (9.9%) |
| $35,000 to $49,999 | 1,865 (9.0%) | 1,912 (20.7%) |
| $50,000 to $74,999 | 3,426 (16.6%) | 1,724 (18.7%) |
| $75,000 to $99,999 | 2,964 (14.3%) | 935 (10.1%) |
| $100,000 to $149,999 | 3,525 (17.1%) | 623 (6.8%) |
| $150,000 or more | 4,843 (23.4%) | 403 (4.4%) |
| Total | 20,660 (100.0%) | 9,235 (100.0%) |
Monthly Housing Cost Tiers in Sullivan County
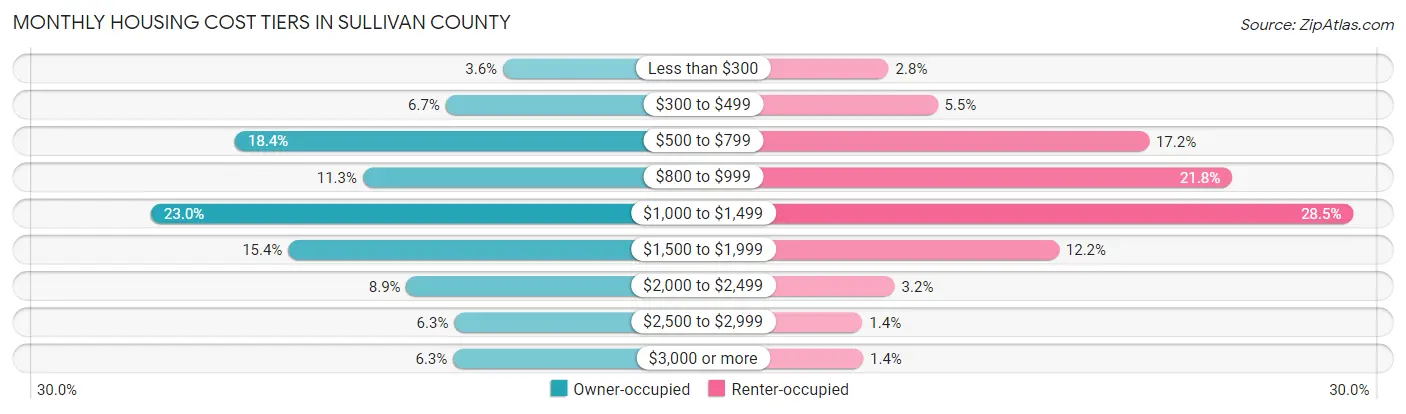
| Monthly Cost | Owner-occupied | Renter-occupied |
| Less than $300 | 740 (3.6%) | 261 (2.8%) |
| $300 to $499 | 1,393 (6.7%) | 511 (5.5%) |
| $500 to $799 | 3,798 (18.4%) | 1,589 (17.2%) |
| $800 to $999 | 2,339 (11.3%) | 2,013 (21.8%) |
| $1,000 to $1,499 | 4,756 (23.0%) | 2,631 (28.5%) |
| $1,500 to $1,999 | 3,190 (15.4%) | 1,129 (12.2%) |
| $2,000 to $2,499 | 1,841 (8.9%) | 292 (3.2%) |
| $2,500 to $2,999 | 1,295 (6.3%) | 127 (1.4%) |
| $3,000 or more | 1,308 (6.3%) | 131 (1.4%) |
| Total | 20,660 (100.0%) | 9,235 (100.0%) |
Physical Housing Characteristics in Sullivan County
Housing Structures in Sullivan County
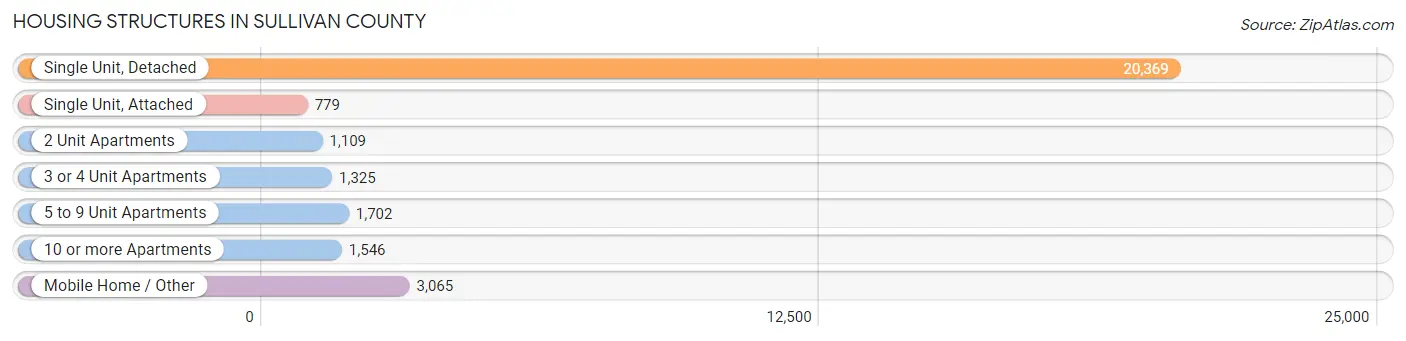
| Structure Type | # Housing Units | % Housing Units |
| Single Unit, Detached | 20,369 | 68.1% |
| Single Unit, Attached | 779 | 2.6% |
| 2 Unit Apartments | 1,109 | 3.7% |
| 3 or 4 Unit Apartments | 1,325 | 4.4% |
| 5 to 9 Unit Apartments | 1,702 | 5.7% |
| 10 or more Apartments | 1,546 | 5.2% |
| Mobile Home / Other | 3,065 | 10.2% |
| Total | 29,895 | 100.0% |
Housing Structures by Occupancy in Sullivan County
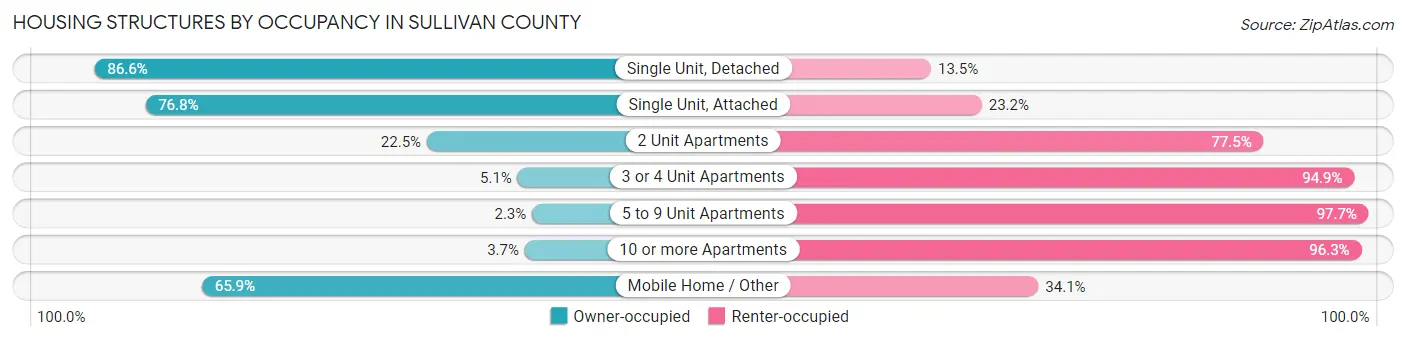
| Structure Type | Owner-occupied | Renter-occupied |
| Single Unit, Detached | 17,630 (86.6%) | 2,739 (13.5%) |
| Single Unit, Attached | 598 (76.8%) | 181 (23.2%) |
| 2 Unit Apartments | 250 (22.5%) | 859 (77.5%) |
| 3 or 4 Unit Apartments | 67 (5.1%) | 1,258 (94.9%) |
| 5 to 9 Unit Apartments | 39 (2.3%) | 1,663 (97.7%) |
| 10 or more Apartments | 57 (3.7%) | 1,489 (96.3%) |
| Mobile Home / Other | 2,019 (65.9%) | 1,046 (34.1%) |
| Total | 20,660 (69.1%) | 9,235 (30.9%) |
Housing Structures by Number of Rooms in Sullivan County
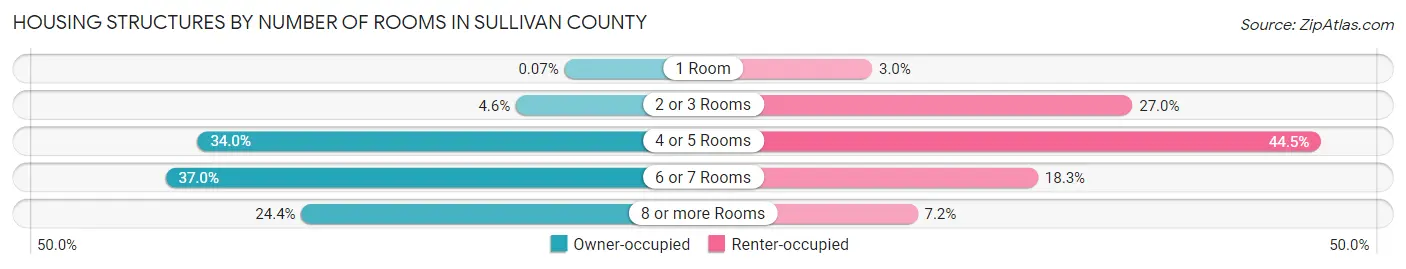
| Number of Rooms | Owner-occupied | Renter-occupied |
| 1 Room | 14 (0.1%) | 274 (3.0%) |
| 2 or 3 Rooms | 941 (4.5%) | 2,497 (27.0%) |
| 4 or 5 Rooms | 7,027 (34.0%) | 4,110 (44.5%) |
| 6 or 7 Rooms | 7,636 (37.0%) | 1,691 (18.3%) |
| 8 or more Rooms | 5,042 (24.4%) | 663 (7.2%) |
| Total | 20,660 (100.0%) | 9,235 (100.0%) |
Housing Structure by Heating Type in Sullivan County
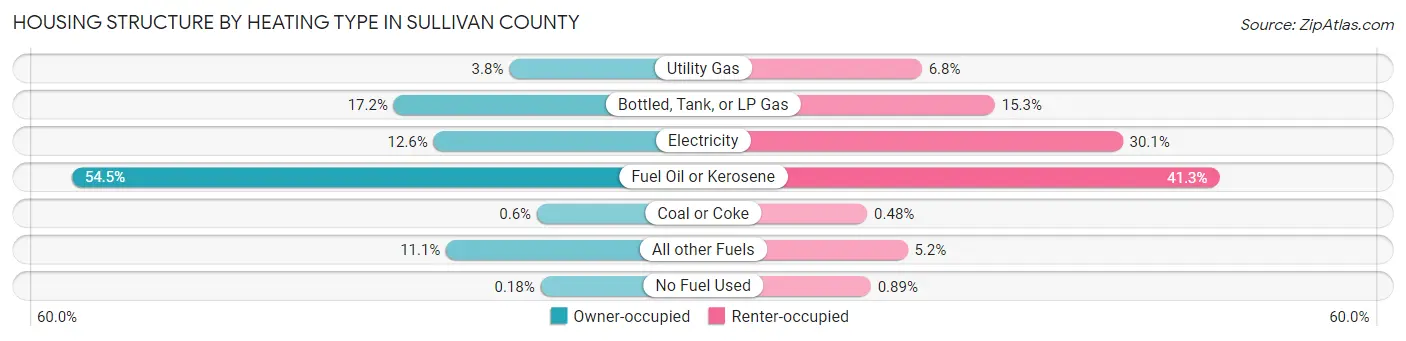
| Heating Type | Owner-occupied | Renter-occupied |
| Utility Gas | 787 (3.8%) | 628 (6.8%) |
| Bottled, Tank, or LP Gas | 3,553 (17.2%) | 1,411 (15.3%) |
| Electricity | 2,599 (12.6%) | 2,779 (30.1%) |
| Fuel Oil or Kerosene | 11,264 (54.5%) | 3,815 (41.3%) |
| Coal or Coke | 123 (0.6%) | 44 (0.5%) |
| All other Fuels | 2,297 (11.1%) | 476 (5.1%) |
| No Fuel Used | 37 (0.2%) | 82 (0.9%) |
| Total | 20,660 (100.0%) | 9,235 (100.0%) |
Household Vehicle Usage in Sullivan County
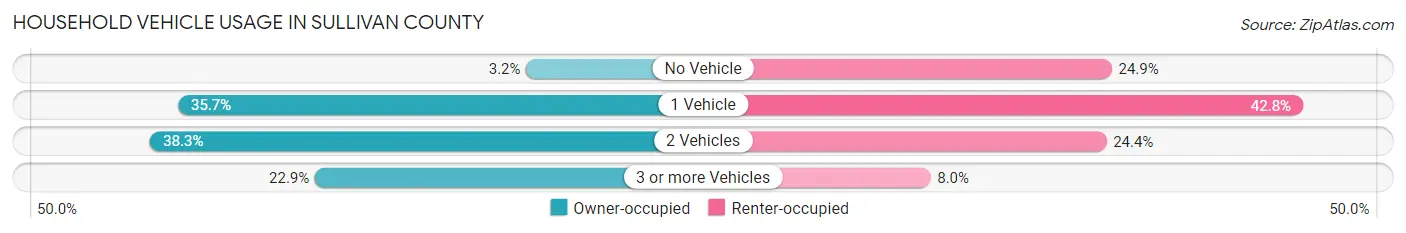
| Vehicles per Household | Owner-occupied | Renter-occupied |
| No Vehicle | 652 (3.2%) | 2,299 (24.9%) |
| 1 Vehicle | 7,374 (35.7%) | 3,948 (42.7%) |
| 2 Vehicles | 7,908 (38.3%) | 2,252 (24.4%) |
| 3 or more Vehicles | 4,726 (22.9%) | 736 (8.0%) |
| Total | 20,660 (100.0%) | 9,235 (100.0%) |
Real Estate & Mortgages in Sullivan County
Real Estate and Mortgage Overview in Sullivan County
| Characteristic | Without Mortgage | With Mortgage |
| Housing Units | 10,582 | 10,078 |
| Median Property Value | $209,800 | $230,100 |
| Median Household Income | $64,967 | $3,055 |
| Monthly Housing Costs | $782 | $1,243 |
| Real Estate Taxes | $4,488 | $263 |
Property Value by Mortgage Status in Sullivan County
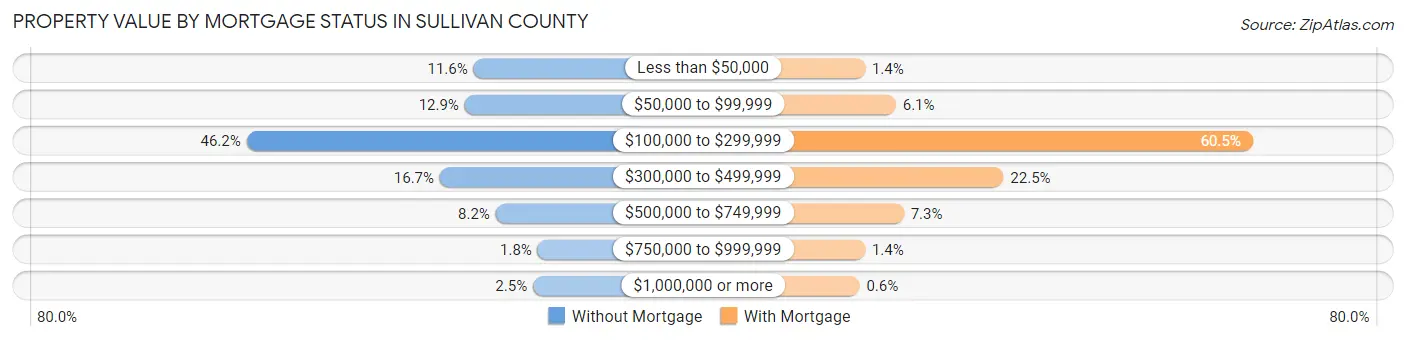
| Property Value | Without Mortgage | With Mortgage |
| Less than $50,000 | 1,226 (11.6%) | 145 (1.4%) |
| $50,000 to $99,999 | 1,369 (12.9%) | 618 (6.1%) |
| $100,000 to $299,999 | 4,887 (46.2%) | 6,099 (60.5%) |
| $300,000 to $499,999 | 1,769 (16.7%) | 2,271 (22.5%) |
| $500,000 to $749,999 | 870 (8.2%) | 740 (7.3%) |
| $750,000 to $999,999 | 193 (1.8%) | 145 (1.4%) |
| $1,000,000 or more | 268 (2.5%) | 60 (0.6%) |
| Total | 10,582 (100.0%) | 10,078 (100.0%) |
Household Income by Mortgage Status in Sullivan County
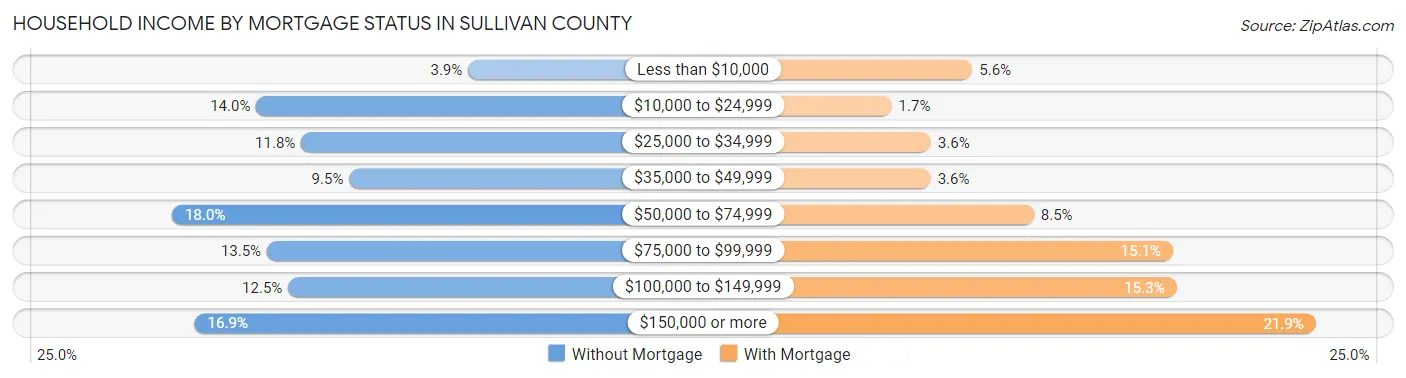
| Household Income | Without Mortgage | With Mortgage |
| Less than $10,000 | 411 (3.9%) | 560 (5.6%) |
| $10,000 to $24,999 | 1,478 (14.0%) | 173 (1.7%) |
| $25,000 to $34,999 | 1,252 (11.8%) | 362 (3.6%) |
| $35,000 to $49,999 | 1,009 (9.5%) | 361 (3.6%) |
| $50,000 to $74,999 | 1,903 (18.0%) | 856 (8.5%) |
| $75,000 to $99,999 | 1,424 (13.5%) | 1,523 (15.1%) |
| $100,000 to $149,999 | 1,317 (12.4%) | 1,540 (15.3%) |
| $150,000 or more | 1,788 (16.9%) | 2,208 (21.9%) |
| Total | 10,582 (100.0%) | 10,078 (100.0%) |
Property Value to Household Income Ratio in Sullivan County
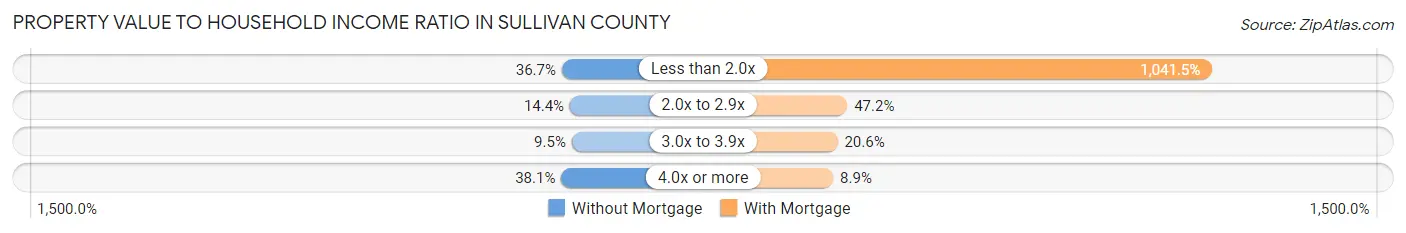
| Value-to-Income Ratio | Without Mortgage | With Mortgage |
| Less than 2.0x | 3,882 (36.7%) | 104,962 (1,041.5%) |
| 2.0x to 2.9x | 1,521 (14.4%) | 4,756 (47.2%) |
| 3.0x to 3.9x | 1,004 (9.5%) | 2,072 (20.6%) |
| 4.0x or more | 4,036 (38.1%) | 894 (8.9%) |
| Total | 10,582 (100.0%) | 10,078 (100.0%) |
Real Estate Taxes by Mortgage Status in Sullivan County
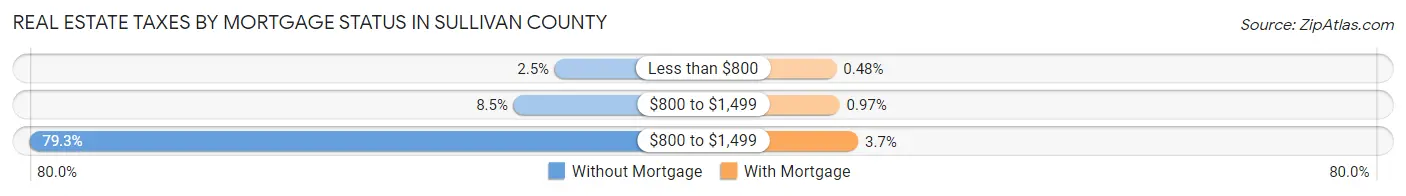
| Property Taxes | Without Mortgage | With Mortgage |
| Less than $800 | 266 (2.5%) | 48 (0.5%) |
| $800 to $1,499 | 902 (8.5%) | 98 (1.0%) |
| $800 to $1,499 | 8,393 (79.3%) | 369 (3.7%) |
| Total | 10,582 (100.0%) | 10,078 (100.0%) |
Health & Disability in Sullivan County
Health Insurance Coverage by Age in Sullivan County
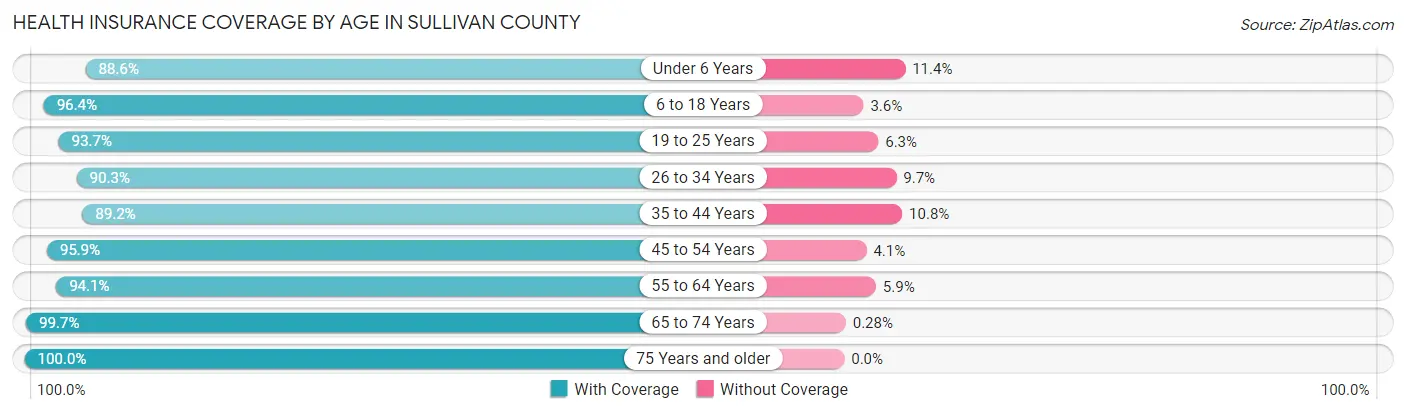
| Age Bracket | With Coverage | Without Coverage |
| Under 6 Years | 5,105 (88.6%) | 654 (11.4%) |
| 6 to 18 Years | 11,399 (96.4%) | 422 (3.6%) |
| 19 to 25 Years | 5,609 (93.7%) | 380 (6.3%) |
| 26 to 34 Years | 7,631 (90.3%) | 821 (9.7%) |
| 35 to 44 Years | 7,740 (89.2%) | 936 (10.8%) |
| 45 to 54 Years | 9,295 (95.9%) | 401 (4.1%) |
| 55 to 64 Years | 10,437 (94.1%) | 654 (5.9%) |
| 65 to 74 Years | 8,945 (99.7%) | 25 (0.3%) |
| 75 Years and older | 5,593 (100.0%) | 0 (0.0%) |
| Total | 71,754 (94.4%) | 4,293 (5.7%) |
Health Insurance Coverage by Citizenship Status in Sullivan County
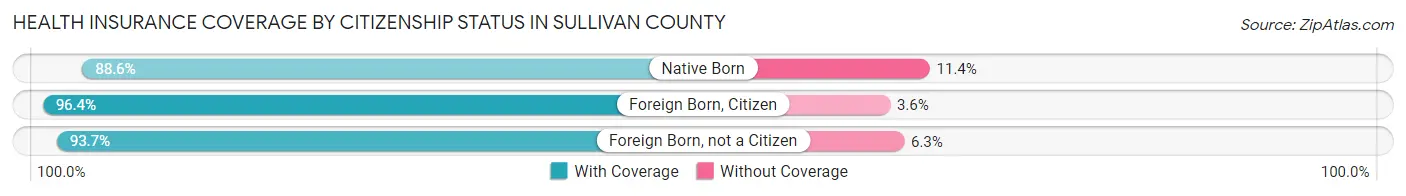
| Citizenship Status | With Coverage | Without Coverage |
| Native Born | 5,105 (88.6%) | 654 (11.4%) |
| Foreign Born, Citizen | 11,399 (96.4%) | 422 (3.6%) |
| Foreign Born, not a Citizen | 5,609 (93.7%) | 380 (6.3%) |
Health Insurance Coverage by Household Income in Sullivan County
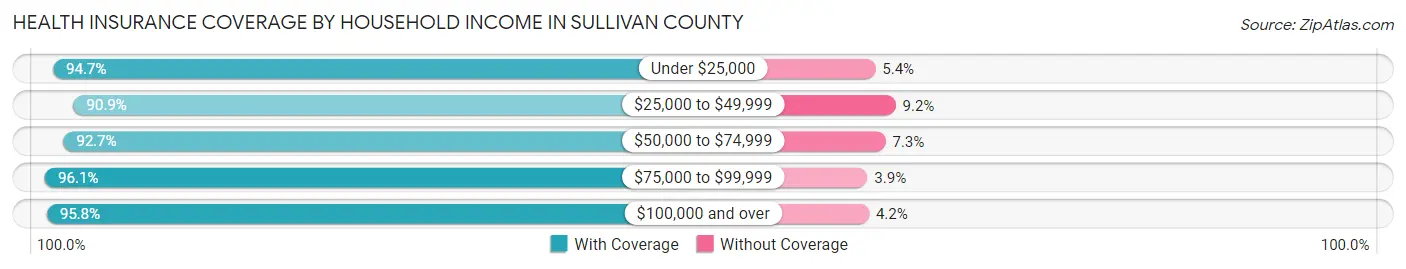
| Household Income | With Coverage | Without Coverage |
| Under $25,000 | 8,577 (94.7%) | 485 (5.3%) |
| $25,000 to $49,999 | 12,071 (90.8%) | 1,216 (9.1%) |
| $50,000 to $74,999 | 11,868 (92.7%) | 929 (7.3%) |
| $75,000 to $99,999 | 9,851 (96.1%) | 396 (3.9%) |
| $100,000 and over | 27,378 (95.8%) | 1,187 (4.2%) |
Public vs Private Health Insurance Coverage by Age in Sullivan County
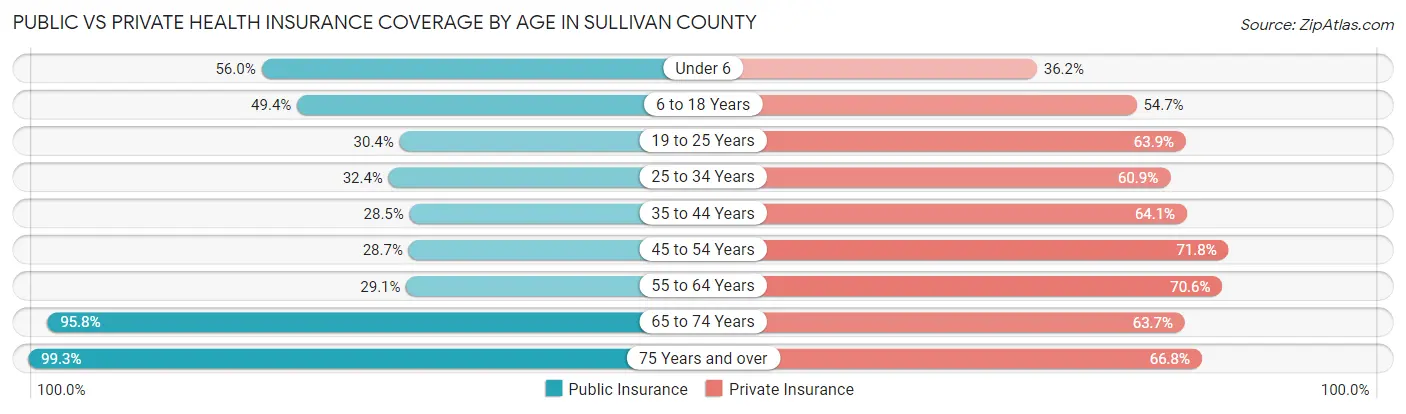
| Age Bracket | Public Insurance | Private Insurance |
| Under 6 | 3,227 (56.0%) | 2,085 (36.2%) |
| 6 to 18 Years | 5,841 (49.4%) | 6,465 (54.7%) |
| 19 to 25 Years | 1,820 (30.4%) | 3,825 (63.9%) |
| 25 to 34 Years | 2,740 (32.4%) | 5,149 (60.9%) |
| 35 to 44 Years | 2,476 (28.5%) | 5,558 (64.1%) |
| 45 to 54 Years | 2,783 (28.7%) | 6,959 (71.8%) |
| 55 to 64 Years | 3,232 (29.1%) | 7,833 (70.6%) |
| 65 to 74 Years | 8,592 (95.8%) | 5,710 (63.7%) |
| 75 Years and over | 5,556 (99.3%) | 3,737 (66.8%) |
| Total | 36,267 (47.7%) | 47,321 (62.2%) |
Disability Status by Sex by Age in Sullivan County
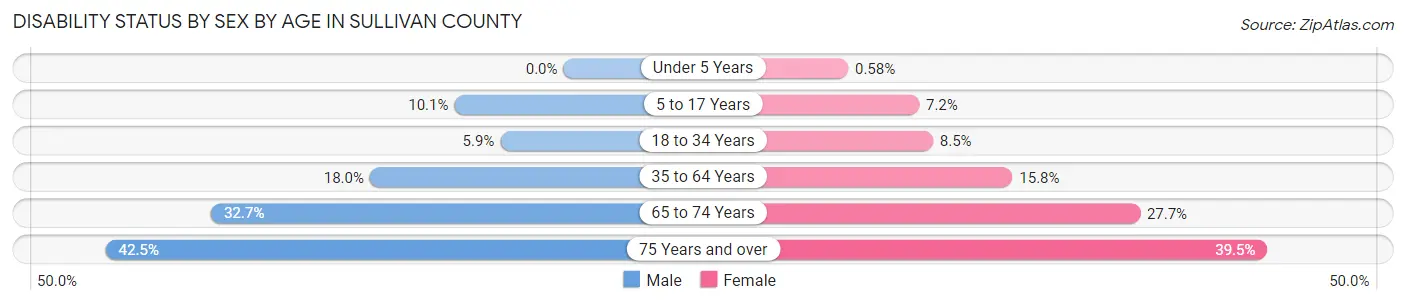
| Age Bracket | Male | Female |
| Under 5 Years | 0 (0.0%) | 13 (0.6%) |
| 5 to 17 Years | 622 (10.1%) | 417 (7.2%) |
| 18 to 34 Years | 476 (5.9%) | 629 (8.5%) |
| 35 to 64 Years | 2,657 (18.0%) | 2,321 (15.8%) |
| 65 to 74 Years | 1,469 (32.7%) | 1,239 (27.7%) |
| 75 Years and over | 1,099 (42.5%) | 1,187 (39.5%) |
Disability Class by Sex by Age in Sullivan County
Disability Class: Hearing Difficulty
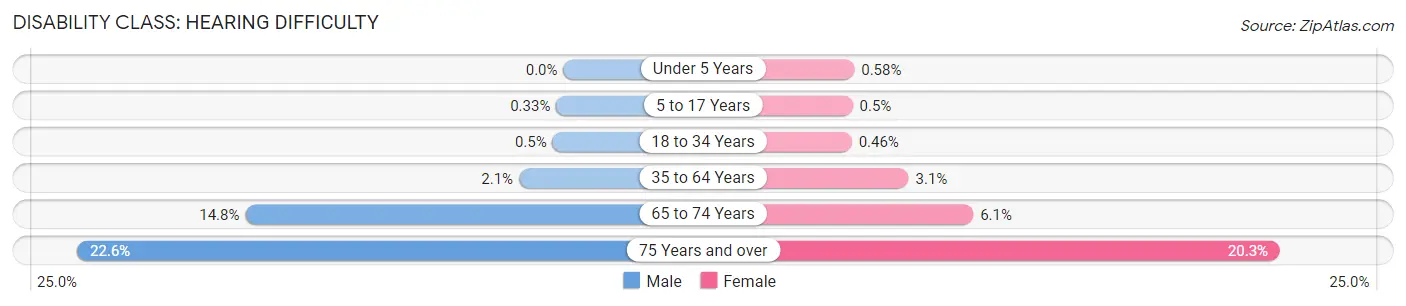
| Age Bracket | Male | Female |
| Under 5 Years | 0 (0.0%) | 13 (0.6%) |
| 5 to 17 Years | 20 (0.3%) | 29 (0.5%) |
| 18 to 34 Years | 41 (0.5%) | 34 (0.5%) |
| 35 to 64 Years | 305 (2.1%) | 455 (3.1%) |
| 65 to 74 Years | 663 (14.8%) | 273 (6.1%) |
| 75 Years and over | 584 (22.6%) | 611 (20.3%) |
Disability Class: Vision Difficulty
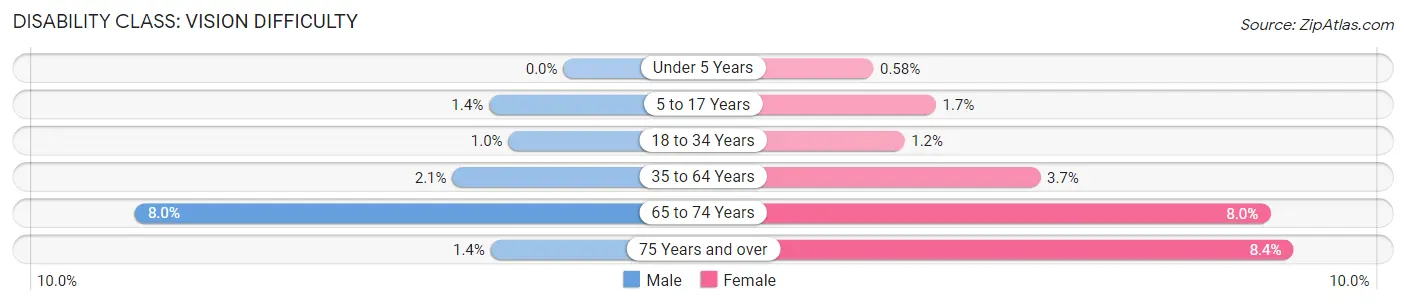
| Age Bracket | Male | Female |
| Under 5 Years | 0 (0.0%) | 13 (0.6%) |
| 5 to 17 Years | 85 (1.4%) | 101 (1.7%) |
| 18 to 34 Years | 83 (1.0%) | 86 (1.2%) |
| 35 to 64 Years | 305 (2.1%) | 539 (3.7%) |
| 65 to 74 Years | 357 (8.0%) | 356 (8.0%) |
| 75 Years and over | 35 (1.3%) | 252 (8.4%) |
Disability Class: Cognitive Difficulty
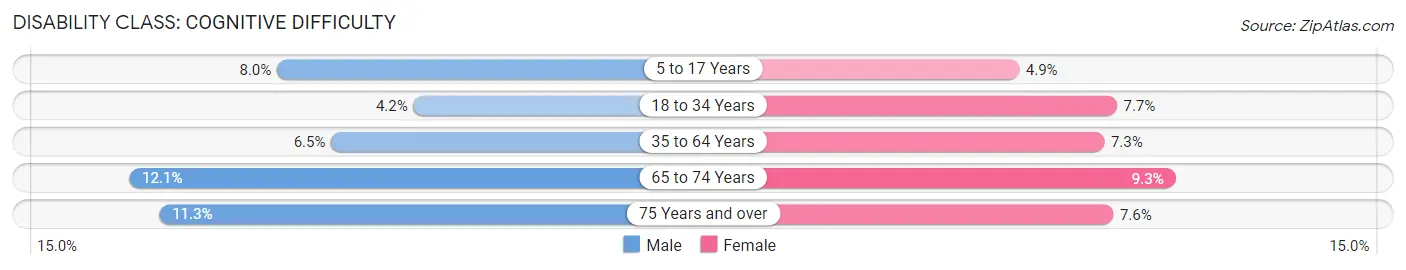
| Age Bracket | Male | Female |
| 5 to 17 Years | 490 (8.0%) | 287 (4.9%) |
| 18 to 34 Years | 339 (4.2%) | 569 (7.6%) |
| 35 to 64 Years | 956 (6.5%) | 1,070 (7.3%) |
| 65 to 74 Years | 543 (12.1%) | 416 (9.3%) |
| 75 Years and over | 291 (11.3%) | 227 (7.5%) |
Disability Class: Ambulatory Difficulty
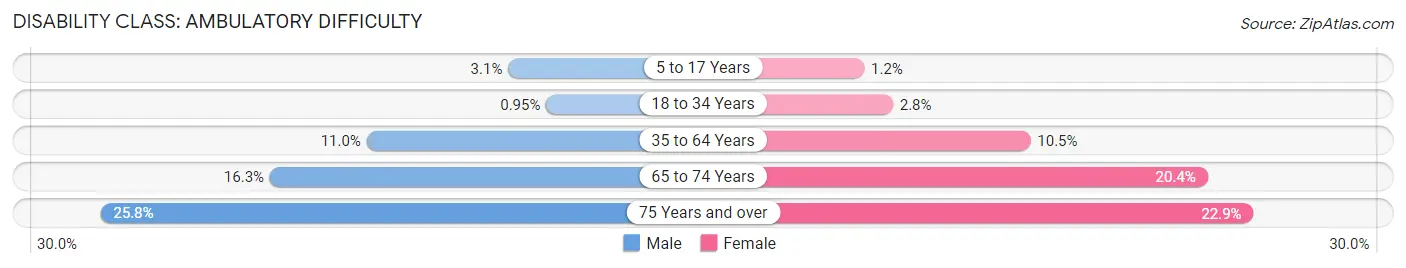
| Age Bracket | Male | Female |
| 5 to 17 Years | 189 (3.1%) | 72 (1.2%) |
| 18 to 34 Years | 77 (0.9%) | 211 (2.8%) |
| 35 to 64 Years | 1,620 (11.0%) | 1,540 (10.5%) |
| 65 to 74 Years | 734 (16.3%) | 912 (20.4%) |
| 75 Years and over | 667 (25.8%) | 689 (22.9%) |
Disability Class: Self-Care Difficulty
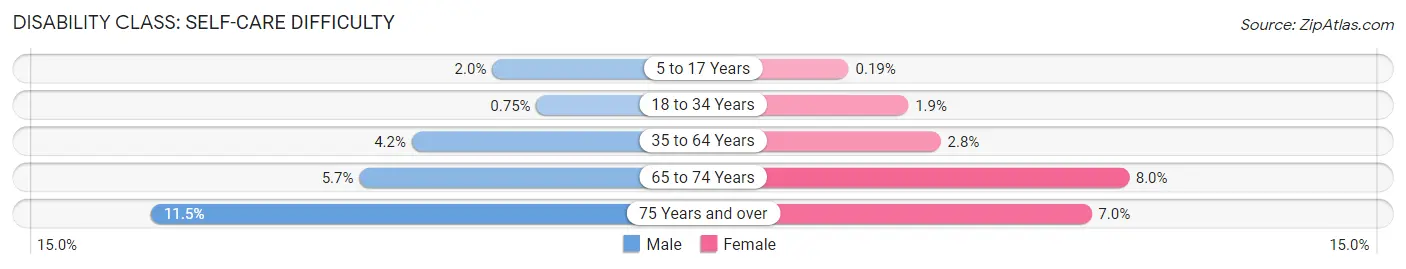
| Age Bracket | Male | Female |
| 5 to 17 Years | 122 (2.0%) | 11 (0.2%) |
| 18 to 34 Years | 61 (0.7%) | 138 (1.8%) |
| 35 to 64 Years | 624 (4.2%) | 404 (2.8%) |
| 65 to 74 Years | 255 (5.7%) | 358 (8.0%) |
| 75 Years and over | 297 (11.5%) | 209 (7.0%) |
Technology Access in Sullivan County
Computing Device Access in Sullivan County
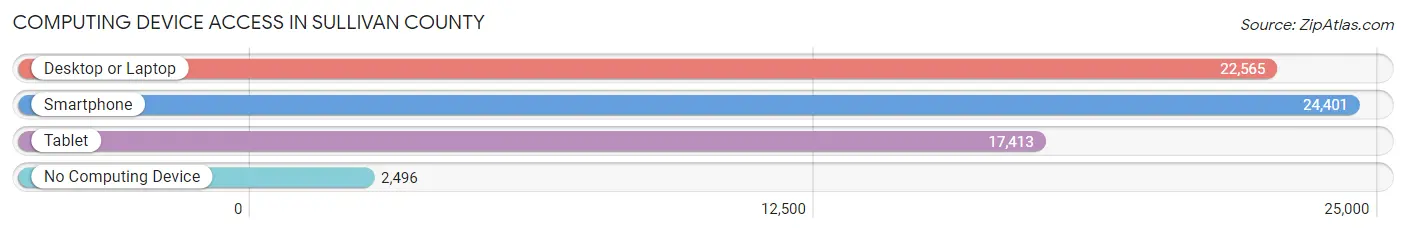
| Device Type | # Households | % Households |
| Desktop or Laptop | 22,565 | 75.5% |
| Smartphone | 24,401 | 81.6% |
| Tablet | 17,413 | 58.3% |
| No Computing Device | 2,496 | 8.4% |
| Total | 29,895 | 100.0% |
Internet Access in Sullivan County
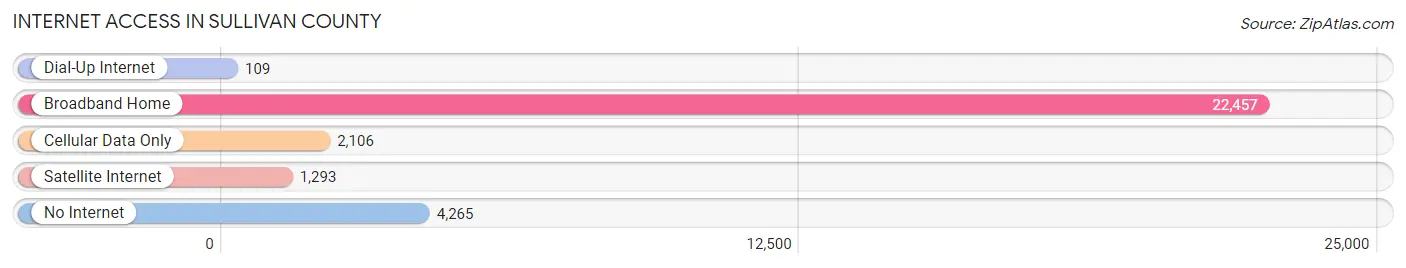
| Internet Type | # Households | % Households |
| Dial-Up Internet | 109 | 0.4% |
| Broadband Home | 22,457 | 75.1% |
| Cellular Data Only | 2,106 | 7.0% |
| Satellite Internet | 1,293 | 4.3% |
| No Internet | 4,265 | 14.3% |
| Total | 29,895 | 100.0% |
Sullivan County Summary
Sullivan County is a county located in the southeastern part of the U.S. state of New York. As of the 2010 census, the population was 77,547. The county seat is Monticello. The county is named after Major General John Sullivan, who was a hero in the American Revolutionary War.
History
The area that is now Sullivan County was first settled by Europeans in the late 17th century. The first settlers were Dutch, who established a trading post in the area in 1690. The area was part of Ulster County until 1809, when it became part of Sullivan County.
The county was named after Major General John Sullivan, who was a hero in the American Revolutionary War. He led a campaign against the Iroquois in 1779, which resulted in the destruction of their villages and crops.
Geography
Sullivan County is located in the southeastern part of New York State. It is bordered by Ulster County to the north, Orange County to the east, Delaware County to the south, and Sullivan County to the west. The county has a total area of 945 square miles, of which 930 square miles is land and 15 square miles is water.
The highest point in the county is Slide Mountain, which has an elevation of 4,180 feet. The county also contains the Catskill Mountains, which are part of the Appalachian Mountains.
Economy
The economy of Sullivan County is largely based on tourism. The county is home to several ski resorts, including Belleayre Mountain and Holiday Mountain. The county also has several state parks, including Minnewaska State Park and the Catskill State Park.
The county is also home to several wineries, including the Bethel Woods Center for the Arts and the Catskill Distilling Company.
Demographics
As of the 2010 census, the population of Sullivan County was 77,547. The racial makeup of the county was 87.3% White, 8.2% Black or African American, 0.4% Native American, 0.7% Asian, 0.1% Pacific Islander, 1.3% from other races, and 2.0% from two or more races. Hispanic or Latino of any race were 5.3% of the population.
The median income for a household in the county was $45,945, and the median income for a family was $54,836. The per capita income for the county was $25,845. About 11.2% of families and 15.2% of the population were below the poverty line, including 22.2% of those under age 18 and 8.2% of those age 65 or over.
Common Questions
What is Per Capita Income in Sullivan County?
Per Capita income in Sullivan County is $37,854.
What is the Median Family Income in Sullivan County?
Median Family Income in Sullivan County is $82,555.
What is the Median Household income in Sullivan County?
Median Household Income in Sullivan County is $67,841.
What is Income or Wage Gap in Sullivan County?
Income or Wage Gap in Sullivan County is 24.3%.
Women in Sullivan County earn 75.7 cents for every dollar earned by a man.
What is Family Income Deficit in Sullivan County?
Family Income Deficit in Sullivan County is $11,234.
Families that are below poverty line in Sullivan County earn $11,234 less on average than the poverty threshold level.
What is Inequality or Gini Index in Sullivan County?
Inequality or Gini Index in Sullivan County is 0.49.
What is the Total Population of Sullivan County?
Total Population of Sullivan County is 78,725.
What is the Total Male Population of Sullivan County?
Total Male Population of Sullivan County is 40,863.
What is the Total Female Population of Sullivan County?
Total Female Population of Sullivan County is 37,862.
What is the Ratio of Males per 100 Females in Sullivan County?
There are 107.93 Males per 100 Females in Sullivan County.
What is the Ratio of Females per 100 Males in Sullivan County?
There are 92.66 Females per 100 Males in Sullivan County.
What is the Median Population Age in Sullivan County?
Median Population Age in Sullivan County is 41.9 Years.
What is the Average Family Size in Sullivan County
Average Family Size in Sullivan County is 3.2 People.
What is the Average Household Size in Sullivan County
Average Household Size in Sullivan County is 2.5 People.
How Large is the Labor Force in Sullivan County?
There are 37,171 People in the Labor Forcein in Sullivan County.
What is the Percentage of People in the Labor Force in Sullivan County?
58.1% of People are in the Labor Force in Sullivan County.
What is the Unemployment Rate in Sullivan County?
Unemployment Rate in Sullivan County is 7.2%.