Steuben County, NY Map & Demographics
Steuben County Map
Steuben County Overview
$35,282
PER CAPITA INCOME
$81,682
AVG FAMILY INCOME
$62,506
AVG HOUSEHOLD INCOME
29.5%
WAGE / INCOME GAP [ % ]
70.5¢/ $1
WAGE / INCOME GAP [ $ ]
$10,224
FAMILY INCOME DEFICIT
0.45
INEQUALITY / GINI INDEX
93,584
TOTAL POPULATION
46,984
MALE POPULATION
46,600
FEMALE POPULATION
100.82
MALES / 100 FEMALES
99.18
FEMALES / 100 MALES
42.8
MEDIAN AGE
2.9
AVG FAMILY SIZE
2.4
AVG HOUSEHOLD SIZE
44,987
LABOR FORCE [ PEOPLE ]
59.3%
PERCENT IN LABOR FORCE
6.3%
UNEMPLOYMENT RATE
Income in Steuben County
Income Overview in Steuben County
Per Capita Income in Steuben County is $35,282, while median incomes of families and households are $81,682 and $62,506 respectively.
| Characteristic | Number | Measure |
| Per Capita Income | 93,584 | $35,282 |
| Median Family Income | 24,711 | $81,682 |
| Mean Family Income | 24,711 | $100,893 |
| Median Household Income | 39,165 | $62,506 |
| Mean Household Income | 39,165 | $82,673 |
| Income Deficit | 24,711 | $10,224 |
| Wage / Income Gap (%) | 93,584 | 29.51% |
| Wage / Income Gap ($) | 93,584 | 70.49¢ per $1 |
| Gini / Inequality Index | 93,584 | 0.45 |
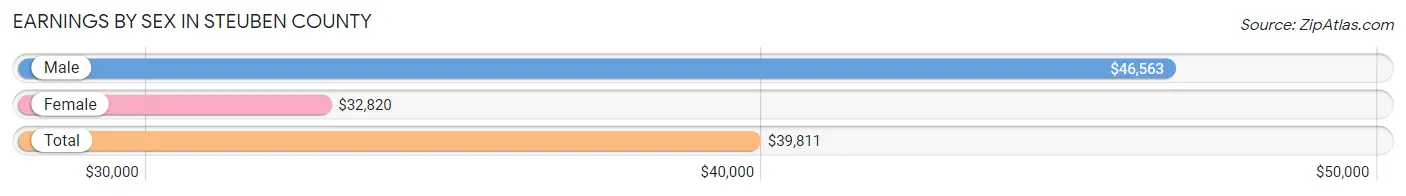
Earnings by Sex in Steuben County
Average Earnings in Steuben County are $39,811, $46,563 for men and $32,820 for women, a difference of 29.5%.
| Sex | Number | Average Earnings |
| Male | 24,516 (52.5%) | $46,563 |
| Female | 22,186 (47.5%) | $32,820 |
| Total | 46,702 (100.0%) | $39,811 |
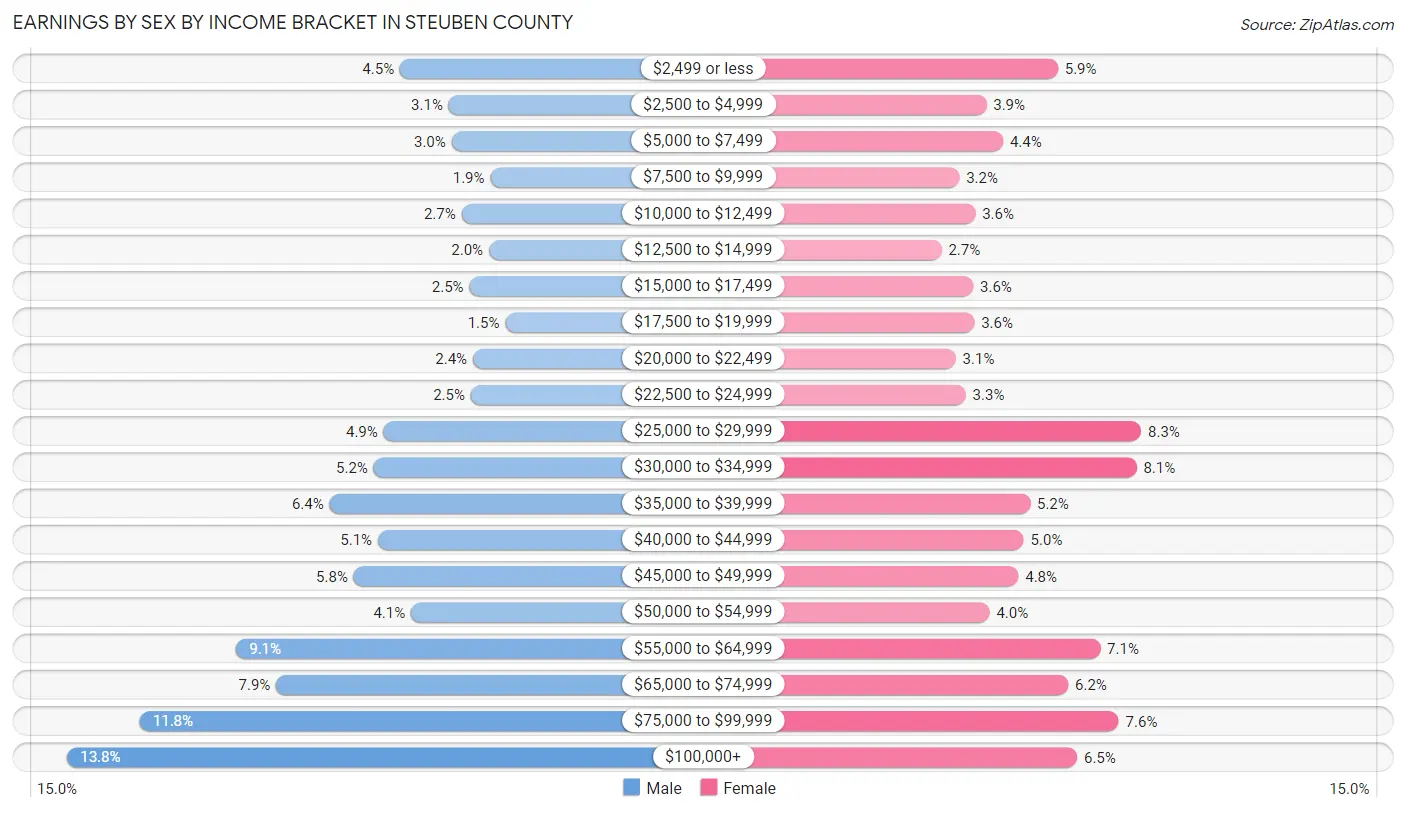
Earnings by Sex by Income Bracket in Steuben County
The most common earnings brackets in Steuben County are $100,000+ for men (3,383 | 13.8%) and $25,000 to $29,999 for women (1,835 | 8.3%).
| Income | Male | Female |
| $2,499 or less | 1,091 (4.4%) | 1,315 (5.9%) |
| $2,500 to $4,999 | 756 (3.1%) | 870 (3.9%) |
| $5,000 to $7,499 | 736 (3.0%) | 973 (4.4%) |
| $7,500 to $9,999 | 468 (1.9%) | 700 (3.2%) |
| $10,000 to $12,499 | 667 (2.7%) | 801 (3.6%) |
| $12,500 to $14,999 | 477 (1.9%) | 591 (2.7%) |
| $15,000 to $17,499 | 613 (2.5%) | 788 (3.5%) |
| $17,500 to $19,999 | 366 (1.5%) | 794 (3.6%) |
| $20,000 to $22,499 | 589 (2.4%) | 678 (3.1%) |
| $22,500 to $24,999 | 604 (2.5%) | 740 (3.3%) |
| $25,000 to $29,999 | 1,204 (4.9%) | 1,835 (8.3%) |
| $30,000 to $34,999 | 1,272 (5.2%) | 1,806 (8.1%) |
| $35,000 to $39,999 | 1,577 (6.4%) | 1,142 (5.1%) |
| $40,000 to $44,999 | 1,243 (5.1%) | 1,103 (5.0%) |
| $45,000 to $49,999 | 1,409 (5.8%) | 1,069 (4.8%) |
| $50,000 to $54,999 | 1,015 (4.1%) | 890 (4.0%) |
| $55,000 to $64,999 | 2,219 (9.0%) | 1,580 (7.1%) |
| $65,000 to $74,999 | 1,945 (7.9%) | 1,381 (6.2%) |
| $75,000 to $99,999 | 2,882 (11.8%) | 1,695 (7.6%) |
| $100,000+ | 3,383 (13.8%) | 1,435 (6.5%) |
| Total | 24,516 (100.0%) | 22,186 (100.0%) |
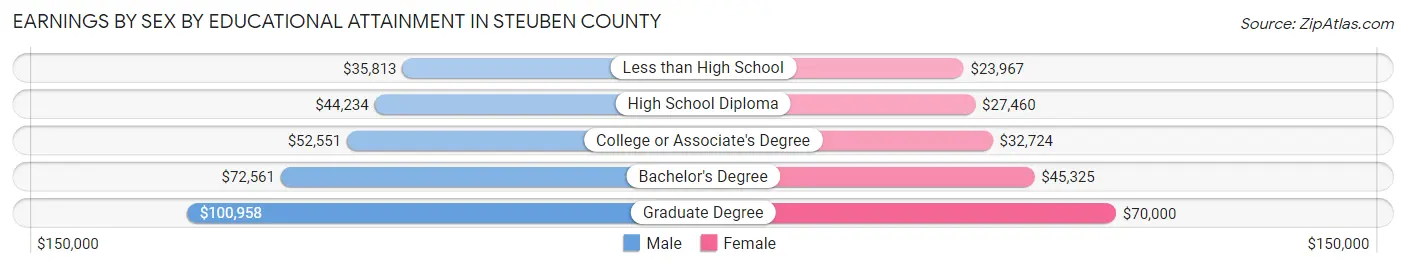
Earnings by Sex by Educational Attainment in Steuben County
Average earnings in Steuben County are $51,978 for men and $36,321 for women, a difference of 30.1%. Men with an educational attainment of graduate degree enjoy the highest average annual earnings of $100,958, while those with less than high school education earn the least with $35,813. Women with an educational attainment of graduate degree earn the most with the average annual earnings of $70,000, while those with less than high school education have the smallest earnings of $23,967.
| Educational Attainment | Male Income | Female Income |
| Less than High School | $35,813 | $23,967 |
| High School Diploma | $44,234 | $27,460 |
| College or Associate's Degree | $52,551 | $32,724 |
| Bachelor's Degree | $72,561 | $45,325 |
| Graduate Degree | $100,958 | $70,000 |
| Total | $51,978 | $36,321 |
Family Income in Steuben County
Family Income Brackets in Steuben County
According to the Steuben County family income data, there are 5,313 families falling into the $100,000 to $149,999 income range, which is the most common income bracket and makes up 21.5% of all families. Conversely, the $10,000 to $14,999 income bracket is the least frequent group with only 297 families (1.2%) belonging to this category.
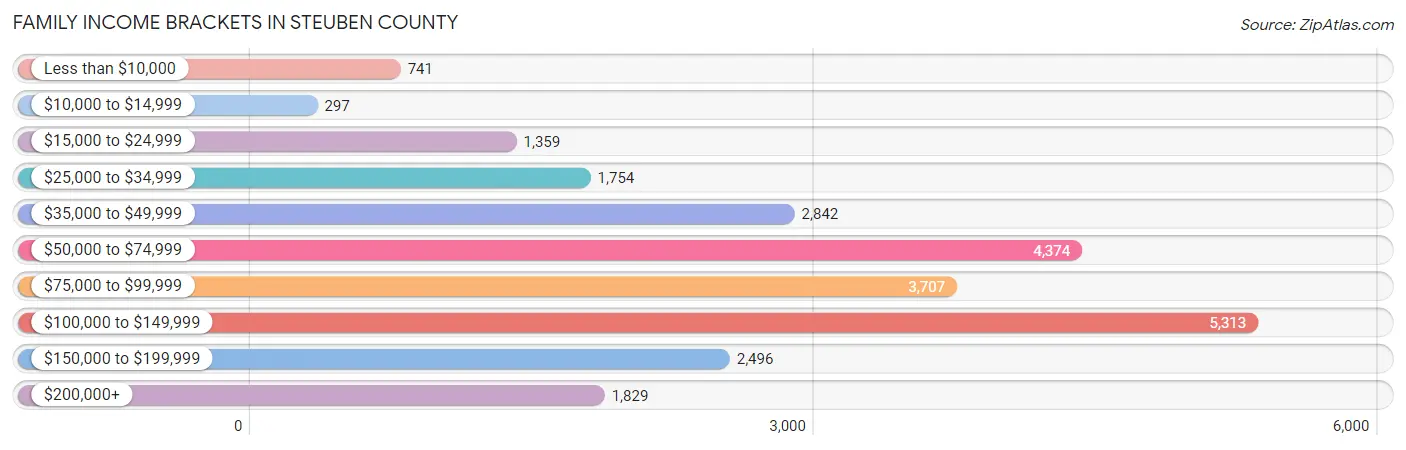
| Income Bracket | # Families | % Families |
| Less than $10,000 | 741 | 3.0% |
| $10,000 to $14,999 | 297 | 1.2% |
| $15,000 to $24,999 | 1,359 | 5.5% |
| $25,000 to $34,999 | 1,754 | 7.1% |
| $35,000 to $49,999 | 2,842 | 11.5% |
| $50,000 to $74,999 | 4,374 | 17.7% |
| $75,000 to $99,999 | 3,707 | 15.0% |
| $100,000 to $149,999 | 5,313 | 21.5% |
| $150,000 to $199,999 | 2,496 | 10.1% |
| $200,000+ | 1,829 | 7.4% |
Family Income by Famaliy Size in Steuben County
4-person families (4,043 | 16.4%) account for the highest median family income in Steuben County with $105,967 per family, while 2-person families (13,138 | 53.2%) have the highest median income of $36,188 per family member.
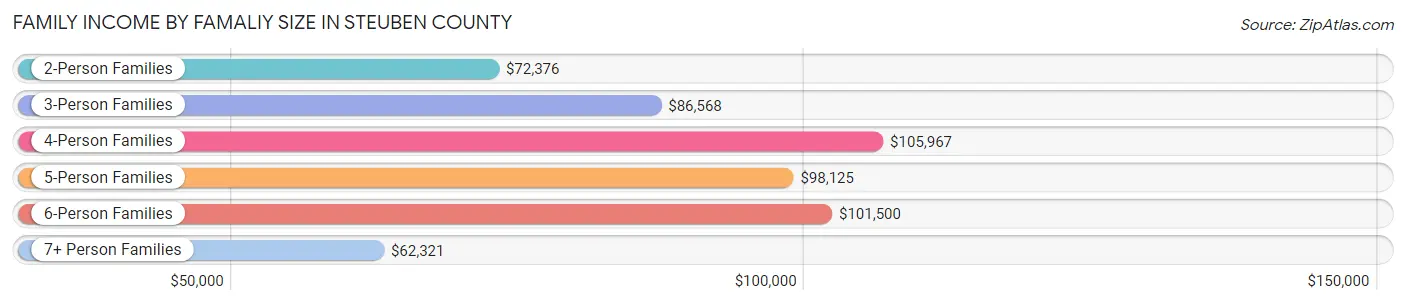
| Income Bracket | # Families | Median Income |
| 2-Person Families | 13,138 (53.2%) | $72,376 |
| 3-Person Families | 5,216 (21.1%) | $86,568 |
| 4-Person Families | 4,043 (16.4%) | $105,967 |
| 5-Person Families | 1,400 (5.7%) | $98,125 |
| 6-Person Families | 612 (2.5%) | $101,500 |
| 7+ Person Families | 302 (1.2%) | $62,321 |
| Total | 24,711 (100.0%) | $81,682 |
Family Income by Number of Earners in Steuben County
The median family income in Steuben County is $81,682, with families comprising 3+ earners (2,313) having the highest median family income of $137,548, while families with no earners (4,617) have the lowest median family income of $51,415, accounting for 9.4% and 18.7% of families, respectively.
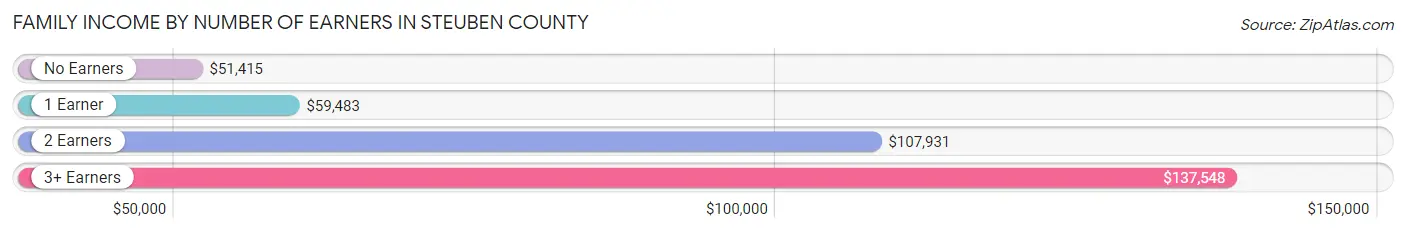
| Number of Earners | # Families | Median Income |
| No Earners | 4,617 (18.7%) | $51,415 |
| 1 Earner | 8,227 (33.3%) | $59,483 |
| 2 Earners | 9,554 (38.7%) | $107,931 |
| 3+ Earners | 2,313 (9.4%) | $137,548 |
| Total | 24,711 (100.0%) | $81,682 |
Household Income in Steuben County
Household Income Brackets in Steuben County
With 6,658 households falling in the category, the $50,000 to $74,999 income range is the most frequent in Steuben County, accounting for 17.0% of all households. In contrast, only 1,449 households (3.7%) fall into the $10,000 to $14,999 income bracket, making it the least populous group.
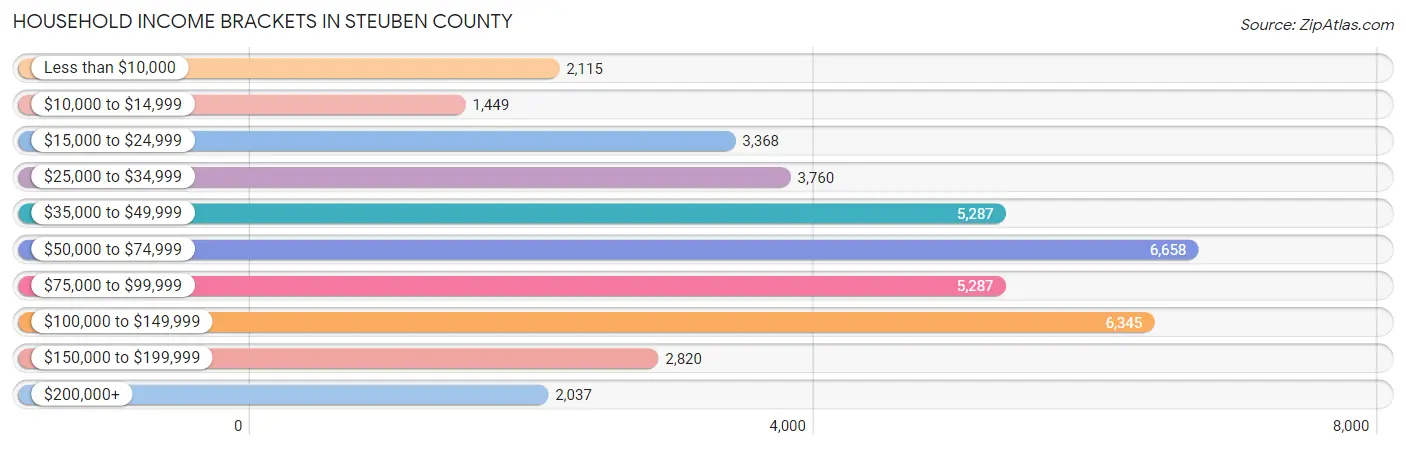
| Income Bracket | # Households | % Households |
| Less than $10,000 | 2,115 | 5.4% |
| $10,000 to $14,999 | 1,449 | 3.7% |
| $15,000 to $24,999 | 3,368 | 8.6% |
| $25,000 to $34,999 | 3,760 | 9.6% |
| $35,000 to $49,999 | 5,287 | 13.5% |
| $50,000 to $74,999 | 6,658 | 17.0% |
| $75,000 to $99,999 | 5,287 | 13.5% |
| $100,000 to $149,999 | 6,345 | 16.2% |
| $150,000 to $199,999 | 2,820 | 7.2% |
| $200,000+ | 2,037 | 5.2% |
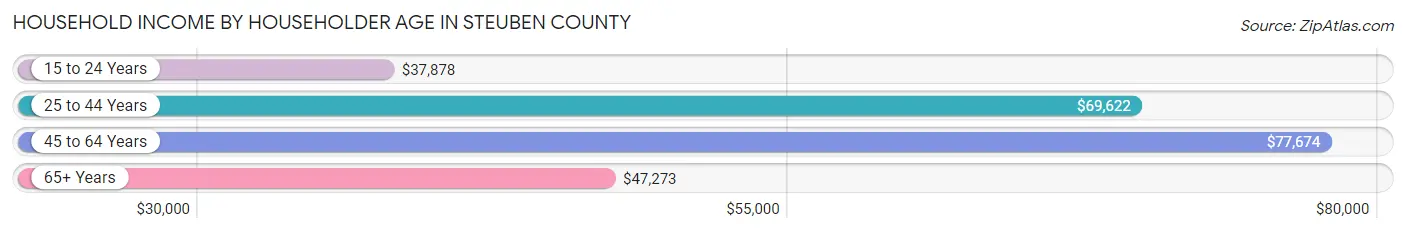
Household Income by Householder Age in Steuben County
The median household income in Steuben County is $62,506, with the highest median household income of $77,674 found in the 45 to 64 years age bracket for the primary householder. A total of 14,941 households (38.2%) fall into this category. Meanwhile, the 15 to 24 years age bracket for the primary householder has the lowest median household income of $37,878, with 1,490 households (3.8%) in this group.
| Income Bracket | # Households | Median Income |
| 15 to 24 Years | 1,490 (3.8%) | $37,878 |
| 25 to 44 Years | 10,874 (27.8%) | $69,622 |
| 45 to 64 Years | 14,941 (38.2%) | $77,674 |
| 65+ Years | 11,860 (30.3%) | $47,273 |
| Total | 39,165 (100.0%) | $62,506 |
Poverty in Steuben County
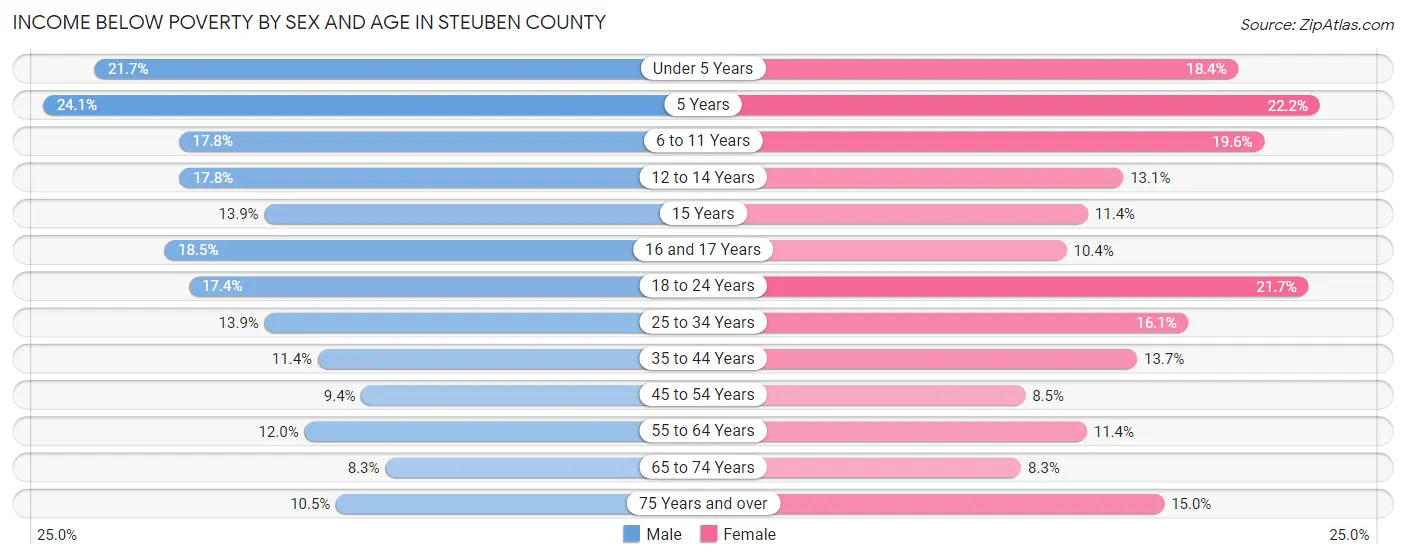
Income Below Poverty by Sex and Age in Steuben County
With 13.2% poverty level for males and 13.6% for females among the residents of Steuben County, 5 year old males and 5 year old females are the most vulnerable to poverty, with 102 males (24.1%) and 112 females (22.2%) in their respective age groups living below the poverty level.
| Age Bracket | Male | Female |
| Under 5 Years | 572 (21.7%) | 435 (18.4%) |
| 5 Years | 102 (24.1%) | 112 (22.2%) |
| 6 to 11 Years | 634 (17.8%) | 619 (19.6%) |
| 12 to 14 Years | 311 (17.8%) | 217 (13.1%) |
| 15 Years | 82 (13.9%) | 75 (11.4%) |
| 16 and 17 Years | 231 (18.5%) | 111 (10.4%) |
| 18 to 24 Years | 630 (17.4%) | 721 (21.7%) |
| 25 to 34 Years | 777 (13.9%) | 854 (16.1%) |
| 35 to 44 Years | 625 (11.4%) | 747 (13.7%) |
| 45 to 54 Years | 549 (9.4%) | 495 (8.5%) |
| 55 to 64 Years | 856 (12.0%) | 788 (11.4%) |
| 65 to 74 Years | 436 (8.3%) | 452 (8.3%) |
| 75 Years and over | 333 (10.5%) | 624 (15.0%) |
| Total | 6,138 (13.2%) | 6,250 (13.6%) |
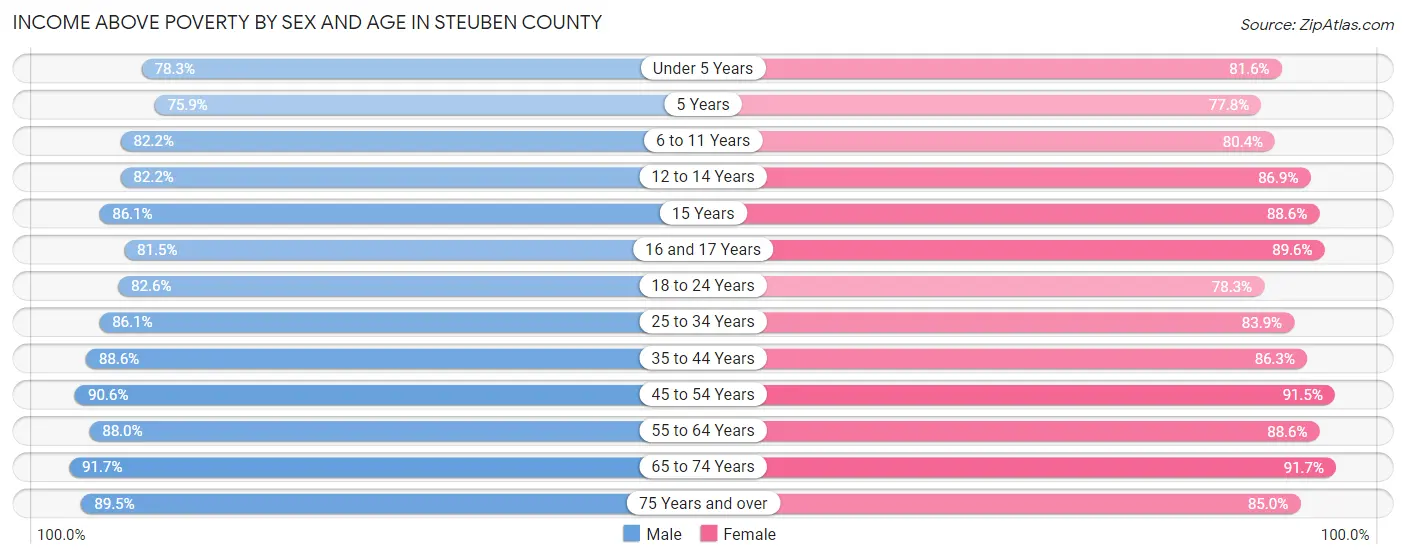
Income Above Poverty by Sex and Age in Steuben County
According to the poverty statistics in Steuben County, males aged 65 to 74 years and females aged 65 to 74 years are the age groups that are most secure financially, with 91.7% of males and 91.7% of females in these age groups living above the poverty line.
| Age Bracket | Male | Female |
| Under 5 Years | 2,060 (78.3%) | 1,928 (81.6%) |
| 5 Years | 321 (75.9%) | 393 (77.8%) |
| 6 to 11 Years | 2,926 (82.2%) | 2,537 (80.4%) |
| 12 to 14 Years | 1,437 (82.2%) | 1,445 (86.9%) |
| 15 Years | 509 (86.1%) | 582 (88.6%) |
| 16 and 17 Years | 1,019 (81.5%) | 953 (89.6%) |
| 18 to 24 Years | 2,996 (82.6%) | 2,607 (78.3%) |
| 25 to 34 Years | 4,829 (86.1%) | 4,455 (83.9%) |
| 35 to 44 Years | 4,864 (88.6%) | 4,707 (86.3%) |
| 45 to 54 Years | 5,313 (90.6%) | 5,324 (91.5%) |
| 55 to 64 Years | 6,274 (88.0%) | 6,145 (88.6%) |
| 65 to 74 Years | 4,843 (91.7%) | 4,982 (91.7%) |
| 75 Years and over | 2,825 (89.5%) | 3,548 (85.0%) |
| Total | 40,216 (86.8%) | 39,606 (86.4%) |
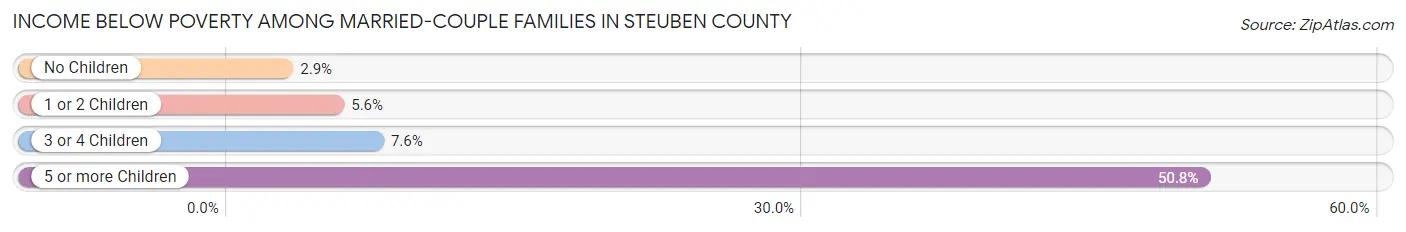
Income Below Poverty Among Married-Couple Families in Steuben County
The poverty statistics for married-couple families in Steuben County show that 4.4% or 831 of the total 18,664 families live below the poverty line. Families with 5 or more children have the highest poverty rate of 50.8%, comprising of 99 families. On the other hand, families with no children have the lowest poverty rate of 2.9%, which includes 346 families.
| Children | Above Poverty | Below Poverty |
| No Children | 11,625 (97.1%) | 346 (2.9%) |
| 1 or 2 Children | 4,984 (94.5%) | 293 (5.6%) |
| 3 or 4 Children | 1,128 (92.4%) | 93 (7.6%) |
| 5 or more Children | 96 (49.2%) | 99 (50.8%) |
| Total | 17,833 (95.6%) | 831 (4.4%) |
Income Below Poverty Among Single-Parent Households in Steuben County
According to the poverty data in Steuben County, 13.1% or 265 single-father households and 24.5% or 987 single-mother households are living below the poverty line. Among single-father households, those with 1 or 2 children have the highest poverty rate, with 203 households (20.5%) experiencing poverty. Likewise, among single-mother households, those with 5 or more children have the highest poverty rate, with 29 households (100.0%) falling below the poverty line.
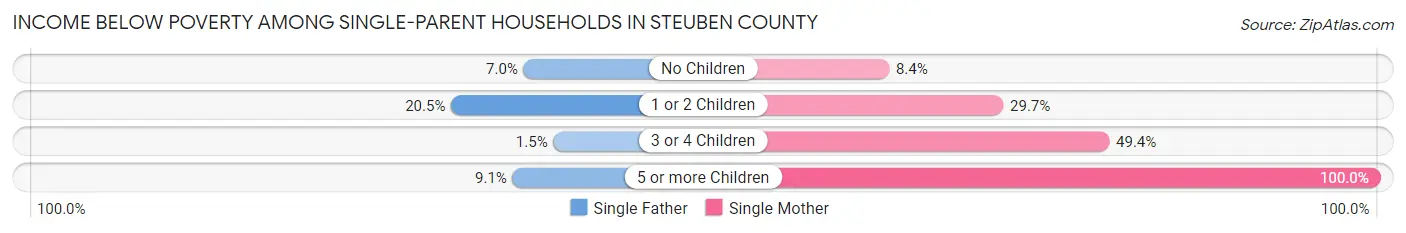
| Children | Single Father | Single Mother |
| No Children | 58 (7.0%) | 118 (8.4%) |
| 1 or 2 Children | 203 (20.5%) | 664 (29.7%) |
| 3 or 4 Children | 3 (1.5%) | 176 (49.4%) |
| 5 or more Children | 1 (9.1%) | 29 (100.0%) |
| Total | 265 (13.1%) | 987 (24.5%) |
Income Below Poverty Among Married-Couple vs Single-Parent Households in Steuben County
The poverty data for Steuben County shows that 831 of the married-couple family households (4.4%) and 1,252 of the single-parent households (20.7%) are living below the poverty level. Within the married-couple family households, those with 5 or more children have the highest poverty rate, with 99 households (50.8%) falling below the poverty line. Among the single-parent households, those with 5 or more children have the highest poverty rate, with 30 household (75.0%) living below poverty.
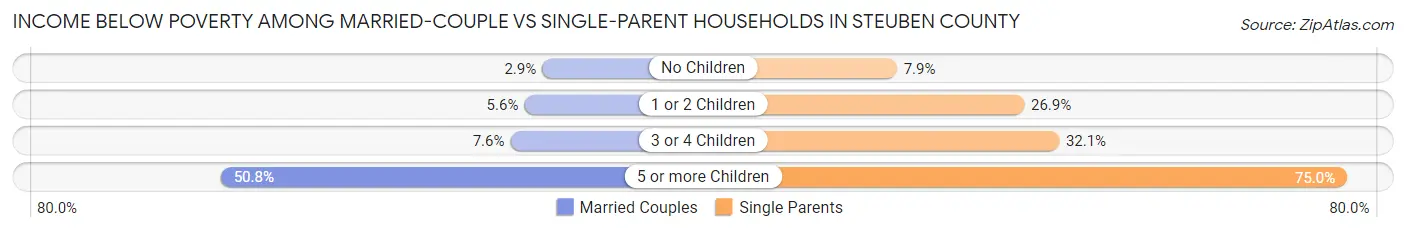
| Children | Married-Couple Families | Single-Parent Households |
| No Children | 346 (2.9%) | 176 (7.9%) |
| 1 or 2 Children | 293 (5.6%) | 867 (26.9%) |
| 3 or 4 Children | 93 (7.6%) | 179 (32.1%) |
| 5 or more Children | 99 (50.8%) | 30 (75.0%) |
| Total | 831 (4.4%) | 1,252 (20.7%) |
Race in Steuben County
The most populous races in Steuben County are White / Caucasian (87,093 | 93.1%), Two or more Races (2,729 | 2.9%), and Hispanic or Latino (1,672 | 1.8%).
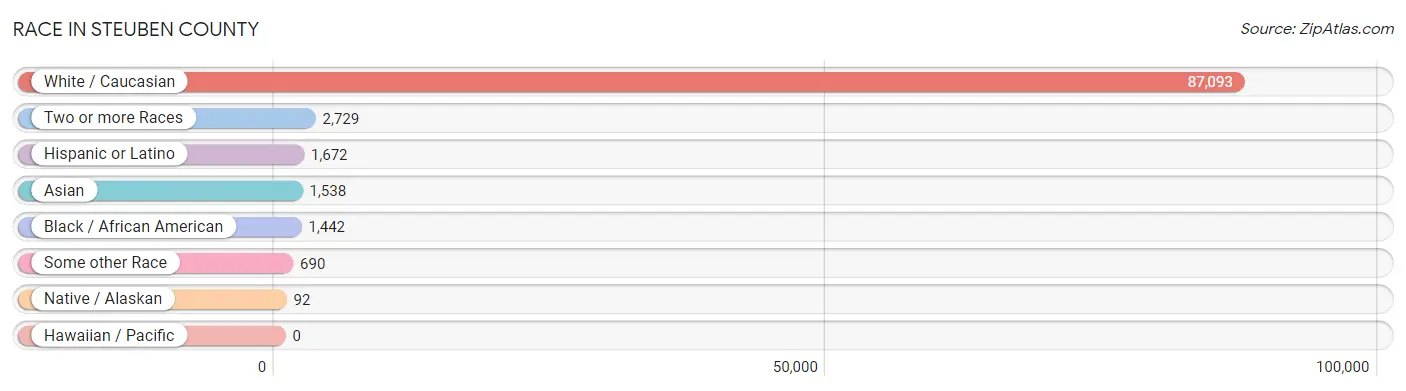
| Race | # Population | % Population |
| Asian | 1,538 | 1.6% |
| Black / African American | 1,442 | 1.5% |
| Hawaiian / Pacific | 0 | 0.0% |
| Hispanic or Latino | 1,672 | 1.8% |
| Native / Alaskan | 92 | 0.1% |
| White / Caucasian | 87,093 | 93.1% |
| Two or more Races | 2,729 | 2.9% |
| Some other Race | 690 | 0.7% |
| Total | 93,584 | 100.0% |
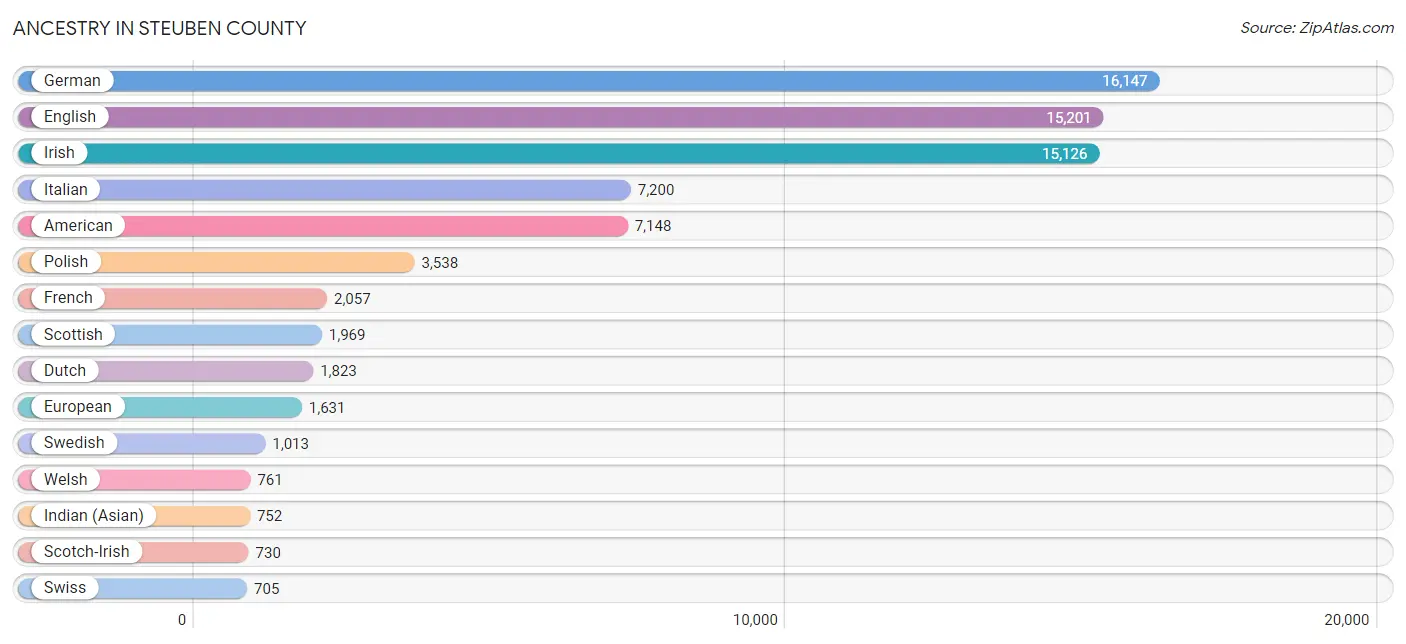
Ancestry in Steuben County
The most populous ancestries reported in Steuben County are German (16,147 | 17.2%), English (15,201 | 16.2%), Irish (15,126 | 16.2%), Italian (7,200 | 7.7%), and American (7,148 | 7.6%), together accounting for 65.0% of all Steuben County residents.
| Ancestry | # Population | % Population |
| Afghan | 1 | 0.0% |
| African | 44 | 0.1% |
| Alaska Native | 21 | 0.0% |
| Albanian | 62 | 0.1% |
| Aleut | 5 | 0.0% |
| American | 7,148 | 7.6% |
| Arab | 198 | 0.2% |
| Argentinean | 40 | 0.0% |
| Armenian | 24 | 0.0% |
| Australian | 110 | 0.1% |
| Austrian | 219 | 0.2% |
| Barbadian | 5 | 0.0% |
| Belgian | 22 | 0.0% |
| Bhutanese | 64 | 0.1% |
| Blackfeet | 17 | 0.0% |
| Brazilian | 95 | 0.1% |
| British | 532 | 0.6% |
| Bulgarian | 5 | 0.0% |
| Burmese | 215 | 0.2% |
| Cajun | 15 | 0.0% |
| Canadian | 67 | 0.1% |
| Celtic | 6 | 0.0% |
| Central American | 139 | 0.2% |
| Central American Indian | 21 | 0.0% |
| Cherokee | 22 | 0.0% |
| Chilean | 24 | 0.0% |
| Chippewa | 27 | 0.0% |
| Colombian | 18 | 0.0% |
| Croatian | 61 | 0.1% |
| Cuban | 60 | 0.1% |
| Czech | 120 | 0.1% |
| Czechoslovakian | 131 | 0.1% |
| Danish | 233 | 0.3% |
| Delaware | 9 | 0.0% |
| Dominican | 97 | 0.1% |
| Dutch | 1,823 | 1.9% |
| Eastern European | 260 | 0.3% |
| Ecuadorian | 59 | 0.1% |
| English | 15,201 | 16.2% |
| European | 1,631 | 1.7% |
| Finnish | 80 | 0.1% |
| French | 2,057 | 2.2% |
| French American Indian | 6 | 0.0% |
| French Canadian | 596 | 0.6% |
| German | 16,147 | 17.2% |
| German Russian | 8 | 0.0% |
| Greek | 80 | 0.1% |
| Guatemalan | 48 | 0.1% |
| Haitian | 2 | 0.0% |
| Honduran | 67 | 0.1% |
| Hungarian | 396 | 0.4% |
| Indian (Asian) | 752 | 0.8% |
| Indonesian | 45 | 0.1% |
| Iranian | 35 | 0.0% |
| Iraqi | 102 | 0.1% |
| Irish | 15,126 | 16.2% |
| Iroquois | 91 | 0.1% |
| Israeli | 6 | 0.0% |
| Italian | 7,200 | 7.7% |
| Jamaican | 9 | 0.0% |
| Japanese | 8 | 0.0% |
| Korean | 186 | 0.2% |
| Latvian | 90 | 0.1% |
| Lebanese | 36 | 0.0% |
| Lithuanian | 52 | 0.1% |
| Luxembourger | 1 | 0.0% |
| Maltese | 13 | 0.0% |
| Mexican | 384 | 0.4% |
| Moroccan | 6 | 0.0% |
| Native Hawaiian | 4 | 0.0% |
| Nigerian | 247 | 0.3% |
| Northern European | 94 | 0.1% |
| Norwegian | 330 | 0.4% |
| Pakistani | 33 | 0.0% |
| Pennsylvania German | 499 | 0.5% |
| Polish | 3,538 | 3.8% |
| Portuguese | 150 | 0.2% |
| Puerto Rican | 611 | 0.6% |
| Romanian | 238 | 0.3% |
| Russian | 456 | 0.5% |
| Salvadoran | 23 | 0.0% |
| Scandinavian | 205 | 0.2% |
| Scotch-Irish | 730 | 0.8% |
| Scottish | 1,969 | 2.1% |
| Serbian | 5 | 0.0% |
| Sioux | 33 | 0.0% |
| Slavic | 31 | 0.0% |
| Slovak | 68 | 0.1% |
| Slovene | 88 | 0.1% |
| South African | 3 | 0.0% |
| South American | 161 | 0.2% |
| South American Indian | 9 | 0.0% |
| Spaniard | 95 | 0.1% |
| Spanish | 58 | 0.1% |
| Sri Lankan | 7 | 0.0% |
| Subsaharan African | 318 | 0.3% |
| Swedish | 1,013 | 1.1% |
| Swiss | 705 | 0.7% |
| Syrian | 20 | 0.0% |
| Thai | 446 | 0.5% |
| Tlingit-Haida | 13 | 0.0% |
| Trinidadian and Tobagonian | 22 | 0.0% |
| Turkish | 9 | 0.0% |
| Ukrainian | 563 | 0.6% |
| Venezuelan | 20 | 0.0% |
| Vietnamese | 38 | 0.0% |
| Welsh | 761 | 0.8% |
| West Indian | 9 | 0.0% |
| Yugoslavian | 14 | 0.0% |
| Zimbabwean | 24 | 0.0% | View All 110 Rows |
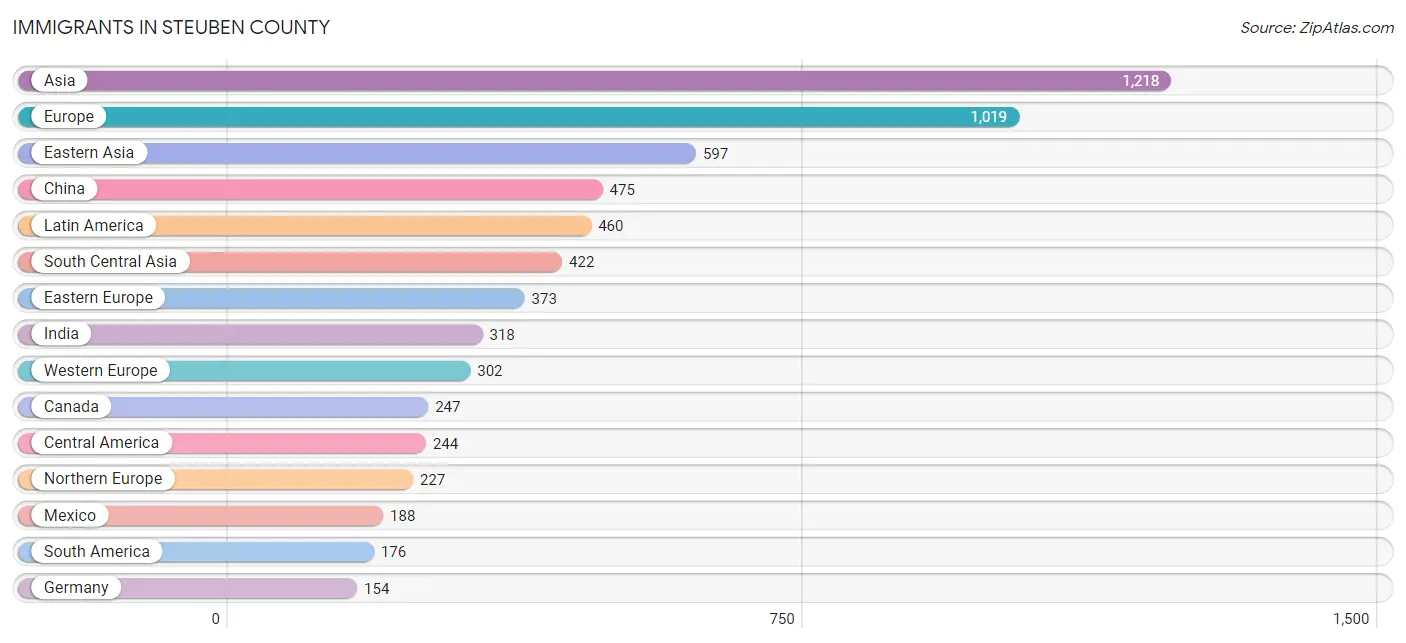
Immigrants in Steuben County
The most numerous immigrant groups reported in Steuben County came from Asia (1,218 | 1.3%), Europe (1,019 | 1.1%), Eastern Asia (597 | 0.6%), China (475 | 0.5%), and Latin America (460 | 0.5%), together accounting for 4.0% of all Steuben County residents.
| Immigration Origin | # Population | % Population |
| Afghanistan | 1 | 0.0% |
| Africa | 79 | 0.1% |
| Argentina | 40 | 0.0% |
| Asia | 1,218 | 1.3% |
| Australia | 52 | 0.1% |
| Austria | 15 | 0.0% |
| Bangladesh | 37 | 0.0% |
| Belgium | 7 | 0.0% |
| Brazil | 80 | 0.1% |
| Cabo Verde | 3 | 0.0% |
| Cameroon | 6 | 0.0% |
| Canada | 247 | 0.3% |
| Caribbean | 40 | 0.0% |
| Central America | 244 | 0.3% |
| China | 475 | 0.5% |
| Colombia | 14 | 0.0% |
| Croatia | 33 | 0.0% |
| Cuba | 7 | 0.0% |
| Czechoslovakia | 5 | 0.0% |
| Denmark | 6 | 0.0% |
| Dominican Republic | 2 | 0.0% |
| Eastern Africa | 12 | 0.0% |
| Eastern Asia | 597 | 0.6% |
| Eastern Europe | 373 | 0.4% |
| Ecuador | 4 | 0.0% |
| El Salvador | 7 | 0.0% |
| England | 94 | 0.1% |
| Ethiopia | 2 | 0.0% |
| Europe | 1,019 | 1.1% |
| France | 99 | 0.1% |
| Germany | 154 | 0.2% |
| Greece | 7 | 0.0% |
| Grenada | 9 | 0.0% |
| Guatemala | 37 | 0.0% |
| Honduras | 12 | 0.0% |
| Hong Kong | 4 | 0.0% |
| India | 318 | 0.3% |
| Iran | 35 | 0.0% |
| Ireland | 37 | 0.0% |
| Israel | 12 | 0.0% |
| Italy | 39 | 0.0% |
| Jamaica | 4 | 0.0% |
| Japan | 9 | 0.0% |
| Kazakhstan | 1 | 0.0% |
| Korea | 113 | 0.1% |
| Latin America | 460 | 0.5% |
| Lithuania | 17 | 0.0% |
| Mexico | 188 | 0.2% |
| Middle Africa | 6 | 0.0% |
| Moldova | 72 | 0.1% |
| Morocco | 4 | 0.0% |
| Nepal | 23 | 0.0% |
| Netherlands | 27 | 0.0% |
| Nigeria | 49 | 0.1% |
| Northern Africa | 4 | 0.0% |
| Northern Europe | 227 | 0.2% |
| Norway | 4 | 0.0% |
| Oceania | 52 | 0.1% |
| Pakistan | 7 | 0.0% |
| Philippines | 79 | 0.1% |
| Poland | 57 | 0.1% |
| Portugal | 45 | 0.1% |
| Romania | 18 | 0.0% |
| Russia | 58 | 0.1% |
| Scotland | 30 | 0.0% |
| South America | 176 | 0.2% |
| South Central Asia | 422 | 0.4% |
| South Eastern Asia | 151 | 0.2% |
| Southern Europe | 117 | 0.1% |
| Spain | 26 | 0.0% |
| Thailand | 22 | 0.0% |
| Trinidad and Tobago | 18 | 0.0% |
| Ukraine | 113 | 0.1% |
| Venezuela | 38 | 0.0% |
| Vietnam | 5 | 0.0% |
| Western Africa | 52 | 0.1% |
| Western Asia | 48 | 0.1% |
| Western Europe | 302 | 0.3% |
| Yemen | 4 | 0.0% |
| Zimbabwe | 3 | 0.0% | View All 80 Rows |
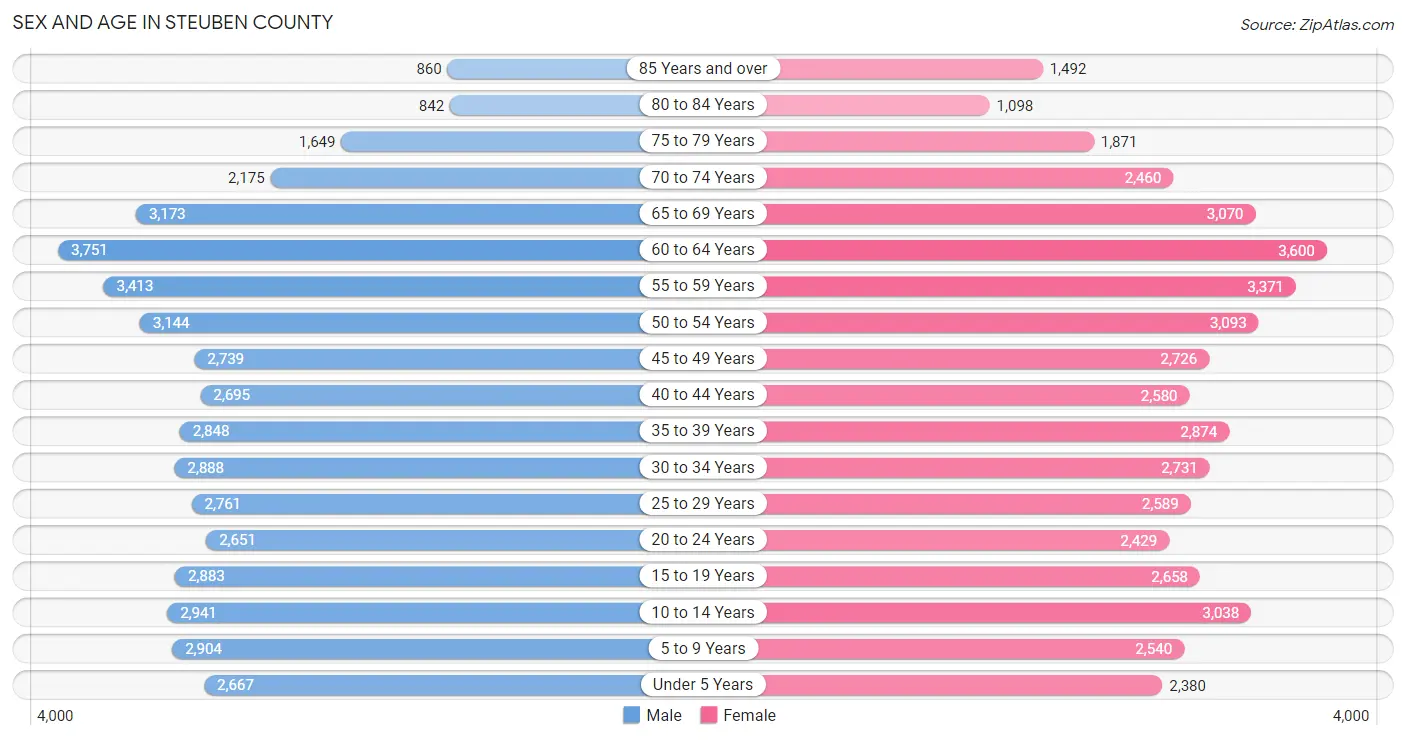
Sex and Age in Steuben County
Sex and Age in Steuben County
The most populous age groups in Steuben County are 60 to 64 Years (3,751 | 8.0%) for men and 60 to 64 Years (3,600 | 7.7%) for women.
| Age Bracket | Male | Female |
| Under 5 Years | 2,667 (5.7%) | 2,380 (5.1%) |
| 5 to 9 Years | 2,904 (6.2%) | 2,540 (5.4%) |
| 10 to 14 Years | 2,941 (6.3%) | 3,038 (6.5%) |
| 15 to 19 Years | 2,883 (6.1%) | 2,658 (5.7%) |
| 20 to 24 Years | 2,651 (5.6%) | 2,429 (5.2%) |
| 25 to 29 Years | 2,761 (5.9%) | 2,589 (5.6%) |
| 30 to 34 Years | 2,888 (6.1%) | 2,731 (5.9%) |
| 35 to 39 Years | 2,848 (6.1%) | 2,874 (6.2%) |
| 40 to 44 Years | 2,695 (5.7%) | 2,580 (5.5%) |
| 45 to 49 Years | 2,739 (5.8%) | 2,726 (5.9%) |
| 50 to 54 Years | 3,144 (6.7%) | 3,093 (6.6%) |
| 55 to 59 Years | 3,413 (7.3%) | 3,371 (7.2%) |
| 60 to 64 Years | 3,751 (8.0%) | 3,600 (7.7%) |
| 65 to 69 Years | 3,173 (6.8%) | 3,070 (6.6%) |
| 70 to 74 Years | 2,175 (4.6%) | 2,460 (5.3%) |
| 75 to 79 Years | 1,649 (3.5%) | 1,871 (4.0%) |
| 80 to 84 Years | 842 (1.8%) | 1,098 (2.4%) |
| 85 Years and over | 860 (1.8%) | 1,492 (3.2%) |
| Total | 46,984 (100.0%) | 46,600 (100.0%) |
Families and Households in Steuben County
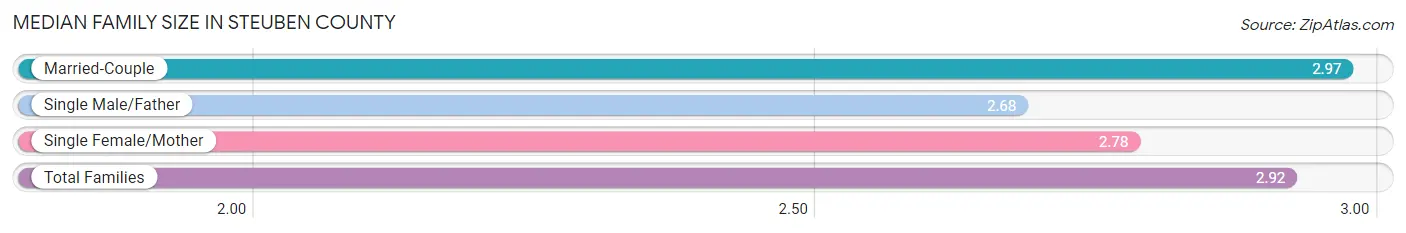
Median Family Size in Steuben County
The median family size in Steuben County is 2.92 persons per family, with married-couple families (18,664 | 75.5%) accounting for the largest median family size of 2.97 persons per family. On the other hand, single male/father families (2,027 | 8.2%) represent the smallest median family size with 2.68 persons per family.
| Family Type | # Families | Family Size |
| Married-Couple | 18,664 (75.5%) | 2.97 |
| Single Male/Father | 2,027 (8.2%) | 2.68 |
| Single Female/Mother | 4,020 (16.3%) | 2.78 |
| Total Families | 24,711 (100.0%) | 2.92 |
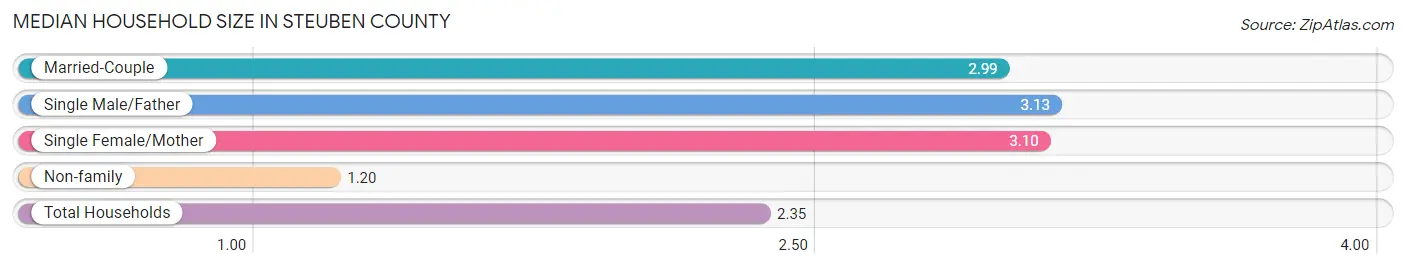
Median Household Size in Steuben County
The median household size in Steuben County is 2.35 persons per household, with single male/father households (2,027 | 5.2%) accounting for the largest median household size of 3.13 persons per household. non-family households (14,454 | 36.9%) represent the smallest median household size with 1.20 persons per household.
| Household Type | # Households | Household Size |
| Married-Couple | 18,664 (47.6%) | 2.99 |
| Single Male/Father | 2,027 (5.2%) | 3.13 |
| Single Female/Mother | 4,020 (10.3%) | 3.10 |
| Non-family | 14,454 (36.9%) | 1.20 |
| Total Households | 39,165 (100.0%) | 2.35 |
Household Size by Marriage Status in Steuben County
Out of a total of 39,165 households in Steuben County, 24,711 (63.1%) are family households, while 14,454 (36.9%) are nonfamily households. The most numerous type of family households are 2-person households, comprising 12,273, and the most common type of nonfamily households are 1-person households, comprising 12,151.
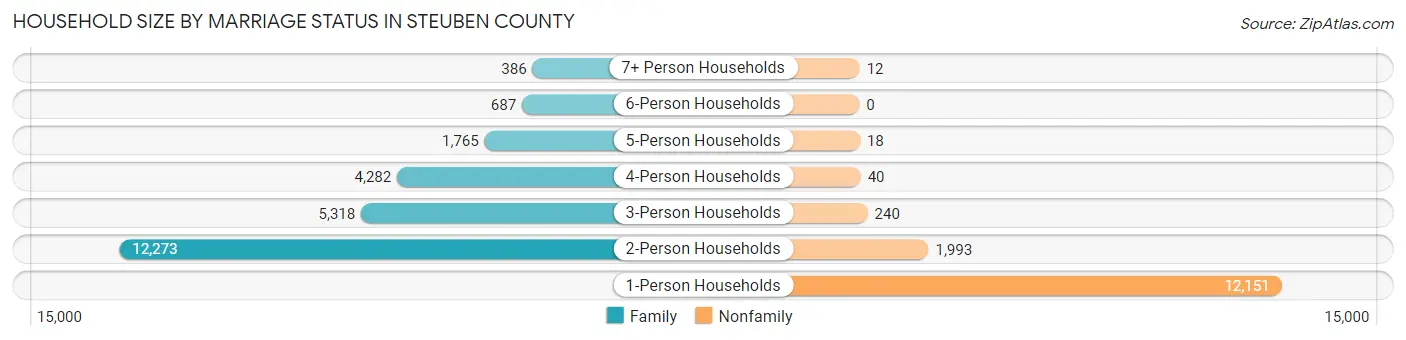
| Household Size | Family Households | Nonfamily Households |
| 1-Person Households | - | 12,151 (31.0%) |
| 2-Person Households | 12,273 (31.3%) | 1,993 (5.1%) |
| 3-Person Households | 5,318 (13.6%) | 240 (0.6%) |
| 4-Person Households | 4,282 (10.9%) | 40 (0.1%) |
| 5-Person Households | 1,765 (4.5%) | 18 (0.1%) |
| 6-Person Households | 687 (1.8%) | 0 (0.0%) |
| 7+ Person Households | 386 (1.0%) | 12 (0.0%) |
| Total | 24,711 (63.1%) | 14,454 (36.9%) |
Female Fertility in Steuben County
Fertility by Age in Steuben County
Average fertility rate in Steuben County is 44.0 births per 1,000 women. Women in the age bracket of 20 to 34 years have the highest fertility rate with 96.0 births per 1,000 women. Women in the age bracket of 20 to 34 years acount for 86.9% of all women with births.
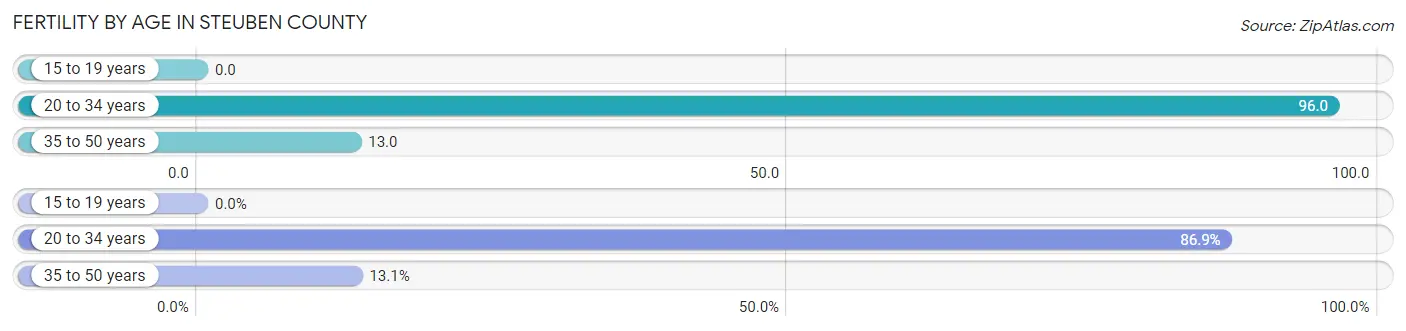
| Age Bracket | Women with Births | Births / 1,000 Women |
| 15 to 19 years | 0 (0.0%) | 0.0 |
| 20 to 34 years | 743 (86.9%) | 96.0 |
| 35 to 50 years | 112 (13.1%) | 13.0 |
| Total | 855 (100.0%) | 44.0 |
Fertility by Age by Marriage Status in Steuben County
75.3% of women with births (855) in Steuben County are married. The highest percentage of unmarried women with births falls into 20 to 34 years age bracket with 26.4% of them unmarried at the time of birth, while the lowest percentage of unmarried women with births belong to 35 to 50 years age bracket with 13.4% of them unmarried.
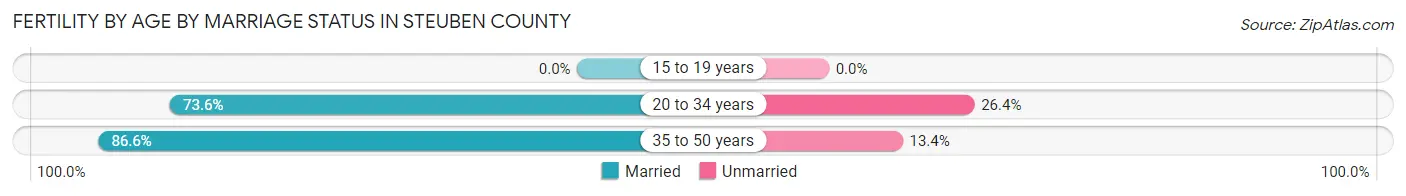
| Age Bracket | Married | Unmarried |
| 15 to 19 years | 0 (0.0%) | 0 (0.0%) |
| 20 to 34 years | 547 (73.6%) | 196 (26.4%) |
| 35 to 50 years | 97 (86.6%) | 15 (13.4%) |
| Total | 644 (75.3%) | 211 (24.7%) |
Fertility by Education in Steuben County
Average fertility rate in Steuben County is 44.0 births per 1,000 women. Women with the education attainment of college or associate's degree have the highest fertility rate of 62.0 births per 1,000 women, while women with the education attainment of high school diploma have the lowest fertility at 24.0 births per 1,000 women. Women with the education attainment of college or associate's degree represent 44.9% of all women with births.
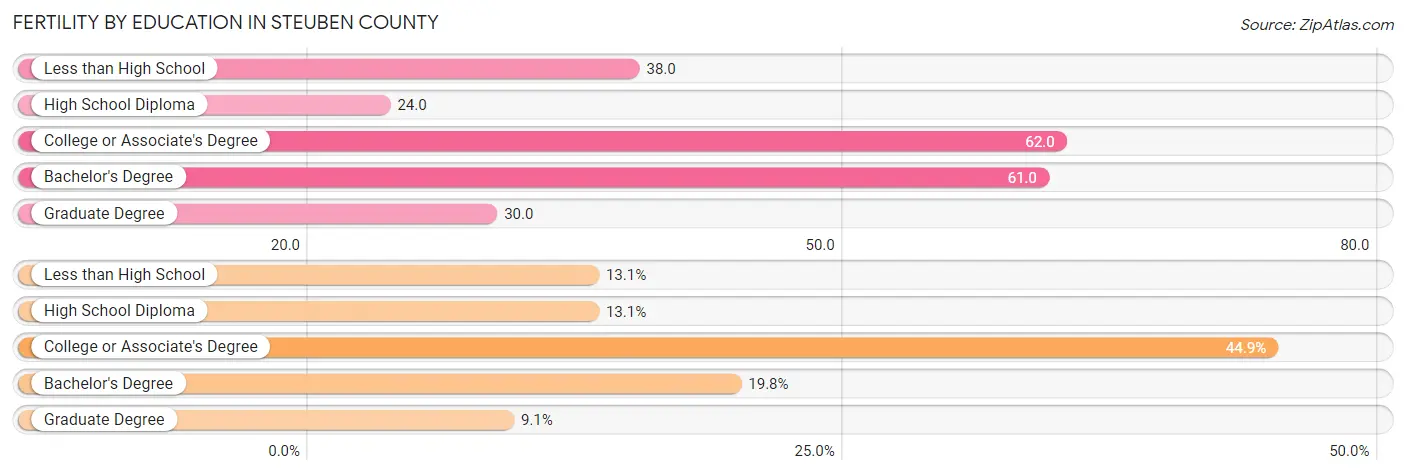
| Educational Attainment | Women with Births | Births / 1,000 Women |
| Less than High School | 112 (13.1%) | 38.0 |
| High School Diploma | 112 (13.1%) | 24.0 |
| College or Associate's Degree | 384 (44.9%) | 62.0 |
| Bachelor's Degree | 169 (19.8%) | 61.0 |
| Graduate Degree | 78 (9.1%) | 30.0 |
| Total | 855 (100.0%) | 44.0 |
Fertility by Education by Marriage Status in Steuben County
24.7% of women with births in Steuben County are unmarried. Women with the educational attainment of graduate degree are most likely to be married with 100.0% of them married at childbirth, while women with the educational attainment of college or associate's degree are least likely to be married with 35.2% of them unmarried at childbirth.
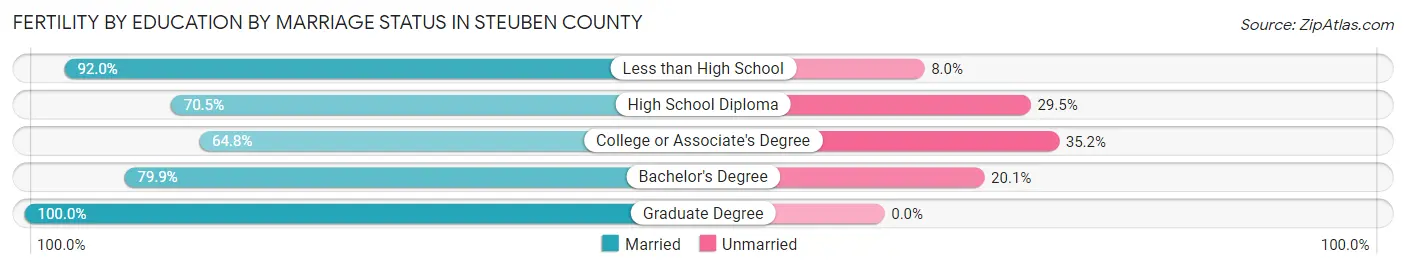
| Educational Attainment | Married | Unmarried |
| Less than High School | 103 (92.0%) | 9 (8.0%) |
| High School Diploma | 79 (70.5%) | 33 (29.5%) |
| College or Associate's Degree | 249 (64.8%) | 135 (35.2%) |
| Bachelor's Degree | 135 (79.9%) | 34 (20.1%) |
| Graduate Degree | 78 (100.0%) | 0 (0.0%) |
| Total | 644 (75.3%) | 211 (24.7%) |
Employment Characteristics in Steuben County
Employment by Class of Employer in Steuben County
Among the 41,256 employed individuals in Steuben County, private company employees (24,550 | 59.5%), local government employees (4,703 | 11.4%), and not-for-profit organizations (4,578 | 11.1%) make up the most common classes of employment.
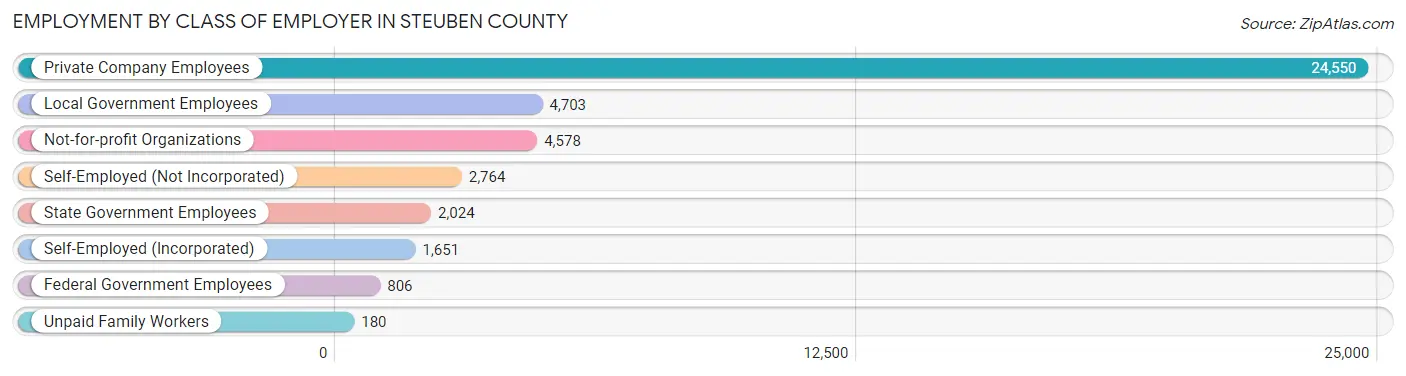
| Employer Class | # Employees | % Employees |
| Private Company Employees | 24,550 | 59.5% |
| Self-Employed (Incorporated) | 1,651 | 4.0% |
| Self-Employed (Not Incorporated) | 2,764 | 6.7% |
| Not-for-profit Organizations | 4,578 | 11.1% |
| Local Government Employees | 4,703 | 11.4% |
| State Government Employees | 2,024 | 4.9% |
| Federal Government Employees | 806 | 1.9% |
| Unpaid Family Workers | 180 | 0.4% |
| Total | 41,256 | 100.0% |
Employment Status by Age in Steuben County
According to the labor force statistics for Steuben County, out of the total population over 16 years of age (75,864), 59.3% or 44,987 individuals are in the labor force, with 6.3% or 2,834 of them unemployed. The age group with the highest labor force participation rate is 25 to 29 years, with 84.8% or 4,537 individuals in the labor force. Within the labor force, the 16 to 19 years age range has the highest percentage of unemployed individuals, with 18.7% or 348 of them being unemployed.
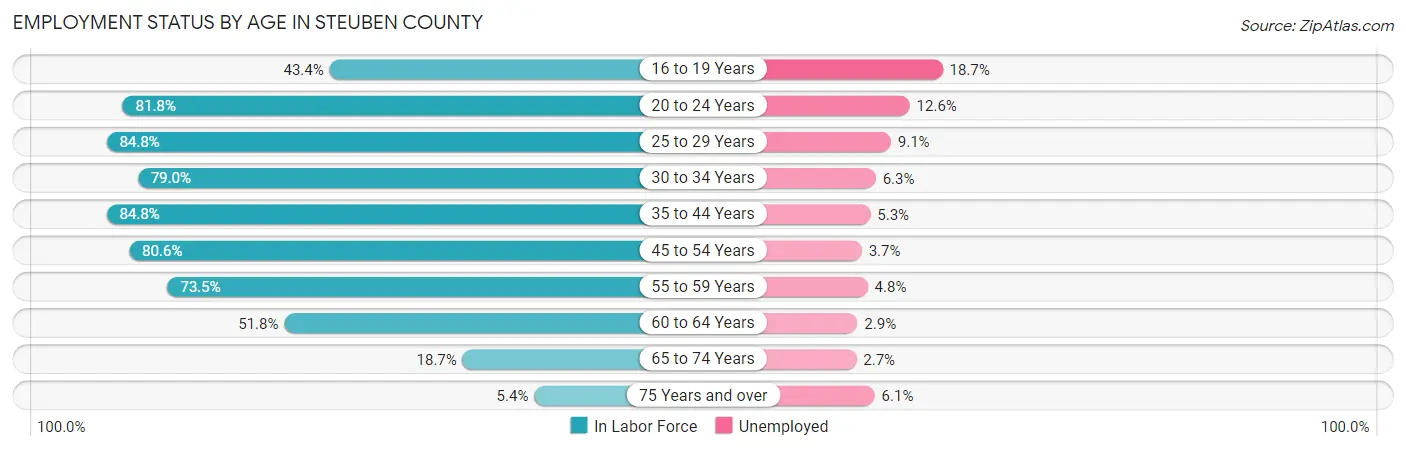
| Age Bracket | In Labor Force | Unemployed |
| 16 to 19 Years | 1,862 (43.4%) | 348 (18.7%) |
| 20 to 24 Years | 4,155 (81.8%) | 524 (12.6%) |
| 25 to 29 Years | 4,537 (84.8%) | 413 (9.1%) |
| 30 to 34 Years | 4,439 (79.0%) | 280 (6.3%) |
| 35 to 44 Years | 9,325 (84.8%) | 494 (5.3%) |
| 45 to 54 Years | 9,432 (80.6%) | 349 (3.7%) |
| 55 to 59 Years | 4,986 (73.5%) | 239 (4.8%) |
| 60 to 64 Years | 3,808 (51.8%) | 110 (2.9%) |
| 65 to 74 Years | 2,034 (18.7%) | 55 (2.7%) |
| 75 Years and over | 422 (5.4%) | 26 (6.1%) |
| Total | 44,987 (59.3%) | 2,834 (6.3%) |
Employment Status by Educational Attainment in Steuben County
According to labor force statistics for Steuben County, 76.4% of individuals (36,521) out of the total population between 25 and 64 years of age (47,803) are in the labor force, with 5.2% or 1,899 of them being unemployed. The group with the highest labor force participation rate are those with the educational attainment of bachelor's degree or higher, with 87.8% or 11,572 individuals in the labor force. Within the labor force, individuals with less than high school education have the highest percentage of unemployment, with 15.8% or 301 of them being unemployed.
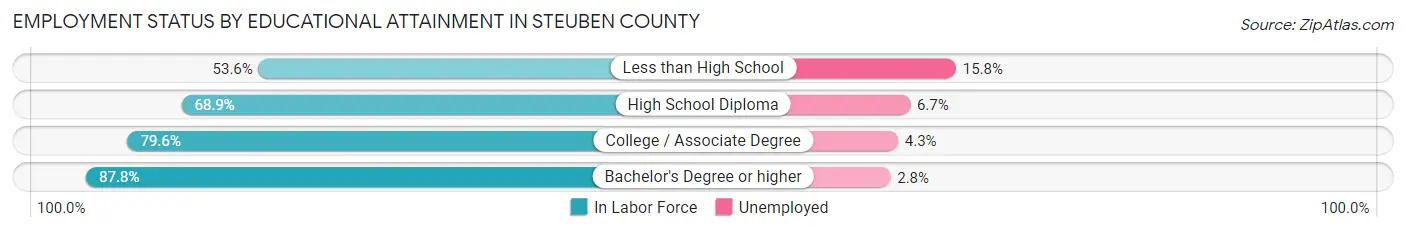
| Educational Attainment | In Labor Force | Unemployed |
| Less than High School | 1,903 (53.6%) | 561 (15.8%) |
| High School Diploma | 10,790 (68.9%) | 1,049 (6.7%) |
| College / Associate Degree | 12,269 (79.6%) | 663 (4.3%) |
| Bachelor's Degree or higher | 11,572 (87.8%) | 369 (2.8%) |
| Total | 36,521 (76.4%) | 2,486 (5.2%) |
Employment Occupations by Sex in Steuben County
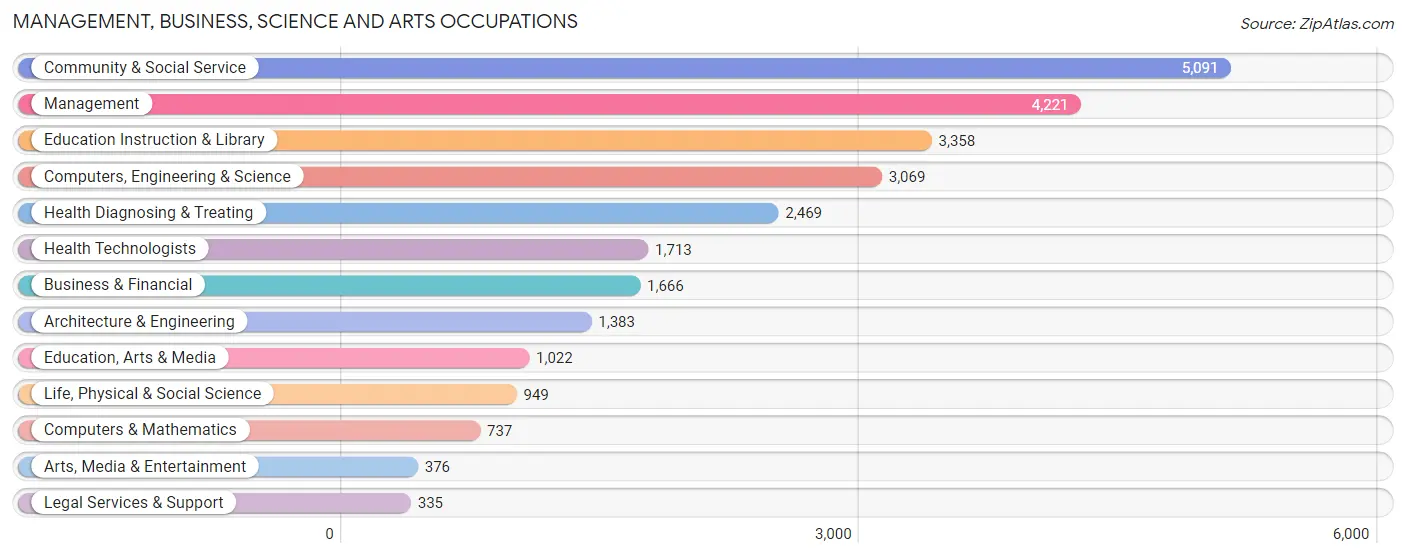
Management, Business, Science and Arts Occupations
The most common Management, Business, Science and Arts occupations in Steuben County are Community & Social Service (5,091 | 12.1%), Management (4,221 | 10.0%), Education Instruction & Library (3,358 | 8.0%), Computers, Engineering & Science (3,069 | 7.3%), and Health Diagnosing & Treating (2,469 | 5.9%).
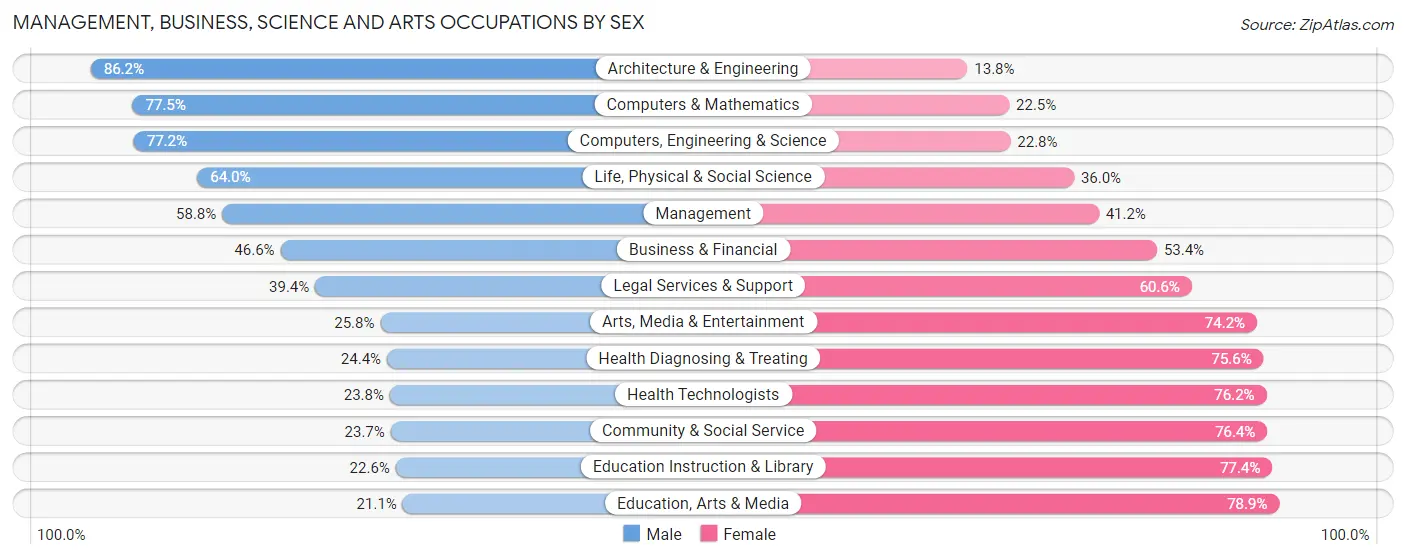
Management, Business, Science and Arts Occupations by Sex
Within the Management, Business, Science and Arts occupations in Steuben County, the most male-oriented occupations are Architecture & Engineering (86.2%), Computers & Mathematics (77.5%), and Computers, Engineering & Science (77.2%), while the most female-oriented occupations are Education, Arts & Media (78.9%), Education Instruction & Library (77.4%), and Community & Social Service (76.3%).
| Occupation | Male | Female |
| Management | 2,482 (58.8%) | 1,739 (41.2%) |
| Business & Financial | 777 (46.6%) | 889 (53.4%) |
| Computers, Engineering & Science | 2,370 (77.2%) | 699 (22.8%) |
| Computers & Mathematics | 571 (77.5%) | 166 (22.5%) |
| Architecture & Engineering | 1,192 (86.2%) | 191 (13.8%) |
| Life, Physical & Social Science | 607 (64.0%) | 342 (36.0%) |
| Community & Social Service | 1,204 (23.6%) | 3,887 (76.3%) |
| Education, Arts & Media | 216 (21.1%) | 806 (78.9%) |
| Legal Services & Support | 132 (39.4%) | 203 (60.6%) |
| Education Instruction & Library | 759 (22.6%) | 2,599 (77.4%) |
| Arts, Media & Entertainment | 97 (25.8%) | 279 (74.2%) |
| Health Diagnosing & Treating | 603 (24.4%) | 1,866 (75.6%) |
| Health Technologists | 408 (23.8%) | 1,305 (76.2%) |
| Total (Category) | 7,436 (45.0%) | 9,080 (55.0%) |
| Total (Overall) | 22,203 (52.7%) | 19,946 (47.3%) |
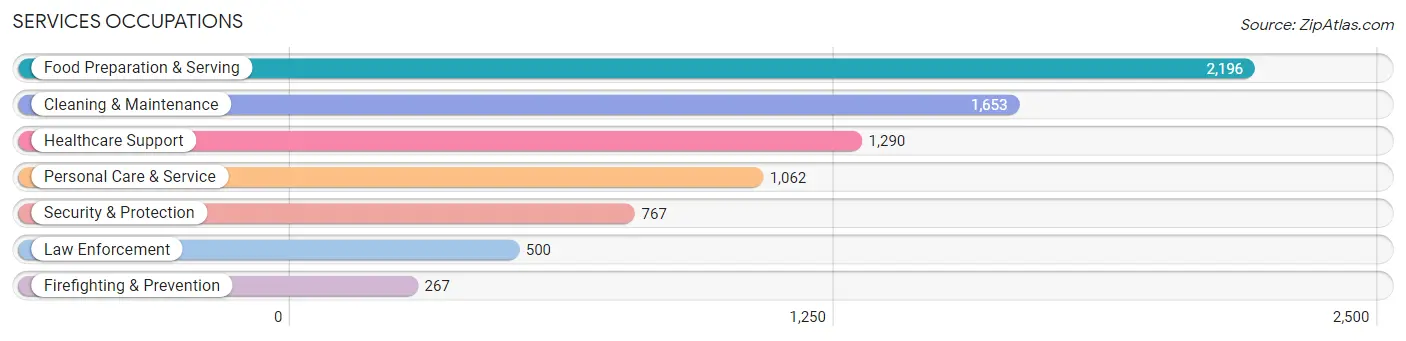
Services Occupations
The most common Services occupations in Steuben County are Food Preparation & Serving (2,196 | 5.2%), Cleaning & Maintenance (1,653 | 3.9%), Healthcare Support (1,290 | 3.1%), Personal Care & Service (1,062 | 2.5%), and Security & Protection (767 | 1.8%).
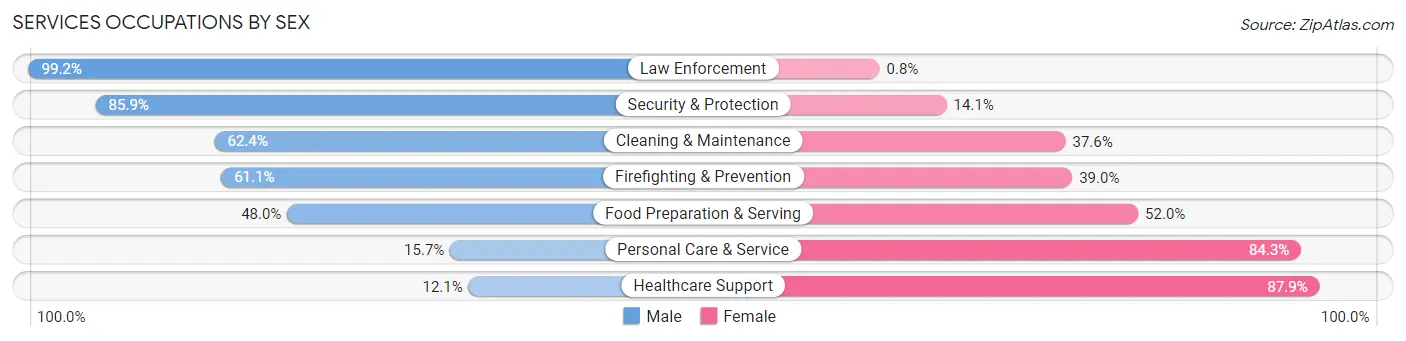
Services Occupations by Sex
Within the Services occupations in Steuben County, the most male-oriented occupations are Law Enforcement (99.2%), Security & Protection (85.9%), and Cleaning & Maintenance (62.4%), while the most female-oriented occupations are Healthcare Support (87.9%), Personal Care & Service (84.3%), and Food Preparation & Serving (52.0%).
| Occupation | Male | Female |
| Healthcare Support | 156 (12.1%) | 1,134 (87.9%) |
| Security & Protection | 659 (85.9%) | 108 (14.1%) |
| Firefighting & Prevention | 163 (61.1%) | 104 (39.0%) |
| Law Enforcement | 496 (99.2%) | 4 (0.8%) |
| Food Preparation & Serving | 1,054 (48.0%) | 1,142 (52.0%) |
| Cleaning & Maintenance | 1,031 (62.4%) | 622 (37.6%) |
| Personal Care & Service | 167 (15.7%) | 895 (84.3%) |
| Total (Category) | 3,067 (44.0%) | 3,901 (56.0%) |
| Total (Overall) | 22,203 (52.7%) | 19,946 (47.3%) |
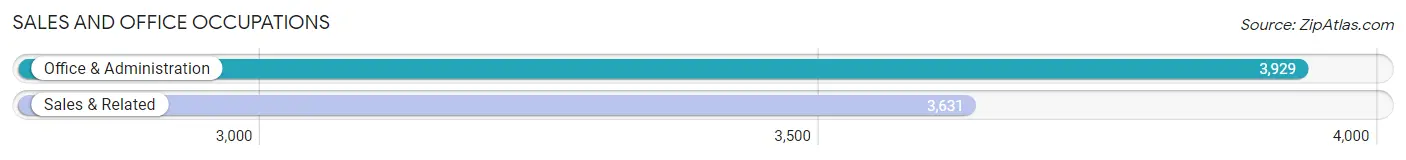
Sales and Office Occupations
The most common Sales and Office occupations in Steuben County are Office & Administration (3,929 | 9.3%), and Sales & Related (3,631 | 8.6%).
Sales and Office Occupations by Sex
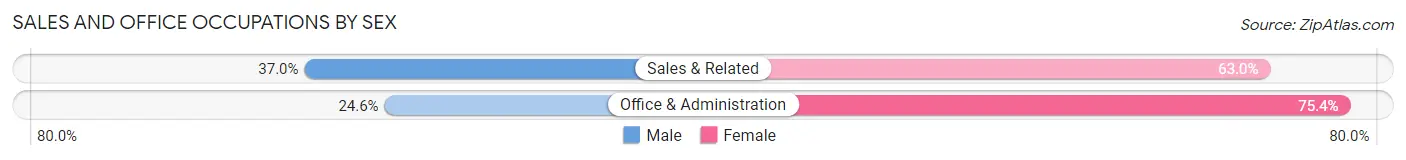
| Occupation | Male | Female |
| Sales & Related | 1,342 (37.0%) | 2,289 (63.0%) |
| Office & Administration | 968 (24.6%) | 2,961 (75.4%) |
| Total (Category) | 2,310 (30.6%) | 5,250 (69.4%) |
| Total (Overall) | 22,203 (52.7%) | 19,946 (47.3%) |
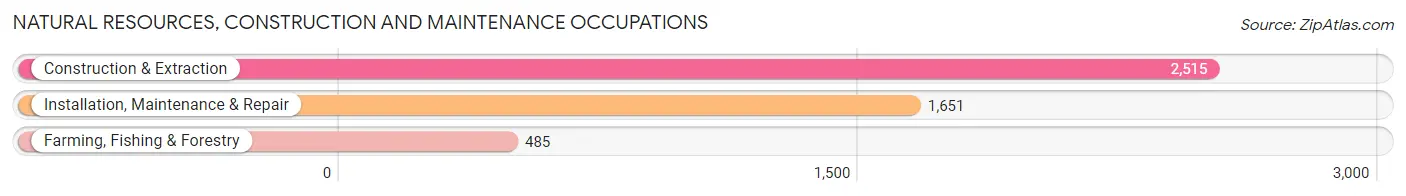
Natural Resources, Construction and Maintenance Occupations
The most common Natural Resources, Construction and Maintenance occupations in Steuben County are Construction & Extraction (2,515 | 6.0%), Installation, Maintenance & Repair (1,651 | 3.9%), and Farming, Fishing & Forestry (485 | 1.1%).
Natural Resources, Construction and Maintenance Occupations by Sex
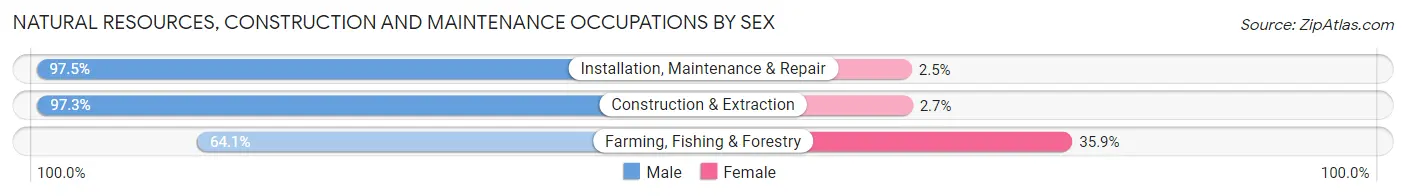
| Occupation | Male | Female |
| Farming, Fishing & Forestry | 311 (64.1%) | 174 (35.9%) |
| Construction & Extraction | 2,448 (97.3%) | 67 (2.7%) |
| Installation, Maintenance & Repair | 1,610 (97.5%) | 41 (2.5%) |
| Total (Category) | 4,369 (93.9%) | 282 (6.1%) |
| Total (Overall) | 22,203 (52.7%) | 19,946 (47.3%) |
Production, Transportation and Moving Occupations
The most common Production, Transportation and Moving occupations in Steuben County are Production (3,195 | 7.6%), Material Moving (1,637 | 3.9%), and Transportation (1,622 | 3.8%).
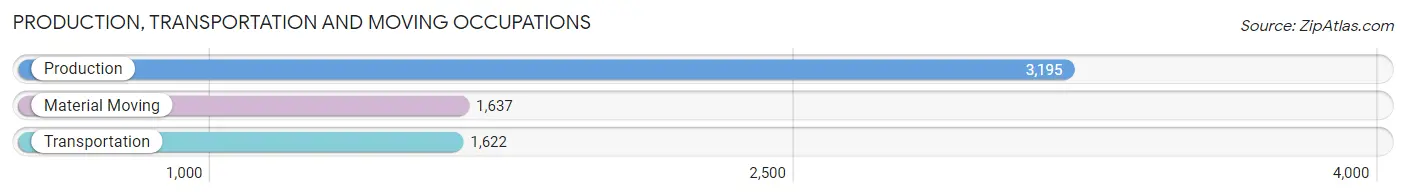
Production, Transportation and Moving Occupations by Sex
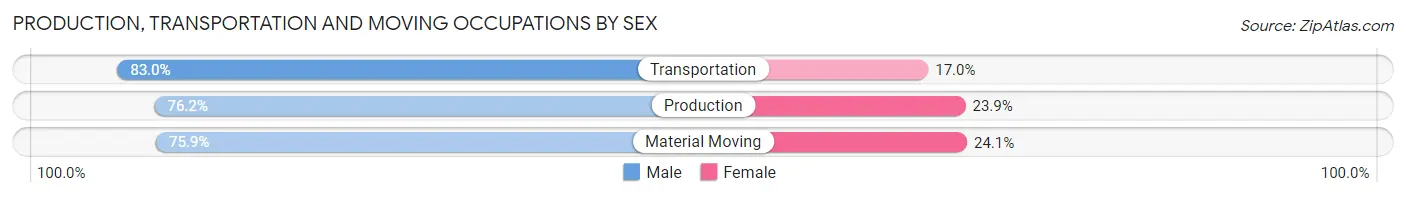
| Occupation | Male | Female |
| Production | 2,433 (76.1%) | 762 (23.8%) |
| Transportation | 1,346 (83.0%) | 276 (17.0%) |
| Material Moving | 1,242 (75.9%) | 395 (24.1%) |
| Total (Category) | 5,021 (77.8%) | 1,433 (22.2%) |
| Total (Overall) | 22,203 (52.7%) | 19,946 (47.3%) |
Employment Industries by Sex in Steuben County
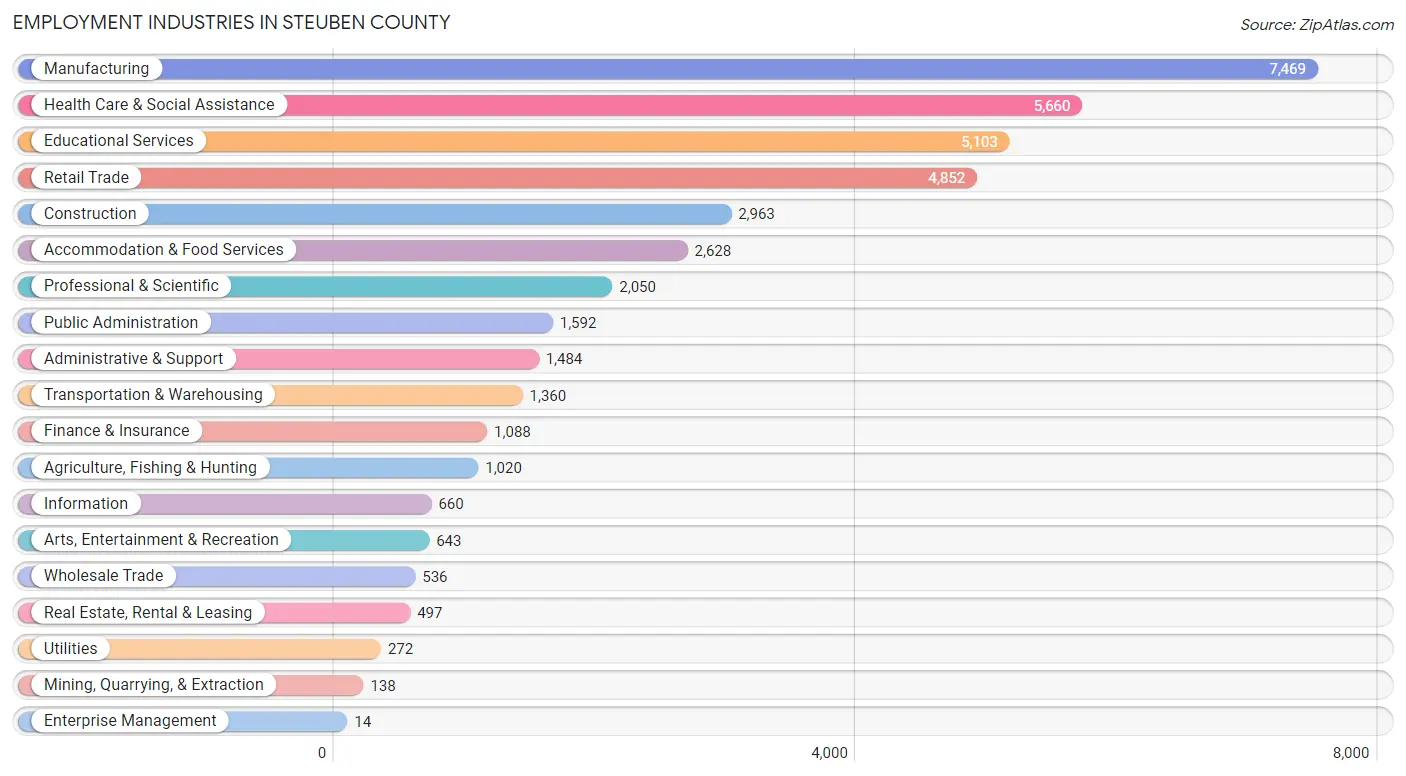
Employment Industries in Steuben County
The major employment industries in Steuben County include Manufacturing (7,469 | 17.7%), Health Care & Social Assistance (5,660 | 13.4%), Educational Services (5,103 | 12.1%), Retail Trade (4,852 | 11.5%), and Construction (2,963 | 7.0%).
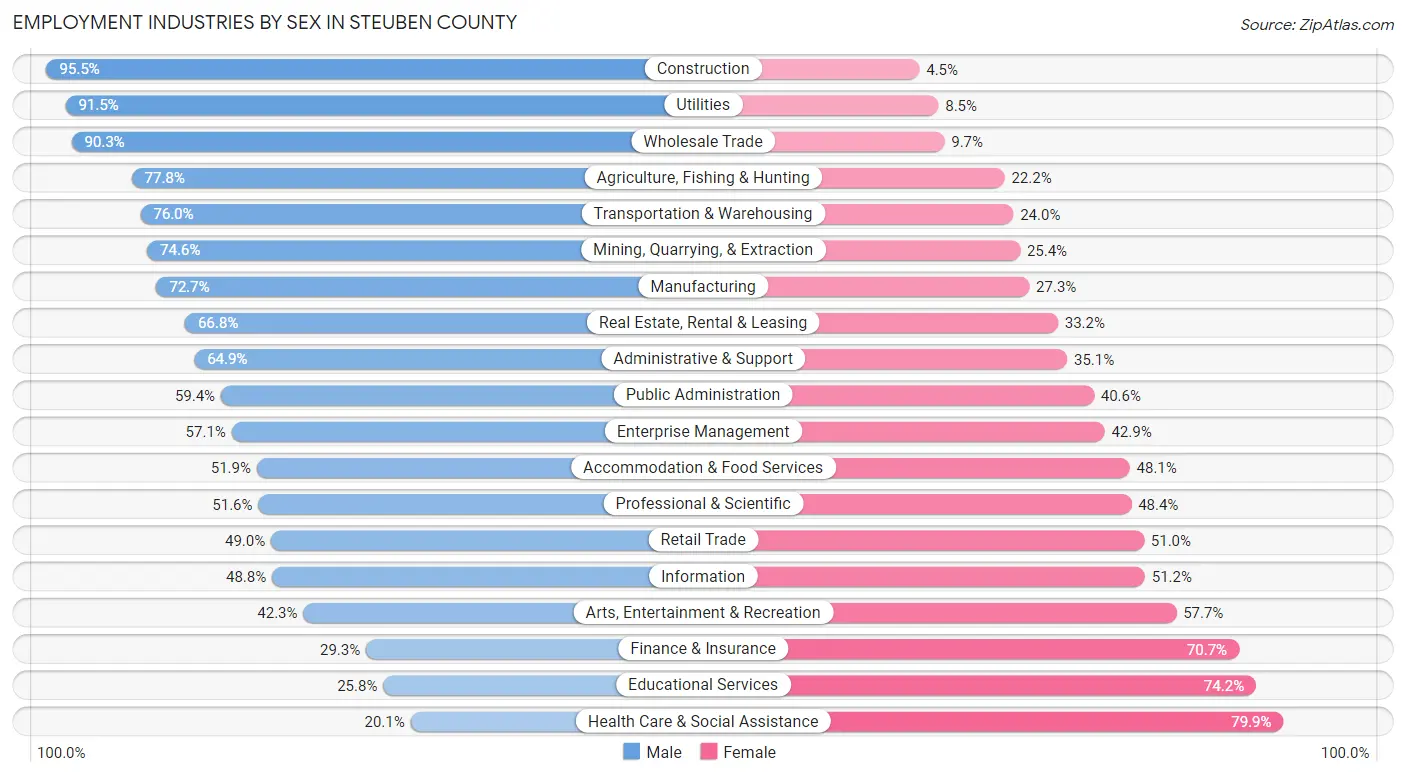
Employment Industries by Sex in Steuben County
The Steuben County industries that see more men than women are Construction (95.5%), Utilities (91.5%), and Wholesale Trade (90.3%), whereas the industries that tend to have a higher number of women are Health Care & Social Assistance (79.9%), Educational Services (74.2%), and Finance & Insurance (70.7%).
| Industry | Male | Female |
| Agriculture, Fishing & Hunting | 794 (77.8%) | 226 (22.2%) |
| Mining, Quarrying, & Extraction | 103 (74.6%) | 35 (25.4%) |
| Construction | 2,829 (95.5%) | 134 (4.5%) |
| Manufacturing | 5,432 (72.7%) | 2,037 (27.3%) |
| Wholesale Trade | 484 (90.3%) | 52 (9.7%) |
| Retail Trade | 2,377 (49.0%) | 2,475 (51.0%) |
| Transportation & Warehousing | 1,034 (76.0%) | 326 (24.0%) |
| Utilities | 249 (91.5%) | 23 (8.5%) |
| Information | 322 (48.8%) | 338 (51.2%) |
| Finance & Insurance | 319 (29.3%) | 769 (70.7%) |
| Real Estate, Rental & Leasing | 332 (66.8%) | 165 (33.2%) |
| Professional & Scientific | 1,058 (51.6%) | 992 (48.4%) |
| Enterprise Management | 8 (57.1%) | 6 (42.9%) |
| Administrative & Support | 963 (64.9%) | 521 (35.1%) |
| Educational Services | 1,315 (25.8%) | 3,788 (74.2%) |
| Health Care & Social Assistance | 1,139 (20.1%) | 4,521 (79.9%) |
| Arts, Entertainment & Recreation | 272 (42.3%) | 371 (57.7%) |
| Accommodation & Food Services | 1,365 (51.9%) | 1,263 (48.1%) |
| Public Administration | 945 (59.4%) | 647 (40.6%) |
| Total | 22,203 (52.7%) | 19,946 (47.3%) |
Education in Steuben County
School Enrollment in Steuben County
The most common levels of schooling among the 18,535 students in Steuben County are middle school (4,575 | 24.7%), high school (4,541 | 24.5%), and elementary school (4,210 | 22.7%).
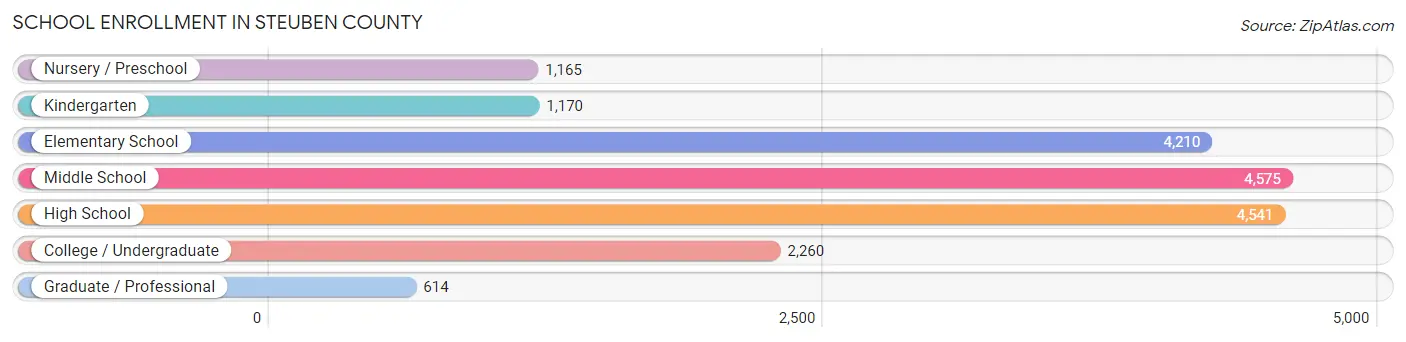
| School Level | # Students | % Students |
| Nursery / Preschool | 1,165 | 6.3% |
| Kindergarten | 1,170 | 6.3% |
| Elementary School | 4,210 | 22.7% |
| Middle School | 4,575 | 24.7% |
| High School | 4,541 | 24.5% |
| College / Undergraduate | 2,260 | 12.2% |
| Graduate / Professional | 614 | 3.3% |
| Total | 18,535 | 100.0% |
School Enrollment by Age by Funding Source in Steuben County
Out of a total of 18,535 students who are enrolled in schools in Steuben County, 2,243 (12.1%) attend a private institution, while the remaining 16,292 (87.9%) are enrolled in public schools. The age group of 35 years and over has the highest likelihood of being enrolled in private schools, with 245 (35.6% in the age bracket) enrolled. Conversely, the age group of 15 to 17 year olds has the lowest likelihood of being enrolled in a private school, with 3,251 (95.0% in the age bracket) attending a public institution.
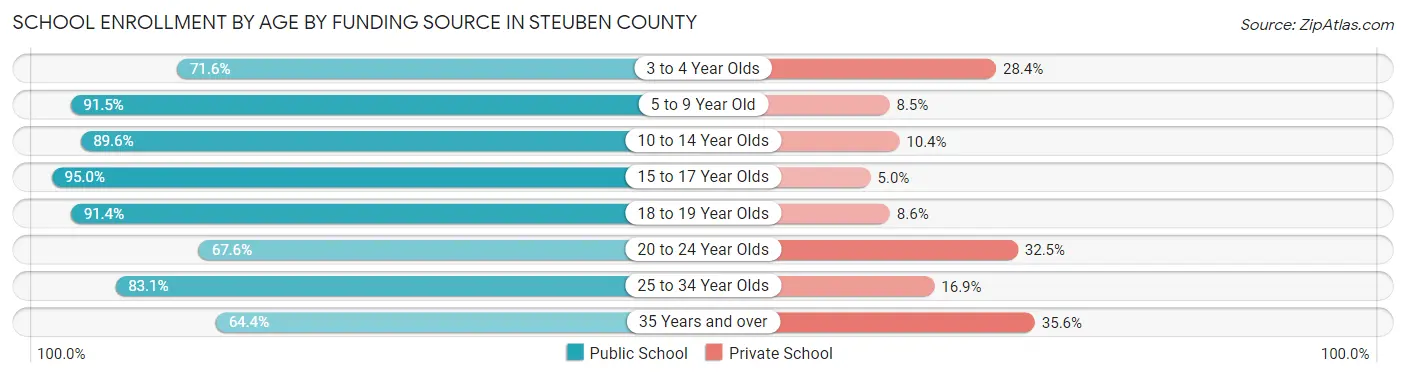
| Age Bracket | Public School | Private School |
| 3 to 4 Year Olds | 724 (71.6%) | 287 (28.4%) |
| 5 to 9 Year Old | 4,571 (91.5%) | 427 (8.5%) |
| 10 to 14 Year Olds | 5,091 (89.6%) | 589 (10.4%) |
| 15 to 17 Year Olds | 3,251 (95.0%) | 172 (5.0%) |
| 18 to 19 Year Olds | 1,029 (91.4%) | 97 (8.6%) |
| 20 to 24 Year Olds | 691 (67.5%) | 332 (32.5%) |
| 25 to 34 Year Olds | 487 (83.1%) | 99 (16.9%) |
| 35 Years and over | 443 (64.4%) | 245 (35.6%) |
| Total | 16,292 (87.9%) | 2,243 (12.1%) |
Educational Attainment by Field of Study in Steuben County
Education (3,627 | 19.7%), business (2,467 | 13.4%), engineering (2,061 | 11.2%), science & technology (1,874 | 10.2%), and physical & health sciences (1,090 | 5.9%) are the most common fields of study among 18,442 individuals in Steuben County who have obtained a bachelor's degree or higher.
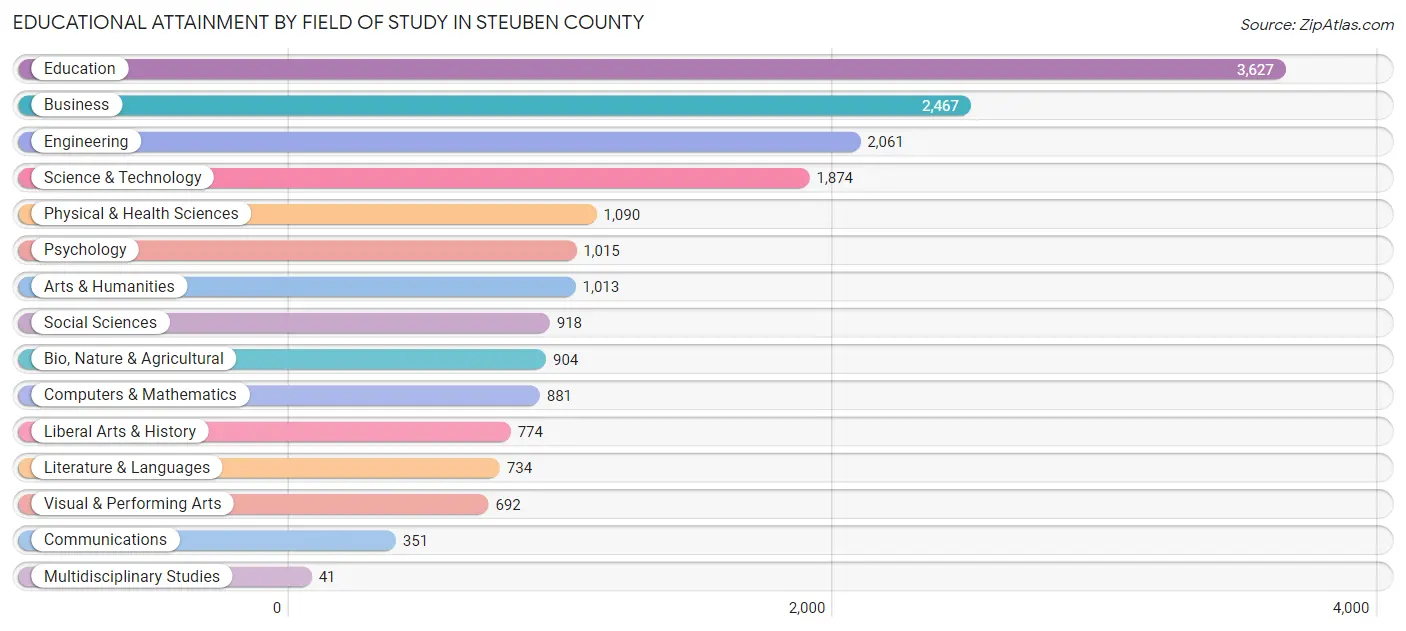
| Field of Study | # Graduates | % Graduates |
| Computers & Mathematics | 881 | 4.8% |
| Bio, Nature & Agricultural | 904 | 4.9% |
| Physical & Health Sciences | 1,090 | 5.9% |
| Psychology | 1,015 | 5.5% |
| Social Sciences | 918 | 5.0% |
| Engineering | 2,061 | 11.2% |
| Multidisciplinary Studies | 41 | 0.2% |
| Science & Technology | 1,874 | 10.2% |
| Business | 2,467 | 13.4% |
| Education | 3,627 | 19.7% |
| Literature & Languages | 734 | 4.0% |
| Liberal Arts & History | 774 | 4.2% |
| Visual & Performing Arts | 692 | 3.7% |
| Communications | 351 | 1.9% |
| Arts & Humanities | 1,013 | 5.5% |
| Total | 18,442 | 100.0% |
Transportation & Commute in Steuben County
Vehicle Availability by Sex in Steuben County
The most prevalent vehicle ownership categories in Steuben County are males with 2 vehicles (9,620, accounting for 44.1%) and females with 2 vehicles (8,540, making up 49.6%).
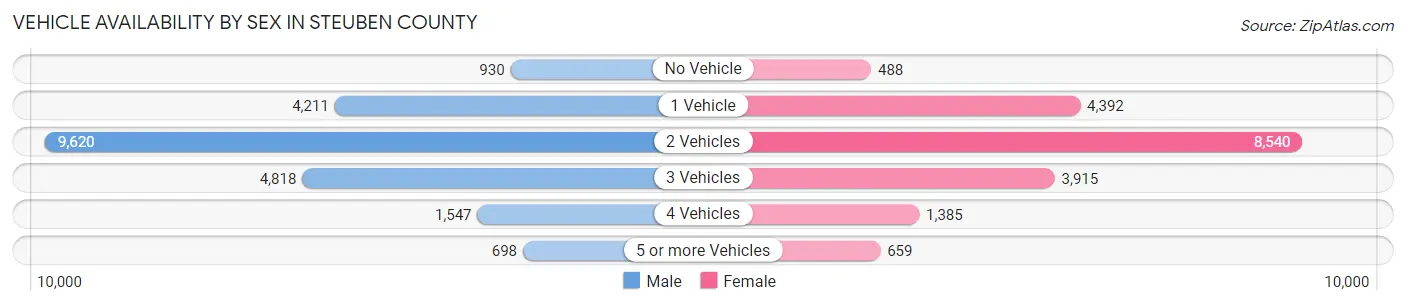
| Vehicles Available | Male | Female |
| No Vehicle | 930 (4.3%) | 488 (2.5%) |
| 1 Vehicle | 4,211 (19.3%) | 4,392 (22.7%) |
| 2 Vehicles | 9,620 (44.1%) | 8,540 (44.1%) |
| 3 Vehicles | 4,818 (22.1%) | 3,915 (20.2%) |
| 4 Vehicles | 1,547 (7.1%) | 1,385 (7.1%) |
| 5 or more Vehicles | 698 (3.2%) | 659 (3.4%) |
| Total | 21,824 (100.0%) | 19,379 (100.0%) |
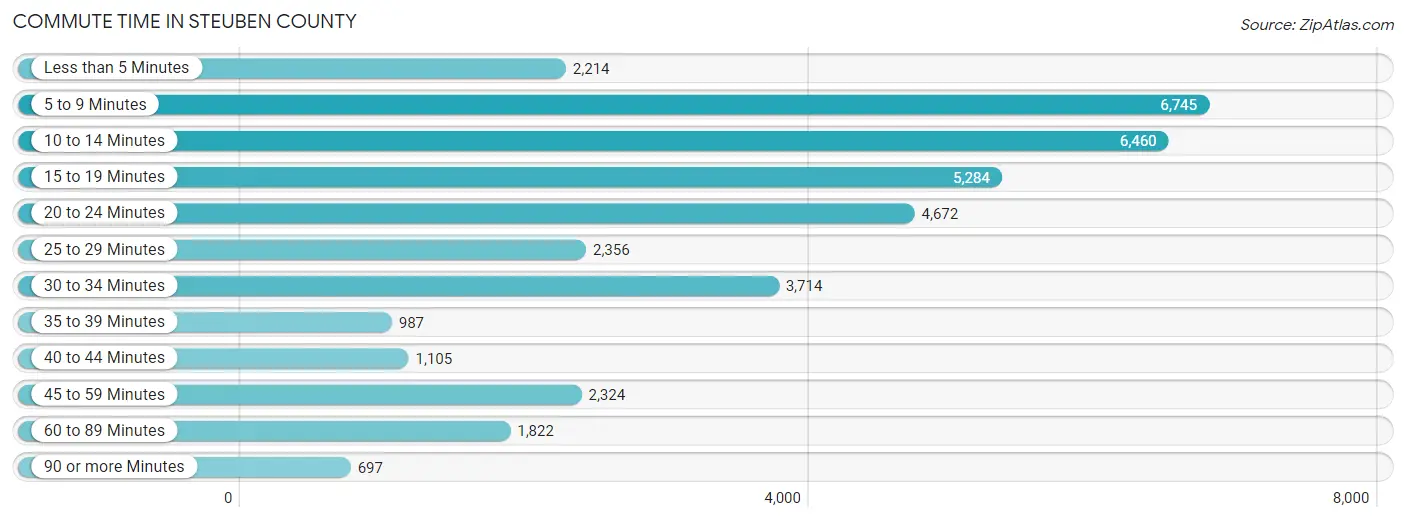
Commute Time in Steuben County
The most frequently occuring commute durations in Steuben County are 5 to 9 minutes (6,745 commuters, 17.6%), 10 to 14 minutes (6,460 commuters, 16.8%), and 15 to 19 minutes (5,284 commuters, 13.8%).
| Commute Time | # Commuters | % Commuters |
| Less than 5 Minutes | 2,214 | 5.8% |
| 5 to 9 Minutes | 6,745 | 17.6% |
| 10 to 14 Minutes | 6,460 | 16.8% |
| 15 to 19 Minutes | 5,284 | 13.8% |
| 20 to 24 Minutes | 4,672 | 12.2% |
| 25 to 29 Minutes | 2,356 | 6.1% |
| 30 to 34 Minutes | 3,714 | 9.7% |
| 35 to 39 Minutes | 987 | 2.6% |
| 40 to 44 Minutes | 1,105 | 2.9% |
| 45 to 59 Minutes | 2,324 | 6.1% |
| 60 to 89 Minutes | 1,822 | 4.8% |
| 90 or more Minutes | 697 | 1.8% |
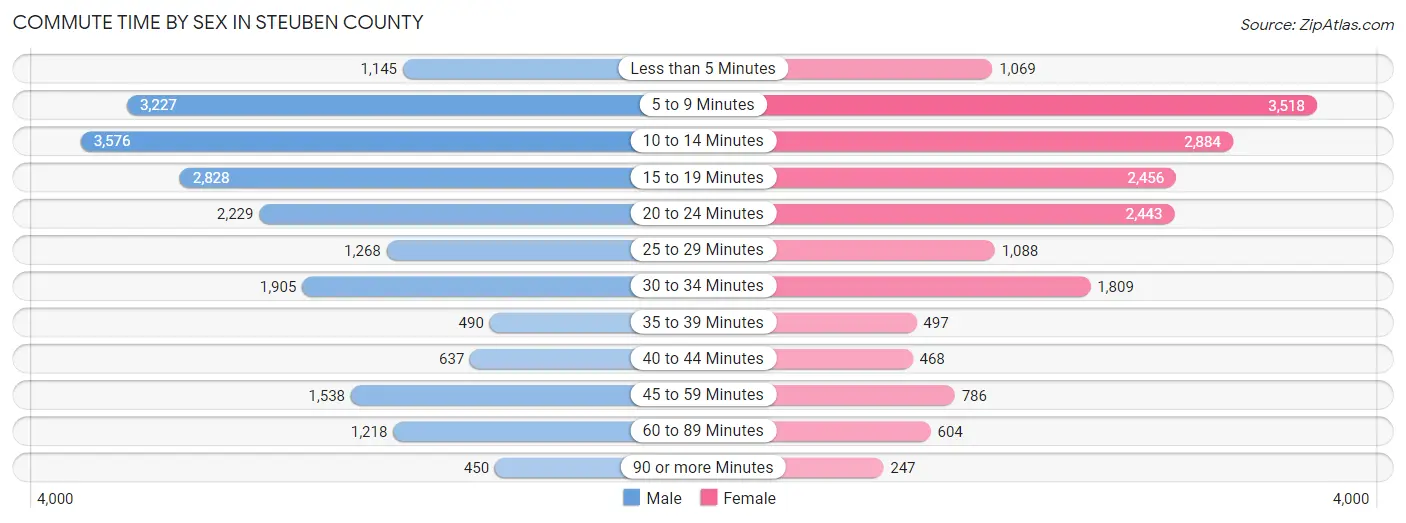
Commute Time by Sex in Steuben County
The most common commute times in Steuben County are 10 to 14 minutes (3,576 commuters, 17.4%) for males and 5 to 9 minutes (3,518 commuters, 19.7%) for females.
| Commute Time | Male | Female |
| Less than 5 Minutes | 1,145 (5.6%) | 1,069 (6.0%) |
| 5 to 9 Minutes | 3,227 (15.7%) | 3,518 (19.7%) |
| 10 to 14 Minutes | 3,576 (17.4%) | 2,884 (16.1%) |
| 15 to 19 Minutes | 2,828 (13.8%) | 2,456 (13.7%) |
| 20 to 24 Minutes | 2,229 (10.9%) | 2,443 (13.7%) |
| 25 to 29 Minutes | 1,268 (6.2%) | 1,088 (6.1%) |
| 30 to 34 Minutes | 1,905 (9.3%) | 1,809 (10.1%) |
| 35 to 39 Minutes | 490 (2.4%) | 497 (2.8%) |
| 40 to 44 Minutes | 637 (3.1%) | 468 (2.6%) |
| 45 to 59 Minutes | 1,538 (7.5%) | 786 (4.4%) |
| 60 to 89 Minutes | 1,218 (5.9%) | 604 (3.4%) |
| 90 or more Minutes | 450 (2.2%) | 247 (1.4%) |
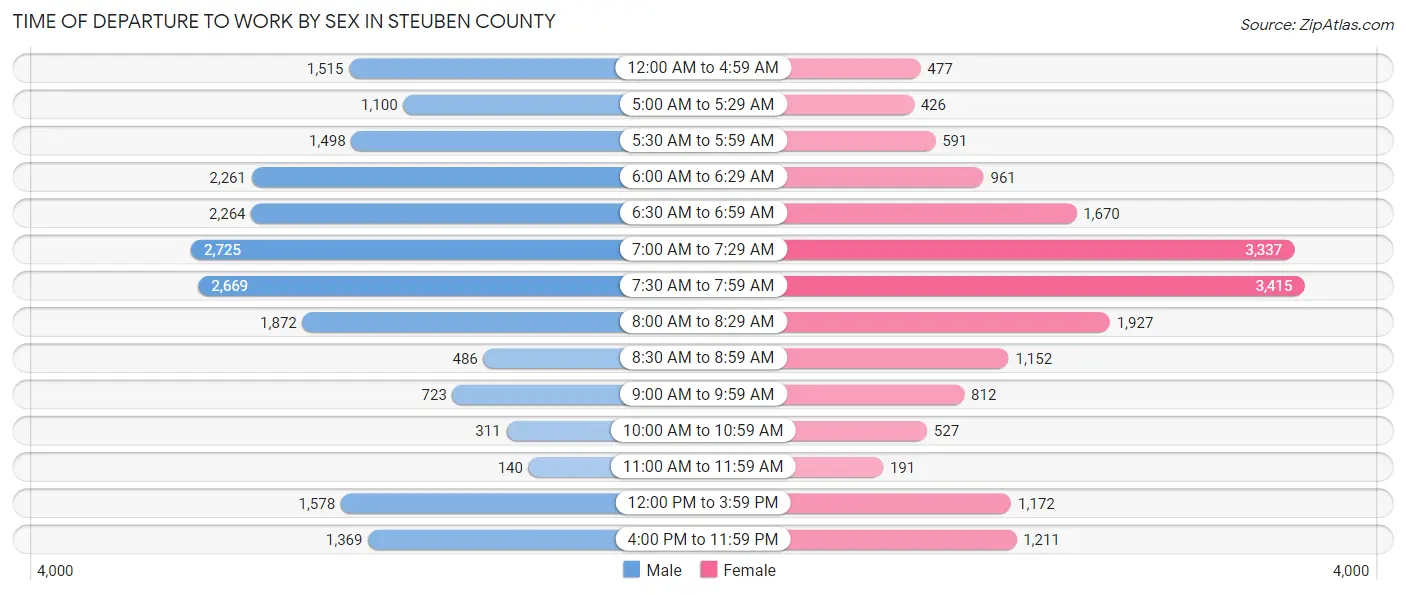
Time of Departure to Work by Sex in Steuben County
The most frequent times of departure to work in Steuben County are 7:00 AM to 7:29 AM (2,725, 13.3%) for males and 7:30 AM to 7:59 AM (3,415, 19.1%) for females.
| Time of Departure | Male | Female |
| 12:00 AM to 4:59 AM | 1,515 (7.4%) | 477 (2.7%) |
| 5:00 AM to 5:29 AM | 1,100 (5.4%) | 426 (2.4%) |
| 5:30 AM to 5:59 AM | 1,498 (7.3%) | 591 (3.3%) |
| 6:00 AM to 6:29 AM | 2,261 (11.0%) | 961 (5.4%) |
| 6:30 AM to 6:59 AM | 2,264 (11.0%) | 1,670 (9.3%) |
| 7:00 AM to 7:29 AM | 2,725 (13.3%) | 3,337 (18.7%) |
| 7:30 AM to 7:59 AM | 2,669 (13.0%) | 3,415 (19.1%) |
| 8:00 AM to 8:29 AM | 1,872 (9.1%) | 1,927 (10.8%) |
| 8:30 AM to 8:59 AM | 486 (2.4%) | 1,152 (6.5%) |
| 9:00 AM to 9:59 AM | 723 (3.5%) | 812 (4.5%) |
| 10:00 AM to 10:59 AM | 311 (1.5%) | 527 (2.9%) |
| 11:00 AM to 11:59 AM | 140 (0.7%) | 191 (1.1%) |
| 12:00 PM to 3:59 PM | 1,578 (7.7%) | 1,172 (6.6%) |
| 4:00 PM to 11:59 PM | 1,369 (6.7%) | 1,211 (6.8%) |
| Total | 20,511 (100.0%) | 17,869 (100.0%) |
Housing Occupancy in Steuben County
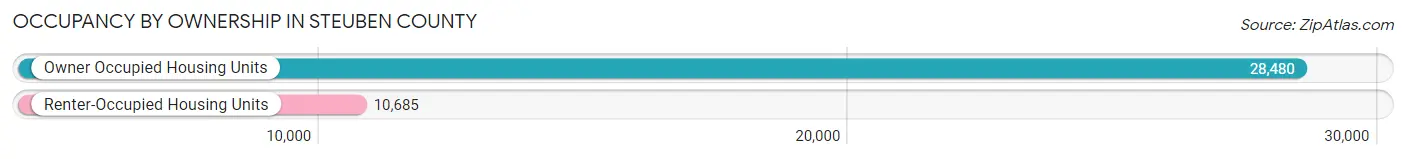
Occupancy by Ownership in Steuben County
Of the total 39,165 dwellings in Steuben County, owner-occupied units account for 28,480 (72.7%), while renter-occupied units make up 10,685 (27.3%).
| Occupancy | # Housing Units | % Housing Units |
| Owner Occupied Housing Units | 28,480 | 72.7% |
| Renter-Occupied Housing Units | 10,685 | 27.3% |
| Total Occupied Housing Units | 39,165 | 100.0% |
Occupancy by Household Size in Steuben County
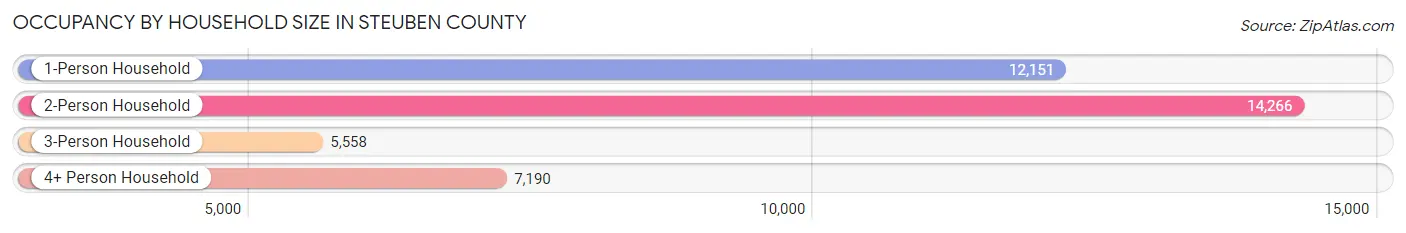
| Household Size | # Housing Units | % Housing Units |
| 1-Person Household | 12,151 | 31.0% |
| 2-Person Household | 14,266 | 36.4% |
| 3-Person Household | 5,558 | 14.2% |
| 4+ Person Household | 7,190 | 18.4% |
| Total Housing Units | 39,165 | 100.0% |
Occupancy by Ownership by Household Size in Steuben County
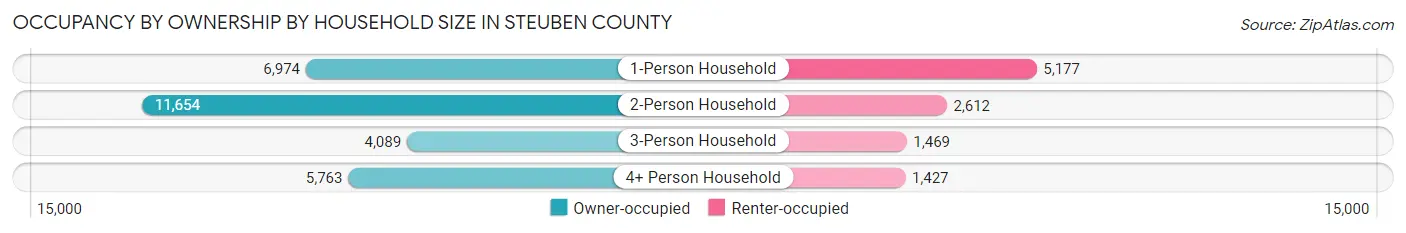
| Household Size | Owner-occupied | Renter-occupied |
| 1-Person Household | 6,974 (57.4%) | 5,177 (42.6%) |
| 2-Person Household | 11,654 (81.7%) | 2,612 (18.3%) |
| 3-Person Household | 4,089 (73.6%) | 1,469 (26.4%) |
| 4+ Person Household | 5,763 (80.1%) | 1,427 (19.9%) |
| Total Housing Units | 28,480 (72.7%) | 10,685 (27.3%) |
Occupancy by Educational Attainment in Steuben County
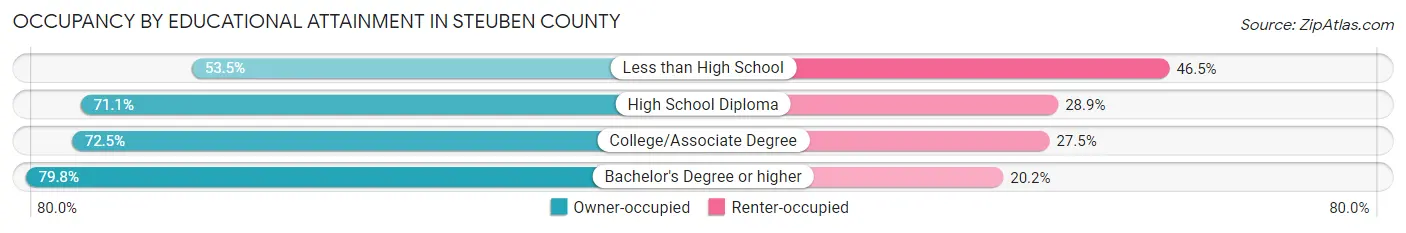
| Household Size | Owner-occupied | Renter-occupied |
| Less than High School | 1,535 (53.5%) | 1,335 (46.5%) |
| High School Diploma | 9,040 (71.1%) | 3,671 (28.9%) |
| College/Associate Degree | 9,139 (72.5%) | 3,464 (27.5%) |
| Bachelor's Degree or higher | 8,766 (79.8%) | 2,215 (20.2%) |
Occupancy by Age of Householder in Steuben County
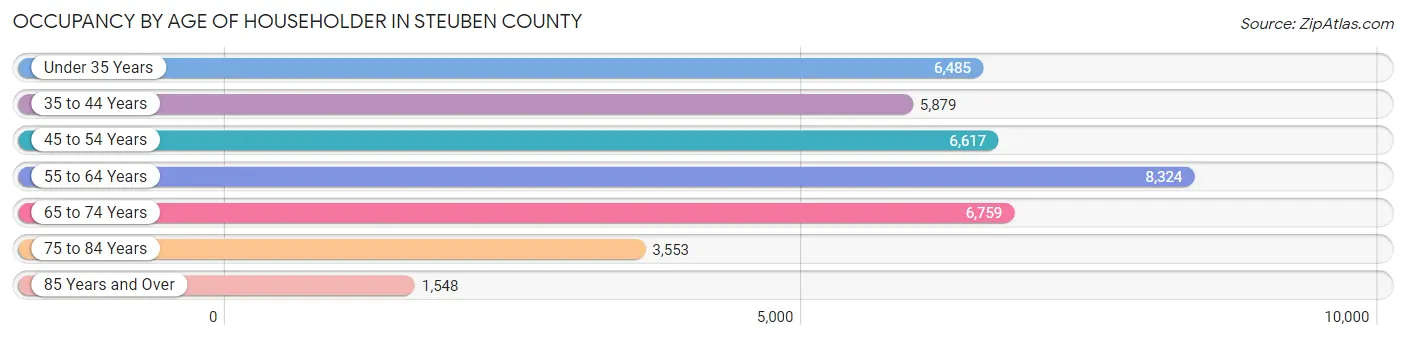
| Age Bracket | # Households | % Households |
| Under 35 Years | 6,485 | 16.6% |
| 35 to 44 Years | 5,879 | 15.0% |
| 45 to 54 Years | 6,617 | 16.9% |
| 55 to 64 Years | 8,324 | 21.2% |
| 65 to 74 Years | 6,759 | 17.3% |
| 75 to 84 Years | 3,553 | 9.1% |
| 85 Years and Over | 1,548 | 4.0% |
| Total | 39,165 | 100.0% |
Housing Finances in Steuben County
Median Income by Occupancy in Steuben County
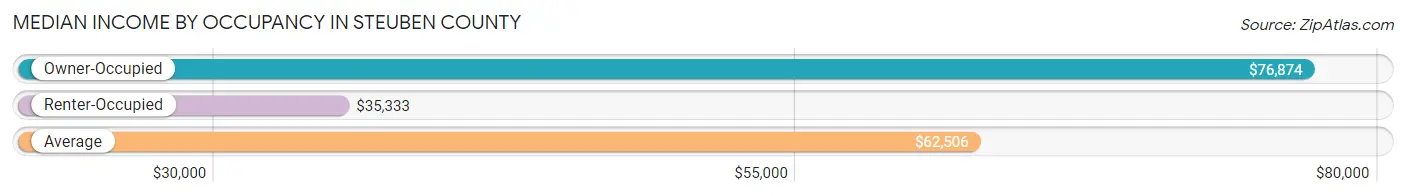
| Occupancy Type | # Households | Median Income |
| Owner-Occupied | 28,480 (72.7%) | $76,874 |
| Renter-Occupied | 10,685 (27.3%) | $35,333 |
| Average | 39,165 (100.0%) | $62,506 |
Occupancy by Householder Income Bracket in Steuben County
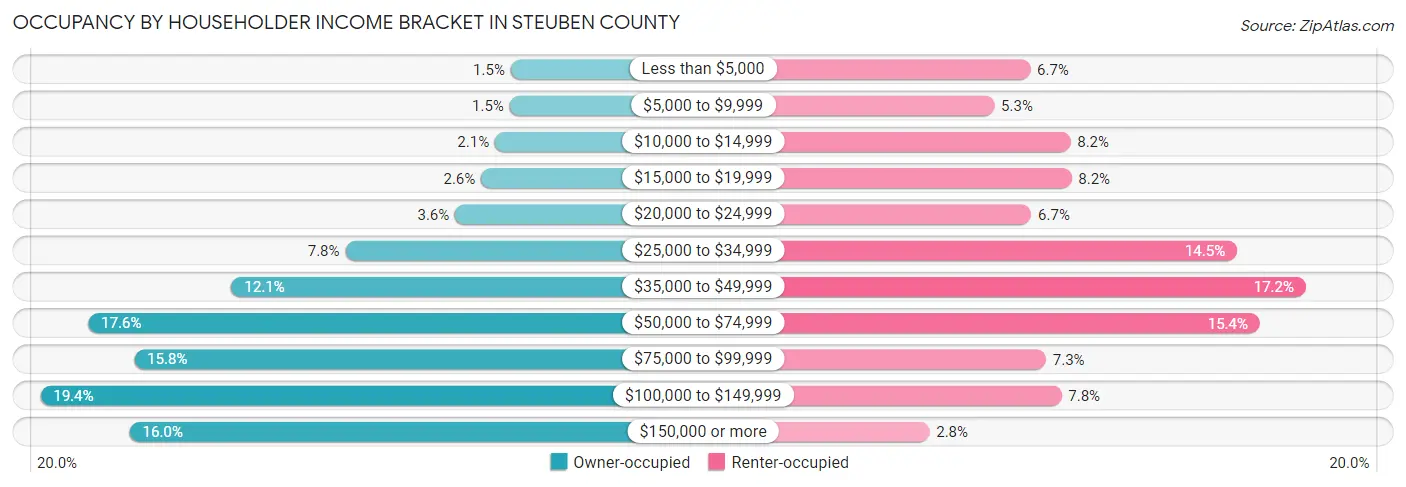
| Income Bracket | Owner-occupied | Renter-occupied |
| Less than $5,000 | 421 (1.5%) | 711 (6.7%) |
| $5,000 to $9,999 | 434 (1.5%) | 564 (5.3%) |
| $10,000 to $14,999 | 593 (2.1%) | 874 (8.2%) |
| $15,000 to $19,999 | 742 (2.6%) | 878 (8.2%) |
| $20,000 to $24,999 | 1,024 (3.6%) | 715 (6.7%) |
| $25,000 to $34,999 | 2,216 (7.8%) | 1,552 (14.5%) |
| $35,000 to $49,999 | 3,451 (12.1%) | 1,833 (17.2%) |
| $50,000 to $74,999 | 5,006 (17.6%) | 1,645 (15.4%) |
| $75,000 to $99,999 | 4,509 (15.8%) | 775 (7.2%) |
| $100,000 to $149,999 | 5,526 (19.4%) | 838 (7.8%) |
| $150,000 or more | 4,558 (16.0%) | 300 (2.8%) |
| Total | 28,480 (100.0%) | 10,685 (100.0%) |
Monthly Housing Cost Tiers in Steuben County
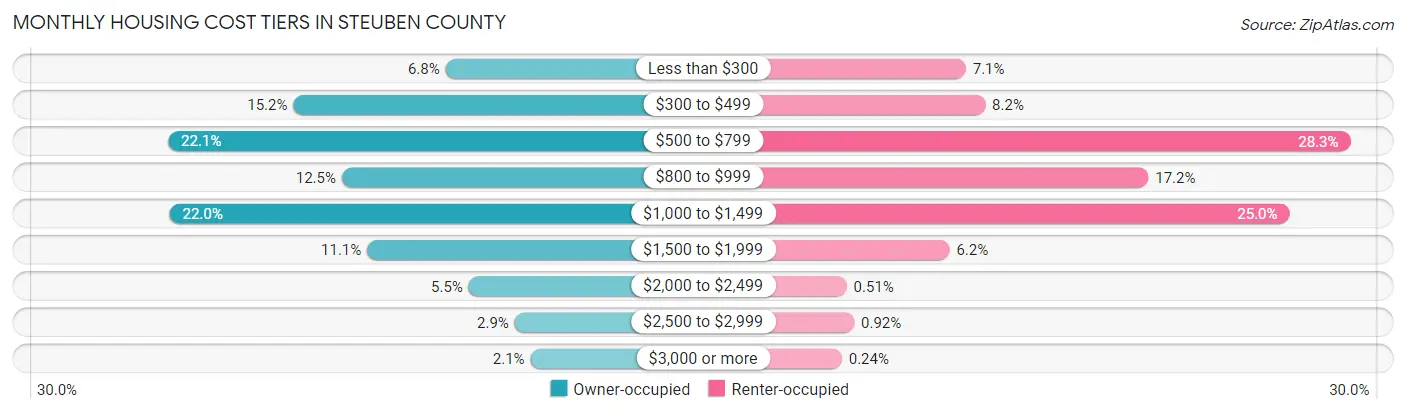
| Monthly Cost | Owner-occupied | Renter-occupied |
| Less than $300 | 1,921 (6.8%) | 758 (7.1%) |
| $300 to $499 | 4,318 (15.2%) | 872 (8.2%) |
| $500 to $799 | 6,286 (22.1%) | 3,027 (28.3%) |
| $800 to $999 | 3,555 (12.5%) | 1,835 (17.2%) |
| $1,000 to $1,499 | 6,264 (22.0%) | 2,667 (25.0%) |
| $1,500 to $1,999 | 3,157 (11.1%) | 661 (6.2%) |
| $2,000 to $2,499 | 1,557 (5.5%) | 55 (0.5%) |
| $2,500 to $2,999 | 834 (2.9%) | 98 (0.9%) |
| $3,000 or more | 588 (2.1%) | 26 (0.2%) |
| Total | 28,480 (100.0%) | 10,685 (100.0%) |
Physical Housing Characteristics in Steuben County
Housing Structures in Steuben County
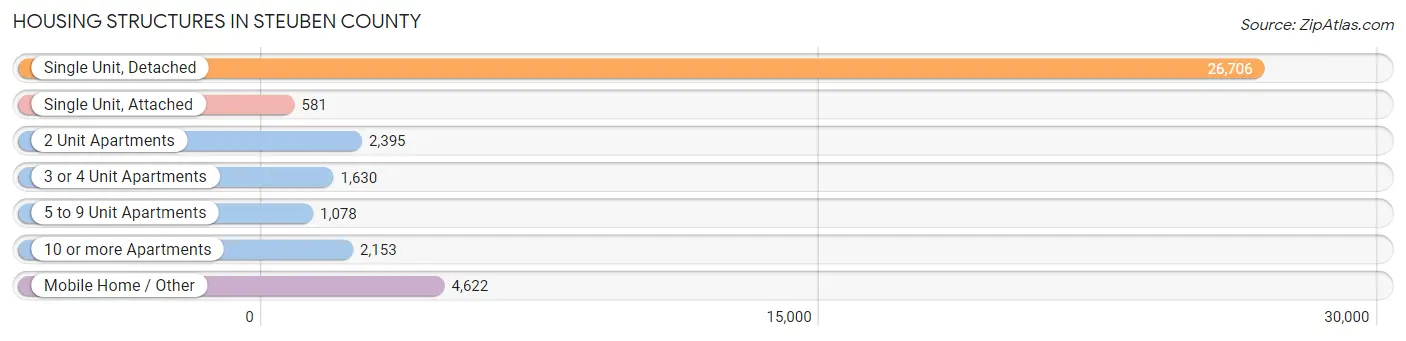
| Structure Type | # Housing Units | % Housing Units |
| Single Unit, Detached | 26,706 | 68.2% |
| Single Unit, Attached | 581 | 1.5% |
| 2 Unit Apartments | 2,395 | 6.1% |
| 3 or 4 Unit Apartments | 1,630 | 4.2% |
| 5 to 9 Unit Apartments | 1,078 | 2.8% |
| 10 or more Apartments | 2,153 | 5.5% |
| Mobile Home / Other | 4,622 | 11.8% |
| Total | 39,165 | 100.0% |
Housing Structures by Occupancy in Steuben County
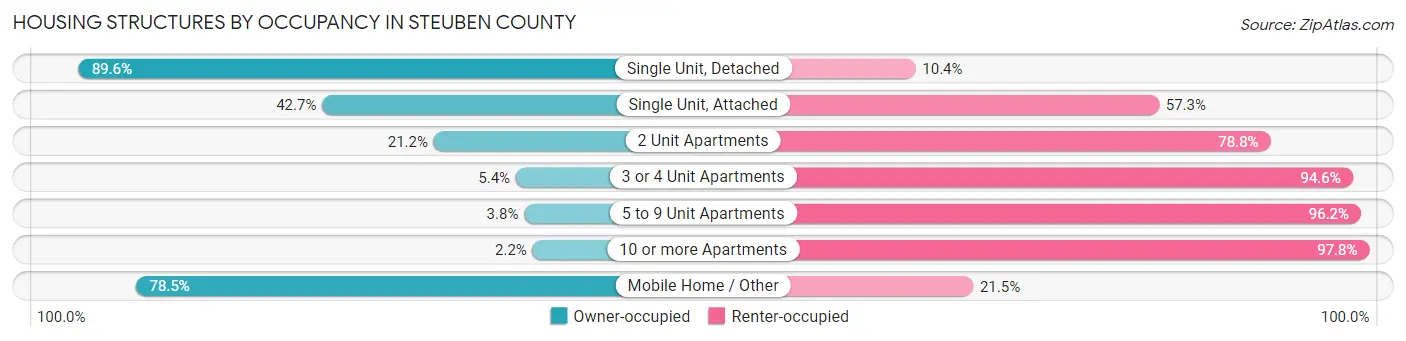
| Structure Type | Owner-occupied | Renter-occupied |
| Single Unit, Detached | 23,921 (89.6%) | 2,785 (10.4%) |
| Single Unit, Attached | 248 (42.7%) | 333 (57.3%) |
| 2 Unit Apartments | 508 (21.2%) | 1,887 (78.8%) |
| 3 or 4 Unit Apartments | 88 (5.4%) | 1,542 (94.6%) |
| 5 to 9 Unit Apartments | 41 (3.8%) | 1,037 (96.2%) |
| 10 or more Apartments | 47 (2.2%) | 2,106 (97.8%) |
| Mobile Home / Other | 3,627 (78.5%) | 995 (21.5%) |
| Total | 28,480 (72.7%) | 10,685 (27.3%) |
Housing Structures by Number of Rooms in Steuben County
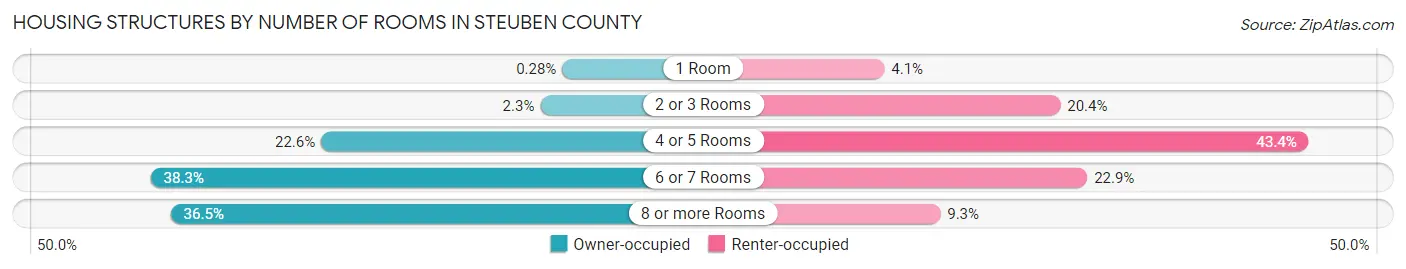
| Number of Rooms | Owner-occupied | Renter-occupied |
| 1 Room | 81 (0.3%) | 439 (4.1%) |
| 2 or 3 Rooms | 657 (2.3%) | 2,178 (20.4%) |
| 4 or 5 Rooms | 6,430 (22.6%) | 4,632 (43.3%) |
| 6 or 7 Rooms | 10,920 (38.3%) | 2,444 (22.9%) |
| 8 or more Rooms | 10,392 (36.5%) | 992 (9.3%) |
| Total | 28,480 (100.0%) | 10,685 (100.0%) |
Housing Structure by Heating Type in Steuben County
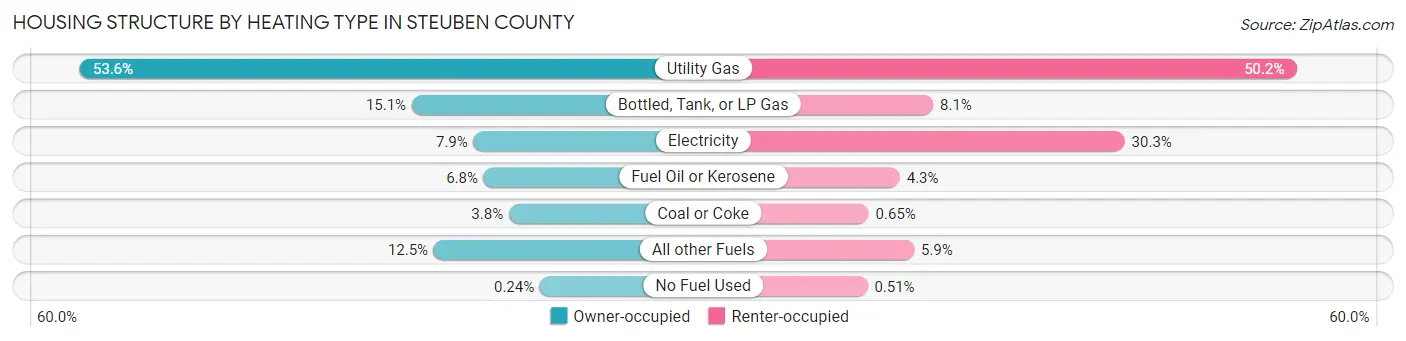
| Heating Type | Owner-occupied | Renter-occupied |
| Utility Gas | 15,263 (53.6%) | 5,366 (50.2%) |
| Bottled, Tank, or LP Gas | 4,299 (15.1%) | 868 (8.1%) |
| Electricity | 2,262 (7.9%) | 3,241 (30.3%) |
| Fuel Oil or Kerosene | 1,921 (6.8%) | 455 (4.3%) |
| Coal or Coke | 1,094 (3.8%) | 69 (0.6%) |
| All other Fuels | 3,572 (12.5%) | 632 (5.9%) |
| No Fuel Used | 69 (0.2%) | 54 (0.5%) |
| Total | 28,480 (100.0%) | 10,685 (100.0%) |
Household Vehicle Usage in Steuben County
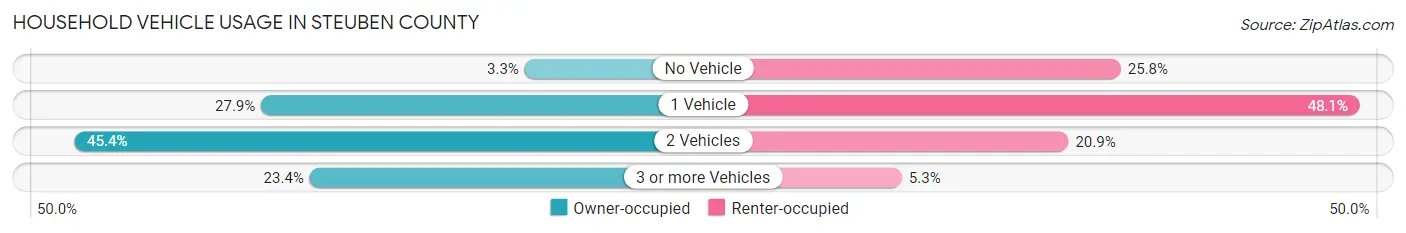
| Vehicles per Household | Owner-occupied | Renter-occupied |
| No Vehicle | 945 (3.3%) | 2,752 (25.8%) |
| 1 Vehicle | 7,951 (27.9%) | 5,135 (48.1%) |
| 2 Vehicles | 12,922 (45.4%) | 2,230 (20.9%) |
| 3 or more Vehicles | 6,662 (23.4%) | 568 (5.3%) |
| Total | 28,480 (100.0%) | 10,685 (100.0%) |
Real Estate & Mortgages in Steuben County
Real Estate and Mortgage Overview in Steuben County
| Characteristic | Without Mortgage | With Mortgage |
| Housing Units | 14,278 | 14,202 |
| Median Property Value | $102,800 | $138,300 |
| Median Household Income | $58,897 | $3,171 |
| Monthly Housing Costs | $547 | $549 |
| Real Estate Taxes | $2,606 | $399 |
Property Value by Mortgage Status in Steuben County
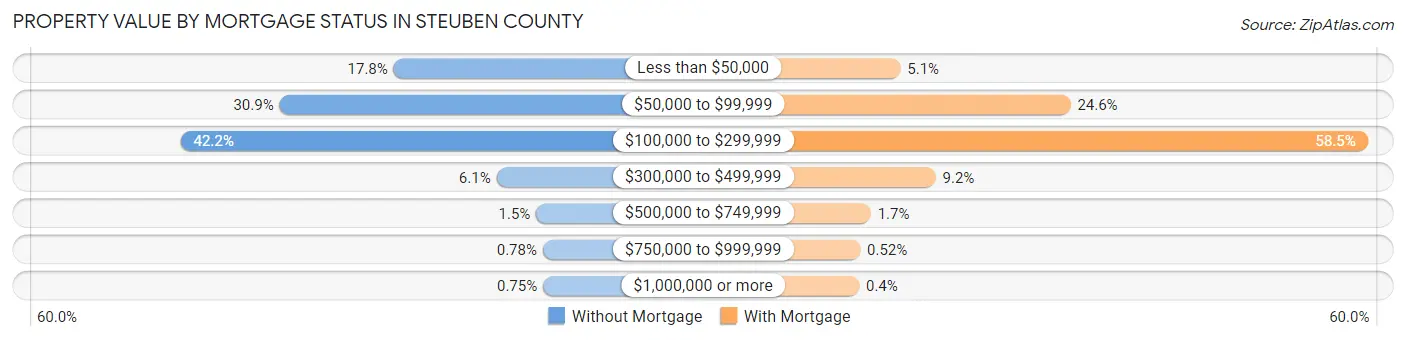
| Property Value | Without Mortgage | With Mortgage |
| Less than $50,000 | 2,546 (17.8%) | 727 (5.1%) |
| $50,000 to $99,999 | 4,407 (30.9%) | 3,488 (24.6%) |
| $100,000 to $299,999 | 6,023 (42.2%) | 8,311 (58.5%) |
| $300,000 to $499,999 | 866 (6.1%) | 1,299 (9.1%) |
| $500,000 to $749,999 | 218 (1.5%) | 246 (1.7%) |
| $750,000 to $999,999 | 111 (0.8%) | 74 (0.5%) |
| $1,000,000 or more | 107 (0.7%) | 57 (0.4%) |
| Total | 14,278 (100.0%) | 14,202 (100.0%) |
Household Income by Mortgage Status in Steuben County
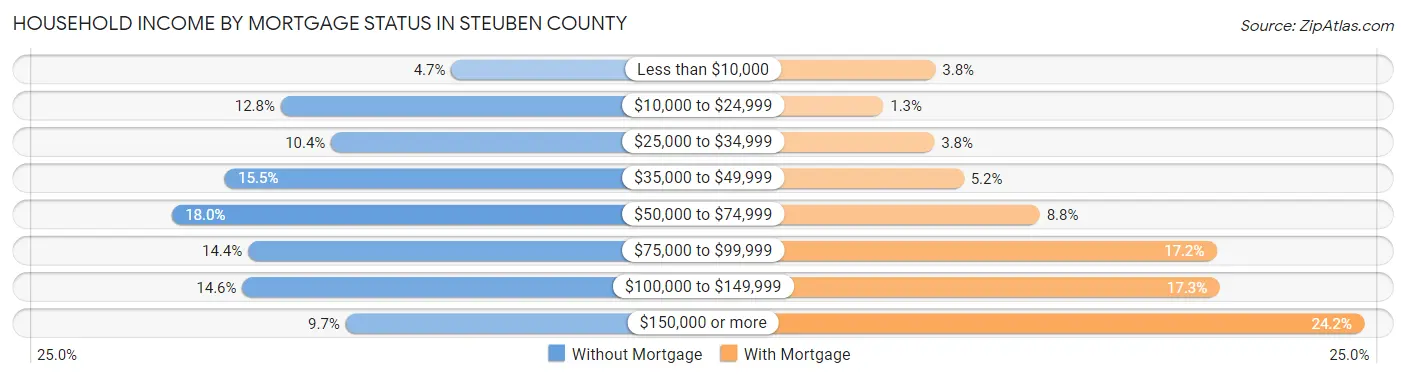
| Household Income | Without Mortgage | With Mortgage |
| Less than $10,000 | 668 (4.7%) | 539 (3.8%) |
| $10,000 to $24,999 | 1,827 (12.8%) | 187 (1.3%) |
| $25,000 to $34,999 | 1,485 (10.4%) | 532 (3.7%) |
| $35,000 to $49,999 | 2,206 (15.4%) | 731 (5.1%) |
| $50,000 to $74,999 | 2,566 (18.0%) | 1,245 (8.8%) |
| $75,000 to $99,999 | 2,050 (14.4%) | 2,440 (17.2%) |
| $100,000 to $149,999 | 2,089 (14.6%) | 2,459 (17.3%) |
| $150,000 or more | 1,387 (9.7%) | 3,437 (24.2%) |
| Total | 14,278 (100.0%) | 14,202 (100.0%) |
Property Value to Household Income Ratio in Steuben County
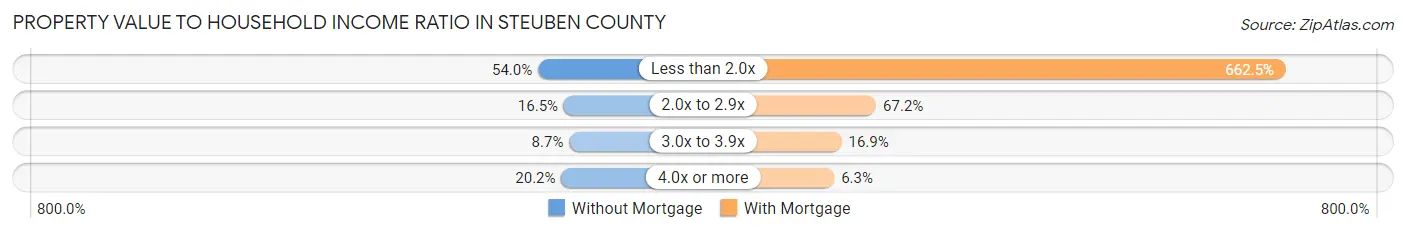
| Value-to-Income Ratio | Without Mortgage | With Mortgage |
| Less than 2.0x | 7,708 (54.0%) | 94,083 (662.5%) |
| 2.0x to 2.9x | 2,351 (16.5%) | 9,536 (67.1%) |
| 3.0x to 3.9x | 1,246 (8.7%) | 2,395 (16.9%) |
| 4.0x or more | 2,877 (20.2%) | 892 (6.3%) |
| Total | 14,278 (100.0%) | 14,202 (100.0%) |
Real Estate Taxes by Mortgage Status in Steuben County
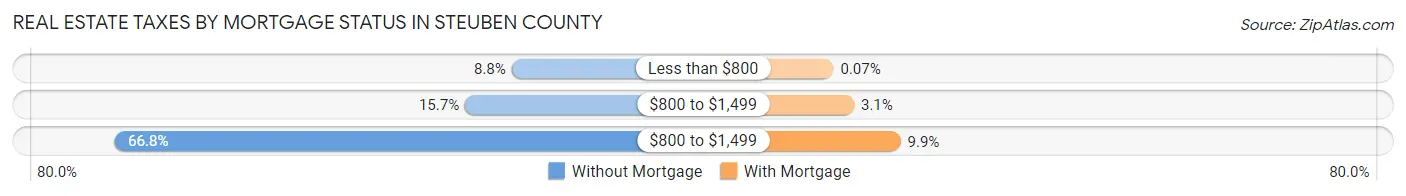
| Property Taxes | Without Mortgage | With Mortgage |
| Less than $800 | 1,262 (8.8%) | 10 (0.1%) |
| $800 to $1,499 | 2,235 (15.7%) | 436 (3.1%) |
| $800 to $1,499 | 9,535 (66.8%) | 1,402 (9.9%) |
| Total | 14,278 (100.0%) | 14,202 (100.0%) |
Health & Disability in Steuben County
Health Insurance Coverage by Age in Steuben County
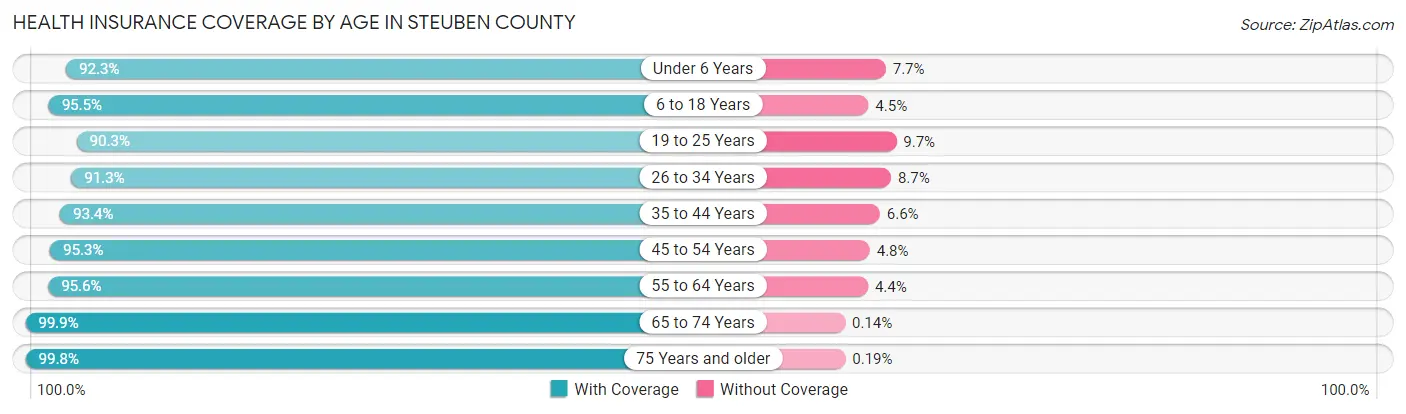
| Age Bracket | With Coverage | Without Coverage |
| Under 6 Years | 5,580 (92.3%) | 468 (7.7%) |
| 6 to 18 Years | 14,277 (95.5%) | 672 (4.5%) |
| 19 to 25 Years | 6,186 (90.3%) | 665 (9.7%) |
| 26 to 34 Years | 9,194 (91.3%) | 877 (8.7%) |
| 35 to 44 Years | 10,217 (93.4%) | 726 (6.6%) |
| 45 to 54 Years | 11,126 (95.3%) | 555 (4.8%) |
| 55 to 64 Years | 13,443 (95.6%) | 620 (4.4%) |
| 65 to 74 Years | 10,698 (99.9%) | 15 (0.1%) |
| 75 Years and older | 7,316 (99.8%) | 14 (0.2%) |
| Total | 88,037 (95.0%) | 4,612 (5.0%) |
Health Insurance Coverage by Citizenship Status in Steuben County
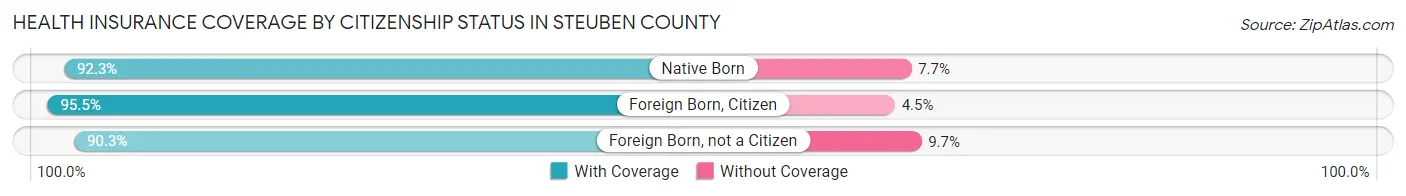
| Citizenship Status | With Coverage | Without Coverage |
| Native Born | 5,580 (92.3%) | 468 (7.7%) |
| Foreign Born, Citizen | 14,277 (95.5%) | 672 (4.5%) |
| Foreign Born, not a Citizen | 6,186 (90.3%) | 665 (9.7%) |
Health Insurance Coverage by Household Income in Steuben County
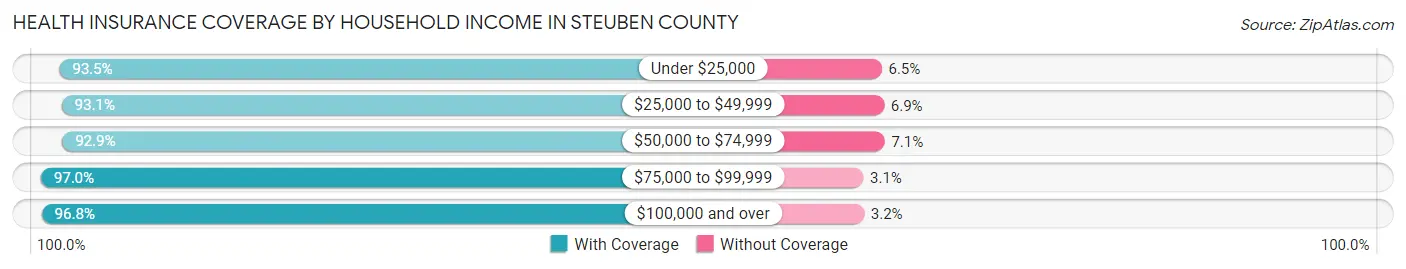
| Household Income | With Coverage | Without Coverage |
| Under $25,000 | 10,287 (93.5%) | 716 (6.5%) |
| $25,000 to $49,999 | 16,544 (93.1%) | 1,234 (6.9%) |
| $50,000 to $74,999 | 15,061 (92.9%) | 1,144 (7.1%) |
| $75,000 to $99,999 | 12,541 (97.0%) | 395 (3.0%) |
| $100,000 and over | 32,842 (96.8%) | 1,085 (3.2%) |
Public vs Private Health Insurance Coverage by Age in Steuben County
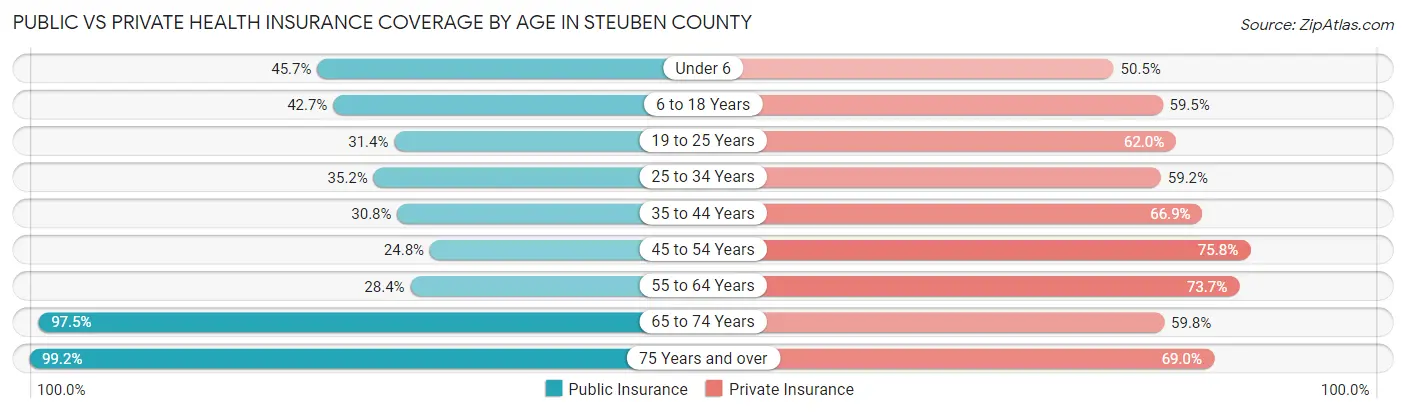
| Age Bracket | Public Insurance | Private Insurance |
| Under 6 | 2,762 (45.7%) | 3,052 (50.5%) |
| 6 to 18 Years | 6,386 (42.7%) | 8,900 (59.5%) |
| 19 to 25 Years | 2,150 (31.4%) | 4,250 (62.0%) |
| 25 to 34 Years | 3,547 (35.2%) | 5,964 (59.2%) |
| 35 to 44 Years | 3,372 (30.8%) | 7,324 (66.9%) |
| 45 to 54 Years | 2,893 (24.8%) | 8,849 (75.8%) |
| 55 to 64 Years | 3,992 (28.4%) | 10,368 (73.7%) |
| 65 to 74 Years | 10,442 (97.5%) | 6,410 (59.8%) |
| 75 Years and over | 7,270 (99.2%) | 5,060 (69.0%) |
| Total | 42,814 (46.2%) | 60,177 (64.9%) |
Disability Status by Sex by Age in Steuben County
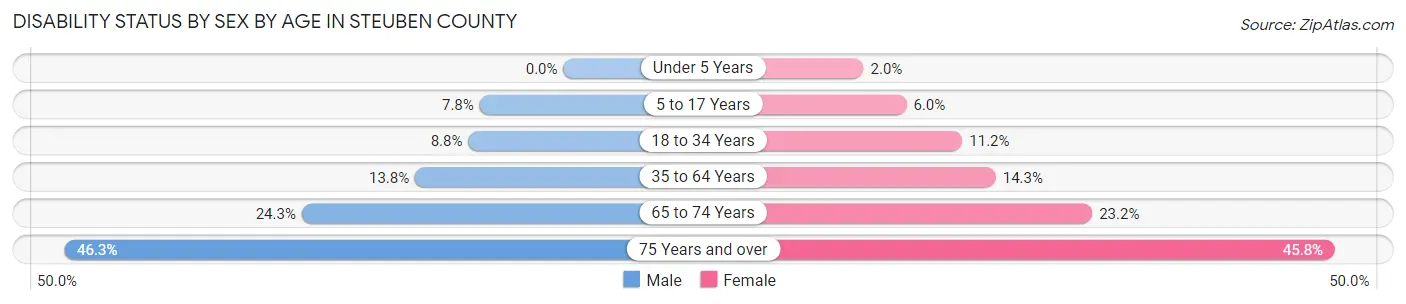
| Age Bracket | Male | Female |
| Under 5 Years | 0 (0.0%) | 48 (2.0%) |
| 5 to 17 Years | 596 (7.8%) | 439 (6.0%) |
| 18 to 34 Years | 815 (8.8%) | 969 (11.2%) |
| 35 to 64 Years | 2,543 (13.8%) | 2,602 (14.3%) |
| 65 to 74 Years | 1,282 (24.3%) | 1,263 (23.2%) |
| 75 Years and over | 1,463 (46.3%) | 1,909 (45.8%) |
Disability Class by Sex by Age in Steuben County
Disability Class: Hearing Difficulty
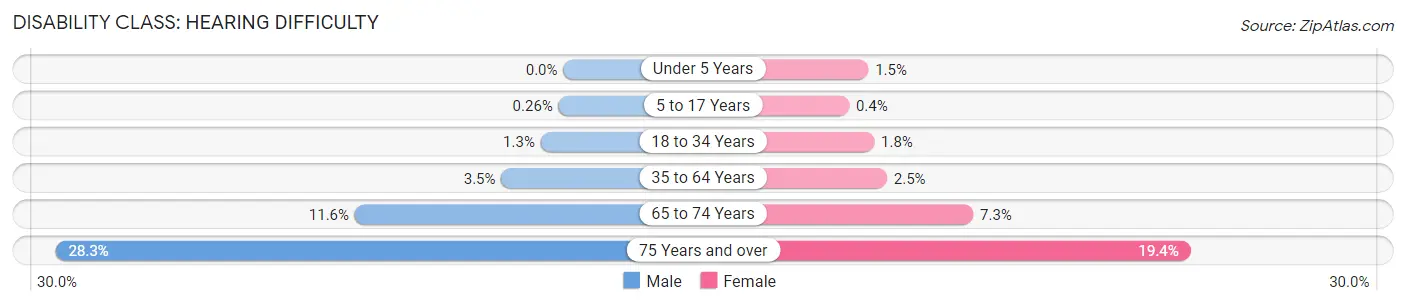
| Age Bracket | Male | Female |
| Under 5 Years | 0 (0.0%) | 35 (1.5%) |
| 5 to 17 Years | 20 (0.3%) | 29 (0.4%) |
| 18 to 34 Years | 116 (1.3%) | 156 (1.8%) |
| 35 to 64 Years | 637 (3.5%) | 457 (2.5%) |
| 65 to 74 Years | 613 (11.6%) | 397 (7.3%) |
| 75 Years and over | 893 (28.3%) | 810 (19.4%) |
Disability Class: Vision Difficulty
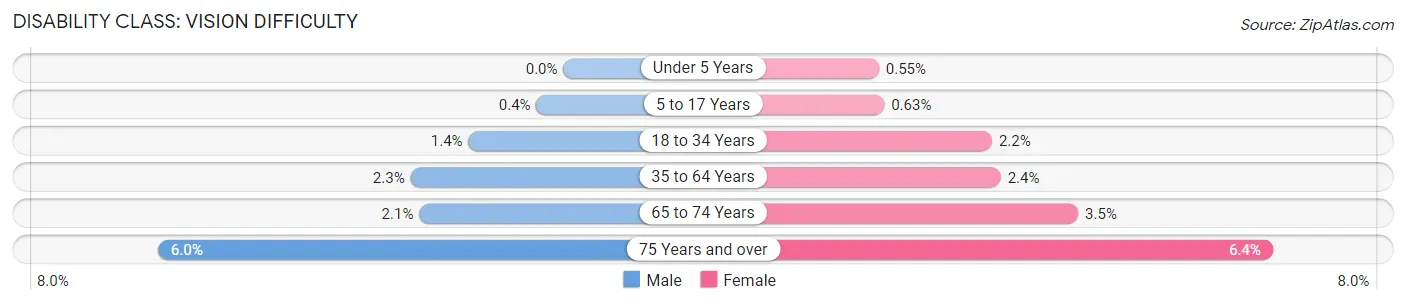
| Age Bracket | Male | Female |
| Under 5 Years | 0 (0.0%) | 13 (0.5%) |
| 5 to 17 Years | 31 (0.4%) | 46 (0.6%) |
| 18 to 34 Years | 130 (1.4%) | 193 (2.2%) |
| 35 to 64 Years | 419 (2.3%) | 430 (2.4%) |
| 65 to 74 Years | 113 (2.1%) | 191 (3.5%) |
| 75 Years and over | 190 (6.0%) | 267 (6.4%) |
Disability Class: Cognitive Difficulty
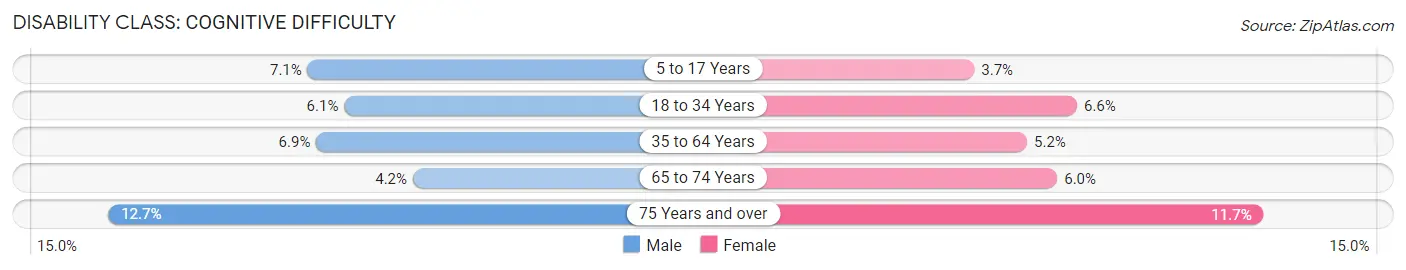
| Age Bracket | Male | Female |
| 5 to 17 Years | 546 (7.1%) | 269 (3.7%) |
| 18 to 34 Years | 564 (6.1%) | 567 (6.6%) |
| 35 to 64 Years | 1,271 (6.9%) | 940 (5.2%) |
| 65 to 74 Years | 221 (4.2%) | 326 (6.0%) |
| 75 Years and over | 400 (12.7%) | 490 (11.7%) |
Disability Class: Ambulatory Difficulty
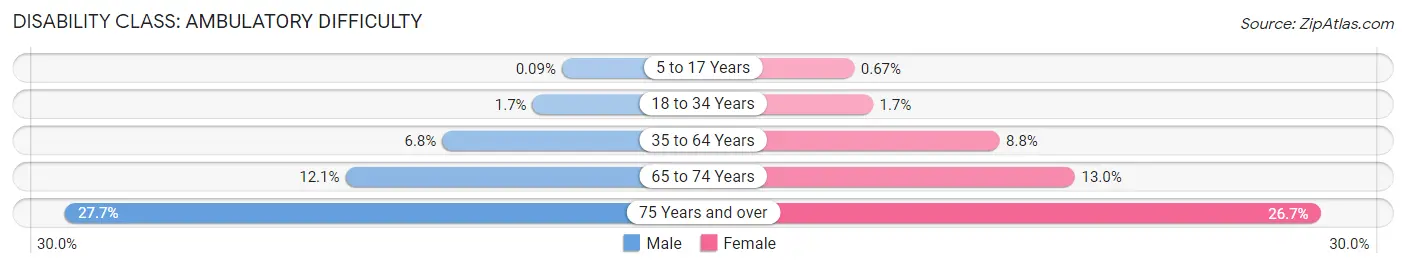
| Age Bracket | Male | Female |
| 5 to 17 Years | 7 (0.1%) | 49 (0.7%) |
| 18 to 34 Years | 159 (1.7%) | 148 (1.7%) |
| 35 to 64 Years | 1,247 (6.8%) | 1,594 (8.8%) |
| 65 to 74 Years | 641 (12.1%) | 704 (13.0%) |
| 75 Years and over | 876 (27.7%) | 1,112 (26.7%) |
Disability Class: Self-Care Difficulty
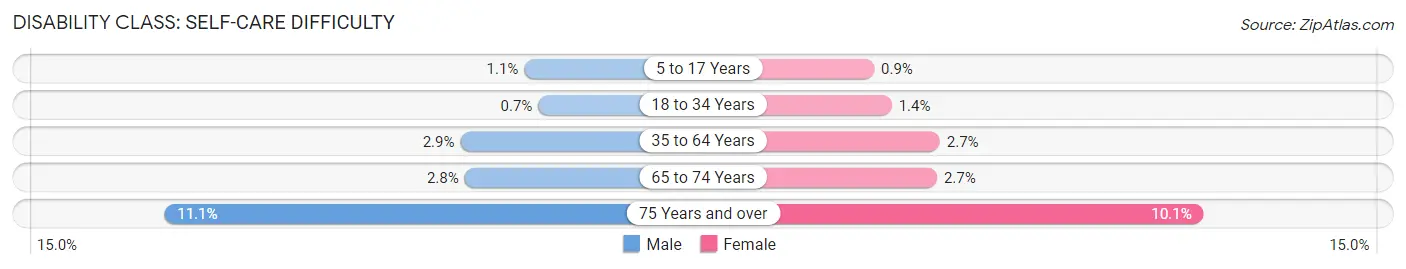
| Age Bracket | Male | Female |
| 5 to 17 Years | 84 (1.1%) | 66 (0.9%) |
| 18 to 34 Years | 65 (0.7%) | 120 (1.4%) |
| 35 to 64 Years | 531 (2.9%) | 497 (2.7%) |
| 65 to 74 Years | 145 (2.8%) | 144 (2.6%) |
| 75 Years and over | 351 (11.1%) | 420 (10.1%) |
Technology Access in Steuben County
Computing Device Access in Steuben County
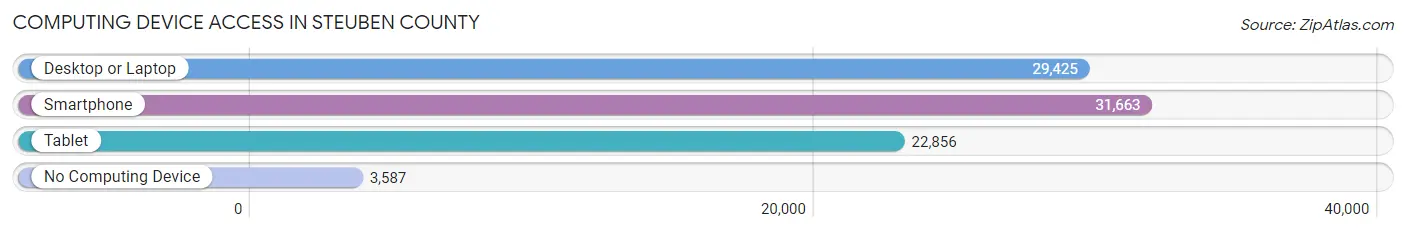
| Device Type | # Households | % Households |
| Desktop or Laptop | 29,425 | 75.1% |
| Smartphone | 31,663 | 80.8% |
| Tablet | 22,856 | 58.4% |
| No Computing Device | 3,587 | 9.2% |
| Total | 39,165 | 100.0% |
Internet Access in Steuben County
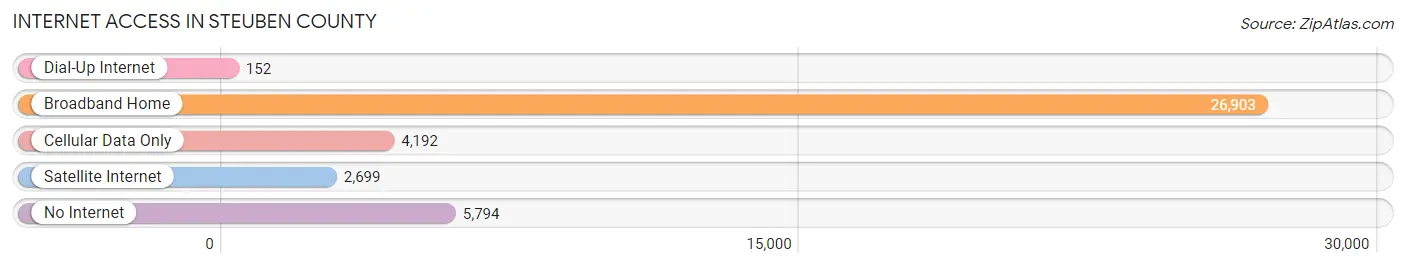
| Internet Type | # Households | % Households |
| Dial-Up Internet | 152 | 0.4% |
| Broadband Home | 26,903 | 68.7% |
| Cellular Data Only | 4,192 | 10.7% |
| Satellite Internet | 2,699 | 6.9% |
| No Internet | 5,794 | 14.8% |
| Total | 39,165 | 100.0% |
Steuben County Summary
Steuben County is located in the south-central part of New York State, and is part of the Finger Lakes region. It is bordered by Chemung County to the north, Schuyler County to the east, Yates County to the south, and Allegany and Livingston Counties to the west. The county seat is Bath, and the largest city is Corning.
Geography
Steuben County covers an area of 1,404 square miles, making it the fourth largest county in New York State. The terrain is mostly hilly, with the highest point being the summit of Mount Washington at 2,845 feet. The county is drained by the Chemung River and its tributaries, including the Cohocton, Canisteo, and Tioga Rivers. The county is home to several state parks, including Stony Brook State Park, Letchworth State Park, and Keuka Lake State Park.
History
Steuben County was formed in 1796 from parts of Ontario and Genesee Counties. It was named after Baron von Steuben, a German-born military officer who served in the American Revolutionary War. The county was originally populated by Native American tribes, including the Seneca, Cayuga, and Onondaga. The first European settlers arrived in the late 1700s, and the county was officially organized in 1817.
Economy
Steuben County has a diverse economy, with a mix of manufacturing, agriculture, and tourism. The county is home to several large manufacturing companies, including Corning Inc., which produces glass and ceramics, and Dresser-Rand, which manufactures industrial turbines. Agriculture is also an important part of the economy, with dairy farming and fruit production being the main crops. Tourism is also a major industry, with the Finger Lakes region being a popular destination for outdoor recreation and wine tasting.
Demographics
As of the 2010 census, Steuben County had a population of 98,990. The population is mostly white (94.3%), with small percentages of African American (2.2%), Asian (1.2%), and Hispanic or Latino (2.2%) residents. The median household income is $45,945, and the median age is 42.7 years.
Steuben County is a rural area, with most of the population living in small towns and villages. The largest city is Corning, with a population of 11,183. Other major towns include Bath (5,741), Hornell (8,563), and Painted Post (3,845).
Conclusion
Steuben County is a rural area located in the Finger Lakes region of New York State. It has a diverse economy, with manufacturing, agriculture, and tourism being the main industries. The population is mostly white, with a median household income of $45,945 and a median age of 42.7 years. Corning is the largest city in the county, with a population of 11,183.
Common Questions
What is Per Capita Income in Steuben County?
Per Capita income in Steuben County is $35,282.
What is the Median Family Income in Steuben County?
Median Family Income in Steuben County is $81,682.
What is the Median Household income in Steuben County?
Median Household Income in Steuben County is $62,506.
What is Income or Wage Gap in Steuben County?
Income or Wage Gap in Steuben County is 29.5%.
Women in Steuben County earn 70.5 cents for every dollar earned by a man.
What is Family Income Deficit in Steuben County?
Family Income Deficit in Steuben County is $10,224.
Families that are below poverty line in Steuben County earn $10,224 less on average than the poverty threshold level.
What is Inequality or Gini Index in Steuben County?
Inequality or Gini Index in Steuben County is 0.45.
What is the Total Population of Steuben County?
Total Population of Steuben County is 93,584.
What is the Total Male Population of Steuben County?
Total Male Population of Steuben County is 46,984.
What is the Total Female Population of Steuben County?
Total Female Population of Steuben County is 46,600.
What is the Ratio of Males per 100 Females in Steuben County?
There are 100.82 Males per 100 Females in Steuben County.
What is the Ratio of Females per 100 Males in Steuben County?
There are 99.18 Females per 100 Males in Steuben County.
What is the Median Population Age in Steuben County?
Median Population Age in Steuben County is 42.8 Years.
What is the Average Family Size in Steuben County
Average Family Size in Steuben County is 2.9 People.
What is the Average Household Size in Steuben County
Average Household Size in Steuben County is 2.4 People.
How Large is the Labor Force in Steuben County?
There are 44,987 People in the Labor Forcein in Steuben County.
What is the Percentage of People in the Labor Force in Steuben County?
59.3% of People are in the Labor Force in Steuben County.
What is the Unemployment Rate in Steuben County?
Unemployment Rate in Steuben County is 6.3%.