Schuyler County, NY Map & Demographics
Schuyler County Map
Schuyler County Overview
$35,062
PER CAPITA INCOME
$81,509
AVG FAMILY INCOME
$61,316
AVG HOUSEHOLD INCOME
24.6%
WAGE / INCOME GAP [ % ]
75.4¢/ $1
WAGE / INCOME GAP [ $ ]
$11,266
FAMILY INCOME DEFICIT
0.44
INEQUALITY / GINI INDEX
17,855
TOTAL POPULATION
8,987
MALE POPULATION
8,868
FEMALE POPULATION
101.34
MALES / 100 FEMALES
98.68
FEMALES / 100 MALES
47.3
MEDIAN AGE
2.8
AVG FAMILY SIZE
2.4
AVG HOUSEHOLD SIZE
8,732
LABOR FORCE [ PEOPLE ]
58.5%
PERCENT IN LABOR FORCE
5.7%
UNEMPLOYMENT RATE
Schuyler County Area Codes
Income in Schuyler County
Income Overview in Schuyler County
Per Capita Income in Schuyler County is $35,062, while median incomes of families and households are $81,509 and $61,316 respectively.
| Characteristic | Number | Measure |
| Per Capita Income | 17,855 | $35,062 |
| Median Family Income | 4,587 | $81,509 |
| Mean Family Income | 4,587 | $94,592 |
| Median Household Income | 7,446 | $61,316 |
| Mean Household Income | 7,446 | $81,139 |
| Income Deficit | 4,587 | $11,266 |
| Wage / Income Gap (%) | 17,855 | 24.65% |
| Wage / Income Gap ($) | 17,855 | 75.35¢ per $1 |
| Gini / Inequality Index | 17,855 | 0.44 |
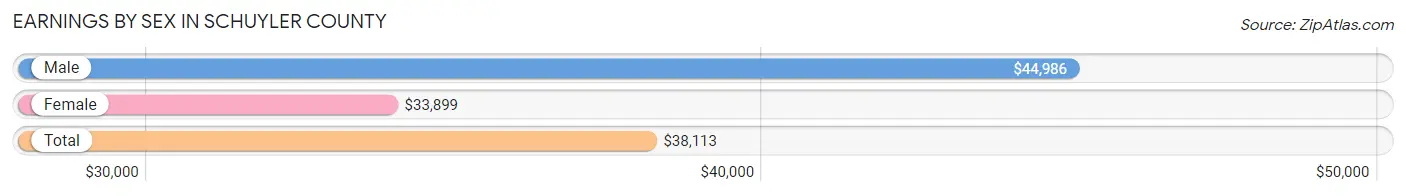
Earnings by Sex in Schuyler County
Average Earnings in Schuyler County are $38,113, $44,986 for men and $33,899 for women, a difference of 24.6%.
| Sex | Number | Average Earnings |
| Male | 4,833 (52.6%) | $44,986 |
| Female | 4,356 (47.4%) | $33,899 |
| Total | 9,189 (100.0%) | $38,113 |
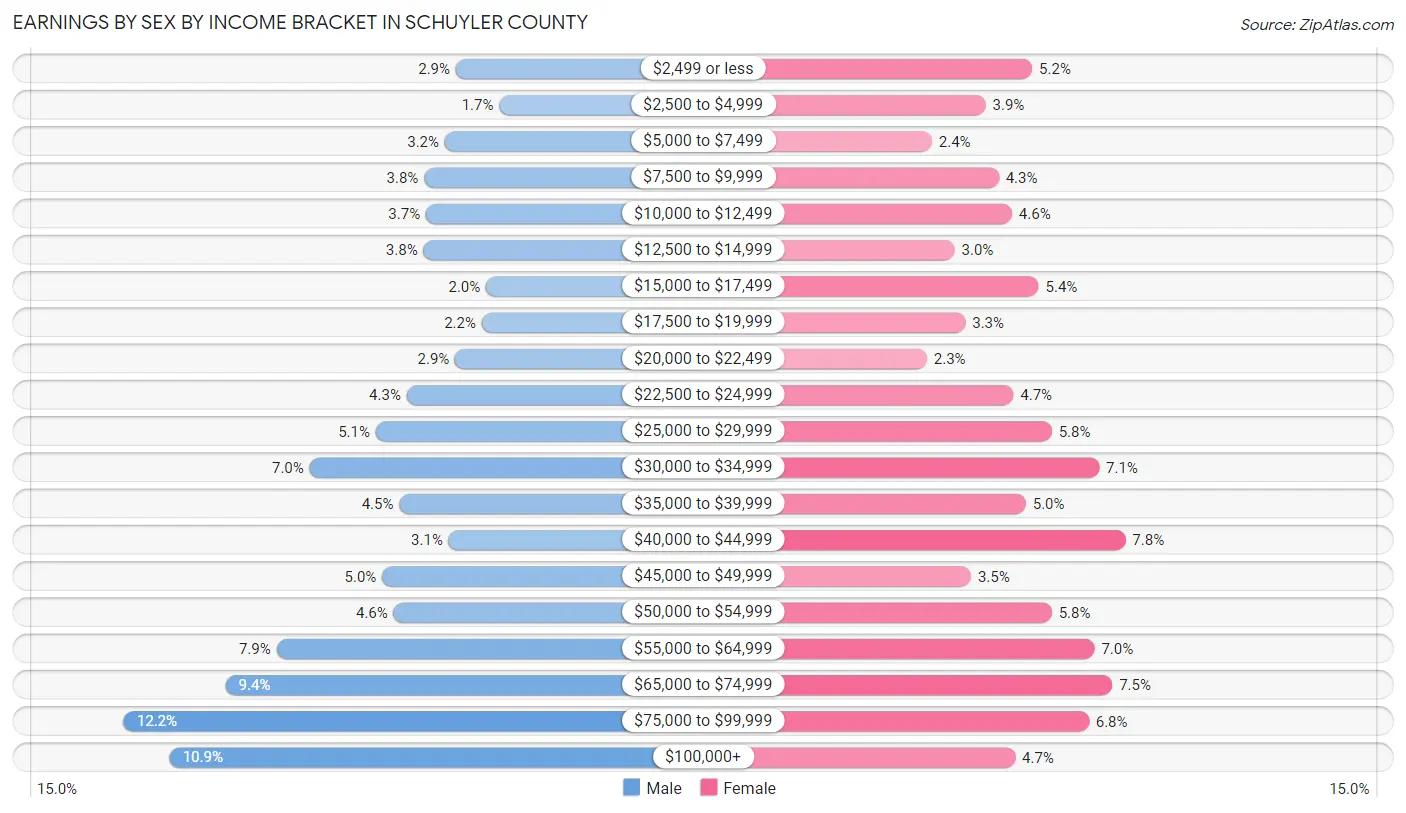
Earnings by Sex by Income Bracket in Schuyler County
The most common earnings brackets in Schuyler County are $75,000 to $99,999 for men (590 | 12.2%) and $40,000 to $44,999 for women (341 | 7.8%).
| Income | Male | Female |
| $2,499 or less | 139 (2.9%) | 227 (5.2%) |
| $2,500 to $4,999 | 80 (1.7%) | 170 (3.9%) |
| $5,000 to $7,499 | 154 (3.2%) | 104 (2.4%) |
| $7,500 to $9,999 | 182 (3.8%) | 186 (4.3%) |
| $10,000 to $12,499 | 180 (3.7%) | 202 (4.6%) |
| $12,500 to $14,999 | 183 (3.8%) | 132 (3.0%) |
| $15,000 to $17,499 | 98 (2.0%) | 235 (5.4%) |
| $17,500 to $19,999 | 104 (2.1%) | 145 (3.3%) |
| $20,000 to $22,499 | 140 (2.9%) | 98 (2.2%) |
| $22,500 to $24,999 | 206 (4.3%) | 204 (4.7%) |
| $25,000 to $29,999 | 248 (5.1%) | 251 (5.8%) |
| $30,000 to $34,999 | 338 (7.0%) | 309 (7.1%) |
| $35,000 to $39,999 | 216 (4.5%) | 219 (5.0%) |
| $40,000 to $44,999 | 149 (3.1%) | 341 (7.8%) |
| $45,000 to $49,999 | 239 (5.0%) | 152 (3.5%) |
| $50,000 to $54,999 | 224 (4.6%) | 251 (5.8%) |
| $55,000 to $64,999 | 383 (7.9%) | 303 (7.0%) |
| $65,000 to $74,999 | 452 (9.3%) | 325 (7.5%) |
| $75,000 to $99,999 | 590 (12.2%) | 296 (6.8%) |
| $100,000+ | 528 (10.9%) | 206 (4.7%) |
| Total | 4,833 (100.0%) | 4,356 (100.0%) |
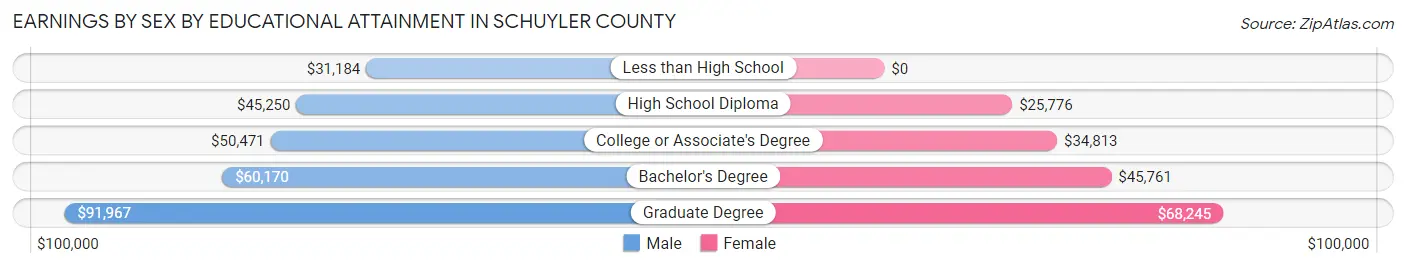
Earnings by Sex by Educational Attainment in Schuyler County
Average earnings in Schuyler County are $48,609 for men and $37,940 for women, a difference of 22.0%. Men with an educational attainment of graduate degree enjoy the highest average annual earnings of $91,967, while those with less than high school education earn the least with $31,184. Women with an educational attainment of graduate degree earn the most with the average annual earnings of $68,245, while those with high school diploma education have the smallest earnings of $25,776.
| Educational Attainment | Male Income | Female Income |
| Less than High School | $31,184 | $0 |
| High School Diploma | $45,250 | $25,776 |
| College or Associate's Degree | $50,471 | $34,813 |
| Bachelor's Degree | $60,170 | $45,761 |
| Graduate Degree | $91,967 | $68,245 |
| Total | $48,609 | $37,940 |
Family Income in Schuyler County
Family Income Brackets in Schuyler County
According to the Schuyler County family income data, there are 936 families falling into the $100,000 to $149,999 income range, which is the most common income bracket and makes up 20.4% of all families. Conversely, the $10,000 to $14,999 income bracket is the least frequent group with only 78 families (1.7%) belonging to this category.
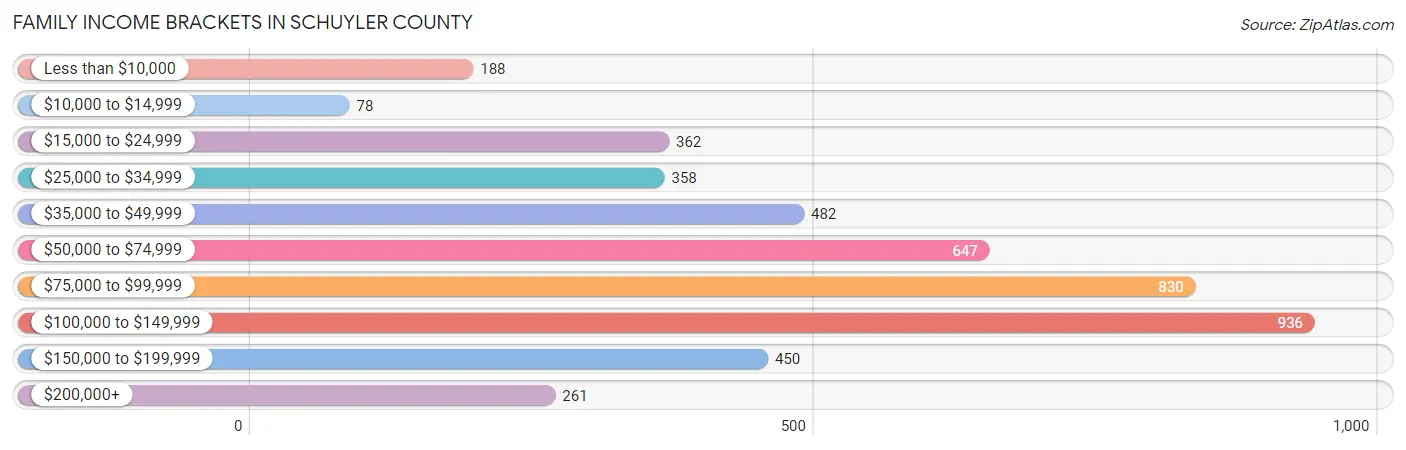
| Income Bracket | # Families | % Families |
| Less than $10,000 | 188 | 4.1% |
| $10,000 to $14,999 | 78 | 1.7% |
| $15,000 to $24,999 | 362 | 7.9% |
| $25,000 to $34,999 | 358 | 7.8% |
| $35,000 to $49,999 | 482 | 10.5% |
| $50,000 to $74,999 | 647 | 14.1% |
| $75,000 to $99,999 | 830 | 18.1% |
| $100,000 to $149,999 | 936 | 20.4% |
| $150,000 to $199,999 | 450 | 9.8% |
| $200,000+ | 261 | 5.7% |
Family Income by Famaliy Size in Schuyler County
4-person families (742 | 16.2%) account for the highest median family income in Schuyler County with $110,938 per family, while 2-person families (2,646 | 57.7%) have the highest median income of $33,778 per family member.
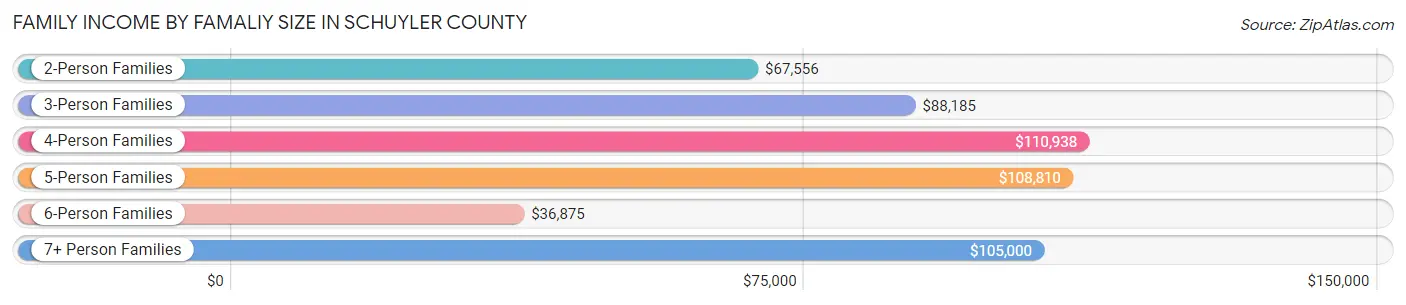
| Income Bracket | # Families | Median Income |
| 2-Person Families | 2,646 (57.7%) | $67,556 |
| 3-Person Families | 783 (17.1%) | $88,185 |
| 4-Person Families | 742 (16.2%) | $110,938 |
| 5-Person Families | 324 (7.1%) | $108,810 |
| 6-Person Families | 68 (1.5%) | $36,875 |
| 7+ Person Families | 24 (0.5%) | $105,000 |
| Total | 4,587 (100.0%) | $81,509 |
Family Income by Number of Earners in Schuyler County
The median family income in Schuyler County is $81,509, with families comprising 3+ earners (568) having the highest median family income of $143,947, while families with no earners (1,051) have the lowest median family income of $35,063, accounting for 12.4% and 22.9% of families, respectively.
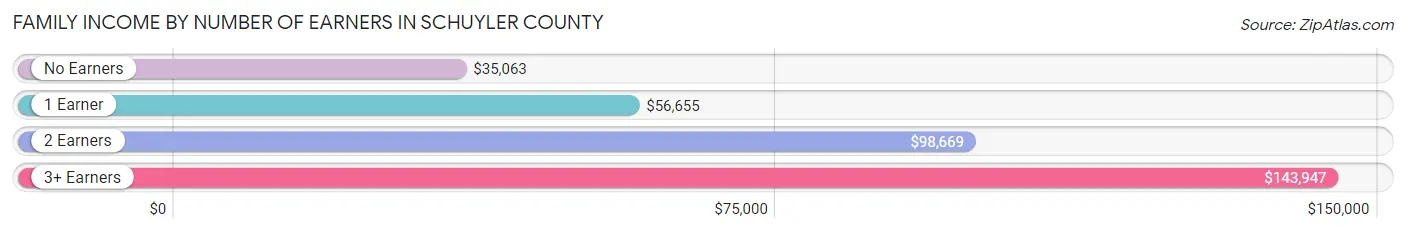
| Number of Earners | # Families | Median Income |
| No Earners | 1,051 (22.9%) | $35,063 |
| 1 Earner | 1,339 (29.2%) | $56,655 |
| 2 Earners | 1,629 (35.5%) | $98,669 |
| 3+ Earners | 568 (12.4%) | $143,947 |
| Total | 4,587 (100.0%) | $81,509 |
Household Income in Schuyler County
Household Income Brackets in Schuyler County
With 1,243 households falling in the category, the $100,000 to $149,999 income range is the most frequent in Schuyler County, accounting for 16.7% of all households. In contrast, only 328 households (4.4%) fall into the $200,000+ income bracket, making it the least populous group.
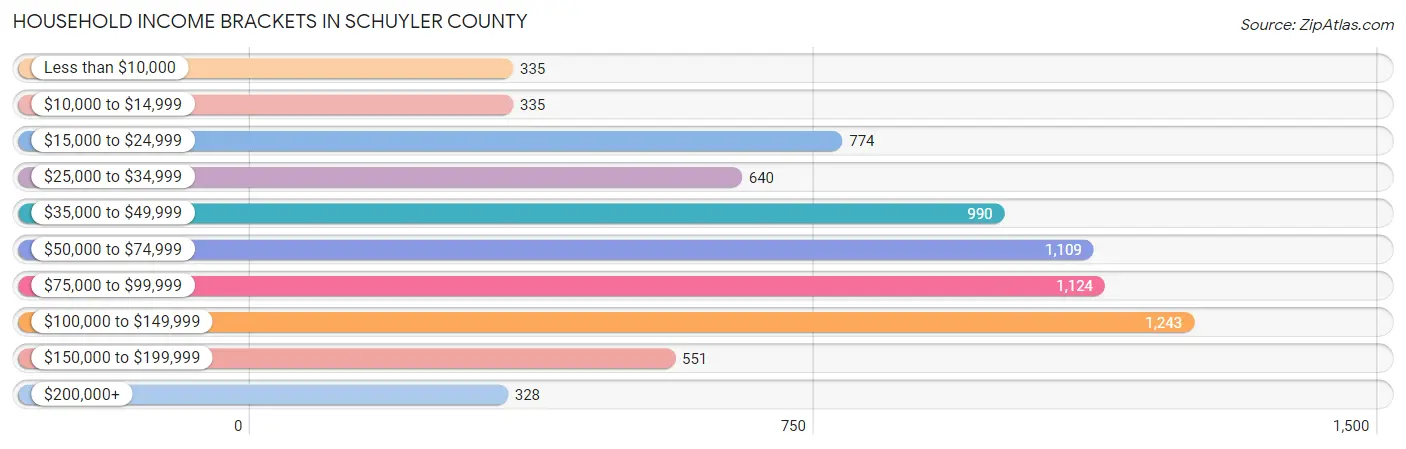
| Income Bracket | # Households | % Households |
| Less than $10,000 | 335 | 4.5% |
| $10,000 to $14,999 | 335 | 4.5% |
| $15,000 to $24,999 | 774 | 10.4% |
| $25,000 to $34,999 | 640 | 8.6% |
| $35,000 to $49,999 | 990 | 13.3% |
| $50,000 to $74,999 | 1,109 | 14.9% |
| $75,000 to $99,999 | 1,124 | 15.1% |
| $100,000 to $149,999 | 1,243 | 16.7% |
| $150,000 to $199,999 | 551 | 7.4% |
| $200,000+ | 328 | 4.4% |
Household Income by Householder Age in Schuyler County
The median household income in Schuyler County is $61,316, with the highest median household income of $86,197 found in the 45 to 64 years age bracket for the primary householder. A total of 2,958 households (39.7%) fall into this category. Meanwhile, the 65+ years age bracket for the primary householder has the lowest median household income of $46,301, with 2,530 households (34.0%) in this group.
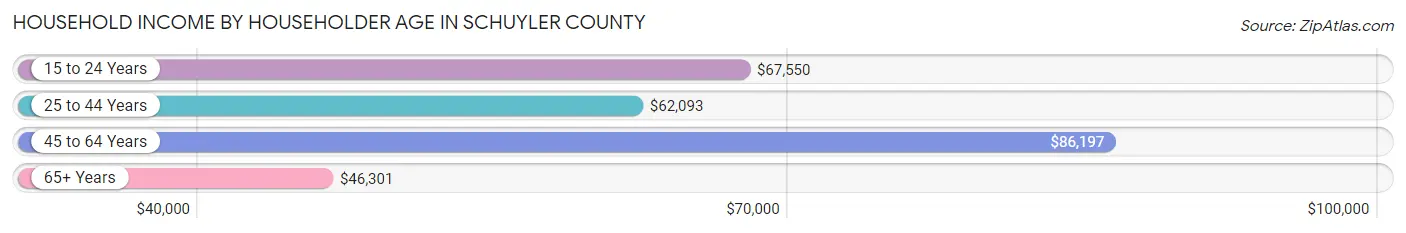
| Income Bracket | # Households | Median Income |
| 15 to 24 Years | 165 (2.2%) | $67,550 |
| 25 to 44 Years | 1,793 (24.1%) | $62,093 |
| 45 to 64 Years | 2,958 (39.7%) | $86,197 |
| 65+ Years | 2,530 (34.0%) | $46,301 |
| Total | 7,446 (100.0%) | $61,316 |
Poverty in Schuyler County
Income Below Poverty by Sex and Age in Schuyler County
With 14.7% poverty level for males and 16.8% for females among the residents of Schuyler County, 16 and 17 year old males and 16 and 17 year old females are the most vulnerable to poverty, with 85 males (35.6%) and 65 females (33.0%) in their respective age groups living below the poverty level.
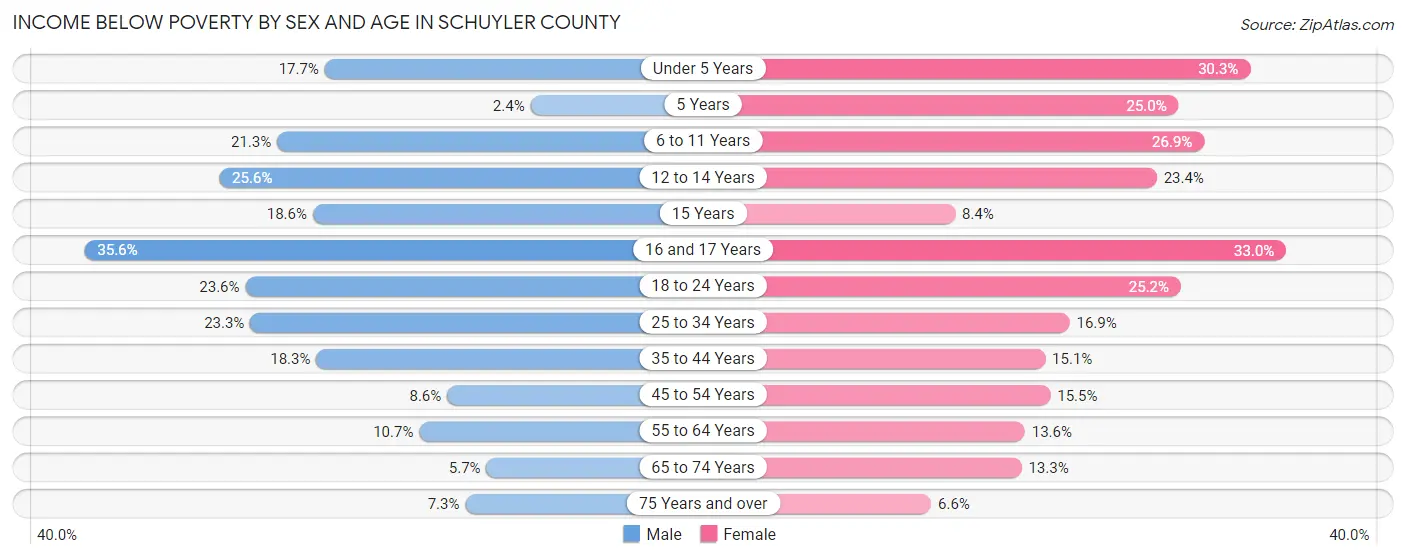
| Age Bracket | Male | Female |
| Under 5 Years | 73 (17.7%) | 134 (30.3%) |
| 5 Years | 2 (2.4%) | 17 (25.0%) |
| 6 to 11 Years | 108 (21.3%) | 152 (26.9%) |
| 12 to 14 Years | 80 (25.6%) | 47 (23.4%) |
| 15 Years | 16 (18.6%) | 10 (8.4%) |
| 16 and 17 Years | 85 (35.6%) | 65 (33.0%) |
| 18 to 24 Years | 144 (23.6%) | 144 (25.2%) |
| 25 to 34 Years | 233 (23.3%) | 151 (16.9%) |
| 35 to 44 Years | 177 (18.3%) | 157 (15.1%) |
| 45 to 54 Years | 110 (8.6%) | 181 (15.5%) |
| 55 to 64 Years | 160 (10.7%) | 200 (13.6%) |
| 65 to 74 Years | 70 (5.7%) | 162 (13.3%) |
| 75 Years and over | 48 (7.3%) | 55 (6.6%) |
| Total | 1,306 (14.7%) | 1,475 (16.8%) |
Income Above Poverty by Sex and Age in Schuyler County
According to the poverty statistics in Schuyler County, males aged 5 years and females aged 75 years and over are the age groups that are most secure financially, with 97.6% of males and 93.4% of females in these age groups living above the poverty line.
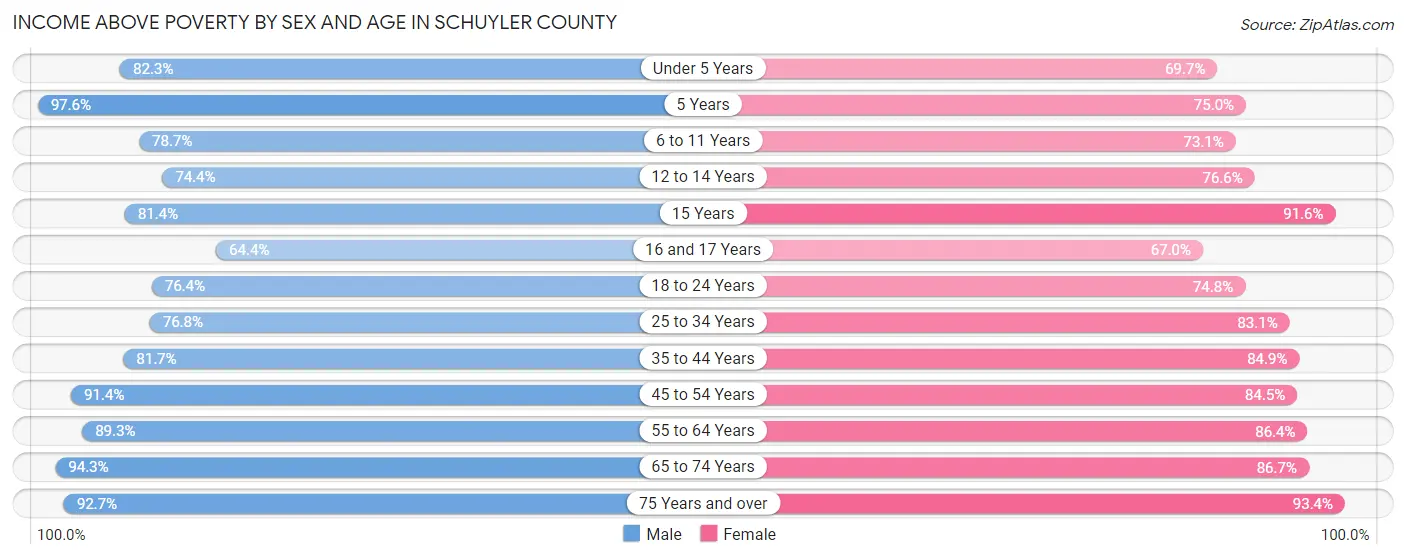
| Age Bracket | Male | Female |
| Under 5 Years | 339 (82.3%) | 308 (69.7%) |
| 5 Years | 80 (97.6%) | 51 (75.0%) |
| 6 to 11 Years | 400 (78.7%) | 413 (73.1%) |
| 12 to 14 Years | 233 (74.4%) | 154 (76.6%) |
| 15 Years | 70 (81.4%) | 109 (91.6%) |
| 16 and 17 Years | 154 (64.4%) | 132 (67.0%) |
| 18 to 24 Years | 466 (76.4%) | 428 (74.8%) |
| 25 to 34 Years | 769 (76.7%) | 742 (83.1%) |
| 35 to 44 Years | 788 (81.7%) | 883 (84.9%) |
| 45 to 54 Years | 1,164 (91.4%) | 988 (84.5%) |
| 55 to 64 Years | 1,335 (89.3%) | 1,272 (86.4%) |
| 65 to 74 Years | 1,155 (94.3%) | 1,052 (86.7%) |
| 75 Years and over | 611 (92.7%) | 775 (93.4%) |
| Total | 7,564 (85.3%) | 7,307 (83.2%) |
Income Below Poverty Among Married-Couple Families in Schuyler County
The poverty statistics for married-couple families in Schuyler County show that 5.5% or 205 of the total 3,742 families live below the poverty line. Families with 5 or more children have the highest poverty rate of 25.0%, comprising of 4 families. On the other hand, families with no children have the lowest poverty rate of 4.1%, which includes 100 families.
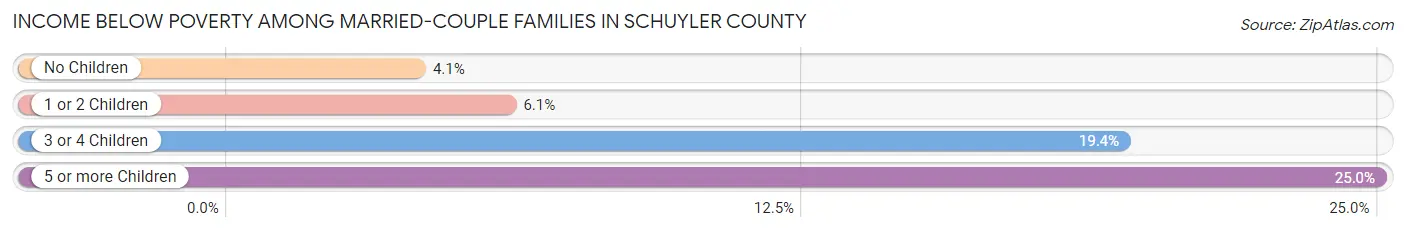
| Children | Above Poverty | Below Poverty |
| No Children | 2,345 (95.9%) | 100 (4.1%) |
| 1 or 2 Children | 1,039 (93.9%) | 67 (6.1%) |
| 3 or 4 Children | 141 (80.6%) | 34 (19.4%) |
| 5 or more Children | 12 (75.0%) | 4 (25.0%) |
| Total | 3,537 (94.5%) | 205 (5.5%) |
Income Below Poverty Among Single-Parent Households in Schuyler County
According to the poverty data in Schuyler County, 29.2% or 114 single-father households and 41.8% or 190 single-mother households are living below the poverty line. Among single-father households, those with 3 or 4 children have the highest poverty rate, with 32 households (97.0%) experiencing poverty. Likewise, among single-mother households, those with 3 or 4 children have the highest poverty rate, with 30 households (100.0%) falling below the poverty line.
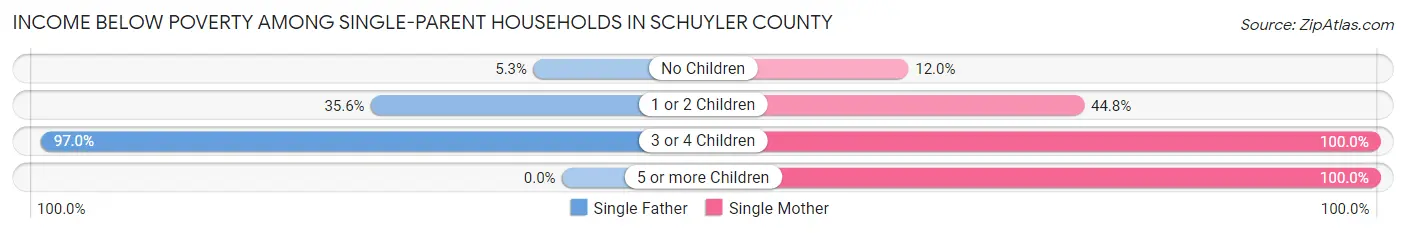
| Children | Single Father | Single Mother |
| No Children | 8 (5.3%) | 13 (12.0%) |
| 1 or 2 Children | 74 (35.6%) | 137 (44.8%) |
| 3 or 4 Children | 32 (97.0%) | 30 (100.0%) |
| 5 or more Children | 0 (0.0%) | 10 (100.0%) |
| Total | 114 (29.2%) | 190 (41.8%) |
Income Below Poverty Among Married-Couple vs Single-Parent Households in Schuyler County
The poverty data for Schuyler County shows that 205 of the married-couple family households (5.5%) and 304 of the single-parent households (36.0%) are living below the poverty level. Within the married-couple family households, those with 5 or more children have the highest poverty rate, with 4 households (25.0%) falling below the poverty line. Among the single-parent households, those with 5 or more children have the highest poverty rate, with 10 household (100.0%) living below poverty.
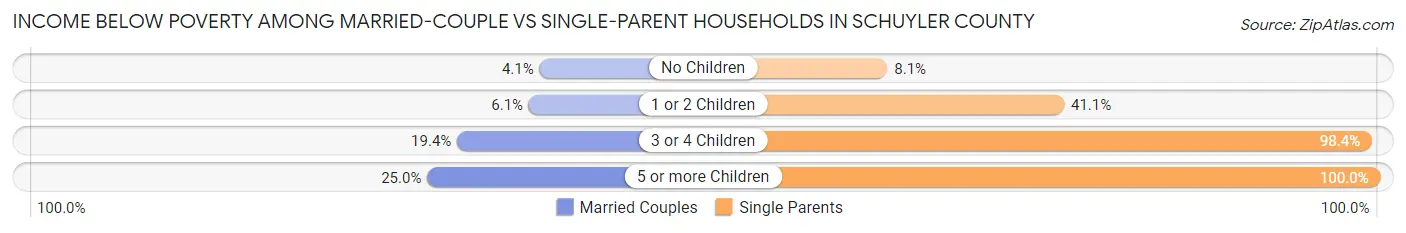
| Children | Married-Couple Families | Single-Parent Households |
| No Children | 100 (4.1%) | 21 (8.1%) |
| 1 or 2 Children | 67 (6.1%) | 211 (41.0%) |
| 3 or 4 Children | 34 (19.4%) | 62 (98.4%) |
| 5 or more Children | 4 (25.0%) | 10 (100.0%) |
| Total | 205 (5.5%) | 304 (36.0%) |
Race in Schuyler County
The most populous races in Schuyler County are White / Caucasian (16,843 | 94.3%), Two or more Races (623 | 3.5%), and Hispanic or Latino (340 | 1.9%).
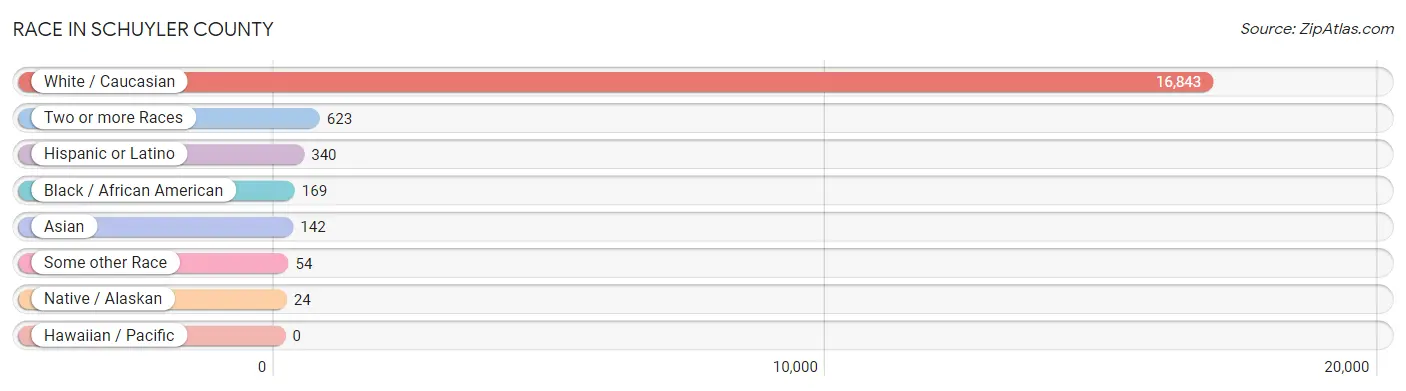
| Race | # Population | % Population |
| Asian | 142 | 0.8% |
| Black / African American | 169 | 0.9% |
| Hawaiian / Pacific | 0 | 0.0% |
| Hispanic or Latino | 340 | 1.9% |
| Native / Alaskan | 24 | 0.1% |
| White / Caucasian | 16,843 | 94.3% |
| Two or more Races | 623 | 3.5% |
| Some other Race | 54 | 0.3% |
| Total | 17,855 | 100.0% |
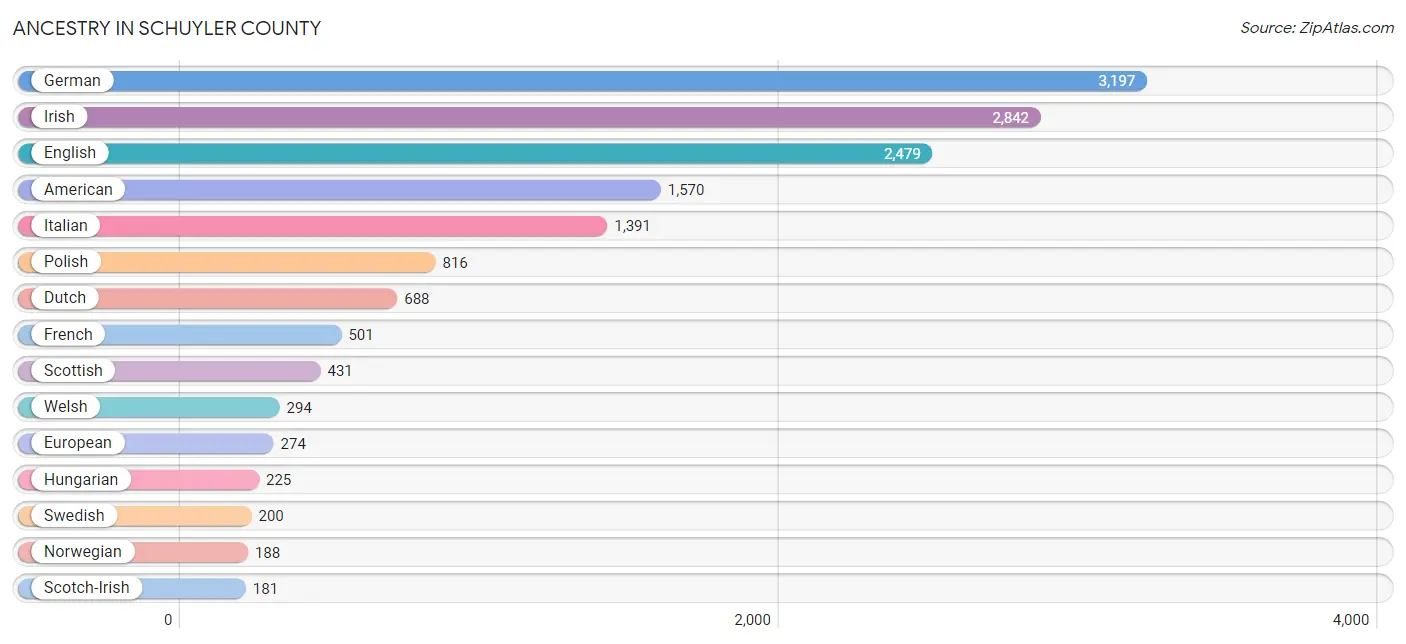
Ancestry in Schuyler County
The most populous ancestries reported in Schuyler County are German (3,197 | 17.9%), Irish (2,842 | 15.9%), English (2,479 | 13.9%), American (1,570 | 8.8%), and Italian (1,391 | 7.8%), together accounting for 64.3% of all Schuyler County residents.
| Ancestry | # Population | % Population |
| Afghan | 1 | 0.0% |
| Alaska Native | 2 | 0.0% |
| Albanian | 4 | 0.0% |
| American | 1,570 | 8.8% |
| Arab | 2 | 0.0% |
| Armenian | 2 | 0.0% |
| Austrian | 69 | 0.4% |
| Belgian | 25 | 0.1% |
| Blackfeet | 31 | 0.2% |
| British | 146 | 0.8% |
| Burmese | 20 | 0.1% |
| Canadian | 49 | 0.3% |
| Celtic | 2 | 0.0% |
| Central American | 5 | 0.0% |
| Central American Indian | 2 | 0.0% |
| Cherokee | 50 | 0.3% |
| Chilean | 28 | 0.2% |
| Choctaw | 6 | 0.0% |
| Cuban | 3 | 0.0% |
| Czech | 67 | 0.4% |
| Czechoslovakian | 16 | 0.1% |
| Danish | 15 | 0.1% |
| Delaware | 1 | 0.0% |
| Dominican | 26 | 0.2% |
| Dutch | 688 | 3.8% |
| Eastern European | 65 | 0.4% |
| Ecuadorian | 10 | 0.1% |
| English | 2,479 | 13.9% |
| European | 274 | 1.5% |
| Finnish | 168 | 0.9% |
| French | 501 | 2.8% |
| French Canadian | 122 | 0.7% |
| German | 3,197 | 17.9% |
| Greek | 23 | 0.1% |
| Honduran | 1 | 0.0% |
| Hungarian | 225 | 1.3% |
| Indian (Asian) | 80 | 0.4% |
| Irish | 2,842 | 15.9% |
| Iroquois | 36 | 0.2% |
| Israeli | 6 | 0.0% |
| Italian | 1,391 | 7.8% |
| Jamaican | 24 | 0.1% |
| Korean | 25 | 0.1% |
| Latvian | 1 | 0.0% |
| Lebanese | 2 | 0.0% |
| Lithuanian | 13 | 0.1% |
| Macedonian | 4 | 0.0% |
| Malaysian | 7 | 0.0% |
| Mexican | 24 | 0.1% |
| Northern European | 17 | 0.1% |
| Norwegian | 188 | 1.1% |
| Panamanian | 4 | 0.0% |
| Pennsylvania German | 99 | 0.5% |
| Peruvian | 3 | 0.0% |
| Polish | 816 | 4.6% |
| Portuguese | 11 | 0.1% |
| Puerto Rican | 137 | 0.8% |
| Russian | 107 | 0.6% |
| Scandinavian | 41 | 0.2% |
| Scotch-Irish | 181 | 1.0% |
| Scottish | 431 | 2.4% |
| Serbian | 4 | 0.0% |
| Slavic | 16 | 0.1% |
| Slovak | 181 | 1.0% |
| Slovene | 1 | 0.0% |
| South American | 41 | 0.2% |
| Spaniard | 102 | 0.6% |
| Spanish | 1 | 0.0% |
| Sri Lankan | 21 | 0.1% |
| Swedish | 200 | 1.1% |
| Swiss | 115 | 0.6% |
| Thai | 31 | 0.2% |
| Ukrainian | 77 | 0.4% |
| Welsh | 294 | 1.7% |
| West Indian | 11 | 0.1% |
| Yugoslavian | 12 | 0.1% | View All 76 Rows |
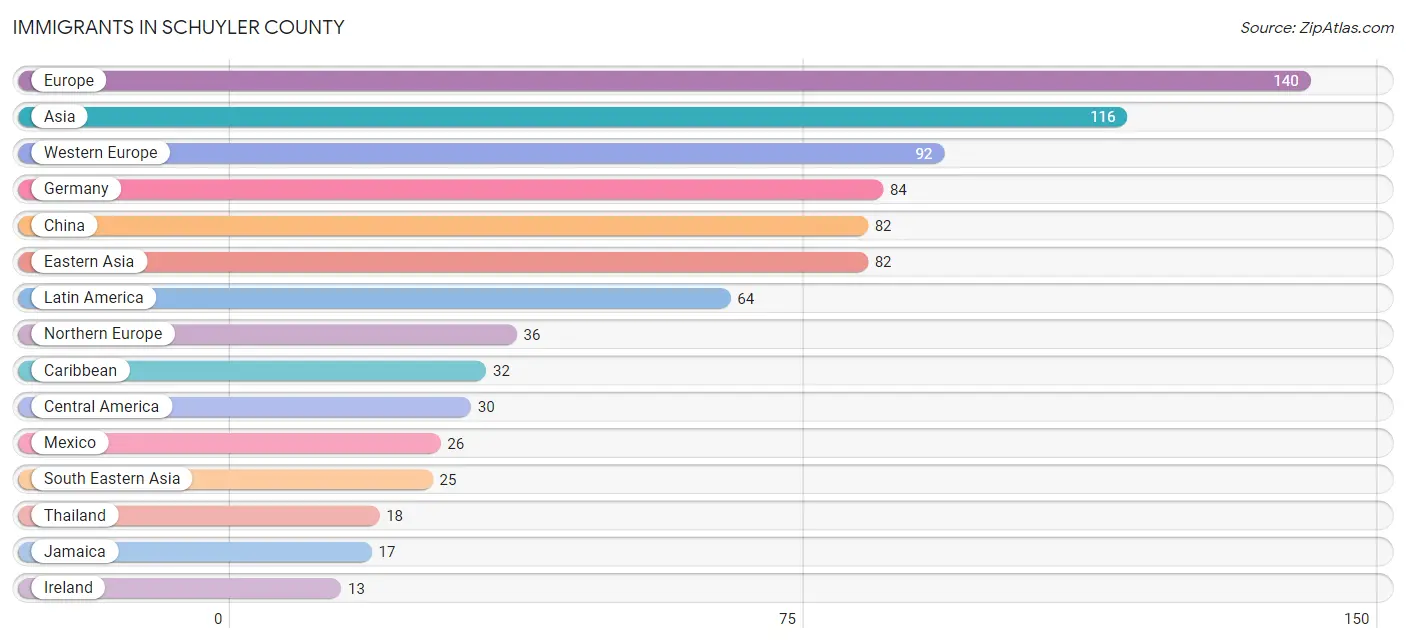
Immigrants in Schuyler County
The most numerous immigrant groups reported in Schuyler County came from Europe (140 | 0.8%), Asia (116 | 0.6%), Western Europe (92 | 0.5%), Germany (84 | 0.5%), and China (82 | 0.5%), together accounting for 2.9% of all Schuyler County residents.
| Immigration Origin | # Population | % Population |
| Afghanistan | 1 | 0.0% |
| Asia | 116 | 0.6% |
| Canada | 6 | 0.0% |
| Caribbean | 32 | 0.2% |
| Central America | 30 | 0.2% |
| Chile | 2 | 0.0% |
| China | 82 | 0.5% |
| Dominican Republic | 7 | 0.0% |
| Eastern Asia | 82 | 0.5% |
| England | 4 | 0.0% |
| Europe | 140 | 0.8% |
| France | 8 | 0.0% |
| Germany | 84 | 0.5% |
| Greece | 8 | 0.0% |
| Guatemala | 3 | 0.0% |
| Honduras | 1 | 0.0% |
| India | 8 | 0.0% |
| Ireland | 13 | 0.1% |
| Italy | 4 | 0.0% |
| Jamaica | 17 | 0.1% |
| Latin America | 64 | 0.4% |
| Mexico | 26 | 0.2% |
| Northern Europe | 36 | 0.2% |
| South America | 2 | 0.0% |
| South Central Asia | 9 | 0.1% |
| South Eastern Asia | 25 | 0.1% |
| Southern Europe | 12 | 0.1% |
| St. Vincent and the Grenadines | 8 | 0.0% |
| Thailand | 18 | 0.1% |
| Vietnam | 7 | 0.0% |
| Western Europe | 92 | 0.5% | View All 31 Rows |
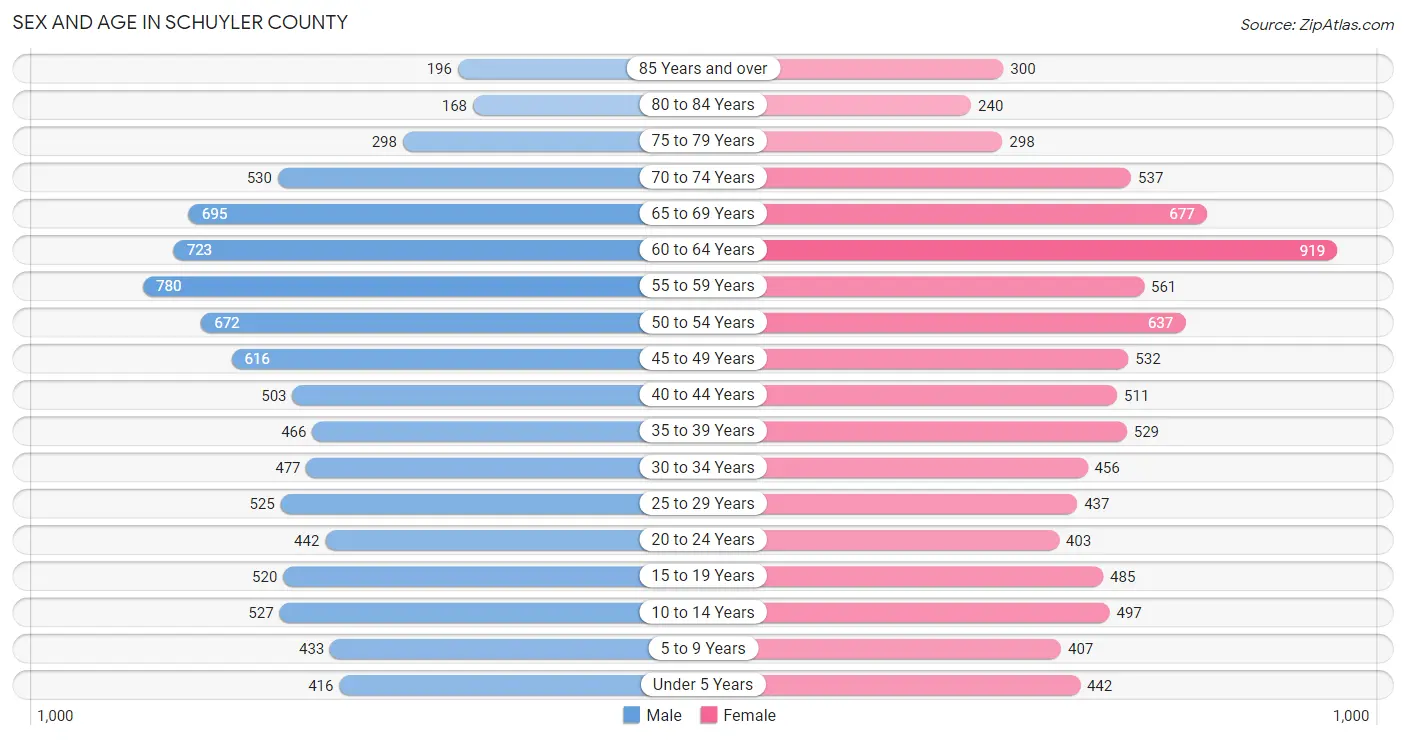
Sex and Age in Schuyler County
Sex and Age in Schuyler County
The most populous age groups in Schuyler County are 55 to 59 Years (780 | 8.7%) for men and 60 to 64 Years (919 | 10.4%) for women.
| Age Bracket | Male | Female |
| Under 5 Years | 416 (4.6%) | 442 (5.0%) |
| 5 to 9 Years | 433 (4.8%) | 407 (4.6%) |
| 10 to 14 Years | 527 (5.9%) | 497 (5.6%) |
| 15 to 19 Years | 520 (5.8%) | 485 (5.5%) |
| 20 to 24 Years | 442 (4.9%) | 403 (4.5%) |
| 25 to 29 Years | 525 (5.8%) | 437 (4.9%) |
| 30 to 34 Years | 477 (5.3%) | 456 (5.1%) |
| 35 to 39 Years | 466 (5.2%) | 529 (6.0%) |
| 40 to 44 Years | 503 (5.6%) | 511 (5.8%) |
| 45 to 49 Years | 616 (6.9%) | 532 (6.0%) |
| 50 to 54 Years | 672 (7.5%) | 637 (7.2%) |
| 55 to 59 Years | 780 (8.7%) | 561 (6.3%) |
| 60 to 64 Years | 723 (8.0%) | 919 (10.4%) |
| 65 to 69 Years | 695 (7.7%) | 677 (7.6%) |
| 70 to 74 Years | 530 (5.9%) | 537 (6.1%) |
| 75 to 79 Years | 298 (3.3%) | 298 (3.4%) |
| 80 to 84 Years | 168 (1.9%) | 240 (2.7%) |
| 85 Years and over | 196 (2.2%) | 300 (3.4%) |
| Total | 8,987 (100.0%) | 8,868 (100.0%) |
Families and Households in Schuyler County
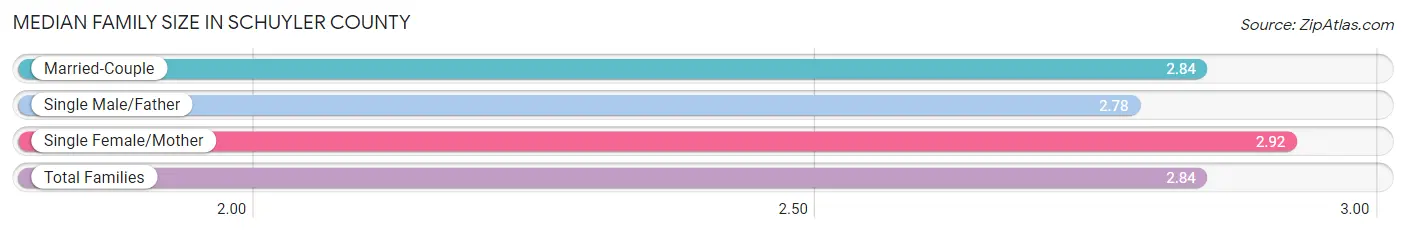
Median Family Size in Schuyler County
The median family size in Schuyler County is 2.84 persons per family, with single female/mother families (454 | 9.9%) accounting for the largest median family size of 2.92 persons per family. On the other hand, single male/father families (391 | 8.5%) represent the smallest median family size with 2.78 persons per family.
| Family Type | # Families | Family Size |
| Married-Couple | 3,742 (81.6%) | 2.84 |
| Single Male/Father | 391 (8.5%) | 2.78 |
| Single Female/Mother | 454 (9.9%) | 2.92 |
| Total Families | 4,587 (100.0%) | 2.84 |
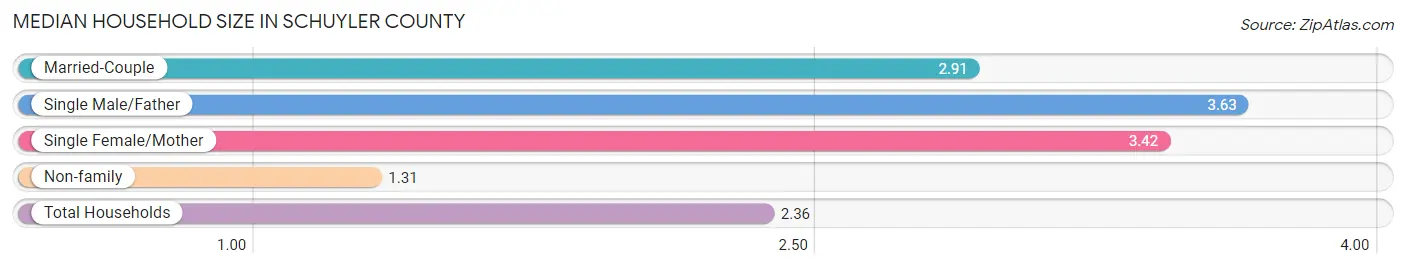
Median Household Size in Schuyler County
The median household size in Schuyler County is 2.36 persons per household, with single male/father households (391 | 5.2%) accounting for the largest median household size of 3.63 persons per household. non-family households (2,859 | 38.4%) represent the smallest median household size with 1.31 persons per household.
| Household Type | # Households | Household Size |
| Married-Couple | 3,742 (50.3%) | 2.91 |
| Single Male/Father | 391 (5.2%) | 3.63 |
| Single Female/Mother | 454 (6.1%) | 3.42 |
| Non-family | 2,859 (38.4%) | 1.31 |
| Total Households | 7,446 (100.0%) | 2.36 |
Household Size by Marriage Status in Schuyler County
Out of a total of 7,446 households in Schuyler County, 4,587 (61.6%) are family households, while 2,859 (38.4%) are nonfamily households. The most numerous type of family households are 2-person households, comprising 2,396, and the most common type of nonfamily households are 1-person households, comprising 2,212.
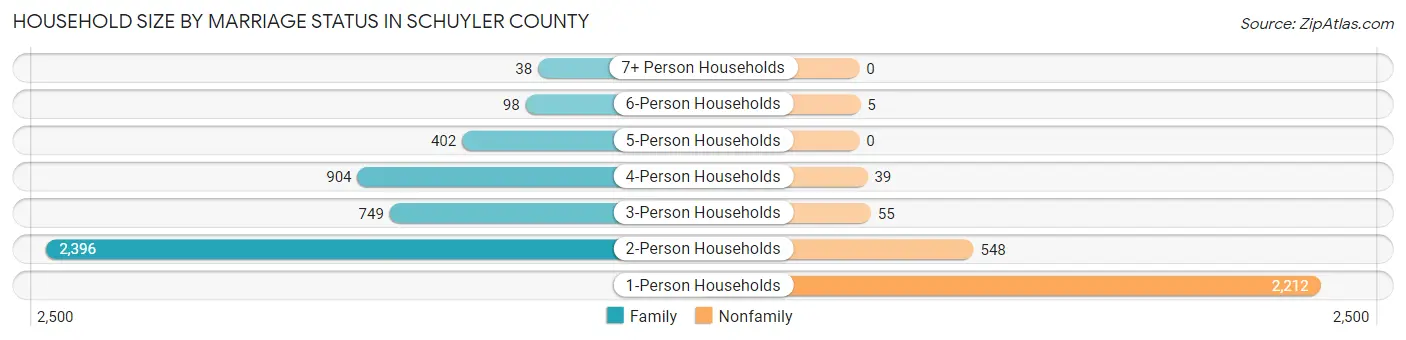
| Household Size | Family Households | Nonfamily Households |
| 1-Person Households | - | 2,212 (29.7%) |
| 2-Person Households | 2,396 (32.2%) | 548 (7.4%) |
| 3-Person Households | 749 (10.1%) | 55 (0.7%) |
| 4-Person Households | 904 (12.1%) | 39 (0.5%) |
| 5-Person Households | 402 (5.4%) | 0 (0.0%) |
| 6-Person Households | 98 (1.3%) | 5 (0.1%) |
| 7+ Person Households | 38 (0.5%) | 0 (0.0%) |
| Total | 4,587 (61.6%) | 2,859 (38.4%) |
Female Fertility in Schuyler County
Fertility by Age in Schuyler County
Average fertility rate in Schuyler County is 25.0 births per 1,000 women. Women in the age bracket of 20 to 34 years have the highest fertility rate with 42.0 births per 1,000 women. Women in the age bracket of 20 to 34 years acount for 63.2% of all women with births.
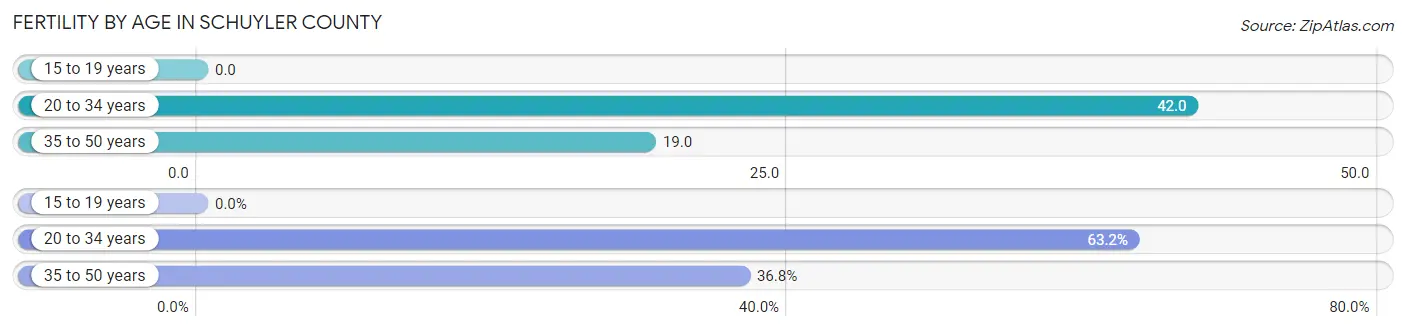
| Age Bracket | Women with Births | Births / 1,000 Women |
| 15 to 19 years | 0 (0.0%) | 0.0 |
| 20 to 34 years | 55 (63.2%) | 42.0 |
| 35 to 50 years | 32 (36.8%) | 19.0 |
| Total | 87 (100.0%) | 25.0 |
Fertility by Age by Marriage Status in Schuyler County
74.7% of women with births (87) in Schuyler County are married. The highest percentage of unmarried women with births falls into 20 to 34 years age bracket with 29.1% of them unmarried at the time of birth, while the lowest percentage of unmarried women with births belong to 35 to 50 years age bracket with 18.8% of them unmarried.
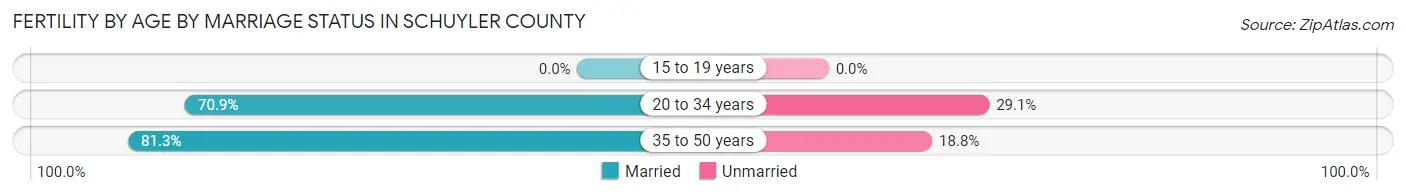
| Age Bracket | Married | Unmarried |
| 15 to 19 years | 0 (0.0%) | 0 (0.0%) |
| 20 to 34 years | 39 (70.9%) | 16 (29.1%) |
| 35 to 50 years | 26 (81.2%) | 6 (18.8%) |
| Total | 65 (74.7%) | 22 (25.3%) |
Fertility by Education in Schuyler County
Average fertility rate in Schuyler County is 25.0 births per 1,000 women. Women with the education attainment of graduate degree have the highest fertility rate of 56.0 births per 1,000 women, while women with the education attainment of less than high school have the lowest fertility at 6.0 births per 1,000 women. Women with the education attainment of high school diploma represent 42.5% of all women with births.
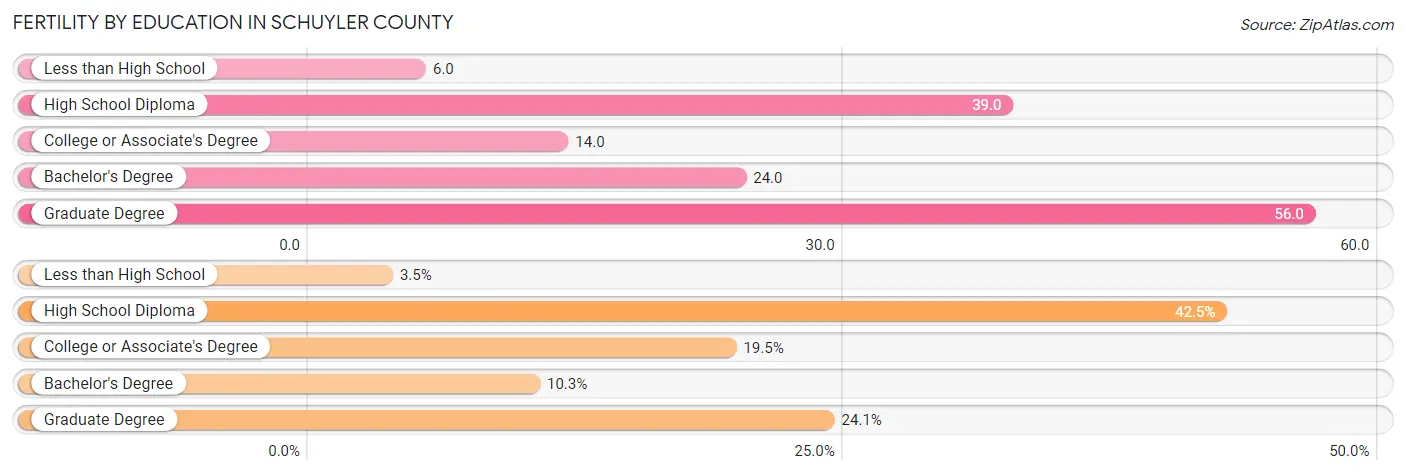
| Educational Attainment | Women with Births | Births / 1,000 Women |
| Less than High School | 3 (3.5%) | 6.0 |
| High School Diploma | 37 (42.5%) | 39.0 |
| College or Associate's Degree | 17 (19.5%) | 14.0 |
| Bachelor's Degree | 9 (10.3%) | 24.0 |
| Graduate Degree | 21 (24.1%) | 56.0 |
| Total | 87 (100.0%) | 25.0 |
Fertility by Education by Marriage Status in Schuyler County
25.3% of women with births in Schuyler County are unmarried. Women with the educational attainment of less than high school are most likely to be married with 100.0% of them married at childbirth, while women with the educational attainment of college or associate's degree are least likely to be married with 52.9% of them unmarried at childbirth.
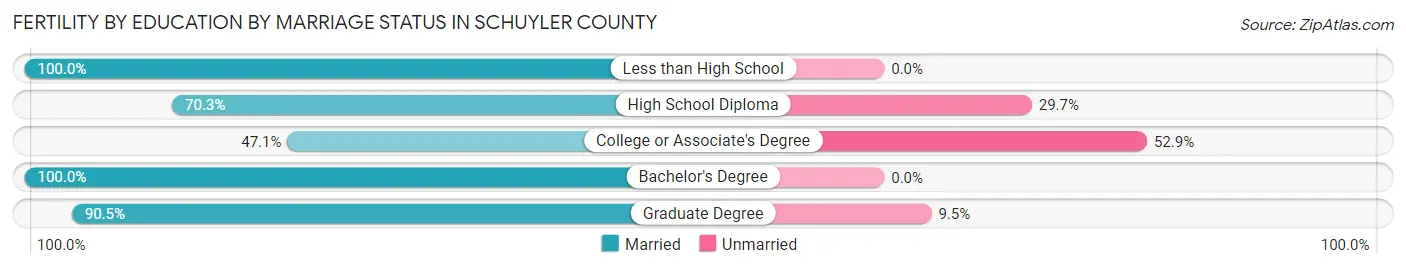
| Educational Attainment | Married | Unmarried |
| Less than High School | 3 (100.0%) | 0 (0.0%) |
| High School Diploma | 26 (70.3%) | 11 (29.7%) |
| College or Associate's Degree | 8 (47.1%) | 9 (52.9%) |
| Bachelor's Degree | 9 (100.0%) | 0 (0.0%) |
| Graduate Degree | 19 (90.5%) | 2 (9.5%) |
| Total | 65 (74.7%) | 22 (25.3%) |
Employment Characteristics in Schuyler County
Employment by Class of Employer in Schuyler County
Among the 7,982 employed individuals in Schuyler County, private company employees (4,428 | 55.5%), not-for-profit organizations (1,169 | 14.6%), and local government employees (925 | 11.6%) make up the most common classes of employment.
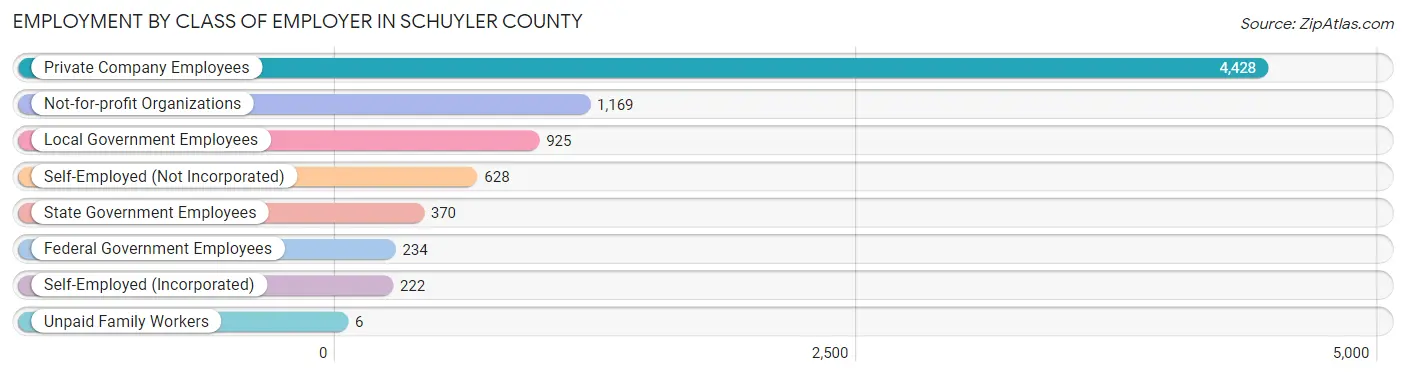
| Employer Class | # Employees | % Employees |
| Private Company Employees | 4,428 | 55.5% |
| Self-Employed (Incorporated) | 222 | 2.8% |
| Self-Employed (Not Incorporated) | 628 | 7.9% |
| Not-for-profit Organizations | 1,169 | 14.6% |
| Local Government Employees | 925 | 11.6% |
| State Government Employees | 370 | 4.6% |
| Federal Government Employees | 234 | 2.9% |
| Unpaid Family Workers | 6 | 0.1% |
| Total | 7,982 | 100.0% |
Employment Status by Age in Schuyler County
According to the labor force statistics for Schuyler County, out of the total population over 16 years of age (14,927), 58.5% or 8,732 individuals are in the labor force, with 5.7% or 498 of them unemployed. The age group with the highest labor force participation rate is 25 to 29 years, with 83.0% or 798 individuals in the labor force. Within the labor force, the 20 to 24 years age range has the highest percentage of unemployed individuals, with 18.5% or 120 of them being unemployed.
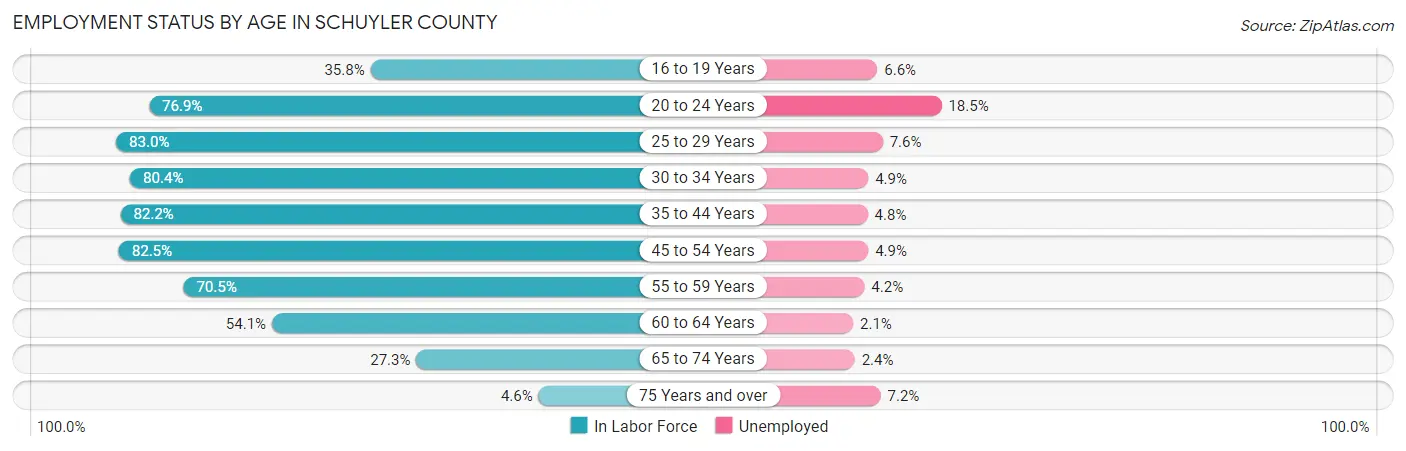
| Age Bracket | In Labor Force | Unemployed |
| 16 to 19 Years | 286 (35.8%) | 19 (6.6%) |
| 20 to 24 Years | 650 (76.9%) | 120 (18.5%) |
| 25 to 29 Years | 798 (83.0%) | 61 (7.6%) |
| 30 to 34 Years | 750 (80.4%) | 37 (4.9%) |
| 35 to 44 Years | 1,651 (82.2%) | 79 (4.8%) |
| 45 to 54 Years | 2,027 (82.5%) | 99 (4.9%) |
| 55 to 59 Years | 945 (70.5%) | 40 (4.2%) |
| 60 to 64 Years | 888 (54.1%) | 19 (2.1%) |
| 65 to 74 Years | 666 (27.3%) | 16 (2.4%) |
| 75 Years and over | 69 (4.6%) | 5 (7.2%) |
| Total | 8,732 (58.5%) | 498 (5.7%) |
Employment Status by Educational Attainment in Schuyler County
According to labor force statistics for Schuyler County, 75.6% of individuals (7,064) out of the total population between 25 and 64 years of age (9,344) are in the labor force, with 4.7% or 332 of them being unemployed. The group with the highest labor force participation rate are those with the educational attainment of bachelor's degree or higher, with 87.5% or 1,988 individuals in the labor force. Within the labor force, individuals with less than high school education have the highest percentage of unemployment, with 9.2% or 35 of them being unemployed.
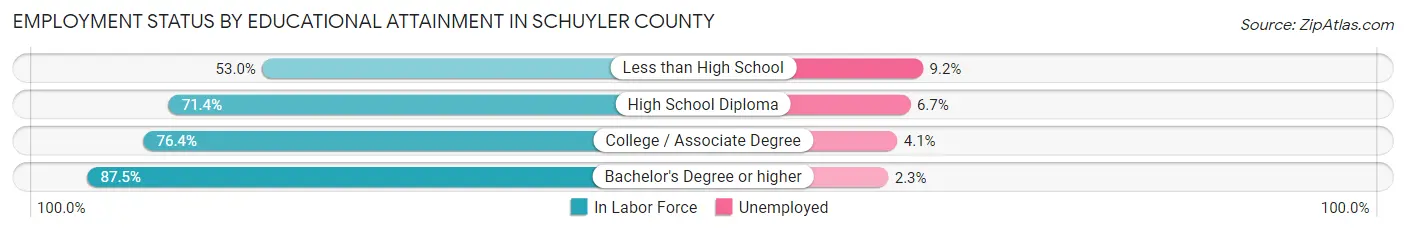
| Educational Attainment | In Labor Force | Unemployed |
| Less than High School | 380 (53.0%) | 66 (9.2%) |
| High School Diploma | 2,325 (71.4%) | 218 (6.7%) |
| College / Associate Degree | 2,368 (76.4%) | 127 (4.1%) |
| Bachelor's Degree or higher | 1,988 (87.5%) | 52 (2.3%) |
| Total | 7,064 (75.6%) | 439 (4.7%) |
Employment Occupations by Sex in Schuyler County
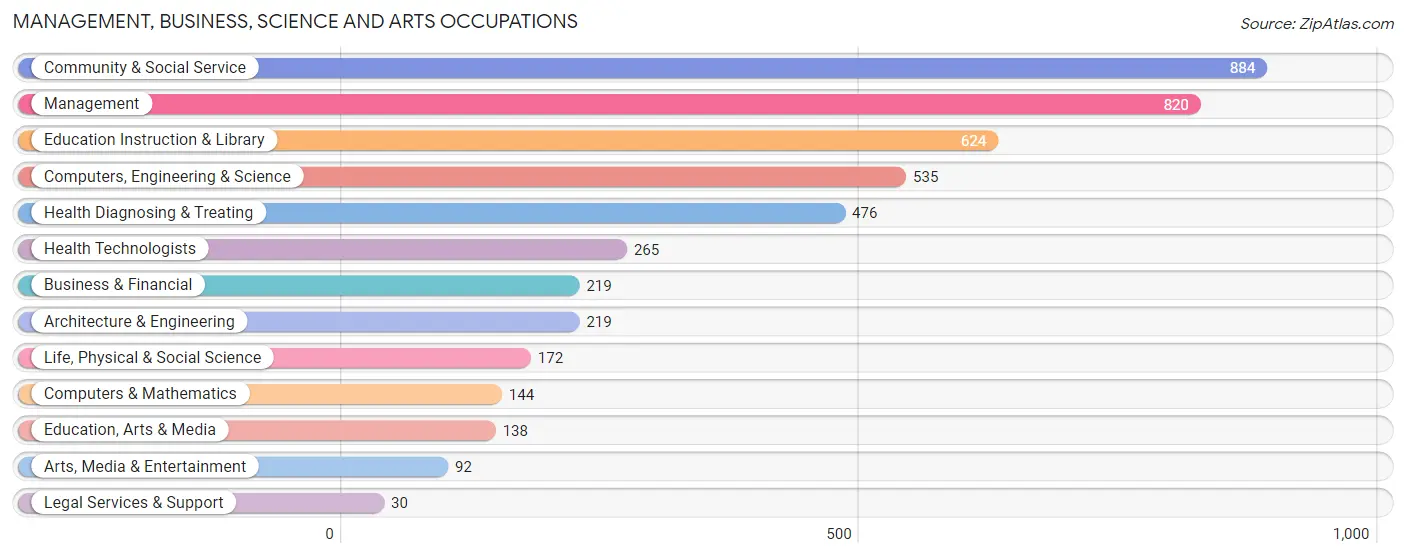
Management, Business, Science and Arts Occupations
The most common Management, Business, Science and Arts occupations in Schuyler County are Community & Social Service (884 | 10.8%), Management (820 | 10.0%), Education Instruction & Library (624 | 7.6%), Computers, Engineering & Science (535 | 6.5%), and Health Diagnosing & Treating (476 | 5.8%).
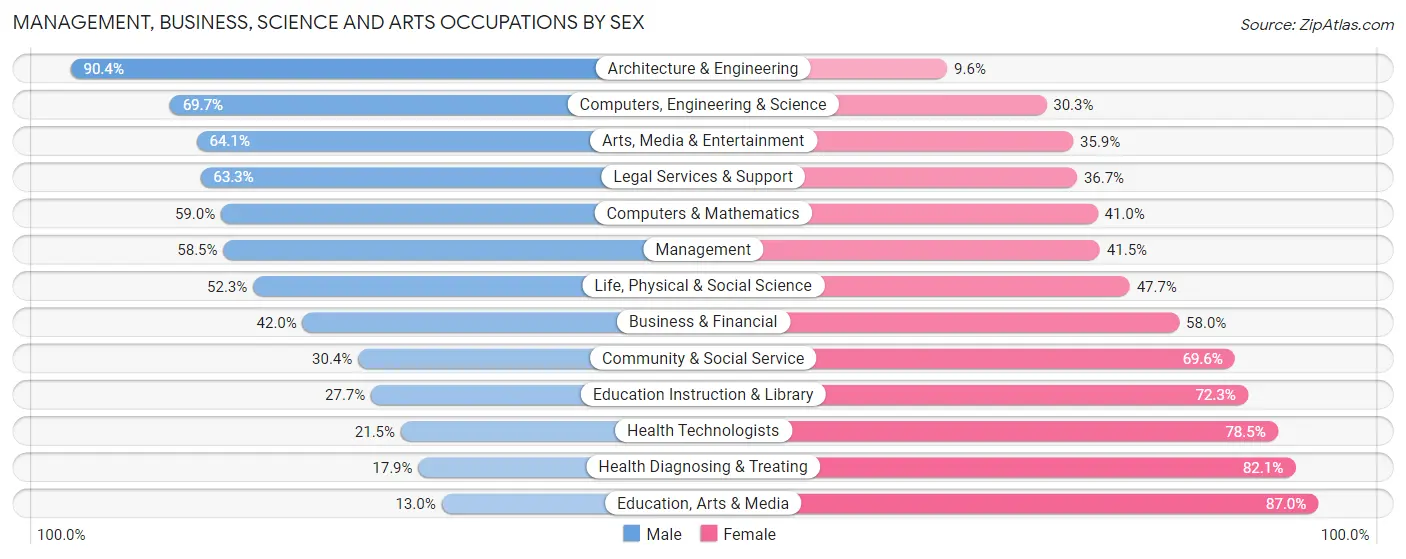
Management, Business, Science and Arts Occupations by Sex
Within the Management, Business, Science and Arts occupations in Schuyler County, the most male-oriented occupations are Architecture & Engineering (90.4%), Computers, Engineering & Science (69.7%), and Arts, Media & Entertainment (64.1%), while the most female-oriented occupations are Education, Arts & Media (87.0%), Health Diagnosing & Treating (82.1%), and Health Technologists (78.5%).
| Occupation | Male | Female |
| Management | 480 (58.5%) | 340 (41.5%) |
| Business & Financial | 92 (42.0%) | 127 (58.0%) |
| Computers, Engineering & Science | 373 (69.7%) | 162 (30.3%) |
| Computers & Mathematics | 85 (59.0%) | 59 (41.0%) |
| Architecture & Engineering | 198 (90.4%) | 21 (9.6%) |
| Life, Physical & Social Science | 90 (52.3%) | 82 (47.7%) |
| Community & Social Service | 269 (30.4%) | 615 (69.6%) |
| Education, Arts & Media | 18 (13.0%) | 120 (87.0%) |
| Legal Services & Support | 19 (63.3%) | 11 (36.7%) |
| Education Instruction & Library | 173 (27.7%) | 451 (72.3%) |
| Arts, Media & Entertainment | 59 (64.1%) | 33 (35.9%) |
| Health Diagnosing & Treating | 85 (17.9%) | 391 (82.1%) |
| Health Technologists | 57 (21.5%) | 208 (78.5%) |
| Total (Category) | 1,299 (44.3%) | 1,635 (55.7%) |
| Total (Overall) | 4,375 (53.4%) | 3,815 (46.6%) |
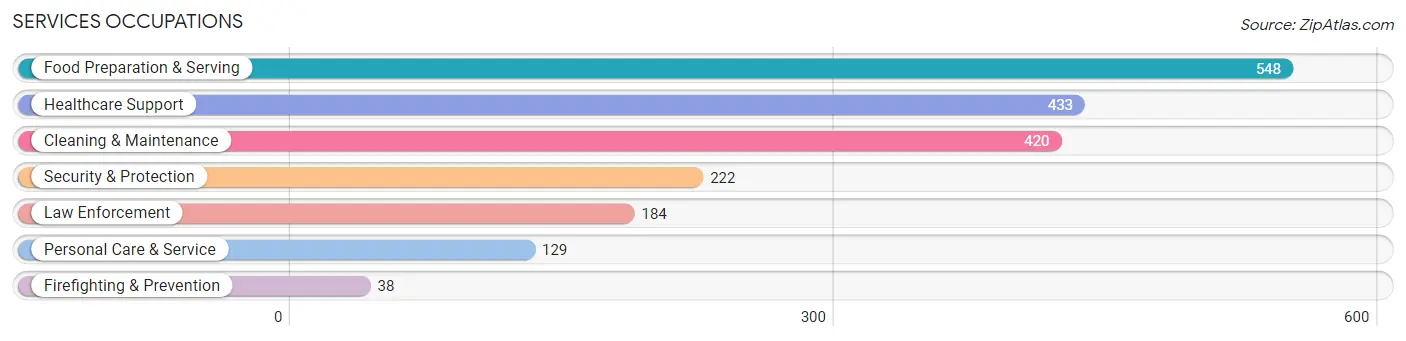
Services Occupations
The most common Services occupations in Schuyler County are Food Preparation & Serving (548 | 6.7%), Healthcare Support (433 | 5.3%), Cleaning & Maintenance (420 | 5.1%), Security & Protection (222 | 2.7%), and Law Enforcement (184 | 2.2%).
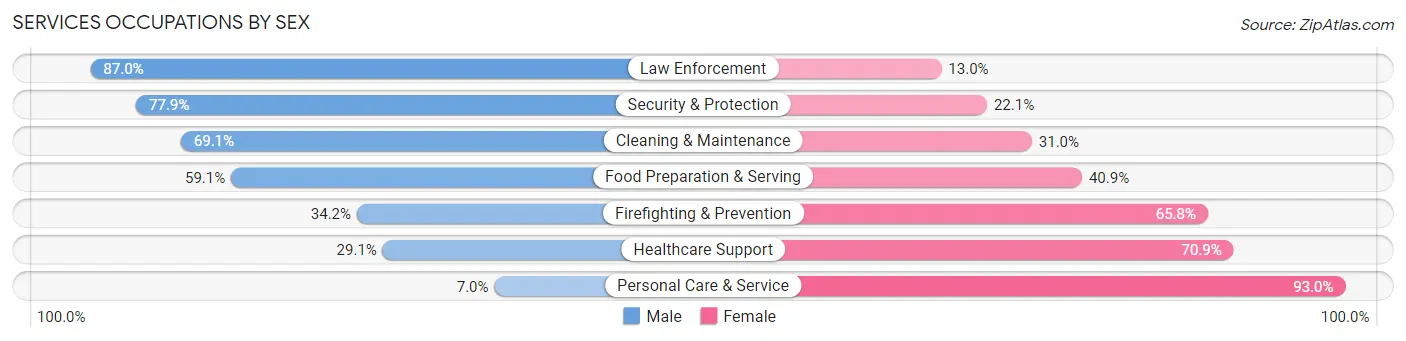
Services Occupations by Sex
Within the Services occupations in Schuyler County, the most male-oriented occupations are Law Enforcement (87.0%), Security & Protection (77.9%), and Cleaning & Maintenance (69.1%), while the most female-oriented occupations are Personal Care & Service (93.0%), Healthcare Support (70.9%), and Firefighting & Prevention (65.8%).
| Occupation | Male | Female |
| Healthcare Support | 126 (29.1%) | 307 (70.9%) |
| Security & Protection | 173 (77.9%) | 49 (22.1%) |
| Firefighting & Prevention | 13 (34.2%) | 25 (65.8%) |
| Law Enforcement | 160 (87.0%) | 24 (13.0%) |
| Food Preparation & Serving | 324 (59.1%) | 224 (40.9%) |
| Cleaning & Maintenance | 290 (69.1%) | 130 (30.9%) |
| Personal Care & Service | 9 (7.0%) | 120 (93.0%) |
| Total (Category) | 922 (52.6%) | 830 (47.4%) |
| Total (Overall) | 4,375 (53.4%) | 3,815 (46.6%) |
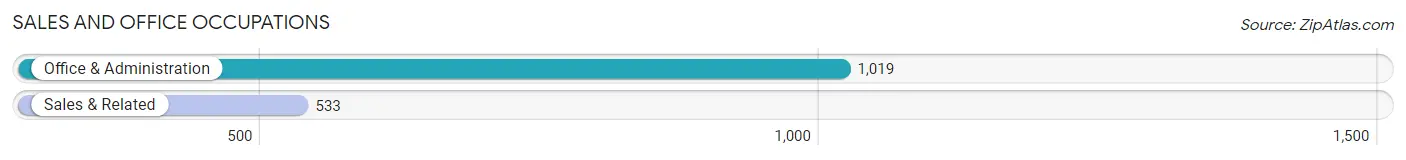
Sales and Office Occupations
The most common Sales and Office occupations in Schuyler County are Office & Administration (1,019 | 12.4%), and Sales & Related (533 | 6.5%).
Sales and Office Occupations by Sex
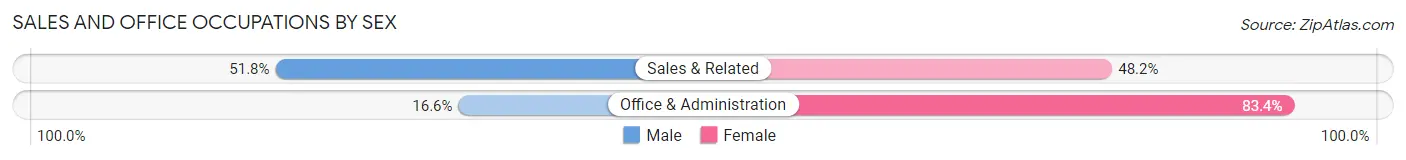
| Occupation | Male | Female |
| Sales & Related | 276 (51.8%) | 257 (48.2%) |
| Office & Administration | 169 (16.6%) | 850 (83.4%) |
| Total (Category) | 445 (28.7%) | 1,107 (71.3%) |
| Total (Overall) | 4,375 (53.4%) | 3,815 (46.6%) |
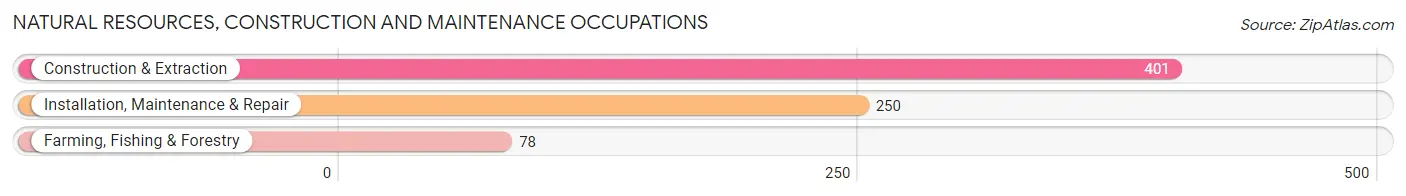
Natural Resources, Construction and Maintenance Occupations
The most common Natural Resources, Construction and Maintenance occupations in Schuyler County are Construction & Extraction (401 | 4.9%), Installation, Maintenance & Repair (250 | 3.0%), and Farming, Fishing & Forestry (78 | 0.9%).
Natural Resources, Construction and Maintenance Occupations by Sex
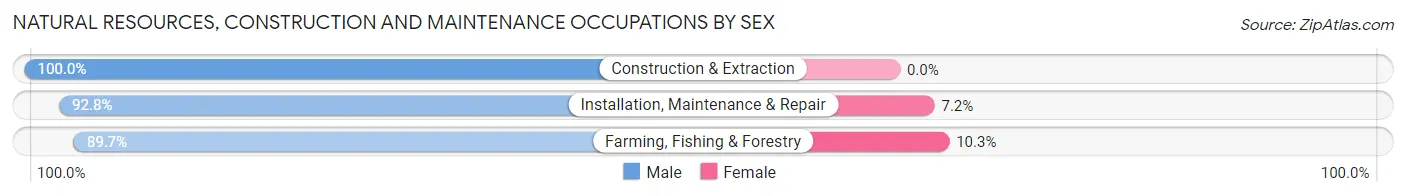
| Occupation | Male | Female |
| Farming, Fishing & Forestry | 70 (89.7%) | 8 (10.3%) |
| Construction & Extraction | 401 (100.0%) | 0 (0.0%) |
| Installation, Maintenance & Repair | 232 (92.8%) | 18 (7.2%) |
| Total (Category) | 703 (96.4%) | 26 (3.6%) |
| Total (Overall) | 4,375 (53.4%) | 3,815 (46.6%) |
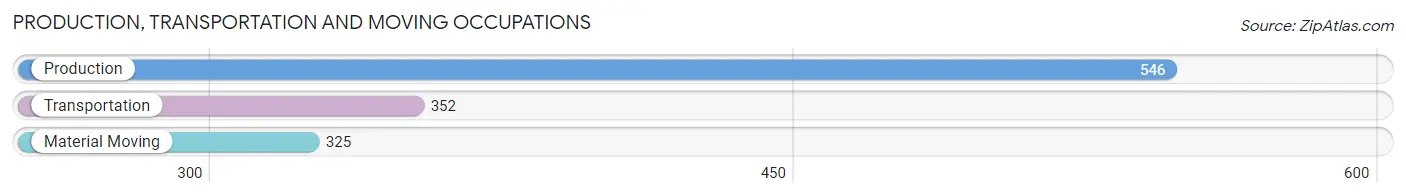
Production, Transportation and Moving Occupations
The most common Production, Transportation and Moving occupations in Schuyler County are Production (546 | 6.7%), Transportation (352 | 4.3%), and Material Moving (325 | 4.0%).
Production, Transportation and Moving Occupations by Sex
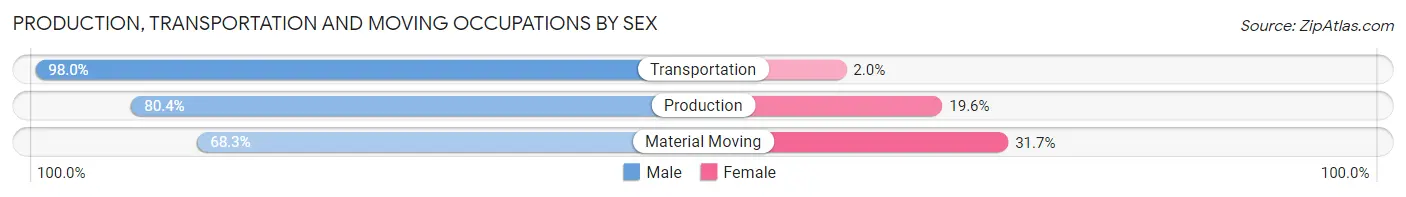
| Occupation | Male | Female |
| Production | 439 (80.4%) | 107 (19.6%) |
| Transportation | 345 (98.0%) | 7 (2.0%) |
| Material Moving | 222 (68.3%) | 103 (31.7%) |
| Total (Category) | 1,006 (82.3%) | 217 (17.7%) |
| Total (Overall) | 4,375 (53.4%) | 3,815 (46.6%) |
Employment Industries by Sex in Schuyler County
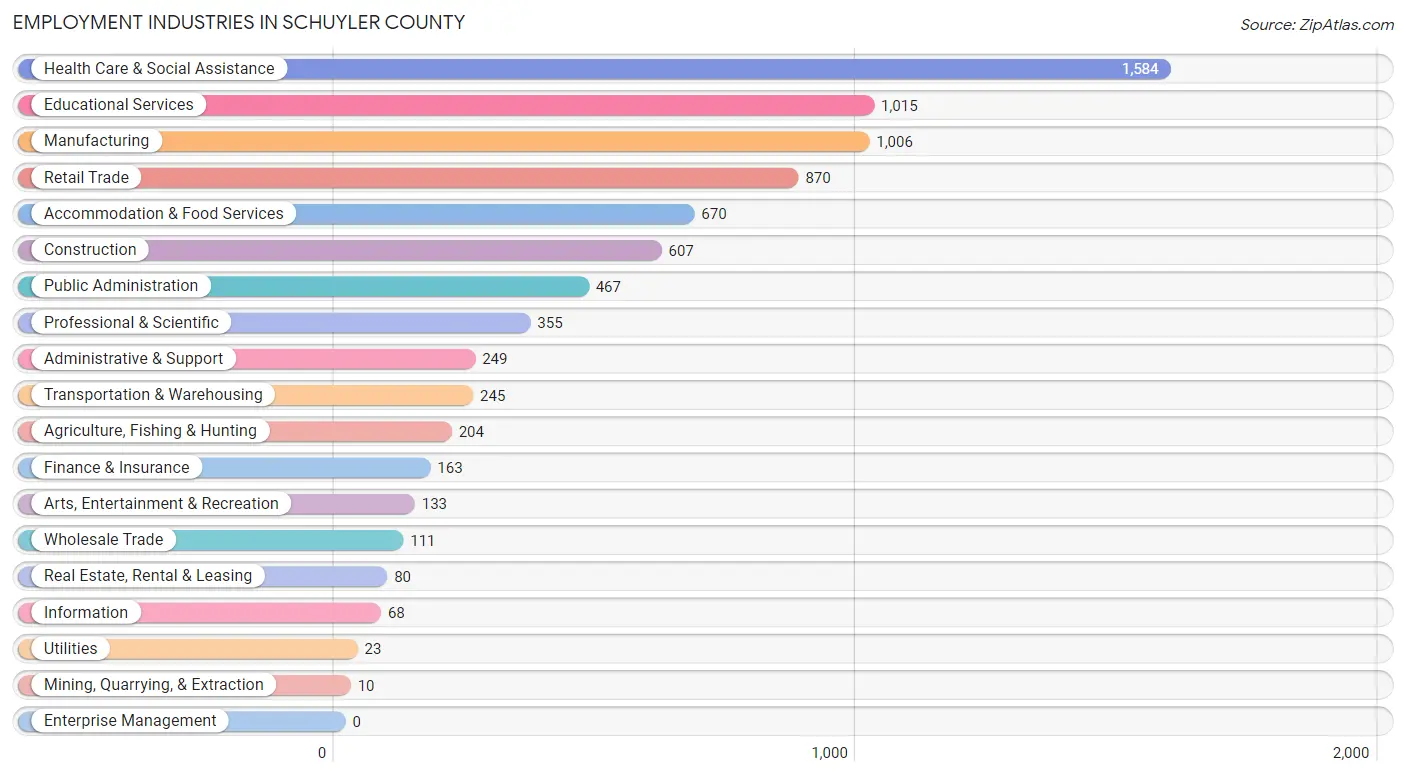
Employment Industries in Schuyler County
The major employment industries in Schuyler County include Health Care & Social Assistance (1,584 | 19.3%), Educational Services (1,015 | 12.4%), Manufacturing (1,006 | 12.3%), Retail Trade (870 | 10.6%), and Accommodation & Food Services (670 | 8.2%).
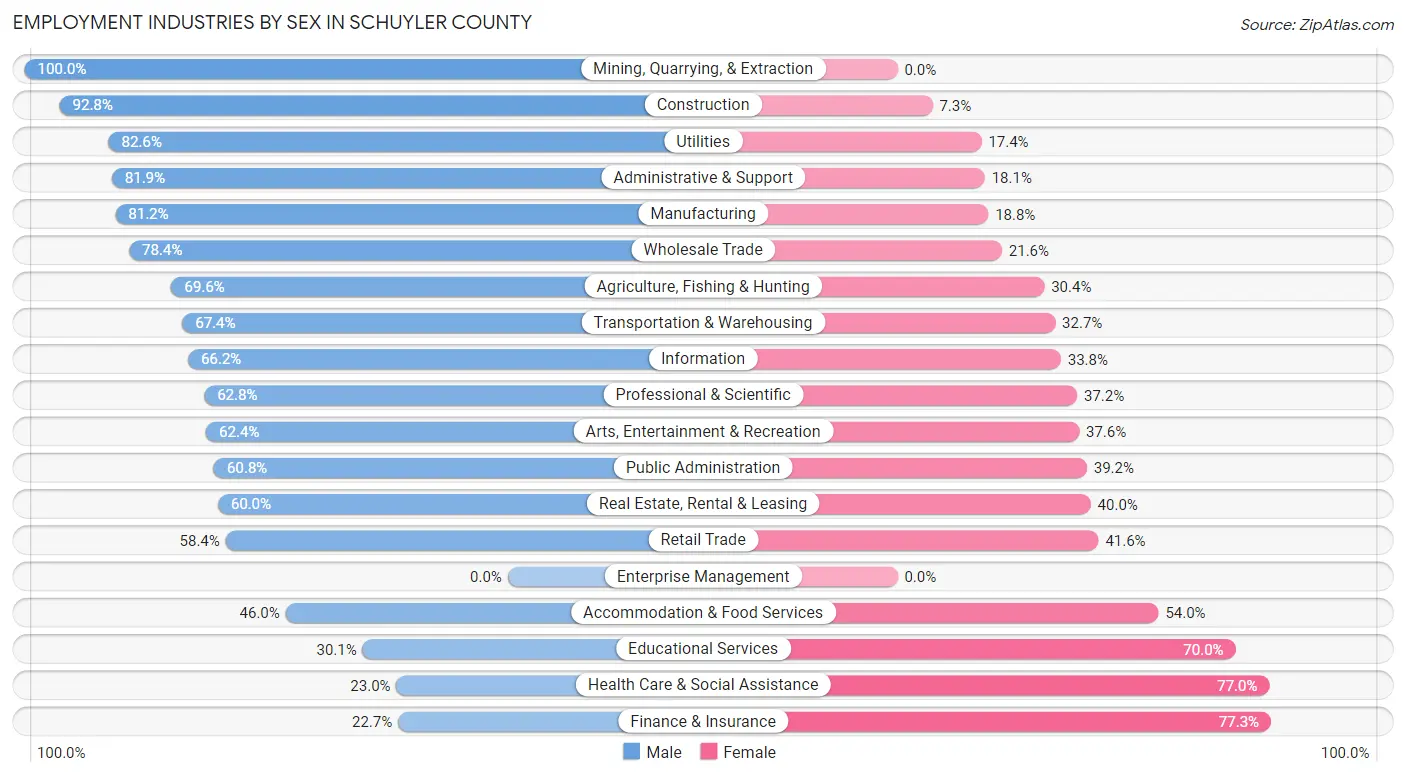
Employment Industries by Sex in Schuyler County
The Schuyler County industries that see more men than women are Mining, Quarrying, & Extraction (100.0%), Construction (92.7%), and Utilities (82.6%), whereas the industries that tend to have a higher number of women are Finance & Insurance (77.3%), Health Care & Social Assistance (77.0%), and Educational Services (70.0%).
| Industry | Male | Female |
| Agriculture, Fishing & Hunting | 142 (69.6%) | 62 (30.4%) |
| Mining, Quarrying, & Extraction | 10 (100.0%) | 0 (0.0%) |
| Construction | 563 (92.7%) | 44 (7.2%) |
| Manufacturing | 817 (81.2%) | 189 (18.8%) |
| Wholesale Trade | 87 (78.4%) | 24 (21.6%) |
| Retail Trade | 508 (58.4%) | 362 (41.6%) |
| Transportation & Warehousing | 165 (67.3%) | 80 (32.7%) |
| Utilities | 19 (82.6%) | 4 (17.4%) |
| Information | 45 (66.2%) | 23 (33.8%) |
| Finance & Insurance | 37 (22.7%) | 126 (77.3%) |
| Real Estate, Rental & Leasing | 48 (60.0%) | 32 (40.0%) |
| Professional & Scientific | 223 (62.8%) | 132 (37.2%) |
| Enterprise Management | 0 (0.0%) | 0 (0.0%) |
| Administrative & Support | 204 (81.9%) | 45 (18.1%) |
| Educational Services | 305 (30.0%) | 710 (70.0%) |
| Health Care & Social Assistance | 365 (23.0%) | 1,219 (77.0%) |
| Arts, Entertainment & Recreation | 83 (62.4%) | 50 (37.6%) |
| Accommodation & Food Services | 308 (46.0%) | 362 (54.0%) |
| Public Administration | 284 (60.8%) | 183 (39.2%) |
| Total | 4,375 (53.4%) | 3,815 (46.6%) |
Education in Schuyler County
School Enrollment in Schuyler County
The most common levels of schooling among the 3,183 students in Schuyler County are middle school (827 | 26.0%), high school (786 | 24.7%), and elementary school (669 | 21.0%).
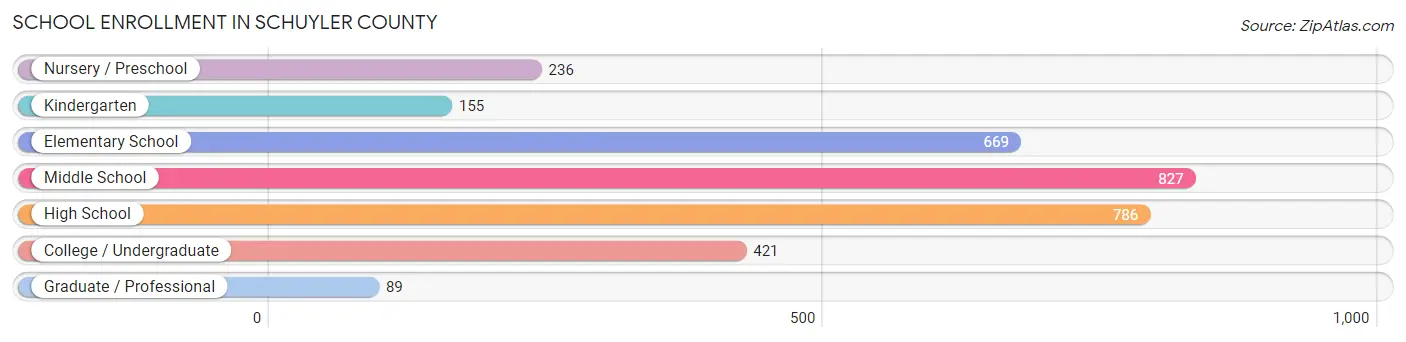
| School Level | # Students | % Students |
| Nursery / Preschool | 236 | 7.4% |
| Kindergarten | 155 | 4.9% |
| Elementary School | 669 | 21.0% |
| Middle School | 827 | 26.0% |
| High School | 786 | 24.7% |
| College / Undergraduate | 421 | 13.2% |
| Graduate / Professional | 89 | 2.8% |
| Total | 3,183 | 100.0% |
School Enrollment by Age by Funding Source in Schuyler County
Out of a total of 3,183 students who are enrolled in schools in Schuyler County, 283 (8.9%) attend a private institution, while the remaining 2,900 (91.1%) are enrolled in public schools. The age group of 25 to 34 year olds has the highest likelihood of being enrolled in private schools, with 28 (58.3% in the age bracket) enrolled. Conversely, the age group of 15 to 17 year olds has the lowest likelihood of being enrolled in a private school, with 571 (99.8% in the age bracket) attending a public institution.
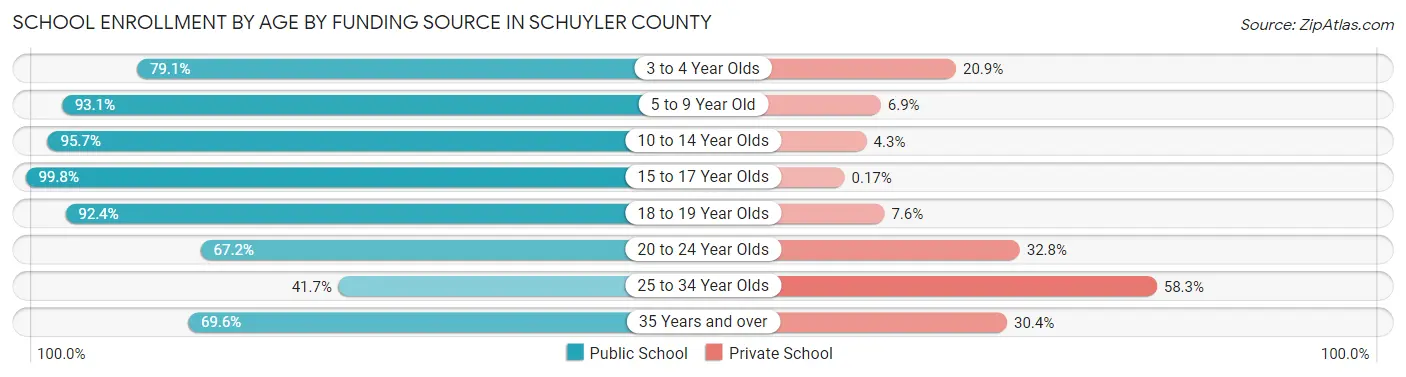
| Age Bracket | Public School | Private School |
| 3 to 4 Year Olds | 151 (79.1%) | 40 (20.9%) |
| 5 to 9 Year Old | 753 (93.1%) | 56 (6.9%) |
| 10 to 14 Year Olds | 961 (95.7%) | 43 (4.3%) |
| 15 to 17 Year Olds | 571 (99.8%) | 1 (0.2%) |
| 18 to 19 Year Olds | 231 (92.4%) | 19 (7.6%) |
| 20 to 24 Year Olds | 84 (67.2%) | 41 (32.8%) |
| 25 to 34 Year Olds | 20 (41.7%) | 28 (58.3%) |
| 35 Years and over | 128 (69.6%) | 56 (30.4%) |
| Total | 2,900 (91.1%) | 283 (8.9%) |
Educational Attainment by Field of Study in Schuyler County
Education (564 | 15.8%), business (498 | 14.0%), bio, nature & agricultural (404 | 11.3%), science & technology (379 | 10.6%), and psychology (360 | 10.1%) are the most common fields of study among 3,570 individuals in Schuyler County who have obtained a bachelor's degree or higher.
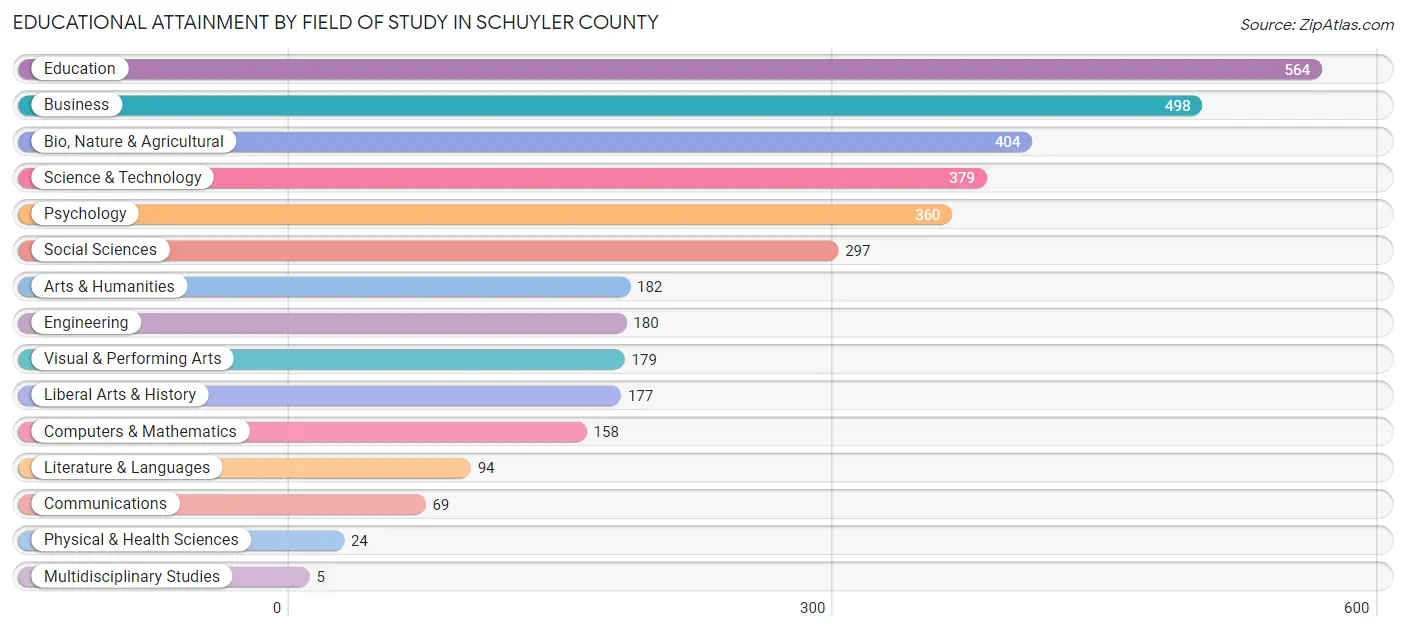
| Field of Study | # Graduates | % Graduates |
| Computers & Mathematics | 158 | 4.4% |
| Bio, Nature & Agricultural | 404 | 11.3% |
| Physical & Health Sciences | 24 | 0.7% |
| Psychology | 360 | 10.1% |
| Social Sciences | 297 | 8.3% |
| Engineering | 180 | 5.0% |
| Multidisciplinary Studies | 5 | 0.1% |
| Science & Technology | 379 | 10.6% |
| Business | 498 | 14.0% |
| Education | 564 | 15.8% |
| Literature & Languages | 94 | 2.6% |
| Liberal Arts & History | 177 | 5.0% |
| Visual & Performing Arts | 179 | 5.0% |
| Communications | 69 | 1.9% |
| Arts & Humanities | 182 | 5.1% |
| Total | 3,570 | 100.0% |
Transportation & Commute in Schuyler County
Vehicle Availability by Sex in Schuyler County
The most prevalent vehicle ownership categories in Schuyler County are males with 2 vehicles (1,742, accounting for 40.2%) and females with 2 vehicles (1,409, making up 47.7%).
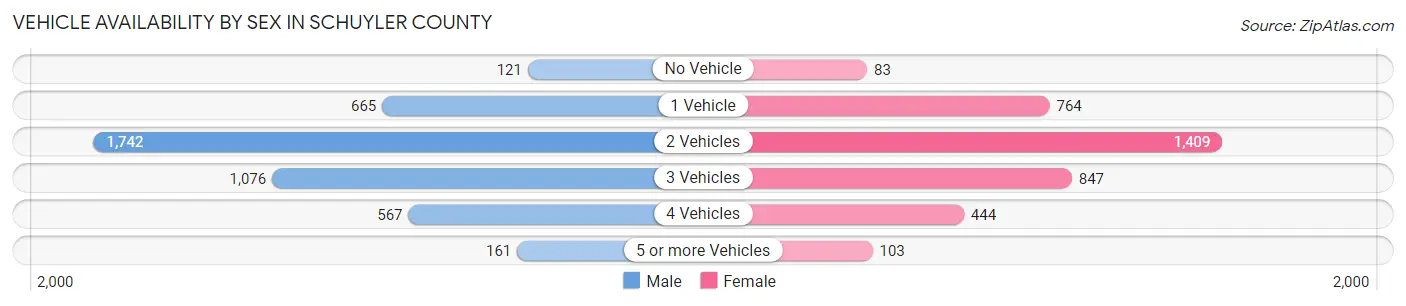
| Vehicles Available | Male | Female |
| No Vehicle | 121 (2.8%) | 83 (2.3%) |
| 1 Vehicle | 665 (15.3%) | 764 (20.9%) |
| 2 Vehicles | 1,742 (40.2%) | 1,409 (38.6%) |
| 3 Vehicles | 1,076 (24.8%) | 847 (23.2%) |
| 4 Vehicles | 567 (13.1%) | 444 (12.2%) |
| 5 or more Vehicles | 161 (3.7%) | 103 (2.8%) |
| Total | 4,332 (100.0%) | 3,650 (100.0%) |
Commute Time in Schuyler County
The most frequently occuring commute durations in Schuyler County are 15 to 19 minutes (957 commuters, 13.1%), 30 to 34 minutes (851 commuters, 11.6%), and 20 to 24 minutes (832 commuters, 11.4%).
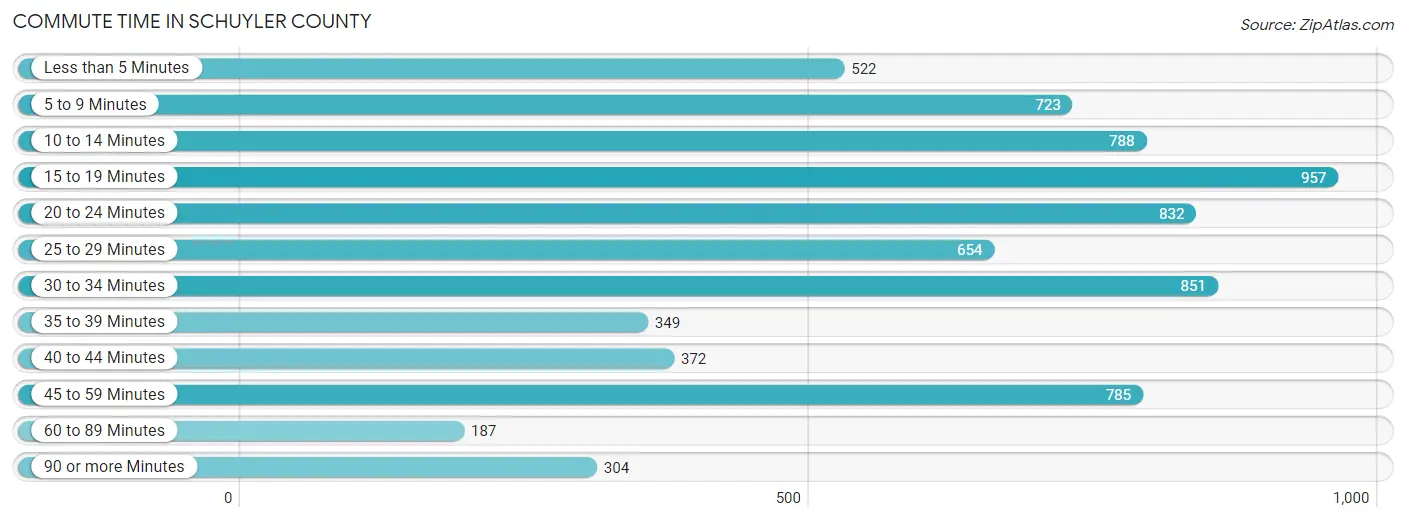
| Commute Time | # Commuters | % Commuters |
| Less than 5 Minutes | 522 | 7.1% |
| 5 to 9 Minutes | 723 | 9.9% |
| 10 to 14 Minutes | 788 | 10.8% |
| 15 to 19 Minutes | 957 | 13.1% |
| 20 to 24 Minutes | 832 | 11.4% |
| 25 to 29 Minutes | 654 | 8.9% |
| 30 to 34 Minutes | 851 | 11.6% |
| 35 to 39 Minutes | 349 | 4.8% |
| 40 to 44 Minutes | 372 | 5.1% |
| 45 to 59 Minutes | 785 | 10.7% |
| 60 to 89 Minutes | 187 | 2.5% |
| 90 or more Minutes | 304 | 4.2% |
Commute Time by Sex in Schuyler County
The most common commute times in Schuyler County are 45 to 59 minutes (528 commuters, 13.2%) for males and 10 to 14 minutes (467 commuters, 14.1%) for females.
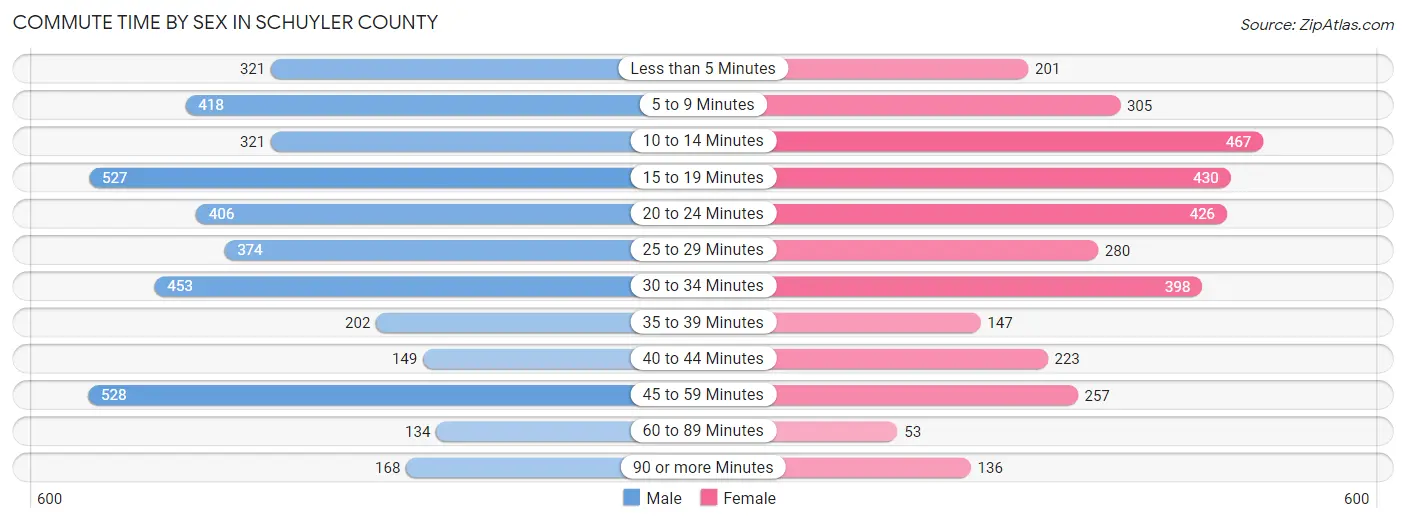
| Commute Time | Male | Female |
| Less than 5 Minutes | 321 (8.0%) | 201 (6.0%) |
| 5 to 9 Minutes | 418 (10.4%) | 305 (9.2%) |
| 10 to 14 Minutes | 321 (8.0%) | 467 (14.1%) |
| 15 to 19 Minutes | 527 (13.2%) | 430 (12.9%) |
| 20 to 24 Minutes | 406 (10.2%) | 426 (12.8%) |
| 25 to 29 Minutes | 374 (9.3%) | 280 (8.4%) |
| 30 to 34 Minutes | 453 (11.3%) | 398 (12.0%) |
| 35 to 39 Minutes | 202 (5.1%) | 147 (4.4%) |
| 40 to 44 Minutes | 149 (3.7%) | 223 (6.7%) |
| 45 to 59 Minutes | 528 (13.2%) | 257 (7.7%) |
| 60 to 89 Minutes | 134 (3.4%) | 53 (1.6%) |
| 90 or more Minutes | 168 (4.2%) | 136 (4.1%) |
Time of Departure to Work by Sex in Schuyler County
The most frequent times of departure to work in Schuyler County are 7:00 AM to 7:29 AM (710, 17.7%) for males and 7:00 AM to 7:29 AM (530, 16.0%) for females.
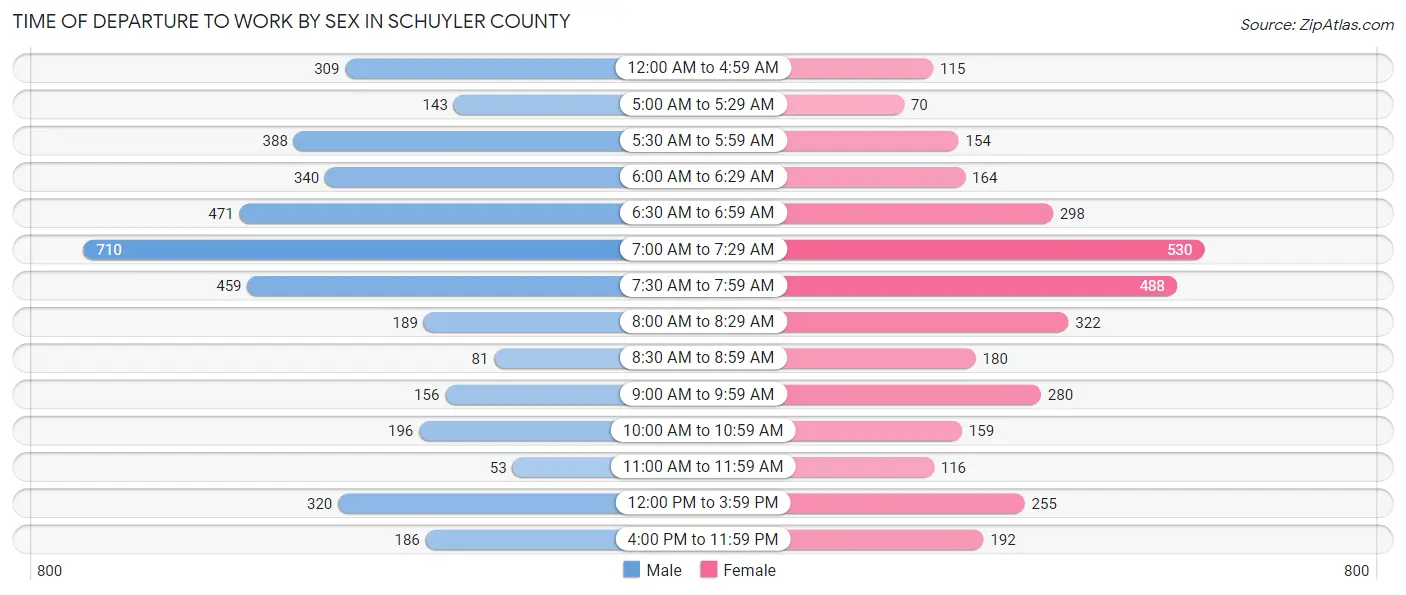
| Time of Departure | Male | Female |
| 12:00 AM to 4:59 AM | 309 (7.7%) | 115 (3.5%) |
| 5:00 AM to 5:29 AM | 143 (3.6%) | 70 (2.1%) |
| 5:30 AM to 5:59 AM | 388 (9.7%) | 154 (4.6%) |
| 6:00 AM to 6:29 AM | 340 (8.5%) | 164 (4.9%) |
| 6:30 AM to 6:59 AM | 471 (11.8%) | 298 (9.0%) |
| 7:00 AM to 7:29 AM | 710 (17.7%) | 530 (16.0%) |
| 7:30 AM to 7:59 AM | 459 (11.5%) | 488 (14.7%) |
| 8:00 AM to 8:29 AM | 189 (4.7%) | 322 (9.7%) |
| 8:30 AM to 8:59 AM | 81 (2.0%) | 180 (5.4%) |
| 9:00 AM to 9:59 AM | 156 (3.9%) | 280 (8.4%) |
| 10:00 AM to 10:59 AM | 196 (4.9%) | 159 (4.8%) |
| 11:00 AM to 11:59 AM | 53 (1.3%) | 116 (3.5%) |
| 12:00 PM to 3:59 PM | 320 (8.0%) | 255 (7.7%) |
| 4:00 PM to 11:59 PM | 186 (4.6%) | 192 (5.8%) |
| Total | 4,001 (100.0%) | 3,323 (100.0%) |
Housing Occupancy in Schuyler County
Occupancy by Ownership in Schuyler County
Of the total 7,446 dwellings in Schuyler County, owner-occupied units account for 5,724 (76.9%), while renter-occupied units make up 1,722 (23.1%).
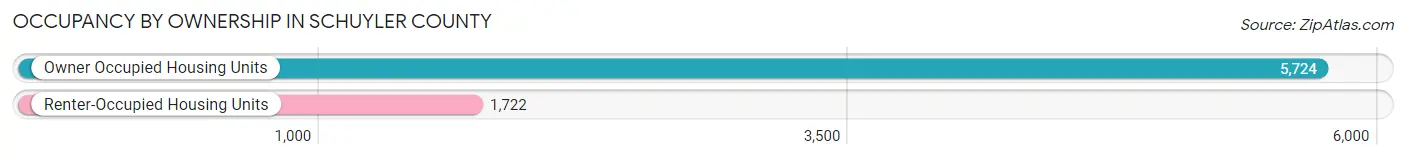
| Occupancy | # Housing Units | % Housing Units |
| Owner Occupied Housing Units | 5,724 | 76.9% |
| Renter-Occupied Housing Units | 1,722 | 23.1% |
| Total Occupied Housing Units | 7,446 | 100.0% |
Occupancy by Household Size in Schuyler County
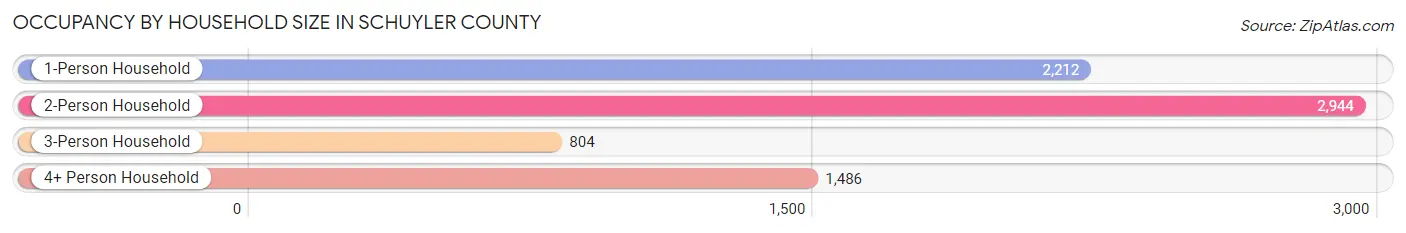
| Household Size | # Housing Units | % Housing Units |
| 1-Person Household | 2,212 | 29.7% |
| 2-Person Household | 2,944 | 39.5% |
| 3-Person Household | 804 | 10.8% |
| 4+ Person Household | 1,486 | 20.0% |
| Total Housing Units | 7,446 | 100.0% |
Occupancy by Ownership by Household Size in Schuyler County
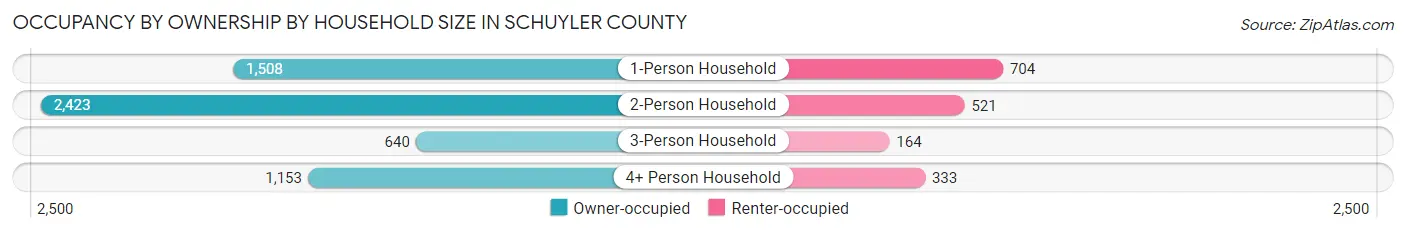
| Household Size | Owner-occupied | Renter-occupied |
| 1-Person Household | 1,508 (68.2%) | 704 (31.8%) |
| 2-Person Household | 2,423 (82.3%) | 521 (17.7%) |
| 3-Person Household | 640 (79.6%) | 164 (20.4%) |
| 4+ Person Household | 1,153 (77.6%) | 333 (22.4%) |
| Total Housing Units | 5,724 (76.9%) | 1,722 (23.1%) |
Occupancy by Educational Attainment in Schuyler County
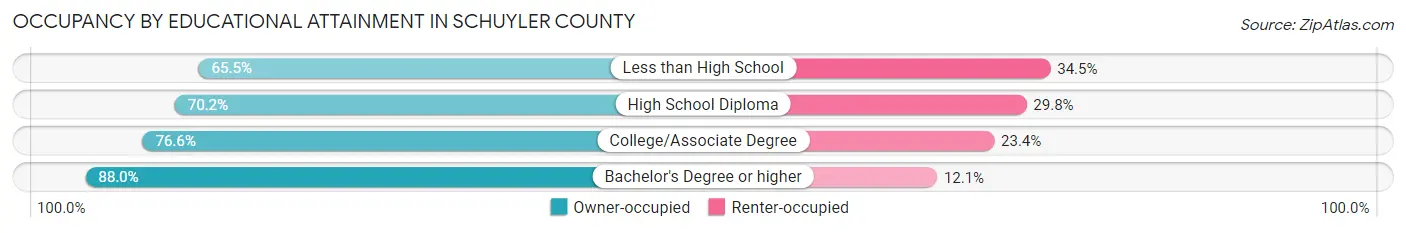
| Household Size | Owner-occupied | Renter-occupied |
| Less than High School | 349 (65.5%) | 184 (34.5%) |
| High School Diploma | 1,673 (70.2%) | 710 (29.8%) |
| College/Associate Degree | 1,907 (76.6%) | 582 (23.4%) |
| Bachelor's Degree or higher | 1,795 (87.9%) | 246 (12.0%) |
Occupancy by Age of Householder in Schuyler County
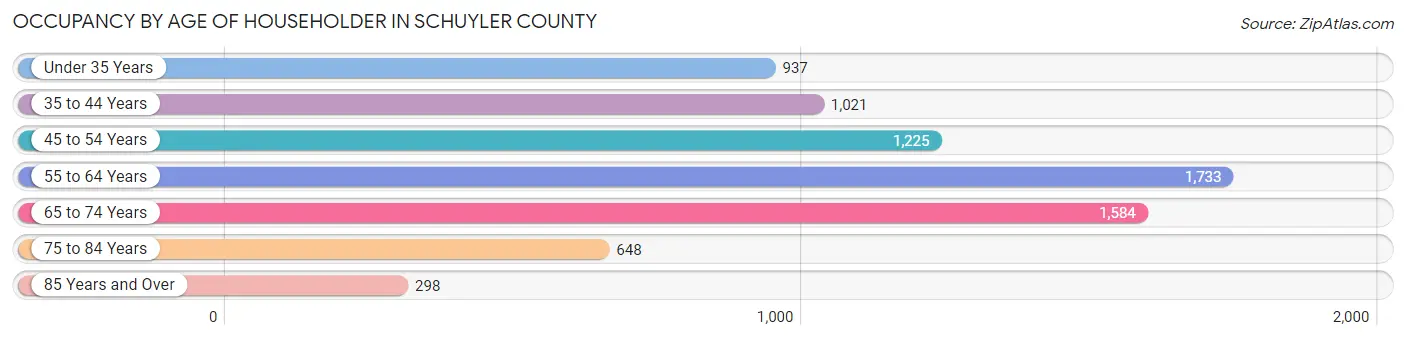
| Age Bracket | # Households | % Households |
| Under 35 Years | 937 | 12.6% |
| 35 to 44 Years | 1,021 | 13.7% |
| 45 to 54 Years | 1,225 | 16.5% |
| 55 to 64 Years | 1,733 | 23.3% |
| 65 to 74 Years | 1,584 | 21.3% |
| 75 to 84 Years | 648 | 8.7% |
| 85 Years and Over | 298 | 4.0% |
| Total | 7,446 | 100.0% |
Housing Finances in Schuyler County
Median Income by Occupancy in Schuyler County
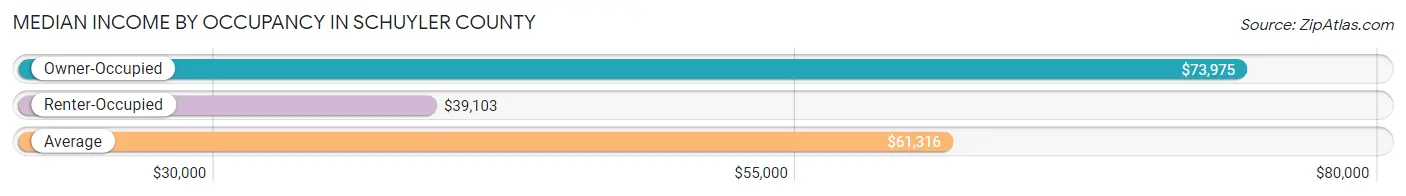
| Occupancy Type | # Households | Median Income |
| Owner-Occupied | 5,724 (76.9%) | $73,975 |
| Renter-Occupied | 1,722 (23.1%) | $39,103 |
| Average | 7,446 (100.0%) | $61,316 |
Occupancy by Householder Income Bracket in Schuyler County
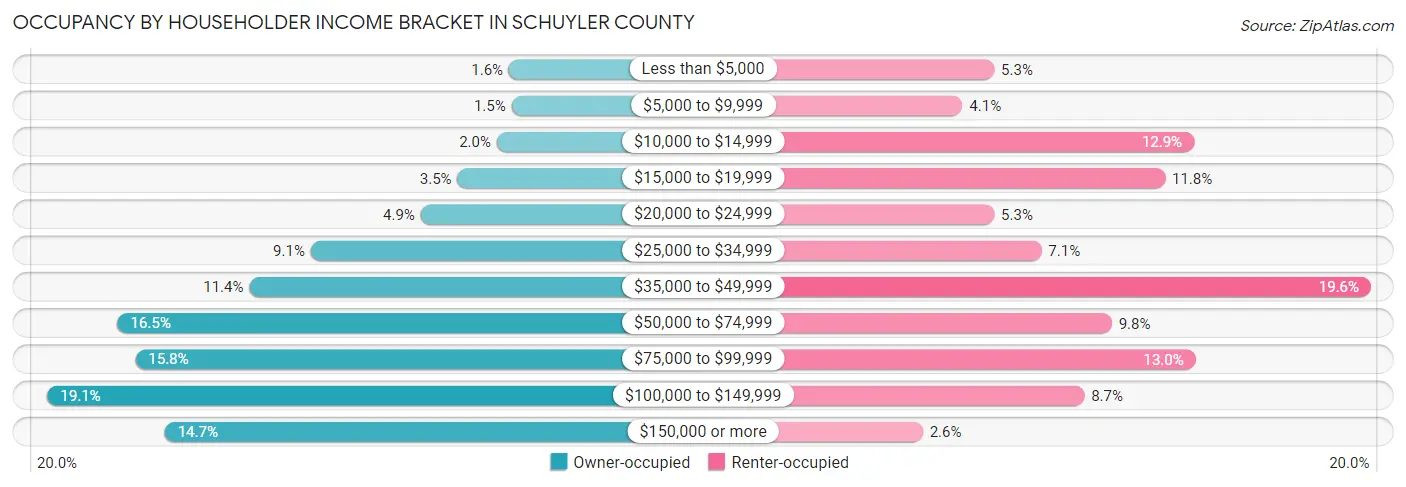
| Income Bracket | Owner-occupied | Renter-occupied |
| Less than $5,000 | 89 (1.5%) | 91 (5.3%) |
| $5,000 to $9,999 | 83 (1.5%) | 70 (4.1%) |
| $10,000 to $14,999 | 115 (2.0%) | 222 (12.9%) |
| $15,000 to $19,999 | 201 (3.5%) | 203 (11.8%) |
| $20,000 to $24,999 | 281 (4.9%) | 91 (5.3%) |
| $25,000 to $34,999 | 521 (9.1%) | 122 (7.1%) |
| $35,000 to $49,999 | 655 (11.4%) | 338 (19.6%) |
| $50,000 to $74,999 | 942 (16.5%) | 168 (9.8%) |
| $75,000 to $99,999 | 903 (15.8%) | 223 (13.0%) |
| $100,000 to $149,999 | 1,095 (19.1%) | 150 (8.7%) |
| $150,000 or more | 839 (14.7%) | 44 (2.6%) |
| Total | 5,724 (100.0%) | 1,722 (100.0%) |
Monthly Housing Cost Tiers in Schuyler County
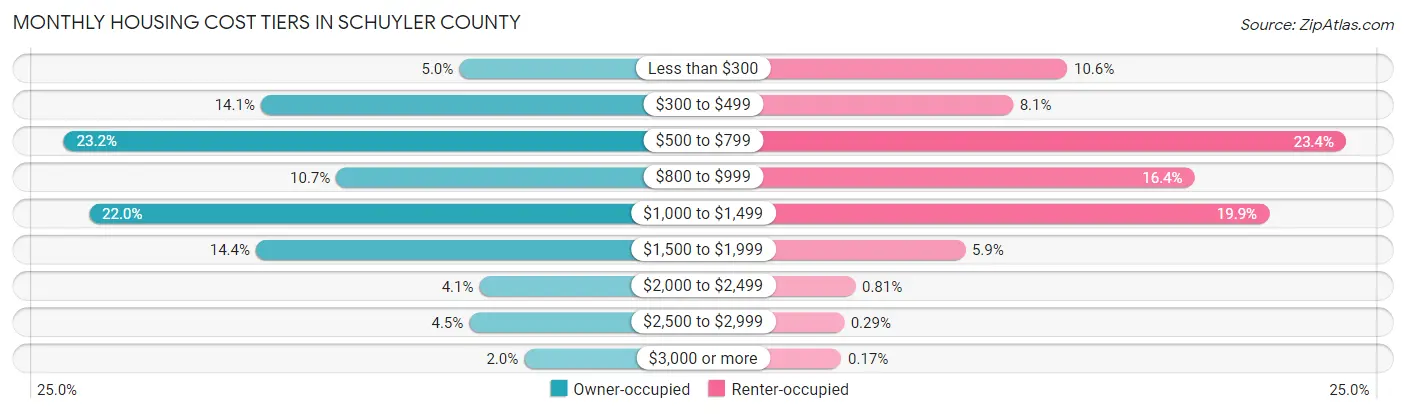
| Monthly Cost | Owner-occupied | Renter-occupied |
| Less than $300 | 286 (5.0%) | 182 (10.6%) |
| $300 to $499 | 809 (14.1%) | 139 (8.1%) |
| $500 to $799 | 1,328 (23.2%) | 403 (23.4%) |
| $800 to $999 | 610 (10.7%) | 283 (16.4%) |
| $1,000 to $1,499 | 1,261 (22.0%) | 342 (19.9%) |
| $1,500 to $1,999 | 822 (14.4%) | 101 (5.9%) |
| $2,000 to $2,499 | 233 (4.1%) | 14 (0.8%) |
| $2,500 to $2,999 | 260 (4.5%) | 5 (0.3%) |
| $3,000 or more | 115 (2.0%) | 3 (0.2%) |
| Total | 5,724 (100.0%) | 1,722 (100.0%) |
Physical Housing Characteristics in Schuyler County
Housing Structures in Schuyler County
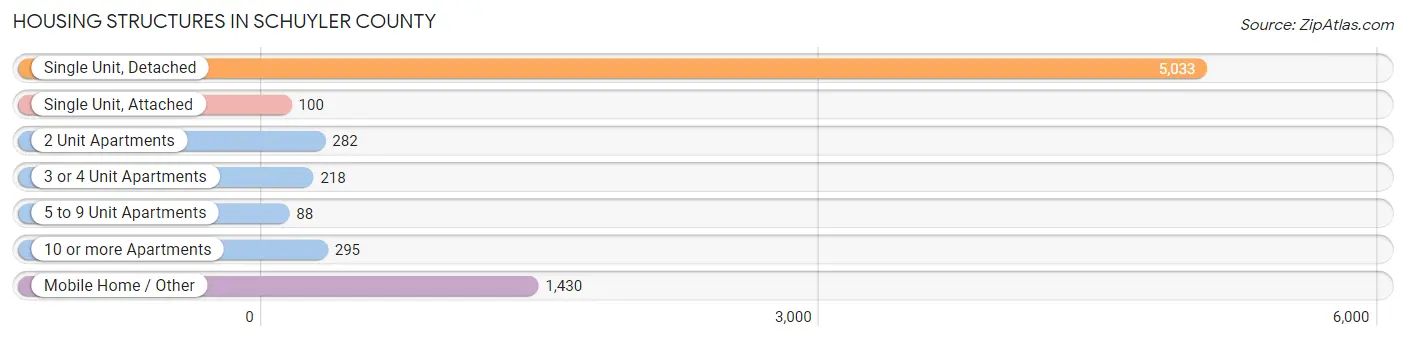
| Structure Type | # Housing Units | % Housing Units |
| Single Unit, Detached | 5,033 | 67.6% |
| Single Unit, Attached | 100 | 1.3% |
| 2 Unit Apartments | 282 | 3.8% |
| 3 or 4 Unit Apartments | 218 | 2.9% |
| 5 to 9 Unit Apartments | 88 | 1.2% |
| 10 or more Apartments | 295 | 4.0% |
| Mobile Home / Other | 1,430 | 19.2% |
| Total | 7,446 | 100.0% |
Housing Structures by Occupancy in Schuyler County
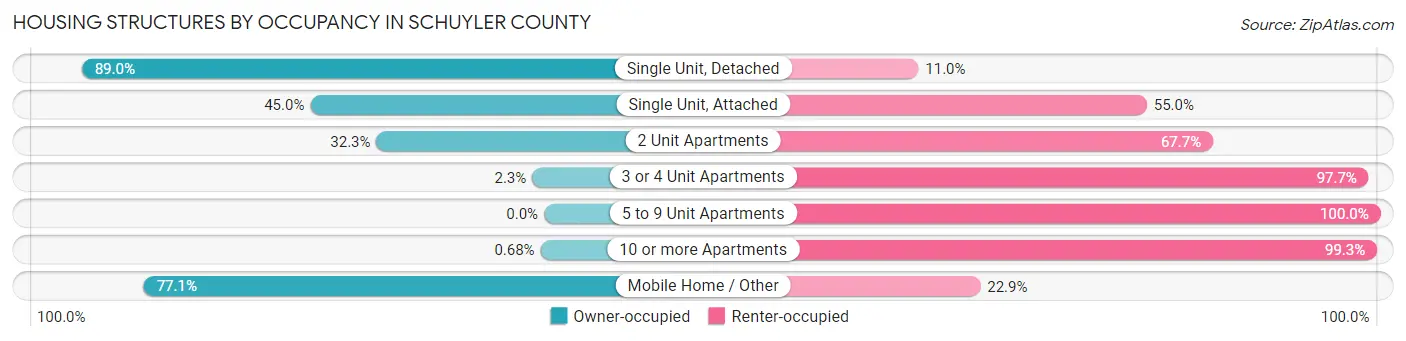
| Structure Type | Owner-occupied | Renter-occupied |
| Single Unit, Detached | 4,479 (89.0%) | 554 (11.0%) |
| Single Unit, Attached | 45 (45.0%) | 55 (55.0%) |
| 2 Unit Apartments | 91 (32.3%) | 191 (67.7%) |
| 3 or 4 Unit Apartments | 5 (2.3%) | 213 (97.7%) |
| 5 to 9 Unit Apartments | 0 (0.0%) | 88 (100.0%) |
| 10 or more Apartments | 2 (0.7%) | 293 (99.3%) |
| Mobile Home / Other | 1,102 (77.1%) | 328 (22.9%) |
| Total | 5,724 (76.9%) | 1,722 (23.1%) |
Housing Structures by Number of Rooms in Schuyler County
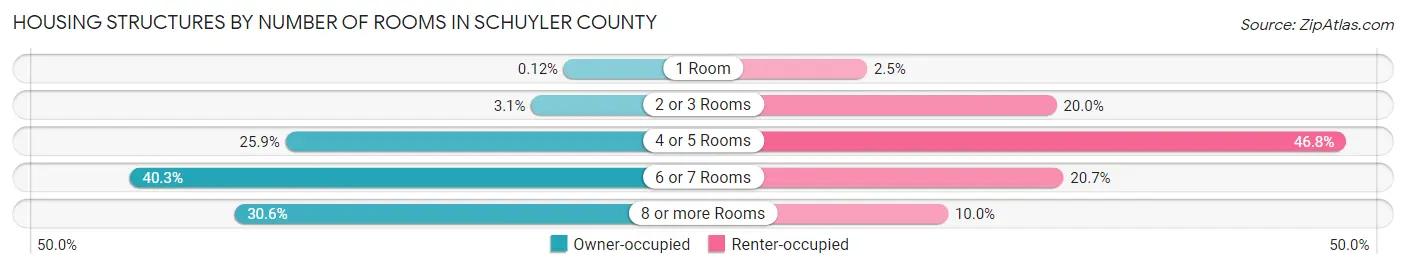
| Number of Rooms | Owner-occupied | Renter-occupied |
| 1 Room | 7 (0.1%) | 43 (2.5%) |
| 2 or 3 Rooms | 179 (3.1%) | 345 (20.0%) |
| 4 or 5 Rooms | 1,480 (25.9%) | 806 (46.8%) |
| 6 or 7 Rooms | 2,306 (40.3%) | 356 (20.7%) |
| 8 or more Rooms | 1,752 (30.6%) | 172 (10.0%) |
| Total | 5,724 (100.0%) | 1,722 (100.0%) |
Housing Structure by Heating Type in Schuyler County
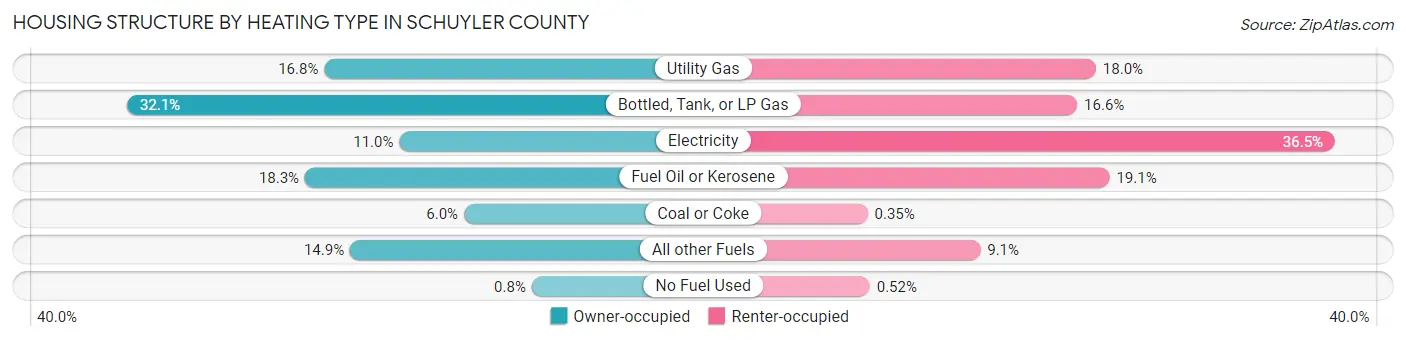
| Heating Type | Owner-occupied | Renter-occupied |
| Utility Gas | 964 (16.8%) | 310 (18.0%) |
| Bottled, Tank, or LP Gas | 1,837 (32.1%) | 285 (16.6%) |
| Electricity | 632 (11.0%) | 628 (36.5%) |
| Fuel Oil or Kerosene | 1,049 (18.3%) | 328 (19.1%) |
| Coal or Coke | 346 (6.0%) | 6 (0.4%) |
| All other Fuels | 850 (14.8%) | 156 (9.1%) |
| No Fuel Used | 46 (0.8%) | 9 (0.5%) |
| Total | 5,724 (100.0%) | 1,722 (100.0%) |
Household Vehicle Usage in Schuyler County
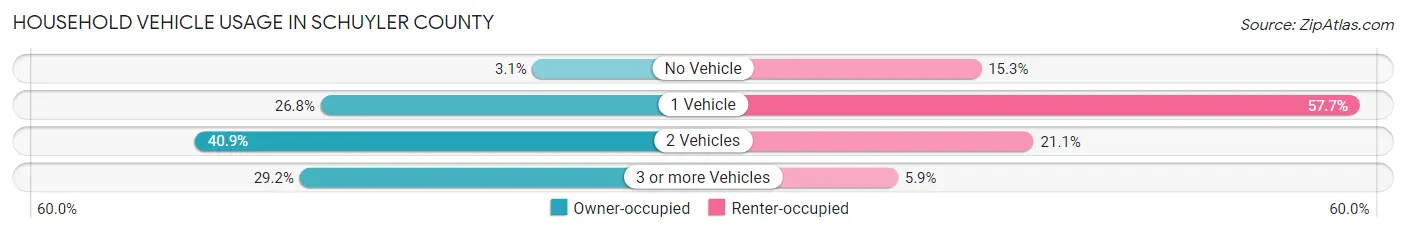
| Vehicles per Household | Owner-occupied | Renter-occupied |
| No Vehicle | 177 (3.1%) | 263 (15.3%) |
| 1 Vehicle | 1,535 (26.8%) | 993 (57.7%) |
| 2 Vehicles | 2,342 (40.9%) | 364 (21.1%) |
| 3 or more Vehicles | 1,670 (29.2%) | 102 (5.9%) |
| Total | 5,724 (100.0%) | 1,722 (100.0%) |
Real Estate & Mortgages in Schuyler County
Real Estate and Mortgage Overview in Schuyler County
| Characteristic | Without Mortgage | With Mortgage |
| Housing Units | 3,041 | 2,683 |
| Median Property Value | $132,500 | $165,800 |
| Median Household Income | $54,078 | $535 |
| Monthly Housing Costs | $586 | $97 |
| Real Estate Taxes | $3,021 | $19 |
Property Value by Mortgage Status in Schuyler County
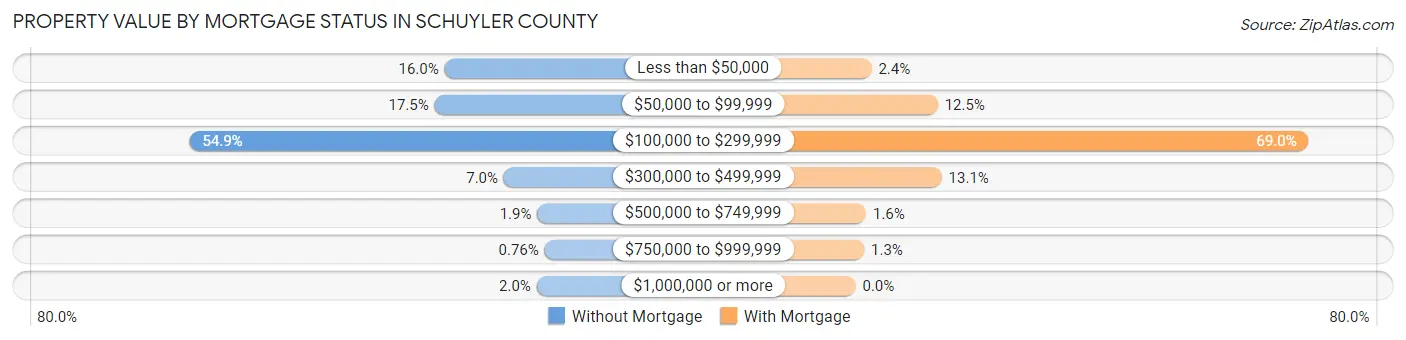
| Property Value | Without Mortgage | With Mortgage |
| Less than $50,000 | 487 (16.0%) | 65 (2.4%) |
| $50,000 to $99,999 | 533 (17.5%) | 336 (12.5%) |
| $100,000 to $299,999 | 1,669 (54.9%) | 1,852 (69.0%) |
| $300,000 to $499,999 | 212 (7.0%) | 352 (13.1%) |
| $500,000 to $749,999 | 57 (1.9%) | 43 (1.6%) |
| $750,000 to $999,999 | 23 (0.8%) | 35 (1.3%) |
| $1,000,000 or more | 60 (2.0%) | 0 (0.0%) |
| Total | 3,041 (100.0%) | 2,683 (100.0%) |
Household Income by Mortgage Status in Schuyler County
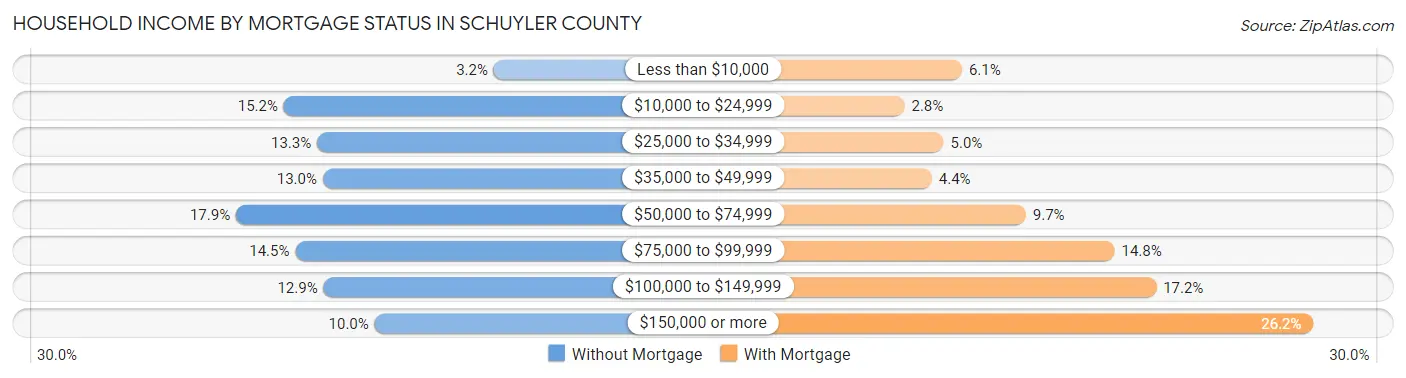
| Household Income | Without Mortgage | With Mortgage |
| Less than $10,000 | 97 (3.2%) | 163 (6.1%) |
| $10,000 to $24,999 | 462 (15.2%) | 75 (2.8%) |
| $25,000 to $34,999 | 404 (13.3%) | 135 (5.0%) |
| $35,000 to $49,999 | 394 (13.0%) | 117 (4.4%) |
| $50,000 to $74,999 | 545 (17.9%) | 261 (9.7%) |
| $75,000 to $99,999 | 442 (14.5%) | 397 (14.8%) |
| $100,000 to $149,999 | 393 (12.9%) | 461 (17.2%) |
| $150,000 or more | 304 (10.0%) | 702 (26.2%) |
| Total | 3,041 (100.0%) | 2,683 (100.0%) |
Property Value to Household Income Ratio in Schuyler County
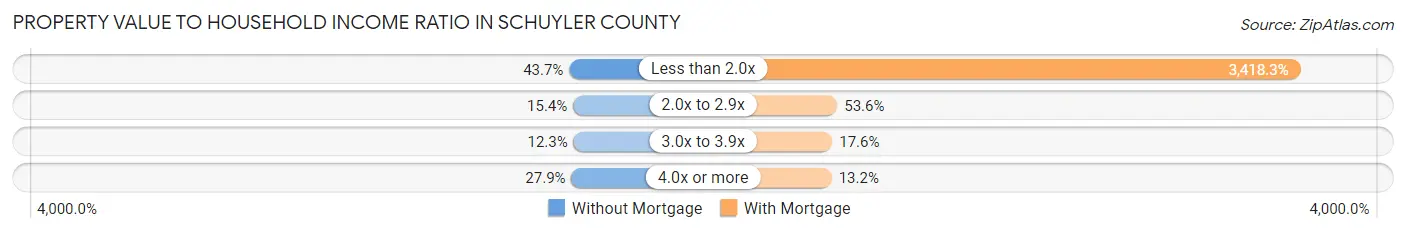
| Value-to-Income Ratio | Without Mortgage | With Mortgage |
| Less than 2.0x | 1,330 (43.7%) | 91,714 (3,418.3%) |
| 2.0x to 2.9x | 467 (15.4%) | 1,437 (53.6%) |
| 3.0x to 3.9x | 375 (12.3%) | 471 (17.5%) |
| 4.0x or more | 849 (27.9%) | 355 (13.2%) |
| Total | 3,041 (100.0%) | 2,683 (100.0%) |
Real Estate Taxes by Mortgage Status in Schuyler County
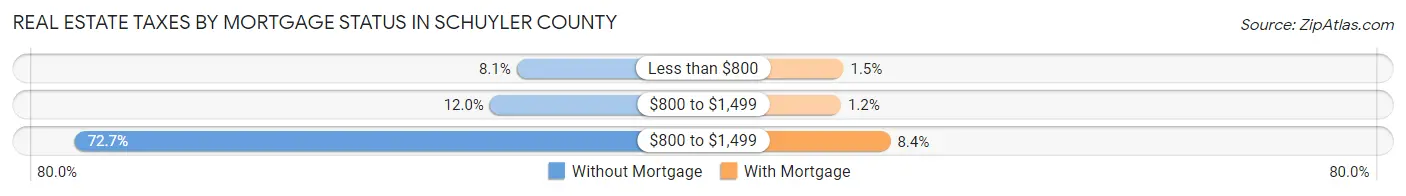
| Property Taxes | Without Mortgage | With Mortgage |
| Less than $800 | 247 (8.1%) | 41 (1.5%) |
| $800 to $1,499 | 366 (12.0%) | 31 (1.2%) |
| $800 to $1,499 | 2,210 (72.7%) | 225 (8.4%) |
| Total | 3,041 (100.0%) | 2,683 (100.0%) |
Health & Disability in Schuyler County
Health Insurance Coverage by Age in Schuyler County
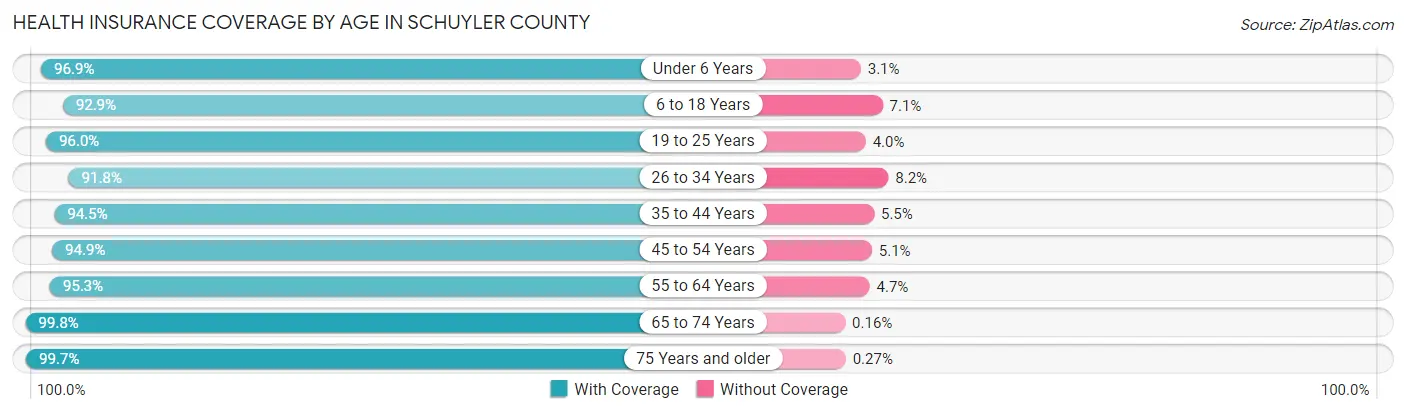
| Age Bracket | With Coverage | Without Coverage |
| Under 6 Years | 977 (96.9%) | 31 (3.1%) |
| 6 to 18 Years | 2,328 (92.9%) | 179 (7.1%) |
| 19 to 25 Years | 1,130 (96.0%) | 47 (4.0%) |
| 26 to 34 Years | 1,621 (91.8%) | 145 (8.2%) |
| 35 to 44 Years | 1,894 (94.5%) | 111 (5.5%) |
| 45 to 54 Years | 2,270 (94.9%) | 123 (5.1%) |
| 55 to 64 Years | 2,827 (95.3%) | 140 (4.7%) |
| 65 to 74 Years | 2,435 (99.8%) | 4 (0.2%) |
| 75 Years and older | 1,485 (99.7%) | 4 (0.3%) |
| Total | 16,967 (95.6%) | 784 (4.4%) |
Health Insurance Coverage by Citizenship Status in Schuyler County
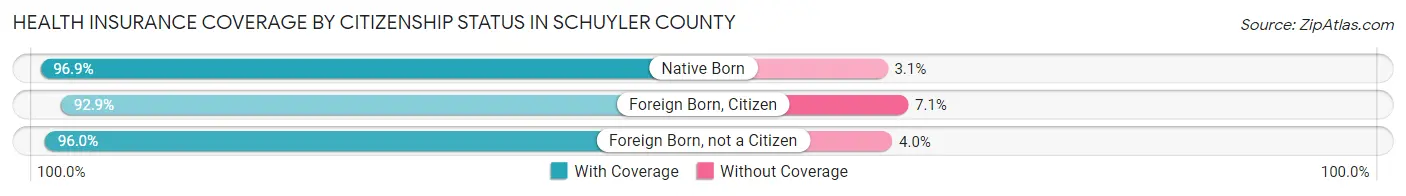
| Citizenship Status | With Coverage | Without Coverage |
| Native Born | 977 (96.9%) | 31 (3.1%) |
| Foreign Born, Citizen | 2,328 (92.9%) | 179 (7.1%) |
| Foreign Born, not a Citizen | 1,130 (96.0%) | 47 (4.0%) |
Health Insurance Coverage by Household Income in Schuyler County
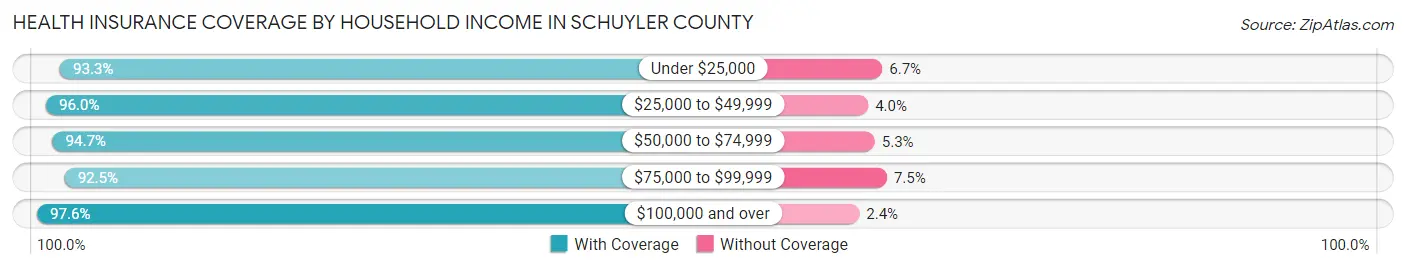
| Household Income | With Coverage | Without Coverage |
| Under $25,000 | 2,158 (93.3%) | 154 (6.7%) |
| $25,000 to $49,999 | 3,270 (96.0%) | 137 (4.0%) |
| $50,000 to $74,999 | 2,271 (94.7%) | 126 (5.3%) |
| $75,000 to $99,999 | 2,496 (92.5%) | 203 (7.5%) |
| $100,000 and over | 6,578 (97.6%) | 159 (2.4%) |
Public vs Private Health Insurance Coverage by Age in Schuyler County
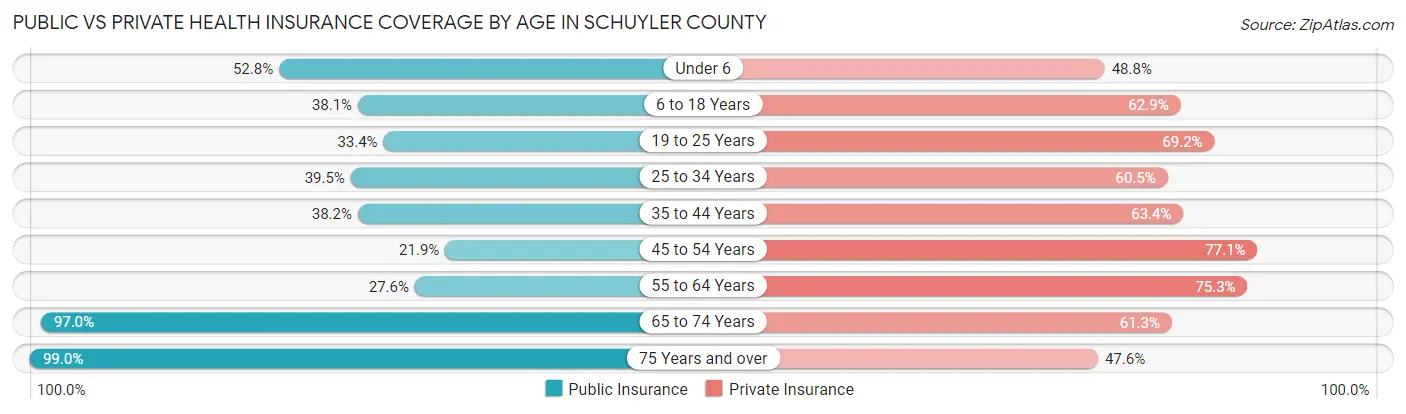
| Age Bracket | Public Insurance | Private Insurance |
| Under 6 | 532 (52.8%) | 492 (48.8%) |
| 6 to 18 Years | 956 (38.1%) | 1,576 (62.9%) |
| 19 to 25 Years | 393 (33.4%) | 814 (69.2%) |
| 25 to 34 Years | 697 (39.5%) | 1,068 (60.5%) |
| 35 to 44 Years | 765 (38.2%) | 1,271 (63.4%) |
| 45 to 54 Years | 525 (21.9%) | 1,846 (77.1%) |
| 55 to 64 Years | 818 (27.6%) | 2,234 (75.3%) |
| 65 to 74 Years | 2,365 (97.0%) | 1,494 (61.3%) |
| 75 Years and over | 1,474 (99.0%) | 708 (47.5%) |
| Total | 8,525 (48.0%) | 11,503 (64.8%) |
Disability Status by Sex by Age in Schuyler County
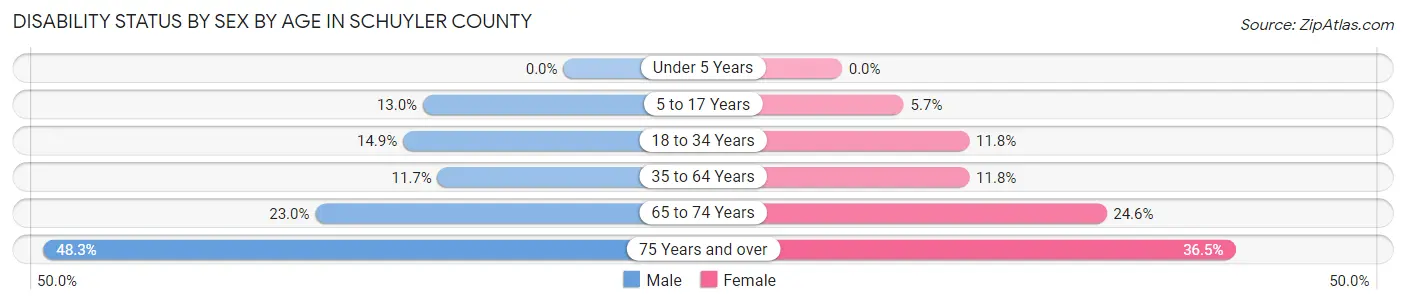
| Age Bracket | Male | Female |
| Under 5 Years | 0 (0.0%) | 0 (0.0%) |
| 5 to 17 Years | 167 (13.0%) | 70 (5.7%) |
| 18 to 34 Years | 243 (14.9%) | 173 (11.8%) |
| 35 to 64 Years | 430 (11.7%) | 435 (11.8%) |
| 65 to 74 Years | 282 (23.0%) | 298 (24.5%) |
| 75 Years and over | 318 (48.2%) | 303 (36.5%) |
Disability Class by Sex by Age in Schuyler County
Disability Class: Hearing Difficulty
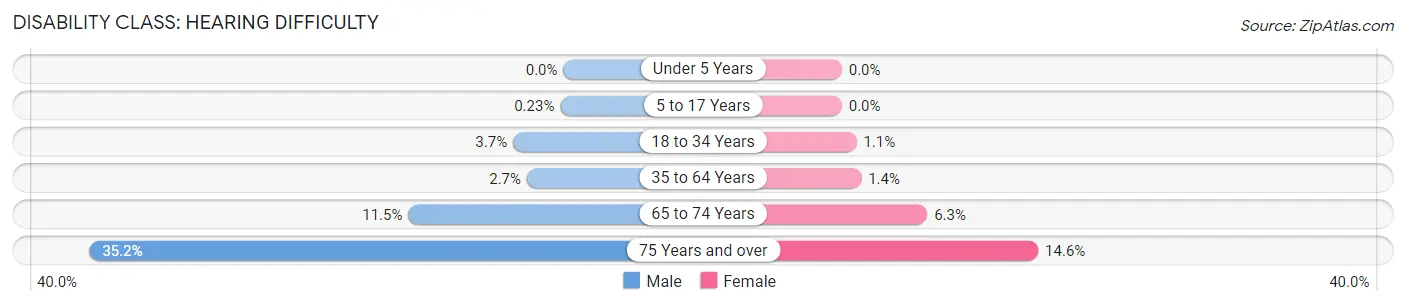
| Age Bracket | Male | Female |
| Under 5 Years | 0 (0.0%) | 0 (0.0%) |
| 5 to 17 Years | 3 (0.2%) | 0 (0.0%) |
| 18 to 34 Years | 61 (3.7%) | 16 (1.1%) |
| 35 to 64 Years | 100 (2.7%) | 53 (1.4%) |
| 65 to 74 Years | 141 (11.5%) | 77 (6.3%) |
| 75 Years and over | 232 (35.2%) | 121 (14.6%) |
Disability Class: Vision Difficulty
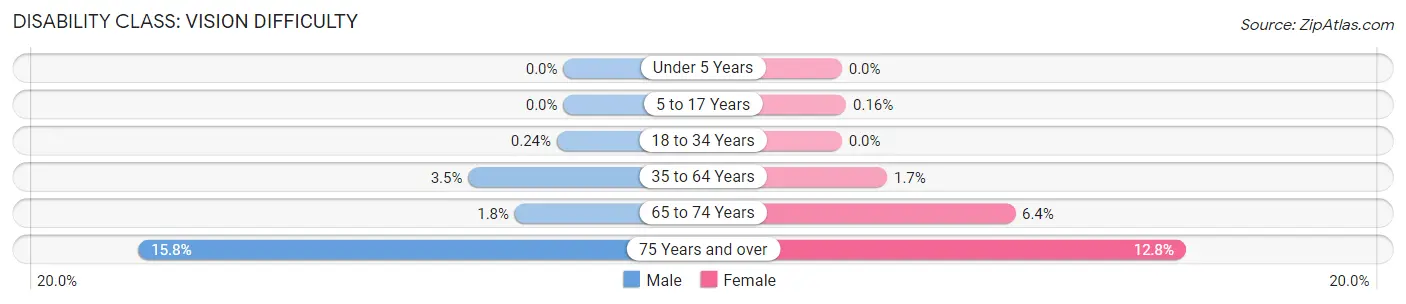
| Age Bracket | Male | Female |
| Under 5 Years | 0 (0.0%) | 0 (0.0%) |
| 5 to 17 Years | 0 (0.0%) | 2 (0.2%) |
| 18 to 34 Years | 4 (0.2%) | 0 (0.0%) |
| 35 to 64 Years | 130 (3.5%) | 62 (1.7%) |
| 65 to 74 Years | 22 (1.8%) | 78 (6.4%) |
| 75 Years and over | 104 (15.8%) | 106 (12.8%) |
Disability Class: Cognitive Difficulty
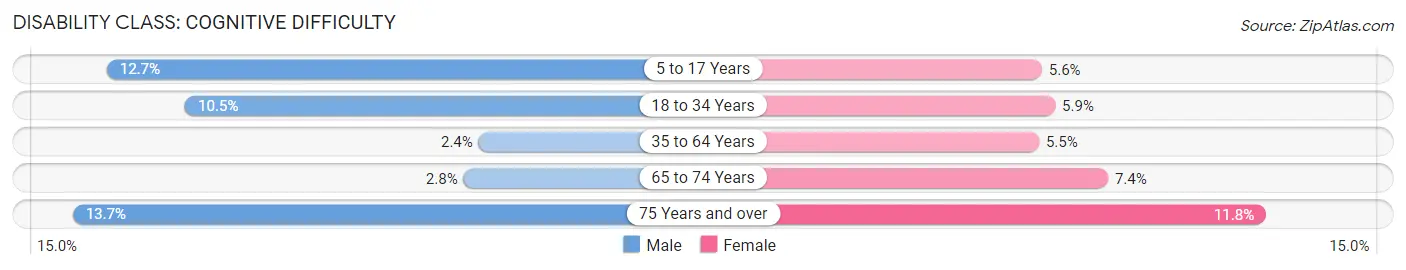
| Age Bracket | Male | Female |
| 5 to 17 Years | 163 (12.7%) | 68 (5.6%) |
| 18 to 34 Years | 172 (10.5%) | 87 (5.9%) |
| 35 to 64 Years | 87 (2.4%) | 202 (5.5%) |
| 65 to 74 Years | 34 (2.8%) | 90 (7.4%) |
| 75 Years and over | 90 (13.7%) | 98 (11.8%) |
Disability Class: Ambulatory Difficulty
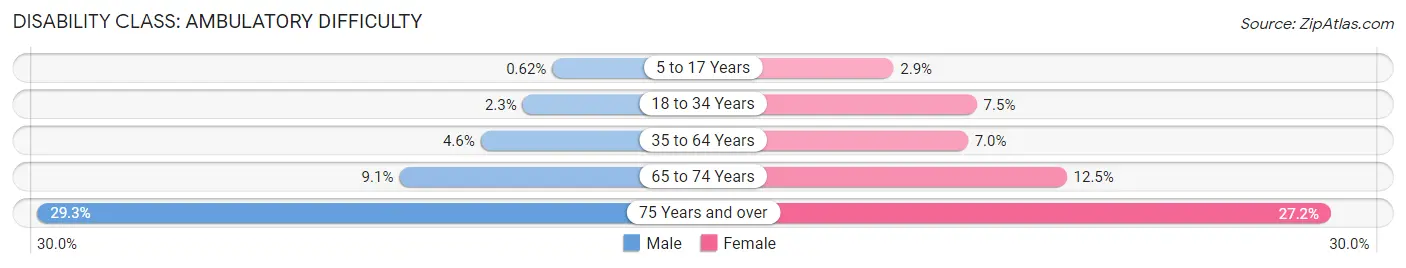
| Age Bracket | Male | Female |
| 5 to 17 Years | 8 (0.6%) | 35 (2.9%) |
| 18 to 34 Years | 37 (2.3%) | 110 (7.5%) |
| 35 to 64 Years | 170 (4.6%) | 258 (7.0%) |
| 65 to 74 Years | 112 (9.1%) | 152 (12.5%) |
| 75 Years and over | 193 (29.3%) | 226 (27.2%) |
Disability Class: Self-Care Difficulty
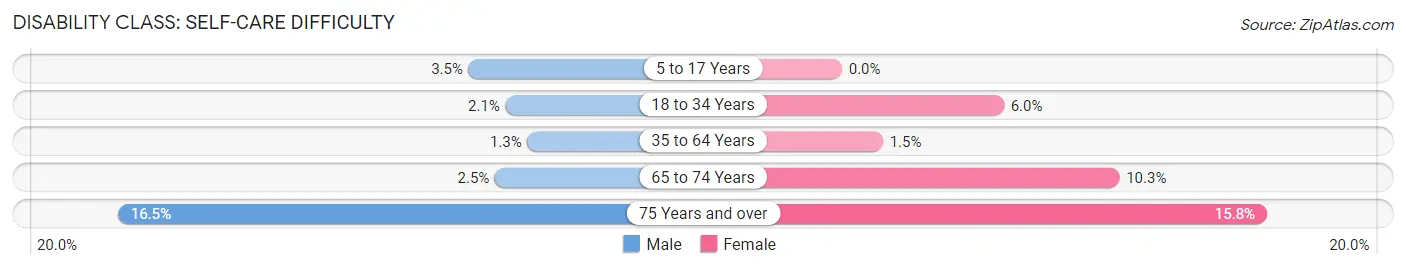
| Age Bracket | Male | Female |
| 5 to 17 Years | 45 (3.5%) | 0 (0.0%) |
| 18 to 34 Years | 35 (2.1%) | 88 (6.0%) |
| 35 to 64 Years | 49 (1.3%) | 56 (1.5%) |
| 65 to 74 Years | 31 (2.5%) | 125 (10.3%) |
| 75 Years and over | 109 (16.5%) | 131 (15.8%) |
Technology Access in Schuyler County
Computing Device Access in Schuyler County
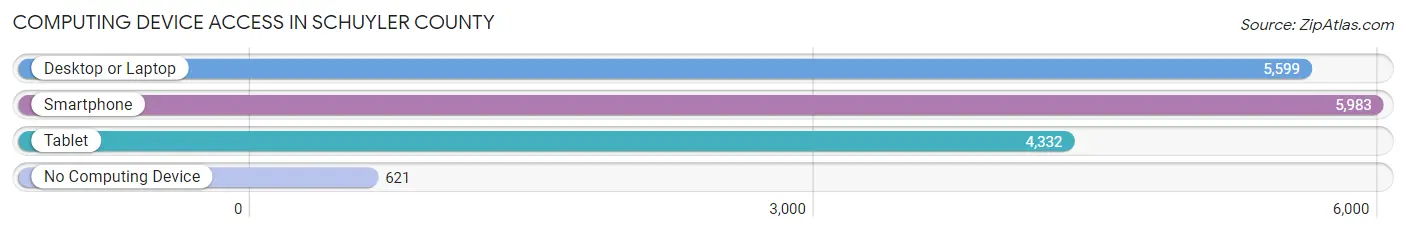
| Device Type | # Households | % Households |
| Desktop or Laptop | 5,599 | 75.2% |
| Smartphone | 5,983 | 80.3% |
| Tablet | 4,332 | 58.2% |
| No Computing Device | 621 | 8.3% |
| Total | 7,446 | 100.0% |
Internet Access in Schuyler County
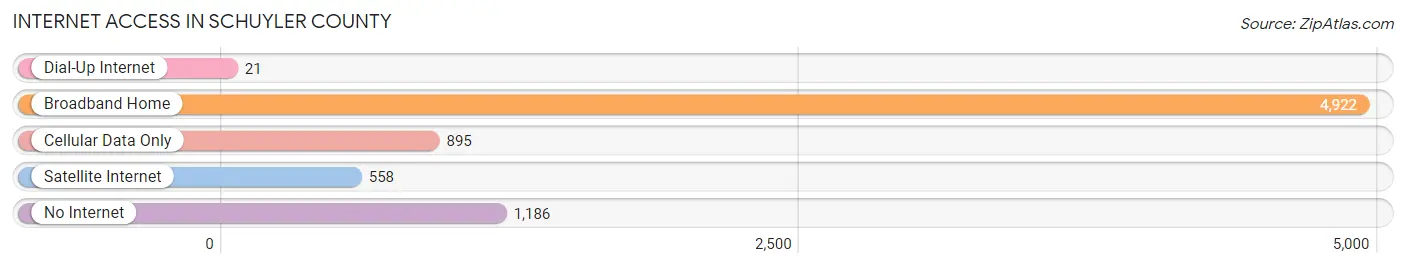
| Internet Type | # Households | % Households |
| Dial-Up Internet | 21 | 0.3% |
| Broadband Home | 4,922 | 66.1% |
| Cellular Data Only | 895 | 12.0% |
| Satellite Internet | 558 | 7.5% |
| No Internet | 1,186 | 15.9% |
| Total | 7,446 | 100.0% |
Schuyler County Summary
Schuyler County is located in the Finger Lakes region of New York State. It is bordered by Seneca, Tompkins, Chemung, Steuben, and Yates counties. The county seat is Watkins Glen. The county was established in 1854 and named after Philip Schuyler, a Revolutionary War general and United States Senator.
Geography
Schuyler County covers an area of approximately 437 square miles. It is located in the Finger Lakes region of New York State and is bordered by Seneca, Tompkins, Chemung, Steuben, and Yates counties. The terrain is mostly rolling hills and valleys, with some flat areas in the northern part of the county. The highest point in the county is 2,890 feet above sea level, located in the town of Hector. The county is drained by the Chemung River and its tributaries.
The climate of Schuyler County is generally temperate, with cold winters and warm summers. The average annual temperature is around 50 degrees Fahrenheit. The average annual precipitation is around 40 inches.
Demographics
As of the 2010 census, Schuyler County had a population of 18,343. The population density was 42 people per square mile. The racial makeup of the county was 95.3% White, 1.2% African American, 0.4% Native American, 0.5% Asian, 0.1% Pacific Islander, 0.7% from other races, and 1.8% from two or more races. Hispanic or Latino of any race were 2.3% of the population.
The median income for a household in Schuyler County was $41,945, and the median income for a family was $50,945. The per capita income for the county was $20,945. About 11.2% of families and 14.7% of the population were below the poverty line, including 19.2% of those under age 18 and 8.2% of those age 65 or over.
Economy
The economy of Schuyler County is largely based on agriculture and tourism. The county is home to several wineries and vineyards, as well as several fruit and vegetable farms. The county is also home to several manufacturing companies, including a paper mill and a plastics factory.
Tourism is a major industry in Schuyler County. The county is home to Watkins Glen State Park, which is a popular destination for hikers, campers, and other outdoor enthusiasts. The county is also home to several other attractions, including the Corning Museum of Glass, the Finger Lakes National Forest, and the Watkins Glen International racetrack.
Education
Schuyler County is served by the Watkins Glen Central School District, which includes Watkins Glen High School. The county is also home to several private schools, including the Schuyler County Catholic School and the Schuyler County Christian Academy.
Conclusion
Schuyler County is a rural county located in the Finger Lakes region of New York State. It is bordered by Seneca, Tompkins, Chemung, Steuben, and Yates counties. The county has a population of 18,343 and is largely based on agriculture and tourism. The county is home to several wineries and vineyards, as well as several manufacturing companies. It is also home to Watkins Glen State Park and several other attractions. The county is served by the Watkins Glen Central School District, as well as several private schools.
Common Questions
What is Per Capita Income in Schuyler County?
Per Capita income in Schuyler County is $35,062.
What is the Median Family Income in Schuyler County?
Median Family Income in Schuyler County is $81,509.
What is the Median Household income in Schuyler County?
Median Household Income in Schuyler County is $61,316.
What is Income or Wage Gap in Schuyler County?
Income or Wage Gap in Schuyler County is 24.6%.
Women in Schuyler County earn 75.4 cents for every dollar earned by a man.
What is Family Income Deficit in Schuyler County?
Family Income Deficit in Schuyler County is $11,266.
Families that are below poverty line in Schuyler County earn $11,266 less on average than the poverty threshold level.
What is Inequality or Gini Index in Schuyler County?
Inequality or Gini Index in Schuyler County is 0.44.
What is the Total Population of Schuyler County?
Total Population of Schuyler County is 17,855.
What is the Total Male Population of Schuyler County?
Total Male Population of Schuyler County is 8,987.
What is the Total Female Population of Schuyler County?
Total Female Population of Schuyler County is 8,868.
What is the Ratio of Males per 100 Females in Schuyler County?
There are 101.34 Males per 100 Females in Schuyler County.
What is the Ratio of Females per 100 Males in Schuyler County?
There are 98.68 Females per 100 Males in Schuyler County.
What is the Median Population Age in Schuyler County?
Median Population Age in Schuyler County is 47.3 Years.
What is the Average Family Size in Schuyler County
Average Family Size in Schuyler County is 2.8 People.
What is the Average Household Size in Schuyler County
Average Household Size in Schuyler County is 2.4 People.
How Large is the Labor Force in Schuyler County?
There are 8,732 People in the Labor Forcein in Schuyler County.
What is the Percentage of People in the Labor Force in Schuyler County?
58.5% of People are in the Labor Force in Schuyler County.
What is the Unemployment Rate in Schuyler County?
Unemployment Rate in Schuyler County is 5.7%.