Schenectady County, NY Map & Demographics
Schenectady County Overview
$39,791
PER CAPITA INCOME
$98,944
AVG FAMILY INCOME
$75,056
AVG HOUSEHOLD INCOME
22.4%
WAGE / INCOME GAP [ % ]
77.6¢/ $1
WAGE / INCOME GAP [ $ ]
$11,238
FAMILY INCOME DEFICIT
0.44
INEQUALITY / GINI INDEX
159,447
TOTAL POPULATION
78,328
MALE POPULATION
81,119
FEMALE POPULATION
96.56
MALES / 100 FEMALES
103.56
FEMALES / 100 MALES
39.7
MEDIAN AGE
3.2
AVG FAMILY SIZE
2.4
AVG HOUSEHOLD SIZE
81,382
LABOR FORCE [ PEOPLE ]
62.9%
PERCENT IN LABOR FORCE
6.0%
UNEMPLOYMENT RATE
Schenectady County Area Codes
Income in Schenectady County
Income Overview in Schenectady County
Per Capita Income in Schenectady County is $39,791, while median incomes of families and households are $98,944 and $75,056 respectively.
| Characteristic | Number | Measure |
| Per Capita Income | 159,447 | $39,791 |
| Median Family Income | 36,998 | $98,944 |
| Mean Family Income | 36,998 | $117,944 |
| Median Household Income | 63,964 | $75,056 |
| Mean Household Income | 63,964 | $95,776 |
| Income Deficit | 36,998 | $11,238 |
| Wage / Income Gap (%) | 159,447 | 22.36% |
| Wage / Income Gap ($) | 159,447 | 77.64¢ per $1 |
| Gini / Inequality Index | 159,447 | 0.44 |
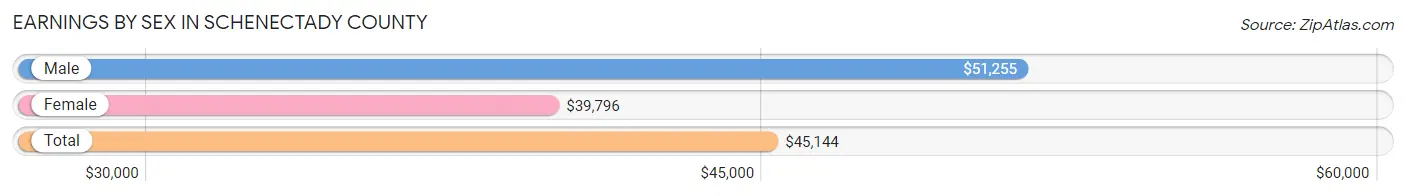
Earnings by Sex in Schenectady County
Average Earnings in Schenectady County are $45,144, $51,255 for men and $39,796 for women, a difference of 22.4%.
| Sex | Number | Average Earnings |
| Male | 43,834 (51.7%) | $51,255 |
| Female | 40,890 (48.3%) | $39,796 |
| Total | 84,724 (100.0%) | $45,144 |
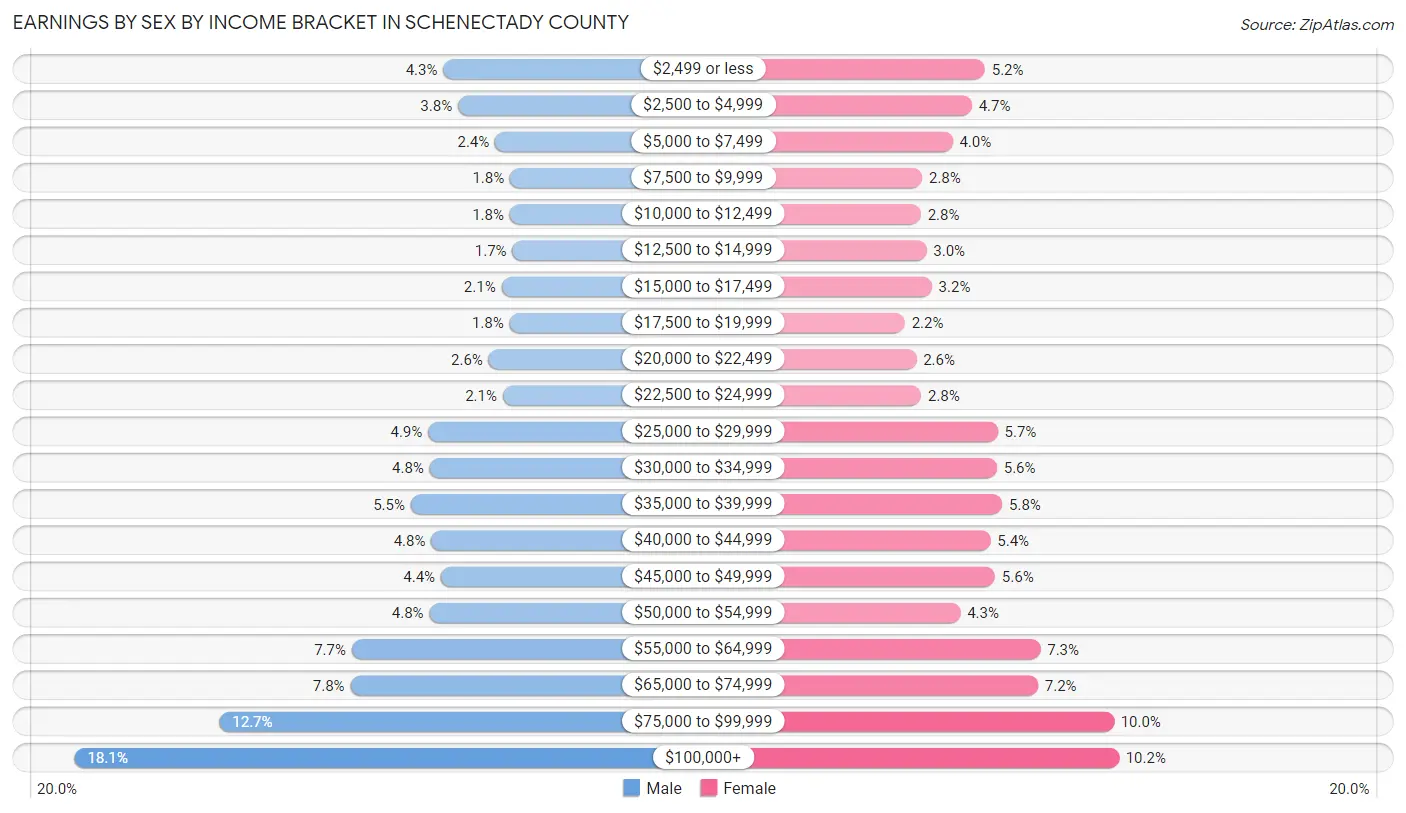
Earnings by Sex by Income Bracket in Schenectady County
The most common earnings brackets in Schenectady County are $100,000+ for men (7,948 | 18.1%) and $100,000+ for women (4,167 | 10.2%).
| Income | Male | Female |
| $2,499 or less | 1,889 (4.3%) | 2,114 (5.2%) |
| $2,500 to $4,999 | 1,646 (3.8%) | 1,915 (4.7%) |
| $5,000 to $7,499 | 1,040 (2.4%) | 1,619 (4.0%) |
| $7,500 to $9,999 | 794 (1.8%) | 1,153 (2.8%) |
| $10,000 to $12,499 | 797 (1.8%) | 1,134 (2.8%) |
| $12,500 to $14,999 | 756 (1.7%) | 1,219 (3.0%) |
| $15,000 to $17,499 | 933 (2.1%) | 1,300 (3.2%) |
| $17,500 to $19,999 | 802 (1.8%) | 887 (2.2%) |
| $20,000 to $22,499 | 1,142 (2.6%) | 1,063 (2.6%) |
| $22,500 to $24,999 | 910 (2.1%) | 1,136 (2.8%) |
| $25,000 to $29,999 | 2,140 (4.9%) | 2,312 (5.7%) |
| $30,000 to $34,999 | 2,112 (4.8%) | 2,300 (5.6%) |
| $35,000 to $39,999 | 2,422 (5.5%) | 2,381 (5.8%) |
| $40,000 to $44,999 | 2,085 (4.8%) | 2,201 (5.4%) |
| $45,000 to $49,999 | 1,930 (4.4%) | 2,271 (5.6%) |
| $50,000 to $54,999 | 2,116 (4.8%) | 1,736 (4.3%) |
| $55,000 to $64,999 | 3,391 (7.7%) | 2,966 (7.2%) |
| $65,000 to $74,999 | 3,416 (7.8%) | 2,927 (7.2%) |
| $75,000 to $99,999 | 5,565 (12.7%) | 4,089 (10.0%) |
| $100,000+ | 7,948 (18.1%) | 4,167 (10.2%) |
| Total | 43,834 (100.0%) | 40,890 (100.0%) |
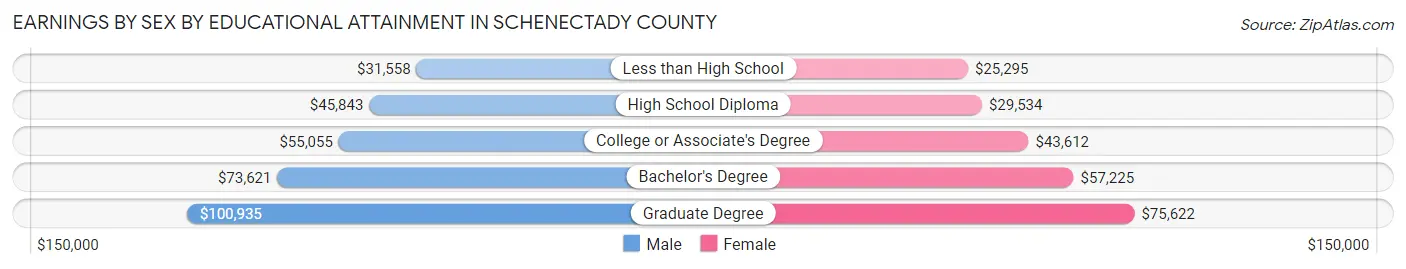
Earnings by Sex by Educational Attainment in Schenectady County
Average earnings in Schenectady County are $58,624 for men and $45,418 for women, a difference of 22.5%. Men with an educational attainment of graduate degree enjoy the highest average annual earnings of $100,935, while those with less than high school education earn the least with $31,558. Women with an educational attainment of graduate degree earn the most with the average annual earnings of $75,622, while those with less than high school education have the smallest earnings of $25,295.
| Educational Attainment | Male Income | Female Income |
| Less than High School | $31,558 | $25,295 |
| High School Diploma | $45,843 | $29,534 |
| College or Associate's Degree | $55,055 | $43,612 |
| Bachelor's Degree | $73,621 | $57,225 |
| Graduate Degree | $100,935 | $75,622 |
| Total | $58,624 | $45,418 |
Family Income in Schenectady County
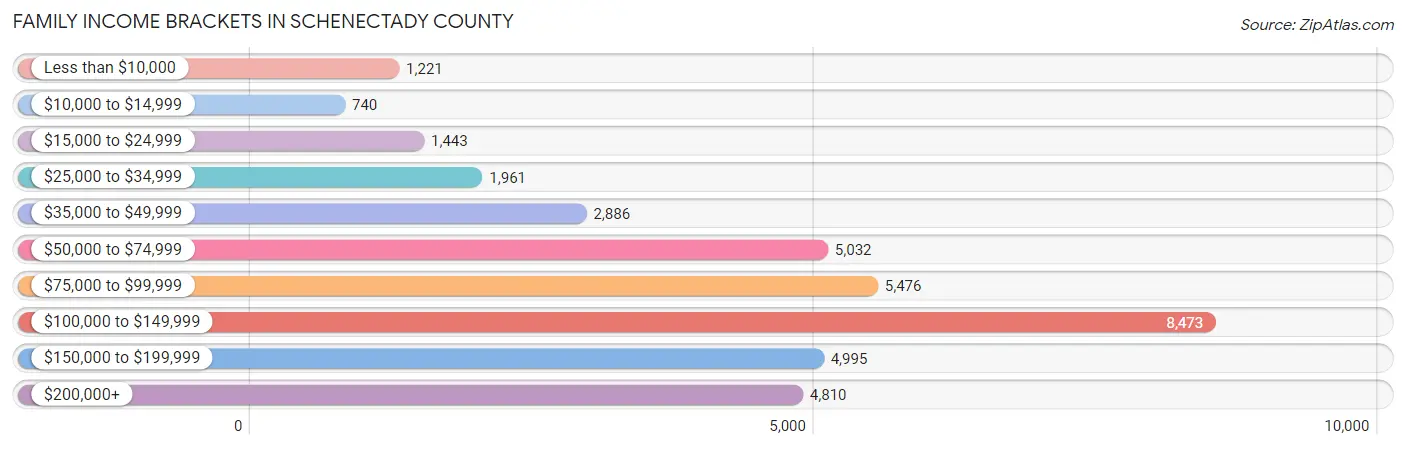
Family Income Brackets in Schenectady County
According to the Schenectady County family income data, there are 8,473 families falling into the $100,000 to $149,999 income range, which is the most common income bracket and makes up 22.9% of all families. Conversely, the $10,000 to $14,999 income bracket is the least frequent group with only 740 families (2.0%) belonging to this category.
| Income Bracket | # Families | % Families |
| Less than $10,000 | 1,221 | 3.3% |
| $10,000 to $14,999 | 740 | 2.0% |
| $15,000 to $24,999 | 1,443 | 3.9% |
| $25,000 to $34,999 | 1,961 | 5.3% |
| $35,000 to $49,999 | 2,886 | 7.8% |
| $50,000 to $74,999 | 5,032 | 13.6% |
| $75,000 to $99,999 | 5,476 | 14.8% |
| $100,000 to $149,999 | 8,473 | 22.9% |
| $150,000 to $199,999 | 4,995 | 13.5% |
| $200,000+ | 4,810 | 13.0% |
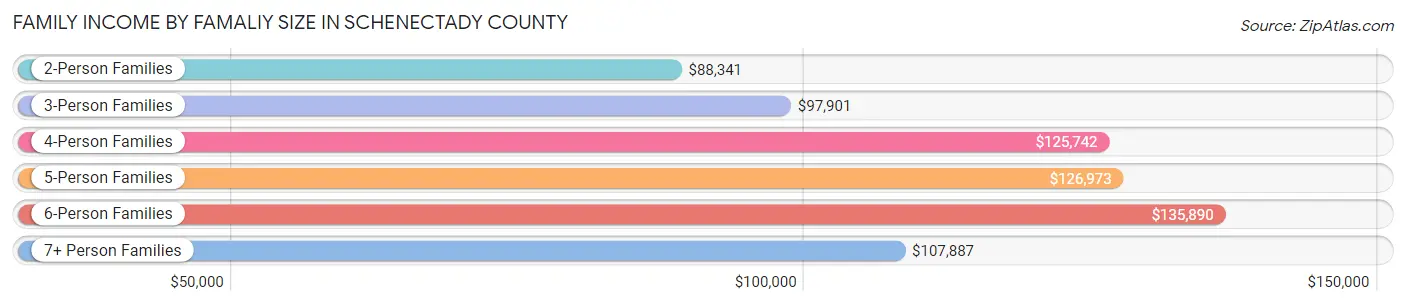
Family Income by Famaliy Size in Schenectady County
6-person families (818 | 2.2%) account for the highest median family income in Schenectady County with $135,890 per family, while 2-person families (17,818 | 48.2%) have the highest median income of $44,170 per family member.
| Income Bracket | # Families | Median Income |
| 2-Person Families | 17,818 (48.2%) | $88,341 |
| 3-Person Families | 8,954 (24.2%) | $97,901 |
| 4-Person Families | 6,661 (18.0%) | $125,742 |
| 5-Person Families | 2,461 (6.7%) | $126,973 |
| 6-Person Families | 818 (2.2%) | $135,890 |
| 7+ Person Families | 286 (0.8%) | $107,887 |
| Total | 36,998 (100.0%) | $98,944 |
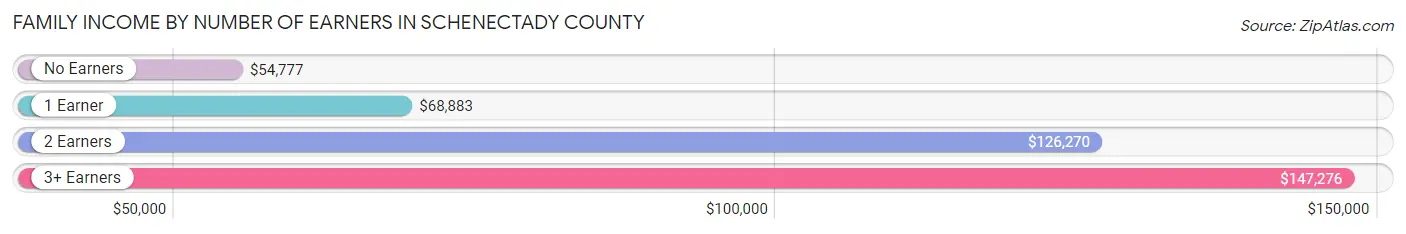
Family Income by Number of Earners in Schenectady County
The median family income in Schenectady County is $98,944, with families comprising 3+ earners (3,868) having the highest median family income of $147,276, while families with no earners (6,049) have the lowest median family income of $54,777, accounting for 10.4% and 16.4% of families, respectively.
| Number of Earners | # Families | Median Income |
| No Earners | 6,049 (16.4%) | $54,777 |
| 1 Earner | 11,426 (30.9%) | $68,883 |
| 2 Earners | 15,655 (42.3%) | $126,270 |
| 3+ Earners | 3,868 (10.4%) | $147,276 |
| Total | 36,998 (100.0%) | $98,944 |
Household Income in Schenectady County
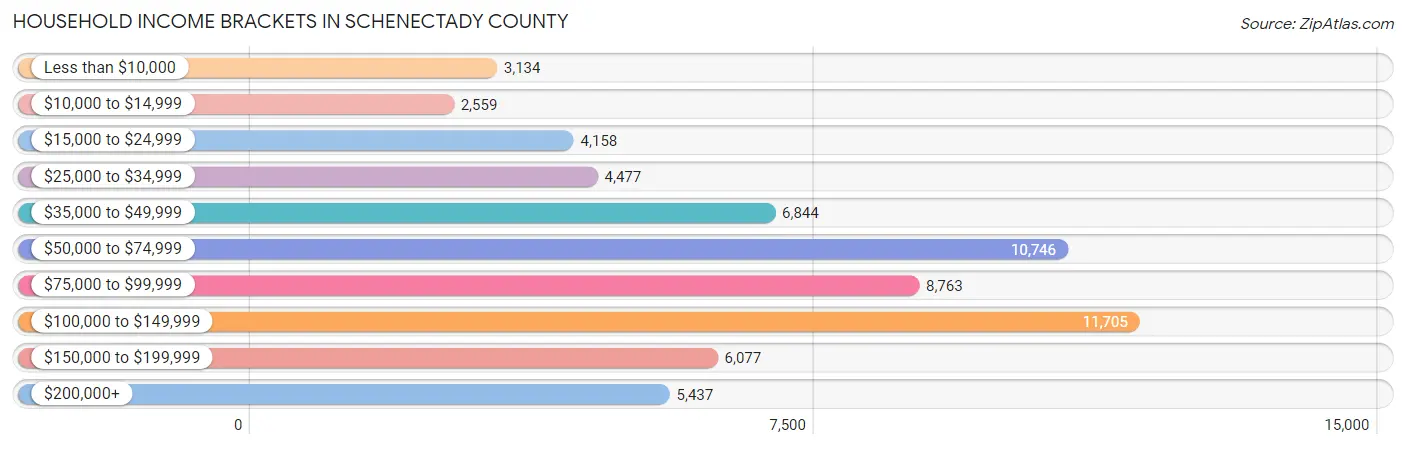
Household Income Brackets in Schenectady County
With 11,705 households falling in the category, the $100,000 to $149,999 income range is the most frequent in Schenectady County, accounting for 18.3% of all households. In contrast, only 2,559 households (4.0%) fall into the $10,000 to $14,999 income bracket, making it the least populous group.
| Income Bracket | # Households | % Households |
| Less than $10,000 | 3,134 | 4.9% |
| $10,000 to $14,999 | 2,559 | 4.0% |
| $15,000 to $24,999 | 4,158 | 6.5% |
| $25,000 to $34,999 | 4,477 | 7.0% |
| $35,000 to $49,999 | 6,844 | 10.7% |
| $50,000 to $74,999 | 10,746 | 16.8% |
| $75,000 to $99,999 | 8,763 | 13.7% |
| $100,000 to $149,999 | 11,705 | 18.3% |
| $150,000 to $199,999 | 6,077 | 9.5% |
| $200,000+ | 5,437 | 8.5% |
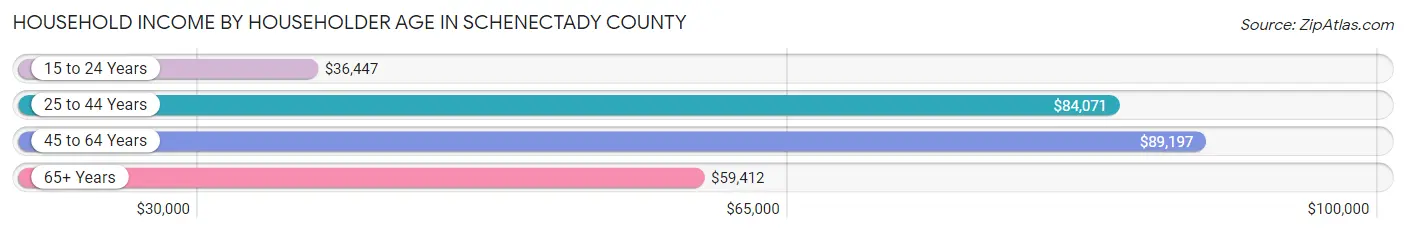
Household Income by Householder Age in Schenectady County
The median household income in Schenectady County is $75,056, with the highest median household income of $89,197 found in the 45 to 64 years age bracket for the primary householder. A total of 23,565 households (36.8%) fall into this category. Meanwhile, the 15 to 24 years age bracket for the primary householder has the lowest median household income of $36,447, with 2,272 households (3.5%) in this group.
| Income Bracket | # Households | Median Income |
| 15 to 24 Years | 2,272 (3.5%) | $36,447 |
| 25 to 44 Years | 20,336 (31.8%) | $84,071 |
| 45 to 64 Years | 23,565 (36.8%) | $89,197 |
| 65+ Years | 17,791 (27.8%) | $59,412 |
| Total | 63,964 (100.0%) | $75,056 |
Poverty in Schenectady County
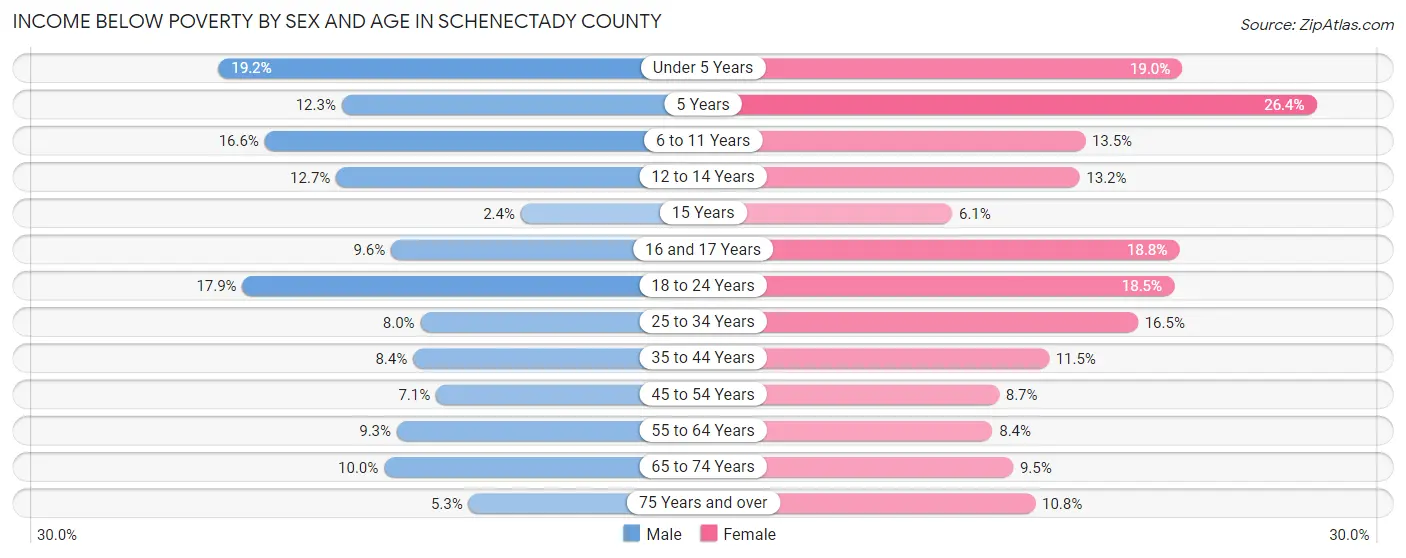
Income Below Poverty by Sex and Age in Schenectady County
With 10.6% poverty level for males and 12.6% for females among the residents of Schenectady County, under 5 year old males and 5 year old females are the most vulnerable to poverty, with 923 males (19.2%) and 196 females (26.4%) in their respective age groups living below the poverty level.
| Age Bracket | Male | Female |
| Under 5 Years | 923 (19.2%) | 842 (19.0%) |
| 5 Years | 115 (12.3%) | 196 (26.4%) |
| 6 to 11 Years | 988 (16.6%) | 742 (13.5%) |
| 12 to 14 Years | 345 (12.7%) | 372 (13.2%) |
| 15 Years | 21 (2.4%) | 60 (6.1%) |
| 16 and 17 Years | 203 (9.6%) | 349 (18.8%) |
| 18 to 24 Years | 1,163 (17.9%) | 1,265 (18.5%) |
| 25 to 34 Years | 824 (8.0%) | 1,703 (16.5%) |
| 35 to 44 Years | 828 (8.4%) | 1,146 (11.5%) |
| 45 to 54 Years | 692 (7.1%) | 862 (8.7%) |
| 55 to 64 Years | 966 (9.3%) | 923 (8.4%) |
| 65 to 74 Years | 755 (10.0%) | 791 (9.5%) |
| 75 Years and over | 229 (5.3%) | 710 (10.8%) |
| Total | 8,052 (10.6%) | 9,961 (12.6%) |
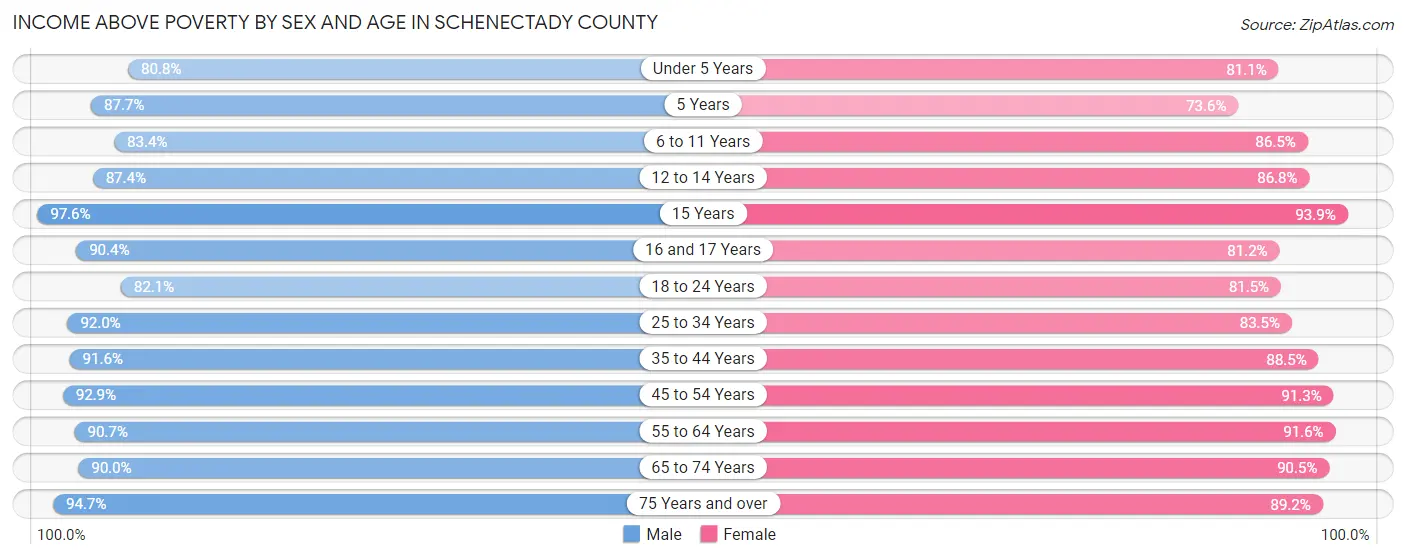
Income Above Poverty by Sex and Age in Schenectady County
According to the poverty statistics in Schenectady County, males aged 15 years and females aged 15 years are the age groups that are most secure financially, with 97.6% of males and 93.9% of females in these age groups living above the poverty line.
| Age Bracket | Male | Female |
| Under 5 Years | 3,883 (80.8%) | 3,601 (81.0%) |
| 5 Years | 817 (87.7%) | 546 (73.6%) |
| 6 to 11 Years | 4,954 (83.4%) | 4,737 (86.5%) |
| 12 to 14 Years | 2,382 (87.4%) | 2,440 (86.8%) |
| 15 Years | 866 (97.6%) | 917 (93.9%) |
| 16 and 17 Years | 1,913 (90.4%) | 1,509 (81.2%) |
| 18 to 24 Years | 5,344 (82.1%) | 5,577 (81.5%) |
| 25 to 34 Years | 9,528 (92.0%) | 8,630 (83.5%) |
| 35 to 44 Years | 9,069 (91.6%) | 8,802 (88.5%) |
| 45 to 54 Years | 9,063 (92.9%) | 8,999 (91.3%) |
| 55 to 64 Years | 9,460 (90.7%) | 10,094 (91.6%) |
| 65 to 74 Years | 6,809 (90.0%) | 7,513 (90.5%) |
| 75 Years and over | 4,105 (94.7%) | 5,888 (89.2%) |
| Total | 68,193 (89.4%) | 69,253 (87.4%) |
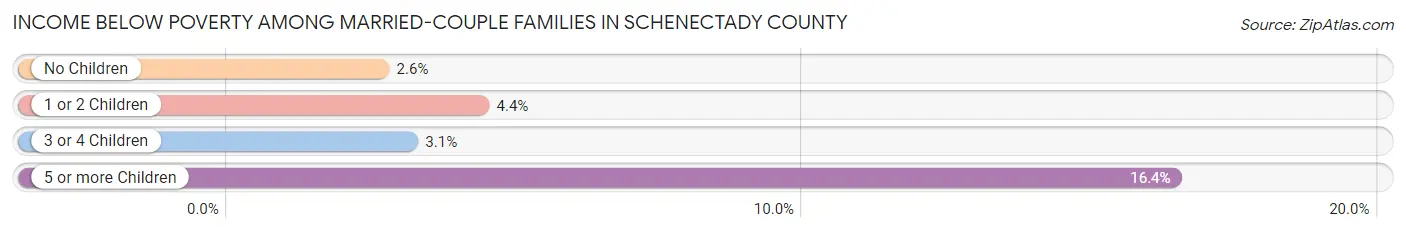
Income Below Poverty Among Married-Couple Families in Schenectady County
The poverty statistics for married-couple families in Schenectady County show that 3.3% or 896 of the total 27,348 families live below the poverty line. Families with 5 or more children have the highest poverty rate of 16.4%, comprising of 12 families. On the other hand, families with no children have the lowest poverty rate of 2.6%, which includes 439 families.
| Children | Above Poverty | Below Poverty |
| No Children | 16,192 (97.4%) | 439 (2.6%) |
| 1 or 2 Children | 8,504 (95.6%) | 390 (4.4%) |
| 3 or 4 Children | 1,695 (96.9%) | 55 (3.1%) |
| 5 or more Children | 61 (83.6%) | 12 (16.4%) |
| Total | 26,452 (96.7%) | 896 (3.3%) |
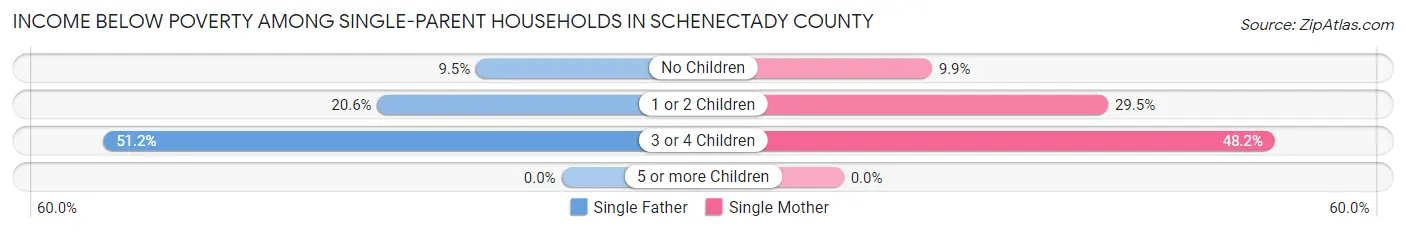
Income Below Poverty Among Single-Parent Households in Schenectady County
According to the poverty data in Schenectady County, 17.8% or 472 single-father households and 22.9% or 1,602 single-mother households are living below the poverty line. Among single-father households, those with 3 or 4 children have the highest poverty rate, with 106 households (51.2%) experiencing poverty. Likewise, among single-mother households, those with 3 or 4 children have the highest poverty rate, with 292 households (48.2%) falling below the poverty line.
| Children | Single Father | Single Mother |
| No Children | 119 (9.5%) | 289 (9.9%) |
| 1 or 2 Children | 247 (20.6%) | 1,021 (29.5%) |
| 3 or 4 Children | 106 (51.2%) | 292 (48.2%) |
| 5 or more Children | 0 (0.0%) | 0 (0.0%) |
| Total | 472 (17.8%) | 1,602 (22.9%) |
Income Below Poverty Among Married-Couple vs Single-Parent Households in Schenectady County
The poverty data for Schenectady County shows that 896 of the married-couple family households (3.3%) and 2,074 of the single-parent households (21.5%) are living below the poverty level. Within the married-couple family households, those with 5 or more children have the highest poverty rate, with 12 households (16.4%) falling below the poverty line. Among the single-parent households, those with 3 or 4 children have the highest poverty rate, with 398 household (48.9%) living below poverty.
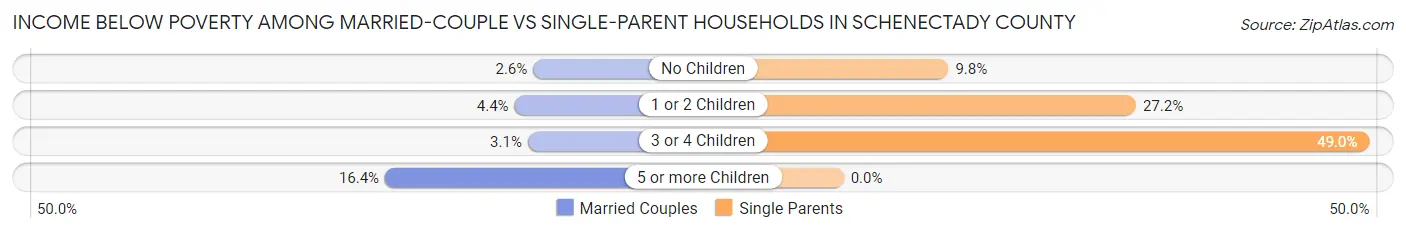
| Children | Married-Couple Families | Single-Parent Households |
| No Children | 439 (2.6%) | 408 (9.8%) |
| 1 or 2 Children | 390 (4.4%) | 1,268 (27.2%) |
| 3 or 4 Children | 55 (3.1%) | 398 (48.9%) |
| 5 or more Children | 12 (16.4%) | 0 (0.0%) |
| Total | 896 (3.3%) | 2,074 (21.5%) |
Race in Schenectady County
The most populous races in Schenectady County are White / Caucasian (114,752 | 72.0%), Black / African American (16,800 | 10.5%), and Two or more Races (13,363 | 8.4%).
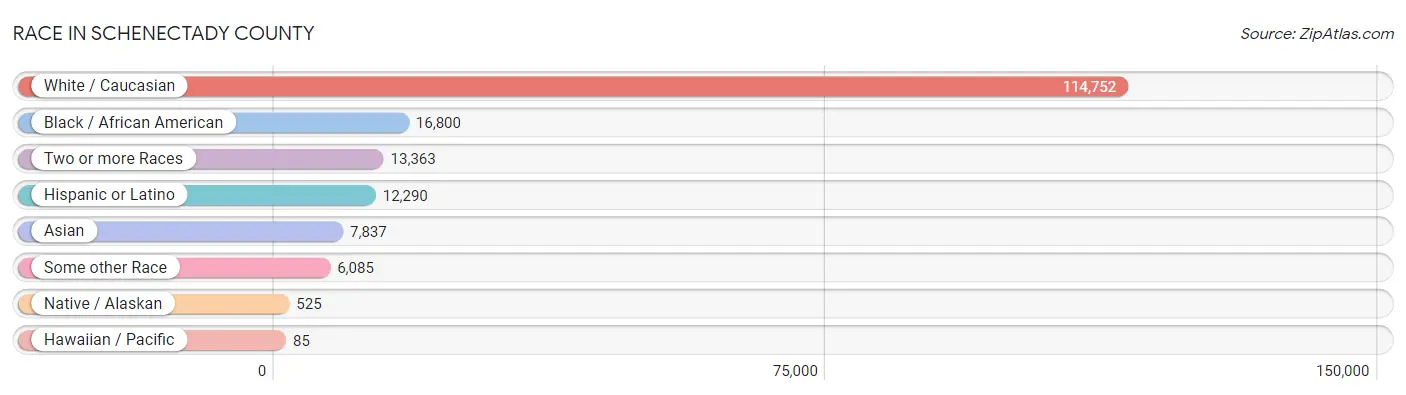
| Race | # Population | % Population |
| Asian | 7,837 | 4.9% |
| Black / African American | 16,800 | 10.5% |
| Hawaiian / Pacific | 85 | 0.1% |
| Hispanic or Latino | 12,290 | 7.7% |
| Native / Alaskan | 525 | 0.3% |
| White / Caucasian | 114,752 | 72.0% |
| Two or more Races | 13,363 | 8.4% |
| Some other Race | 6,085 | 3.8% |
| Total | 159,447 | 100.0% |
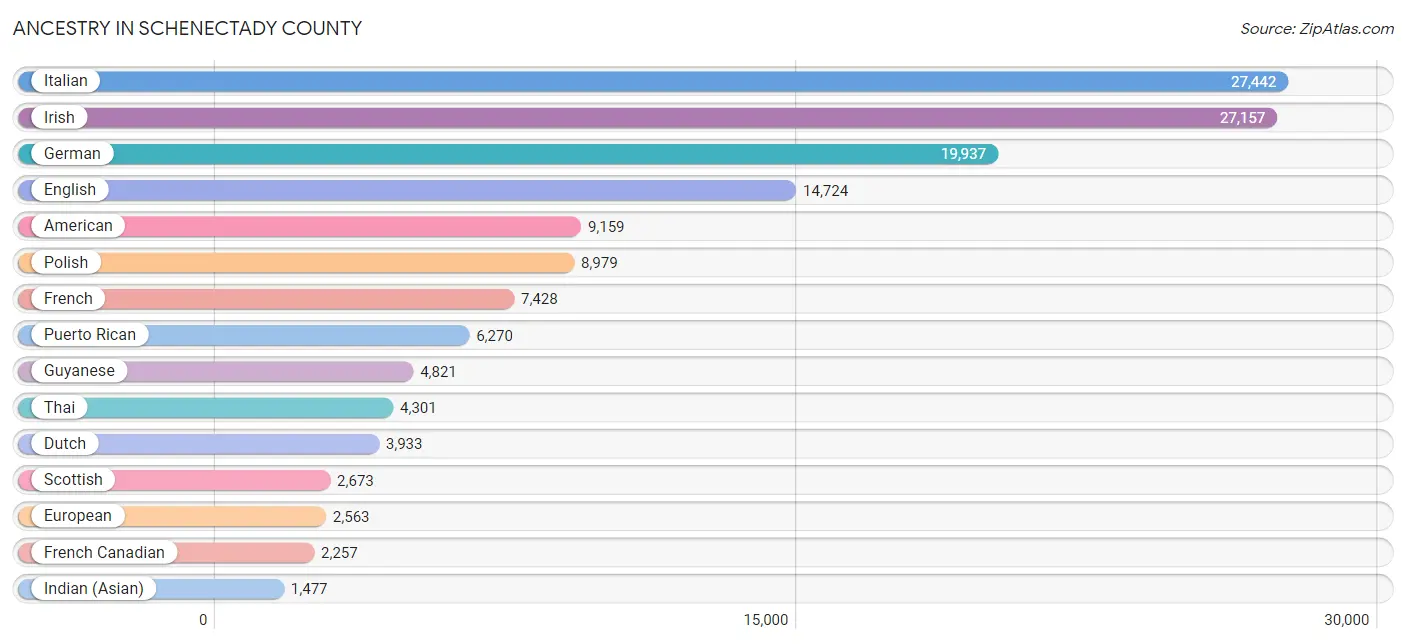
Ancestry in Schenectady County
The most populous ancestries reported in Schenectady County are Italian (27,442 | 17.2%), Irish (27,157 | 17.0%), German (19,937 | 12.5%), English (14,724 | 9.2%), and American (9,159 | 5.7%), together accounting for 61.7% of all Schenectady County residents.
| Ancestry | # Population | % Population |
| Afghan | 275 | 0.2% |
| African | 671 | 0.4% |
| Alaska Native | 30 | 0.0% |
| Albanian | 23 | 0.0% |
| American | 9,159 | 5.7% |
| Apache | 59 | 0.0% |
| Arab | 554 | 0.4% |
| Argentinean | 14 | 0.0% |
| Armenian | 108 | 0.1% |
| Australian | 23 | 0.0% |
| Austrian | 225 | 0.1% |
| Bahamian | 27 | 0.0% |
| Barbadian | 117 | 0.1% |
| Belgian | 145 | 0.1% |
| Belizean | 16 | 0.0% |
| Bhutanese | 289 | 0.2% |
| Blackfeet | 184 | 0.1% |
| Bolivian | 14 | 0.0% |
| Brazilian | 33 | 0.0% |
| British | 709 | 0.4% |
| British West Indian | 84 | 0.1% |
| Bulgarian | 16 | 0.0% |
| Burmese | 639 | 0.4% |
| Cambodian | 19 | 0.0% |
| Canadian | 386 | 0.2% |
| Celtic | 3 | 0.0% |
| Central American | 1,361 | 0.9% |
| Central American Indian | 189 | 0.1% |
| Cherokee | 322 | 0.2% |
| Chilean | 75 | 0.1% |
| Chippewa | 18 | 0.0% |
| Colombian | 113 | 0.1% |
| Costa Rican | 116 | 0.1% |
| Creek | 1 | 0.0% |
| Croatian | 36 | 0.0% |
| Cuban | 288 | 0.2% |
| Czech | 361 | 0.2% |
| Czechoslovakian | 153 | 0.1% |
| Danish | 393 | 0.3% |
| Delaware | 21 | 0.0% |
| Dominican | 1,095 | 0.7% |
| Dutch | 3,933 | 2.5% |
| Eastern European | 615 | 0.4% |
| Ecuadorian | 185 | 0.1% |
| Egyptian | 95 | 0.1% |
| English | 14,724 | 9.2% |
| Estonian | 6 | 0.0% |
| Ethiopian | 16 | 0.0% |
| European | 2,563 | 1.6% |
| Filipino | 16 | 0.0% |
| Finnish | 118 | 0.1% |
| French | 7,428 | 4.7% |
| French American Indian | 95 | 0.1% |
| French Canadian | 2,257 | 1.4% |
| German | 19,937 | 12.5% |
| Ghanaian | 10 | 0.0% |
| Greek | 794 | 0.5% |
| Guatemalan | 186 | 0.1% |
| Guyanese | 4,821 | 3.0% |
| Haitian | 415 | 0.3% |
| Honduran | 502 | 0.3% |
| Hungarian | 911 | 0.6% |
| Indian (Asian) | 1,477 | 0.9% |
| Indonesian | 216 | 0.1% |
| Iranian | 45 | 0.0% |
| Iraqi | 12 | 0.0% |
| Irish | 27,157 | 17.0% |
| Iroquois | 326 | 0.2% |
| Israeli | 2 | 0.0% |
| Italian | 27,442 | 17.2% |
| Jamaican | 387 | 0.2% |
| Japanese | 8 | 0.0% |
| Kiowa | 81 | 0.1% |
| Korean | 580 | 0.4% |
| Latvian | 138 | 0.1% |
| Lebanese | 247 | 0.2% |
| Lithuanian | 516 | 0.3% |
| Malaysian | 17 | 0.0% |
| Maltese | 14 | 0.0% |
| Mexican | 1,275 | 0.8% |
| Mexican American Indian | 161 | 0.1% |
| Moroccan | 21 | 0.0% |
| Native Hawaiian | 124 | 0.1% |
| Navajo | 17 | 0.0% |
| Nicaraguan | 7 | 0.0% |
| Nigerian | 97 | 0.1% |
| Northern European | 195 | 0.1% |
| Norwegian | 693 | 0.4% |
| Pakistani | 19 | 0.0% |
| Panamanian | 89 | 0.1% |
| Pennsylvania German | 61 | 0.0% |
| Peruvian | 217 | 0.1% |
| Polish | 8,979 | 5.6% |
| Portuguese | 273 | 0.2% |
| Puerto Rican | 6,270 | 3.9% |
| Romanian | 126 | 0.1% |
| Russian | 1,315 | 0.8% |
| Salvadoran | 255 | 0.2% |
| Samoan | 33 | 0.0% |
| Scandinavian | 259 | 0.2% |
| Scotch-Irish | 1,101 | 0.7% |
| Scottish | 2,673 | 1.7% |
| Sioux | 84 | 0.1% |
| Slavic | 132 | 0.1% |
| Slovak | 570 | 0.4% |
| Slovene | 43 | 0.0% |
| South American | 874 | 0.5% |
| South American Indian | 44 | 0.0% |
| Spaniard | 418 | 0.3% |
| Spanish | 213 | 0.1% |
| Sri Lankan | 233 | 0.2% |
| Subsaharan African | 1,167 | 0.7% |
| Sudanese | 215 | 0.1% |
| Swedish | 1,047 | 0.7% |
| Swiss | 295 | 0.2% |
| Syrian | 23 | 0.0% |
| Thai | 4,301 | 2.7% |
| Trinidadian and Tobagonian | 207 | 0.1% |
| Turkish | 68 | 0.0% |
| U.S. Virgin Islander | 34 | 0.0% |
| Ukrainian | 681 | 0.4% |
| Uruguayan | 17 | 0.0% |
| Venezuelan | 131 | 0.1% |
| Vietnamese | 109 | 0.1% |
| Welsh | 947 | 0.6% |
| West Indian | 990 | 0.6% |
| Yugoslavian | 15 | 0.0% | View All 127 Rows |
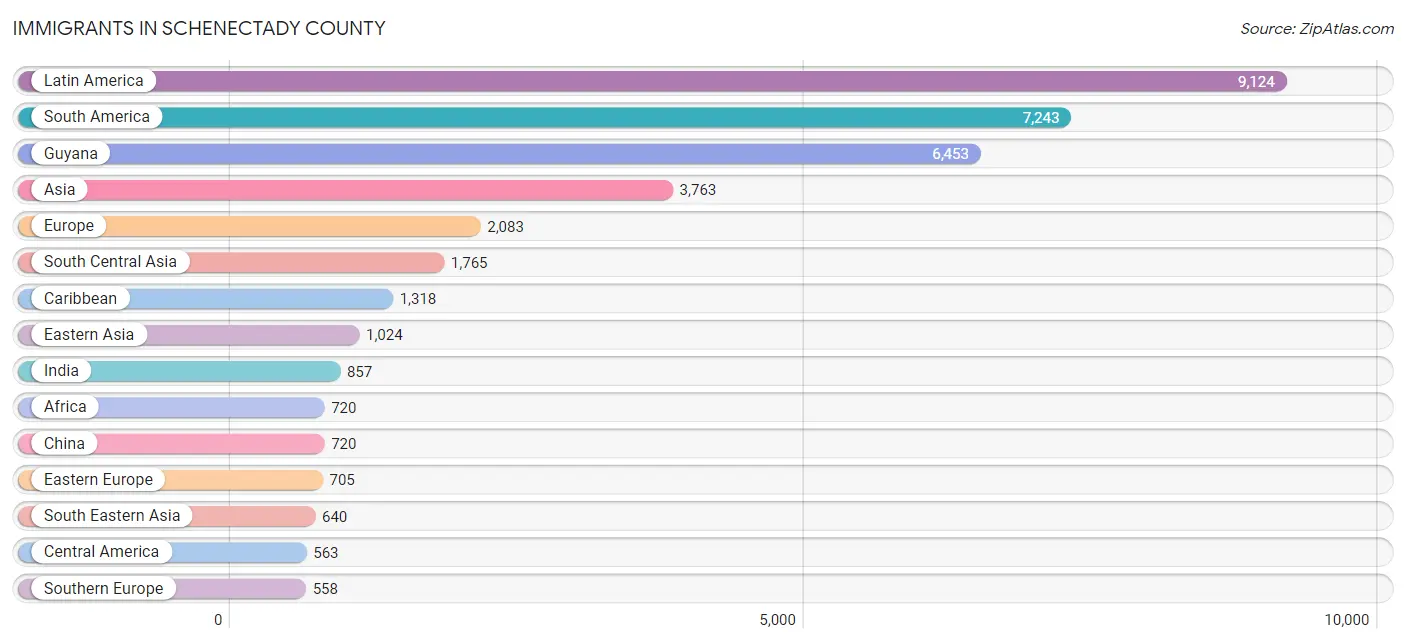
Immigrants in Schenectady County
The most numerous immigrant groups reported in Schenectady County came from Latin America (9,124 | 5.7%), South America (7,243 | 4.5%), Guyana (6,453 | 4.1%), Asia (3,763 | 2.4%), and Europe (2,083 | 1.3%), together accounting for 18.0% of all Schenectady County residents.
| Immigration Origin | # Population | % Population |
| Afghanistan | 407 | 0.3% |
| Africa | 720 | 0.4% |
| Albania | 23 | 0.0% |
| Argentina | 14 | 0.0% |
| Asia | 3,763 | 2.4% |
| Australia | 7 | 0.0% |
| Austria | 5 | 0.0% |
| Bangladesh | 97 | 0.1% |
| Barbados | 31 | 0.0% |
| Belarus | 46 | 0.0% |
| Bolivia | 3 | 0.0% |
| Brazil | 50 | 0.0% |
| Cameroon | 60 | 0.0% |
| Canada | 337 | 0.2% |
| Caribbean | 1,318 | 0.8% |
| Central America | 563 | 0.4% |
| Chile | 31 | 0.0% |
| China | 720 | 0.4% |
| Colombia | 47 | 0.0% |
| Costa Rica | 61 | 0.0% |
| Cuba | 13 | 0.0% |
| Czechoslovakia | 9 | 0.0% |
| Dominica | 43 | 0.0% |
| Dominican Republic | 335 | 0.2% |
| Eastern Africa | 132 | 0.1% |
| Eastern Asia | 1,024 | 0.6% |
| Eastern Europe | 705 | 0.4% |
| Ecuador | 108 | 0.1% |
| Egypt | 26 | 0.0% |
| El Salvador | 55 | 0.0% |
| England | 184 | 0.1% |
| Europe | 2,083 | 1.3% |
| France | 35 | 0.0% |
| Germany | 272 | 0.2% |
| Ghana | 76 | 0.1% |
| Greece | 28 | 0.0% |
| Guatemala | 100 | 0.1% |
| Guyana | 6,453 | 4.1% |
| Haiti | 146 | 0.1% |
| Honduras | 42 | 0.0% |
| Hong Kong | 181 | 0.1% |
| Hungary | 133 | 0.1% |
| India | 857 | 0.5% |
| Indonesia | 8 | 0.0% |
| Iran | 6 | 0.0% |
| Ireland | 81 | 0.1% |
| Israel | 25 | 0.0% |
| Italy | 491 | 0.3% |
| Jamaica | 370 | 0.2% |
| Japan | 46 | 0.0% |
| Jordan | 16 | 0.0% |
| Kazakhstan | 14 | 0.0% |
| Korea | 258 | 0.2% |
| Kuwait | 79 | 0.1% |
| Laos | 22 | 0.0% |
| Latin America | 9,124 | 5.7% |
| Latvia | 39 | 0.0% |
| Liberia | 20 | 0.0% |
| Malaysia | 58 | 0.0% |
| Mexico | 208 | 0.1% |
| Middle Africa | 60 | 0.0% |
| Moldova | 26 | 0.0% |
| Morocco | 42 | 0.0% |
| Nepal | 19 | 0.0% |
| Netherlands | 8 | 0.0% |
| Nicaragua | 59 | 0.0% |
| Nigeria | 46 | 0.0% |
| Northern Africa | 129 | 0.1% |
| Northern Europe | 479 | 0.3% |
| Norway | 10 | 0.0% |
| Oceania | 7 | 0.0% |
| Pakistan | 303 | 0.2% |
| Panama | 38 | 0.0% |
| Peru | 283 | 0.2% |
| Philippines | 306 | 0.2% |
| Poland | 128 | 0.1% |
| Portugal | 25 | 0.0% |
| Romania | 26 | 0.0% |
| Russia | 152 | 0.1% |
| Saudi Arabia | 66 | 0.0% |
| Scotland | 42 | 0.0% |
| Serbia | 6 | 0.0% |
| Singapore | 2 | 0.0% |
| South Africa | 34 | 0.0% |
| South America | 7,243 | 4.5% |
| South Central Asia | 1,765 | 1.1% |
| South Eastern Asia | 640 | 0.4% |
| Southern Europe | 558 | 0.4% |
| Spain | 14 | 0.0% |
| Sri Lanka | 57 | 0.0% |
| Sudan | 54 | 0.0% |
| Switzerland | 21 | 0.0% |
| Taiwan | 51 | 0.0% |
| Thailand | 11 | 0.0% |
| Trinidad and Tobago | 335 | 0.2% |
| Turkey | 29 | 0.0% |
| Ukraine | 104 | 0.1% |
| Uzbekistan | 5 | 0.0% |
| Venezuela | 114 | 0.1% |
| Vietnam | 159 | 0.1% |
| Western Africa | 326 | 0.2% |
| Western Asia | 334 | 0.2% |
| Western Europe | 341 | 0.2% |
| Yemen | 26 | 0.0% | View All 104 Rows |
Sex and Age in Schenectady County
Sex and Age in Schenectady County
The most populous age groups in Schenectady County are 20 to 24 Years (5,575 | 7.1%) for men and 60 to 64 Years (5,769 | 7.1%) for women.
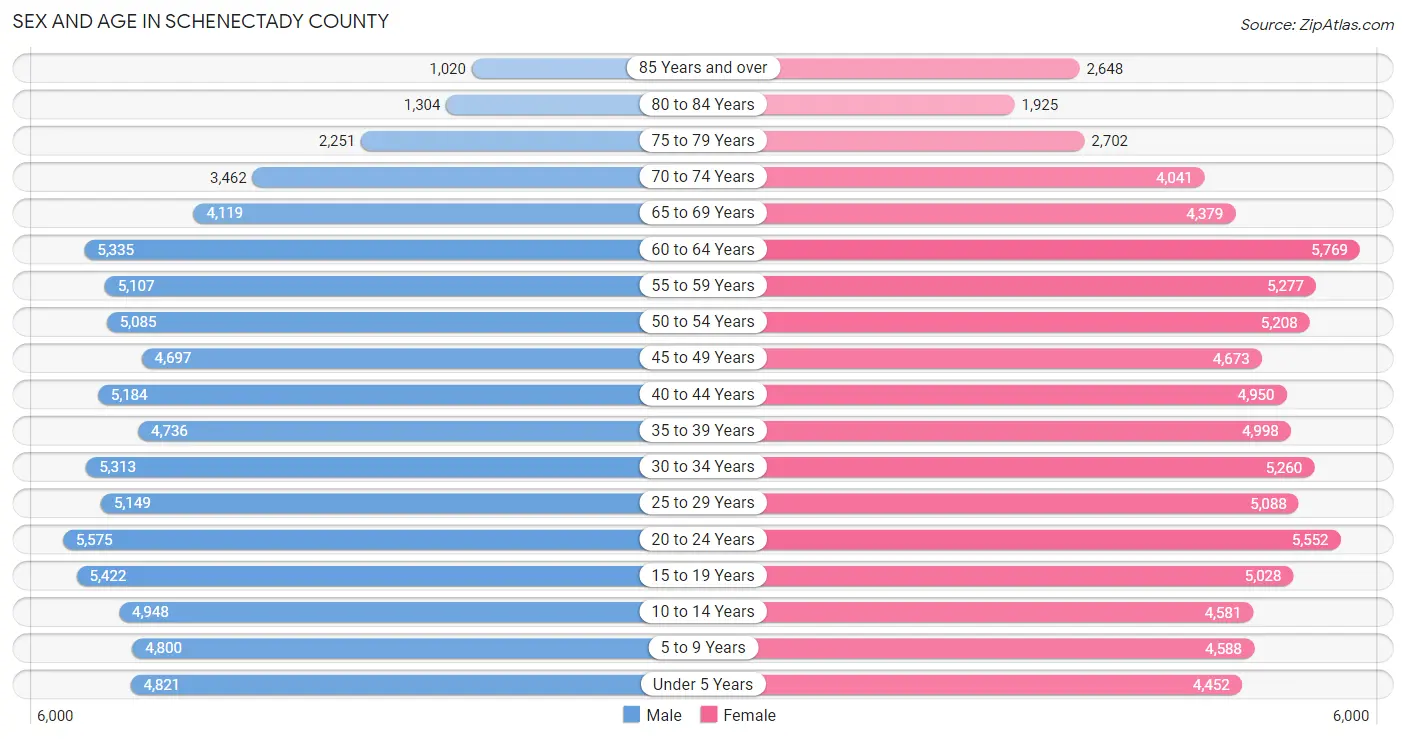
| Age Bracket | Male | Female |
| Under 5 Years | 4,821 (6.1%) | 4,452 (5.5%) |
| 5 to 9 Years | 4,800 (6.1%) | 4,588 (5.7%) |
| 10 to 14 Years | 4,948 (6.3%) | 4,581 (5.7%) |
| 15 to 19 Years | 5,422 (6.9%) | 5,028 (6.2%) |
| 20 to 24 Years | 5,575 (7.1%) | 5,552 (6.8%) |
| 25 to 29 Years | 5,149 (6.6%) | 5,088 (6.3%) |
| 30 to 34 Years | 5,313 (6.8%) | 5,260 (6.5%) |
| 35 to 39 Years | 4,736 (6.0%) | 4,998 (6.2%) |
| 40 to 44 Years | 5,184 (6.6%) | 4,950 (6.1%) |
| 45 to 49 Years | 4,697 (6.0%) | 4,673 (5.8%) |
| 50 to 54 Years | 5,085 (6.5%) | 5,208 (6.4%) |
| 55 to 59 Years | 5,107 (6.5%) | 5,277 (6.5%) |
| 60 to 64 Years | 5,335 (6.8%) | 5,769 (7.1%) |
| 65 to 69 Years | 4,119 (5.3%) | 4,379 (5.4%) |
| 70 to 74 Years | 3,462 (4.4%) | 4,041 (5.0%) |
| 75 to 79 Years | 2,251 (2.9%) | 2,702 (3.3%) |
| 80 to 84 Years | 1,304 (1.7%) | 1,925 (2.4%) |
| 85 Years and over | 1,020 (1.3%) | 2,648 (3.3%) |
| Total | 78,328 (100.0%) | 81,119 (100.0%) |
Families and Households in Schenectady County
Median Family Size in Schenectady County
The median family size in Schenectady County is 3.18 persons per family, with single female/mother families (6,995 | 18.9%) accounting for the largest median family size of 3.23 persons per family. On the other hand, single male/father families (2,655 | 7.2%) represent the smallest median family size with 2.93 persons per family.
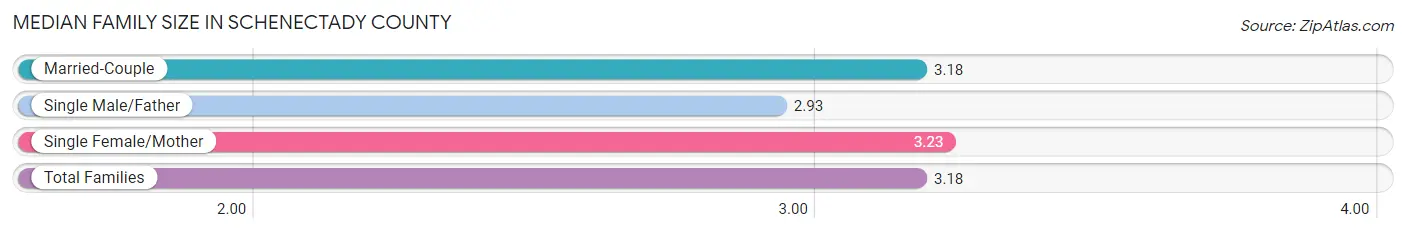
| Family Type | # Families | Family Size |
| Married-Couple | 27,348 (73.9%) | 3.18 |
| Single Male/Father | 2,655 (7.2%) | 2.93 |
| Single Female/Mother | 6,995 (18.9%) | 3.23 |
| Total Families | 36,998 (100.0%) | 3.18 |
Median Household Size in Schenectady County
The median household size in Schenectady County is 2.42 persons per household, with single female/mother households (6,995 | 10.9%) accounting for the largest median household size of 3.5 persons per household. non-family households (26,966 | 42.2%) represent the smallest median household size with 1.24 persons per household.
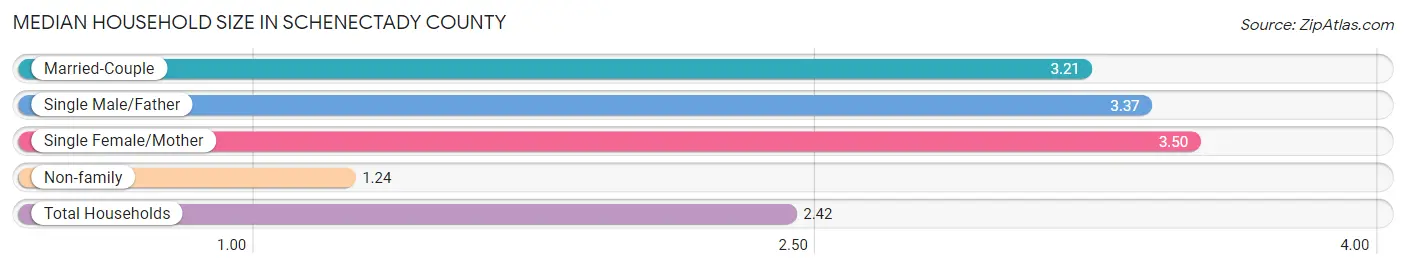
| Household Type | # Households | Household Size |
| Married-Couple | 27,348 (42.8%) | 3.21 |
| Single Male/Father | 2,655 (4.2%) | 3.37 |
| Single Female/Mother | 6,995 (10.9%) | 3.50 |
| Non-family | 26,966 (42.2%) | 1.24 |
| Total Households | 63,964 (100.0%) | 2.42 |
Household Size by Marriage Status in Schenectady County
Out of a total of 63,964 households in Schenectady County, 36,998 (57.8%) are family households, while 26,966 (42.2%) are nonfamily households. The most numerous type of family households are 2-person households, comprising 16,370, and the most common type of nonfamily households are 1-person households, comprising 21,689.
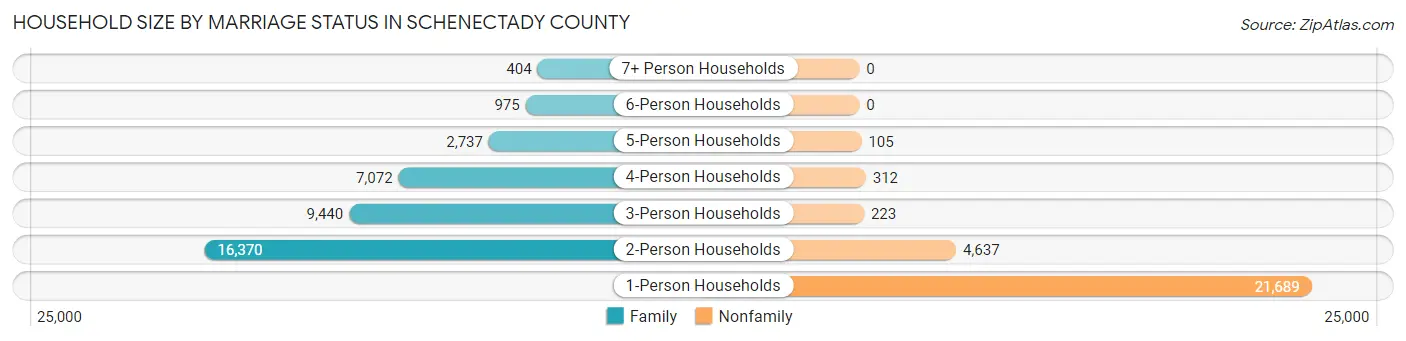
| Household Size | Family Households | Nonfamily Households |
| 1-Person Households | - | 21,689 (33.9%) |
| 2-Person Households | 16,370 (25.6%) | 4,637 (7.2%) |
| 3-Person Households | 9,440 (14.8%) | 223 (0.4%) |
| 4-Person Households | 7,072 (11.1%) | 312 (0.5%) |
| 5-Person Households | 2,737 (4.3%) | 105 (0.2%) |
| 6-Person Households | 975 (1.5%) | 0 (0.0%) |
| 7+ Person Households | 404 (0.6%) | 0 (0.0%) |
| Total | 36,998 (57.8%) | 26,966 (42.2%) |
Female Fertility in Schenectady County
Fertility by Age in Schenectady County
Average fertility rate in Schenectady County is 53.0 births per 1,000 women. Women in the age bracket of 20 to 34 years have the highest fertility rate with 75.0 births per 1,000 women. Women in the age bracket of 20 to 34 years acount for 61.2% of all women with births.
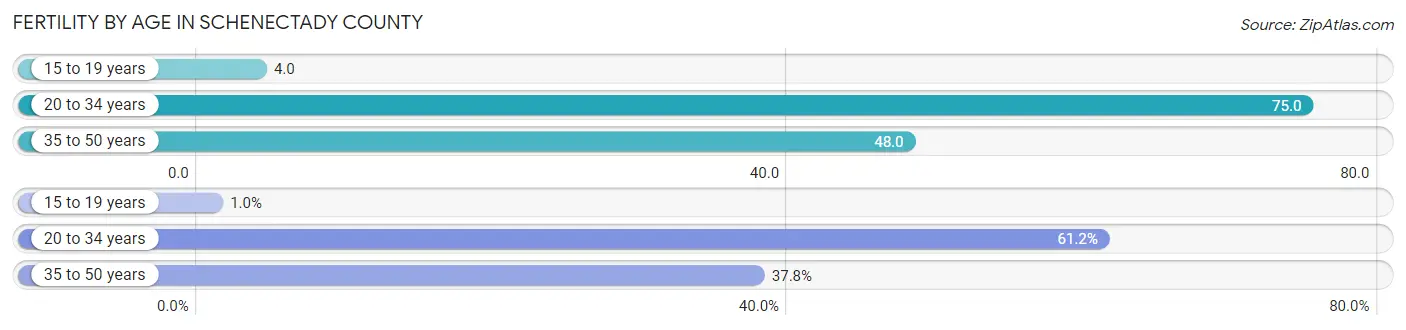
| Age Bracket | Women with Births | Births / 1,000 Women |
| 15 to 19 years | 20 (1.0%) | 4.0 |
| 20 to 34 years | 1,185 (61.2%) | 75.0 |
| 35 to 50 years | 732 (37.8%) | 48.0 |
| Total | 1,937 (100.0%) | 53.0 |
Fertility by Age by Marriage Status in Schenectady County
73.9% of women with births (1,937) in Schenectady County are married. The highest percentage of unmarried women with births falls into 15 to 19 years age bracket with 100.0% of them unmarried at the time of birth, while the lowest percentage of unmarried women with births belong to 35 to 50 years age bracket with 13.8% of them unmarried.
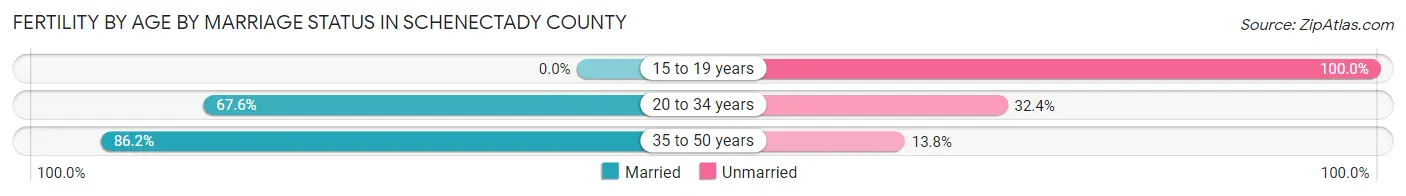
| Age Bracket | Married | Unmarried |
| 15 to 19 years | 0 (0.0%) | 20 (100.0%) |
| 20 to 34 years | 801 (67.6%) | 384 (32.4%) |
| 35 to 50 years | 631 (86.2%) | 101 (13.8%) |
| Total | 1,431 (73.9%) | 506 (26.1%) |
Fertility by Education in Schenectady County
Average fertility rate in Schenectady County is 53.0 births per 1,000 women. Women with the education attainment of less than high school have the highest fertility rate of 82.0 births per 1,000 women, while women with the education attainment of college or associate's degree have the lowest fertility at 39.0 births per 1,000 women. Women with the education attainment of less than high school represent 21.8% of all women with births.
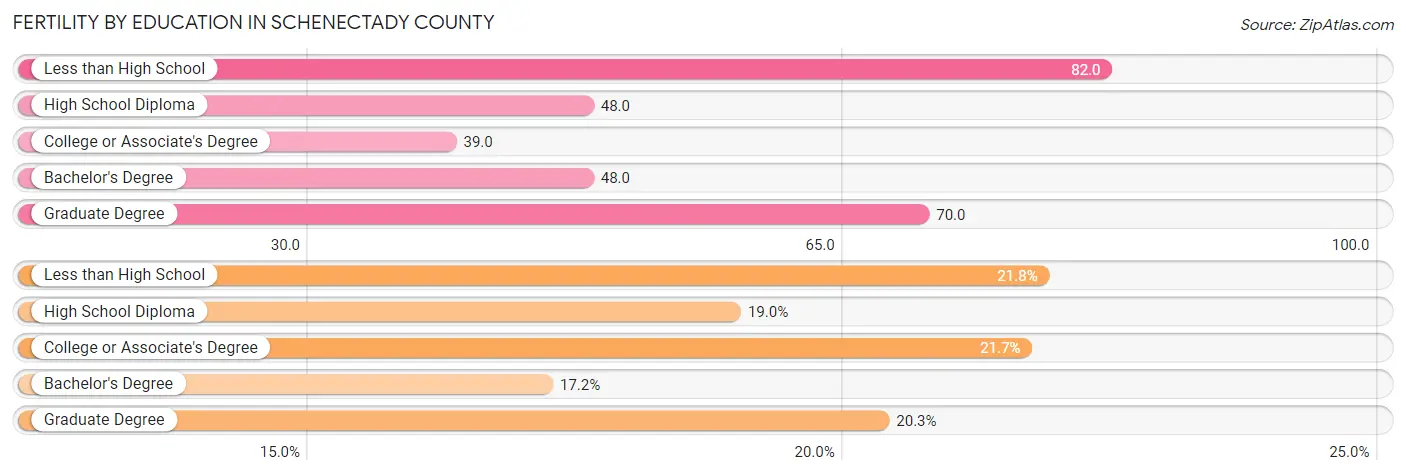
| Educational Attainment | Women with Births | Births / 1,000 Women |
| Less than High School | 423 (21.8%) | 82.0 |
| High School Diploma | 367 (19.0%) | 48.0 |
| College or Associate's Degree | 420 (21.7%) | 39.0 |
| Bachelor's Degree | 333 (17.2%) | 48.0 |
| Graduate Degree | 394 (20.3%) | 70.0 |
| Total | 1,937 (100.0%) | 53.0 |
Fertility by Education by Marriage Status in Schenectady County
26.1% of women with births in Schenectady County are unmarried. Women with the educational attainment of graduate degree are most likely to be married with 94.4% of them married at childbirth, while women with the educational attainment of high school diploma are least likely to be married with 53.4% of them unmarried at childbirth.
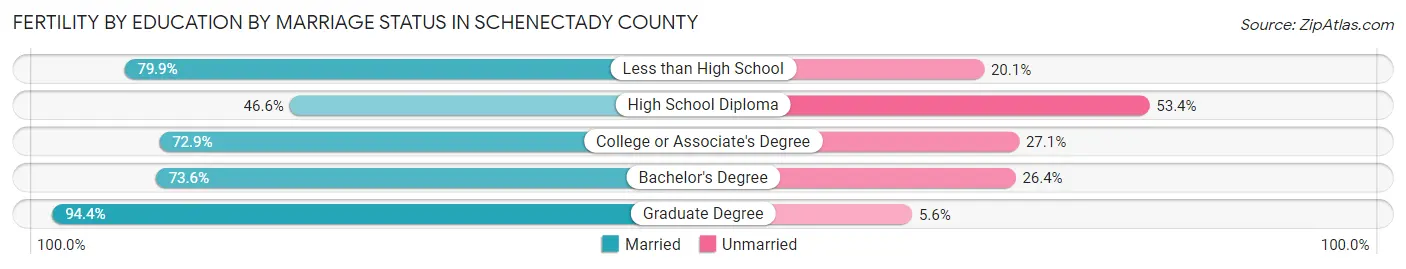
| Educational Attainment | Married | Unmarried |
| Less than High School | 338 (79.9%) | 85 (20.1%) |
| High School Diploma | 171 (46.6%) | 196 (53.4%) |
| College or Associate's Degree | 306 (72.9%) | 114 (27.1%) |
| Bachelor's Degree | 245 (73.6%) | 88 (26.4%) |
| Graduate Degree | 372 (94.4%) | 22 (5.6%) |
| Total | 1,431 (73.9%) | 506 (26.1%) |
Employment Characteristics in Schenectady County
Employment by Class of Employer in Schenectady County
Among the 75,018 employed individuals in Schenectady County, private company employees (45,120 | 60.2%), not-for-profit organizations (10,881 | 14.5%), and state government employees (6,730 | 9.0%) make up the most common classes of employment.
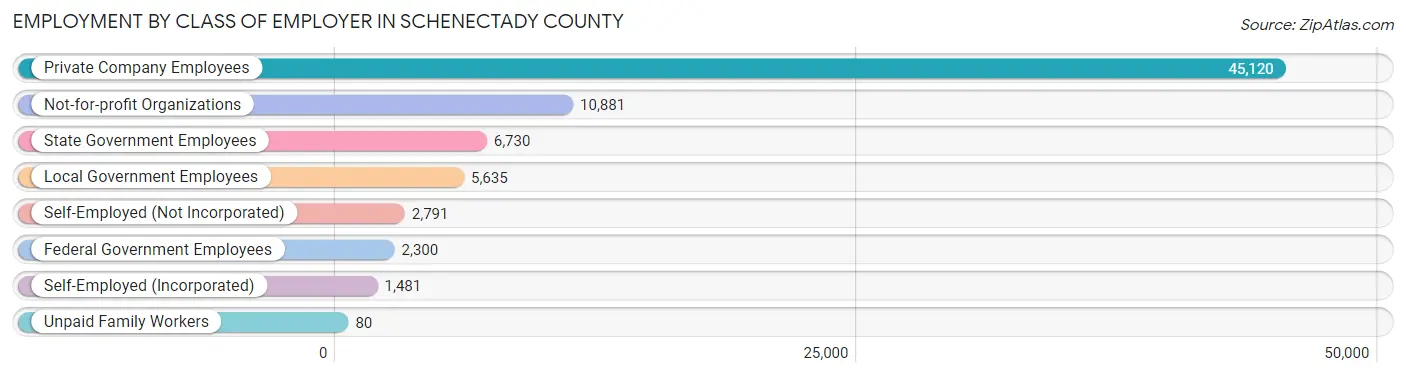
| Employer Class | # Employees | % Employees |
| Private Company Employees | 45,120 | 60.2% |
| Self-Employed (Incorporated) | 1,481 | 2.0% |
| Self-Employed (Not Incorporated) | 2,791 | 3.7% |
| Not-for-profit Organizations | 10,881 | 14.5% |
| Local Government Employees | 5,635 | 7.5% |
| State Government Employees | 6,730 | 9.0% |
| Federal Government Employees | 2,300 | 3.1% |
| Unpaid Family Workers | 80 | 0.1% |
| Total | 75,018 | 100.0% |
Employment Status by Age in Schenectady County
According to the labor force statistics for Schenectady County, out of the total population over 16 years of age (129,383), 62.9% or 81,382 individuals are in the labor force, with 6.0% or 4,883 of them unemployed. The age group with the highest labor force participation rate is 25 to 29 years, with 86.6% or 8,865 individuals in the labor force. Within the labor force, the 16 to 19 years age range has the highest percentage of unemployed individuals, with 19.3% or 612 of them being unemployed.
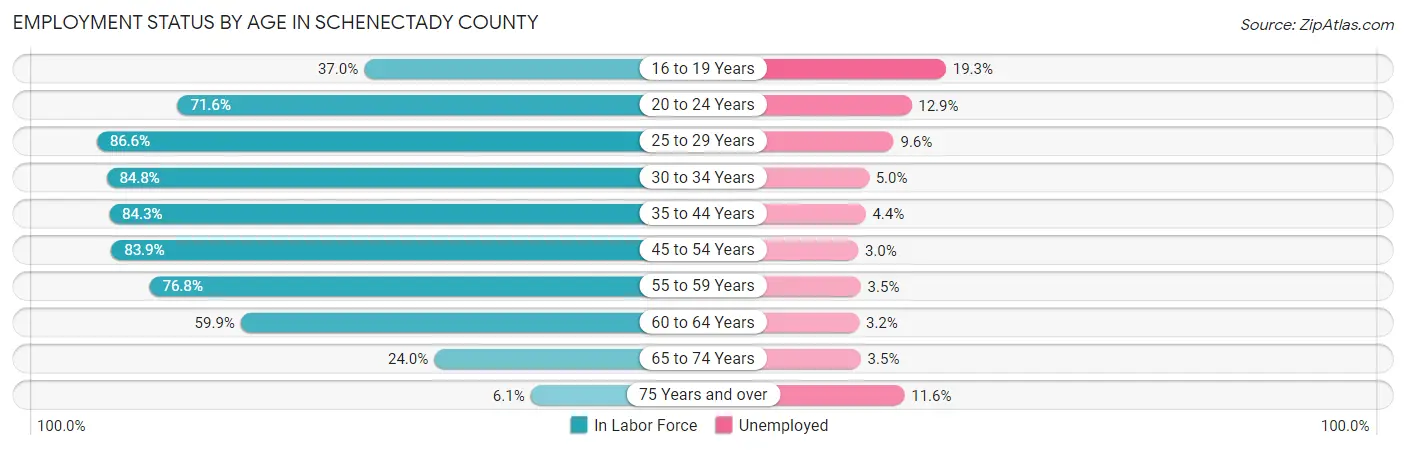
| Age Bracket | In Labor Force | Unemployed |
| 16 to 19 Years | 3,173 (37.0%) | 612 (19.3%) |
| 20 to 24 Years | 7,967 (71.6%) | 1,028 (12.9%) |
| 25 to 29 Years | 8,865 (86.6%) | 851 (9.6%) |
| 30 to 34 Years | 8,966 (84.8%) | 448 (5.0%) |
| 35 to 44 Years | 16,749 (84.3%) | 737 (4.4%) |
| 45 to 54 Years | 16,497 (83.9%) | 495 (3.0%) |
| 55 to 59 Years | 7,975 (76.8%) | 279 (3.5%) |
| 60 to 64 Years | 6,651 (59.9%) | 213 (3.2%) |
| 65 to 74 Years | 3,840 (24.0%) | 134 (3.5%) |
| 75 Years and over | 723 (6.1%) | 84 (11.6%) |
| Total | 81,382 (62.9%) | 4,883 (6.0%) |
Employment Status by Educational Attainment in Schenectady County
According to labor force statistics for Schenectady County, 80.3% of individuals (65,709) out of the total population between 25 and 64 years of age (81,829) are in the labor force, with 4.6% or 3,023 of them being unemployed. The group with the highest labor force participation rate are those with the educational attainment of bachelor's degree or higher, with 90.7% or 26,259 individuals in the labor force. Within the labor force, individuals with less than high school education have the highest percentage of unemployment, with 13.4% or 478 of them being unemployed.
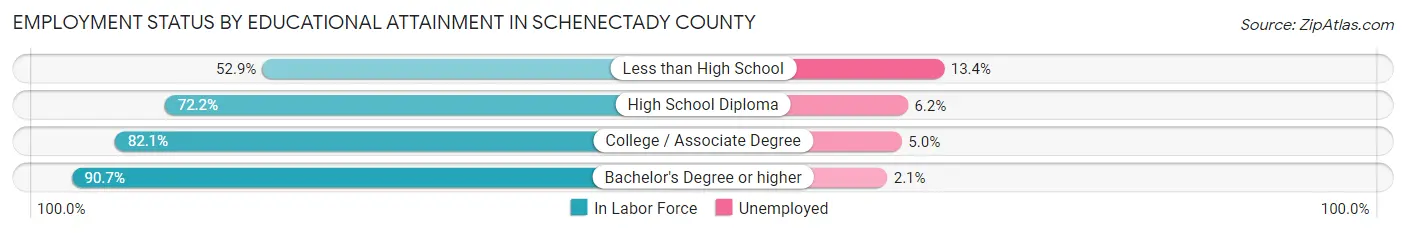
| Educational Attainment | In Labor Force | Unemployed |
| Less than High School | 3,569 (52.9%) | 904 (13.4%) |
| High School Diploma | 14,685 (72.2%) | 1,261 (6.2%) |
| College / Associate Degree | 21,176 (82.1%) | 1,290 (5.0%) |
| Bachelor's Degree or higher | 26,259 (90.7%) | 608 (2.1%) |
| Total | 65,709 (80.3%) | 3,764 (4.6%) |
Employment Occupations by Sex in Schenectady County
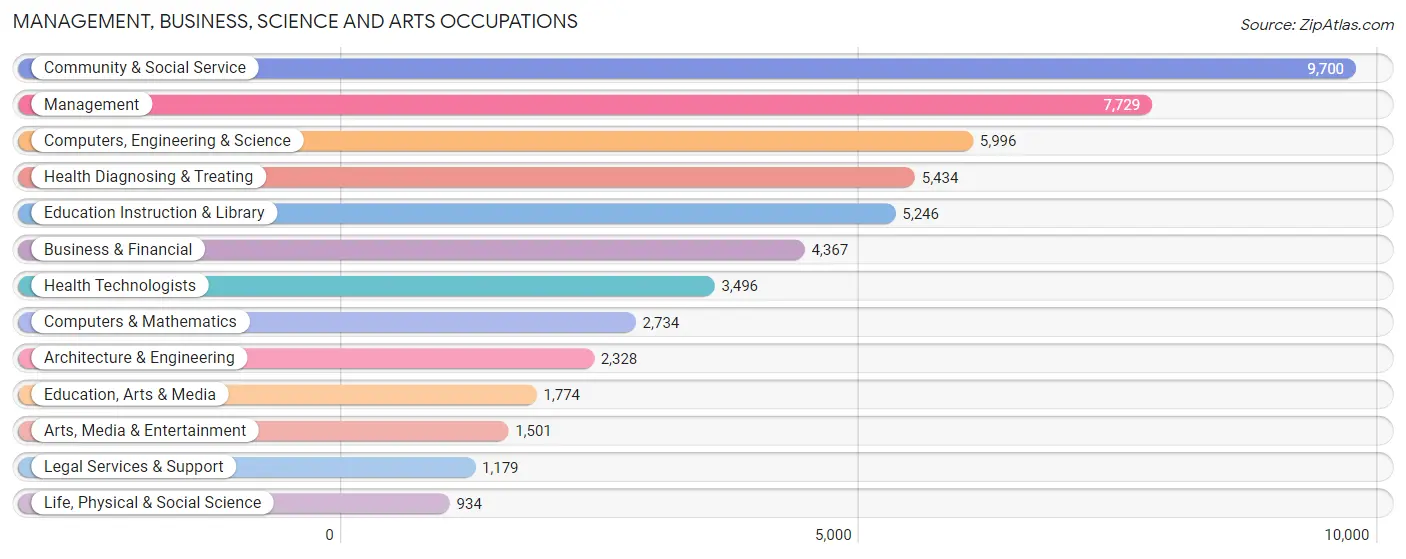
Management, Business, Science and Arts Occupations
The most common Management, Business, Science and Arts occupations in Schenectady County are Community & Social Service (9,700 | 12.7%), Management (7,729 | 10.1%), Computers, Engineering & Science (5,996 | 7.9%), Health Diagnosing & Treating (5,434 | 7.1%), and Education Instruction & Library (5,246 | 6.9%).
Management, Business, Science and Arts Occupations by Sex
Within the Management, Business, Science and Arts occupations in Schenectady County, the most male-oriented occupations are Architecture & Engineering (79.8%), Computers, Engineering & Science (72.2%), and Computers & Mathematics (71.4%), while the most female-oriented occupations are Health Technologists (80.1%), Health Diagnosing & Treating (78.8%), and Education, Arts & Media (71.1%).
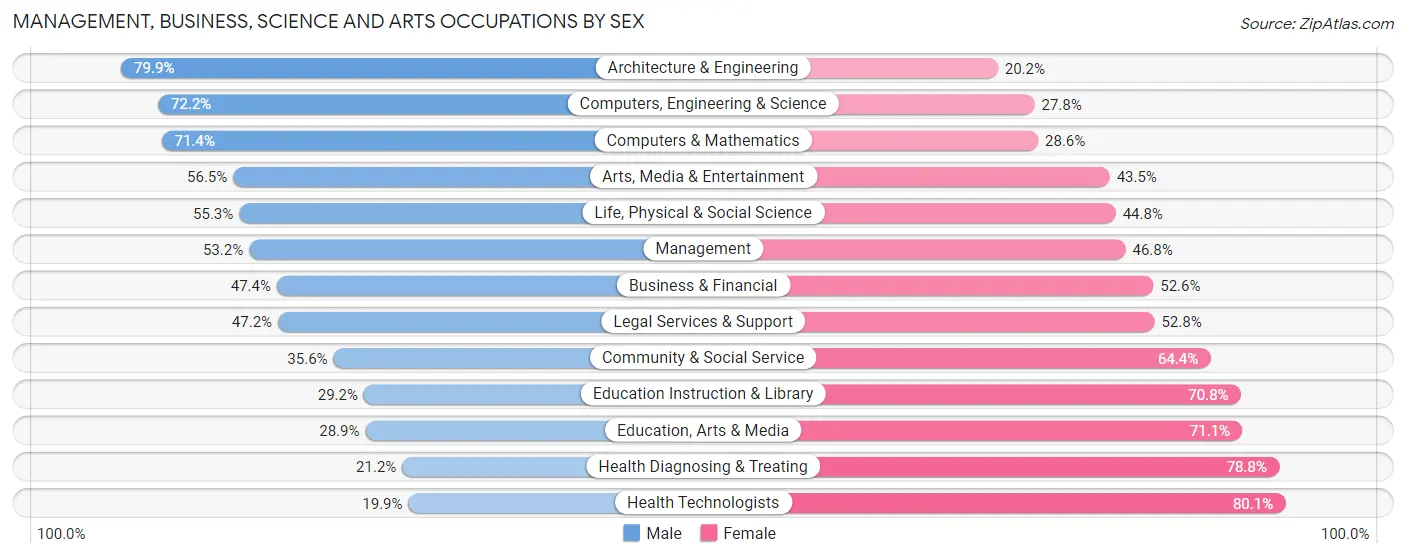
| Occupation | Male | Female |
| Management | 4,111 (53.2%) | 3,618 (46.8%) |
| Business & Financial | 2,070 (47.4%) | 2,297 (52.6%) |
| Computers, Engineering & Science | 4,328 (72.2%) | 1,668 (27.8%) |
| Computers & Mathematics | 1,953 (71.4%) | 781 (28.6%) |
| Architecture & Engineering | 1,859 (79.8%) | 469 (20.2%) |
| Life, Physical & Social Science | 516 (55.2%) | 418 (44.8%) |
| Community & Social Service | 3,451 (35.6%) | 6,249 (64.4%) |
| Education, Arts & Media | 513 (28.9%) | 1,261 (71.1%) |
| Legal Services & Support | 556 (47.2%) | 623 (52.8%) |
| Education Instruction & Library | 1,534 (29.2%) | 3,712 (70.8%) |
| Arts, Media & Entertainment | 848 (56.5%) | 653 (43.5%) |
| Health Diagnosing & Treating | 1,154 (21.2%) | 4,280 (78.8%) |
| Health Technologists | 697 (19.9%) | 2,799 (80.1%) |
| Total (Category) | 15,114 (45.5%) | 18,112 (54.5%) |
| Total (Overall) | 39,235 (51.4%) | 37,132 (48.6%) |
Services Occupations
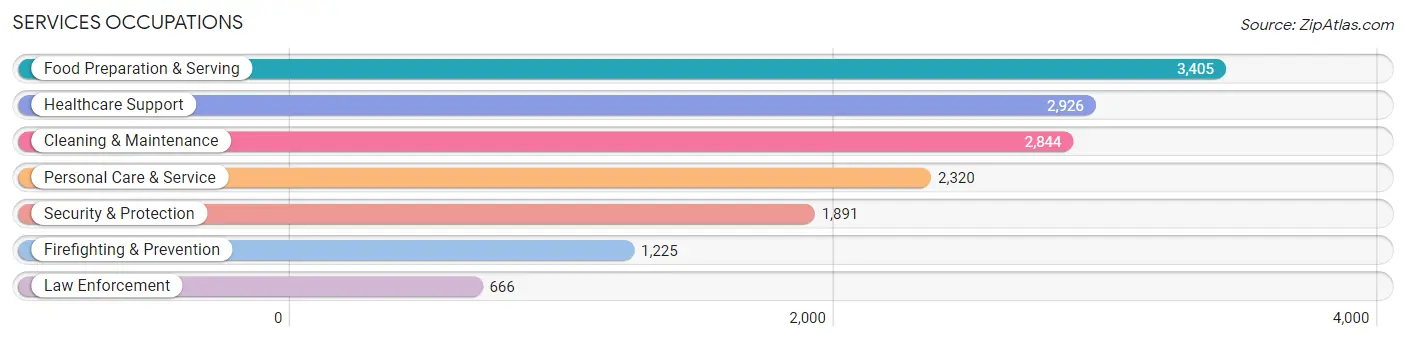
The most common Services occupations in Schenectady County are Food Preparation & Serving (3,405 | 4.5%), Healthcare Support (2,926 | 3.8%), Cleaning & Maintenance (2,844 | 3.7%), Personal Care & Service (2,320 | 3.0%), and Security & Protection (1,891 | 2.5%).
Services Occupations by Sex
Within the Services occupations in Schenectady County, the most male-oriented occupations are Law Enforcement (94.4%), Security & Protection (79.2%), and Firefighting & Prevention (70.9%), while the most female-oriented occupations are Healthcare Support (84.6%), Personal Care & Service (73.5%), and Food Preparation & Serving (48.3%).
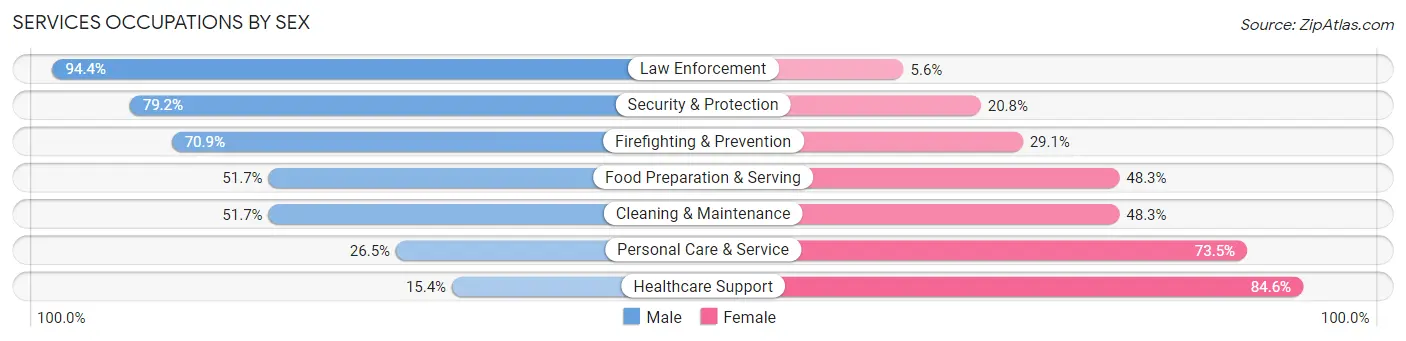
| Occupation | Male | Female |
| Healthcare Support | 450 (15.4%) | 2,476 (84.6%) |
| Security & Protection | 1,497 (79.2%) | 394 (20.8%) |
| Firefighting & Prevention | 868 (70.9%) | 357 (29.1%) |
| Law Enforcement | 629 (94.4%) | 37 (5.6%) |
| Food Preparation & Serving | 1,761 (51.7%) | 1,644 (48.3%) |
| Cleaning & Maintenance | 1,471 (51.7%) | 1,373 (48.3%) |
| Personal Care & Service | 614 (26.5%) | 1,706 (73.5%) |
| Total (Category) | 5,793 (43.3%) | 7,593 (56.7%) |
| Total (Overall) | 39,235 (51.4%) | 37,132 (48.6%) |
Sales and Office Occupations
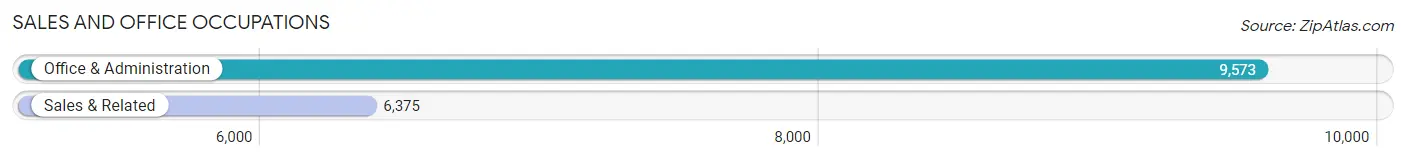
The most common Sales and Office occupations in Schenectady County are Office & Administration (9,573 | 12.5%), and Sales & Related (6,375 | 8.4%).
Sales and Office Occupations by Sex
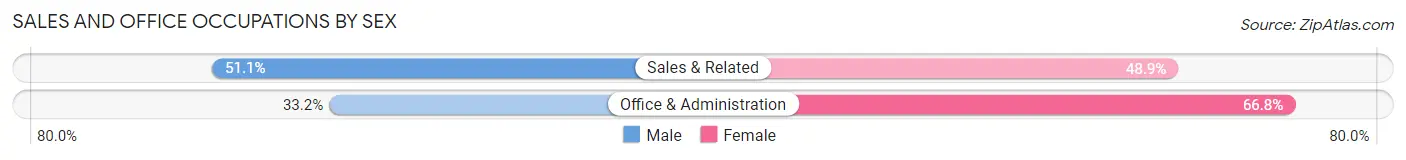
| Occupation | Male | Female |
| Sales & Related | 3,260 (51.1%) | 3,115 (48.9%) |
| Office & Administration | 3,175 (33.2%) | 6,398 (66.8%) |
| Total (Category) | 6,435 (40.4%) | 9,513 (59.7%) |
| Total (Overall) | 39,235 (51.4%) | 37,132 (48.6%) |
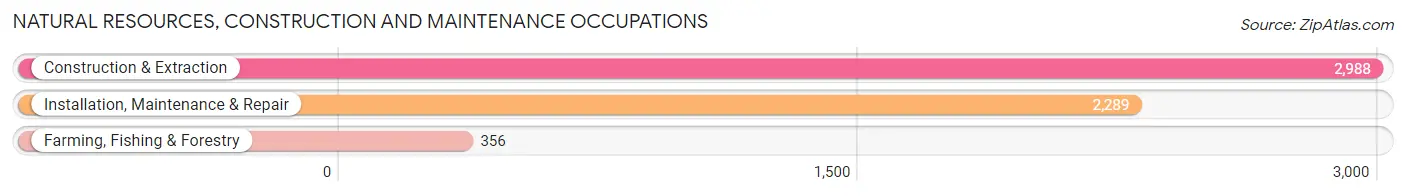
Natural Resources, Construction and Maintenance Occupations
The most common Natural Resources, Construction and Maintenance occupations in Schenectady County are Construction & Extraction (2,988 | 3.9%), Installation, Maintenance & Repair (2,289 | 3.0%), and Farming, Fishing & Forestry (356 | 0.5%).
Natural Resources, Construction and Maintenance Occupations by Sex
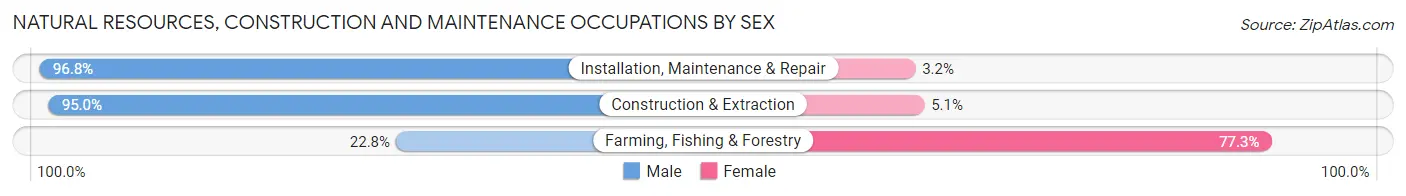
| Occupation | Male | Female |
| Farming, Fishing & Forestry | 81 (22.8%) | 275 (77.2%) |
| Construction & Extraction | 2,837 (95.0%) | 151 (5.1%) |
| Installation, Maintenance & Repair | 2,216 (96.8%) | 73 (3.2%) |
| Total (Category) | 5,134 (91.1%) | 499 (8.9%) |
| Total (Overall) | 39,235 (51.4%) | 37,132 (48.6%) |
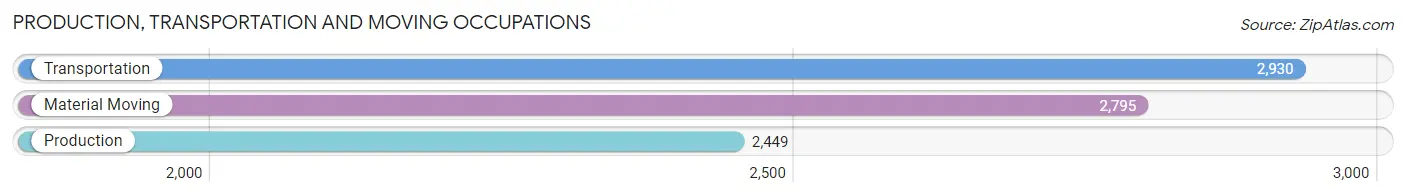
Production, Transportation and Moving Occupations
The most common Production, Transportation and Moving occupations in Schenectady County are Transportation (2,930 | 3.8%), Material Moving (2,795 | 3.7%), and Production (2,449 | 3.2%).
Production, Transportation and Moving Occupations by Sex
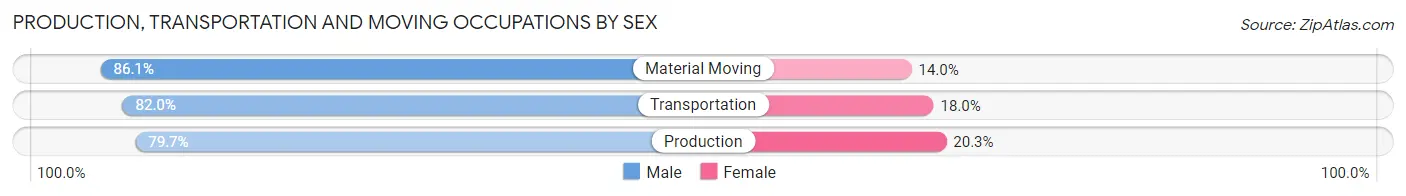
| Occupation | Male | Female |
| Production | 1,951 (79.7%) | 498 (20.3%) |
| Transportation | 2,403 (82.0%) | 527 (18.0%) |
| Material Moving | 2,405 (86.1%) | 390 (14.0%) |
| Total (Category) | 6,759 (82.7%) | 1,415 (17.3%) |
| Total (Overall) | 39,235 (51.4%) | 37,132 (48.6%) |
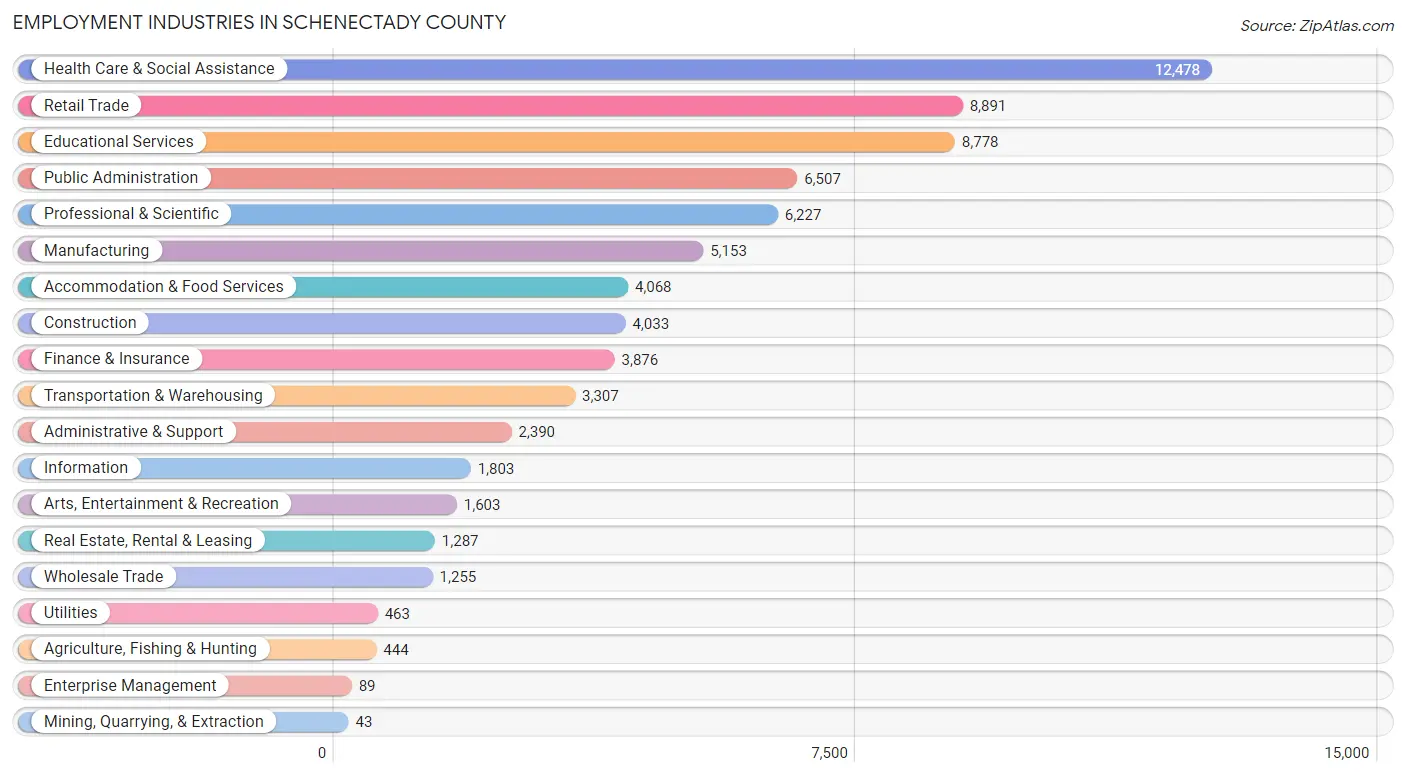
Employment Industries by Sex in Schenectady County
Employment Industries in Schenectady County
The major employment industries in Schenectady County include Health Care & Social Assistance (12,478 | 16.3%), Retail Trade (8,891 | 11.6%), Educational Services (8,778 | 11.5%), Public Administration (6,507 | 8.5%), and Professional & Scientific (6,227 | 8.2%).
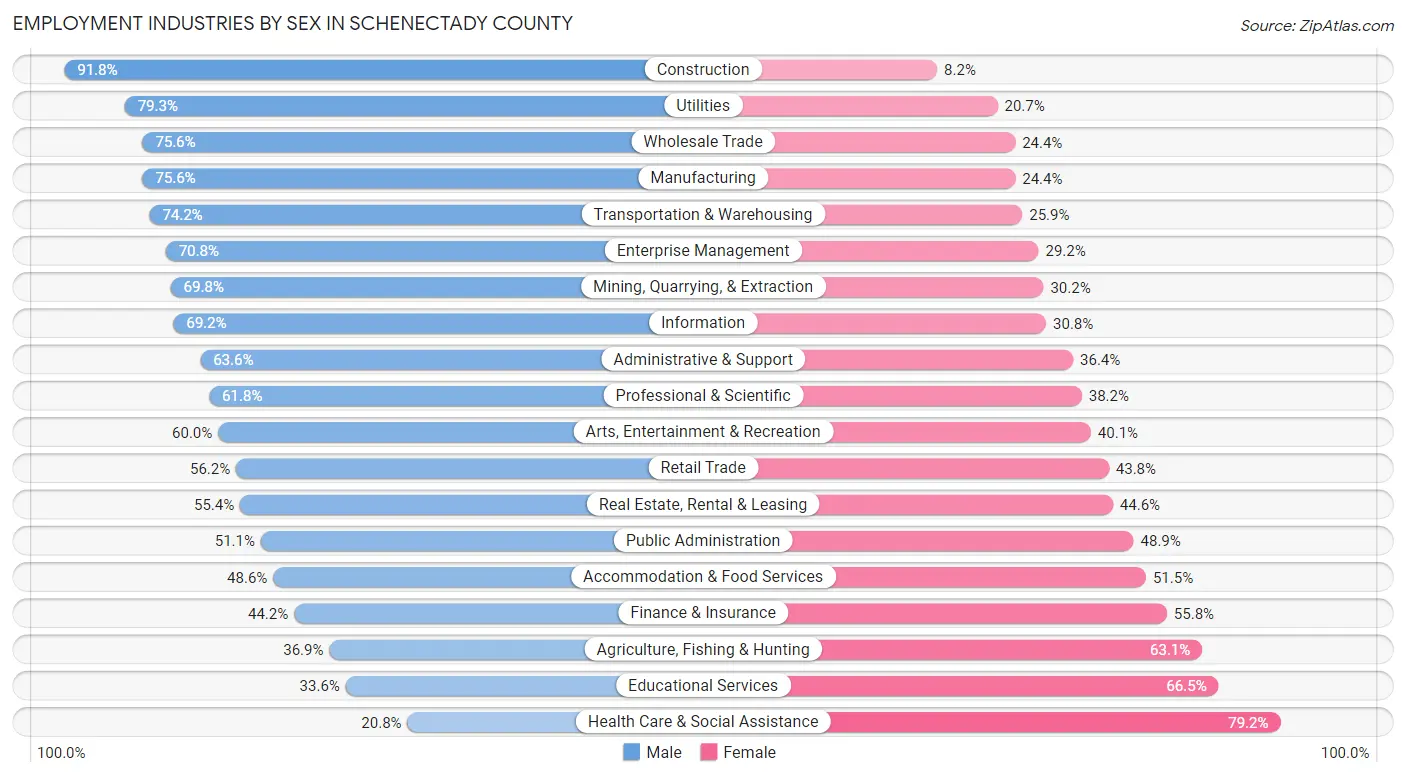
Employment Industries by Sex in Schenectady County
The Schenectady County industries that see more men than women are Construction (91.8%), Utilities (79.3%), and Wholesale Trade (75.6%), whereas the industries that tend to have a higher number of women are Health Care & Social Assistance (79.2%), Educational Services (66.4%), and Agriculture, Fishing & Hunting (63.1%).
| Industry | Male | Female |
| Agriculture, Fishing & Hunting | 164 (36.9%) | 280 (63.1%) |
| Mining, Quarrying, & Extraction | 30 (69.8%) | 13 (30.2%) |
| Construction | 3,701 (91.8%) | 332 (8.2%) |
| Manufacturing | 3,896 (75.6%) | 1,257 (24.4%) |
| Wholesale Trade | 949 (75.6%) | 306 (24.4%) |
| Retail Trade | 4,999 (56.2%) | 3,892 (43.8%) |
| Transportation & Warehousing | 2,452 (74.2%) | 855 (25.9%) |
| Utilities | 367 (79.3%) | 96 (20.7%) |
| Information | 1,248 (69.2%) | 555 (30.8%) |
| Finance & Insurance | 1,714 (44.2%) | 2,162 (55.8%) |
| Real Estate, Rental & Leasing | 713 (55.4%) | 574 (44.6%) |
| Professional & Scientific | 3,850 (61.8%) | 2,377 (38.2%) |
| Enterprise Management | 63 (70.8%) | 26 (29.2%) |
| Administrative & Support | 1,521 (63.6%) | 869 (36.4%) |
| Educational Services | 2,945 (33.6%) | 5,833 (66.4%) |
| Health Care & Social Assistance | 2,591 (20.8%) | 9,887 (79.2%) |
| Arts, Entertainment & Recreation | 961 (60.0%) | 642 (40.1%) |
| Accommodation & Food Services | 1,975 (48.5%) | 2,093 (51.4%) |
| Public Administration | 3,326 (51.1%) | 3,181 (48.9%) |
| Total | 39,235 (51.4%) | 37,132 (48.6%) |
Education in Schenectady County
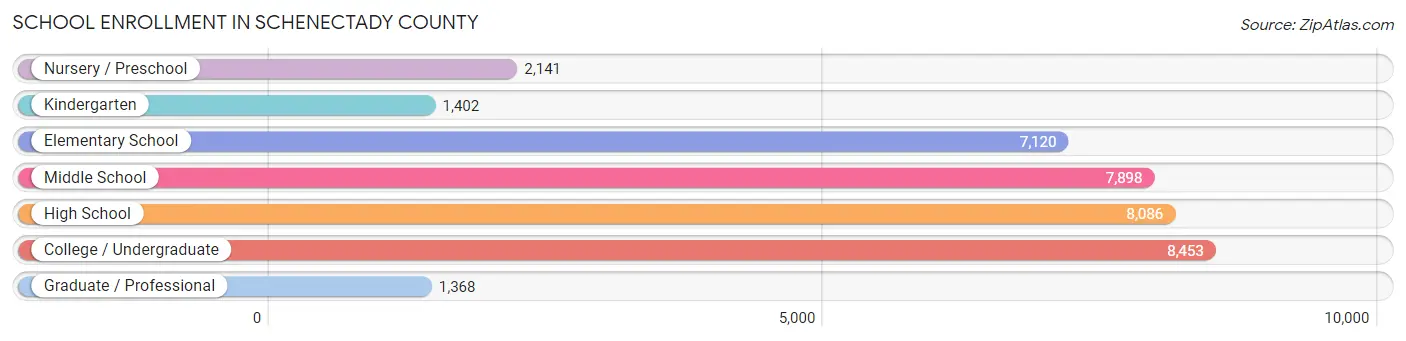
School Enrollment in Schenectady County
The most common levels of schooling among the 36,468 students in Schenectady County are college / undergraduate (8,453 | 23.2%), high school (8,086 | 22.2%), and middle school (7,898 | 21.7%).
| School Level | # Students | % Students |
| Nursery / Preschool | 2,141 | 5.9% |
| Kindergarten | 1,402 | 3.8% |
| Elementary School | 7,120 | 19.5% |
| Middle School | 7,898 | 21.7% |
| High School | 8,086 | 22.2% |
| College / Undergraduate | 8,453 | 23.2% |
| Graduate / Professional | 1,368 | 3.7% |
| Total | 36,468 | 100.0% |
School Enrollment by Age by Funding Source in Schenectady County
Out of a total of 36,468 students who are enrolled in schools in Schenectady County, 7,330 (20.1%) attend a private institution, while the remaining 29,138 (79.9%) are enrolled in public schools. The age group of 20 to 24 year olds has the highest likelihood of being enrolled in private schools, with 2,340 (55.2% in the age bracket) enrolled. Conversely, the age group of 15 to 17 year olds has the lowest likelihood of being enrolled in a private school, with 5,270 (94.3% in the age bracket) attending a public institution.
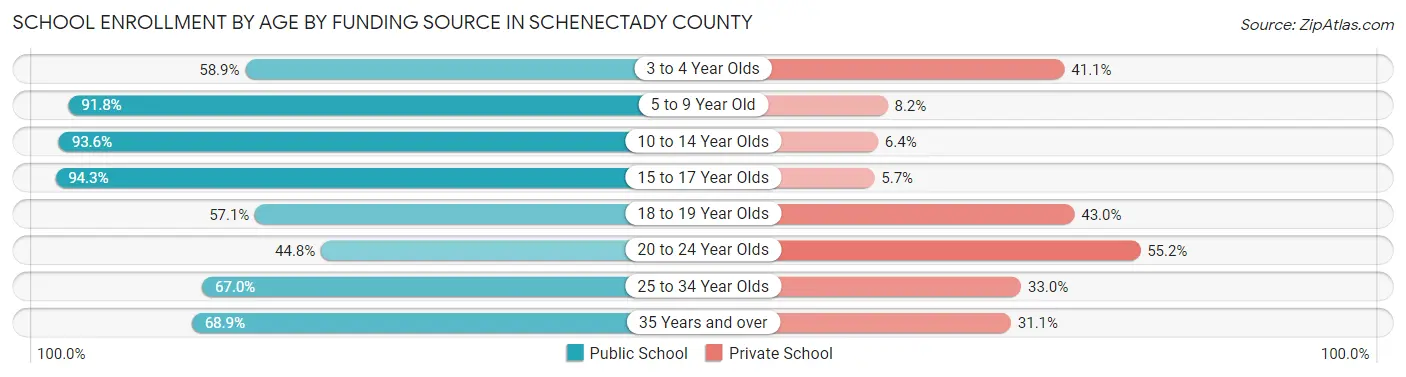
| Age Bracket | Public School | Private School |
| 3 to 4 Year Olds | 1,023 (58.9%) | 714 (41.1%) |
| 5 to 9 Year Old | 7,829 (91.8%) | 697 (8.2%) |
| 10 to 14 Year Olds | 8,757 (93.6%) | 597 (6.4%) |
| 15 to 17 Year Olds | 5,270 (94.3%) | 319 (5.7%) |
| 18 to 19 Year Olds | 2,141 (57.1%) | 1,612 (42.9%) |
| 20 to 24 Year Olds | 1,897 (44.8%) | 2,340 (55.2%) |
| 25 to 34 Year Olds | 1,133 (67.0%) | 559 (33.0%) |
| 35 Years and over | 1,088 (68.9%) | 492 (31.1%) |
| Total | 29,138 (79.9%) | 7,330 (20.1%) |
Educational Attainment by Field of Study in Schenectady County
Business (6,413 | 15.9%), education (4,835 | 12.0%), social sciences (4,197 | 10.4%), engineering (3,676 | 9.1%), and science & technology (3,599 | 8.9%) are the most common fields of study among 40,431 individuals in Schenectady County who have obtained a bachelor's degree or higher.
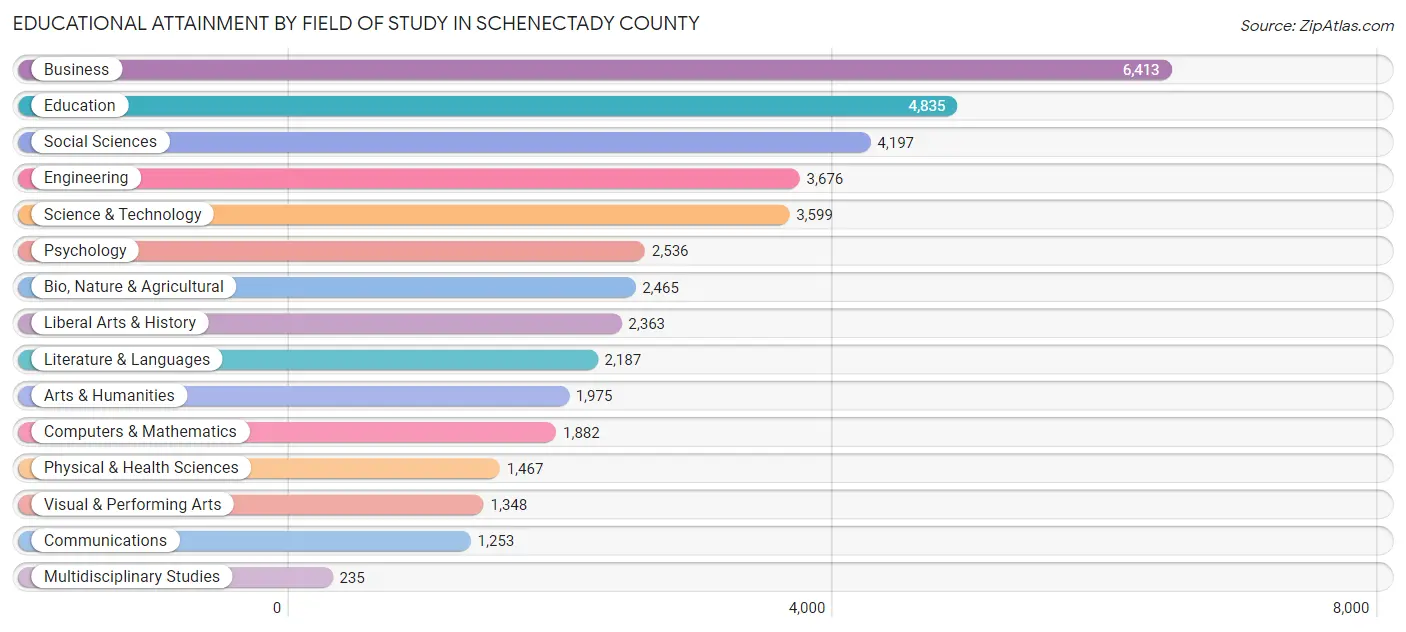
| Field of Study | # Graduates | % Graduates |
| Computers & Mathematics | 1,882 | 4.6% |
| Bio, Nature & Agricultural | 2,465 | 6.1% |
| Physical & Health Sciences | 1,467 | 3.6% |
| Psychology | 2,536 | 6.3% |
| Social Sciences | 4,197 | 10.4% |
| Engineering | 3,676 | 9.1% |
| Multidisciplinary Studies | 235 | 0.6% |
| Science & Technology | 3,599 | 8.9% |
| Business | 6,413 | 15.9% |
| Education | 4,835 | 12.0% |
| Literature & Languages | 2,187 | 5.4% |
| Liberal Arts & History | 2,363 | 5.8% |
| Visual & Performing Arts | 1,348 | 3.3% |
| Communications | 1,253 | 3.1% |
| Arts & Humanities | 1,975 | 4.9% |
| Total | 40,431 | 100.0% |
Transportation & Commute in Schenectady County
Vehicle Availability by Sex in Schenectady County
The most prevalent vehicle ownership categories in Schenectady County are males with 2 vehicles (17,301, accounting for 45.0%) and females with 2 vehicles (15,176, making up 48.4%).
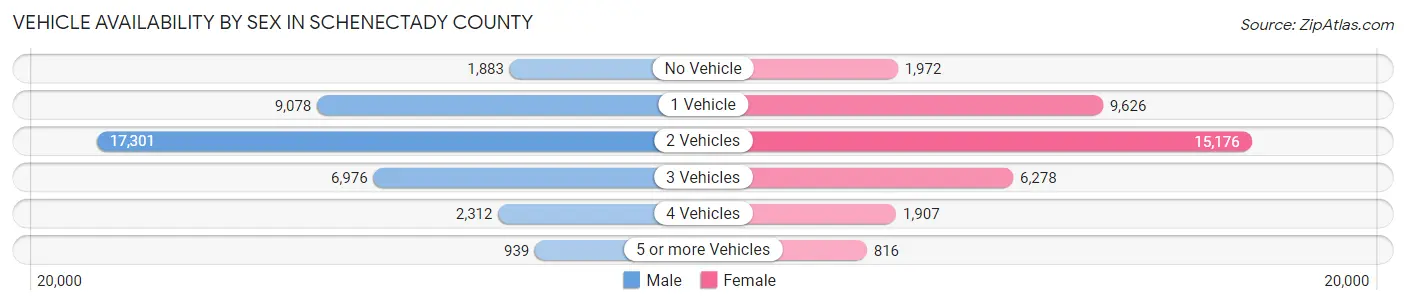
| Vehicles Available | Male | Female |
| No Vehicle | 1,883 (4.9%) | 1,972 (5.5%) |
| 1 Vehicle | 9,078 (23.6%) | 9,626 (26.9%) |
| 2 Vehicles | 17,301 (45.0%) | 15,176 (42.4%) |
| 3 Vehicles | 6,976 (18.1%) | 6,278 (17.5%) |
| 4 Vehicles | 2,312 (6.0%) | 1,907 (5.3%) |
| 5 or more Vehicles | 939 (2.4%) | 816 (2.3%) |
| Total | 38,489 (100.0%) | 35,775 (100.0%) |
Commute Time in Schenectady County
The most frequently occuring commute durations in Schenectady County are 10 to 14 minutes (11,198 commuters, 16.6%), 15 to 19 minutes (10,715 commuters, 15.9%), and 30 to 34 minutes (10,397 commuters, 15.4%).
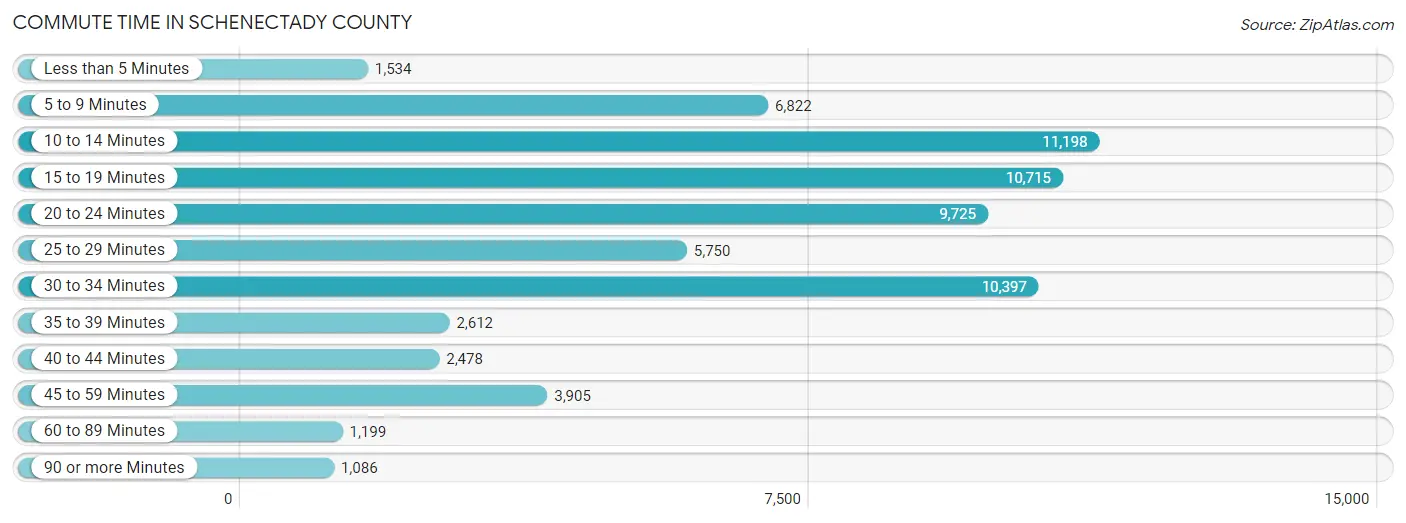
| Commute Time | # Commuters | % Commuters |
| Less than 5 Minutes | 1,534 | 2.3% |
| 5 to 9 Minutes | 6,822 | 10.1% |
| 10 to 14 Minutes | 11,198 | 16.6% |
| 15 to 19 Minutes | 10,715 | 15.9% |
| 20 to 24 Minutes | 9,725 | 14.4% |
| 25 to 29 Minutes | 5,750 | 8.5% |
| 30 to 34 Minutes | 10,397 | 15.4% |
| 35 to 39 Minutes | 2,612 | 3.9% |
| 40 to 44 Minutes | 2,478 | 3.7% |
| 45 to 59 Minutes | 3,905 | 5.8% |
| 60 to 89 Minutes | 1,199 | 1.8% |
| 90 or more Minutes | 1,086 | 1.6% |
Commute Time by Sex in Schenectady County
The most common commute times in Schenectady County are 10 to 14 minutes (5,675 commuters, 16.2%) for males and 10 to 14 minutes (5,523 commuters, 17.1%) for females.
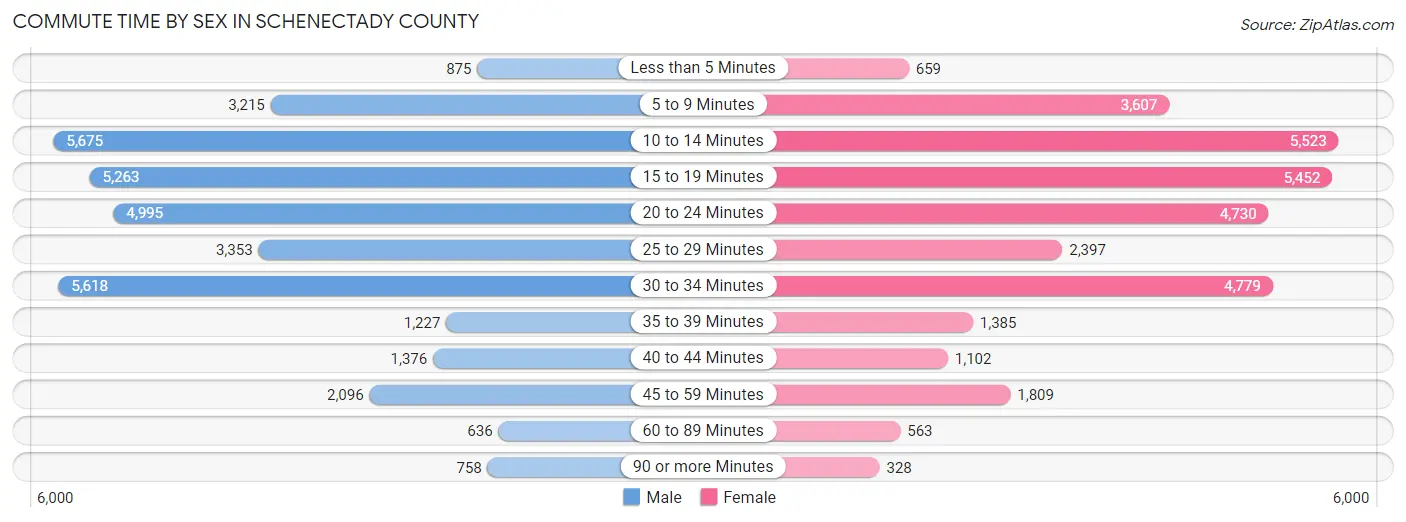
| Commute Time | Male | Female |
| Less than 5 Minutes | 875 (2.5%) | 659 (2.0%) |
| 5 to 9 Minutes | 3,215 (9.2%) | 3,607 (11.2%) |
| 10 to 14 Minutes | 5,675 (16.2%) | 5,523 (17.1%) |
| 15 to 19 Minutes | 5,263 (15.0%) | 5,452 (16.9%) |
| 20 to 24 Minutes | 4,995 (14.2%) | 4,730 (14.6%) |
| 25 to 29 Minutes | 3,353 (9.6%) | 2,397 (7.4%) |
| 30 to 34 Minutes | 5,618 (16.0%) | 4,779 (14.8%) |
| 35 to 39 Minutes | 1,227 (3.5%) | 1,385 (4.3%) |
| 40 to 44 Minutes | 1,376 (3.9%) | 1,102 (3.4%) |
| 45 to 59 Minutes | 2,096 (6.0%) | 1,809 (5.6%) |
| 60 to 89 Minutes | 636 (1.8%) | 563 (1.7%) |
| 90 or more Minutes | 758 (2.2%) | 328 (1.0%) |
Time of Departure to Work by Sex in Schenectady County
The most frequent times of departure to work in Schenectady County are 7:00 AM to 7:29 AM (4,601, 13.1%) for males and 7:30 AM to 7:59 AM (5,129, 15.9%) for females.
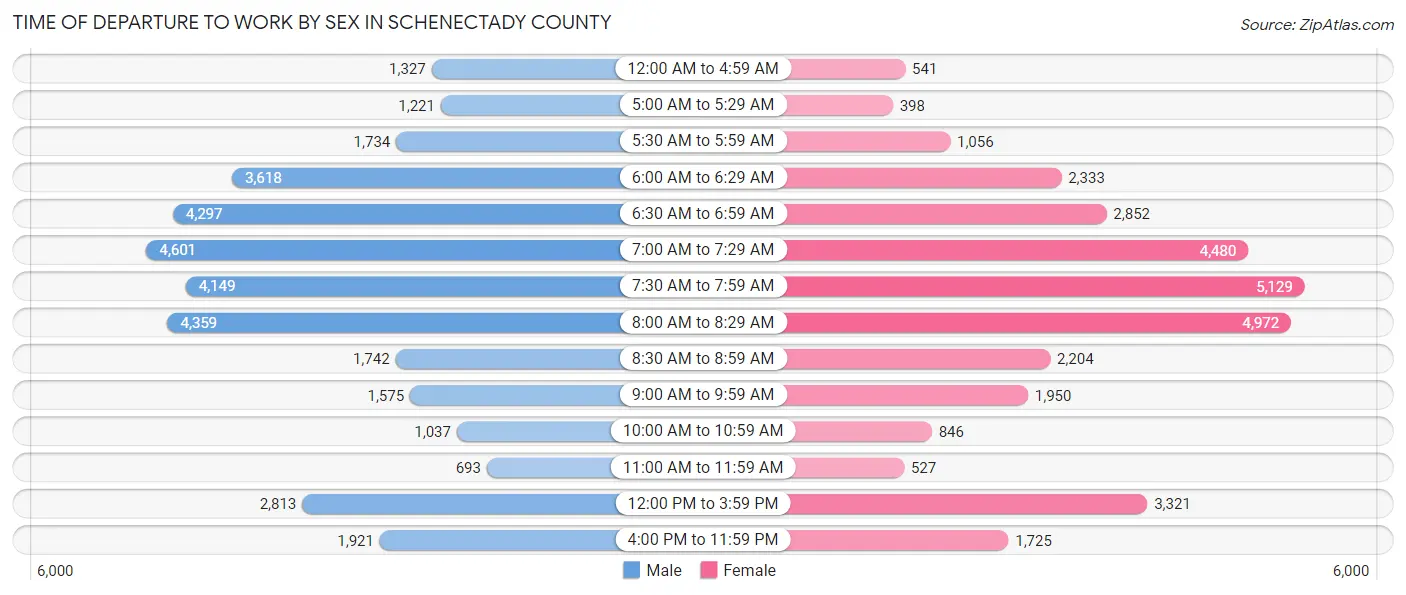
| Time of Departure | Male | Female |
| 12:00 AM to 4:59 AM | 1,327 (3.8%) | 541 (1.7%) |
| 5:00 AM to 5:29 AM | 1,221 (3.5%) | 398 (1.2%) |
| 5:30 AM to 5:59 AM | 1,734 (4.9%) | 1,056 (3.3%) |
| 6:00 AM to 6:29 AM | 3,618 (10.3%) | 2,333 (7.2%) |
| 6:30 AM to 6:59 AM | 4,297 (12.2%) | 2,852 (8.8%) |
| 7:00 AM to 7:29 AM | 4,601 (13.1%) | 4,480 (13.9%) |
| 7:30 AM to 7:59 AM | 4,149 (11.8%) | 5,129 (15.9%) |
| 8:00 AM to 8:29 AM | 4,359 (12.4%) | 4,972 (15.4%) |
| 8:30 AM to 8:59 AM | 1,742 (5.0%) | 2,204 (6.8%) |
| 9:00 AM to 9:59 AM | 1,575 (4.5%) | 1,950 (6.0%) |
| 10:00 AM to 10:59 AM | 1,037 (3.0%) | 846 (2.6%) |
| 11:00 AM to 11:59 AM | 693 (2.0%) | 527 (1.6%) |
| 12:00 PM to 3:59 PM | 2,813 (8.0%) | 3,321 (10.3%) |
| 4:00 PM to 11:59 PM | 1,921 (5.5%) | 1,725 (5.3%) |
| Total | 35,087 (100.0%) | 32,334 (100.0%) |
Housing Occupancy in Schenectady County
Occupancy by Ownership in Schenectady County
Of the total 63,964 dwellings in Schenectady County, owner-occupied units account for 40,880 (63.9%), while renter-occupied units make up 23,084 (36.1%).
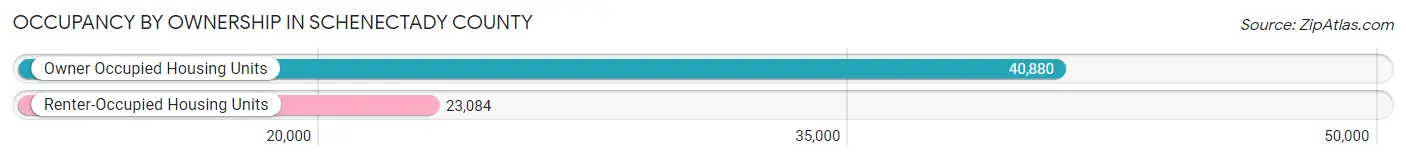
| Occupancy | # Housing Units | % Housing Units |
| Owner Occupied Housing Units | 40,880 | 63.9% |
| Renter-Occupied Housing Units | 23,084 | 36.1% |
| Total Occupied Housing Units | 63,964 | 100.0% |
Occupancy by Household Size in Schenectady County
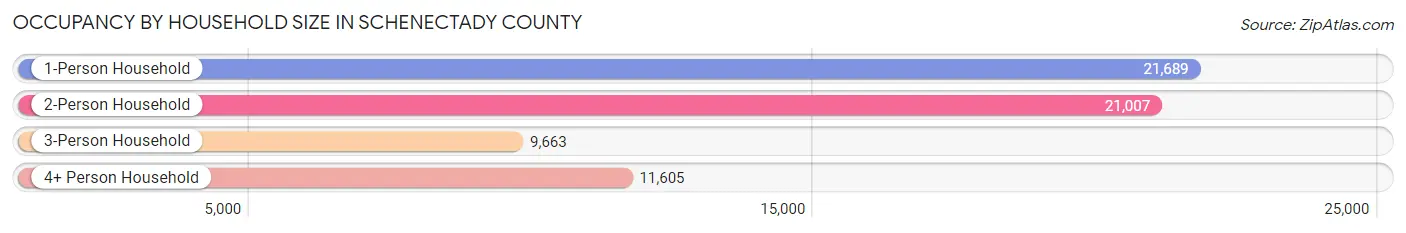
| Household Size | # Housing Units | % Housing Units |
| 1-Person Household | 21,689 | 33.9% |
| 2-Person Household | 21,007 | 32.8% |
| 3-Person Household | 9,663 | 15.1% |
| 4+ Person Household | 11,605 | 18.1% |
| Total Housing Units | 63,964 | 100.0% |
Occupancy by Ownership by Household Size in Schenectady County
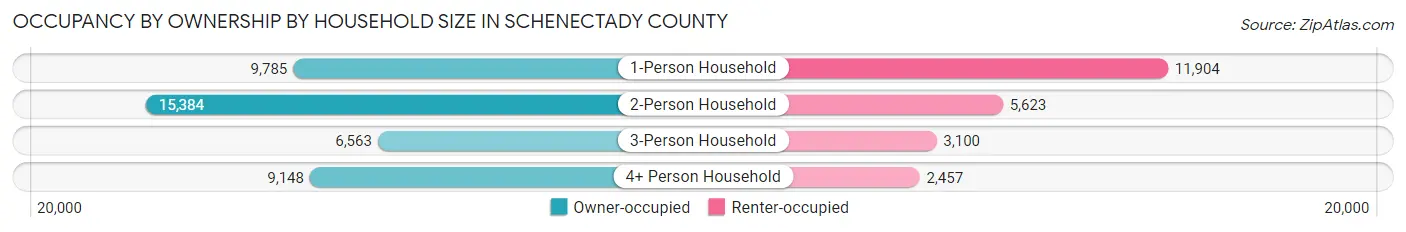
| Household Size | Owner-occupied | Renter-occupied |
| 1-Person Household | 9,785 (45.1%) | 11,904 (54.9%) |
| 2-Person Household | 15,384 (73.2%) | 5,623 (26.8%) |
| 3-Person Household | 6,563 (67.9%) | 3,100 (32.1%) |
| 4+ Person Household | 9,148 (78.8%) | 2,457 (21.2%) |
| Total Housing Units | 40,880 (63.9%) | 23,084 (36.1%) |
Occupancy by Educational Attainment in Schenectady County
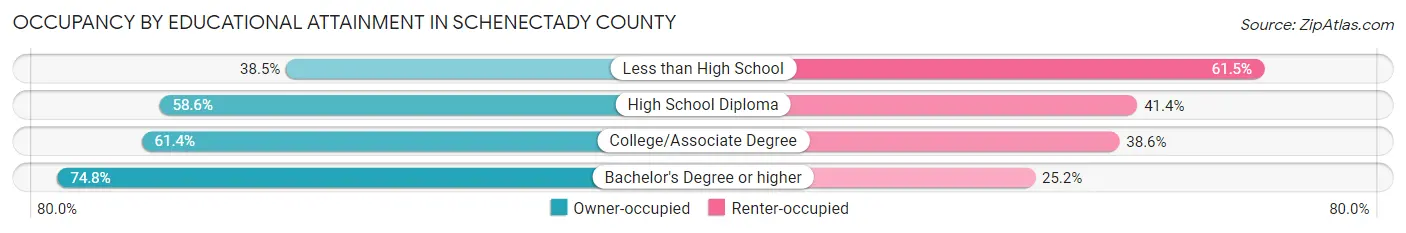
| Household Size | Owner-occupied | Renter-occupied |
| Less than High School | 1,798 (38.5%) | 2,871 (61.5%) |
| High School Diploma | 9,205 (58.6%) | 6,505 (41.4%) |
| College/Associate Degree | 12,522 (61.4%) | 7,861 (38.6%) |
| Bachelor's Degree or higher | 17,355 (74.8%) | 5,847 (25.2%) |
Occupancy by Age of Householder in Schenectady County
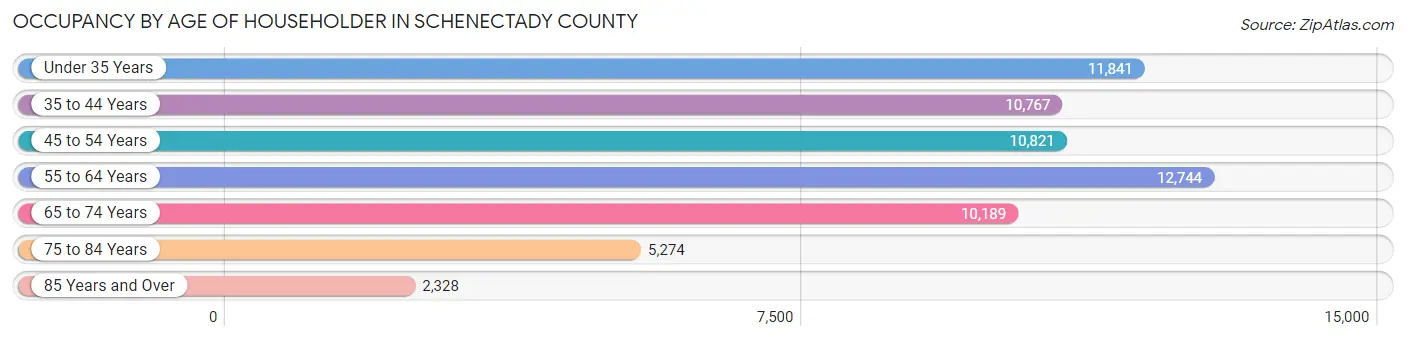
| Age Bracket | # Households | % Households |
| Under 35 Years | 11,841 | 18.5% |
| 35 to 44 Years | 10,767 | 16.8% |
| 45 to 54 Years | 10,821 | 16.9% |
| 55 to 64 Years | 12,744 | 19.9% |
| 65 to 74 Years | 10,189 | 15.9% |
| 75 to 84 Years | 5,274 | 8.3% |
| 85 Years and Over | 2,328 | 3.6% |
| Total | 63,964 | 100.0% |
Housing Finances in Schenectady County
Median Income by Occupancy in Schenectady County
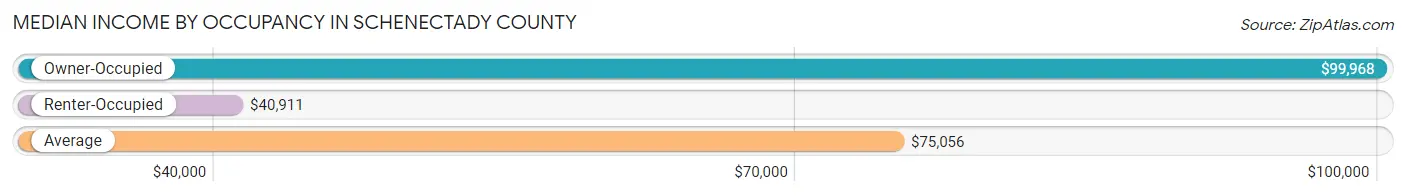
| Occupancy Type | # Households | Median Income |
| Owner-Occupied | 40,880 (63.9%) | $99,968 |
| Renter-Occupied | 23,084 (36.1%) | $40,911 |
| Average | 63,964 (100.0%) | $75,056 |
Occupancy by Householder Income Bracket in Schenectady County
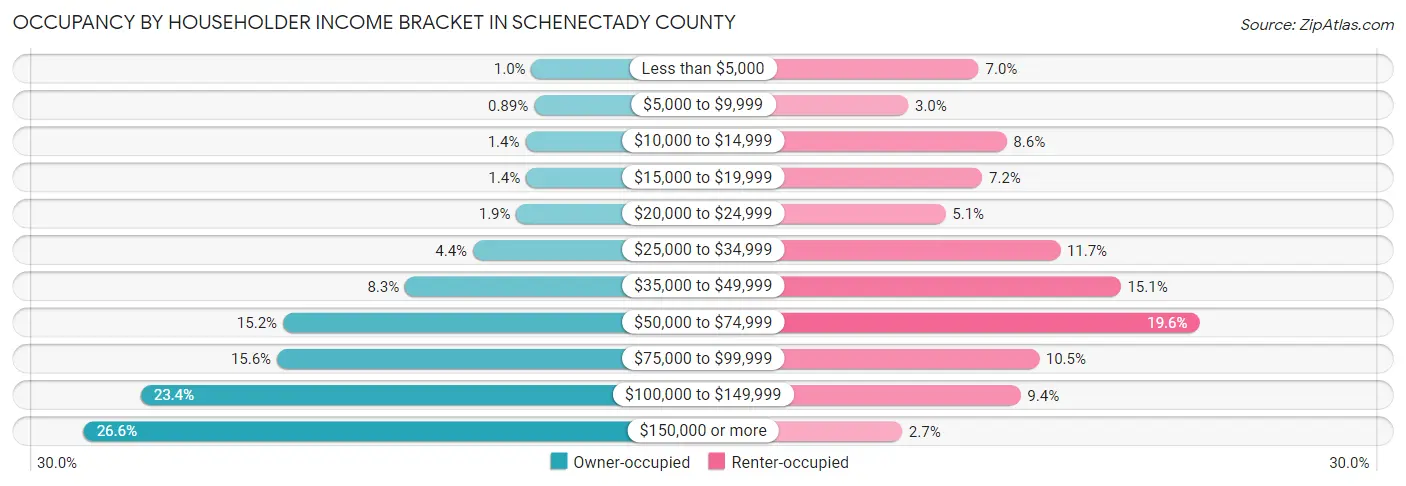
| Income Bracket | Owner-occupied | Renter-occupied |
| Less than $5,000 | 426 (1.0%) | 1,622 (7.0%) |
| $5,000 to $9,999 | 364 (0.9%) | 692 (3.0%) |
| $10,000 to $14,999 | 567 (1.4%) | 1,990 (8.6%) |
| $15,000 to $19,999 | 551 (1.3%) | 1,668 (7.2%) |
| $20,000 to $24,999 | 776 (1.9%) | 1,185 (5.1%) |
| $25,000 to $34,999 | 1,791 (4.4%) | 2,696 (11.7%) |
| $35,000 to $49,999 | 3,376 (8.3%) | 3,494 (15.1%) |
| $50,000 to $74,999 | 6,229 (15.2%) | 4,534 (19.6%) |
| $75,000 to $99,999 | 6,368 (15.6%) | 2,417 (10.5%) |
| $100,000 to $149,999 | 9,549 (23.4%) | 2,175 (9.4%) |
| $150,000 or more | 10,883 (26.6%) | 611 (2.6%) |
| Total | 40,880 (100.0%) | 23,084 (100.0%) |
Monthly Housing Cost Tiers in Schenectady County
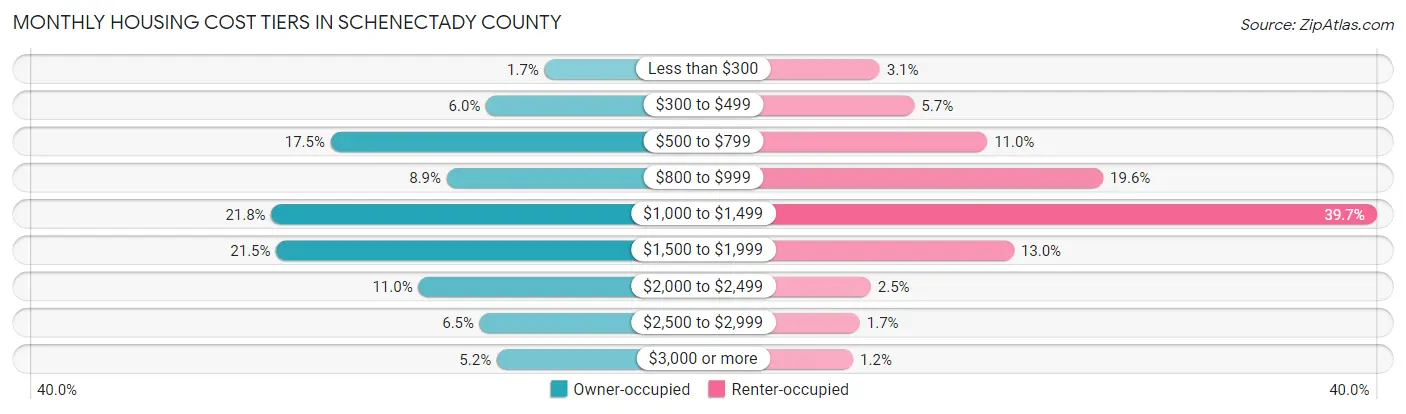
| Monthly Cost | Owner-occupied | Renter-occupied |
| Less than $300 | 697 (1.7%) | 721 (3.1%) |
| $300 to $499 | 2,453 (6.0%) | 1,310 (5.7%) |
| $500 to $799 | 7,132 (17.4%) | 2,547 (11.0%) |
| $800 to $999 | 3,639 (8.9%) | 4,517 (19.6%) |
| $1,000 to $1,499 | 8,918 (21.8%) | 9,164 (39.7%) |
| $1,500 to $1,999 | 8,772 (21.5%) | 3,001 (13.0%) |
| $2,000 to $2,499 | 4,494 (11.0%) | 567 (2.5%) |
| $2,500 to $2,999 | 2,646 (6.5%) | 382 (1.7%) |
| $3,000 or more | 2,129 (5.2%) | 267 (1.2%) |
| Total | 40,880 (100.0%) | 23,084 (100.0%) |
Physical Housing Characteristics in Schenectady County
Housing Structures in Schenectady County
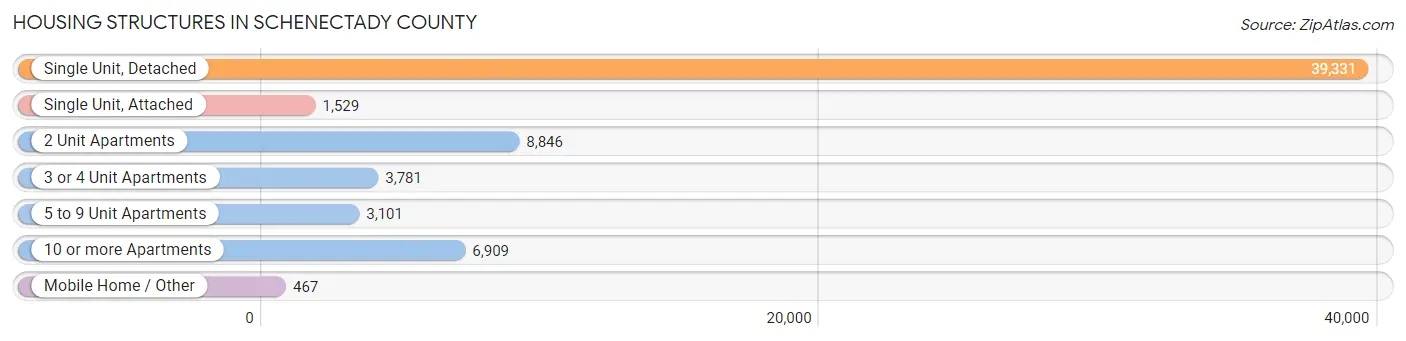
| Structure Type | # Housing Units | % Housing Units |
| Single Unit, Detached | 39,331 | 61.5% |
| Single Unit, Attached | 1,529 | 2.4% |
| 2 Unit Apartments | 8,846 | 13.8% |
| 3 or 4 Unit Apartments | 3,781 | 5.9% |
| 5 to 9 Unit Apartments | 3,101 | 4.9% |
| 10 or more Apartments | 6,909 | 10.8% |
| Mobile Home / Other | 467 | 0.7% |
| Total | 63,964 | 100.0% |
Housing Structures by Occupancy in Schenectady County
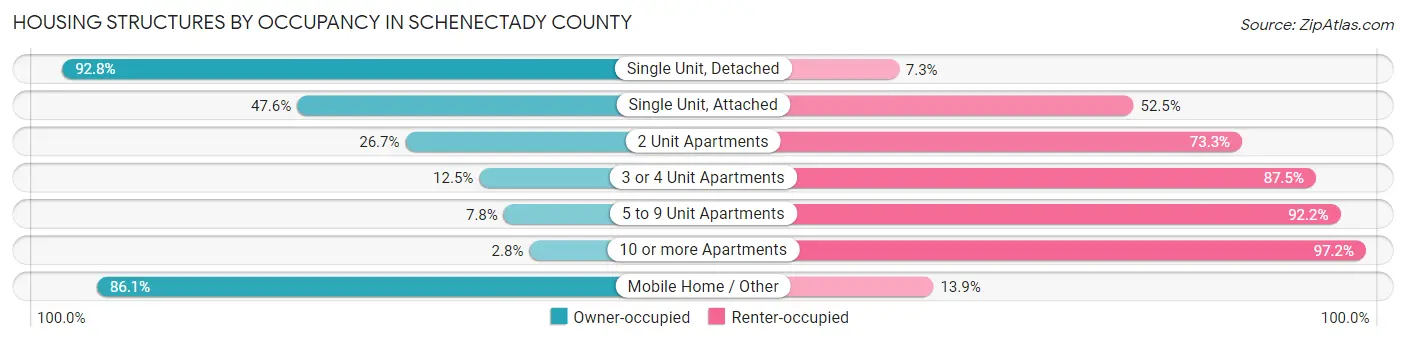
| Structure Type | Owner-occupied | Renter-occupied |
| Single Unit, Detached | 36,480 (92.7%) | 2,851 (7.2%) |
| Single Unit, Attached | 727 (47.5%) | 802 (52.4%) |
| 2 Unit Apartments | 2,362 (26.7%) | 6,484 (73.3%) |
| 3 or 4 Unit Apartments | 472 (12.5%) | 3,309 (87.5%) |
| 5 to 9 Unit Apartments | 241 (7.8%) | 2,860 (92.2%) |
| 10 or more Apartments | 196 (2.8%) | 6,713 (97.2%) |
| Mobile Home / Other | 402 (86.1%) | 65 (13.9%) |
| Total | 40,880 (63.9%) | 23,084 (36.1%) |
Housing Structures by Number of Rooms in Schenectady County
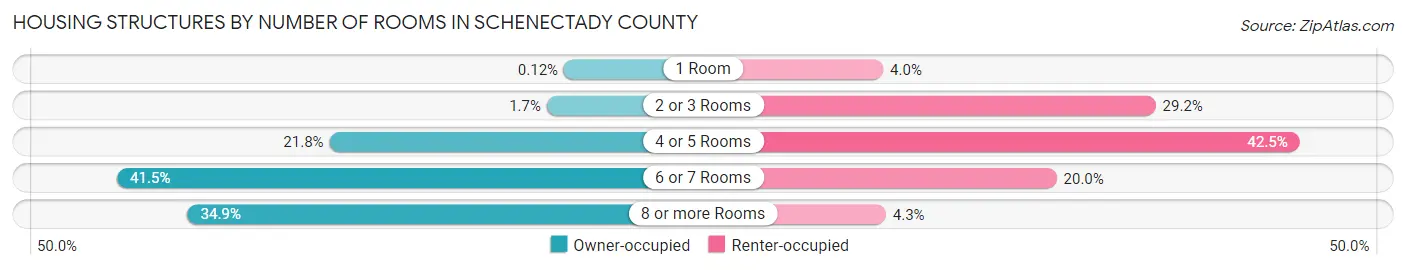
| Number of Rooms | Owner-occupied | Renter-occupied |
| 1 Room | 50 (0.1%) | 923 (4.0%) |
| 2 or 3 Rooms | 695 (1.7%) | 6,740 (29.2%) |
| 4 or 5 Rooms | 8,914 (21.8%) | 9,814 (42.5%) |
| 6 or 7 Rooms | 16,946 (41.4%) | 4,627 (20.0%) |
| 8 or more Rooms | 14,275 (34.9%) | 980 (4.3%) |
| Total | 40,880 (100.0%) | 23,084 (100.0%) |
Housing Structure by Heating Type in Schenectady County
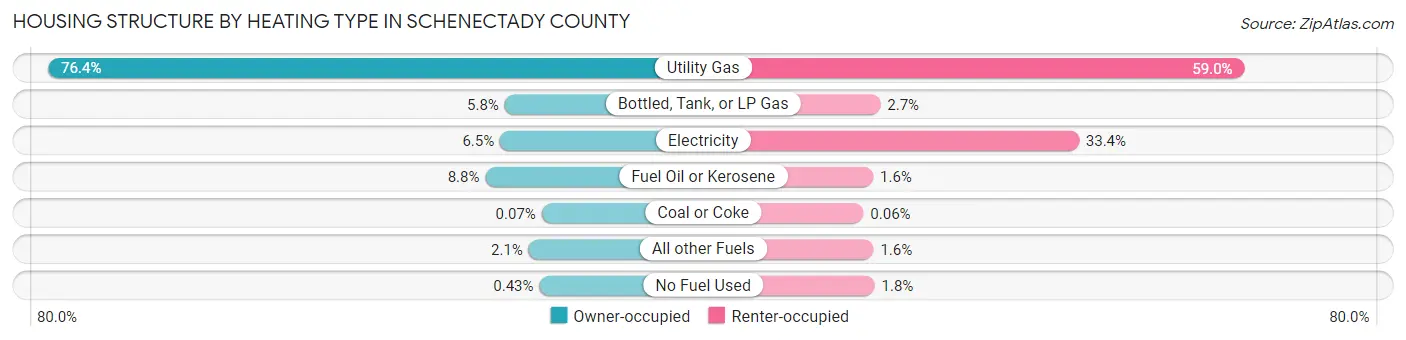
| Heating Type | Owner-occupied | Renter-occupied |
| Utility Gas | 31,220 (76.4%) | 13,608 (59.0%) |
| Bottled, Tank, or LP Gas | 2,363 (5.8%) | 618 (2.7%) |
| Electricity | 2,658 (6.5%) | 7,700 (33.4%) |
| Fuel Oil or Kerosene | 3,588 (8.8%) | 359 (1.6%) |
| Coal or Coke | 29 (0.1%) | 15 (0.1%) |
| All other Fuels | 847 (2.1%) | 371 (1.6%) |
| No Fuel Used | 175 (0.4%) | 413 (1.8%) |
| Total | 40,880 (100.0%) | 23,084 (100.0%) |
Household Vehicle Usage in Schenectady County
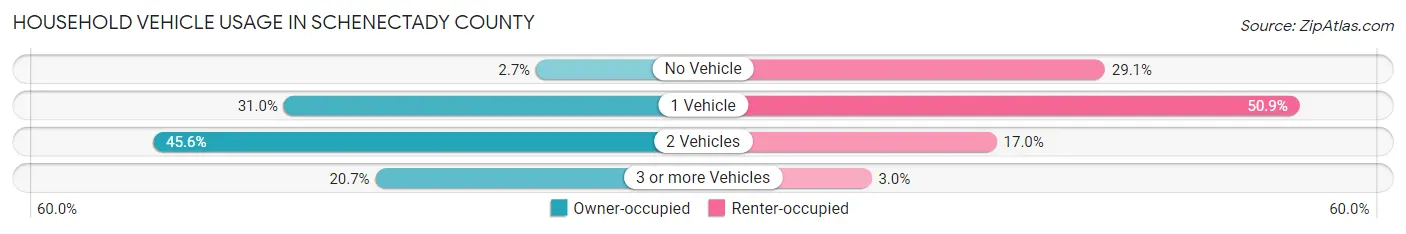
| Vehicles per Household | Owner-occupied | Renter-occupied |
| No Vehicle | 1,112 (2.7%) | 6,723 (29.1%) |
| 1 Vehicle | 12,660 (31.0%) | 11,754 (50.9%) |
| 2 Vehicles | 18,644 (45.6%) | 3,922 (17.0%) |
| 3 or more Vehicles | 8,464 (20.7%) | 685 (3.0%) |
| Total | 40,880 (100.0%) | 23,084 (100.0%) |
Real Estate & Mortgages in Schenectady County
Real Estate and Mortgage Overview in Schenectady County
| Characteristic | Without Mortgage | With Mortgage |
| Housing Units | 15,138 | 25,742 |
| Median Property Value | $198,800 | $207,600 |
| Median Household Income | $79,696 | $7,890 |
| Monthly Housing Costs | $699 | $2,114 |
| Real Estate Taxes | $4,613 | $581 |
Property Value by Mortgage Status in Schenectady County
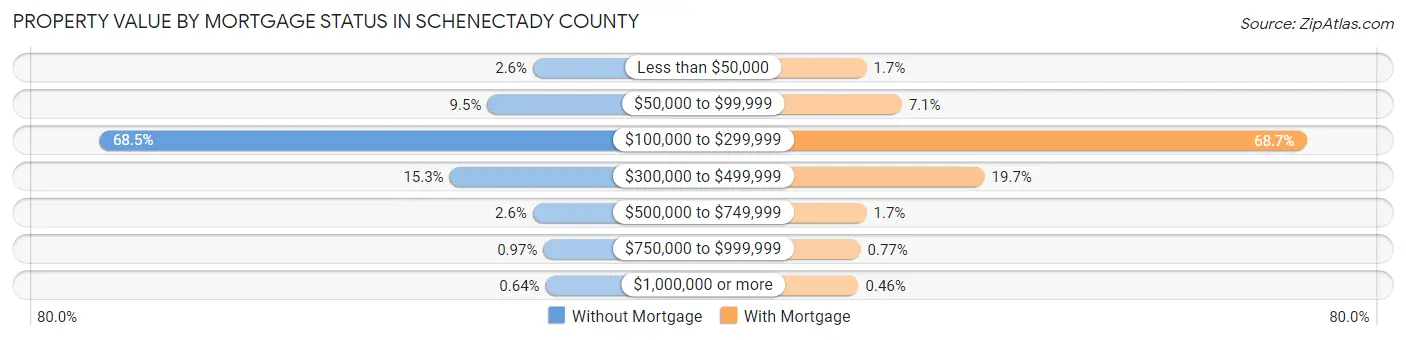
| Property Value | Without Mortgage | With Mortgage |
| Less than $50,000 | 386 (2.5%) | 431 (1.7%) |
| $50,000 to $99,999 | 1,438 (9.5%) | 1,814 (7.0%) |
| $100,000 to $299,999 | 10,371 (68.5%) | 17,682 (68.7%) |
| $300,000 to $499,999 | 2,310 (15.3%) | 5,064 (19.7%) |
| $500,000 to $749,999 | 389 (2.6%) | 435 (1.7%) |
| $750,000 to $999,999 | 147 (1.0%) | 197 (0.8%) |
| $1,000,000 or more | 97 (0.6%) | 119 (0.5%) |
| Total | 15,138 (100.0%) | 25,742 (100.0%) |
Household Income by Mortgage Status in Schenectady County
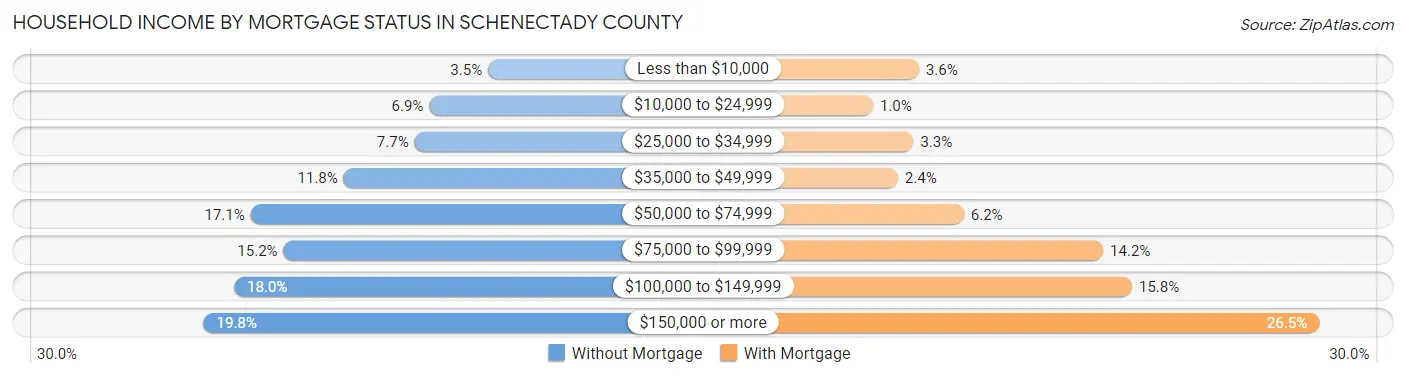
| Household Income | Without Mortgage | With Mortgage |
| Less than $10,000 | 533 (3.5%) | 933 (3.6%) |
| $10,000 to $24,999 | 1,042 (6.9%) | 257 (1.0%) |
| $25,000 to $34,999 | 1,169 (7.7%) | 852 (3.3%) |
| $35,000 to $49,999 | 1,782 (11.8%) | 622 (2.4%) |
| $50,000 to $74,999 | 2,587 (17.1%) | 1,594 (6.2%) |
| $75,000 to $99,999 | 2,302 (15.2%) | 3,642 (14.1%) |
| $100,000 to $149,999 | 2,730 (18.0%) | 4,066 (15.8%) |
| $150,000 or more | 2,993 (19.8%) | 6,819 (26.5%) |
| Total | 15,138 (100.0%) | 25,742 (100.0%) |
Property Value to Household Income Ratio in Schenectady County
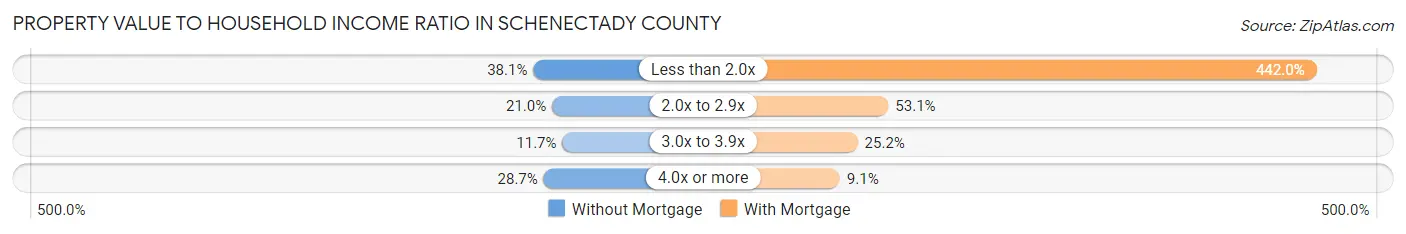
| Value-to-Income Ratio | Without Mortgage | With Mortgage |
| Less than 2.0x | 5,771 (38.1%) | 113,766 (442.0%) |
| 2.0x to 2.9x | 3,182 (21.0%) | 13,673 (53.1%) |
| 3.0x to 3.9x | 1,768 (11.7%) | 6,483 (25.2%) |
| 4.0x or more | 4,346 (28.7%) | 2,332 (9.1%) |
| Total | 15,138 (100.0%) | 25,742 (100.0%) |
Real Estate Taxes by Mortgage Status in Schenectady County
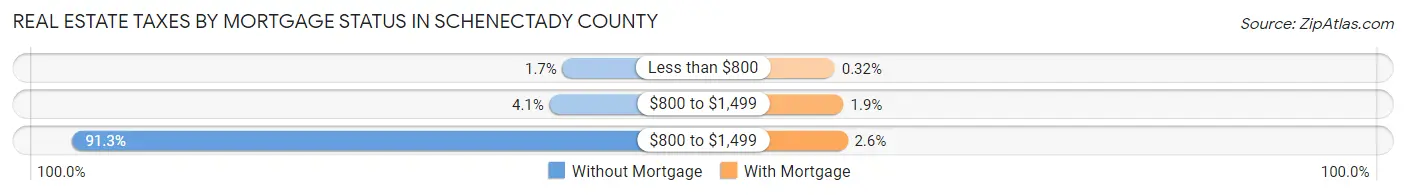
| Property Taxes | Without Mortgage | With Mortgage |
| Less than $800 | 262 (1.7%) | 82 (0.3%) |
| $800 to $1,499 | 622 (4.1%) | 493 (1.9%) |
| $800 to $1,499 | 13,814 (91.2%) | 677 (2.6%) |
| Total | 15,138 (100.0%) | 25,742 (100.0%) |
Health & Disability in Schenectady County
Health Insurance Coverage by Age in Schenectady County
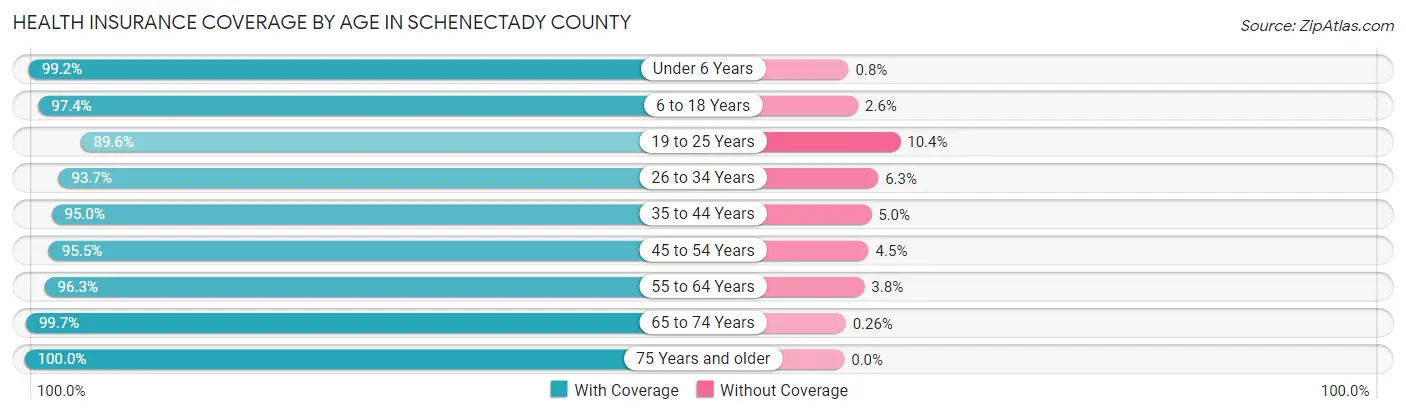
| Age Bracket | With Coverage | Without Coverage |
| Under 6 Years | 10,867 (99.2%) | 88 (0.8%) |
| 6 to 18 Years | 25,177 (97.4%) | 666 (2.6%) |
| 19 to 25 Years | 13,188 (89.6%) | 1,538 (10.4%) |
| 26 to 34 Years | 17,554 (93.7%) | 1,187 (6.3%) |
| 35 to 44 Years | 18,771 (95.0%) | 995 (5.0%) |
| 45 to 54 Years | 18,726 (95.5%) | 890 (4.5%) |
| 55 to 64 Years | 20,639 (96.3%) | 804 (3.7%) |
| 65 to 74 Years | 15,827 (99.7%) | 41 (0.3%) |
| 75 Years and older | 10,932 (100.0%) | 0 (0.0%) |
| Total | 151,681 (96.1%) | 6,209 (3.9%) |
Health Insurance Coverage by Citizenship Status in Schenectady County
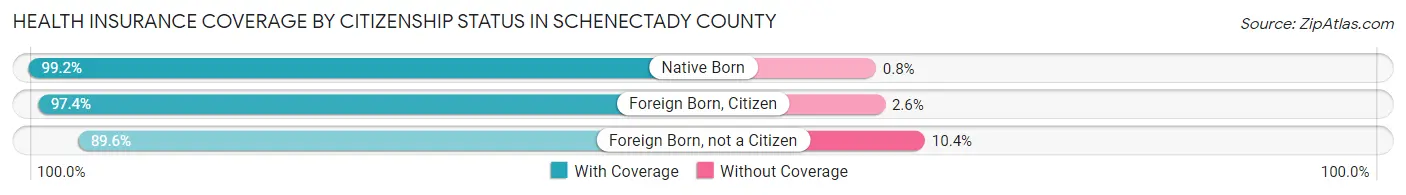
| Citizenship Status | With Coverage | Without Coverage |
| Native Born | 10,867 (99.2%) | 88 (0.8%) |
| Foreign Born, Citizen | 25,177 (97.4%) | 666 (2.6%) |
| Foreign Born, not a Citizen | 13,188 (89.6%) | 1,538 (10.4%) |
Health Insurance Coverage by Household Income in Schenectady County
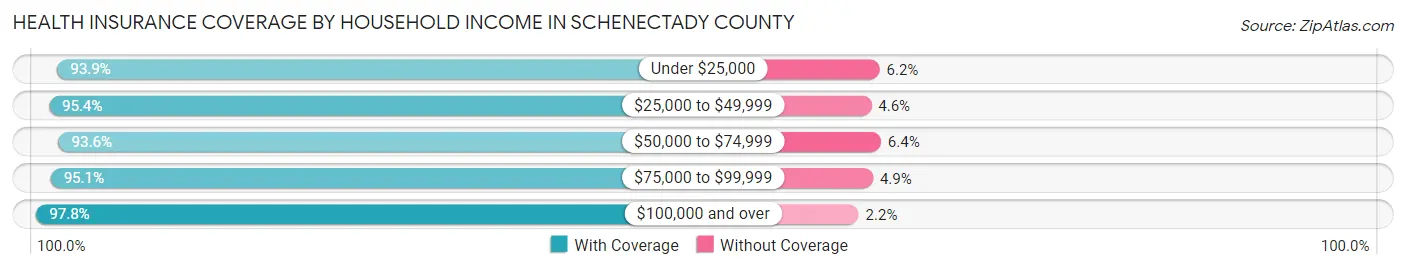
| Household Income | With Coverage | Without Coverage |
| Under $25,000 | 15,789 (93.9%) | 1,034 (6.1%) |
| $25,000 to $49,999 | 20,309 (95.4%) | 979 (4.6%) |
| $50,000 to $74,999 | 21,335 (93.6%) | 1,456 (6.4%) |
| $75,000 to $99,999 | 20,877 (95.1%) | 1,076 (4.9%) |
| $100,000 and over | 69,963 (97.8%) | 1,589 (2.2%) |
Public vs Private Health Insurance Coverage by Age in Schenectady County
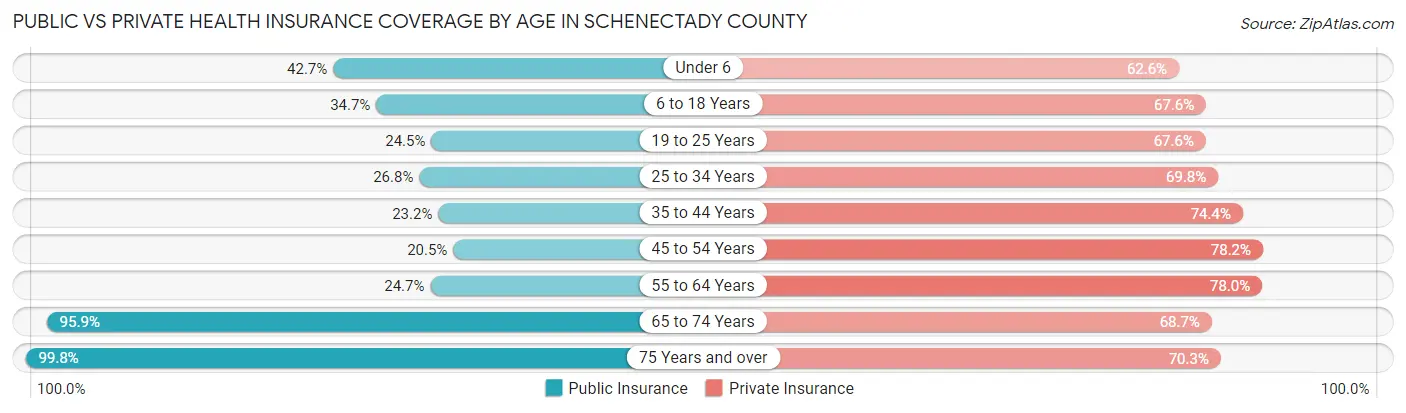
| Age Bracket | Public Insurance | Private Insurance |
| Under 6 | 4,682 (42.7%) | 6,855 (62.6%) |
| 6 to 18 Years | 8,978 (34.7%) | 17,473 (67.6%) |
| 19 to 25 Years | 3,610 (24.5%) | 9,947 (67.5%) |
| 25 to 34 Years | 5,014 (26.8%) | 13,089 (69.8%) |
| 35 to 44 Years | 4,590 (23.2%) | 14,707 (74.4%) |
| 45 to 54 Years | 4,012 (20.4%) | 15,330 (78.1%) |
| 55 to 64 Years | 5,297 (24.7%) | 16,725 (78.0%) |
| 65 to 74 Years | 15,217 (95.9%) | 10,894 (68.6%) |
| 75 Years and over | 10,914 (99.8%) | 7,689 (70.3%) |
| Total | 62,314 (39.5%) | 112,709 (71.4%) |
Disability Status by Sex by Age in Schenectady County
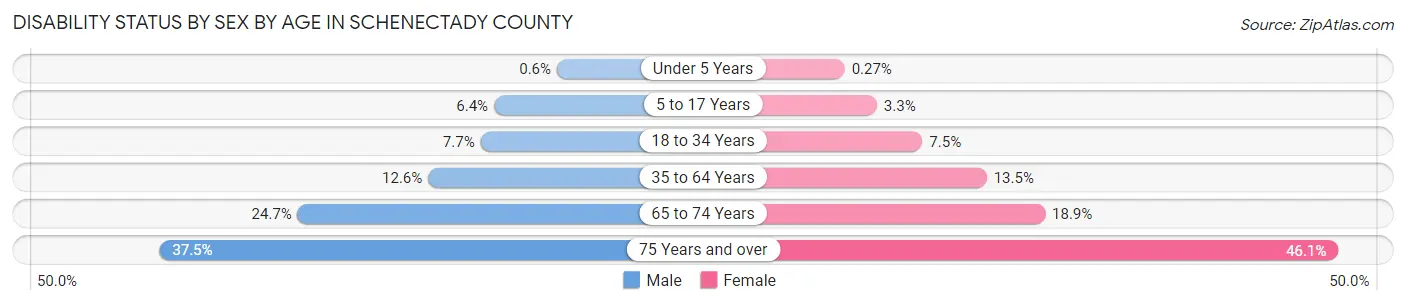
| Age Bracket | Male | Female |
| Under 5 Years | 29 (0.6%) | 12 (0.3%) |
| 5 to 17 Years | 821 (6.4%) | 392 (3.3%) |
| 18 to 34 Years | 1,398 (7.7%) | 1,350 (7.5%) |
| 35 to 64 Years | 3,766 (12.6%) | 4,145 (13.5%) |
| 65 to 74 Years | 1,865 (24.7%) | 1,567 (18.9%) |
| 75 Years and over | 1,625 (37.5%) | 3,040 (46.1%) |
Disability Class by Sex by Age in Schenectady County
Disability Class: Hearing Difficulty
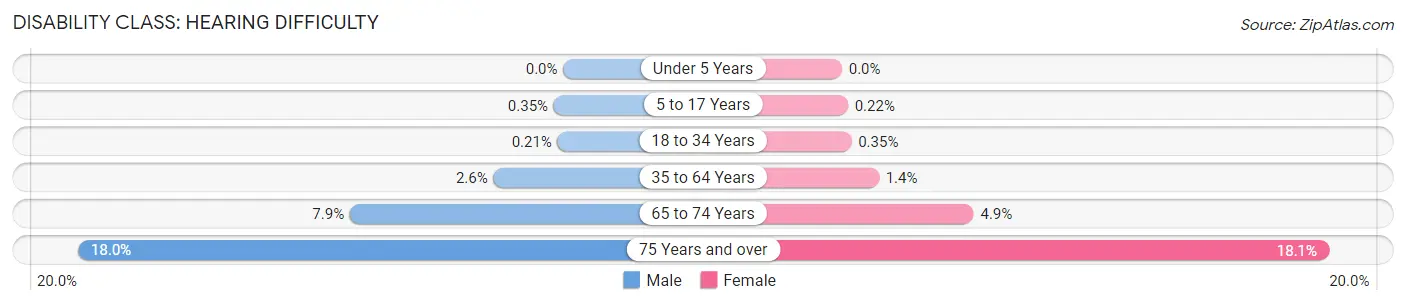
| Age Bracket | Male | Female |
| Under 5 Years | 0 (0.0%) | 0 (0.0%) |
| 5 to 17 Years | 44 (0.4%) | 27 (0.2%) |
| 18 to 34 Years | 39 (0.2%) | 64 (0.4%) |
| 35 to 64 Years | 777 (2.6%) | 422 (1.4%) |
| 65 to 74 Years | 599 (7.9%) | 406 (4.9%) |
| 75 Years and over | 781 (18.0%) | 1,193 (18.1%) |
Disability Class: Vision Difficulty
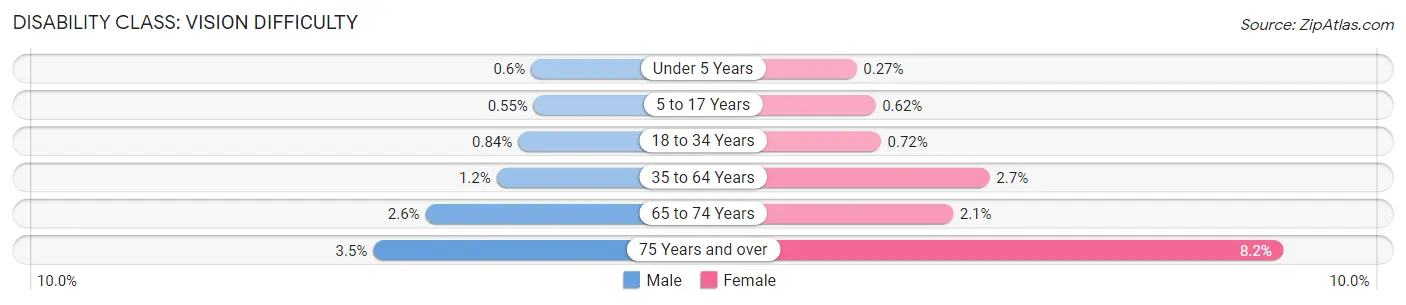
| Age Bracket | Male | Female |
| Under 5 Years | 29 (0.6%) | 12 (0.3%) |
| 5 to 17 Years | 70 (0.5%) | 74 (0.6%) |
| 18 to 34 Years | 152 (0.8%) | 130 (0.7%) |
| 35 to 64 Years | 373 (1.2%) | 844 (2.7%) |
| 65 to 74 Years | 194 (2.6%) | 171 (2.1%) |
| 75 Years and over | 153 (3.5%) | 541 (8.2%) |
Disability Class: Cognitive Difficulty
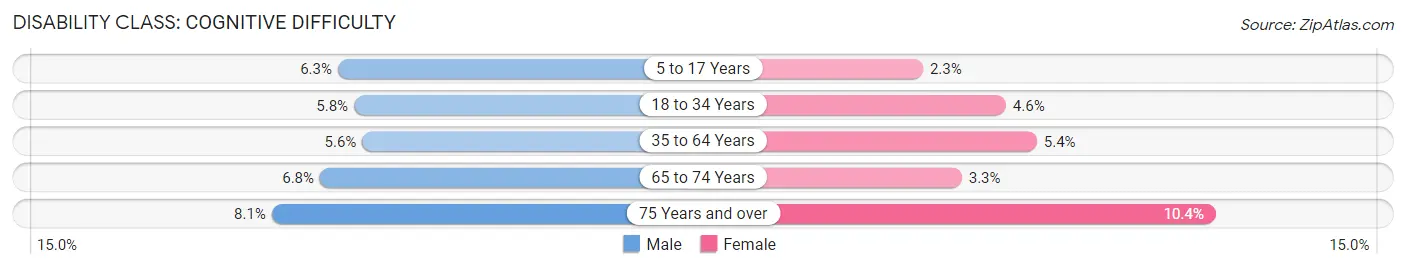
| Age Bracket | Male | Female |
| 5 to 17 Years | 801 (6.3%) | 272 (2.3%) |
| 18 to 34 Years | 1,060 (5.8%) | 824 (4.6%) |
| 35 to 64 Years | 1,679 (5.6%) | 1,674 (5.4%) |
| 65 to 74 Years | 513 (6.8%) | 277 (3.3%) |
| 75 Years and over | 352 (8.1%) | 687 (10.4%) |
Disability Class: Ambulatory Difficulty
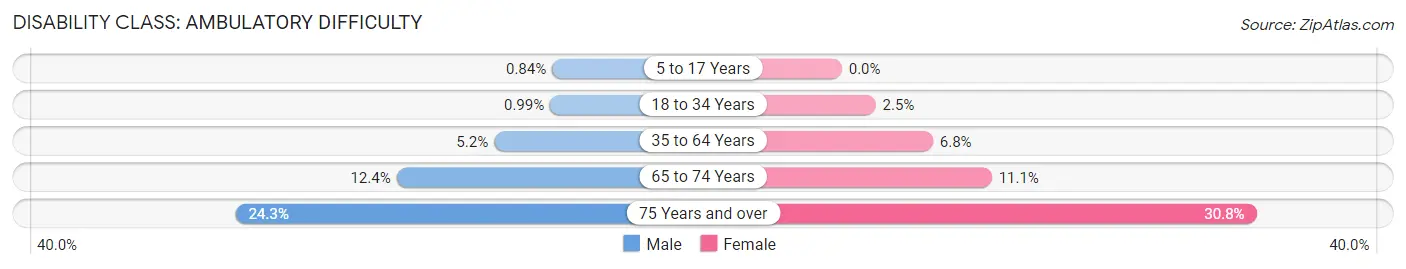
| Age Bracket | Male | Female |
| 5 to 17 Years | 107 (0.8%) | 0 (0.0%) |
| 18 to 34 Years | 180 (1.0%) | 453 (2.5%) |
| 35 to 64 Years | 1,545 (5.1%) | 2,083 (6.8%) |
| 65 to 74 Years | 937 (12.4%) | 924 (11.1%) |
| 75 Years and over | 1,055 (24.3%) | 2,031 (30.8%) |
Disability Class: Self-Care Difficulty
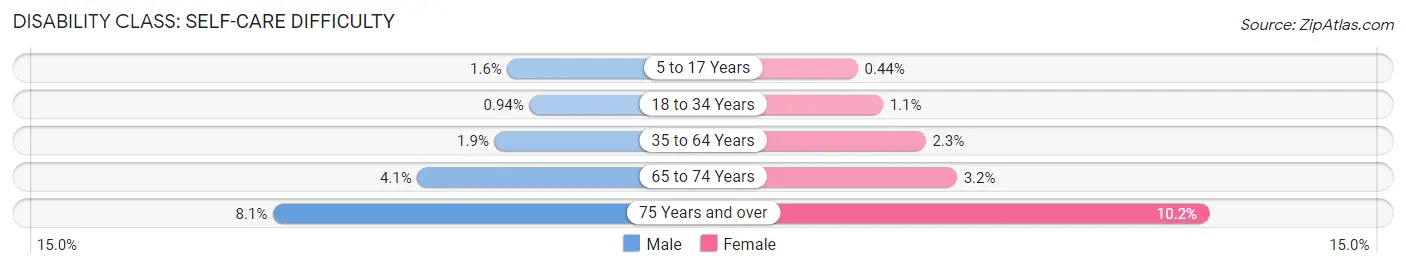
| Age Bracket | Male | Female |
| 5 to 17 Years | 198 (1.5%) | 53 (0.4%) |
| 18 to 34 Years | 171 (0.9%) | 206 (1.1%) |
| 35 to 64 Years | 574 (1.9%) | 719 (2.3%) |
| 65 to 74 Years | 307 (4.1%) | 266 (3.2%) |
| 75 Years and over | 350 (8.1%) | 674 (10.2%) |
Technology Access in Schenectady County
Computing Device Access in Schenectady County
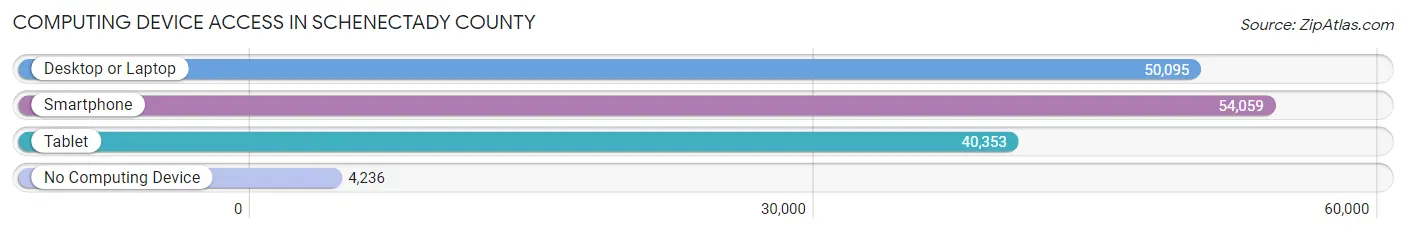
| Device Type | # Households | % Households |
| Desktop or Laptop | 50,095 | 78.3% |
| Smartphone | 54,059 | 84.5% |
| Tablet | 40,353 | 63.1% |
| No Computing Device | 4,236 | 6.6% |
| Total | 63,964 | 100.0% |
Internet Access in Schenectady County
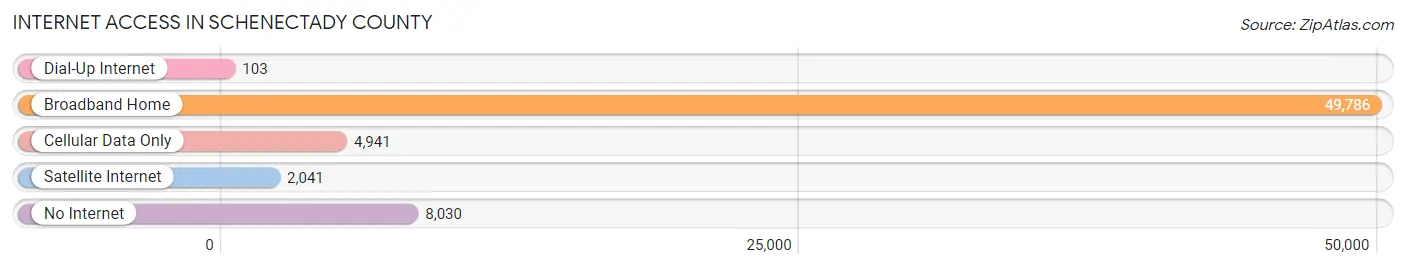
| Internet Type | # Households | % Households |
| Dial-Up Internet | 103 | 0.2% |
| Broadband Home | 49,786 | 77.8% |
| Cellular Data Only | 4,941 | 7.7% |
| Satellite Internet | 2,041 | 3.2% |
| No Internet | 8,030 | 12.6% |
| Total | 63,964 | 100.0% |
Schenectady County Summary
Schenectady County is located in the eastern part of New York State, in the Capital Region. It is bordered by Saratoga County to the north, Albany County to the west, and Montgomery County to the south. The county seat is the city of Schenectady, which is also the largest city in the county. The county has a population of 154,727 as of the 2010 census, and covers an area of 320 square miles.
History
The area that is now Schenectady County was originally inhabited by the Mohawk and Iroquois Native American tribes. The first European settlers arrived in the area in the early 17th century, and the county was officially established in 1809. The county was named after the city of Schenectady, which was founded in 1661 by Dutch settlers.
The city of Schenectady was an important industrial center during the 19th and 20th centuries, and was home to several major companies, including General Electric and American Locomotive Company. The city was also the site of the first commercial radio broadcast in 1920.
Geography
Schenectady County is located in the eastern part of New York State, in the Capital Region. It is bordered by Saratoga County to the north, Albany County to the west, and Montgomery County to the south. The county has a total area of 320 square miles, of which 315 square miles is land and 5 square miles is water.
The terrain of the county is mostly flat, with some rolling hills in the northern and western parts of the county. The highest point in the county is the summit of the Helderberg Escarpment, which rises to 1,890 feet above sea level. The county is drained by the Mohawk River, which flows through the city of Schenectady.
Economy
Schenectady County has a diverse economy, with a mix of manufacturing, technology, and service industries. The county is home to several major companies, including General Electric, which has its headquarters in the city of Schenectady. Other major employers in the county include the New York State Department of Transportation, the University at Albany, and the Schenectady County Community College.
The county also has a thriving tourism industry, with attractions such as the Proctors Theater, the Schenectady County Historical Society, and the Mohawk Towpath Byway.
Demographics
As of the 2010 census, Schenectady County had a population of 154,727. The racial makeup of the county was 79.2% White, 11.3% African American, 0.5% Native American, 3.2% Asian, 0.1% Pacific Islander, and 5.7% from other races. Hispanic or Latino of any race were 8.7% of the population.
The median household income in the county was $50,845, and the median family income was $60,817. The per capita income was $25,945. About 11.3% of the population was below the poverty line.
Common Questions
What is Per Capita Income in Schenectady County?
Per Capita income in Schenectady County is $39,791.
What is the Median Family Income in Schenectady County?
Median Family Income in Schenectady County is $98,944.
What is the Median Household income in Schenectady County?
Median Household Income in Schenectady County is $75,056.
What is Income or Wage Gap in Schenectady County?
Income or Wage Gap in Schenectady County is 22.4%.
Women in Schenectady County earn 77.6 cents for every dollar earned by a man.
What is Family Income Deficit in Schenectady County?
Family Income Deficit in Schenectady County is $11,238.
Families that are below poverty line in Schenectady County earn $11,238 less on average than the poverty threshold level.
What is Inequality or Gini Index in Schenectady County?
Inequality or Gini Index in Schenectady County is 0.44.
What is the Total Population of Schenectady County?
Total Population of Schenectady County is 159,447.
What is the Total Male Population of Schenectady County?
Total Male Population of Schenectady County is 78,328.
What is the Total Female Population of Schenectady County?
Total Female Population of Schenectady County is 81,119.
What is the Ratio of Males per 100 Females in Schenectady County?
There are 96.56 Males per 100 Females in Schenectady County.
What is the Ratio of Females per 100 Males in Schenectady County?
There are 103.56 Females per 100 Males in Schenectady County.
What is the Median Population Age in Schenectady County?
Median Population Age in Schenectady County is 39.7 Years.
What is the Average Family Size in Schenectady County
Average Family Size in Schenectady County is 3.2 People.
What is the Average Household Size in Schenectady County
Average Household Size in Schenectady County is 2.4 People.
How Large is the Labor Force in Schenectady County?
There are 81,382 People in the Labor Forcein in Schenectady County.
What is the Percentage of People in the Labor Force in Schenectady County?
62.9% of People are in the Labor Force in Schenectady County.
What is the Unemployment Rate in Schenectady County?
Unemployment Rate in Schenectady County is 6.0%.