Saratoga County, NY Map & Demographics
Saratoga County Map

Saratoga County Overview
$51,931
PER CAPITA INCOME
$121,420
AVG FAMILY INCOME
$97,038
AVG HOUSEHOLD INCOME
33.4%
WAGE / INCOME GAP [ % ]
66.6¢/ $1
WAGE / INCOME GAP [ $ ]
$10,532
FAMILY INCOME DEFICIT
0.43
INEQUALITY / GINI INDEX
236,328
TOTAL POPULATION
117,525
MALE POPULATION
118,803
FEMALE POPULATION
98.92
MALES / 100 FEMALES
101.09
FEMALES / 100 MALES
43.3
MEDIAN AGE
2.9
AVG FAMILY SIZE
2.4
AVG HOUSEHOLD SIZE
130,581
LABOR FORCE [ PEOPLE ]
66.5%
PERCENT IN LABOR FORCE
3.5%
UNEMPLOYMENT RATE
Saratoga County Area Codes
Income in Saratoga County
Income Overview in Saratoga County
Per Capita Income in Saratoga County is $51,931, while median incomes of families and households are $121,420 and $97,038 respectively.
| Characteristic | Number | Measure |
| Per Capita Income | 236,328 | $51,931 |
| Median Family Income | 62,923 | $121,420 |
| Mean Family Income | 62,923 | $146,617 |
| Median Household Income | 98,409 | $97,038 |
| Mean Household Income | 98,409 | $122,874 |
| Income Deficit | 62,923 | $10,532 |
| Wage / Income Gap (%) | 236,328 | 33.39% |
| Wage / Income Gap ($) | 236,328 | 66.61¢ per $1 |
| Gini / Inequality Index | 236,328 | 0.43 |
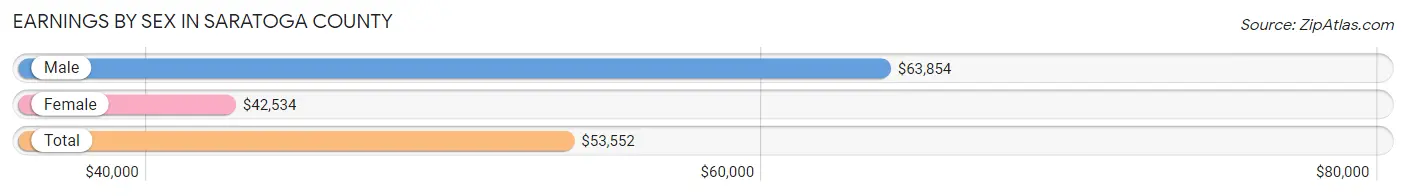
Earnings by Sex in Saratoga County
Average Earnings in Saratoga County are $53,552, $63,854 for men and $42,534 for women, a difference of 33.4%.
| Sex | Number | Average Earnings |
| Male | 71,770 (52.1%) | $63,854 |
| Female | 65,871 (47.9%) | $42,534 |
| Total | 137,641 (100.0%) | $53,552 |
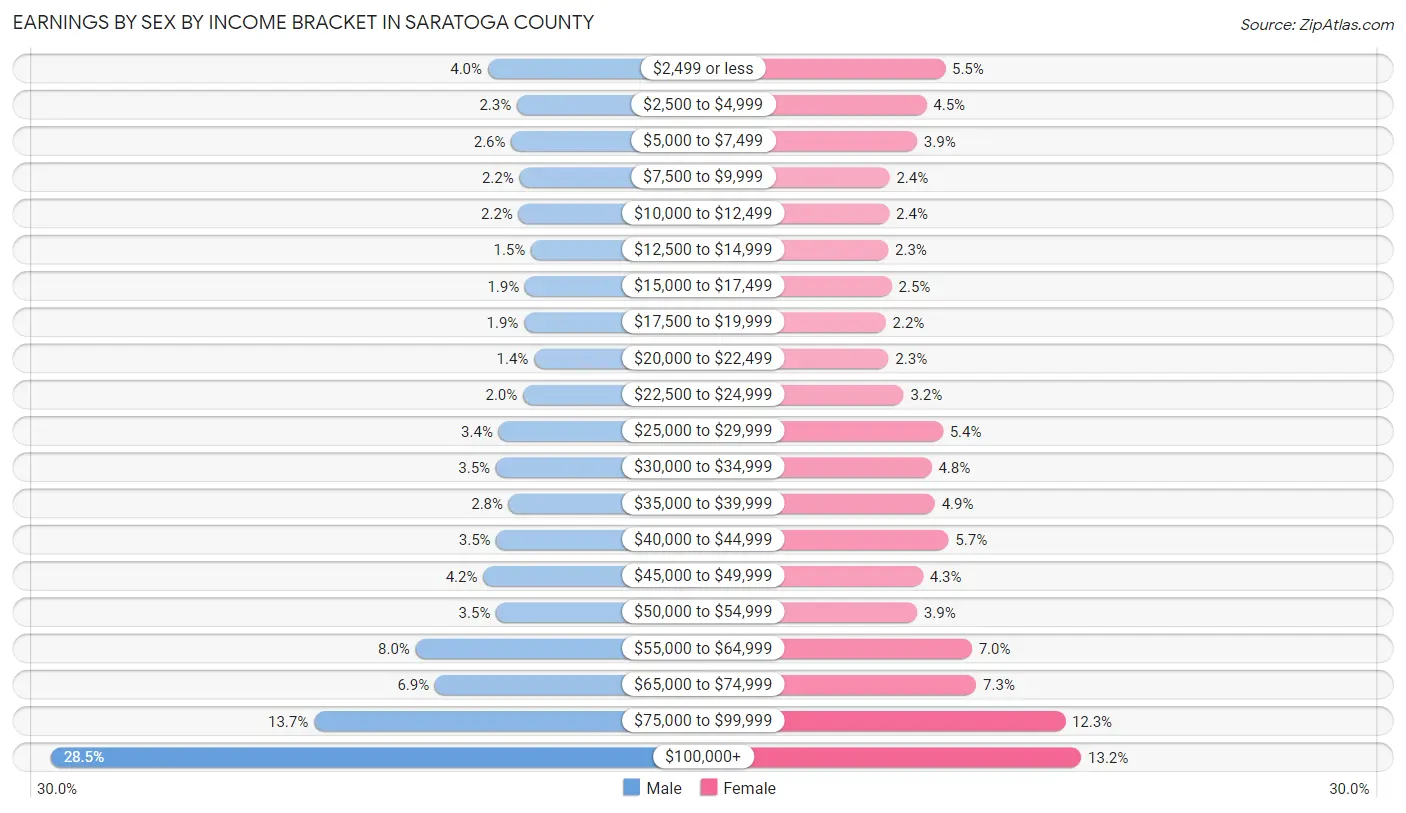
Earnings by Sex by Income Bracket in Saratoga County
The most common earnings brackets in Saratoga County are $100,000+ for men (20,473 | 28.5%) and $100,000+ for women (8,678 | 13.2%).
| Income | Male | Female |
| $2,499 or less | 2,840 (4.0%) | 3,639 (5.5%) |
| $2,500 to $4,999 | 1,662 (2.3%) | 2,947 (4.5%) |
| $5,000 to $7,499 | 1,892 (2.6%) | 2,593 (3.9%) |
| $7,500 to $9,999 | 1,567 (2.2%) | 1,578 (2.4%) |
| $10,000 to $12,499 | 1,598 (2.2%) | 1,566 (2.4%) |
| $12,500 to $14,999 | 1,097 (1.5%) | 1,525 (2.3%) |
| $15,000 to $17,499 | 1,344 (1.9%) | 1,663 (2.5%) |
| $17,500 to $19,999 | 1,376 (1.9%) | 1,437 (2.2%) |
| $20,000 to $22,499 | 977 (1.4%) | 1,542 (2.3%) |
| $22,500 to $24,999 | 1,420 (2.0%) | 2,104 (3.2%) |
| $25,000 to $29,999 | 2,402 (3.4%) | 3,552 (5.4%) |
| $30,000 to $34,999 | 2,519 (3.5%) | 3,135 (4.8%) |
| $35,000 to $39,999 | 1,993 (2.8%) | 3,251 (4.9%) |
| $40,000 to $44,999 | 2,497 (3.5%) | 3,763 (5.7%) |
| $45,000 to $49,999 | 3,028 (4.2%) | 2,814 (4.3%) |
| $50,000 to $54,999 | 2,507 (3.5%) | 2,597 (3.9%) |
| $55,000 to $64,999 | 5,754 (8.0%) | 4,621 (7.0%) |
| $65,000 to $74,999 | 4,971 (6.9%) | 4,789 (7.3%) |
| $75,000 to $99,999 | 9,853 (13.7%) | 8,077 (12.3%) |
| $100,000+ | 20,473 (28.5%) | 8,678 (13.2%) |
| Total | 71,770 (100.0%) | 65,871 (100.0%) |
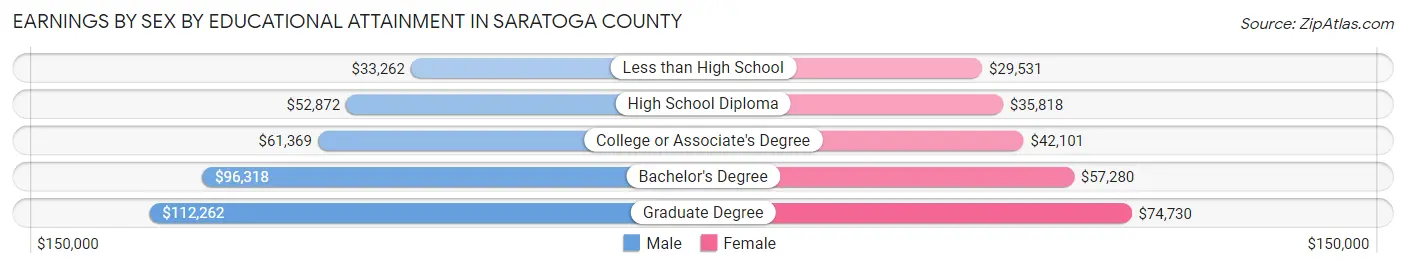
Earnings by Sex by Educational Attainment in Saratoga County
Average earnings in Saratoga County are $73,025 for men and $50,197 for women, a difference of 31.3%. Men with an educational attainment of graduate degree enjoy the highest average annual earnings of $112,262, while those with less than high school education earn the least with $33,262. Women with an educational attainment of graduate degree earn the most with the average annual earnings of $74,730, while those with less than high school education have the smallest earnings of $29,531.
| Educational Attainment | Male Income | Female Income |
| Less than High School | $33,262 | $29,531 |
| High School Diploma | $52,872 | $35,818 |
| College or Associate's Degree | $61,369 | $42,101 |
| Bachelor's Degree | $96,318 | $57,280 |
| Graduate Degree | $112,262 | $74,730 |
| Total | $73,025 | $50,197 |
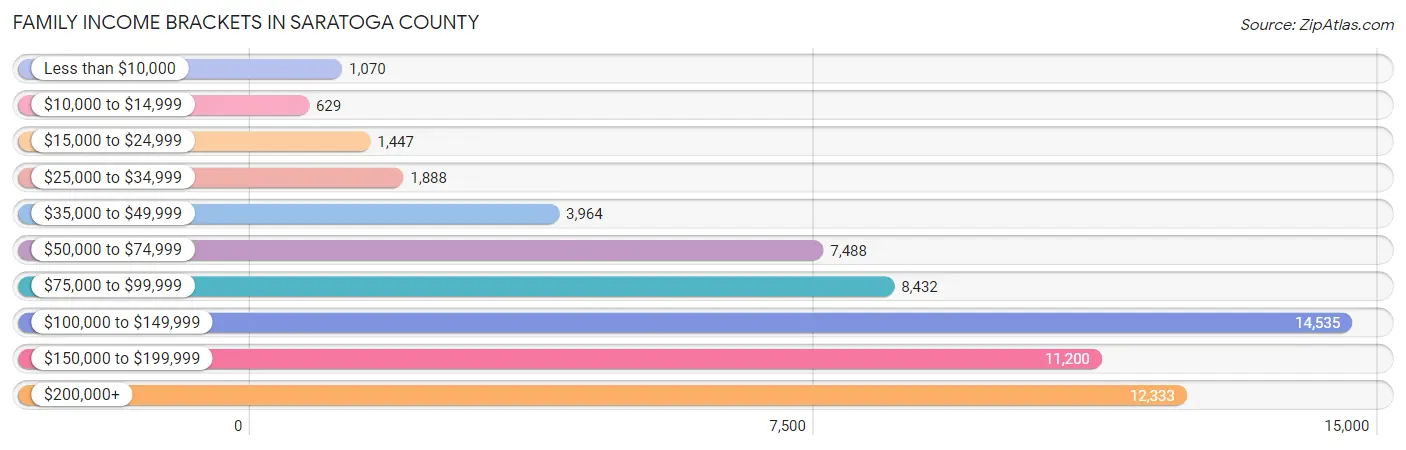
Family Income in Saratoga County
Family Income Brackets in Saratoga County
According to the Saratoga County family income data, there are 14,535 families falling into the $100,000 to $149,999 income range, which is the most common income bracket and makes up 23.1% of all families. Conversely, the $10,000 to $14,999 income bracket is the least frequent group with only 629 families (1.0%) belonging to this category.
| Income Bracket | # Families | % Families |
| Less than $10,000 | 1,070 | 1.7% |
| $10,000 to $14,999 | 629 | 1.0% |
| $15,000 to $24,999 | 1,447 | 2.3% |
| $25,000 to $34,999 | 1,888 | 3.0% |
| $35,000 to $49,999 | 3,964 | 6.3% |
| $50,000 to $74,999 | 7,488 | 11.9% |
| $75,000 to $99,999 | 8,432 | 13.4% |
| $100,000 to $149,999 | 14,535 | 23.1% |
| $150,000 to $199,999 | 11,200 | 17.8% |
| $200,000+ | 12,333 | 19.6% |
Family Income by Famaliy Size in Saratoga County
4-person families (12,464 | 19.8%) account for the highest median family income in Saratoga County with $162,577 per family, while 2-person families (32,114 | 51.0%) have the highest median income of $50,726 per family member.
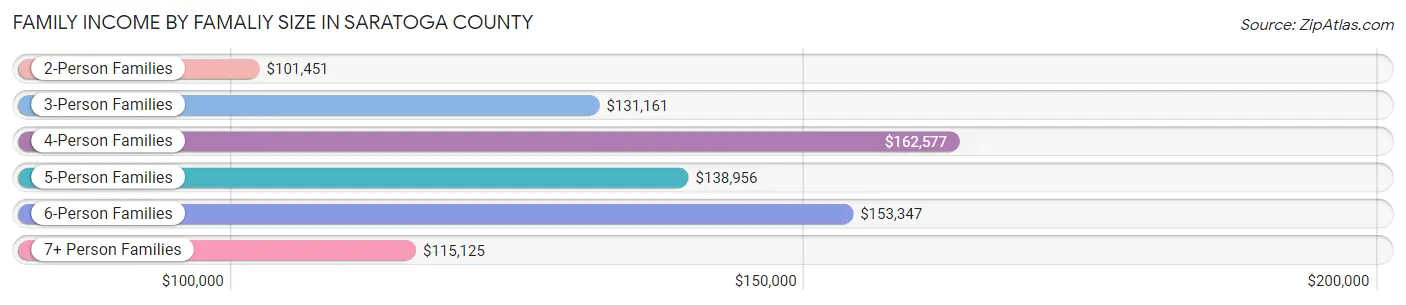
| Income Bracket | # Families | Median Income |
| 2-Person Families | 32,114 (51.0%) | $101,451 |
| 3-Person Families | 13,178 (20.9%) | $131,161 |
| 4-Person Families | 12,464 (19.8%) | $162,577 |
| 5-Person Families | 3,768 (6.0%) | $138,956 |
| 6-Person Families | 1,110 (1.8%) | $153,347 |
| 7+ Person Families | 289 (0.5%) | $115,125 |
| Total | 62,923 (100.0%) | $121,420 |
Family Income by Number of Earners in Saratoga County
The median family income in Saratoga County is $121,420, with families comprising 3+ earners (8,172) having the highest median family income of $178,125, while families with no earners (9,538) have the lowest median family income of $68,205, accounting for 13.0% and 15.2% of families, respectively.
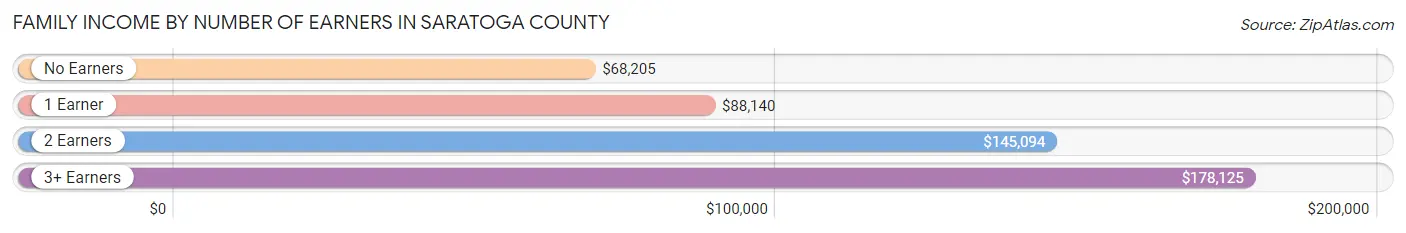
| Number of Earners | # Families | Median Income |
| No Earners | 9,538 (15.2%) | $68,205 |
| 1 Earner | 16,928 (26.9%) | $88,140 |
| 2 Earners | 28,285 (45.0%) | $145,094 |
| 3+ Earners | 8,172 (13.0%) | $178,125 |
| Total | 62,923 (100.0%) | $121,420 |
Household Income in Saratoga County
Household Income Brackets in Saratoga County
With 19,879 households falling in the category, the $100,000 to $149,999 income range is the most frequent in Saratoga County, accounting for 20.2% of all households. In contrast, only 2,460 households (2.5%) fall into the less than $10,000 income bracket, making it the least populous group.
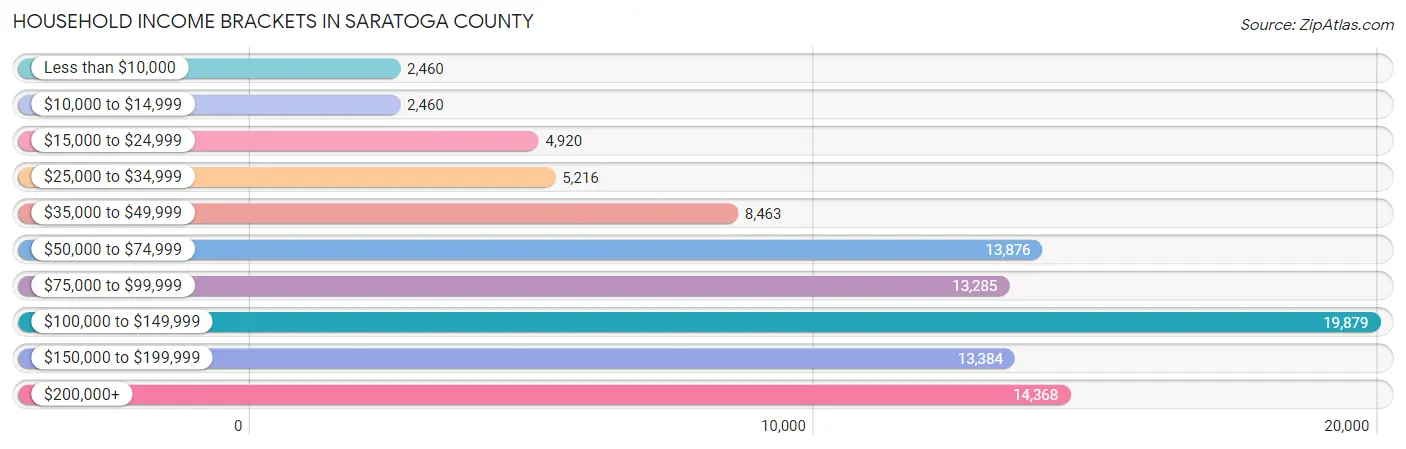
| Income Bracket | # Households | % Households |
| Less than $10,000 | 2,460 | 2.5% |
| $10,000 to $14,999 | 2,460 | 2.5% |
| $15,000 to $24,999 | 4,920 | 5.0% |
| $25,000 to $34,999 | 5,216 | 5.3% |
| $35,000 to $49,999 | 8,463 | 8.6% |
| $50,000 to $74,999 | 13,876 | 14.1% |
| $75,000 to $99,999 | 13,285 | 13.5% |
| $100,000 to $149,999 | 19,879 | 20.2% |
| $150,000 to $199,999 | 13,384 | 13.6% |
| $200,000+ | 14,368 | 14.6% |
Household Income by Householder Age in Saratoga County
The median household income in Saratoga County is $97,038, with the highest median household income of $116,944 found in the 45 to 64 years age bracket for the primary householder. A total of 38,845 households (39.5%) fall into this category. Meanwhile, the 15 to 24 years age bracket for the primary householder has the lowest median household income of $50,833, with 2,732 households (2.8%) in this group.
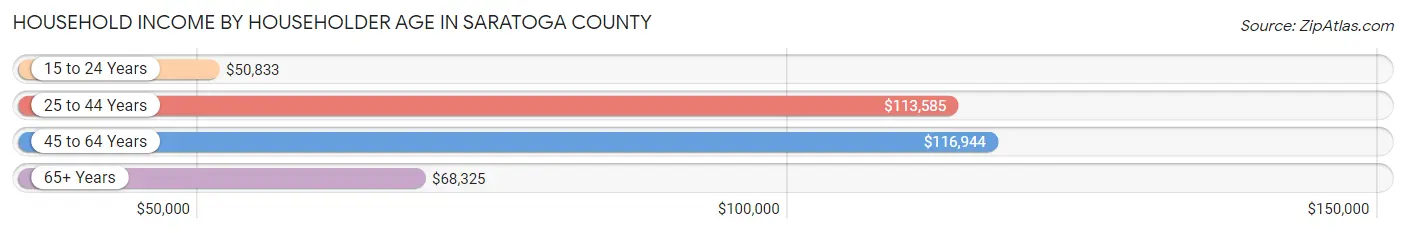
| Income Bracket | # Households | Median Income |
| 15 to 24 Years | 2,732 (2.8%) | $50,833 |
| 25 to 44 Years | 28,260 (28.7%) | $113,585 |
| 45 to 64 Years | 38,845 (39.5%) | $116,944 |
| 65+ Years | 28,572 (29.0%) | $68,325 |
| Total | 98,409 (100.0%) | $97,038 |
Poverty in Saratoga County
Income Below Poverty by Sex and Age in Saratoga County
With 5.8% poverty level for males and 7.3% for females among the residents of Saratoga County, 15 year old males and 18 to 24 year old females are the most vulnerable to poverty, with 229 males (16.1%) and 1,111 females (13.0%) in their respective age groups living below the poverty level.
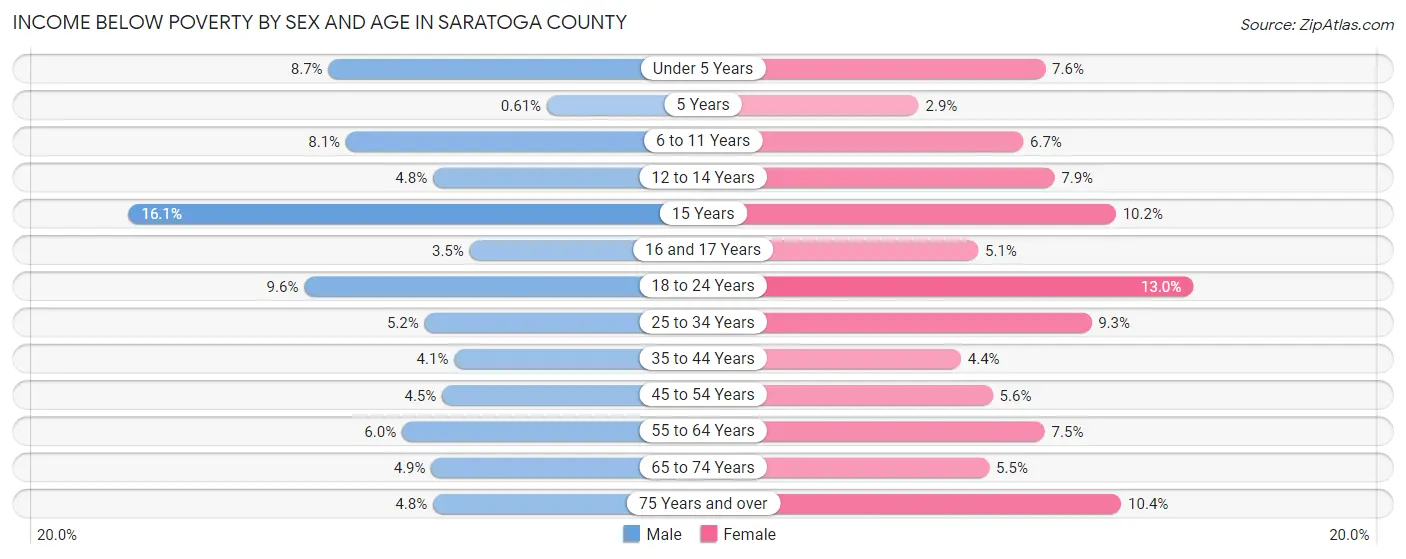
| Age Bracket | Male | Female |
| Under 5 Years | 489 (8.7%) | 405 (7.5%) |
| 5 Years | 7 (0.6%) | 36 (2.9%) |
| 6 to 11 Years | 636 (8.1%) | 521 (6.7%) |
| 12 to 14 Years | 202 (4.8%) | 275 (7.9%) |
| 15 Years | 229 (16.1%) | 126 (10.2%) |
| 16 and 17 Years | 98 (3.5%) | 151 (5.1%) |
| 18 to 24 Years | 886 (9.6%) | 1,111 (13.0%) |
| 25 to 34 Years | 746 (5.1%) | 1,253 (9.3%) |
| 35 to 44 Years | 612 (4.1%) | 657 (4.4%) |
| 45 to 54 Years | 745 (4.5%) | 911 (5.6%) |
| 55 to 64 Years | 1,035 (6.0%) | 1,334 (7.5%) |
| 65 to 74 Years | 627 (4.9%) | 762 (5.5%) |
| 75 Years and over | 361 (4.8%) | 1,033 (10.4%) |
| Total | 6,673 (5.8%) | 8,575 (7.3%) |
Income Above Poverty by Sex and Age in Saratoga County
According to the poverty statistics in Saratoga County, males aged 5 years and females aged 5 years are the age groups that are most secure financially, with 99.4% of males and 97.2% of females in these age groups living above the poverty line.
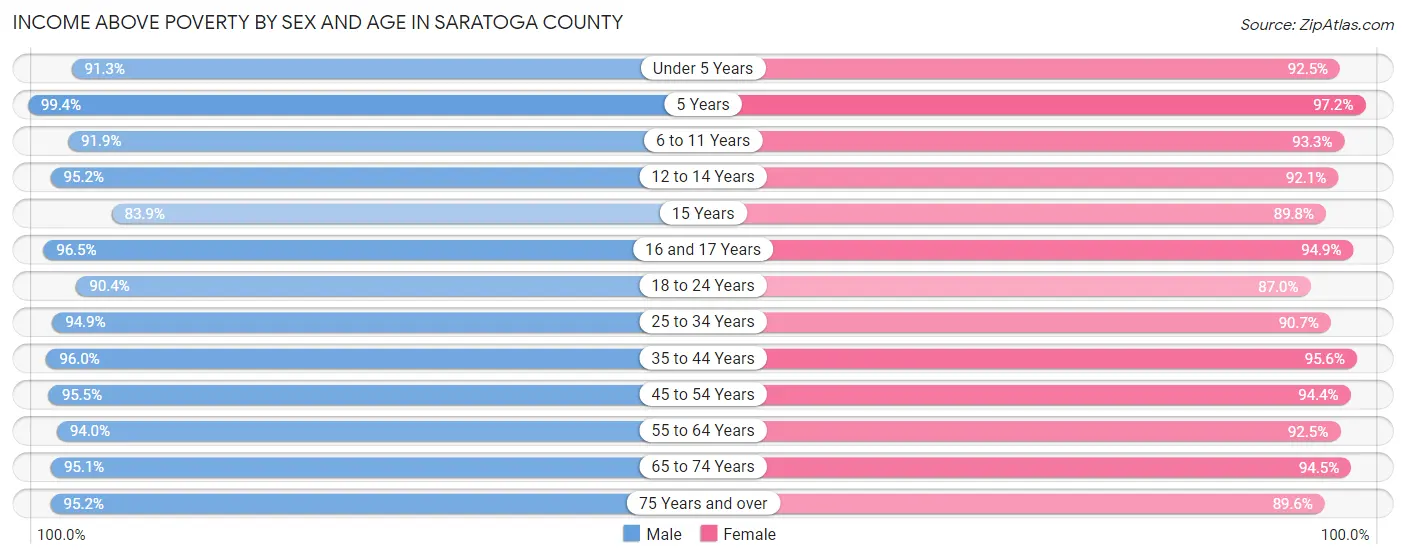
| Age Bracket | Male | Female |
| Under 5 Years | 5,117 (91.3%) | 4,960 (92.4%) |
| 5 Years | 1,140 (99.4%) | 1,226 (97.2%) |
| 6 to 11 Years | 7,247 (91.9%) | 7,218 (93.3%) |
| 12 to 14 Years | 3,973 (95.2%) | 3,212 (92.1%) |
| 15 Years | 1,190 (83.9%) | 1,113 (89.8%) |
| 16 and 17 Years | 2,722 (96.5%) | 2,832 (94.9%) |
| 18 to 24 Years | 8,328 (90.4%) | 7,410 (87.0%) |
| 25 to 34 Years | 13,735 (94.9%) | 12,275 (90.7%) |
| 35 to 44 Years | 14,481 (96.0%) | 14,204 (95.6%) |
| 45 to 54 Years | 15,801 (95.5%) | 15,364 (94.4%) |
| 55 to 64 Years | 16,238 (94.0%) | 16,376 (92.5%) |
| 65 to 74 Years | 12,174 (95.1%) | 13,174 (94.5%) |
| 75 Years and over | 7,090 (95.2%) | 8,927 (89.6%) |
| Total | 109,236 (94.2%) | 108,291 (92.7%) |
Income Below Poverty Among Married-Couple Families in Saratoga County
The poverty statistics for married-couple families in Saratoga County show that 2.0% or 1,028 of the total 50,421 families live below the poverty line. Families with 5 or more children have the highest poverty rate of 13.5%, comprising of 12 families. On the other hand, families with 1 or 2 children have the lowest poverty rate of 2.0%, which includes 320 families.
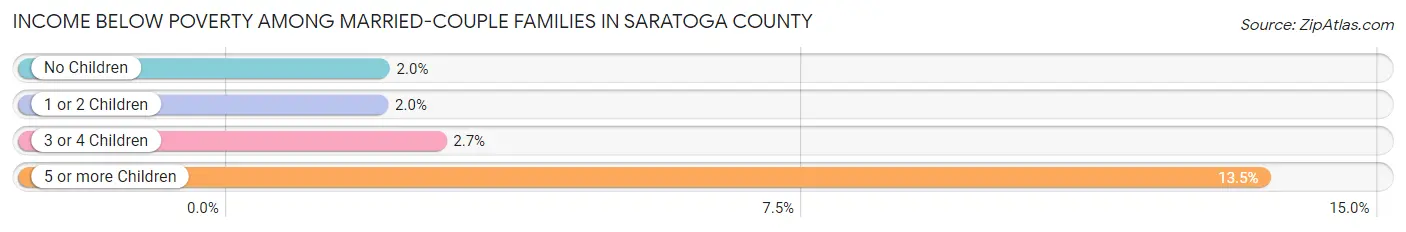
| Children | Above Poverty | Below Poverty |
| No Children | 30,261 (98.0%) | 610 (2.0%) |
| 1 or 2 Children | 15,977 (98.0%) | 320 (2.0%) |
| 3 or 4 Children | 3,078 (97.3%) | 86 (2.7%) |
| 5 or more Children | 77 (86.5%) | 12 (13.5%) |
| Total | 49,393 (98.0%) | 1,028 (2.0%) |
Income Below Poverty Among Single-Parent Households in Saratoga County
According to the poverty data in Saratoga County, 12.2% or 456 single-father households and 12.6% or 1,105 single-mother households are living below the poverty line. Among single-father households, those with 3 or 4 children have the highest poverty rate, with 82 households (30.9%) experiencing poverty. Likewise, among single-mother households, those with 3 or 4 children have the highest poverty rate, with 158 households (36.7%) falling below the poverty line.
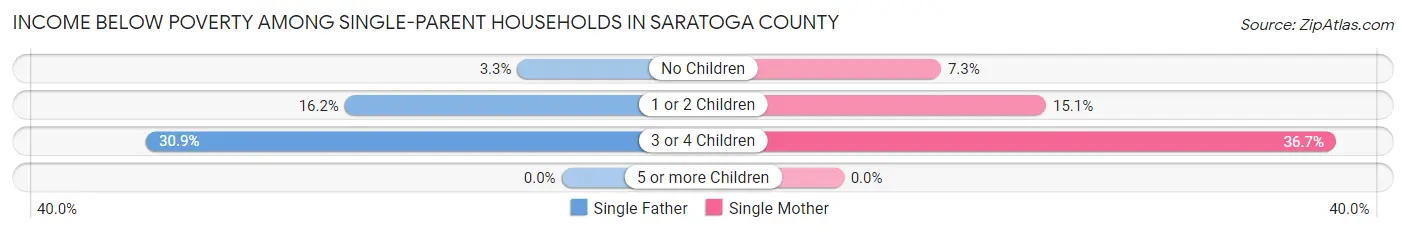
| Children | Single Father | Single Mother |
| No Children | 48 (3.3%) | 278 (7.2%) |
| 1 or 2 Children | 326 (16.2%) | 669 (15.1%) |
| 3 or 4 Children | 82 (30.9%) | 158 (36.7%) |
| 5 or more Children | 0 (0.0%) | 0 (0.0%) |
| Total | 456 (12.2%) | 1,105 (12.6%) |
Income Below Poverty Among Married-Couple vs Single-Parent Households in Saratoga County
The poverty data for Saratoga County shows that 1,028 of the married-couple family households (2.0%) and 1,561 of the single-parent households (12.5%) are living below the poverty level. Within the married-couple family households, those with 5 or more children have the highest poverty rate, with 12 households (13.5%) falling below the poverty line. Among the single-parent households, those with 3 or 4 children have the highest poverty rate, with 240 household (34.5%) living below poverty.
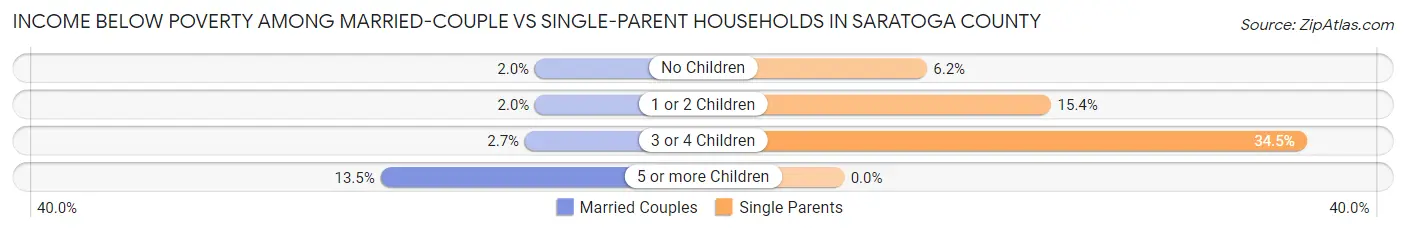
| Children | Married-Couple Families | Single-Parent Households |
| No Children | 610 (2.0%) | 326 (6.2%) |
| 1 or 2 Children | 320 (2.0%) | 995 (15.4%) |
| 3 or 4 Children | 86 (2.7%) | 240 (34.5%) |
| 5 or more Children | 12 (13.5%) | 0 (0.0%) |
| Total | 1,028 (2.0%) | 1,561 (12.5%) |
Race in Saratoga County
The most populous races in Saratoga County are White / Caucasian (213,299 | 90.3%), Two or more Races (9,538 | 4.0%), and Hispanic or Latino (8,320 | 3.5%).
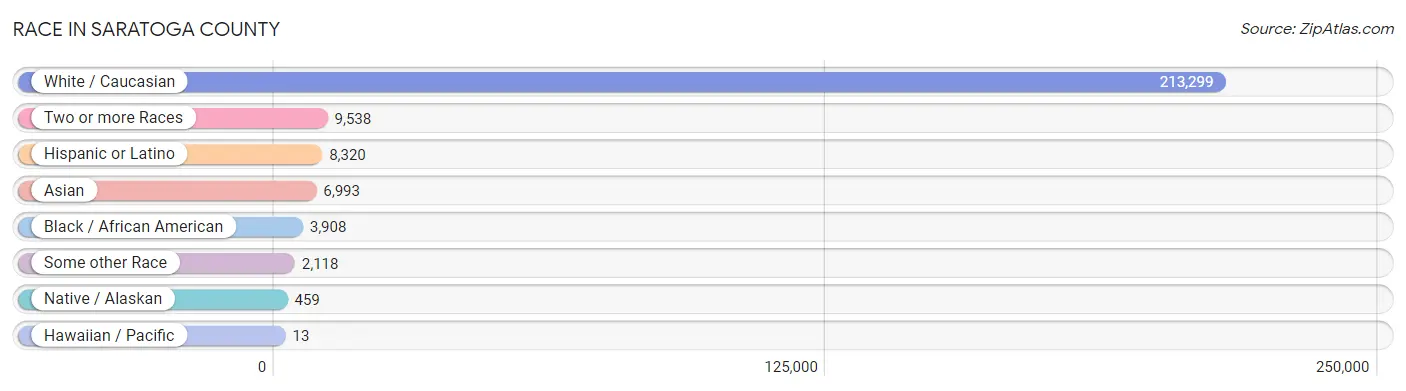
| Race | # Population | % Population |
| Asian | 6,993 | 3.0% |
| Black / African American | 3,908 | 1.7% |
| Hawaiian / Pacific | 13 | 0.0% |
| Hispanic or Latino | 8,320 | 3.5% |
| Native / Alaskan | 459 | 0.2% |
| White / Caucasian | 213,299 | 90.3% |
| Two or more Races | 9,538 | 4.0% |
| Some other Race | 2,118 | 0.9% |
| Total | 236,328 | 100.0% |
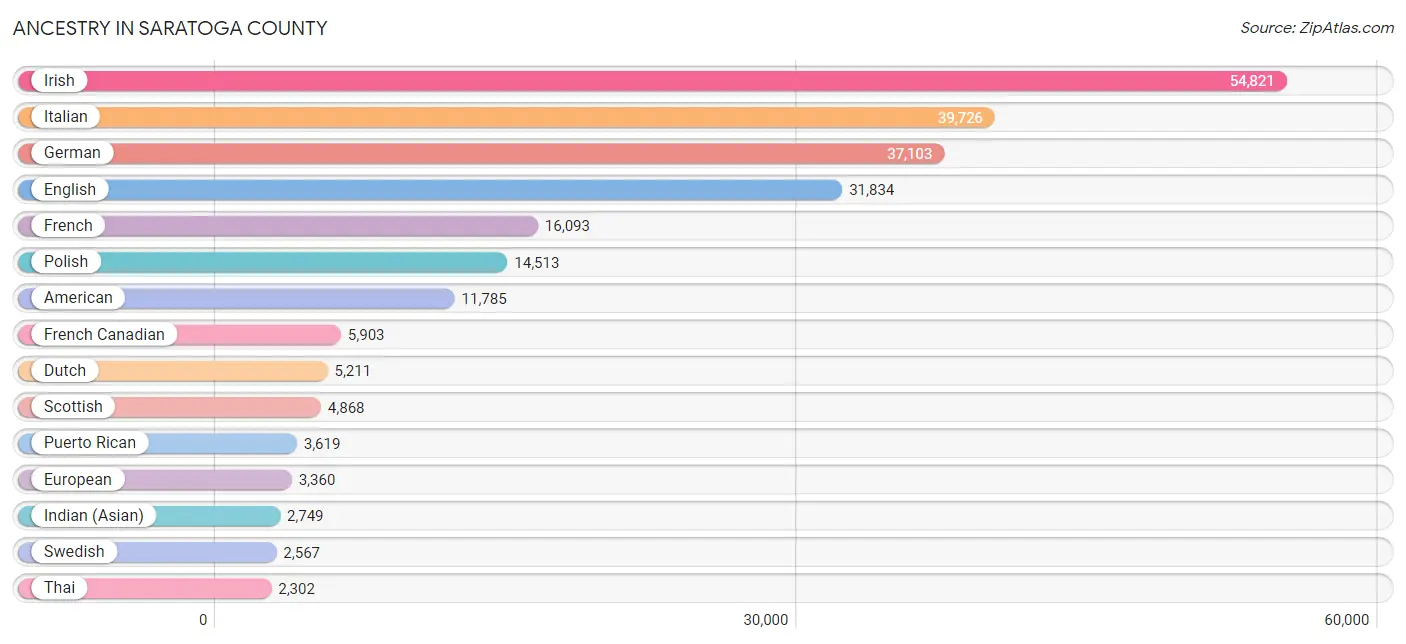
Ancestry in Saratoga County
The most populous ancestries reported in Saratoga County are Irish (54,821 | 23.2%), Italian (39,726 | 16.8%), German (37,103 | 15.7%), English (31,834 | 13.5%), and French (16,093 | 6.8%), together accounting for 76.0% of all Saratoga County residents.
| Ancestry | # Population | % Population |
| Afghan | 426 | 0.2% |
| African | 292 | 0.1% |
| Alaska Native | 11 | 0.0% |
| Alaskan Athabascan | 4 | 0.0% |
| Albanian | 118 | 0.1% |
| Alsatian | 6 | 0.0% |
| American | 11,785 | 5.0% |
| Apache | 16 | 0.0% |
| Arab | 1,617 | 0.7% |
| Argentinean | 53 | 0.0% |
| Armenian | 456 | 0.2% |
| Austrian | 996 | 0.4% |
| Barbadian | 43 | 0.0% |
| Belgian | 286 | 0.1% |
| Belizean | 66 | 0.0% |
| Bhutanese | 446 | 0.2% |
| Blackfeet | 129 | 0.1% |
| Bolivian | 4 | 0.0% |
| Brazilian | 157 | 0.1% |
| British | 1,192 | 0.5% |
| British West Indian | 189 | 0.1% |
| Bulgarian | 34 | 0.0% |
| Burmese | 1,069 | 0.4% |
| Canadian | 635 | 0.3% |
| Cape Verdean | 35 | 0.0% |
| Carpatho Rusyn | 25 | 0.0% |
| Celtic | 17 | 0.0% |
| Central American | 1,051 | 0.4% |
| Central American Indian | 89 | 0.0% |
| Cherokee | 161 | 0.1% |
| Chilean | 142 | 0.1% |
| Chippewa | 24 | 0.0% |
| Choctaw | 15 | 0.0% |
| Colombian | 205 | 0.1% |
| Costa Rican | 108 | 0.1% |
| Creek | 2 | 0.0% |
| Croatian | 159 | 0.1% |
| Cuban | 124 | 0.1% |
| Cypriot | 13 | 0.0% |
| Czech | 995 | 0.4% |
| Czechoslovakian | 441 | 0.2% |
| Danish | 1,051 | 0.4% |
| Dominican | 492 | 0.2% |
| Dutch | 5,211 | 2.2% |
| Eastern European | 972 | 0.4% |
| Ecuadorian | 279 | 0.1% |
| Egyptian | 585 | 0.3% |
| English | 31,834 | 13.5% |
| Estonian | 105 | 0.0% |
| Ethiopian | 26 | 0.0% |
| European | 3,360 | 1.4% |
| Filipino | 32 | 0.0% |
| Finnish | 236 | 0.1% |
| French | 16,093 | 6.8% |
| French American Indian | 34 | 0.0% |
| French Canadian | 5,903 | 2.5% |
| German | 37,103 | 15.7% |
| Ghanaian | 23 | 0.0% |
| Greek | 1,339 | 0.6% |
| Guatemalan | 194 | 0.1% |
| Guyanese | 180 | 0.1% |
| Haitian | 335 | 0.1% |
| Honduran | 371 | 0.2% |
| Hungarian | 1,189 | 0.5% |
| Icelander | 15 | 0.0% |
| Indian (Asian) | 2,749 | 1.2% |
| Iranian | 129 | 0.1% |
| Irish | 54,821 | 23.2% |
| Iroquois | 194 | 0.1% |
| Israeli | 36 | 0.0% |
| Italian | 39,726 | 16.8% |
| Jamaican | 203 | 0.1% |
| Japanese | 91 | 0.0% |
| Jordanian | 12 | 0.0% |
| Kenyan | 18 | 0.0% |
| Korean | 969 | 0.4% |
| Laotian | 57 | 0.0% |
| Latvian | 98 | 0.0% |
| Lebanese | 417 | 0.2% |
| Lithuanian | 871 | 0.4% |
| Macedonian | 60 | 0.0% |
| Mexican | 1,040 | 0.4% |
| Mongolian | 159 | 0.1% |
| Moroccan | 38 | 0.0% |
| Native Hawaiian | 65 | 0.0% |
| New Zealander | 4 | 0.0% |
| Nigerian | 19 | 0.0% |
| Northern European | 226 | 0.1% |
| Norwegian | 1,825 | 0.8% |
| Okinawan | 19 | 0.0% |
| Pakistani | 203 | 0.1% |
| Palestinian | 241 | 0.1% |
| Panamanian | 210 | 0.1% |
| Pennsylvania German | 252 | 0.1% |
| Peruvian | 170 | 0.1% |
| Polish | 14,513 | 6.1% |
| Portuguese | 662 | 0.3% |
| Puerto Rican | 3,619 | 1.5% |
| Romanian | 346 | 0.2% |
| Russian | 2,300 | 1.0% |
| Salvadoran | 168 | 0.1% |
| Scandinavian | 724 | 0.3% |
| Scotch-Irish | 1,782 | 0.7% |
| Scottish | 4,868 | 2.1% |
| Seminole | 16 | 0.0% |
| Serbian | 27 | 0.0% |
| Sierra Leonean | 11 | 0.0% |
| Sioux | 181 | 0.1% |
| Slavic | 126 | 0.1% |
| Slovak | 734 | 0.3% |
| Slovene | 56 | 0.0% |
| South African | 26 | 0.0% |
| South American | 973 | 0.4% |
| South American Indian | 14 | 0.0% |
| Spaniard | 515 | 0.2% |
| Spanish | 87 | 0.0% |
| Sri Lankan | 140 | 0.1% |
| Subsaharan African | 474 | 0.2% |
| Swedish | 2,567 | 1.1% |
| Swiss | 725 | 0.3% |
| Syrian | 192 | 0.1% |
| Thai | 2,302 | 1.0% |
| Trinidadian and Tobagonian | 93 | 0.0% |
| Turkish | 162 | 0.1% |
| Ukrainian | 1,855 | 0.8% |
| Uruguayan | 37 | 0.0% |
| Venezuelan | 77 | 0.0% |
| Vietnamese | 39 | 0.0% |
| Welsh | 1,556 | 0.7% |
| West Indian | 162 | 0.1% |
| Yugoslavian | 146 | 0.1% |
| Yup'ik | 4 | 0.0% | View All 132 Rows |
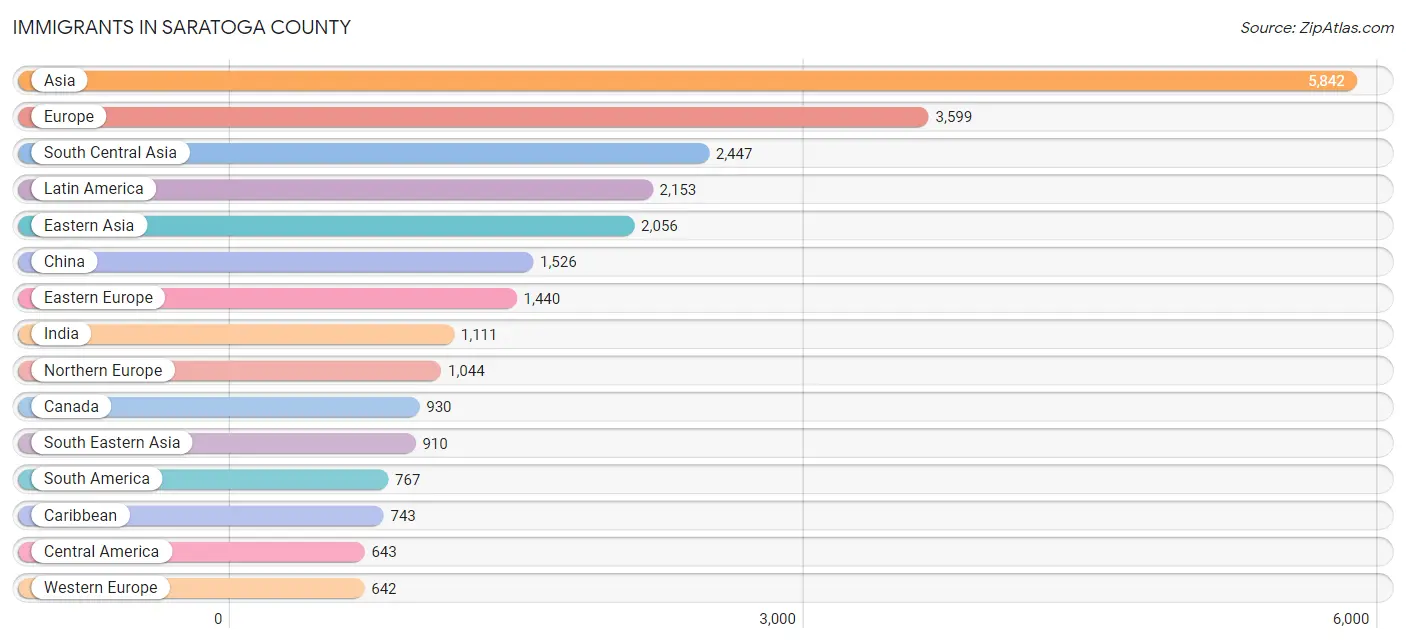
Immigrants in Saratoga County
The most numerous immigrant groups reported in Saratoga County came from Asia (5,842 | 2.5%), Europe (3,599 | 1.5%), South Central Asia (2,447 | 1.0%), Latin America (2,153 | 0.9%), and Eastern Asia (2,056 | 0.9%), together accounting for 6.8% of all Saratoga County residents.
| Immigration Origin | # Population | % Population |
| Afghanistan | 446 | 0.2% |
| Africa | 582 | 0.3% |
| Albania | 57 | 0.0% |
| Argentina | 13 | 0.0% |
| Asia | 5,842 | 2.5% |
| Australia | 13 | 0.0% |
| Austria | 45 | 0.0% |
| Bangladesh | 187 | 0.1% |
| Barbados | 34 | 0.0% |
| Belgium | 103 | 0.0% |
| Belize | 16 | 0.0% |
| Bosnia and Herzegovina | 69 | 0.0% |
| Brazil | 206 | 0.1% |
| Bulgaria | 27 | 0.0% |
| Cambodia | 12 | 0.0% |
| Canada | 930 | 0.4% |
| Caribbean | 743 | 0.3% |
| Central America | 643 | 0.3% |
| China | 1,526 | 0.6% |
| Colombia | 103 | 0.0% |
| Cuba | 27 | 0.0% |
| Czechoslovakia | 69 | 0.0% |
| Dominican Republic | 193 | 0.1% |
| Eastern Africa | 73 | 0.0% |
| Eastern Asia | 2,056 | 0.9% |
| Eastern Europe | 1,440 | 0.6% |
| Ecuador | 131 | 0.1% |
| Egypt | 237 | 0.1% |
| El Salvador | 17 | 0.0% |
| England | 256 | 0.1% |
| Ethiopia | 26 | 0.0% |
| Europe | 3,599 | 1.5% |
| France | 74 | 0.0% |
| Germany | 386 | 0.2% |
| Ghana | 50 | 0.0% |
| Greece | 7 | 0.0% |
| Grenada | 4 | 0.0% |
| Guatemala | 119 | 0.1% |
| Guyana | 167 | 0.1% |
| Haiti | 215 | 0.1% |
| Honduras | 115 | 0.1% |
| Hong Kong | 143 | 0.1% |
| Hungary | 17 | 0.0% |
| India | 1,111 | 0.5% |
| Indonesia | 72 | 0.0% |
| Iran | 92 | 0.0% |
| Iraq | 18 | 0.0% |
| Ireland | 143 | 0.1% |
| Italy | 409 | 0.2% |
| Jamaica | 126 | 0.1% |
| Japan | 142 | 0.1% |
| Jordan | 12 | 0.0% |
| Kazakhstan | 10 | 0.0% |
| Kenya | 22 | 0.0% |
| Korea | 388 | 0.2% |
| Kuwait | 20 | 0.0% |
| Latin America | 2,153 | 0.9% |
| Latvia | 13 | 0.0% |
| Lebanon | 239 | 0.1% |
| Lithuania | 15 | 0.0% |
| Malaysia | 247 | 0.1% |
| Mexico | 265 | 0.1% |
| Moldova | 36 | 0.0% |
| Morocco | 62 | 0.0% |
| Netherlands | 13 | 0.0% |
| Nicaragua | 32 | 0.0% |
| Nigeria | 85 | 0.0% |
| Northern Africa | 337 | 0.1% |
| Northern Europe | 1,044 | 0.4% |
| Oceania | 13 | 0.0% |
| Pakistan | 486 | 0.2% |
| Panama | 79 | 0.0% |
| Peru | 72 | 0.0% |
| Philippines | 320 | 0.1% |
| Poland | 239 | 0.1% |
| Portugal | 35 | 0.0% |
| Romania | 117 | 0.1% |
| Russia | 243 | 0.1% |
| Saudi Arabia | 8 | 0.0% |
| Scotland | 85 | 0.0% |
| Sierra Leone | 11 | 0.0% |
| Singapore | 121 | 0.1% |
| South Africa | 14 | 0.0% |
| South America | 767 | 0.3% |
| South Central Asia | 2,447 | 1.0% |
| South Eastern Asia | 910 | 0.4% |
| Southern Europe | 473 | 0.2% |
| Spain | 22 | 0.0% |
| Sri Lanka | 66 | 0.0% |
| St. Vincent and the Grenadines | 21 | 0.0% |
| Sudan | 38 | 0.0% |
| Sweden | 18 | 0.0% |
| Switzerland | 21 | 0.0% |
| Taiwan | 281 | 0.1% |
| Thailand | 79 | 0.0% |
| Trinidad and Tobago | 23 | 0.0% |
| Turkey | 23 | 0.0% |
| Ukraine | 457 | 0.2% |
| Uruguay | 3 | 0.0% |
| Venezuela | 72 | 0.0% |
| Vietnam | 59 | 0.0% |
| West Indies | 9 | 0.0% |
| Western Africa | 157 | 0.1% |
| Western Asia | 391 | 0.2% |
| Western Europe | 642 | 0.3% | View All 105 Rows |
Sex and Age in Saratoga County
Sex and Age in Saratoga County
The most populous age groups in Saratoga County are 55 to 59 Years (9,049 | 7.7%) for men and 55 to 59 Years (9,365 | 7.9%) for women.
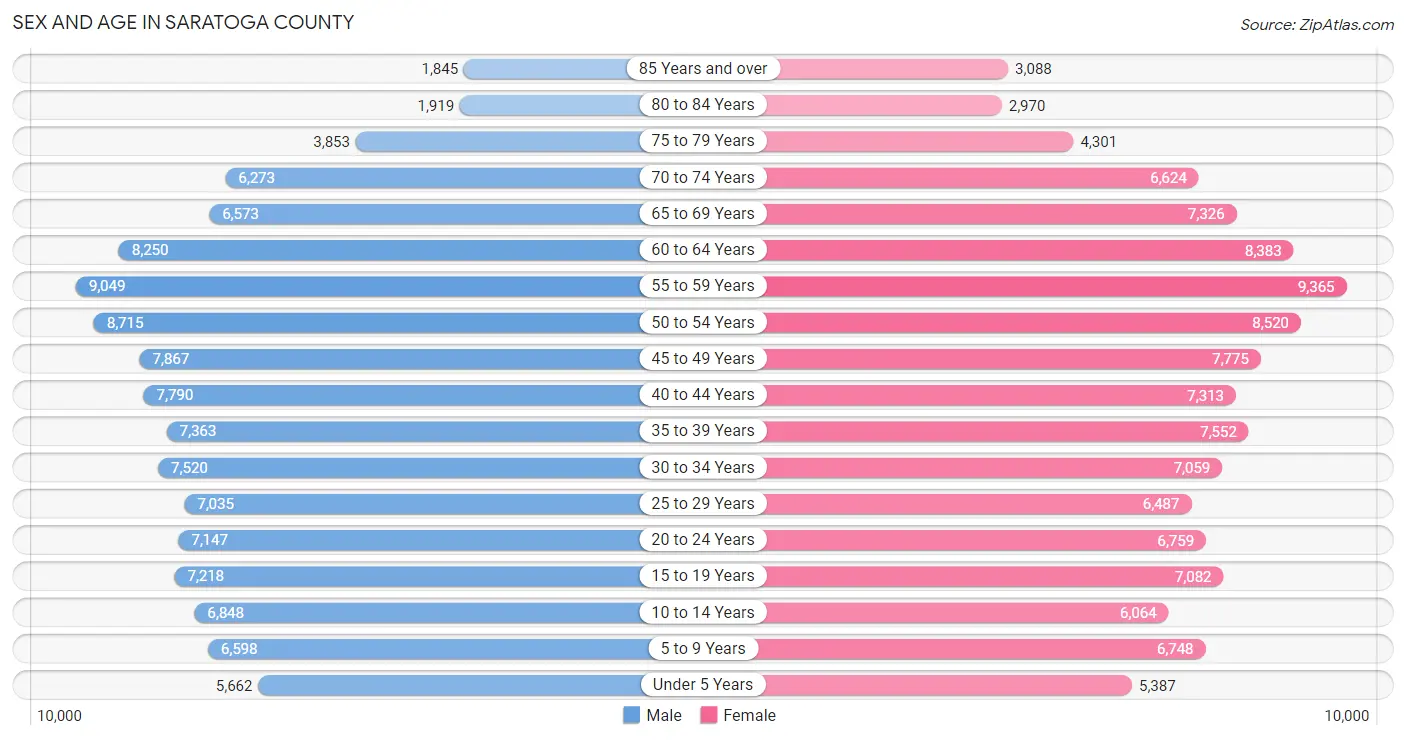
| Age Bracket | Male | Female |
| Under 5 Years | 5,662 (4.8%) | 5,387 (4.5%) |
| 5 to 9 Years | 6,598 (5.6%) | 6,748 (5.7%) |
| 10 to 14 Years | 6,848 (5.8%) | 6,064 (5.1%) |
| 15 to 19 Years | 7,218 (6.1%) | 7,082 (6.0%) |
| 20 to 24 Years | 7,147 (6.1%) | 6,759 (5.7%) |
| 25 to 29 Years | 7,035 (6.0%) | 6,487 (5.5%) |
| 30 to 34 Years | 7,520 (6.4%) | 7,059 (5.9%) |
| 35 to 39 Years | 7,363 (6.3%) | 7,552 (6.4%) |
| 40 to 44 Years | 7,790 (6.6%) | 7,313 (6.2%) |
| 45 to 49 Years | 7,867 (6.7%) | 7,775 (6.5%) |
| 50 to 54 Years | 8,715 (7.4%) | 8,520 (7.2%) |
| 55 to 59 Years | 9,049 (7.7%) | 9,365 (7.9%) |
| 60 to 64 Years | 8,250 (7.0%) | 8,383 (7.1%) |
| 65 to 69 Years | 6,573 (5.6%) | 7,326 (6.2%) |
| 70 to 74 Years | 6,273 (5.3%) | 6,624 (5.6%) |
| 75 to 79 Years | 3,853 (3.3%) | 4,301 (3.6%) |
| 80 to 84 Years | 1,919 (1.6%) | 2,970 (2.5%) |
| 85 Years and over | 1,845 (1.6%) | 3,088 (2.6%) |
| Total | 117,525 (100.0%) | 118,803 (100.0%) |
Families and Households in Saratoga County
Median Family Size in Saratoga County
The median family size in Saratoga County is 2.90 persons per family, with married-couple families (50,421 | 80.1%) accounting for the largest median family size of 2.96 persons per family. On the other hand, single male/father families (3,741 | 5.9%) represent the smallest median family size with 2.57 persons per family.
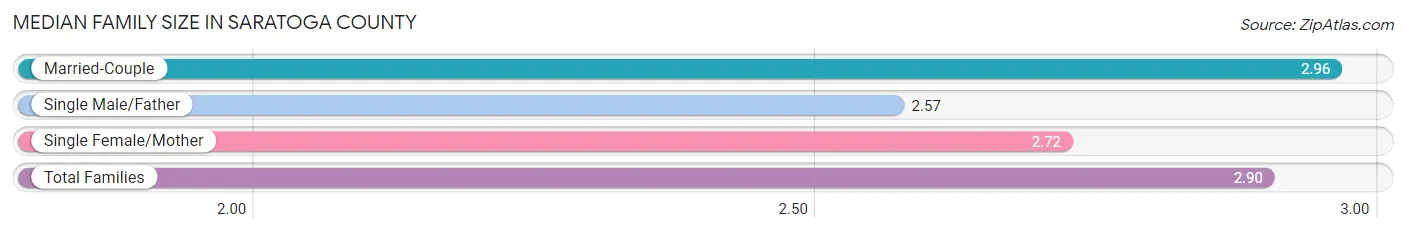
| Family Type | # Families | Family Size |
| Married-Couple | 50,421 (80.1%) | 2.96 |
| Single Male/Father | 3,741 (5.9%) | 2.57 |
| Single Female/Mother | 8,761 (13.9%) | 2.72 |
| Total Families | 62,923 (100.0%) | 2.90 |
Median Household Size in Saratoga County
The median household size in Saratoga County is 2.36 persons per household, with single female/mother households (8,761 | 8.9%) accounting for the largest median household size of 3.01 persons per household. non-family households (35,486 | 36.1%) represent the smallest median household size with 1.27 persons per household.
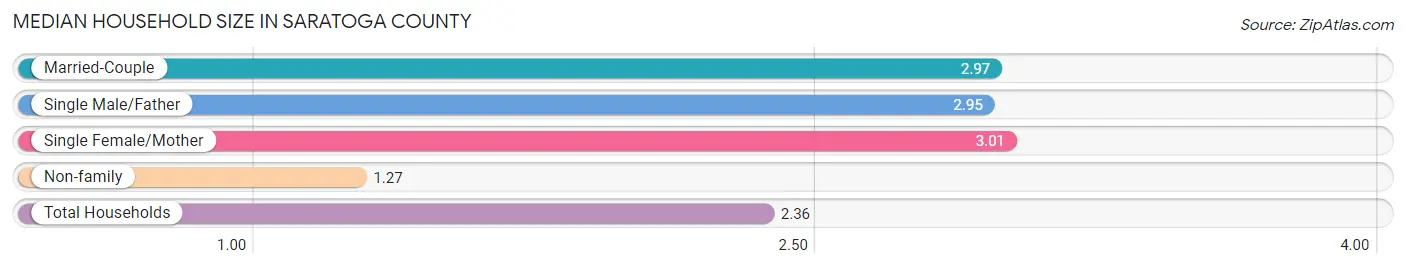
| Household Type | # Households | Household Size |
| Married-Couple | 50,421 (51.2%) | 2.97 |
| Single Male/Father | 3,741 (3.8%) | 2.95 |
| Single Female/Mother | 8,761 (8.9%) | 3.01 |
| Non-family | 35,486 (36.1%) | 1.27 |
| Total Households | 98,409 (100.0%) | 2.36 |
Household Size by Marriage Status in Saratoga County
Out of a total of 98,409 households in Saratoga County, 62,923 (63.9%) are family households, while 35,486 (36.1%) are nonfamily households. The most numerous type of family households are 2-person households, comprising 30,106, and the most common type of nonfamily households are 1-person households, comprising 27,040.
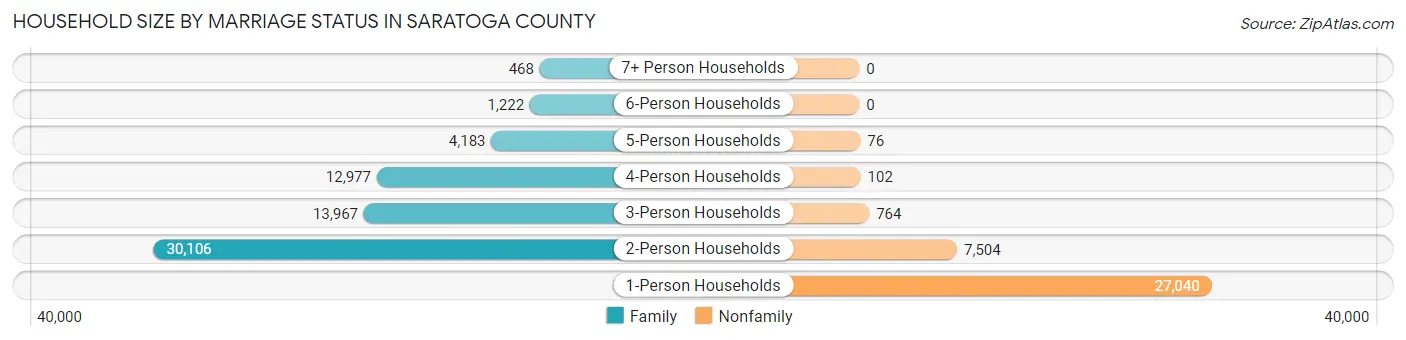
| Household Size | Family Households | Nonfamily Households |
| 1-Person Households | - | 27,040 (27.5%) |
| 2-Person Households | 30,106 (30.6%) | 7,504 (7.6%) |
| 3-Person Households | 13,967 (14.2%) | 764 (0.8%) |
| 4-Person Households | 12,977 (13.2%) | 102 (0.1%) |
| 5-Person Households | 4,183 (4.3%) | 76 (0.1%) |
| 6-Person Households | 1,222 (1.2%) | 0 (0.0%) |
| 7+ Person Households | 468 (0.5%) | 0 (0.0%) |
| Total | 62,923 (63.9%) | 35,486 (36.1%) |
Female Fertility in Saratoga County
Fertility by Age in Saratoga County
Average fertility rate in Saratoga County is 40.0 births per 1,000 women. Women in the age bracket of 20 to 34 years have the highest fertility rate with 66.0 births per 1,000 women. Women in the age bracket of 20 to 34 years acount for 64.6% of all women with births.
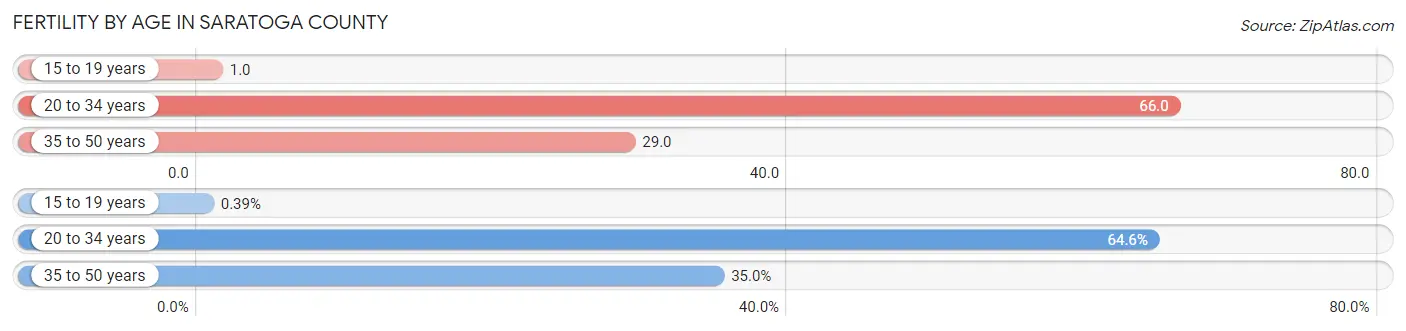
| Age Bracket | Women with Births | Births / 1,000 Women |
| 15 to 19 years | 8 (0.4%) | 1.0 |
| 20 to 34 years | 1,331 (64.6%) | 66.0 |
| 35 to 50 years | 722 (35.0%) | 29.0 |
| Total | 2,061 (100.0%) | 40.0 |
Fertility by Age by Marriage Status in Saratoga County
82.6% of women with births (2,061) in Saratoga County are married. The highest percentage of unmarried women with births falls into 15 to 19 years age bracket with 100.0% of them unmarried at the time of birth, while the lowest percentage of unmarried women with births belong to 35 to 50 years age bracket with 6.5% of them unmarried.
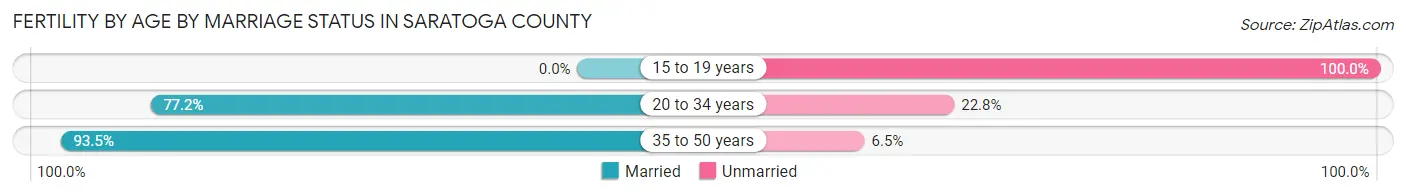
| Age Bracket | Married | Unmarried |
| 15 to 19 years | 0 (0.0%) | 8 (100.0%) |
| 20 to 34 years | 1,028 (77.2%) | 303 (22.8%) |
| 35 to 50 years | 675 (93.5%) | 47 (6.5%) |
| Total | 1,702 (82.6%) | 359 (17.4%) |
Fertility by Education in Saratoga County
Average fertility rate in Saratoga County is 40.0 births per 1,000 women. Women with the education attainment of graduate degree have the highest fertility rate of 60.0 births per 1,000 women, while women with the education attainment of less than high school have the lowest fertility at 7.0 births per 1,000 women. Women with the education attainment of graduate degree represent 30.5% of all women with births.
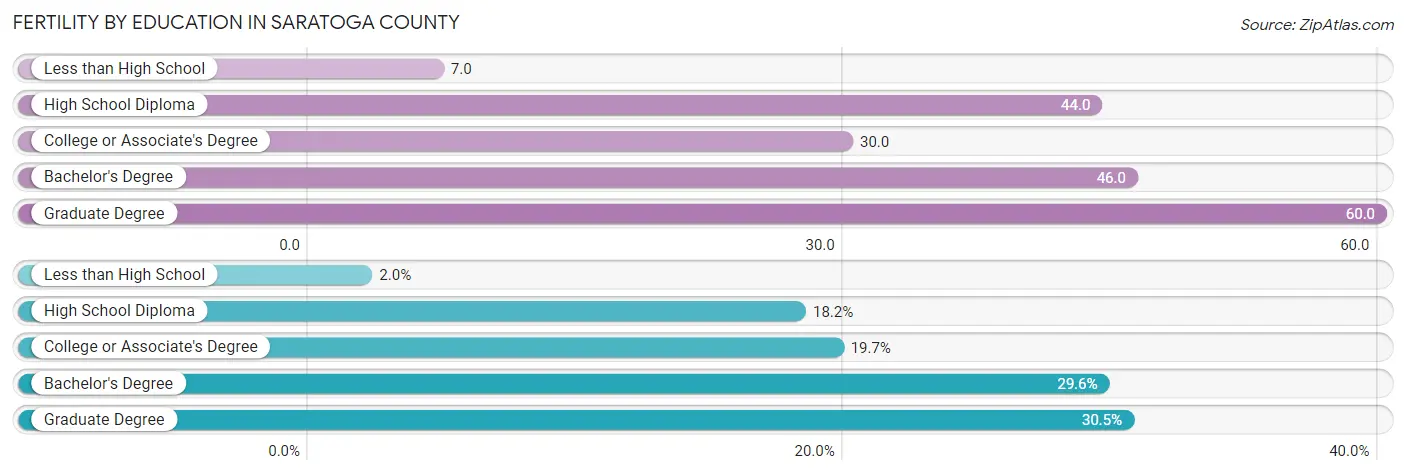
| Educational Attainment | Women with Births | Births / 1,000 Women |
| Less than High School | 41 (2.0%) | 7.0 |
| High School Diploma | 376 (18.2%) | 44.0 |
| College or Associate's Degree | 405 (19.7%) | 30.0 |
| Bachelor's Degree | 610 (29.6%) | 46.0 |
| Graduate Degree | 629 (30.5%) | 60.0 |
| Total | 2,061 (100.0%) | 40.0 |
Fertility by Education by Marriage Status in Saratoga County
17.4% of women with births in Saratoga County are unmarried. Women with the educational attainment of graduate degree are most likely to be married with 97.8% of them married at childbirth, while women with the educational attainment of high school diploma are least likely to be married with 46.8% of them unmarried at childbirth.
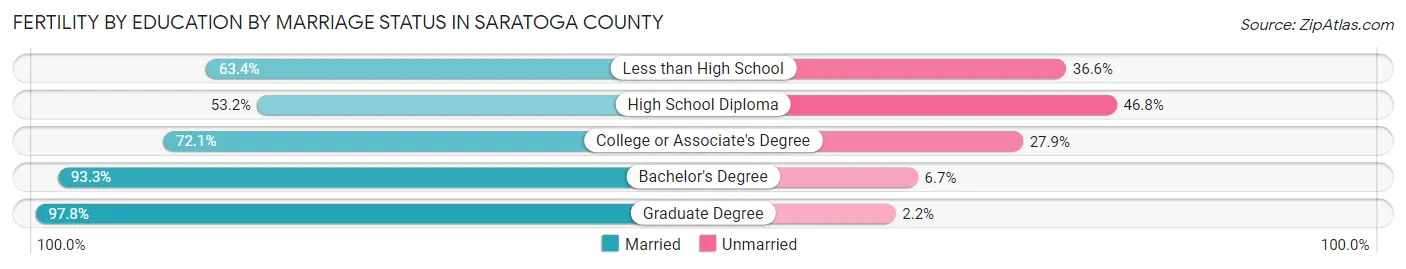
| Educational Attainment | Married | Unmarried |
| Less than High School | 26 (63.4%) | 15 (36.6%) |
| High School Diploma | 200 (53.2%) | 176 (46.8%) |
| College or Associate's Degree | 292 (72.1%) | 113 (27.9%) |
| Bachelor's Degree | 569 (93.3%) | 41 (6.7%) |
| Graduate Degree | 615 (97.8%) | 14 (2.2%) |
| Total | 1,702 (82.6%) | 359 (17.4%) |
Employment Characteristics in Saratoga County
Employment by Class of Employer in Saratoga County
Among the 123,295 employed individuals in Saratoga County, private company employees (75,115 | 60.9%), not-for-profit organizations (14,144 | 11.5%), and local government employees (10,660 | 8.6%) make up the most common classes of employment.
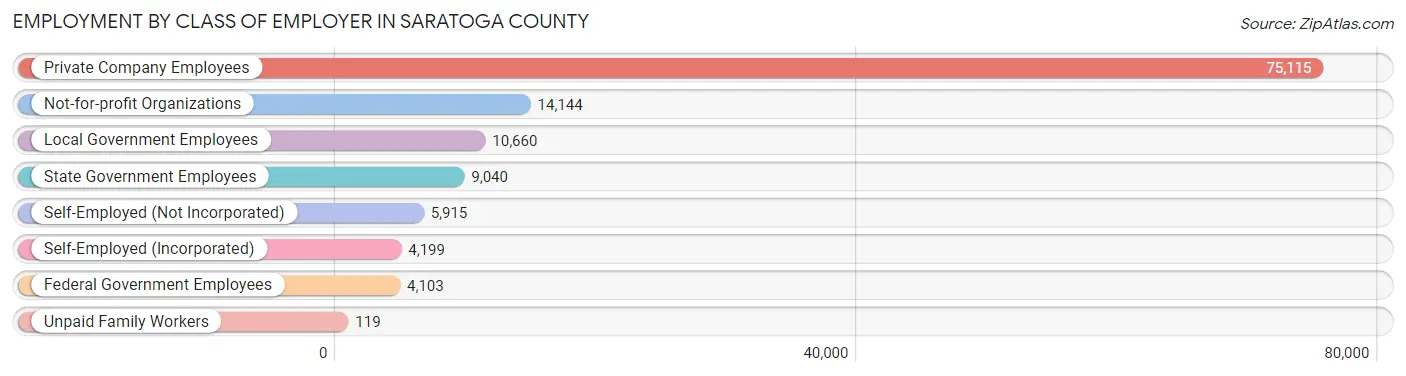
| Employer Class | # Employees | % Employees |
| Private Company Employees | 75,115 | 60.9% |
| Self-Employed (Incorporated) | 4,199 | 3.4% |
| Self-Employed (Not Incorporated) | 5,915 | 4.8% |
| Not-for-profit Organizations | 14,144 | 11.5% |
| Local Government Employees | 10,660 | 8.6% |
| State Government Employees | 9,040 | 7.3% |
| Federal Government Employees | 4,103 | 3.3% |
| Unpaid Family Workers | 119 | 0.1% |
| Total | 123,295 | 100.0% |
Employment Status by Age in Saratoga County
According to the labor force statistics for Saratoga County, out of the total population over 16 years of age (196,363), 66.5% or 130,581 individuals are in the labor force, with 3.5% or 4,570 of them unemployed. The age group with the highest labor force participation rate is 25 to 29 years, with 91.5% or 12,373 individuals in the labor force. Within the labor force, the 20 to 24 years age range has the highest percentage of unemployed individuals, with 9.6% or 1,087 of them being unemployed.
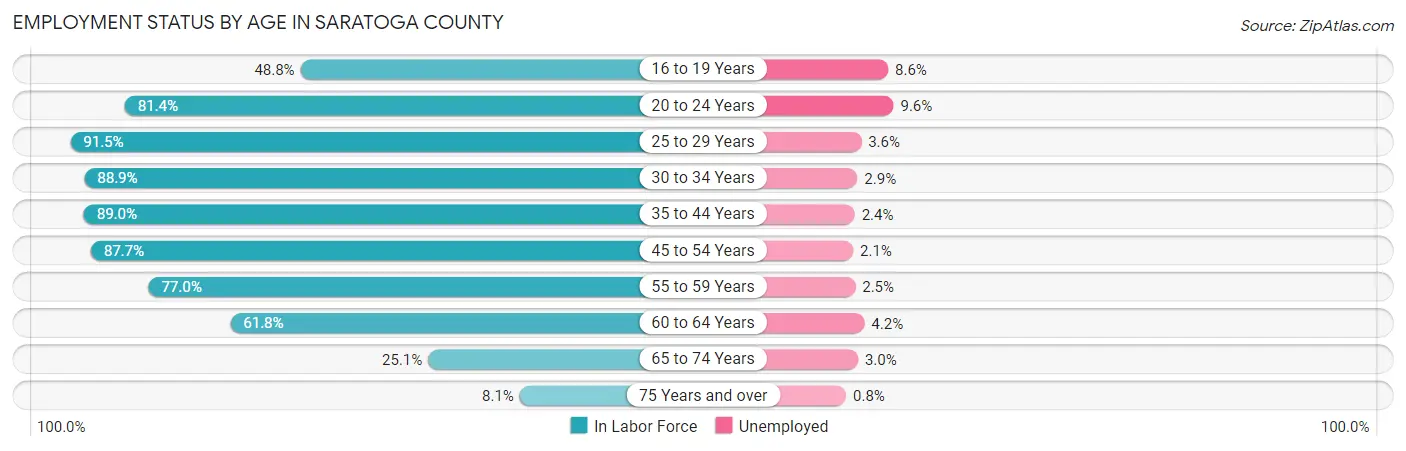
| Age Bracket | In Labor Force | Unemployed |
| 16 to 19 Years | 5,681 (48.8%) | 489 (8.6%) |
| 20 to 24 Years | 11,319 (81.4%) | 1,087 (9.6%) |
| 25 to 29 Years | 12,373 (91.5%) | 445 (3.6%) |
| 30 to 34 Years | 12,961 (88.9%) | 376 (2.9%) |
| 35 to 44 Years | 26,716 (89.0%) | 641 (2.4%) |
| 45 to 54 Years | 28,833 (87.7%) | 605 (2.1%) |
| 55 to 59 Years | 14,179 (77.0%) | 354 (2.5%) |
| 60 to 64 Years | 10,279 (61.8%) | 432 (4.2%) |
| 65 to 74 Years | 6,726 (25.1%) | 202 (3.0%) |
| 75 Years and over | 1,456 (8.1%) | 12 (0.8%) |
| Total | 130,581 (66.5%) | 4,570 (3.5%) |
Employment Status by Educational Attainment in Saratoga County
According to labor force statistics for Saratoga County, 83.6% of individuals (105,372) out of the total population between 25 and 64 years of age (126,043) are in the labor force, with 2.7% or 2,845 of them being unemployed. The group with the highest labor force participation rate are those with the educational attainment of bachelor's degree or higher, with 89.8% or 52,543 individuals in the labor force. Within the labor force, individuals with less than high school education have the highest percentage of unemployment, with 5.1% or 177 of them being unemployed.
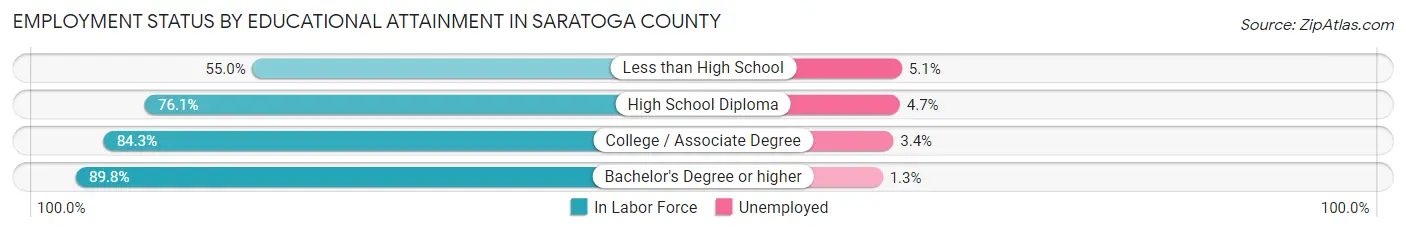
| Educational Attainment | In Labor Force | Unemployed |
| Less than High School | 3,469 (55.0%) | 322 (5.1%) |
| High School Diploma | 21,226 (76.1%) | 1,311 (4.7%) |
| College / Associate Degree | 28,099 (84.3%) | 1,133 (3.4%) |
| Bachelor's Degree or higher | 52,543 (89.8%) | 761 (1.3%) |
| Total | 105,372 (83.6%) | 3,403 (2.7%) |
Employment Occupations by Sex in Saratoga County
Management, Business, Science and Arts Occupations
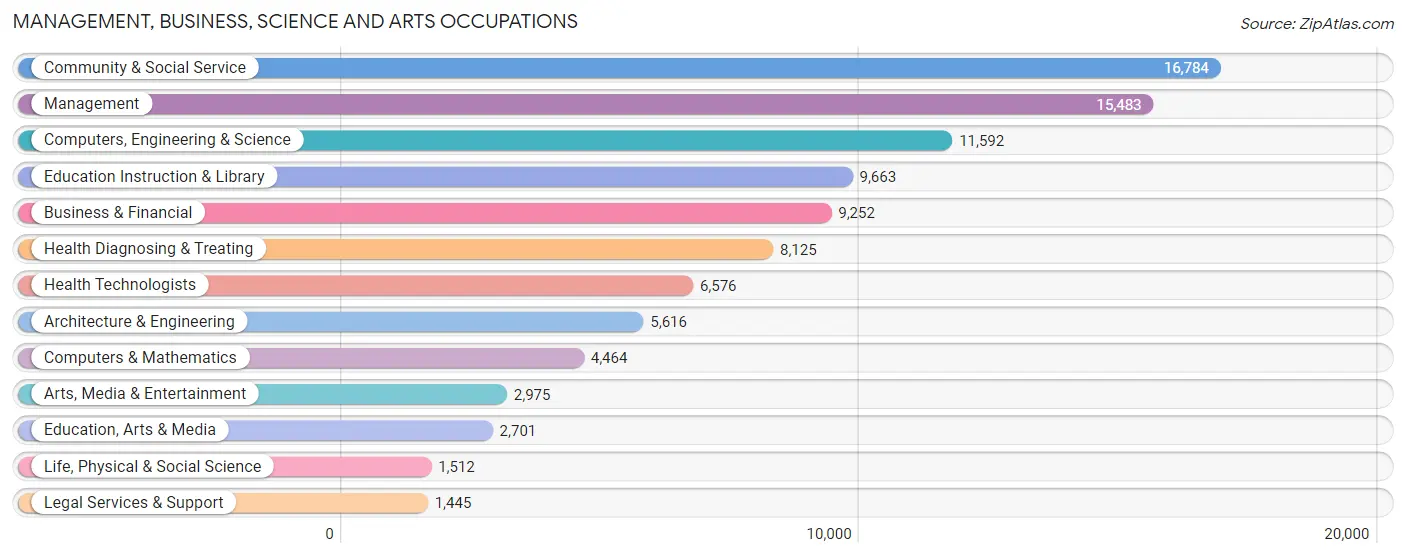
The most common Management, Business, Science and Arts occupations in Saratoga County are Community & Social Service (16,784 | 13.4%), Management (15,483 | 12.4%), Computers, Engineering & Science (11,592 | 9.3%), Education Instruction & Library (9,663 | 7.7%), and Business & Financial (9,252 | 7.4%).
Management, Business, Science and Arts Occupations by Sex
Within the Management, Business, Science and Arts occupations in Saratoga County, the most male-oriented occupations are Architecture & Engineering (84.0%), Computers & Mathematics (82.0%), and Computers, Engineering & Science (79.8%), while the most female-oriented occupations are Education Instruction & Library (77.8%), Education, Arts & Media (77.5%), and Health Diagnosing & Treating (74.7%).
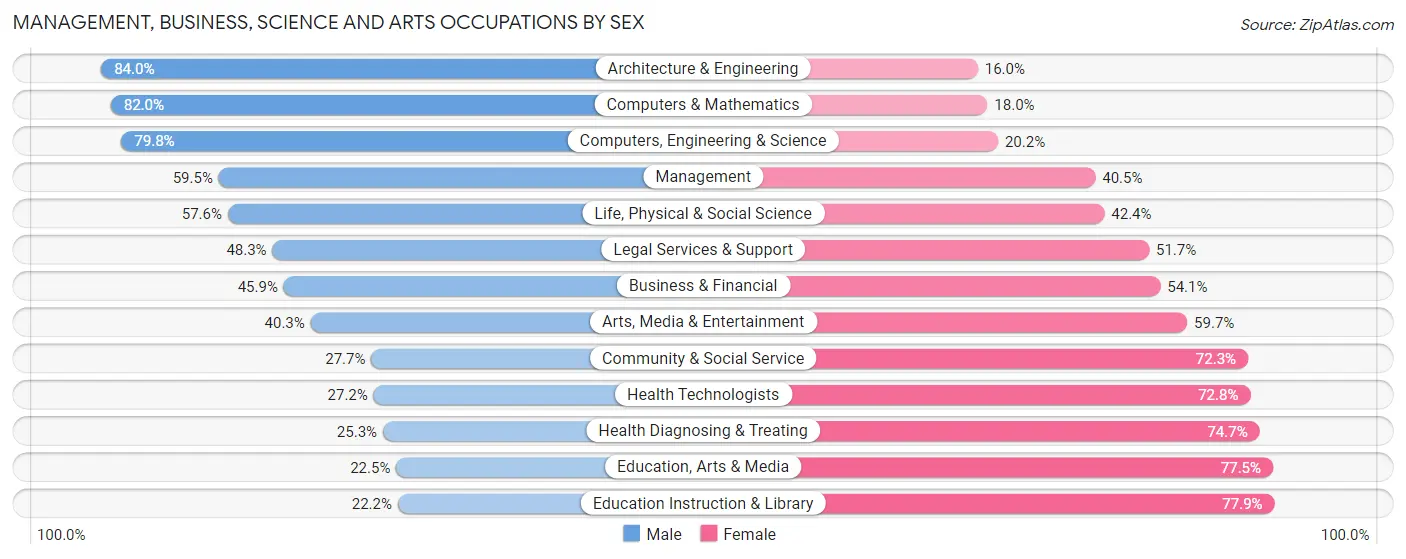
| Occupation | Male | Female |
| Management | 9,212 (59.5%) | 6,271 (40.5%) |
| Business & Financial | 4,250 (45.9%) | 5,002 (54.1%) |
| Computers, Engineering & Science | 9,250 (79.8%) | 2,342 (20.2%) |
| Computers & Mathematics | 3,661 (82.0%) | 803 (18.0%) |
| Architecture & Engineering | 4,718 (84.0%) | 898 (16.0%) |
| Life, Physical & Social Science | 871 (57.6%) | 641 (42.4%) |
| Community & Social Service | 4,645 (27.7%) | 12,139 (72.3%) |
| Education, Arts & Media | 607 (22.5%) | 2,094 (77.5%) |
| Legal Services & Support | 698 (48.3%) | 747 (51.7%) |
| Education Instruction & Library | 2,140 (22.2%) | 7,523 (77.8%) |
| Arts, Media & Entertainment | 1,200 (40.3%) | 1,775 (59.7%) |
| Health Diagnosing & Treating | 2,052 (25.3%) | 6,073 (74.7%) |
| Health Technologists | 1,788 (27.2%) | 4,788 (72.8%) |
| Total (Category) | 29,409 (48.0%) | 31,827 (52.0%) |
| Total (Overall) | 65,170 (52.1%) | 59,789 (47.8%) |
Services Occupations
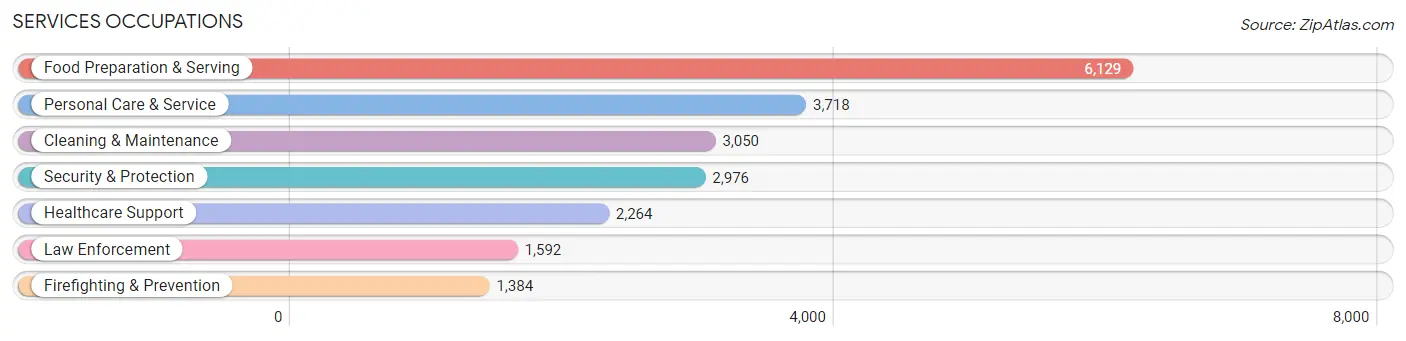
The most common Services occupations in Saratoga County are Food Preparation & Serving (6,129 | 4.9%), Personal Care & Service (3,718 | 3.0%), Cleaning & Maintenance (3,050 | 2.4%), Security & Protection (2,976 | 2.4%), and Healthcare Support (2,264 | 1.8%).
Services Occupations by Sex
Within the Services occupations in Saratoga County, the most male-oriented occupations are Law Enforcement (82.5%), Cleaning & Maintenance (75.5%), and Security & Protection (74.8%), while the most female-oriented occupations are Healthcare Support (81.6%), Personal Care & Service (76.7%), and Food Preparation & Serving (49.0%).
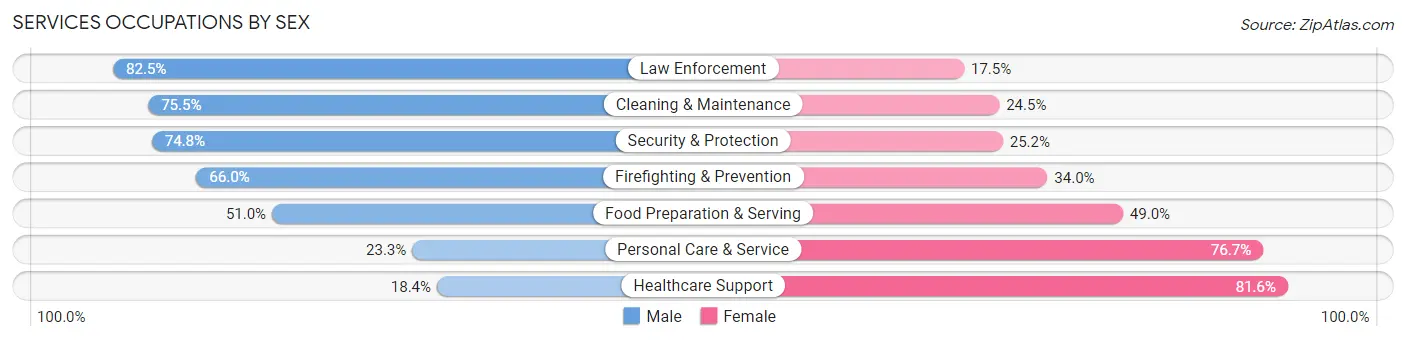
| Occupation | Male | Female |
| Healthcare Support | 416 (18.4%) | 1,848 (81.6%) |
| Security & Protection | 2,226 (74.8%) | 750 (25.2%) |
| Firefighting & Prevention | 913 (66.0%) | 471 (34.0%) |
| Law Enforcement | 1,313 (82.5%) | 279 (17.5%) |
| Food Preparation & Serving | 3,127 (51.0%) | 3,002 (49.0%) |
| Cleaning & Maintenance | 2,303 (75.5%) | 747 (24.5%) |
| Personal Care & Service | 865 (23.3%) | 2,853 (76.7%) |
| Total (Category) | 8,937 (49.3%) | 9,200 (50.7%) |
| Total (Overall) | 65,170 (52.1%) | 59,789 (47.8%) |
Sales and Office Occupations
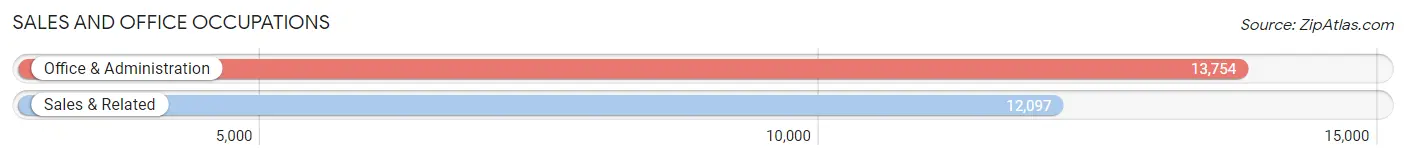
The most common Sales and Office occupations in Saratoga County are Office & Administration (13,754 | 11.0%), and Sales & Related (12,097 | 9.7%).
Sales and Office Occupations by Sex
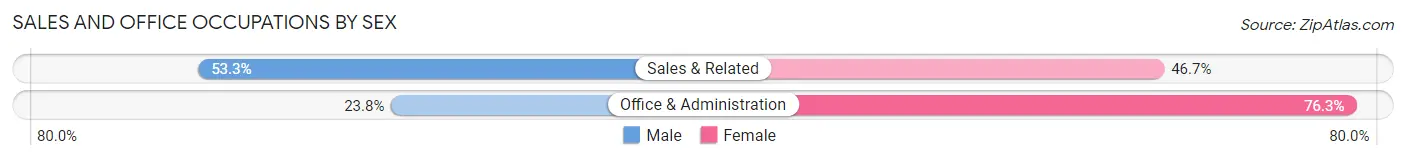
| Occupation | Male | Female |
| Sales & Related | 6,445 (53.3%) | 5,652 (46.7%) |
| Office & Administration | 3,266 (23.7%) | 10,488 (76.2%) |
| Total (Category) | 9,711 (37.6%) | 16,140 (62.4%) |
| Total (Overall) | 65,170 (52.1%) | 59,789 (47.8%) |
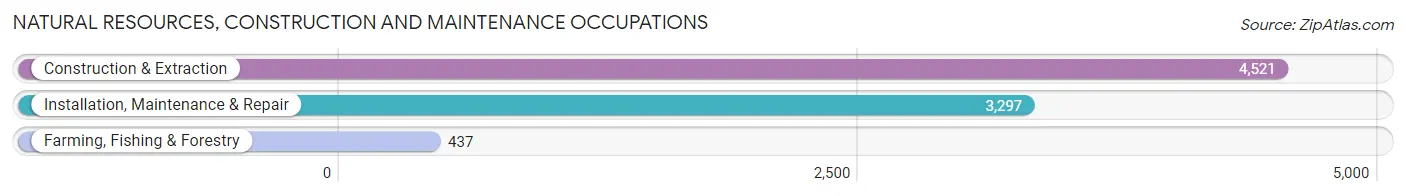
Natural Resources, Construction and Maintenance Occupations
The most common Natural Resources, Construction and Maintenance occupations in Saratoga County are Construction & Extraction (4,521 | 3.6%), Installation, Maintenance & Repair (3,297 | 2.6%), and Farming, Fishing & Forestry (437 | 0.4%).
Natural Resources, Construction and Maintenance Occupations by Sex
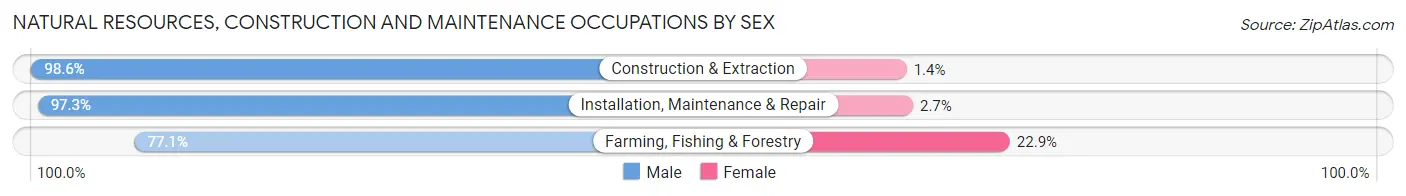
| Occupation | Male | Female |
| Farming, Fishing & Forestry | 337 (77.1%) | 100 (22.9%) |
| Construction & Extraction | 4,457 (98.6%) | 64 (1.4%) |
| Installation, Maintenance & Repair | 3,207 (97.3%) | 90 (2.7%) |
| Total (Category) | 8,001 (96.9%) | 254 (3.1%) |
| Total (Overall) | 65,170 (52.1%) | 59,789 (47.8%) |
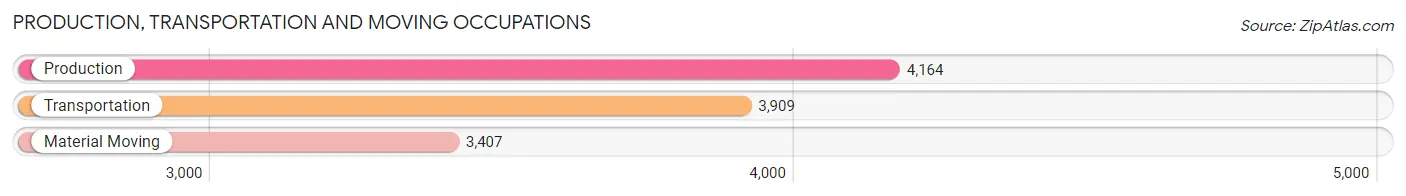
Production, Transportation and Moving Occupations
The most common Production, Transportation and Moving occupations in Saratoga County are Production (4,164 | 3.3%), Transportation (3,909 | 3.1%), and Material Moving (3,407 | 2.7%).
Production, Transportation and Moving Occupations by Sex
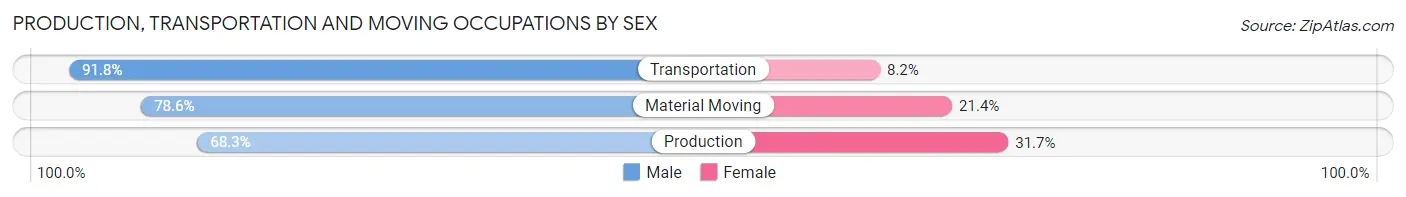
| Occupation | Male | Female |
| Production | 2,844 (68.3%) | 1,320 (31.7%) |
| Transportation | 3,590 (91.8%) | 319 (8.2%) |
| Material Moving | 2,678 (78.6%) | 729 (21.4%) |
| Total (Category) | 9,112 (79.4%) | 2,368 (20.6%) |
| Total (Overall) | 65,170 (52.1%) | 59,789 (47.8%) |
Employment Industries by Sex in Saratoga County
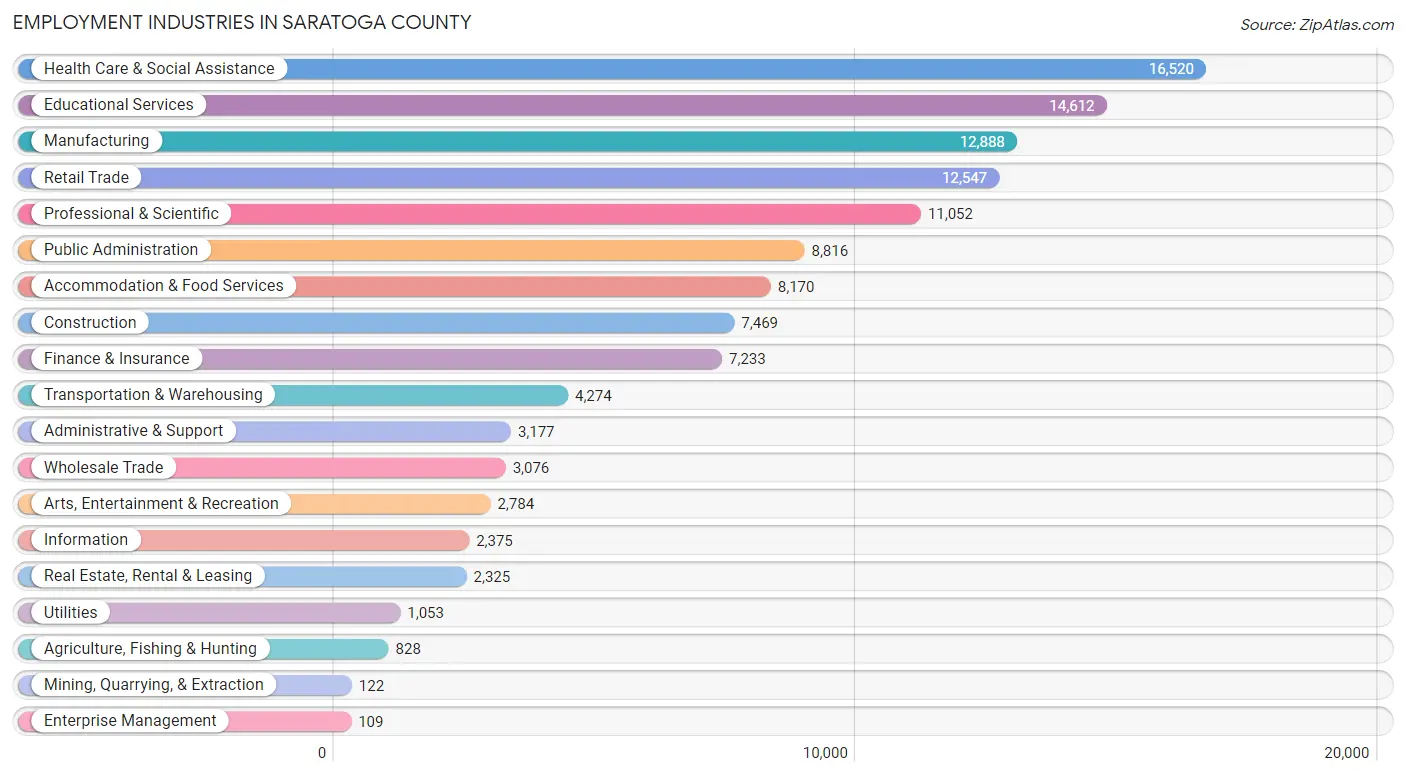
Employment Industries in Saratoga County
The major employment industries in Saratoga County include Health Care & Social Assistance (16,520 | 13.2%), Educational Services (14,612 | 11.7%), Manufacturing (12,888 | 10.3%), Retail Trade (12,547 | 10.0%), and Professional & Scientific (11,052 | 8.8%).
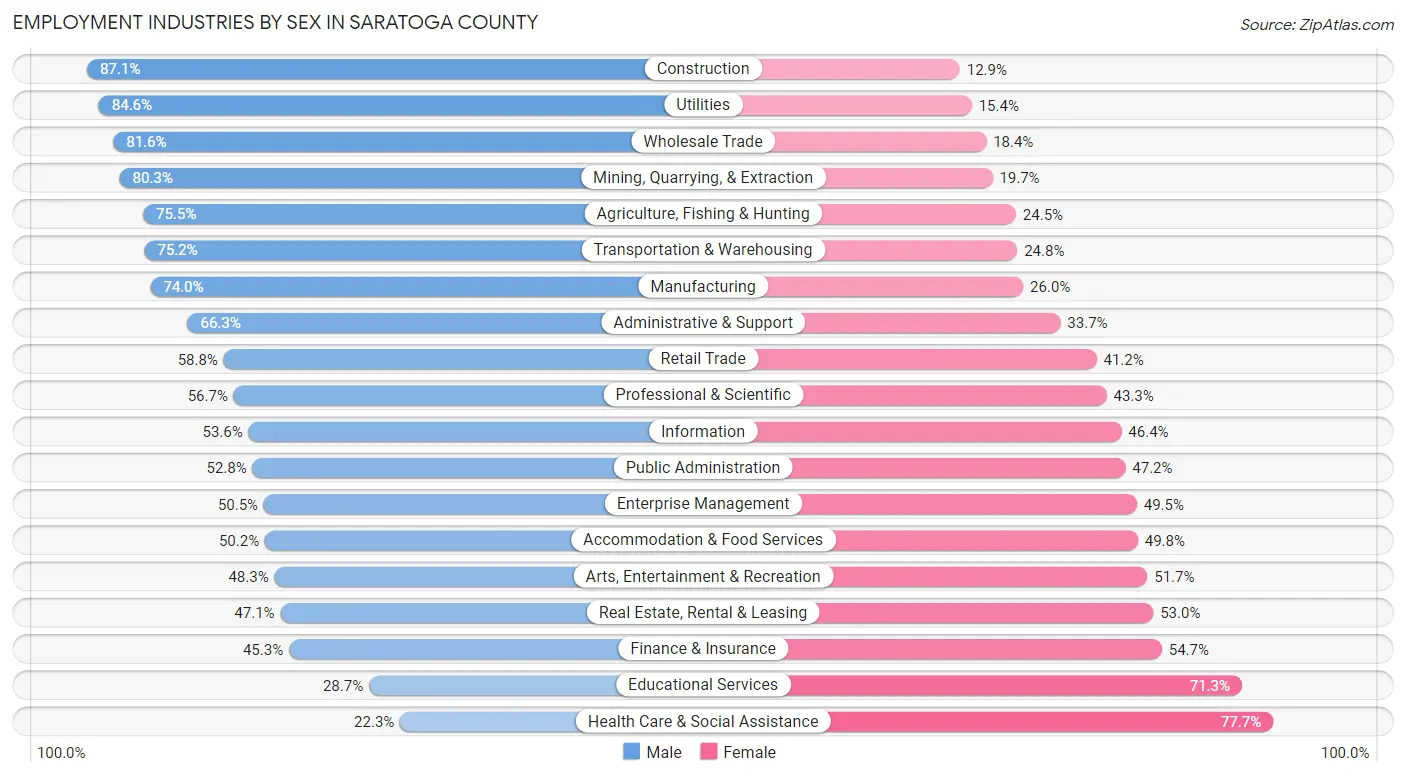
Employment Industries by Sex in Saratoga County
The Saratoga County industries that see more men than women are Construction (87.1%), Utilities (84.6%), and Wholesale Trade (81.6%), whereas the industries that tend to have a higher number of women are Health Care & Social Assistance (77.7%), Educational Services (71.3%), and Finance & Insurance (54.7%).
| Industry | Male | Female |
| Agriculture, Fishing & Hunting | 625 (75.5%) | 203 (24.5%) |
| Mining, Quarrying, & Extraction | 98 (80.3%) | 24 (19.7%) |
| Construction | 6,504 (87.1%) | 965 (12.9%) |
| Manufacturing | 9,533 (74.0%) | 3,355 (26.0%) |
| Wholesale Trade | 2,511 (81.6%) | 565 (18.4%) |
| Retail Trade | 7,376 (58.8%) | 5,171 (41.2%) |
| Transportation & Warehousing | 3,214 (75.2%) | 1,060 (24.8%) |
| Utilities | 891 (84.6%) | 162 (15.4%) |
| Information | 1,274 (53.6%) | 1,101 (46.4%) |
| Finance & Insurance | 3,275 (45.3%) | 3,958 (54.7%) |
| Real Estate, Rental & Leasing | 1,094 (47.0%) | 1,231 (52.9%) |
| Professional & Scientific | 6,268 (56.7%) | 4,784 (43.3%) |
| Enterprise Management | 55 (50.5%) | 54 (49.5%) |
| Administrative & Support | 2,105 (66.3%) | 1,072 (33.7%) |
| Educational Services | 4,196 (28.7%) | 10,416 (71.3%) |
| Health Care & Social Assistance | 3,677 (22.3%) | 12,843 (77.7%) |
| Arts, Entertainment & Recreation | 1,344 (48.3%) | 1,440 (51.7%) |
| Accommodation & Food Services | 4,105 (50.2%) | 4,065 (49.8%) |
| Public Administration | 4,657 (52.8%) | 4,159 (47.2%) |
| Total | 65,170 (52.1%) | 59,789 (47.8%) |
Education in Saratoga County
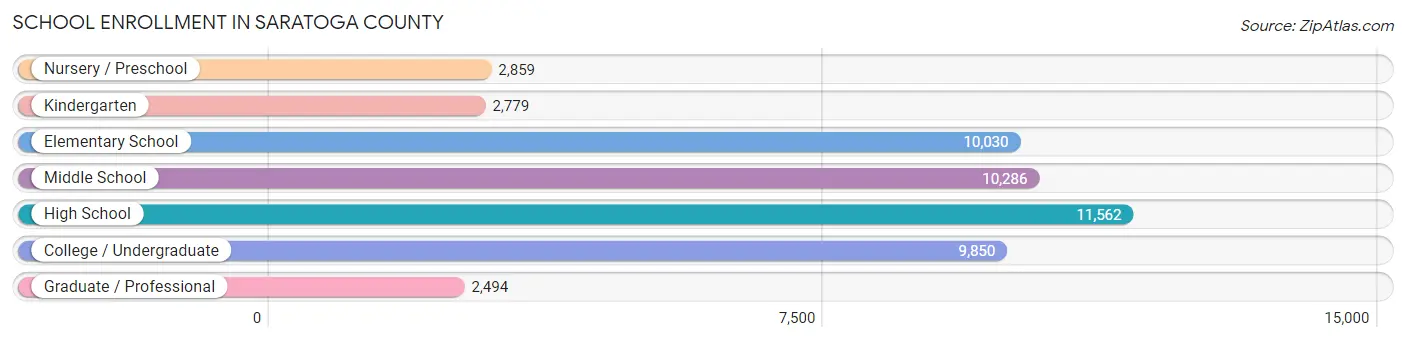
School Enrollment in Saratoga County
The most common levels of schooling among the 49,860 students in Saratoga County are high school (11,562 | 23.2%), middle school (10,286 | 20.6%), and elementary school (10,030 | 20.1%).
| School Level | # Students | % Students |
| Nursery / Preschool | 2,859 | 5.7% |
| Kindergarten | 2,779 | 5.6% |
| Elementary School | 10,030 | 20.1% |
| Middle School | 10,286 | 20.6% |
| High School | 11,562 | 23.2% |
| College / Undergraduate | 9,850 | 19.8% |
| Graduate / Professional | 2,494 | 5.0% |
| Total | 49,860 | 100.0% |
School Enrollment by Age by Funding Source in Saratoga County
Out of a total of 49,860 students who are enrolled in schools in Saratoga County, 9,922 (19.9%) attend a private institution, while the remaining 39,938 (80.1%) are enrolled in public schools. The age group of 3 to 4 year olds has the highest likelihood of being enrolled in private schools, with 1,296 (54.3% in the age bracket) enrolled. Conversely, the age group of 10 to 14 year olds has the lowest likelihood of being enrolled in a private school, with 11,890 (93.7% in the age bracket) attending a public institution.
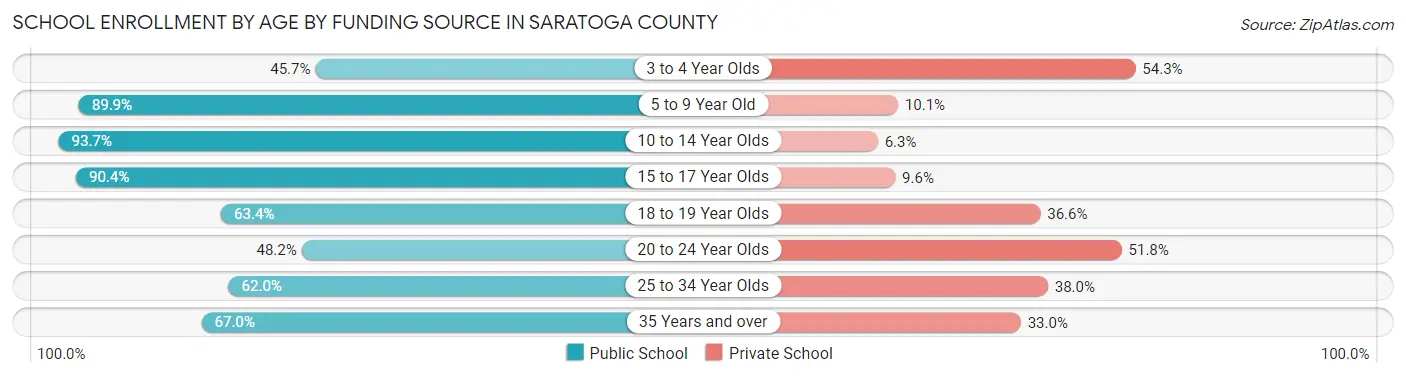
| Age Bracket | Public School | Private School |
| 3 to 4 Year Olds | 1,089 (45.7%) | 1,296 (54.3%) |
| 5 to 9 Year Old | 11,480 (89.9%) | 1,291 (10.1%) |
| 10 to 14 Year Olds | 11,890 (93.7%) | 805 (6.3%) |
| 15 to 17 Year Olds | 7,410 (90.4%) | 786 (9.6%) |
| 18 to 19 Year Olds | 3,013 (63.4%) | 1,741 (36.6%) |
| 20 to 24 Year Olds | 2,298 (48.2%) | 2,467 (51.8%) |
| 25 to 34 Year Olds | 1,265 (62.0%) | 776 (38.0%) |
| 35 Years and over | 1,510 (67.0%) | 743 (33.0%) |
| Total | 39,938 (80.1%) | 9,922 (19.9%) |
Educational Attainment by Field of Study in Saratoga County
Business (12,730 | 15.9%), education (10,360 | 12.9%), engineering (8,282 | 10.3%), science & technology (7,461 | 9.3%), and social sciences (7,325 | 9.1%) are the most common fields of study among 80,306 individuals in Saratoga County who have obtained a bachelor's degree or higher.
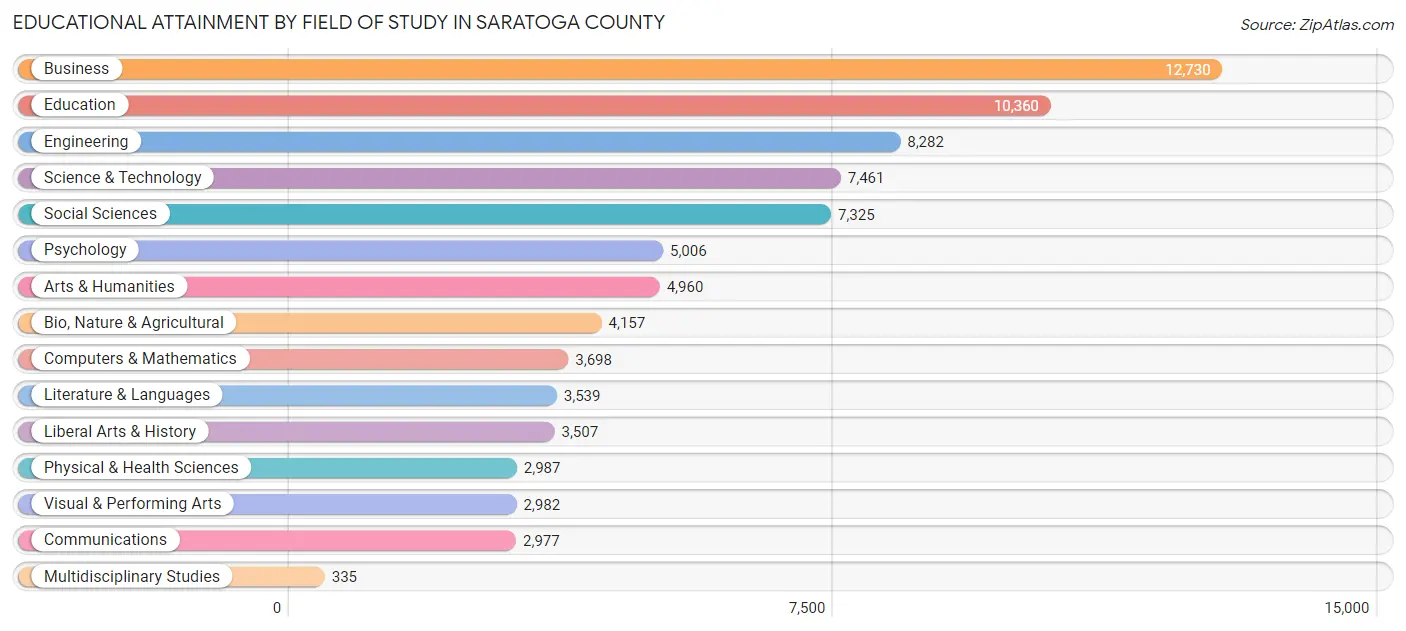
| Field of Study | # Graduates | % Graduates |
| Computers & Mathematics | 3,698 | 4.6% |
| Bio, Nature & Agricultural | 4,157 | 5.2% |
| Physical & Health Sciences | 2,987 | 3.7% |
| Psychology | 5,006 | 6.2% |
| Social Sciences | 7,325 | 9.1% |
| Engineering | 8,282 | 10.3% |
| Multidisciplinary Studies | 335 | 0.4% |
| Science & Technology | 7,461 | 9.3% |
| Business | 12,730 | 15.9% |
| Education | 10,360 | 12.9% |
| Literature & Languages | 3,539 | 4.4% |
| Liberal Arts & History | 3,507 | 4.4% |
| Visual & Performing Arts | 2,982 | 3.7% |
| Communications | 2,977 | 3.7% |
| Arts & Humanities | 4,960 | 6.2% |
| Total | 80,306 | 100.0% |
Transportation & Commute in Saratoga County
Vehicle Availability by Sex in Saratoga County
The most prevalent vehicle ownership categories in Saratoga County are males with 2 vehicles (31,172, accounting for 48.2%) and females with 2 vehicles (26,182, making up 53.9%).
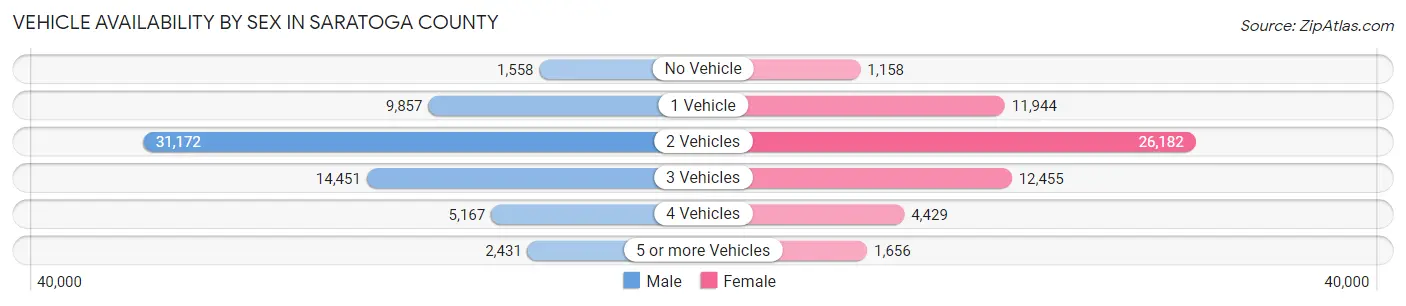
| Vehicles Available | Male | Female |
| No Vehicle | 1,558 (2.4%) | 1,158 (2.0%) |
| 1 Vehicle | 9,857 (15.2%) | 11,944 (20.7%) |
| 2 Vehicles | 31,172 (48.2%) | 26,182 (45.3%) |
| 3 Vehicles | 14,451 (22.4%) | 12,455 (21.5%) |
| 4 Vehicles | 5,167 (8.0%) | 4,429 (7.7%) |
| 5 or more Vehicles | 2,431 (3.8%) | 1,656 (2.9%) |
| Total | 64,636 (100.0%) | 57,824 (100.0%) |
Commute Time in Saratoga County
The most frequently occuring commute durations in Saratoga County are 20 to 24 minutes (16,228 commuters, 15.2%), 15 to 19 minutes (15,393 commuters, 14.4%), and 30 to 34 minutes (15,229 commuters, 14.2%).
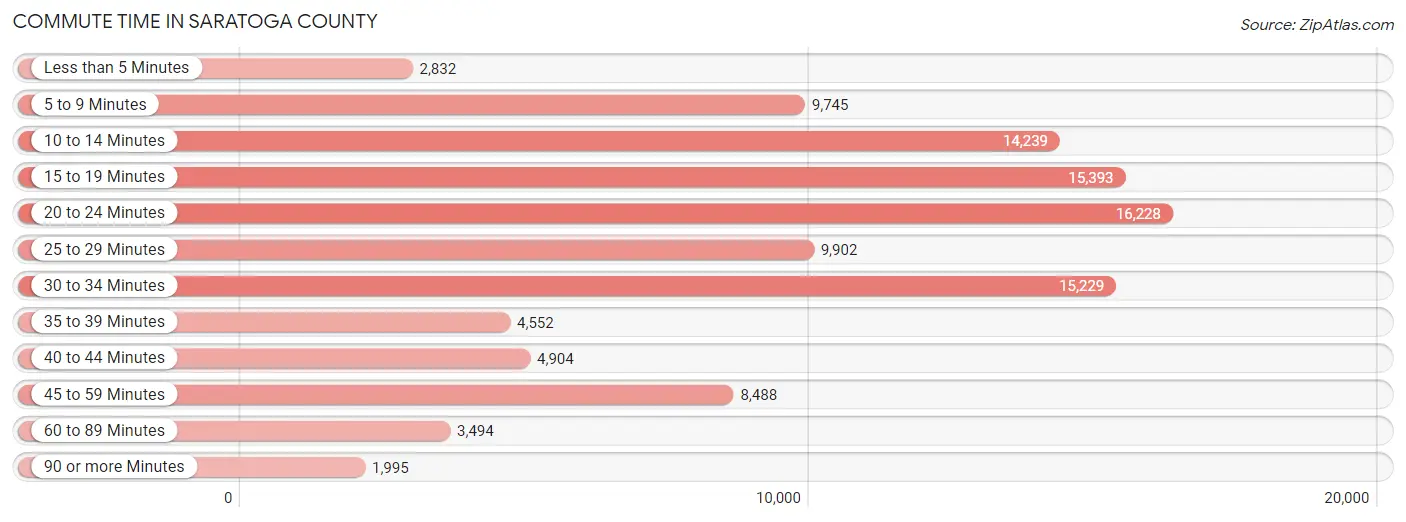
| Commute Time | # Commuters | % Commuters |
| Less than 5 Minutes | 2,832 | 2.6% |
| 5 to 9 Minutes | 9,745 | 9.1% |
| 10 to 14 Minutes | 14,239 | 13.3% |
| 15 to 19 Minutes | 15,393 | 14.4% |
| 20 to 24 Minutes | 16,228 | 15.2% |
| 25 to 29 Minutes | 9,902 | 9.2% |
| 30 to 34 Minutes | 15,229 | 14.2% |
| 35 to 39 Minutes | 4,552 | 4.3% |
| 40 to 44 Minutes | 4,904 | 4.6% |
| 45 to 59 Minutes | 8,488 | 7.9% |
| 60 to 89 Minutes | 3,494 | 3.3% |
| 90 or more Minutes | 1,995 | 1.9% |
Commute Time by Sex in Saratoga County
The most common commute times in Saratoga County are 20 to 24 minutes (8,777 commuters, 15.5%) for males and 15 to 19 minutes (7,807 commuters, 15.5%) for females.
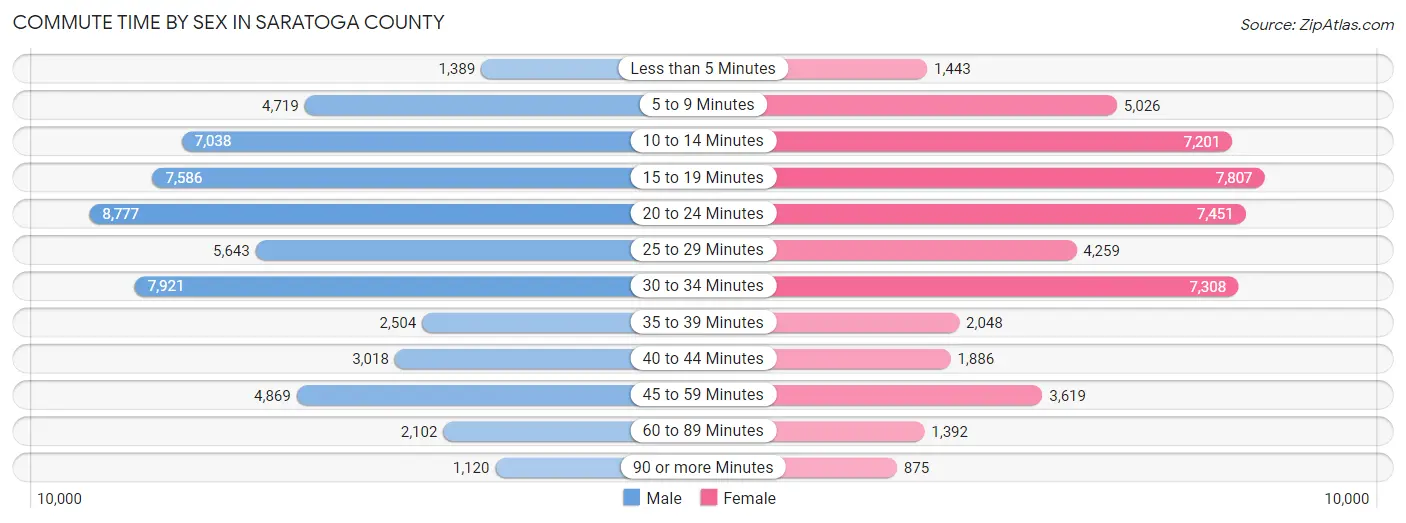
| Commute Time | Male | Female |
| Less than 5 Minutes | 1,389 (2.5%) | 1,443 (2.9%) |
| 5 to 9 Minutes | 4,719 (8.3%) | 5,026 (10.0%) |
| 10 to 14 Minutes | 7,038 (12.4%) | 7,201 (14.3%) |
| 15 to 19 Minutes | 7,586 (13.4%) | 7,807 (15.5%) |
| 20 to 24 Minutes | 8,777 (15.5%) | 7,451 (14.8%) |
| 25 to 29 Minutes | 5,643 (10.0%) | 4,259 (8.5%) |
| 30 to 34 Minutes | 7,921 (14.0%) | 7,308 (14.5%) |
| 35 to 39 Minutes | 2,504 (4.4%) | 2,048 (4.1%) |
| 40 to 44 Minutes | 3,018 (5.3%) | 1,886 (3.7%) |
| 45 to 59 Minutes | 4,869 (8.6%) | 3,619 (7.2%) |
| 60 to 89 Minutes | 2,102 (3.7%) | 1,392 (2.8%) |
| 90 or more Minutes | 1,120 (2.0%) | 875 (1.7%) |
Time of Departure to Work by Sex in Saratoga County
The most frequent times of departure to work in Saratoga County are 7:00 AM to 7:29 AM (8,972, 15.8%) for males and 7:00 AM to 7:29 AM (8,316, 16.5%) for females.
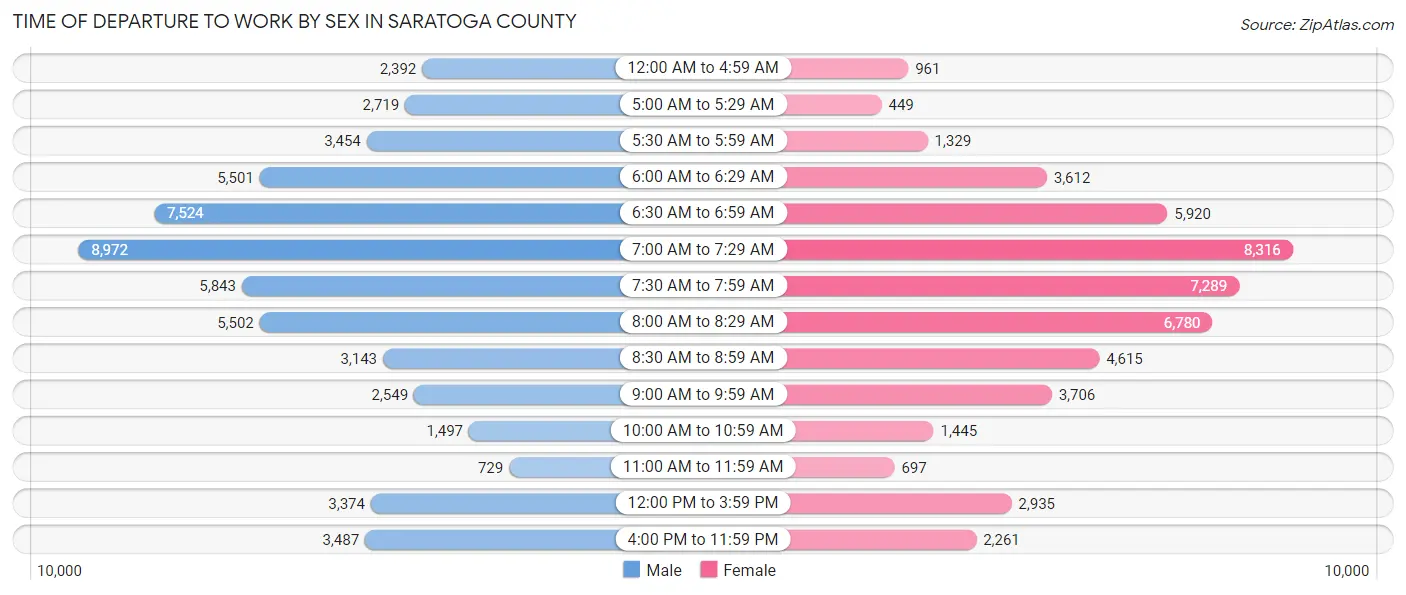
| Time of Departure | Male | Female |
| 12:00 AM to 4:59 AM | 2,392 (4.2%) | 961 (1.9%) |
| 5:00 AM to 5:29 AM | 2,719 (4.8%) | 449 (0.9%) |
| 5:30 AM to 5:59 AM | 3,454 (6.1%) | 1,329 (2.6%) |
| 6:00 AM to 6:29 AM | 5,501 (9.7%) | 3,612 (7.2%) |
| 6:30 AM to 6:59 AM | 7,524 (13.3%) | 5,920 (11.8%) |
| 7:00 AM to 7:29 AM | 8,972 (15.8%) | 8,316 (16.5%) |
| 7:30 AM to 7:59 AM | 5,843 (10.3%) | 7,289 (14.5%) |
| 8:00 AM to 8:29 AM | 5,502 (9.7%) | 6,780 (13.5%) |
| 8:30 AM to 8:59 AM | 3,143 (5.5%) | 4,615 (9.2%) |
| 9:00 AM to 9:59 AM | 2,549 (4.5%) | 3,706 (7.4%) |
| 10:00 AM to 10:59 AM | 1,497 (2.6%) | 1,445 (2.9%) |
| 11:00 AM to 11:59 AM | 729 (1.3%) | 697 (1.4%) |
| 12:00 PM to 3:59 PM | 3,374 (5.9%) | 2,935 (5.8%) |
| 4:00 PM to 11:59 PM | 3,487 (6.1%) | 2,261 (4.5%) |
| Total | 56,686 (100.0%) | 50,315 (100.0%) |
Housing Occupancy in Saratoga County
Occupancy by Ownership in Saratoga County
Of the total 98,409 dwellings in Saratoga County, owner-occupied units account for 70,909 (72.1%), while renter-occupied units make up 27,500 (27.9%).
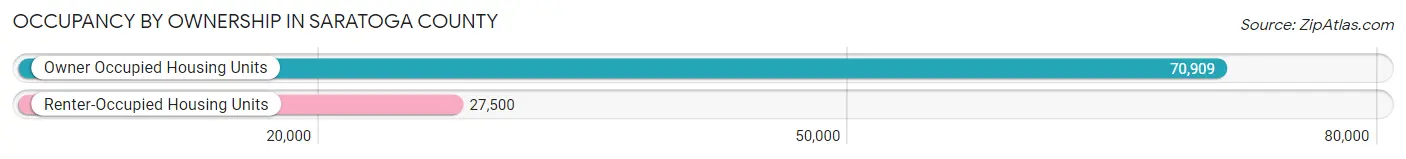
| Occupancy | # Housing Units | % Housing Units |
| Owner Occupied Housing Units | 70,909 | 72.1% |
| Renter-Occupied Housing Units | 27,500 | 27.9% |
| Total Occupied Housing Units | 98,409 | 100.0% |
Occupancy by Household Size in Saratoga County
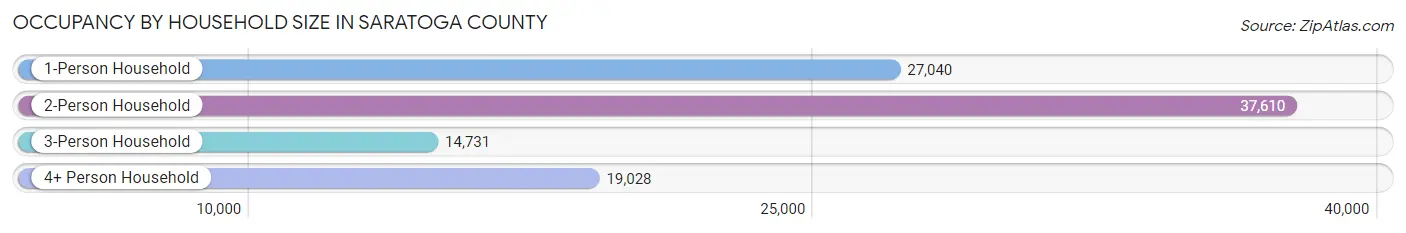
| Household Size | # Housing Units | % Housing Units |
| 1-Person Household | 27,040 | 27.5% |
| 2-Person Household | 37,610 | 38.2% |
| 3-Person Household | 14,731 | 15.0% |
| 4+ Person Household | 19,028 | 19.3% |
| Total Housing Units | 98,409 | 100.0% |
Occupancy by Ownership by Household Size in Saratoga County
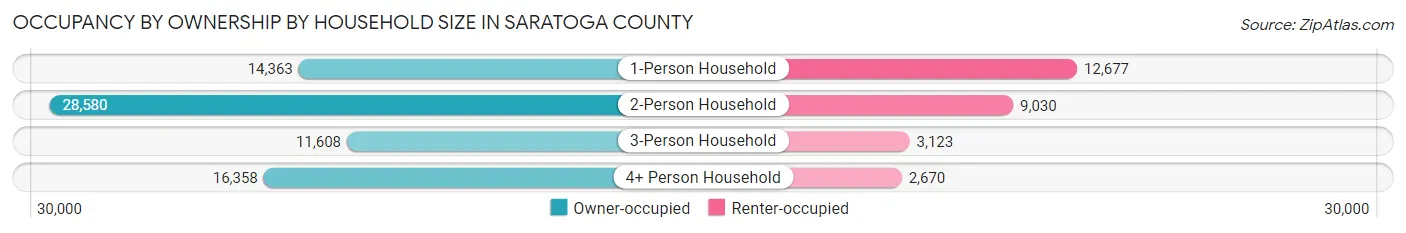
| Household Size | Owner-occupied | Renter-occupied |
| 1-Person Household | 14,363 (53.1%) | 12,677 (46.9%) |
| 2-Person Household | 28,580 (76.0%) | 9,030 (24.0%) |
| 3-Person Household | 11,608 (78.8%) | 3,123 (21.2%) |
| 4+ Person Household | 16,358 (86.0%) | 2,670 (14.0%) |
| Total Housing Units | 70,909 (72.1%) | 27,500 (27.9%) |
Occupancy by Educational Attainment in Saratoga County
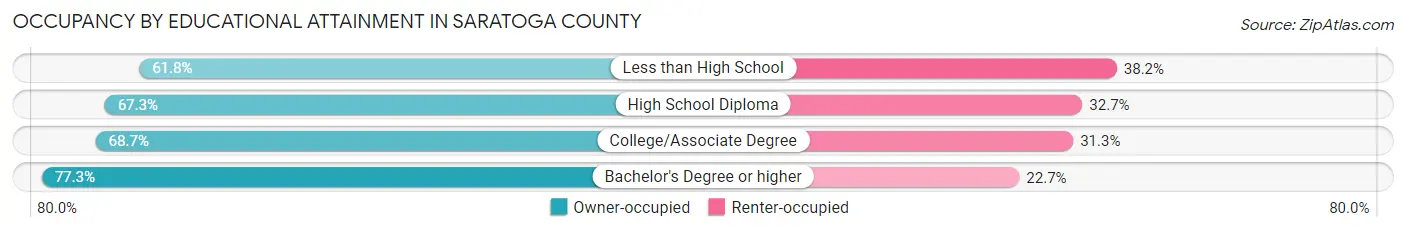
| Household Size | Owner-occupied | Renter-occupied |
| Less than High School | 2,866 (61.8%) | 1,770 (38.2%) |
| High School Diploma | 14,194 (67.3%) | 6,901 (32.7%) |
| College/Associate Degree | 18,653 (68.7%) | 8,484 (31.3%) |
| Bachelor's Degree or higher | 35,196 (77.3%) | 10,345 (22.7%) |
Occupancy by Age of Householder in Saratoga County
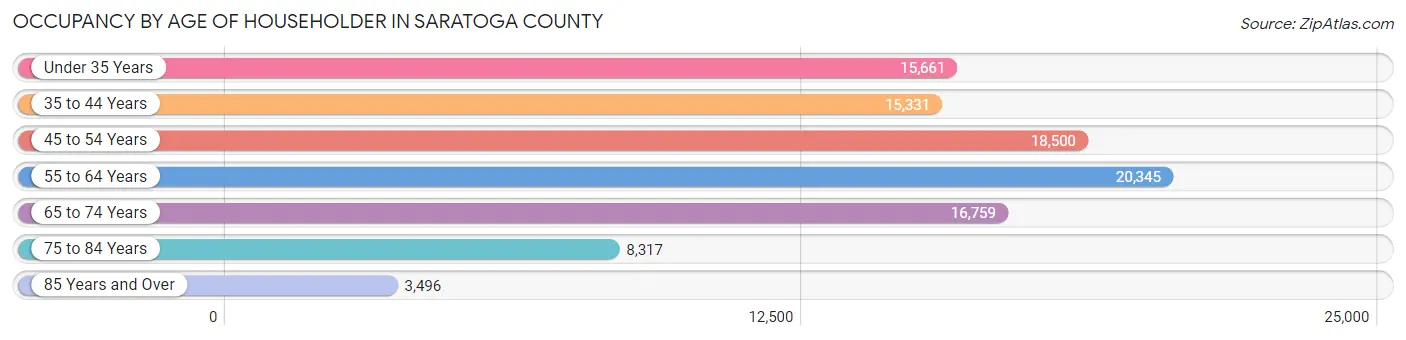
| Age Bracket | # Households | % Households |
| Under 35 Years | 15,661 | 15.9% |
| 35 to 44 Years | 15,331 | 15.6% |
| 45 to 54 Years | 18,500 | 18.8% |
| 55 to 64 Years | 20,345 | 20.7% |
| 65 to 74 Years | 16,759 | 17.0% |
| 75 to 84 Years | 8,317 | 8.5% |
| 85 Years and Over | 3,496 | 3.5% |
| Total | 98,409 | 100.0% |
Housing Finances in Saratoga County
Median Income by Occupancy in Saratoga County
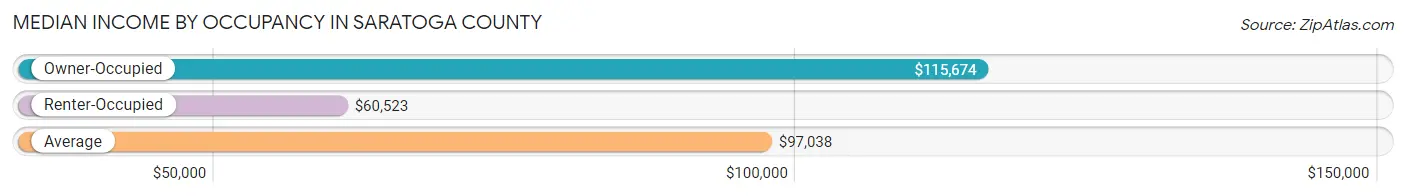
| Occupancy Type | # Households | Median Income |
| Owner-Occupied | 70,909 (72.1%) | $115,674 |
| Renter-Occupied | 27,500 (27.9%) | $60,523 |
| Average | 98,409 (100.0%) | $97,038 |
Occupancy by Householder Income Bracket in Saratoga County
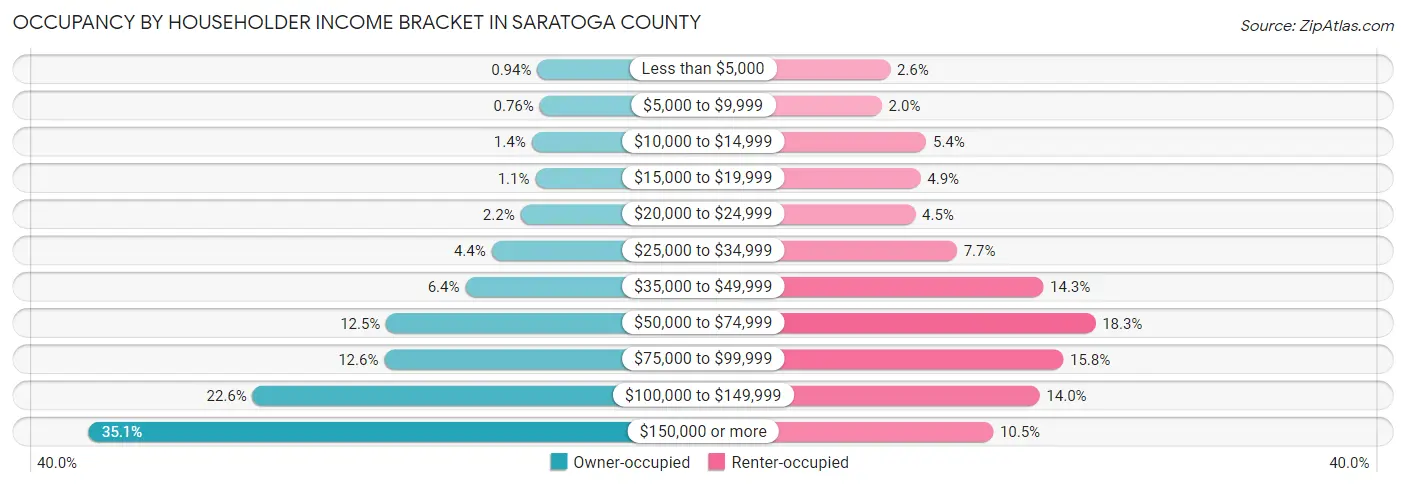
| Income Bracket | Owner-occupied | Renter-occupied |
| Less than $5,000 | 670 (0.9%) | 720 (2.6%) |
| $5,000 to $9,999 | 536 (0.8%) | 546 (2.0%) |
| $10,000 to $14,999 | 976 (1.4%) | 1,476 (5.4%) |
| $15,000 to $19,999 | 771 (1.1%) | 1,358 (4.9%) |
| $20,000 to $24,999 | 1,573 (2.2%) | 1,249 (4.5%) |
| $25,000 to $34,999 | 3,131 (4.4%) | 2,119 (7.7%) |
| $35,000 to $49,999 | 4,549 (6.4%) | 3,929 (14.3%) |
| $50,000 to $74,999 | 8,830 (12.4%) | 5,021 (18.3%) |
| $75,000 to $99,999 | 8,938 (12.6%) | 4,349 (15.8%) |
| $100,000 to $149,999 | 16,049 (22.6%) | 3,854 (14.0%) |
| $150,000 or more | 24,886 (35.1%) | 2,879 (10.5%) |
| Total | 70,909 (100.0%) | 27,500 (100.0%) |
Monthly Housing Cost Tiers in Saratoga County
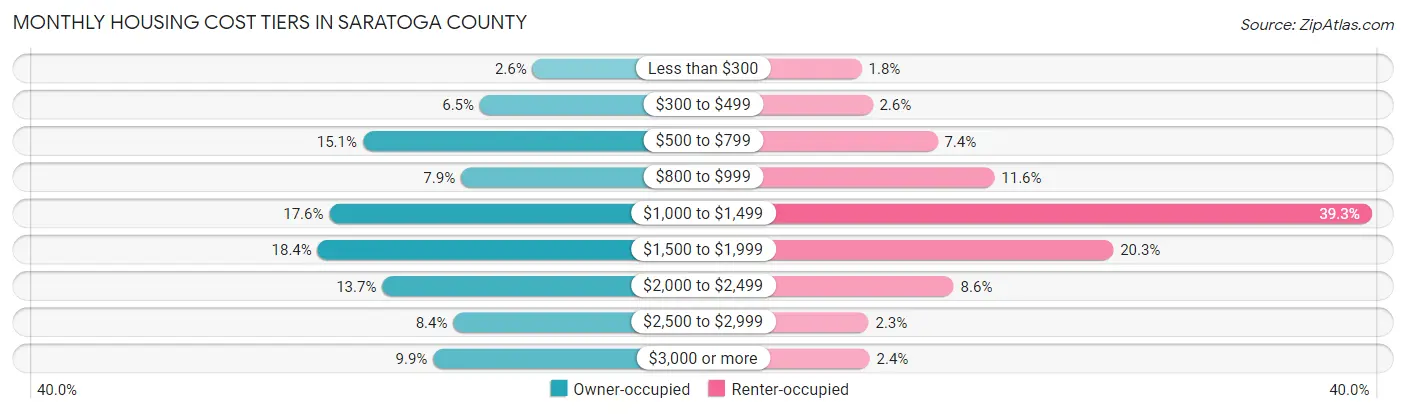
| Monthly Cost | Owner-occupied | Renter-occupied |
| Less than $300 | 1,833 (2.6%) | 489 (1.8%) |
| $300 to $499 | 4,588 (6.5%) | 710 (2.6%) |
| $500 to $799 | 10,700 (15.1%) | 2,028 (7.4%) |
| $800 to $999 | 5,576 (7.9%) | 3,179 (11.6%) |
| $1,000 to $1,499 | 12,453 (17.6%) | 10,817 (39.3%) |
| $1,500 to $1,999 | 13,064 (18.4%) | 5,585 (20.3%) |
| $2,000 to $2,499 | 9,685 (13.7%) | 2,355 (8.6%) |
| $2,500 to $2,999 | 5,981 (8.4%) | 630 (2.3%) |
| $3,000 or more | 7,029 (9.9%) | 652 (2.4%) |
| Total | 70,909 (100.0%) | 27,500 (100.0%) |
Physical Housing Characteristics in Saratoga County
Housing Structures in Saratoga County
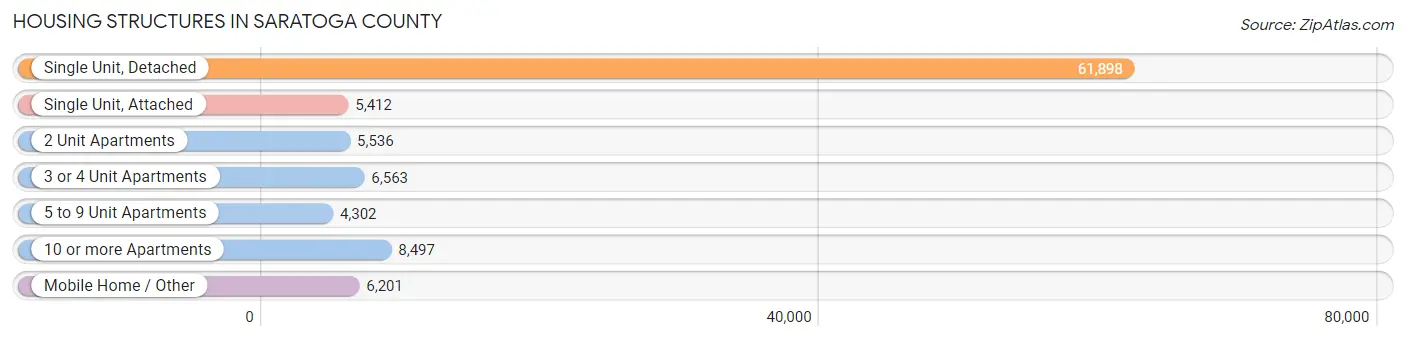
| Structure Type | # Housing Units | % Housing Units |
| Single Unit, Detached | 61,898 | 62.9% |
| Single Unit, Attached | 5,412 | 5.5% |
| 2 Unit Apartments | 5,536 | 5.6% |
| 3 or 4 Unit Apartments | 6,563 | 6.7% |
| 5 to 9 Unit Apartments | 4,302 | 4.4% |
| 10 or more Apartments | 8,497 | 8.6% |
| Mobile Home / Other | 6,201 | 6.3% |
| Total | 98,409 | 100.0% |
Housing Structures by Occupancy in Saratoga County
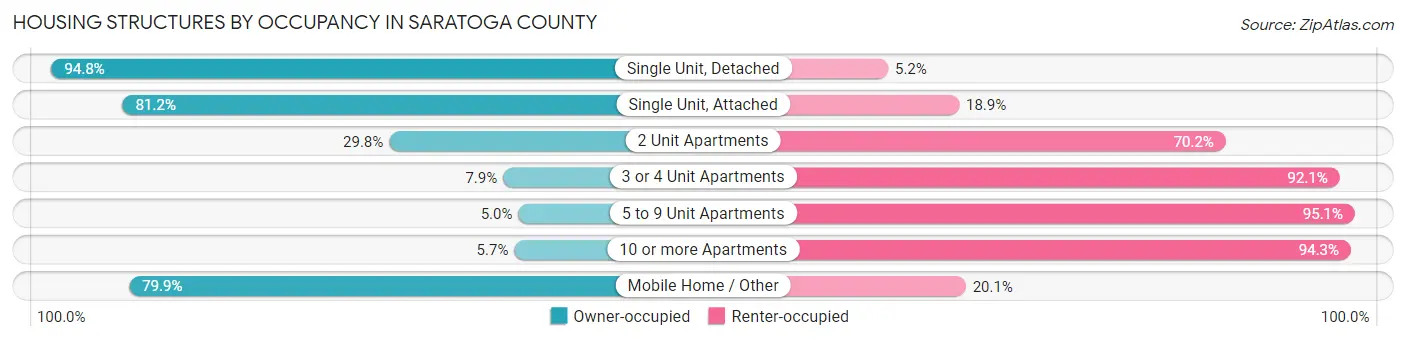
| Structure Type | Owner-occupied | Renter-occupied |
| Single Unit, Detached | 58,697 (94.8%) | 3,201 (5.2%) |
| Single Unit, Attached | 4,392 (81.1%) | 1,020 (18.9%) |
| 2 Unit Apartments | 1,651 (29.8%) | 3,885 (70.2%) |
| 3 or 4 Unit Apartments | 517 (7.9%) | 6,046 (92.1%) |
| 5 to 9 Unit Apartments | 213 (5.0%) | 4,089 (95.1%) |
| 10 or more Apartments | 486 (5.7%) | 8,011 (94.3%) |
| Mobile Home / Other | 4,953 (79.9%) | 1,248 (20.1%) |
| Total | 70,909 (72.1%) | 27,500 (27.9%) |
Housing Structures by Number of Rooms in Saratoga County
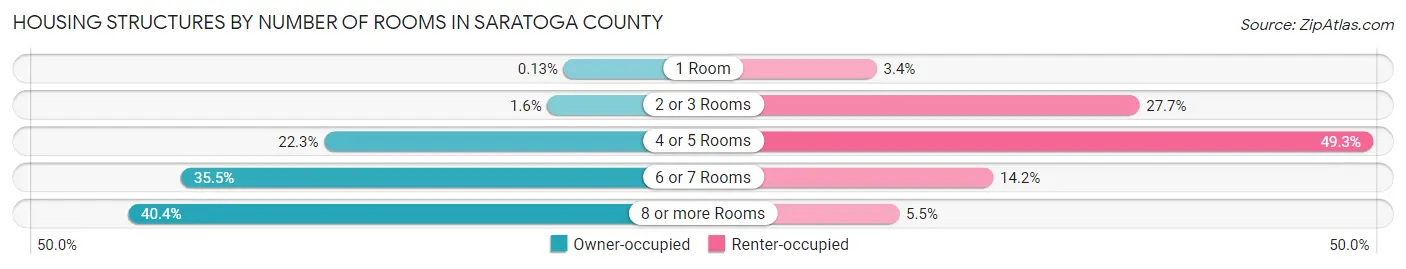
| Number of Rooms | Owner-occupied | Renter-occupied |
| 1 Room | 95 (0.1%) | 933 (3.4%) |
| 2 or 3 Rooms | 1,154 (1.6%) | 7,615 (27.7%) |
| 4 or 5 Rooms | 15,796 (22.3%) | 13,548 (49.3%) |
| 6 or 7 Rooms | 25,204 (35.5%) | 3,898 (14.2%) |
| 8 or more Rooms | 28,660 (40.4%) | 1,506 (5.5%) |
| Total | 70,909 (100.0%) | 27,500 (100.0%) |
Housing Structure by Heating Type in Saratoga County
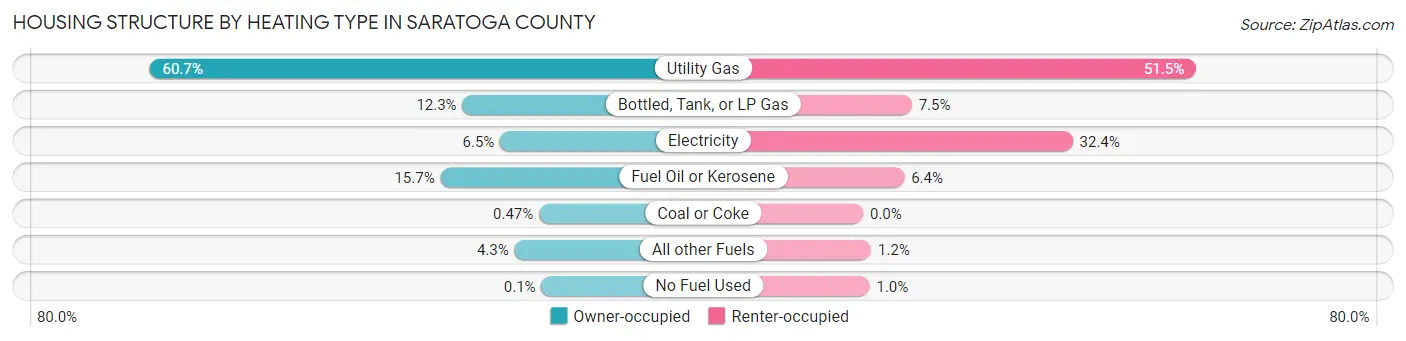
| Heating Type | Owner-occupied | Renter-occupied |
| Utility Gas | 43,026 (60.7%) | 14,155 (51.5%) |
| Bottled, Tank, or LP Gas | 8,730 (12.3%) | 2,072 (7.5%) |
| Electricity | 4,597 (6.5%) | 8,910 (32.4%) |
| Fuel Oil or Kerosene | 11,142 (15.7%) | 1,748 (6.4%) |
| Coal or Coke | 331 (0.5%) | 0 (0.0%) |
| All other Fuels | 3,011 (4.3%) | 340 (1.2%) |
| No Fuel Used | 72 (0.1%) | 275 (1.0%) |
| Total | 70,909 (100.0%) | 27,500 (100.0%) |
Household Vehicle Usage in Saratoga County
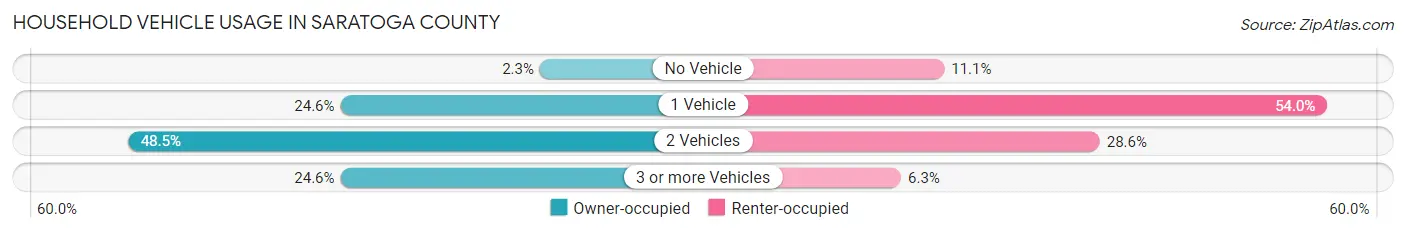
| Vehicles per Household | Owner-occupied | Renter-occupied |
| No Vehicle | 1,623 (2.3%) | 3,062 (11.1%) |
| 1 Vehicle | 17,468 (24.6%) | 14,856 (54.0%) |
| 2 Vehicles | 34,352 (48.4%) | 7,852 (28.5%) |
| 3 or more Vehicles | 17,466 (24.6%) | 1,730 (6.3%) |
| Total | 70,909 (100.0%) | 27,500 (100.0%) |
Real Estate & Mortgages in Saratoga County
Real Estate and Mortgage Overview in Saratoga County
| Characteristic | Without Mortgage | With Mortgage |
| Housing Units | 25,574 | 45,335 |
| Median Property Value | $276,600 | $322,900 |
| Median Household Income | $80,420 | $19,245 |
| Monthly Housing Costs | $709 | $6,926 |
| Real Estate Taxes | $4,125 | $1,976 |
Property Value by Mortgage Status in Saratoga County
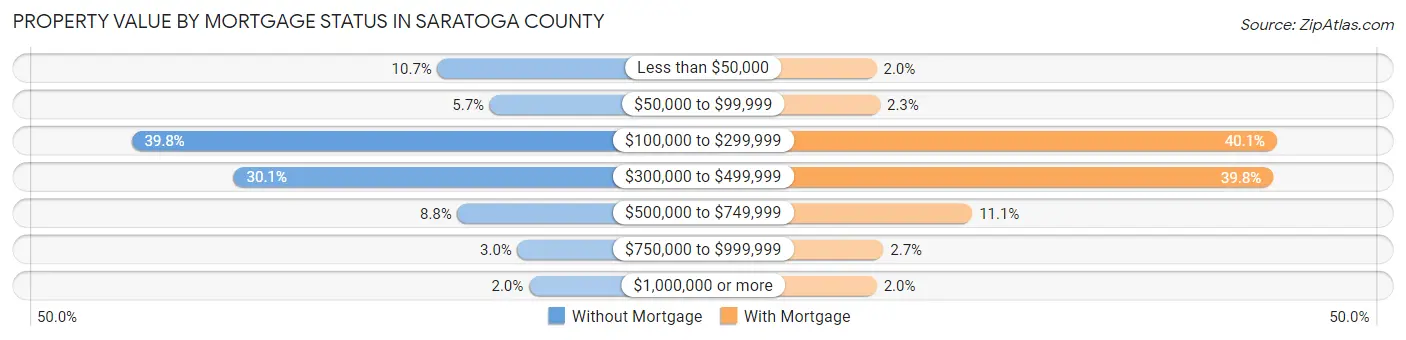
| Property Value | Without Mortgage | With Mortgage |
| Less than $50,000 | 2,725 (10.7%) | 906 (2.0%) |
| $50,000 to $99,999 | 1,453 (5.7%) | 1,057 (2.3%) |
| $100,000 to $299,999 | 10,184 (39.8%) | 18,191 (40.1%) |
| $300,000 to $499,999 | 7,696 (30.1%) | 18,029 (39.8%) |
| $500,000 to $749,999 | 2,240 (8.8%) | 5,035 (11.1%) |
| $750,000 to $999,999 | 778 (3.0%) | 1,201 (2.6%) |
| $1,000,000 or more | 498 (1.9%) | 916 (2.0%) |
| Total | 25,574 (100.0%) | 45,335 (100.0%) |
Household Income by Mortgage Status in Saratoga County
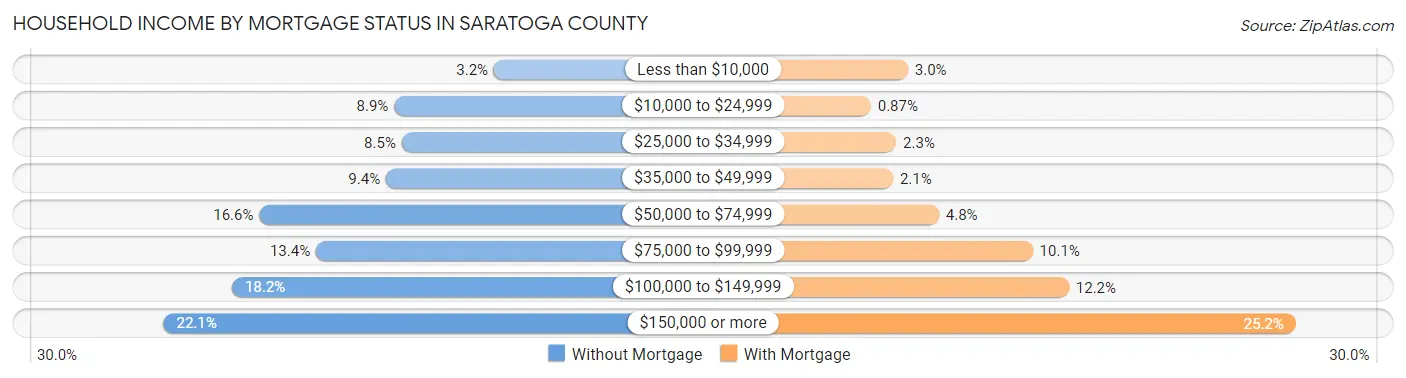
| Household Income | Without Mortgage | With Mortgage |
| Less than $10,000 | 812 (3.2%) | 1,357 (3.0%) |
| $10,000 to $24,999 | 2,270 (8.9%) | 394 (0.9%) |
| $25,000 to $34,999 | 2,160 (8.5%) | 1,050 (2.3%) |
| $35,000 to $49,999 | 2,392 (9.3%) | 971 (2.1%) |
| $50,000 to $74,999 | 4,244 (16.6%) | 2,157 (4.8%) |
| $75,000 to $99,999 | 3,413 (13.4%) | 4,586 (10.1%) |
| $100,000 to $149,999 | 4,642 (18.1%) | 5,525 (12.2%) |
| $150,000 or more | 5,641 (22.1%) | 11,407 (25.2%) |
| Total | 25,574 (100.0%) | 45,335 (100.0%) |
Property Value to Household Income Ratio in Saratoga County
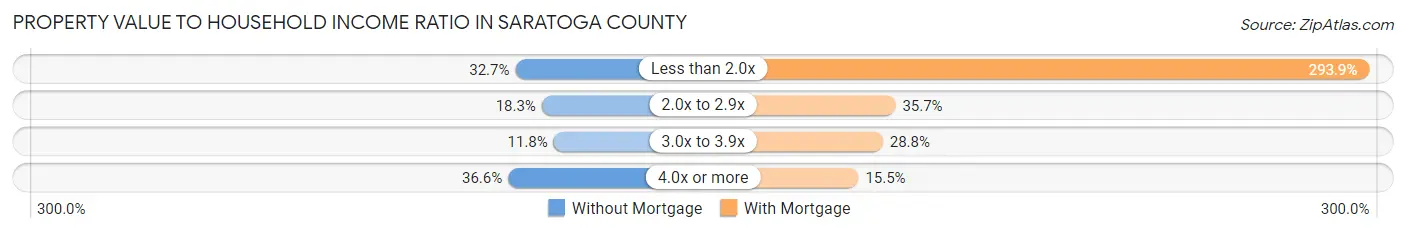
| Value-to-Income Ratio | Without Mortgage | With Mortgage |
| Less than 2.0x | 8,350 (32.7%) | 133,215 (293.8%) |
| 2.0x to 2.9x | 4,673 (18.3%) | 16,183 (35.7%) |
| 3.0x to 3.9x | 3,014 (11.8%) | 13,055 (28.8%) |
| 4.0x or more | 9,366 (36.6%) | 7,045 (15.5%) |
| Total | 25,574 (100.0%) | 45,335 (100.0%) |
Real Estate Taxes by Mortgage Status in Saratoga County
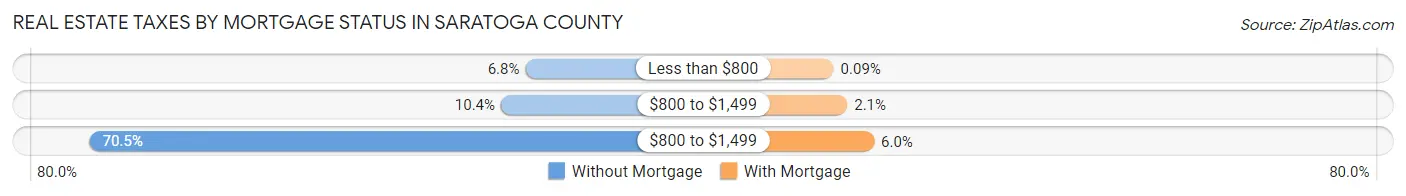
| Property Taxes | Without Mortgage | With Mortgage |
| Less than $800 | 1,750 (6.8%) | 39 (0.1%) |
| $800 to $1,499 | 2,661 (10.4%) | 941 (2.1%) |
| $800 to $1,499 | 18,031 (70.5%) | 2,720 (6.0%) |
| Total | 25,574 (100.0%) | 45,335 (100.0%) |
Health & Disability in Saratoga County
Health Insurance Coverage by Age in Saratoga County
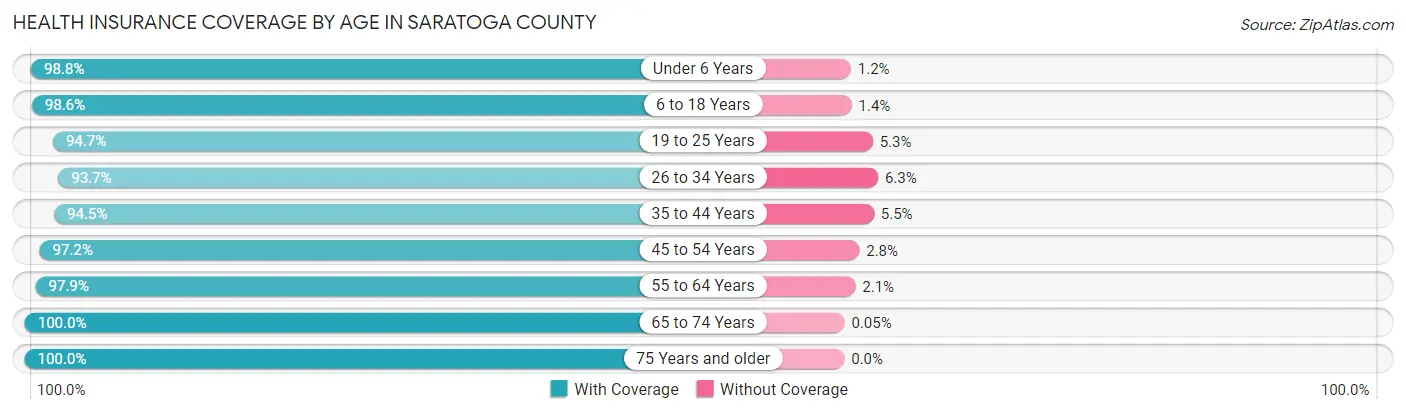
| Age Bracket | With Coverage | Without Coverage |
| Under 6 Years | 13,305 (98.8%) | 164 (1.2%) |
| 6 to 18 Years | 34,796 (98.6%) | 481 (1.4%) |
| 19 to 25 Years | 17,833 (94.7%) | 998 (5.3%) |
| 26 to 34 Years | 23,650 (93.7%) | 1,587 (6.3%) |
| 35 to 44 Years | 28,084 (94.5%) | 1,639 (5.5%) |
| 45 to 54 Years | 31,812 (97.2%) | 914 (2.8%) |
| 55 to 64 Years | 34,261 (97.9%) | 722 (2.1%) |
| 65 to 74 Years | 26,724 (100.0%) | 13 (0.1%) |
| 75 Years and older | 17,411 (100.0%) | 0 (0.0%) |
| Total | 227,876 (97.2%) | 6,518 (2.8%) |
Health Insurance Coverage by Citizenship Status in Saratoga County
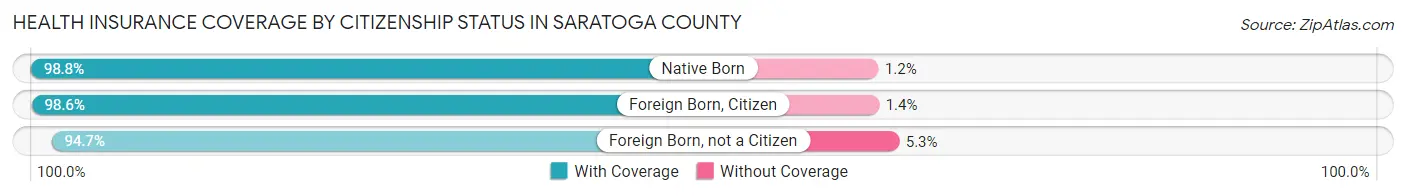
| Citizenship Status | With Coverage | Without Coverage |
| Native Born | 13,305 (98.8%) | 164 (1.2%) |
| Foreign Born, Citizen | 34,796 (98.6%) | 481 (1.4%) |
| Foreign Born, not a Citizen | 17,833 (94.7%) | 998 (5.3%) |
Health Insurance Coverage by Household Income in Saratoga County
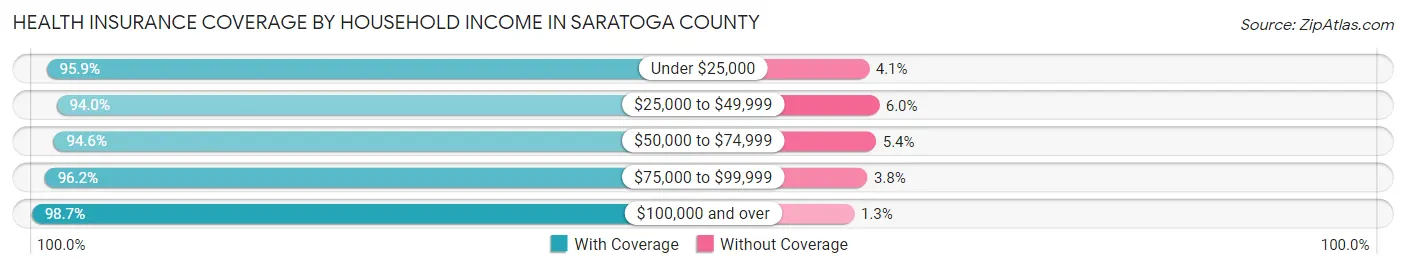
| Household Income | With Coverage | Without Coverage |
| Under $25,000 | 14,115 (95.9%) | 606 (4.1%) |
| $25,000 to $49,999 | 22,384 (94.0%) | 1,425 (6.0%) |
| $50,000 to $74,999 | 26,601 (94.6%) | 1,527 (5.4%) |
| $75,000 to $99,999 | 28,612 (96.2%) | 1,123 (3.8%) |
| $100,000 and over | 133,372 (98.7%) | 1,805 (1.3%) |
Public vs Private Health Insurance Coverage by Age in Saratoga County
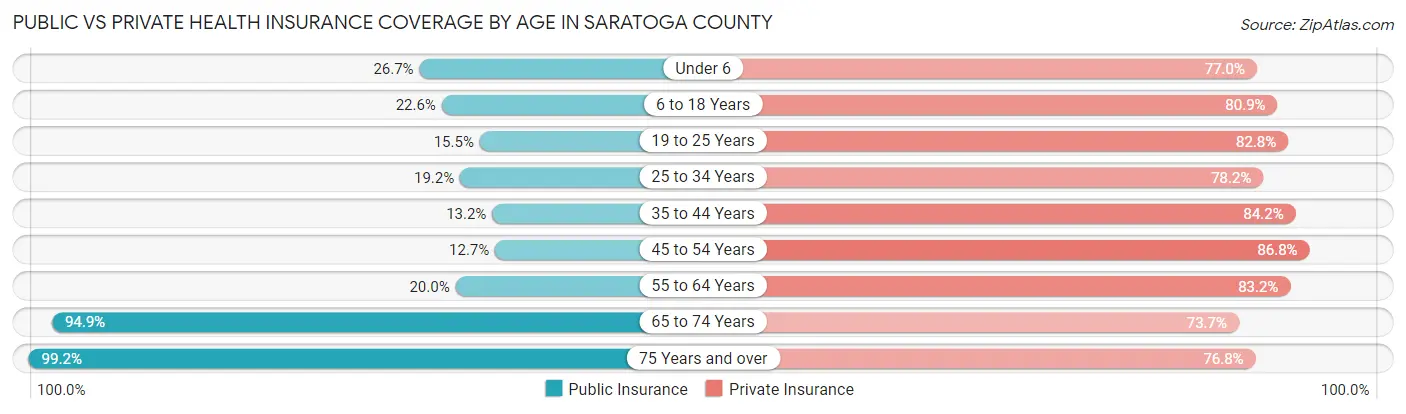
| Age Bracket | Public Insurance | Private Insurance |
| Under 6 | 3,597 (26.7%) | 10,374 (77.0%) |
| 6 to 18 Years | 7,967 (22.6%) | 28,522 (80.8%) |
| 19 to 25 Years | 2,922 (15.5%) | 15,595 (82.8%) |
| 25 to 34 Years | 4,838 (19.2%) | 19,740 (78.2%) |
| 35 to 44 Years | 3,926 (13.2%) | 25,030 (84.2%) |
| 45 to 54 Years | 4,147 (12.7%) | 28,405 (86.8%) |
| 55 to 64 Years | 7,004 (20.0%) | 29,113 (83.2%) |
| 65 to 74 Years | 25,380 (94.9%) | 19,702 (73.7%) |
| 75 Years and over | 17,278 (99.2%) | 13,367 (76.8%) |
| Total | 77,059 (32.9%) | 189,848 (81.0%) |
Disability Status by Sex by Age in Saratoga County
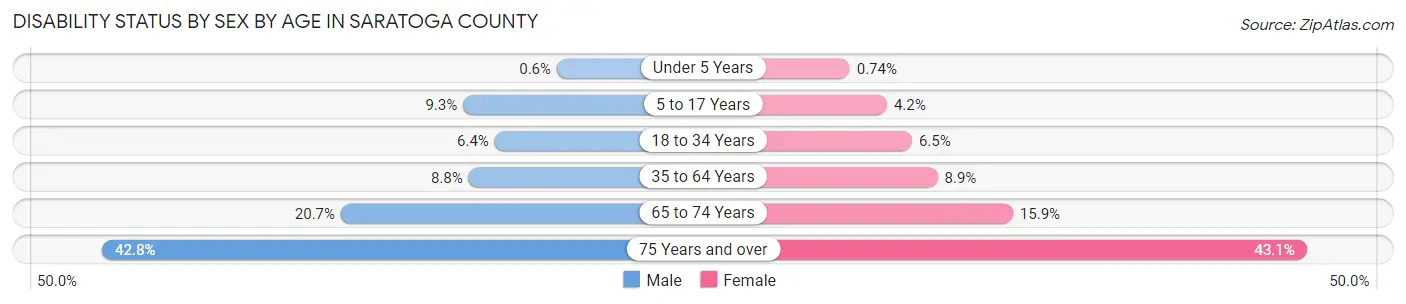
| Age Bracket | Male | Female |
| Under 5 Years | 34 (0.6%) | 40 (0.7%) |
| 5 to 17 Years | 1,646 (9.3%) | 713 (4.2%) |
| 18 to 34 Years | 1,528 (6.4%) | 1,503 (6.5%) |
| 35 to 64 Years | 4,277 (8.8%) | 4,344 (8.9%) |
| 65 to 74 Years | 2,643 (20.6%) | 2,213 (15.9%) |
| 75 Years and over | 3,189 (42.8%) | 4,296 (43.1%) |
Disability Class by Sex by Age in Saratoga County
Disability Class: Hearing Difficulty
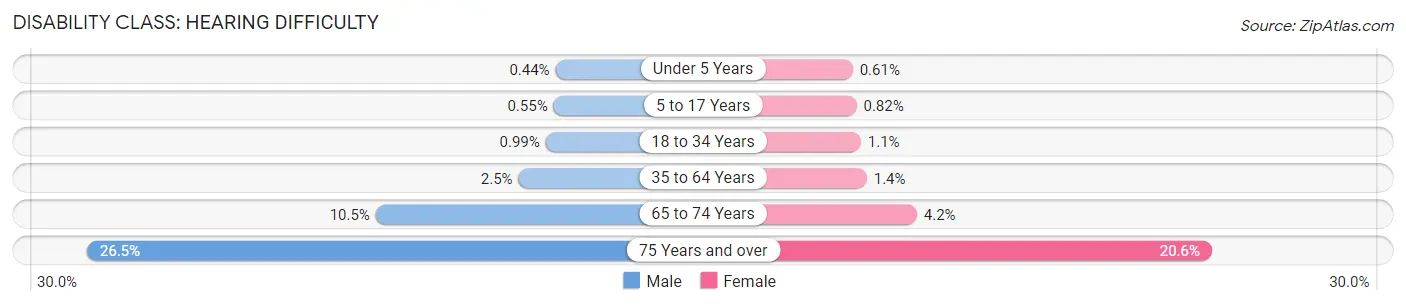
| Age Bracket | Male | Female |
| Under 5 Years | 25 (0.4%) | 33 (0.6%) |
| 5 to 17 Years | 97 (0.5%) | 139 (0.8%) |
| 18 to 34 Years | 238 (1.0%) | 245 (1.1%) |
| 35 to 64 Years | 1,214 (2.5%) | 681 (1.4%) |
| 65 to 74 Years | 1,338 (10.4%) | 582 (4.2%) |
| 75 Years and over | 1,977 (26.5%) | 2,052 (20.6%) |
Disability Class: Vision Difficulty
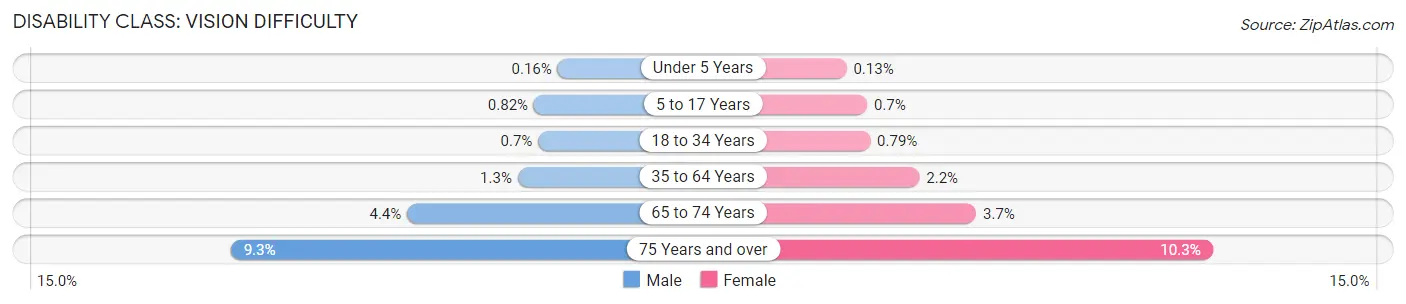
| Age Bracket | Male | Female |
| Under 5 Years | 9 (0.2%) | 7 (0.1%) |
| 5 to 17 Years | 145 (0.8%) | 119 (0.7%) |
| 18 to 34 Years | 167 (0.7%) | 182 (0.8%) |
| 35 to 64 Years | 616 (1.3%) | 1,056 (2.2%) |
| 65 to 74 Years | 557 (4.3%) | 521 (3.7%) |
| 75 Years and over | 690 (9.3%) | 1,028 (10.3%) |
Disability Class: Cognitive Difficulty
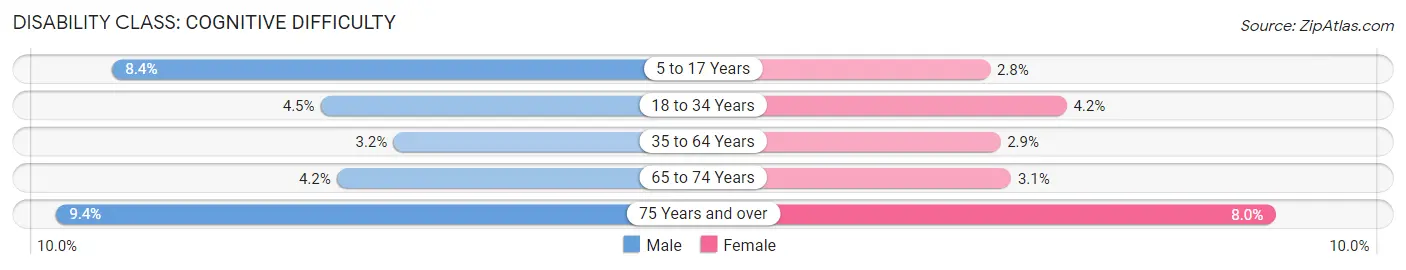
| Age Bracket | Male | Female |
| 5 to 17 Years | 1,480 (8.4%) | 469 (2.8%) |
| 18 to 34 Years | 1,080 (4.5%) | 963 (4.2%) |
| 35 to 64 Years | 1,534 (3.2%) | 1,437 (2.9%) |
| 65 to 74 Years | 539 (4.2%) | 437 (3.1%) |
| 75 Years and over | 701 (9.4%) | 801 (8.0%) |
Disability Class: Ambulatory Difficulty
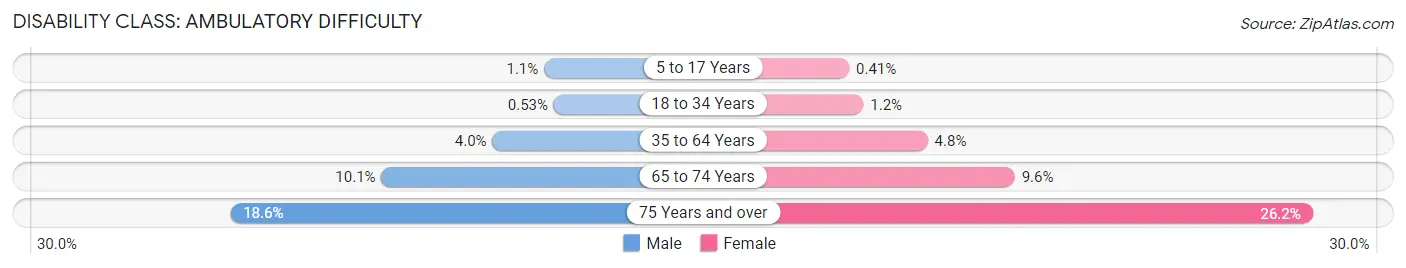
| Age Bracket | Male | Female |
| 5 to 17 Years | 190 (1.1%) | 69 (0.4%) |
| 18 to 34 Years | 128 (0.5%) | 278 (1.2%) |
| 35 to 64 Years | 1,920 (4.0%) | 2,337 (4.8%) |
| 65 to 74 Years | 1,297 (10.1%) | 1,342 (9.6%) |
| 75 Years and over | 1,382 (18.5%) | 2,611 (26.2%) |
Disability Class: Self-Care Difficulty
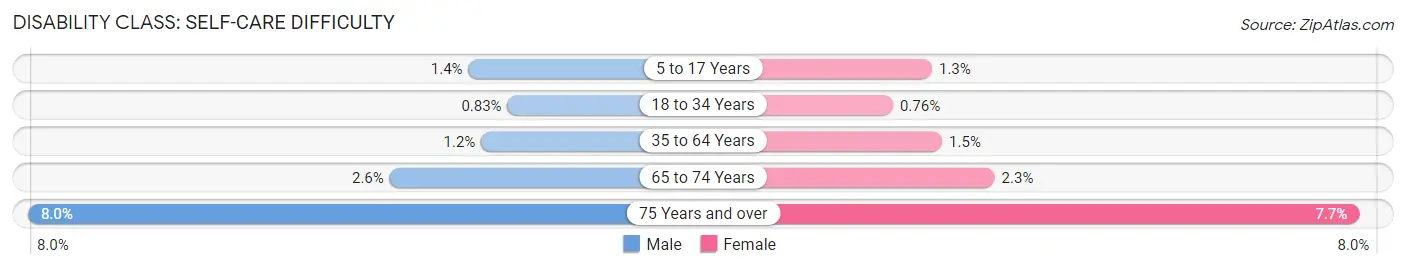
| Age Bracket | Male | Female |
| 5 to 17 Years | 250 (1.4%) | 229 (1.3%) |
| 18 to 34 Years | 199 (0.8%) | 176 (0.8%) |
| 35 to 64 Years | 594 (1.2%) | 728 (1.5%) |
| 65 to 74 Years | 330 (2.6%) | 316 (2.3%) |
| 75 Years and over | 592 (8.0%) | 765 (7.7%) |
Technology Access in Saratoga County
Computing Device Access in Saratoga County
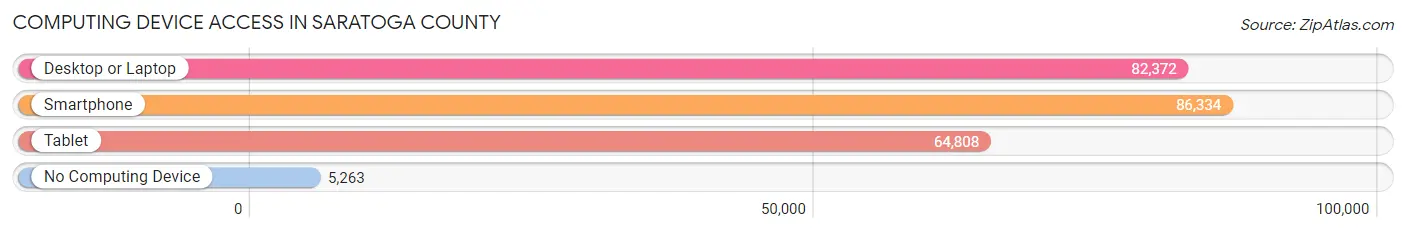
| Device Type | # Households | % Households |
| Desktop or Laptop | 82,372 | 83.7% |
| Smartphone | 86,334 | 87.7% |
| Tablet | 64,808 | 65.9% |
| No Computing Device | 5,263 | 5.3% |
| Total | 98,409 | 100.0% |
Internet Access in Saratoga County
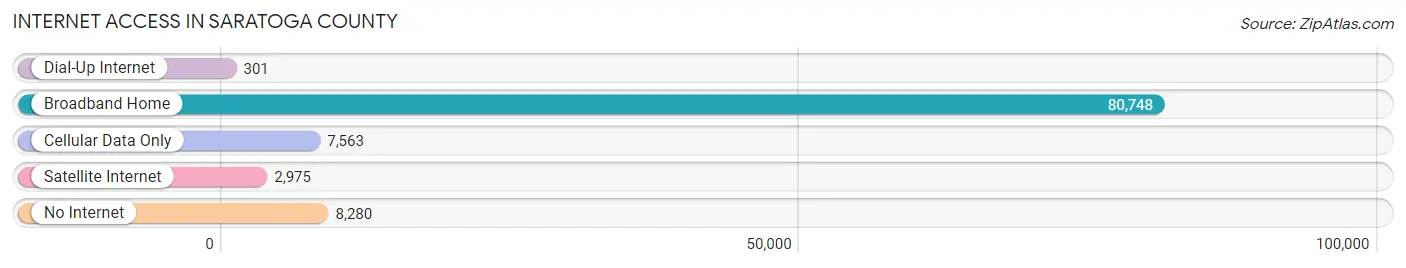
| Internet Type | # Households | % Households |
| Dial-Up Internet | 301 | 0.3% |
| Broadband Home | 80,748 | 82.1% |
| Cellular Data Only | 7,563 | 7.7% |
| Satellite Internet | 2,975 | 3.0% |
| No Internet | 8,280 | 8.4% |
| Total | 98,409 | 100.0% |
Saratoga County Summary
Saratoga County is a county located in the U.S. state of New York. As of the 2010 census, the population was 219,607. The county seat is Ballston Spa. Saratoga County is part of the Albany-Schenectady-Troy, NY Metropolitan Statistical Area.
History
Saratoga County was created in 1791 from Albany County. It was named after the famous Battle of Saratoga in the American Revolutionary War. The county was much larger than it is today. In 1826, Saratoga County was reduced in size by the creation of Rensselaer and Washington counties.
Geography
Saratoga County is located in the east-central part of New York State, north of Albany, northwest of Troy, and east of Utica. It is bordered by Washington County to the west, Rensselaer County to the south, and Schenectady County to the east. The northern part of the county is in the Adirondack Park. The southern part of the county is mostly rural, with small towns and villages scattered throughout.
The highest point in the county is Crane Mountain, at an elevation of 2,843 feet (867 m). The lowest point is the Hudson River, at an elevation of 20 feet (6 m).
The county has a total area of 1,947 square miles (5,040 km2), of which 1,835 square miles (4,760 km2) is land and 112 square miles (290 km2) is water.
Economy
Saratoga County is home to a diverse economy. The county is home to several large employers, including GlobalFoundries, the world's second-largest semiconductor manufacturer, and the Saratoga Race Course, the oldest continuously operating horse racing track in the United States.
The county is also home to a number of smaller businesses, including technology companies, manufacturing companies, and agricultural businesses. The county is also home to a number of wineries, breweries, and distilleries.
Demographics
As of the 2010 census, there were 219,607 people, 81,845 households, and 57,845 families residing in the county. The population density was 119.7 people per square mile (46.2/km2). There were 87,737 housing units at an average density of 47.9 per square mile (18.5/km2). The racial makeup of the county was 94.2% White, 2.2% African American, 0.3% Native American, 1.7% Asian, 0.1% Pacific Islander, 0.5% from other races, and 1.1% from two or more races. Hispanic or Latino of any race were 2.7% of the population.
The median income for a household in the county was $60,872, and the median income for a family was $71,919. Males had a median income of $50,819 versus $37,817 for females. The per capita income for the county was $29,811. About 4.2% of families and 6.7% of the population were below the poverty line, including 8.2% of those under age 18 and 5.2% of those age 65 or over.
Common Questions
What is Per Capita Income in Saratoga County?
Per Capita income in Saratoga County is $51,931.
What is the Median Family Income in Saratoga County?
Median Family Income in Saratoga County is $121,420.
What is the Median Household income in Saratoga County?
Median Household Income in Saratoga County is $97,038.
What is Income or Wage Gap in Saratoga County?
Income or Wage Gap in Saratoga County is 33.4%.
Women in Saratoga County earn 66.6 cents for every dollar earned by a man.
What is Family Income Deficit in Saratoga County?
Family Income Deficit in Saratoga County is $10,532.
Families that are below poverty line in Saratoga County earn $10,532 less on average than the poverty threshold level.
What is Inequality or Gini Index in Saratoga County?
Inequality or Gini Index in Saratoga County is 0.43.
What is the Total Population of Saratoga County?
Total Population of Saratoga County is 236,328.
What is the Total Male Population of Saratoga County?
Total Male Population of Saratoga County is 117,525.
What is the Total Female Population of Saratoga County?
Total Female Population of Saratoga County is 118,803.
What is the Ratio of Males per 100 Females in Saratoga County?
There are 98.92 Males per 100 Females in Saratoga County.
What is the Ratio of Females per 100 Males in Saratoga County?
There are 101.09 Females per 100 Males in Saratoga County.
What is the Median Population Age in Saratoga County?
Median Population Age in Saratoga County is 43.3 Years.
What is the Average Family Size in Saratoga County
Average Family Size in Saratoga County is 2.9 People.
What is the Average Household Size in Saratoga County
Average Household Size in Saratoga County is 2.4 People.
How Large is the Labor Force in Saratoga County?
There are 130,581 People in the Labor Forcein in Saratoga County.
What is the Percentage of People in the Labor Force in Saratoga County?
66.5% of People are in the Labor Force in Saratoga County.
What is the Unemployment Rate in Saratoga County?
Unemployment Rate in Saratoga County is 3.5%.