Rensselaer County, NY Map & Demographics
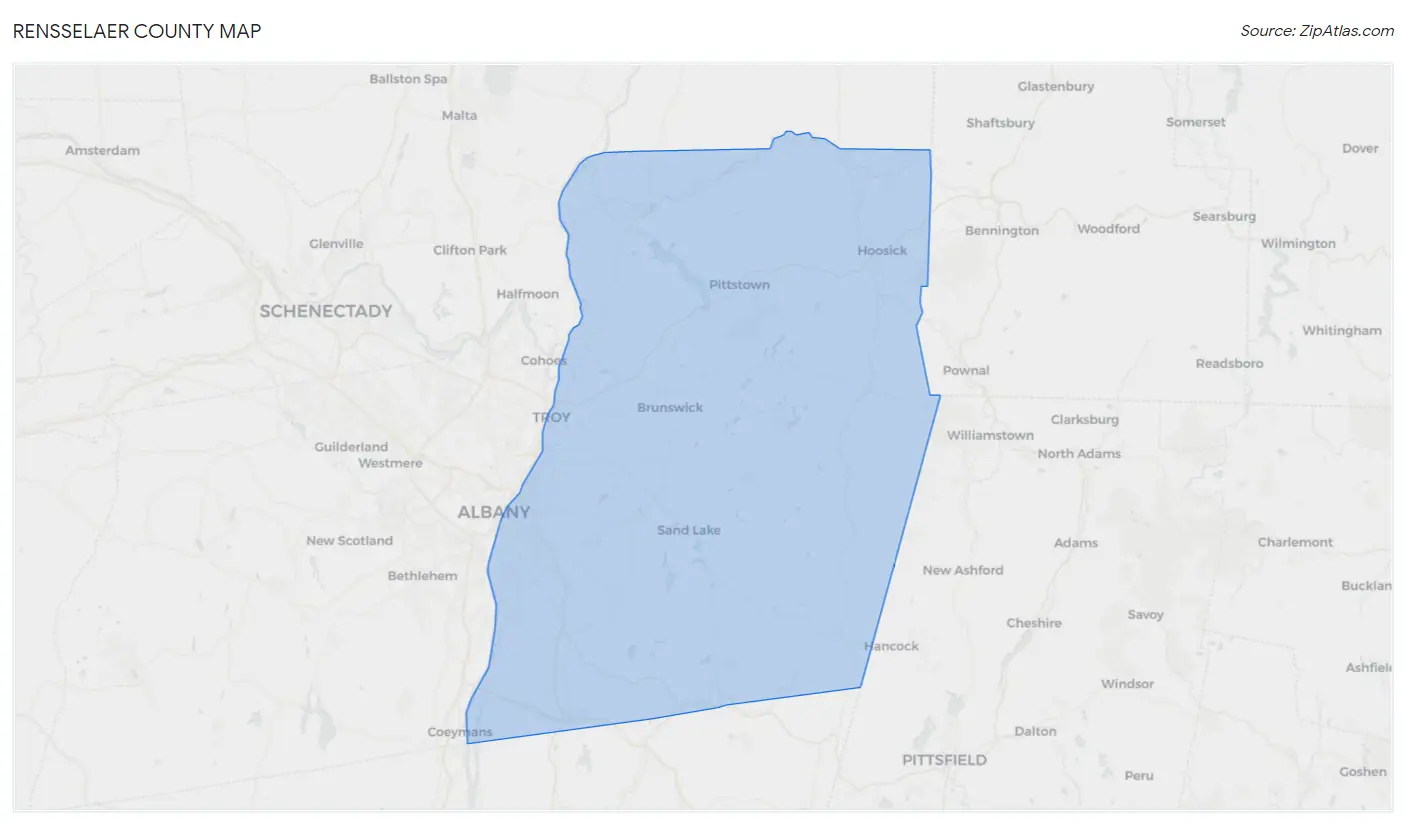
Rensselaer County Map
Rensselaer County Overview
$42,728
PER CAPITA INCOME
$104,744
AVG FAMILY INCOME
$83,734
AVG HOUSEHOLD INCOME
20.6%
WAGE / INCOME GAP [ % ]
79.4¢/ $1
WAGE / INCOME GAP [ $ ]
$10,093
FAMILY INCOME DEFICIT
0.42
INEQUALITY / GINI INDEX
160,943
TOTAL POPULATION
80,545
MALE POPULATION
80,398
FEMALE POPULATION
100.18
MALES / 100 FEMALES
99.82
FEMALES / 100 MALES
40.0
MEDIAN AGE
2.9
AVG FAMILY SIZE
2.3
AVG HOUSEHOLD SIZE
86,160
LABOR FORCE [ PEOPLE ]
64.2%
PERCENT IN LABOR FORCE
5.6%
UNEMPLOYMENT RATE
Rensselaer County Area Codes
Income in Rensselaer County
Income Overview in Rensselaer County
Per Capita Income in Rensselaer County is $42,728, while median incomes of families and households are $104,744 and $83,734 respectively.
| Characteristic | Number | Measure |
| Per Capita Income | 160,943 | $42,728 |
| Median Family Income | 39,627 | $104,744 |
| Mean Family Income | 39,627 | $121,327 |
| Median Household Income | 66,088 | $83,734 |
| Mean Household Income | 66,088 | $101,066 |
| Income Deficit | 39,627 | $10,093 |
| Wage / Income Gap (%) | 160,943 | 20.63% |
| Wage / Income Gap ($) | 160,943 | 79.37¢ per $1 |
| Gini / Inequality Index | 160,943 | 0.42 |
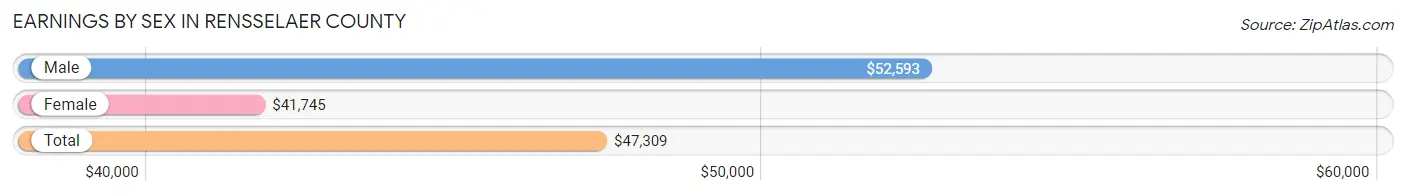
Earnings by Sex in Rensselaer County
Average Earnings in Rensselaer County are $47,309, $52,593 for men and $41,745 for women, a difference of 20.6%.
| Sex | Number | Average Earnings |
| Male | 47,255 (51.9%) | $52,593 |
| Female | 43,822 (48.1%) | $41,745 |
| Total | 91,077 (100.0%) | $47,309 |
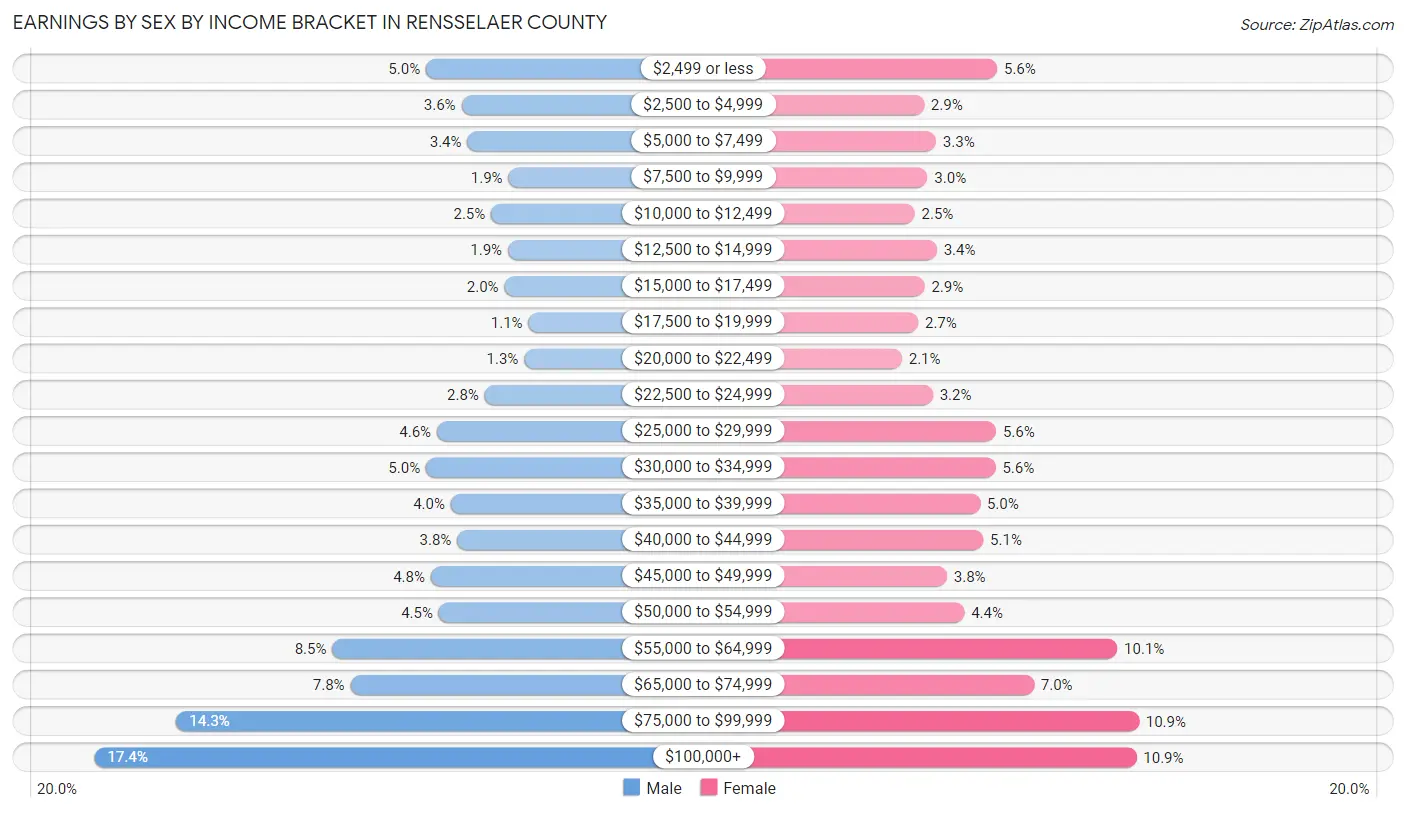
Earnings by Sex by Income Bracket in Rensselaer County
The most common earnings brackets in Rensselaer County are $100,000+ for men (8,212 | 17.4%) and $75,000 to $99,999 for women (4,793 | 10.9%).
| Income | Male | Female |
| $2,499 or less | 2,346 (5.0%) | 2,467 (5.6%) |
| $2,500 to $4,999 | 1,717 (3.6%) | 1,265 (2.9%) |
| $5,000 to $7,499 | 1,613 (3.4%) | 1,464 (3.3%) |
| $7,500 to $9,999 | 882 (1.9%) | 1,324 (3.0%) |
| $10,000 to $12,499 | 1,190 (2.5%) | 1,115 (2.5%) |
| $12,500 to $14,999 | 892 (1.9%) | 1,476 (3.4%) |
| $15,000 to $17,499 | 953 (2.0%) | 1,276 (2.9%) |
| $17,500 to $19,999 | 530 (1.1%) | 1,172 (2.7%) |
| $20,000 to $22,499 | 604 (1.3%) | 904 (2.1%) |
| $22,500 to $24,999 | 1,304 (2.8%) | 1,409 (3.2%) |
| $25,000 to $29,999 | 2,148 (4.5%) | 2,451 (5.6%) |
| $30,000 to $34,999 | 2,346 (5.0%) | 2,441 (5.6%) |
| $35,000 to $39,999 | 1,906 (4.0%) | 2,188 (5.0%) |
| $40,000 to $44,999 | 1,791 (3.8%) | 2,238 (5.1%) |
| $45,000 to $49,999 | 2,260 (4.8%) | 1,645 (3.7%) |
| $50,000 to $54,999 | 2,116 (4.5%) | 1,930 (4.4%) |
| $55,000 to $64,999 | 4,002 (8.5%) | 4,440 (10.1%) |
| $65,000 to $74,999 | 3,681 (7.8%) | 3,070 (7.0%) |
| $75,000 to $99,999 | 6,762 (14.3%) | 4,793 (10.9%) |
| $100,000+ | 8,212 (17.4%) | 4,754 (10.8%) |
| Total | 47,255 (100.0%) | 43,822 (100.0%) |
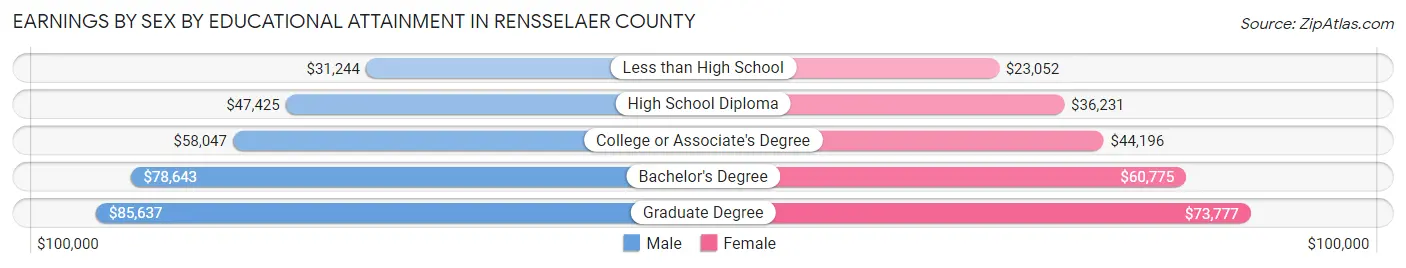
Earnings by Sex by Educational Attainment in Rensselaer County
Average earnings in Rensselaer County are $61,644 for men and $50,414 for women, a difference of 18.2%. Men with an educational attainment of graduate degree enjoy the highest average annual earnings of $85,637, while those with less than high school education earn the least with $31,244. Women with an educational attainment of graduate degree earn the most with the average annual earnings of $73,777, while those with less than high school education have the smallest earnings of $23,052.
| Educational Attainment | Male Income | Female Income |
| Less than High School | $31,244 | $23,052 |
| High School Diploma | $47,425 | $36,231 |
| College or Associate's Degree | $58,047 | $44,196 |
| Bachelor's Degree | $78,643 | $60,775 |
| Graduate Degree | $85,637 | $73,777 |
| Total | $61,644 | $50,414 |
Family Income in Rensselaer County
Family Income Brackets in Rensselaer County
According to the Rensselaer County family income data, there are 9,629 families falling into the $100,000 to $149,999 income range, which is the most common income bracket and makes up 24.3% of all families. Conversely, the $10,000 to $14,999 income bracket is the least frequent group with only 634 families (1.6%) belonging to this category.
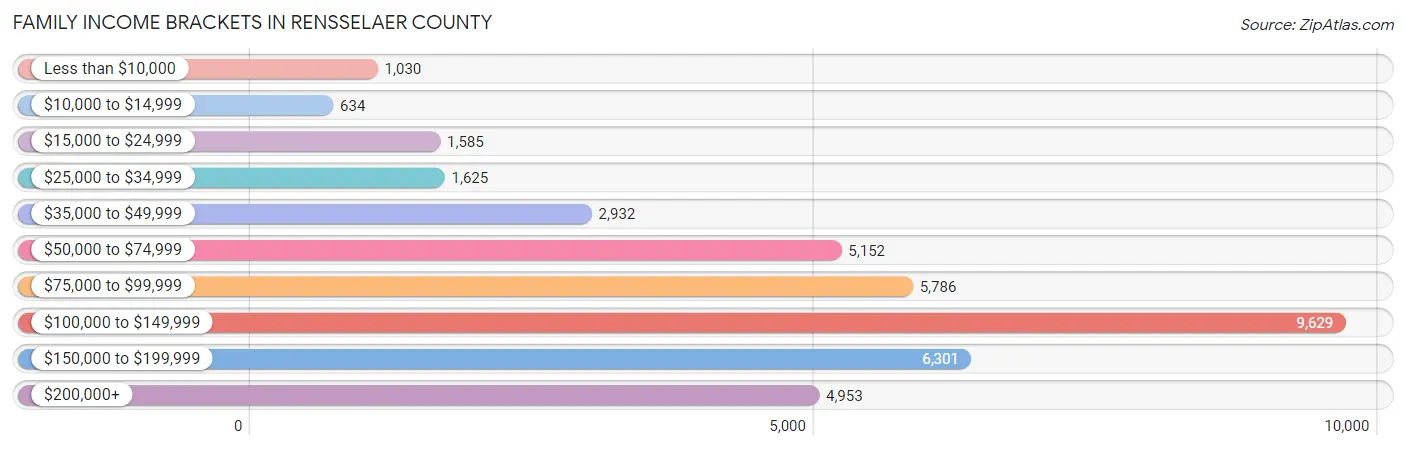
| Income Bracket | # Families | % Families |
| Less than $10,000 | 1,030 | 2.6% |
| $10,000 to $14,999 | 634 | 1.6% |
| $15,000 to $24,999 | 1,585 | 4.0% |
| $25,000 to $34,999 | 1,625 | 4.1% |
| $35,000 to $49,999 | 2,932 | 7.4% |
| $50,000 to $74,999 | 5,152 | 13.0% |
| $75,000 to $99,999 | 5,786 | 14.6% |
| $100,000 to $149,999 | 9,629 | 24.3% |
| $150,000 to $199,999 | 6,301 | 15.9% |
| $200,000+ | 4,953 | 12.5% |
Family Income by Famaliy Size in Rensselaer County
6-person families (700 | 1.8%) account for the highest median family income in Rensselaer County with $152,738 per family, while 2-person families (19,872 | 50.1%) have the highest median income of $46,176 per family member.
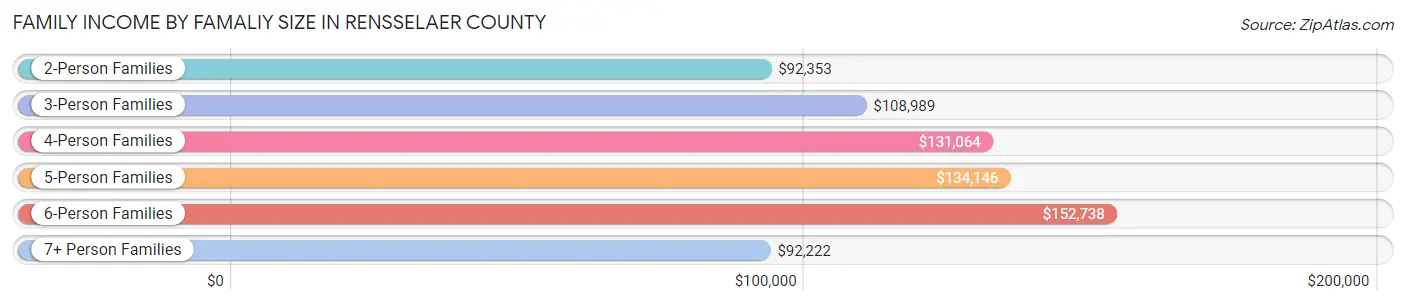
| Income Bracket | # Families | Median Income |
| 2-Person Families | 19,872 (50.1%) | $92,353 |
| 3-Person Families | 9,345 (23.6%) | $108,989 |
| 4-Person Families | 7,332 (18.5%) | $131,064 |
| 5-Person Families | 2,158 (5.4%) | $134,146 |
| 6-Person Families | 700 (1.8%) | $152,738 |
| 7+ Person Families | 220 (0.6%) | $92,222 |
| Total | 39,627 (100.0%) | $104,744 |
Family Income by Number of Earners in Rensselaer County
The median family income in Rensselaer County is $104,744, with families comprising 3+ earners (5,061) having the highest median family income of $156,190, while families with no earners (5,698) have the lowest median family income of $59,907, accounting for 12.8% and 14.4% of families, respectively.
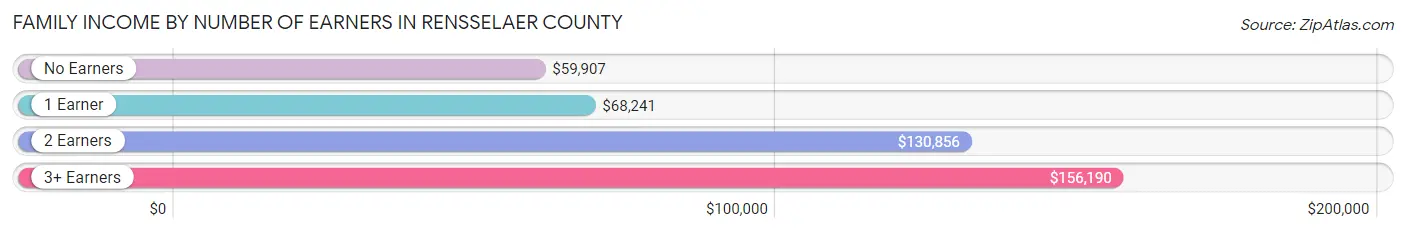
| Number of Earners | # Families | Median Income |
| No Earners | 5,698 (14.4%) | $59,907 |
| 1 Earner | 12,245 (30.9%) | $68,241 |
| 2 Earners | 16,623 (41.9%) | $130,856 |
| 3+ Earners | 5,061 (12.8%) | $156,190 |
| Total | 39,627 (100.0%) | $104,744 |
Household Income in Rensselaer County
Household Income Brackets in Rensselaer County
With 13,812 households falling in the category, the $100,000 to $149,999 income range is the most frequent in Rensselaer County, accounting for 20.9% of all households. In contrast, only 2,181 households (3.3%) fall into the $10,000 to $14,999 income bracket, making it the least populous group.
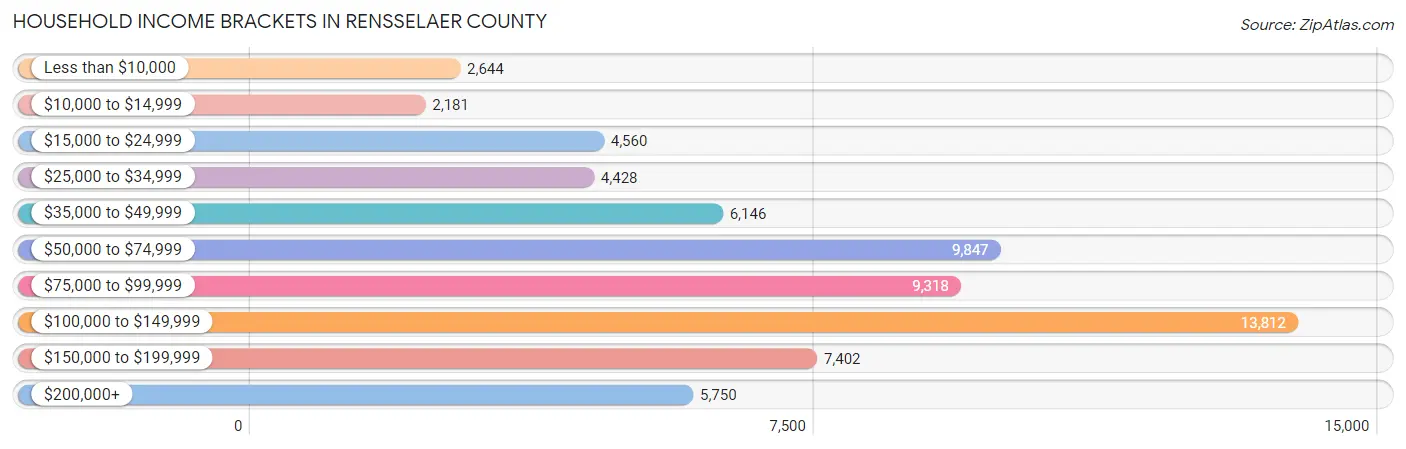
| Income Bracket | # Households | % Households |
| Less than $10,000 | 2,644 | 4.0% |
| $10,000 to $14,999 | 2,181 | 3.3% |
| $15,000 to $24,999 | 4,560 | 6.9% |
| $25,000 to $34,999 | 4,428 | 6.7% |
| $35,000 to $49,999 | 6,146 | 9.3% |
| $50,000 to $74,999 | 9,847 | 14.9% |
| $75,000 to $99,999 | 9,318 | 14.1% |
| $100,000 to $149,999 | 13,812 | 20.9% |
| $150,000 to $199,999 | 7,402 | 11.2% |
| $200,000+ | 5,750 | 8.7% |
Household Income by Householder Age in Rensselaer County
The median household income in Rensselaer County is $83,734, with the highest median household income of $100,194 found in the 45 to 64 years age bracket for the primary householder. A total of 24,712 households (37.4%) fall into this category. Meanwhile, the 15 to 24 years age bracket for the primary householder has the lowest median household income of $38,828, with 2,340 households (3.5%) in this group.
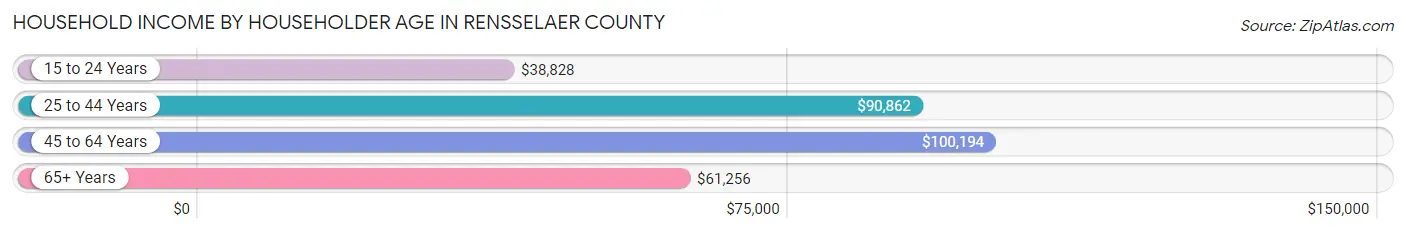
| Income Bracket | # Households | Median Income |
| 15 to 24 Years | 2,340 (3.5%) | $38,828 |
| 25 to 44 Years | 21,165 (32.0%) | $90,862 |
| 45 to 64 Years | 24,712 (37.4%) | $100,194 |
| 65+ Years | 17,871 (27.0%) | $61,256 |
| Total | 66,088 (100.0%) | $83,734 |
Poverty in Rensselaer County
Income Below Poverty by Sex and Age in Rensselaer County
With 9.4% poverty level for males and 13.5% for females among the residents of Rensselaer County, under 5 year old males and under 5 year old females are the most vulnerable to poverty, with 740 males (18.4%) and 1,109 females (29.8%) in their respective age groups living below the poverty level.
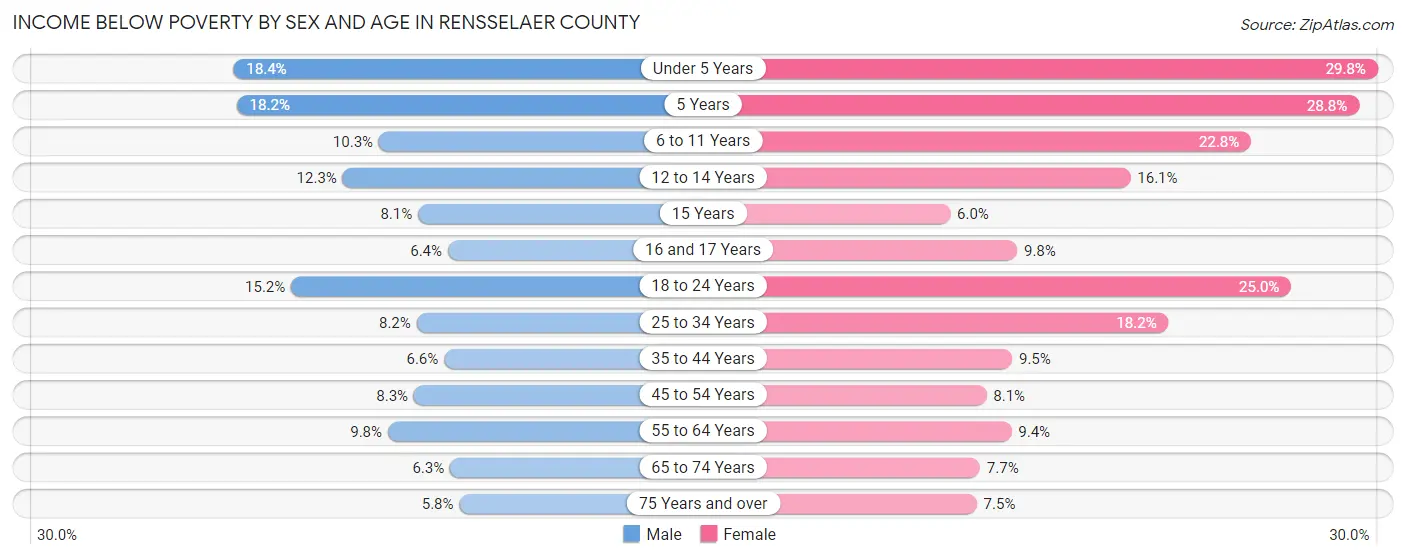
| Age Bracket | Male | Female |
| Under 5 Years | 740 (18.4%) | 1,109 (29.8%) |
| 5 Years | 131 (18.2%) | 159 (28.8%) |
| 6 to 11 Years | 579 (10.3%) | 1,158 (22.8%) |
| 12 to 14 Years | 310 (12.3%) | 389 (16.1%) |
| 15 Years | 58 (8.1%) | 51 (6.0%) |
| 16 and 17 Years | 126 (6.4%) | 174 (9.8%) |
| 18 to 24 Years | 1,074 (15.2%) | 1,503 (25.0%) |
| 25 to 34 Years | 909 (8.2%) | 1,996 (18.2%) |
| 35 to 44 Years | 658 (6.6%) | 944 (9.5%) |
| 45 to 54 Years | 817 (8.3%) | 802 (8.1%) |
| 55 to 64 Years | 1,089 (9.8%) | 1,102 (9.4%) |
| 65 to 74 Years | 515 (6.3%) | 674 (7.7%) |
| 75 Years and over | 250 (5.8%) | 472 (7.5%) |
| Total | 7,256 (9.4%) | 10,533 (13.5%) |
Income Above Poverty by Sex and Age in Rensselaer County
According to the poverty statistics in Rensselaer County, males aged 75 years and over and females aged 15 years are the age groups that are most secure financially, with 94.2% of males and 94.0% of females in these age groups living above the poverty line.
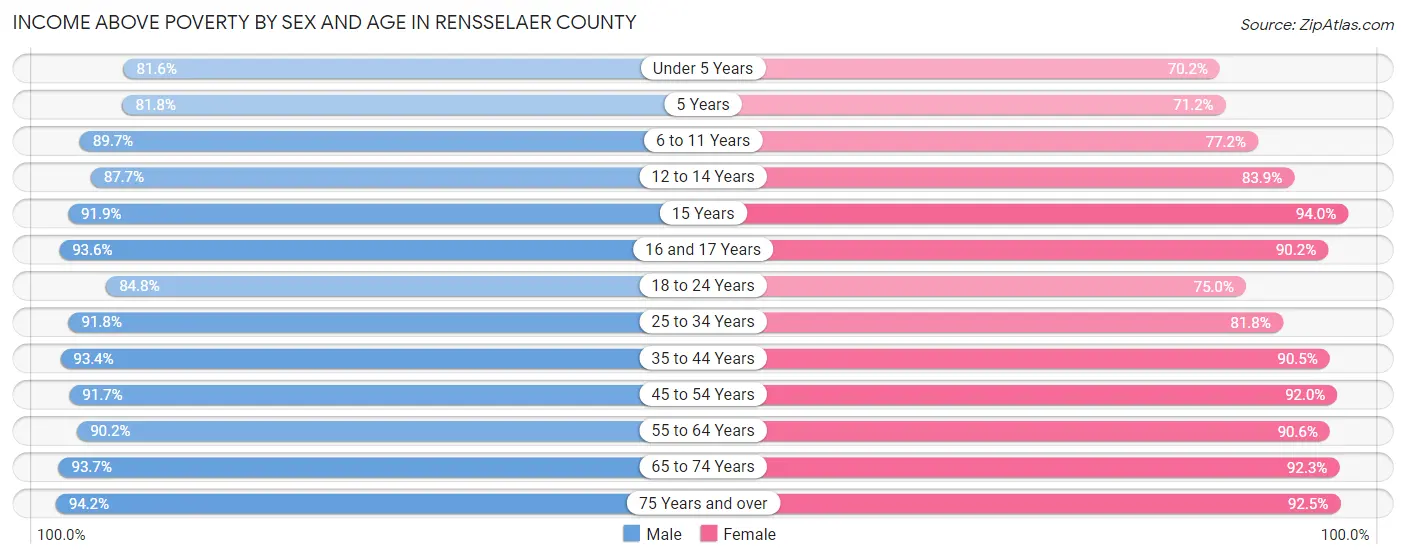
| Age Bracket | Male | Female |
| Under 5 Years | 3,289 (81.6%) | 2,608 (70.2%) |
| 5 Years | 589 (81.8%) | 393 (71.2%) |
| 6 to 11 Years | 5,060 (89.7%) | 3,924 (77.2%) |
| 12 to 14 Years | 2,213 (87.7%) | 2,032 (83.9%) |
| 15 Years | 659 (91.9%) | 795 (94.0%) |
| 16 and 17 Years | 1,833 (93.6%) | 1,609 (90.2%) |
| 18 to 24 Years | 6,009 (84.8%) | 4,503 (75.0%) |
| 25 to 34 Years | 10,217 (91.8%) | 8,979 (81.8%) |
| 35 to 44 Years | 9,246 (93.4%) | 9,010 (90.5%) |
| 45 to 54 Years | 9,004 (91.7%) | 9,158 (91.9%) |
| 55 to 64 Years | 10,060 (90.2%) | 10,567 (90.6%) |
| 65 to 74 Years | 7,641 (93.7%) | 8,087 (92.3%) |
| 75 Years and over | 4,070 (94.2%) | 5,812 (92.5%) |
| Total | 69,890 (90.6%) | 67,477 (86.5%) |
Income Below Poverty Among Married-Couple Families in Rensselaer County
The poverty statistics for married-couple families in Rensselaer County show that 3.0% or 864 of the total 28,294 families live below the poverty line. Families with 5 or more children have the highest poverty rate of 9.3%, comprising of 11 families. On the other hand, families with no children have the lowest poverty rate of 1.9%, which includes 339 families.
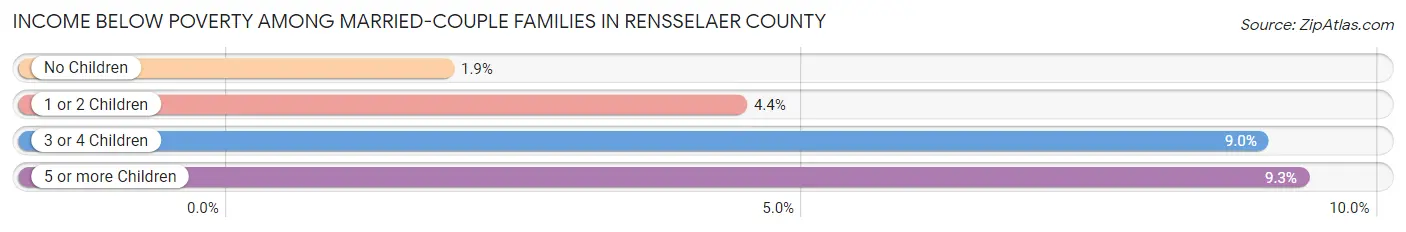
| Children | Above Poverty | Below Poverty |
| No Children | 17,657 (98.1%) | 339 (1.9%) |
| 1 or 2 Children | 8,408 (95.6%) | 390 (4.4%) |
| 3 or 4 Children | 1,258 (91.0%) | 124 (9.0%) |
| 5 or more Children | 107 (90.7%) | 11 (9.3%) |
| Total | 27,430 (97.0%) | 864 (3.0%) |
Income Below Poverty Among Single-Parent Households in Rensselaer County
According to the poverty data in Rensselaer County, 13.4% or 377 single-father households and 21.9% or 1,869 single-mother households are living below the poverty line. Among single-father households, those with 5 or more children have the highest poverty rate, with 17 households (100.0%) experiencing poverty. Likewise, among single-mother households, those with 3 or 4 children have the highest poverty rate, with 383 households (63.0%) falling below the poverty line.
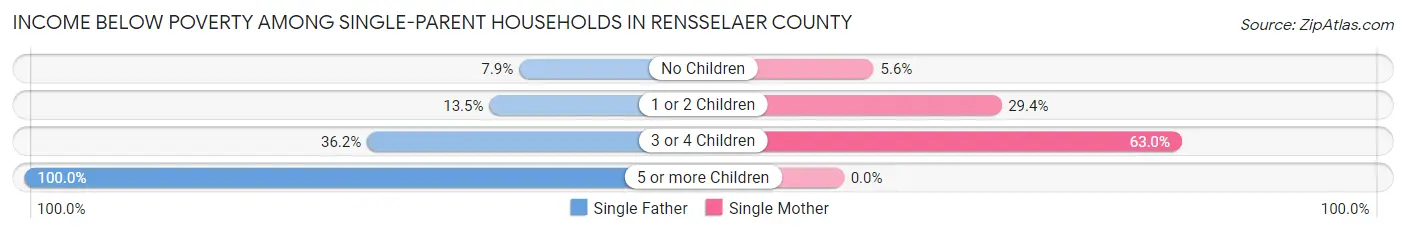
| Children | Single Father | Single Mother |
| No Children | 102 (7.9%) | 195 (5.6%) |
| 1 or 2 Children | 170 (13.5%) | 1,291 (29.3%) |
| 3 or 4 Children | 88 (36.2%) | 383 (63.0%) |
| 5 or more Children | 17 (100.0%) | 0 (0.0%) |
| Total | 377 (13.4%) | 1,869 (21.9%) |
Income Below Poverty Among Married-Couple vs Single-Parent Households in Rensselaer County
The poverty data for Rensselaer County shows that 864 of the married-couple family households (3.0%) and 2,246 of the single-parent households (19.8%) are living below the poverty level. Within the married-couple family households, those with 5 or more children have the highest poverty rate, with 11 households (9.3%) falling below the poverty line. Among the single-parent households, those with 5 or more children have the highest poverty rate, with 17 household (60.7%) living below poverty.
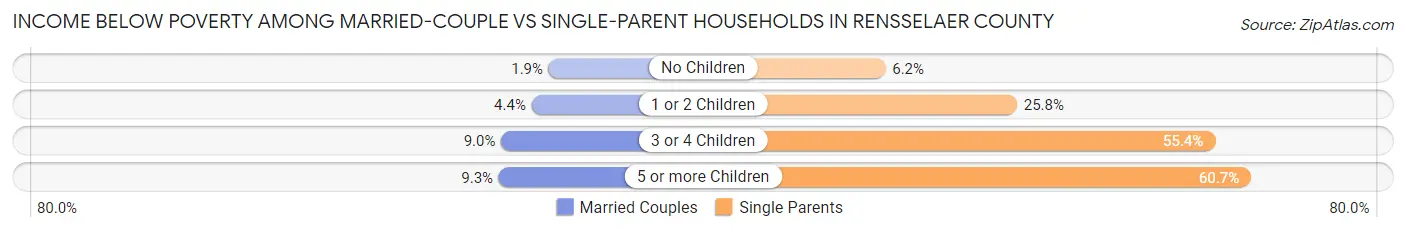
| Children | Married-Couple Families | Single-Parent Households |
| No Children | 339 (1.9%) | 297 (6.2%) |
| 1 or 2 Children | 390 (4.4%) | 1,461 (25.8%) |
| 3 or 4 Children | 124 (9.0%) | 471 (55.3%) |
| 5 or more Children | 11 (9.3%) | 17 (60.7%) |
| Total | 864 (3.0%) | 2,246 (19.8%) |
Race in Rensselaer County
The most populous races in Rensselaer County are White / Caucasian (133,037 | 82.7%), Black / African American (10,759 | 6.7%), and Two or more Races (9,312 | 5.8%).
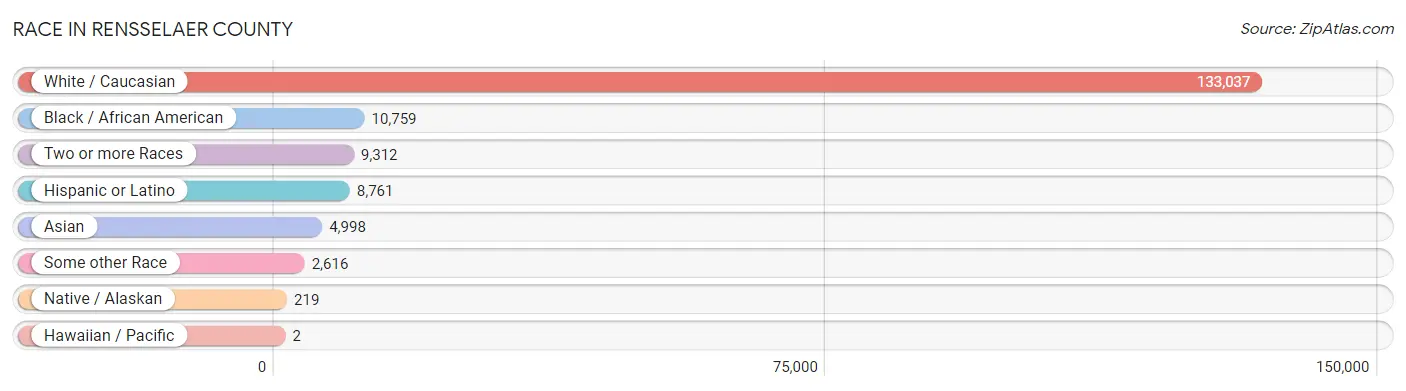
| Race | # Population | % Population |
| Asian | 4,998 | 3.1% |
| Black / African American | 10,759 | 6.7% |
| Hawaiian / Pacific | 2 | 0.0% |
| Hispanic or Latino | 8,761 | 5.4% |
| Native / Alaskan | 219 | 0.1% |
| White / Caucasian | 133,037 | 82.7% |
| Two or more Races | 9,312 | 5.8% |
| Some other Race | 2,616 | 1.6% |
| Total | 160,943 | 100.0% |
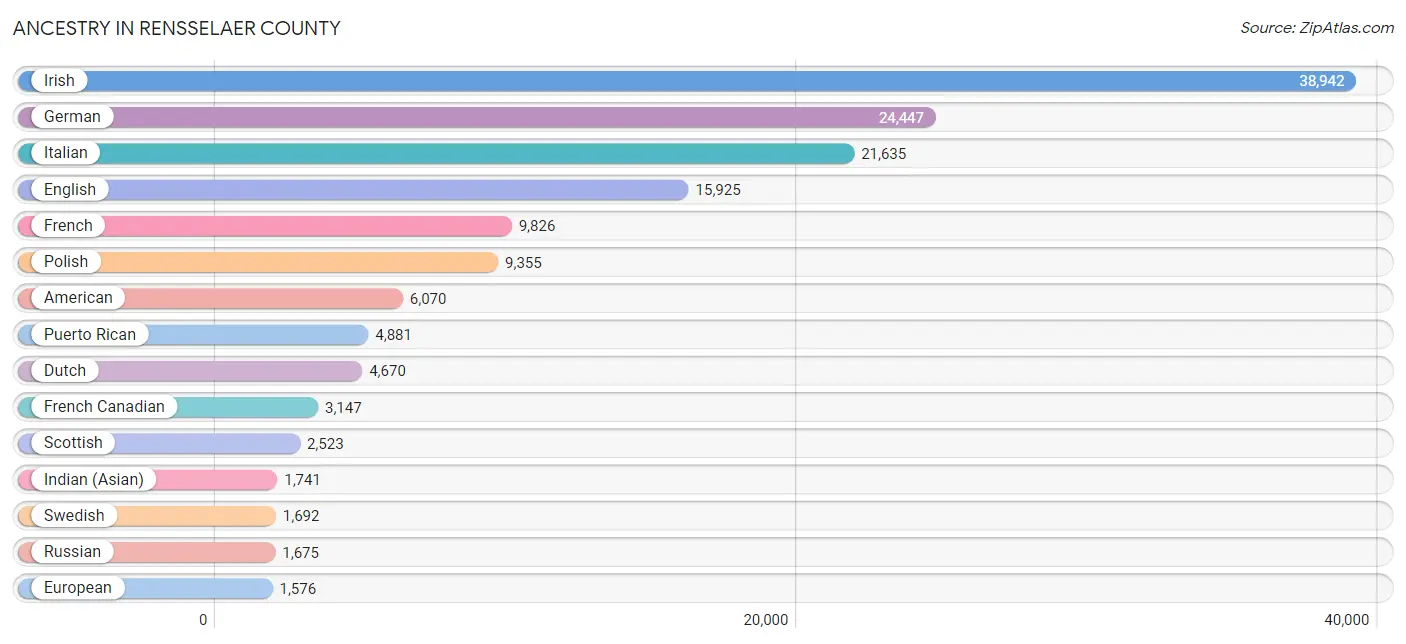
Ancestry in Rensselaer County
The most populous ancestries reported in Rensselaer County are Irish (38,942 | 24.2%), German (24,447 | 15.2%), Italian (21,635 | 13.4%), English (15,925 | 9.9%), and French (9,826 | 6.1%), together accounting for 68.8% of all Rensselaer County residents.
| Ancestry | # Population | % Population |
| Afghan | 139 | 0.1% |
| African | 429 | 0.3% |
| Albanian | 64 | 0.0% |
| Alsatian | 10 | 0.0% |
| American | 6,070 | 3.8% |
| Apache | 5 | 0.0% |
| Arab | 1,482 | 0.9% |
| Argentinean | 107 | 0.1% |
| Armenian | 501 | 0.3% |
| Australian | 34 | 0.0% |
| Austrian | 557 | 0.4% |
| Barbadian | 178 | 0.1% |
| Belgian | 110 | 0.1% |
| Bhutanese | 293 | 0.2% |
| Blackfeet | 34 | 0.0% |
| Brazilian | 28 | 0.0% |
| British | 698 | 0.4% |
| British West Indian | 66 | 0.0% |
| Bulgarian | 15 | 0.0% |
| Burmese | 405 | 0.3% |
| Cajun | 21 | 0.0% |
| Canadian | 380 | 0.2% |
| Celtic | 21 | 0.0% |
| Central American | 484 | 0.3% |
| Central American Indian | 74 | 0.1% |
| Cherokee | 336 | 0.2% |
| Chippewa | 16 | 0.0% |
| Colombian | 72 | 0.0% |
| Cree | 27 | 0.0% |
| Croatian | 200 | 0.1% |
| Cuban | 372 | 0.2% |
| Czech | 412 | 0.3% |
| Czechoslovakian | 85 | 0.1% |
| Danish | 749 | 0.5% |
| Dominican | 813 | 0.5% |
| Dutch | 4,670 | 2.9% |
| Eastern European | 703 | 0.4% |
| Ecuadorian | 283 | 0.2% |
| Egyptian | 45 | 0.0% |
| English | 15,925 | 9.9% |
| European | 1,576 | 1.0% |
| Filipino | 11 | 0.0% |
| Finnish | 228 | 0.1% |
| French | 9,826 | 6.1% |
| French American Indian | 85 | 0.1% |
| French Canadian | 3,147 | 2.0% |
| German | 24,447 | 15.2% |
| German Russian | 47 | 0.0% |
| Ghanaian | 221 | 0.1% |
| Greek | 765 | 0.5% |
| Guamanian / Chamorro | 8 | 0.0% |
| Guatemalan | 142 | 0.1% |
| Guyanese | 171 | 0.1% |
| Haitian | 348 | 0.2% |
| Honduran | 105 | 0.1% |
| Hungarian | 598 | 0.4% |
| Icelander | 19 | 0.0% |
| Indian (Asian) | 1,741 | 1.1% |
| Indonesian | 619 | 0.4% |
| Iranian | 232 | 0.1% |
| Iraqi | 27 | 0.0% |
| Irish | 38,942 | 24.2% |
| Iroquois | 53 | 0.0% |
| Israeli | 99 | 0.1% |
| Italian | 21,635 | 13.4% |
| Jamaican | 513 | 0.3% |
| Japanese | 23 | 0.0% |
| Kenyan | 26 | 0.0% |
| Korean | 212 | 0.1% |
| Latvian | 74 | 0.1% |
| Lebanese | 340 | 0.2% |
| Liberian | 13 | 0.0% |
| Lithuanian | 609 | 0.4% |
| Luxembourger | 42 | 0.0% |
| Marshallese | 3 | 0.0% |
| Mexican | 864 | 0.5% |
| Mexican American Indian | 136 | 0.1% |
| Mongolian | 1 | 0.0% |
| Native Hawaiian | 86 | 0.1% |
| New Zealander | 21 | 0.0% |
| Nicaraguan | 2 | 0.0% |
| Nigerian | 187 | 0.1% |
| Northern European | 492 | 0.3% |
| Norwegian | 781 | 0.5% |
| Pakistani | 55 | 0.0% |
| Palestinian | 3 | 0.0% |
| Panamanian | 131 | 0.1% |
| Paraguayan | 6 | 0.0% |
| Pennsylvania German | 34 | 0.0% |
| Peruvian | 44 | 0.0% |
| Polish | 9,355 | 5.8% |
| Portuguese | 458 | 0.3% |
| Puerto Rican | 4,881 | 3.0% |
| Romanian | 204 | 0.1% |
| Russian | 1,675 | 1.0% |
| Salvadoran | 104 | 0.1% |
| Samoan | 19 | 0.0% |
| Scandinavian | 383 | 0.2% |
| Scotch-Irish | 1,208 | 0.7% |
| Scottish | 2,523 | 1.6% |
| Serbian | 8 | 0.0% |
| Slavic | 144 | 0.1% |
| Slovak | 148 | 0.1% |
| Slovene | 37 | 0.0% |
| Somali | 17 | 0.0% |
| South African | 96 | 0.1% |
| South American | 529 | 0.3% |
| Spaniard | 102 | 0.1% |
| Spanish | 309 | 0.2% |
| Spanish American | 14 | 0.0% |
| Sri Lankan | 140 | 0.1% |
| Subsaharan African | 1,056 | 0.7% |
| Sudanese | 12 | 0.0% |
| Swedish | 1,692 | 1.1% |
| Swiss | 236 | 0.2% |
| Syrian | 147 | 0.1% |
| Thai | 1,406 | 0.9% |
| Trinidadian and Tobagonian | 75 | 0.1% |
| Turkish | 213 | 0.1% |
| U.S. Virgin Islander | 11 | 0.0% |
| Ukrainian | 1,256 | 0.8% |
| Venezuelan | 12 | 0.0% |
| Vietnamese | 21 | 0.0% |
| Welsh | 1,383 | 0.9% |
| West Indian | 351 | 0.2% |
| Yugoslavian | 34 | 0.0% |
| Yuman | 3 | 0.0% | View All 127 Rows |
Immigrants in Rensselaer County
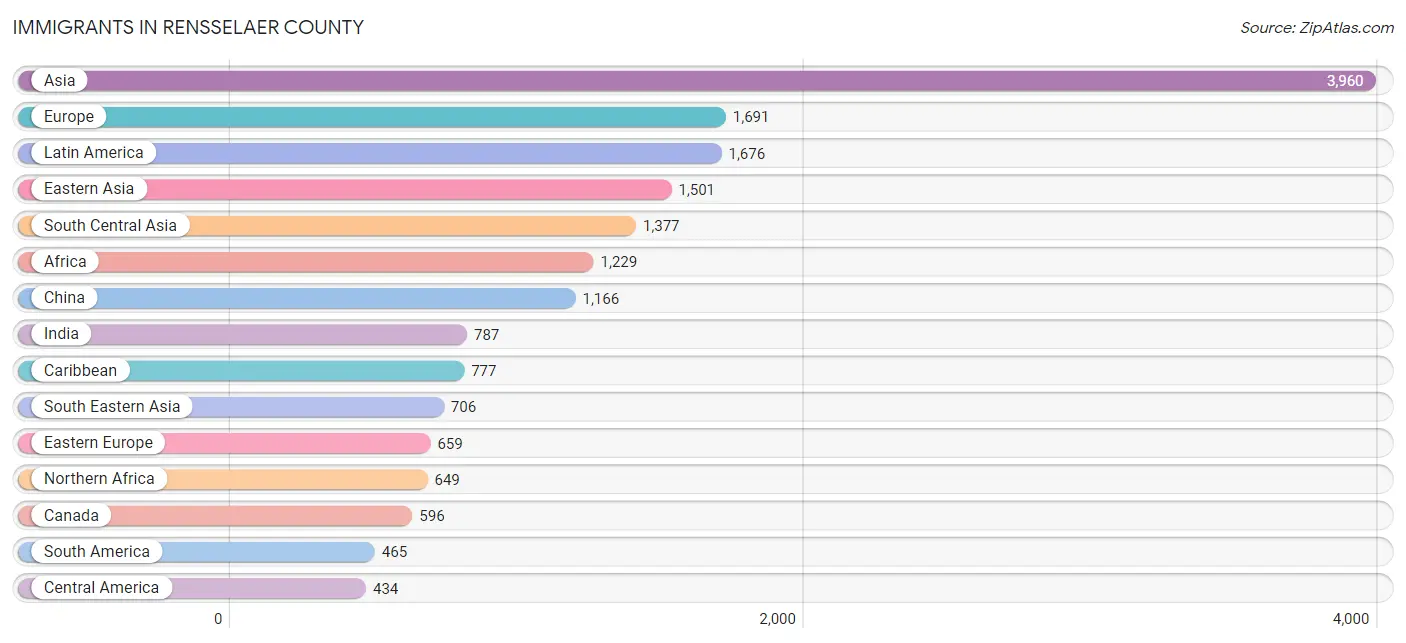
The most numerous immigrant groups reported in Rensselaer County came from Asia (3,960 | 2.5%), Europe (1,691 | 1.1%), Latin America (1,676 | 1.0%), Eastern Asia (1,501 | 0.9%), and South Central Asia (1,377 | 0.9%), together accounting for 6.3% of all Rensselaer County residents.
| Immigration Origin | # Population | % Population |
| Afghanistan | 129 | 0.1% |
| Africa | 1,229 | 0.8% |
| Albania | 16 | 0.0% |
| Argentina | 10 | 0.0% |
| Armenia | 96 | 0.1% |
| Asia | 3,960 | 2.5% |
| Australia | 28 | 0.0% |
| Austria | 47 | 0.0% |
| Bangladesh | 47 | 0.0% |
| Belarus | 78 | 0.1% |
| Belgium | 29 | 0.0% |
| Bosnia and Herzegovina | 4 | 0.0% |
| Brazil | 70 | 0.0% |
| Bulgaria | 5 | 0.0% |
| Canada | 596 | 0.4% |
| Caribbean | 777 | 0.5% |
| Central America | 434 | 0.3% |
| China | 1,166 | 0.7% |
| Colombia | 72 | 0.0% |
| Cuba | 54 | 0.0% |
| Denmark | 7 | 0.0% |
| Dominican Republic | 232 | 0.1% |
| Eastern Africa | 128 | 0.1% |
| Eastern Asia | 1,501 | 0.9% |
| Eastern Europe | 659 | 0.4% |
| Ecuador | 87 | 0.1% |
| Egypt | 150 | 0.1% |
| El Salvador | 56 | 0.0% |
| England | 38 | 0.0% |
| Europe | 1,691 | 1.1% |
| Germany | 293 | 0.2% |
| Ghana | 209 | 0.1% |
| Greece | 64 | 0.0% |
| Guatemala | 96 | 0.1% |
| Guyana | 151 | 0.1% |
| Haiti | 172 | 0.1% |
| Honduras | 21 | 0.0% |
| Hong Kong | 20 | 0.0% |
| India | 787 | 0.5% |
| Indonesia | 24 | 0.0% |
| Iran | 98 | 0.1% |
| Iraq | 27 | 0.0% |
| Ireland | 124 | 0.1% |
| Israel | 49 | 0.0% |
| Italy | 258 | 0.2% |
| Jamaica | 131 | 0.1% |
| Japan | 156 | 0.1% |
| Kazakhstan | 60 | 0.0% |
| Kenya | 26 | 0.0% |
| Korea | 179 | 0.1% |
| Latin America | 1,676 | 1.0% |
| Lebanon | 6 | 0.0% |
| Malaysia | 15 | 0.0% |
| Mexico | 249 | 0.2% |
| Micronesia | 2 | 0.0% |
| Middle Africa | 15 | 0.0% |
| Nepal | 91 | 0.1% |
| Netherlands | 13 | 0.0% |
| Nigeria | 139 | 0.1% |
| Northern Africa | 649 | 0.4% |
| Northern Europe | 304 | 0.2% |
| Oceania | 48 | 0.0% |
| Pakistan | 64 | 0.0% |
| Panama | 12 | 0.0% |
| Peru | 25 | 0.0% |
| Philippines | 166 | 0.1% |
| Poland | 316 | 0.2% |
| Romania | 20 | 0.0% |
| Russia | 96 | 0.1% |
| Saudi Arabia | 7 | 0.0% |
| Scotland | 41 | 0.0% |
| Somalia | 34 | 0.0% |
| South Africa | 66 | 0.0% |
| South America | 465 | 0.3% |
| South Central Asia | 1,377 | 0.9% |
| South Eastern Asia | 706 | 0.4% |
| Southern Europe | 346 | 0.2% |
| Spain | 24 | 0.0% |
| St. Vincent and the Grenadines | 51 | 0.0% |
| Sudan | 19 | 0.0% |
| Syria | 8 | 0.0% |
| Taiwan | 23 | 0.0% |
| Thailand | 112 | 0.1% |
| Trinidad and Tobago | 105 | 0.1% |
| Turkey | 175 | 0.1% |
| Ukraine | 91 | 0.1% |
| Uzbekistan | 101 | 0.1% |
| Venezuela | 50 | 0.0% |
| Vietnam | 80 | 0.1% |
| Western Africa | 371 | 0.2% |
| Western Asia | 376 | 0.2% |
| Western Europe | 382 | 0.2% |
| Zimbabwe | 9 | 0.0% | View All 93 Rows |
Sex and Age in Rensselaer County
Sex and Age in Rensselaer County
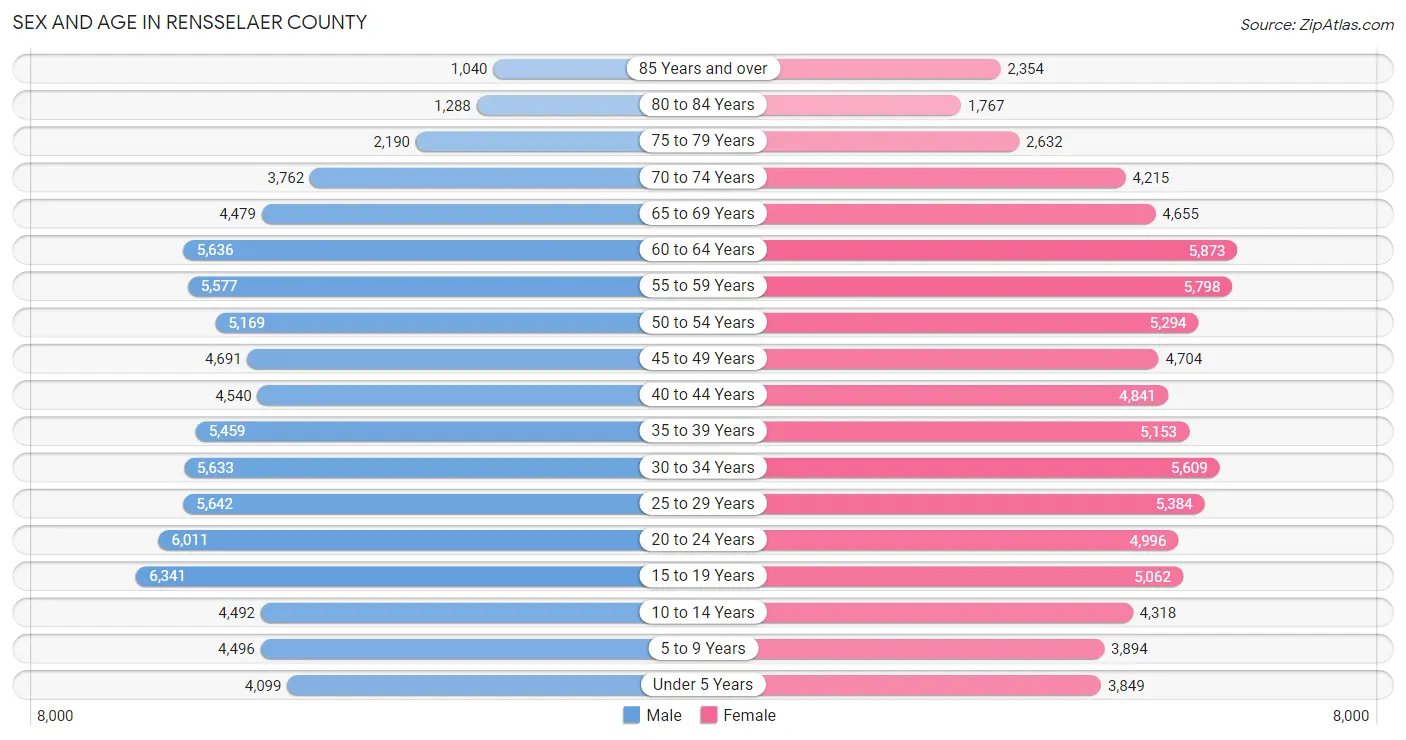
The most populous age groups in Rensselaer County are 15 to 19 Years (6,341 | 7.9%) for men and 60 to 64 Years (5,873 | 7.3%) for women.
| Age Bracket | Male | Female |
| Under 5 Years | 4,099 (5.1%) | 3,849 (4.8%) |
| 5 to 9 Years | 4,496 (5.6%) | 3,894 (4.8%) |
| 10 to 14 Years | 4,492 (5.6%) | 4,318 (5.4%) |
| 15 to 19 Years | 6,341 (7.9%) | 5,062 (6.3%) |
| 20 to 24 Years | 6,011 (7.5%) | 4,996 (6.2%) |
| 25 to 29 Years | 5,642 (7.0%) | 5,384 (6.7%) |
| 30 to 34 Years | 5,633 (7.0%) | 5,609 (7.0%) |
| 35 to 39 Years | 5,459 (6.8%) | 5,153 (6.4%) |
| 40 to 44 Years | 4,540 (5.6%) | 4,841 (6.0%) |
| 45 to 49 Years | 4,691 (5.8%) | 4,704 (5.9%) |
| 50 to 54 Years | 5,169 (6.4%) | 5,294 (6.6%) |
| 55 to 59 Years | 5,577 (6.9%) | 5,798 (7.2%) |
| 60 to 64 Years | 5,636 (7.0%) | 5,873 (7.3%) |
| 65 to 69 Years | 4,479 (5.6%) | 4,655 (5.8%) |
| 70 to 74 Years | 3,762 (4.7%) | 4,215 (5.2%) |
| 75 to 79 Years | 2,190 (2.7%) | 2,632 (3.3%) |
| 80 to 84 Years | 1,288 (1.6%) | 1,767 (2.2%) |
| 85 Years and over | 1,040 (1.3%) | 2,354 (2.9%) |
| Total | 80,545 (100.0%) | 80,398 (100.0%) |
Families and Households in Rensselaer County
Median Family Size in Rensselaer County
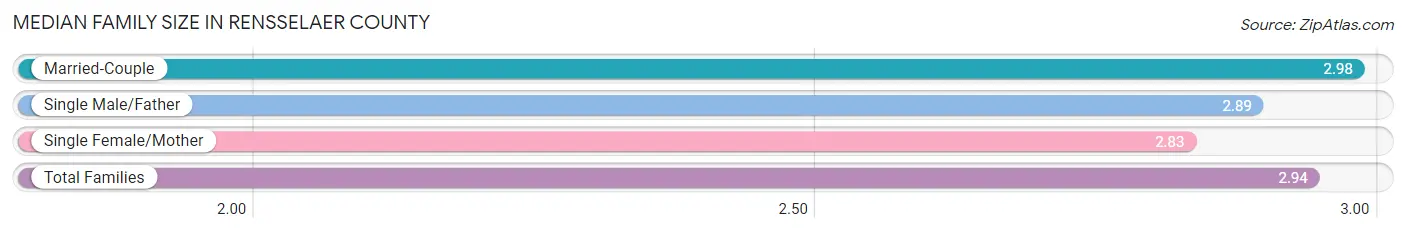
The median family size in Rensselaer County is 2.94 persons per family, with married-couple families (28,294 | 71.4%) accounting for the largest median family size of 2.98 persons per family. On the other hand, single female/mother families (8,519 | 21.5%) represent the smallest median family size with 2.83 persons per family.
| Family Type | # Families | Family Size |
| Married-Couple | 28,294 (71.4%) | 2.98 |
| Single Male/Father | 2,814 (7.1%) | 2.89 |
| Single Female/Mother | 8,519 (21.5%) | 2.83 |
| Total Families | 39,627 (100.0%) | 2.94 |
Median Household Size in Rensselaer County
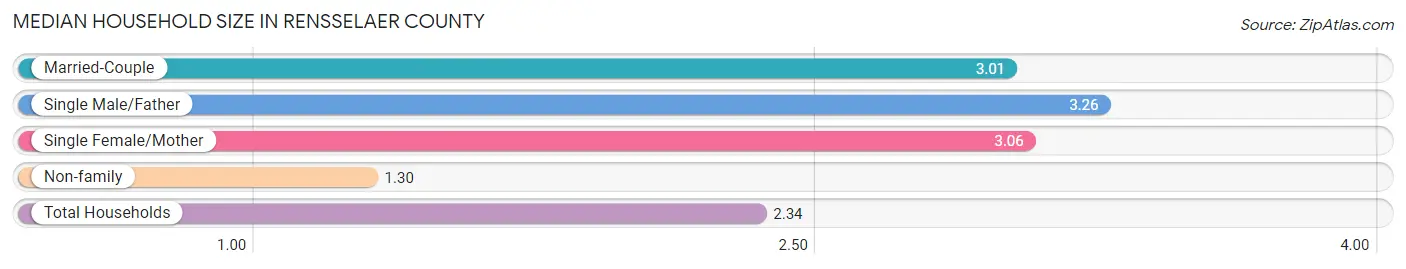
The median household size in Rensselaer County is 2.34 persons per household, with single male/father households (2,814 | 4.3%) accounting for the largest median household size of 3.26 persons per household. non-family households (26,461 | 40.0%) represent the smallest median household size with 1.30 persons per household.
| Household Type | # Households | Household Size |
| Married-Couple | 28,294 (42.8%) | 3.01 |
| Single Male/Father | 2,814 (4.3%) | 3.26 |
| Single Female/Mother | 8,519 (12.9%) | 3.06 |
| Non-family | 26,461 (40.0%) | 1.30 |
| Total Households | 66,088 (100.0%) | 2.34 |
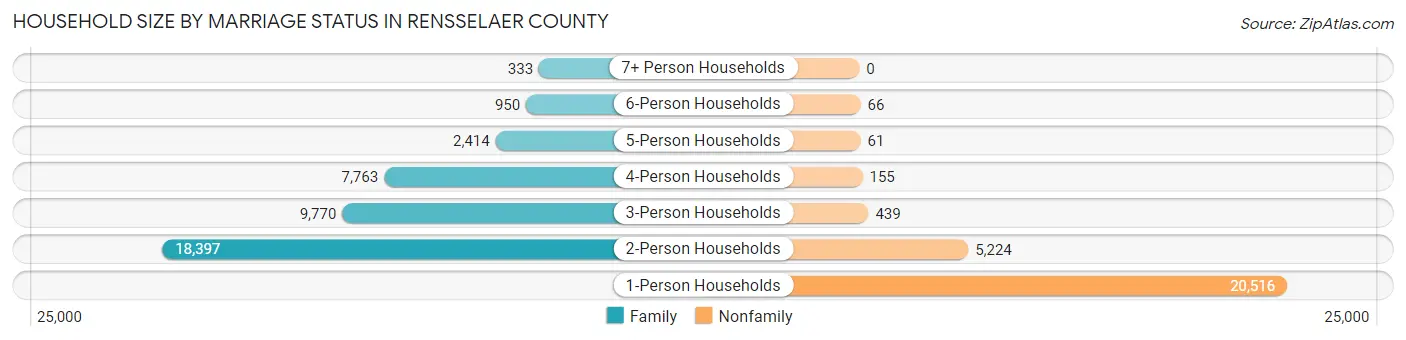
Household Size by Marriage Status in Rensselaer County
Out of a total of 66,088 households in Rensselaer County, 39,627 (60.0%) are family households, while 26,461 (40.0%) are nonfamily households. The most numerous type of family households are 2-person households, comprising 18,397, and the most common type of nonfamily households are 1-person households, comprising 20,516.
| Household Size | Family Households | Nonfamily Households |
| 1-Person Households | - | 20,516 (31.0%) |
| 2-Person Households | 18,397 (27.8%) | 5,224 (7.9%) |
| 3-Person Households | 9,770 (14.8%) | 439 (0.7%) |
| 4-Person Households | 7,763 (11.7%) | 155 (0.2%) |
| 5-Person Households | 2,414 (3.6%) | 61 (0.1%) |
| 6-Person Households | 950 (1.4%) | 66 (0.1%) |
| 7+ Person Households | 333 (0.5%) | 0 (0.0%) |
| Total | 39,627 (60.0%) | 26,461 (40.0%) |
Female Fertility in Rensselaer County
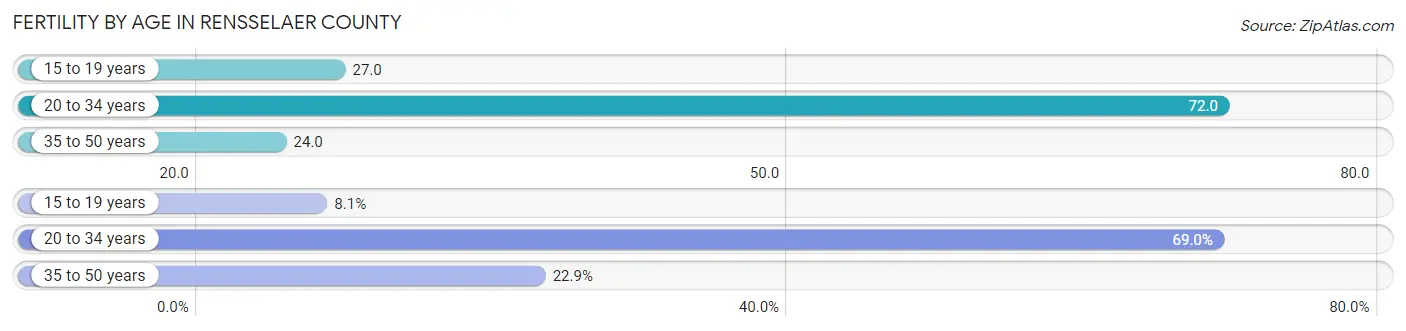
Fertility by Age in Rensselaer County
Average fertility rate in Rensselaer County is 45.0 births per 1,000 women. Women in the age bracket of 20 to 34 years have the highest fertility rate with 72.0 births per 1,000 women. Women in the age bracket of 20 to 34 years acount for 69.0% of all women with births.
| Age Bracket | Women with Births | Births / 1,000 Women |
| 15 to 19 years | 135 (8.1%) | 27.0 |
| 20 to 34 years | 1,150 (69.0%) | 72.0 |
| 35 to 50 years | 382 (22.9%) | 24.0 |
| Total | 1,667 (100.0%) | 45.0 |
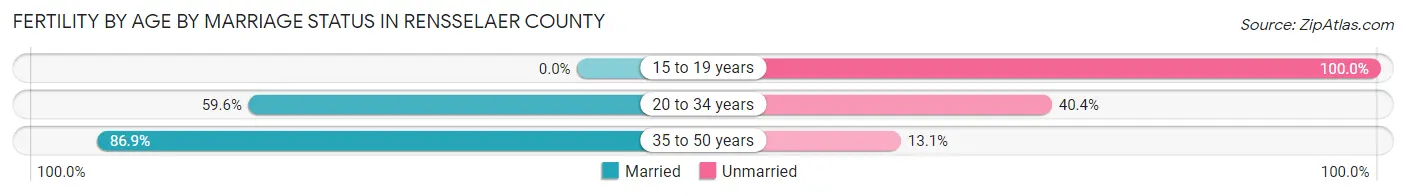
Fertility by Age by Marriage Status in Rensselaer County
61.0% of women with births (1,667) in Rensselaer County are married. The highest percentage of unmarried women with births falls into 15 to 19 years age bracket with 100.0% of them unmarried at the time of birth, while the lowest percentage of unmarried women with births belong to 35 to 50 years age bracket with 13.1% of them unmarried.
| Age Bracket | Married | Unmarried |
| 15 to 19 years | 0 (0.0%) | 135 (100.0%) |
| 20 to 34 years | 685 (59.6%) | 465 (40.4%) |
| 35 to 50 years | 332 (86.9%) | 50 (13.1%) |
| Total | 1,017 (61.0%) | 650 (39.0%) |
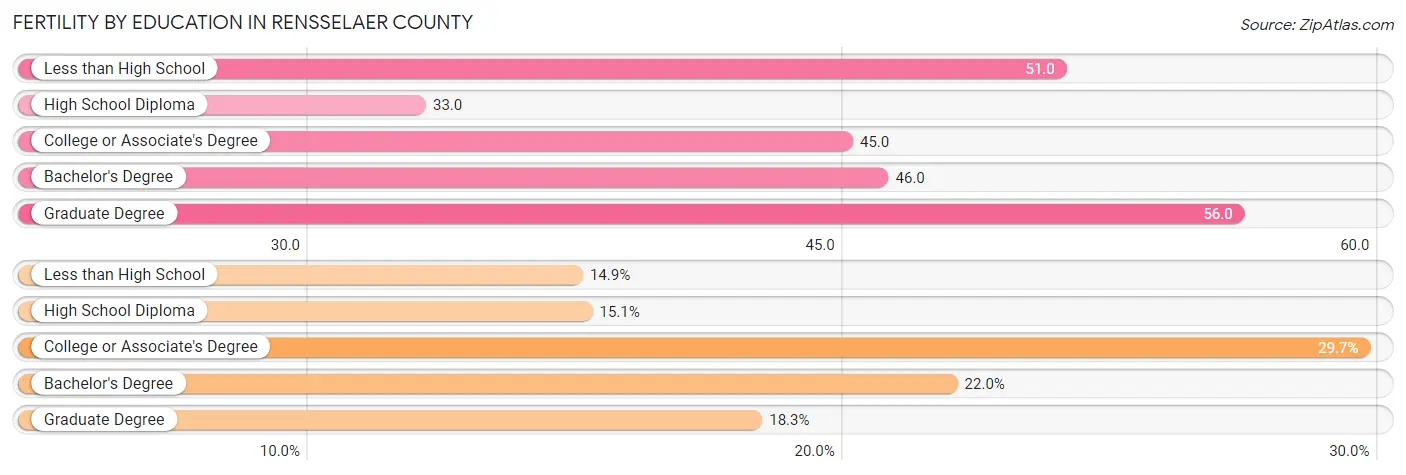
Fertility by Education in Rensselaer County
Average fertility rate in Rensselaer County is 45.0 births per 1,000 women. Women with the education attainment of graduate degree have the highest fertility rate of 56.0 births per 1,000 women, while women with the education attainment of high school diploma have the lowest fertility at 33.0 births per 1,000 women. Women with the education attainment of college or associate's degree represent 29.7% of all women with births.
| Educational Attainment | Women with Births | Births / 1,000 Women |
| Less than High School | 249 (14.9%) | 51.0 |
| High School Diploma | 252 (15.1%) | 33.0 |
| College or Associate's Degree | 495 (29.7%) | 45.0 |
| Bachelor's Degree | 366 (22.0%) | 46.0 |
| Graduate Degree | 305 (18.3%) | 56.0 |
| Total | 1,667 (100.0%) | 45.0 |
Fertility by Education by Marriage Status in Rensselaer County
39.0% of women with births in Rensselaer County are unmarried. Women with the educational attainment of graduate degree are most likely to be married with 94.1% of them married at childbirth, while women with the educational attainment of high school diploma are least likely to be married with 78.2% of them unmarried at childbirth.
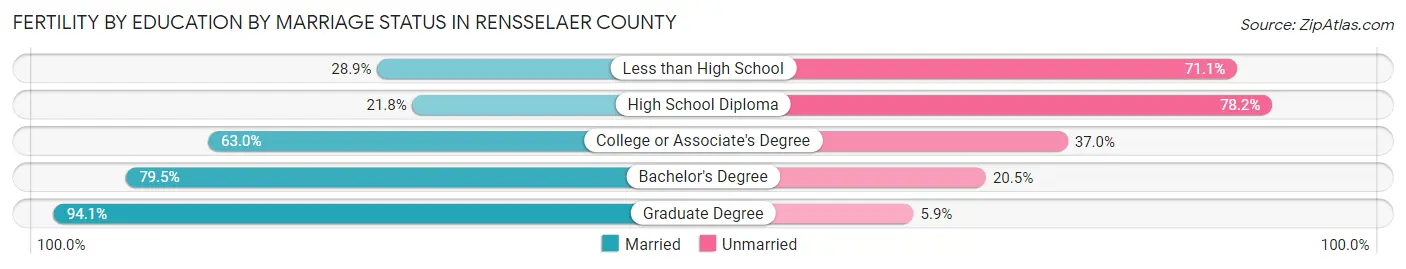
| Educational Attainment | Married | Unmarried |
| Less than High School | 72 (28.9%) | 177 (71.1%) |
| High School Diploma | 55 (21.8%) | 197 (78.2%) |
| College or Associate's Degree | 312 (63.0%) | 183 (37.0%) |
| Bachelor's Degree | 291 (79.5%) | 75 (20.5%) |
| Graduate Degree | 287 (94.1%) | 18 (5.9%) |
| Total | 1,017 (61.0%) | 650 (39.0%) |
Employment Characteristics in Rensselaer County
Employment by Class of Employer in Rensselaer County
Among the 78,978 employed individuals in Rensselaer County, private company employees (44,765 | 56.7%), not-for-profit organizations (10,541 | 13.4%), and state government employees (8,946 | 11.3%) make up the most common classes of employment.
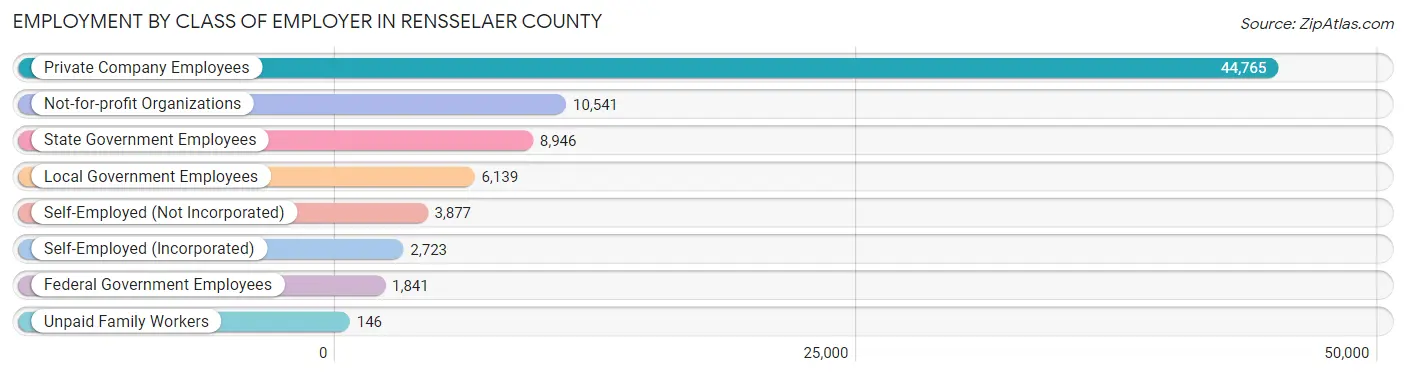
| Employer Class | # Employees | % Employees |
| Private Company Employees | 44,765 | 56.7% |
| Self-Employed (Incorporated) | 2,723 | 3.5% |
| Self-Employed (Not Incorporated) | 3,877 | 4.9% |
| Not-for-profit Organizations | 10,541 | 13.4% |
| Local Government Employees | 6,139 | 7.8% |
| State Government Employees | 8,946 | 11.3% |
| Federal Government Employees | 1,841 | 2.3% |
| Unpaid Family Workers | 146 | 0.2% |
| Total | 78,978 | 100.0% |
Employment Status by Age in Rensselaer County
According to the labor force statistics for Rensselaer County, out of the total population over 16 years of age (134,206), 64.2% or 86,160 individuals are in the labor force, with 5.6% or 4,825 of them unemployed. The age group with the highest labor force participation rate is 35 to 44 years, with 90.1% or 18,014 individuals in the labor force. Within the labor force, the 16 to 19 years age range has the highest percentage of unemployed individuals, with 20.8% or 735 of them being unemployed.
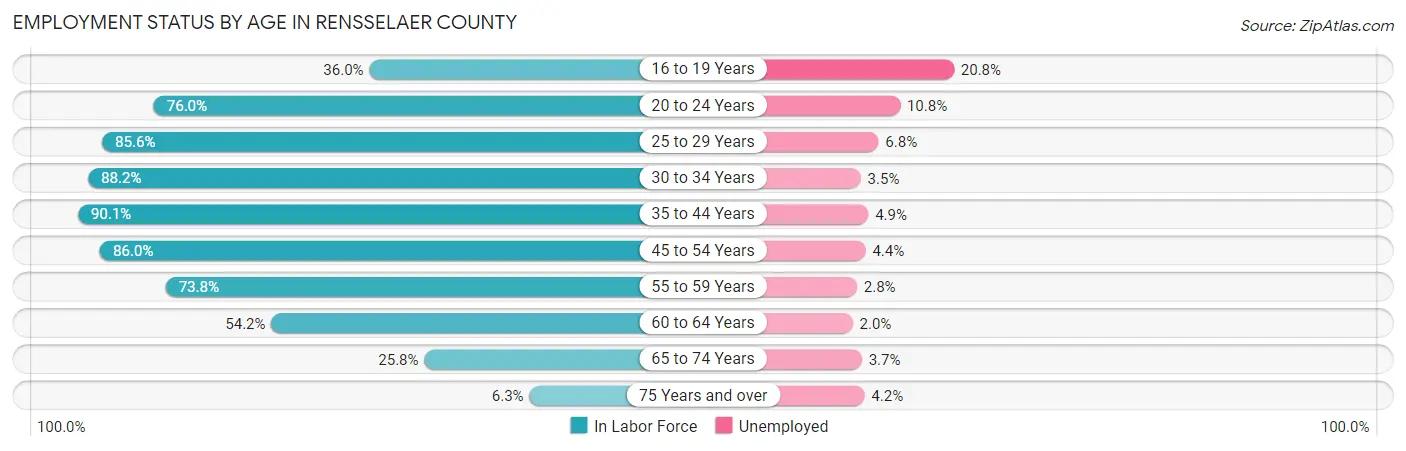
| Age Bracket | In Labor Force | Unemployed |
| 16 to 19 Years | 3,533 (36.0%) | 735 (20.8%) |
| 20 to 24 Years | 8,365 (76.0%) | 903 (10.8%) |
| 25 to 29 Years | 9,438 (85.6%) | 642 (6.8%) |
| 30 to 34 Years | 9,915 (88.2%) | 347 (3.5%) |
| 35 to 44 Years | 18,014 (90.1%) | 883 (4.9%) |
| 45 to 54 Years | 17,078 (86.0%) | 751 (4.4%) |
| 55 to 59 Years | 8,395 (73.8%) | 235 (2.8%) |
| 60 to 64 Years | 6,238 (54.2%) | 125 (2.0%) |
| 65 to 74 Years | 4,415 (25.8%) | 163 (3.7%) |
| 75 Years and over | 710 (6.3%) | 30 (4.2%) |
| Total | 86,160 (64.2%) | 4,825 (5.6%) |
Employment Status by Educational Attainment in Rensselaer County
According to labor force statistics for Rensselaer County, 81.3% of individuals (69,107) out of the total population between 25 and 64 years of age (85,003) are in the labor force, with 4.3% or 2,972 of them being unemployed. The group with the highest labor force participation rate are those with the educational attainment of bachelor's degree or higher, with 89.7% or 28,710 individuals in the labor force. Within the labor force, individuals with less than high school education have the highest percentage of unemployment, with 11.7% or 411 of them being unemployed.
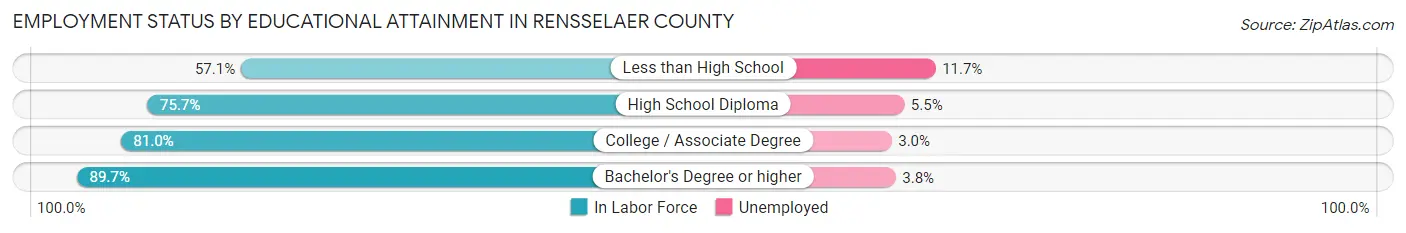
| Educational Attainment | In Labor Force | Unemployed |
| Less than High School | 3,509 (57.1%) | 719 (11.7%) |
| High School Diploma | 15,299 (75.7%) | 1,112 (5.5%) |
| College / Associate Degree | 21,578 (81.0%) | 799 (3.0%) |
| Bachelor's Degree or higher | 28,710 (89.7%) | 1,216 (3.8%) |
| Total | 69,107 (81.3%) | 3,655 (4.3%) |
Employment Occupations by Sex in Rensselaer County
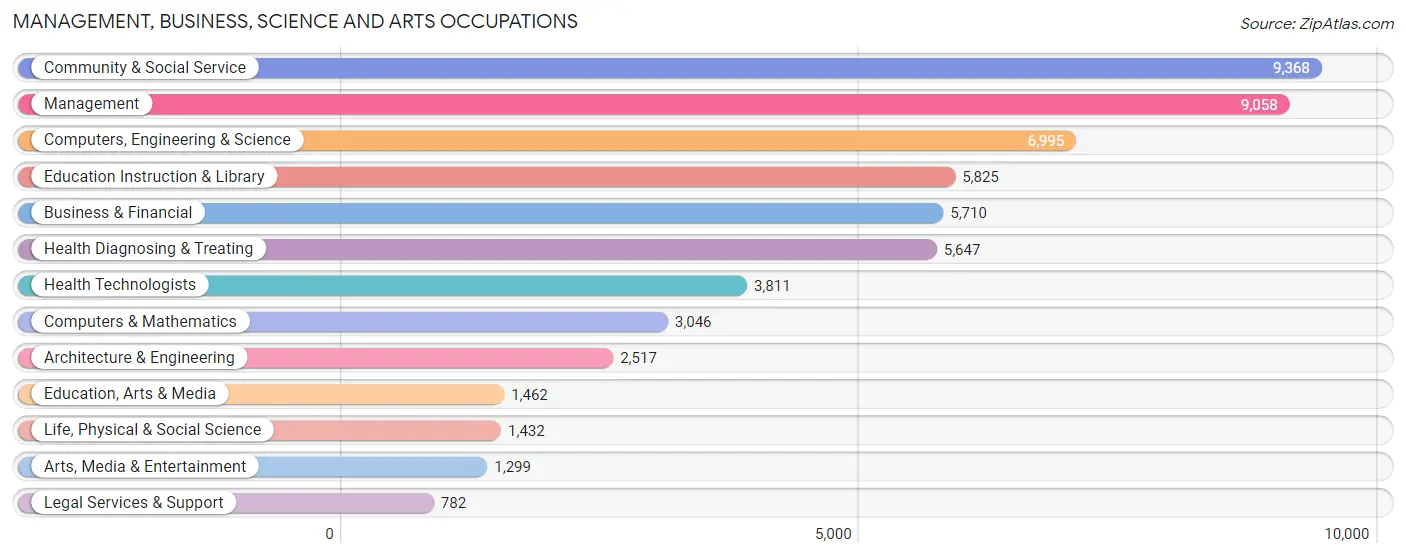
Management, Business, Science and Arts Occupations
The most common Management, Business, Science and Arts occupations in Rensselaer County are Community & Social Service (9,368 | 11.6%), Management (9,058 | 11.2%), Computers, Engineering & Science (6,995 | 8.6%), Education Instruction & Library (5,825 | 7.2%), and Business & Financial (5,710 | 7.0%).
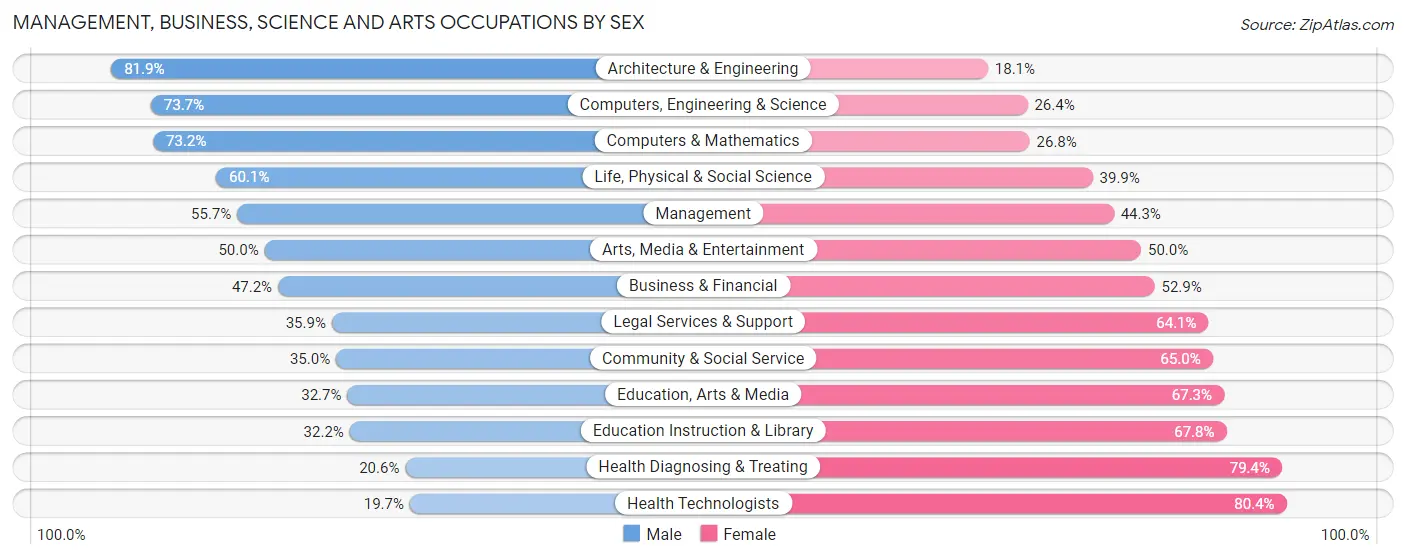
Management, Business, Science and Arts Occupations by Sex
Within the Management, Business, Science and Arts occupations in Rensselaer County, the most male-oriented occupations are Architecture & Engineering (81.9%), Computers, Engineering & Science (73.7%), and Computers & Mathematics (73.2%), while the most female-oriented occupations are Health Technologists (80.3%), Health Diagnosing & Treating (79.4%), and Education Instruction & Library (67.8%).
| Occupation | Male | Female |
| Management | 5,043 (55.7%) | 4,015 (44.3%) |
| Business & Financial | 2,692 (47.1%) | 3,018 (52.8%) |
| Computers, Engineering & Science | 5,152 (73.7%) | 1,843 (26.4%) |
| Computers & Mathematics | 2,230 (73.2%) | 816 (26.8%) |
| Architecture & Engineering | 2,062 (81.9%) | 455 (18.1%) |
| Life, Physical & Social Science | 860 (60.1%) | 572 (39.9%) |
| Community & Social Service | 3,283 (35.0%) | 6,085 (65.0%) |
| Education, Arts & Media | 478 (32.7%) | 984 (67.3%) |
| Legal Services & Support | 281 (35.9%) | 501 (64.1%) |
| Education Instruction & Library | 1,875 (32.2%) | 3,950 (67.8%) |
| Arts, Media & Entertainment | 649 (50.0%) | 650 (50.0%) |
| Health Diagnosing & Treating | 1,163 (20.6%) | 4,484 (79.4%) |
| Health Technologists | 749 (19.7%) | 3,062 (80.3%) |
| Total (Category) | 17,333 (47.1%) | 19,445 (52.9%) |
| Total (Overall) | 42,434 (52.4%) | 38,570 (47.6%) |
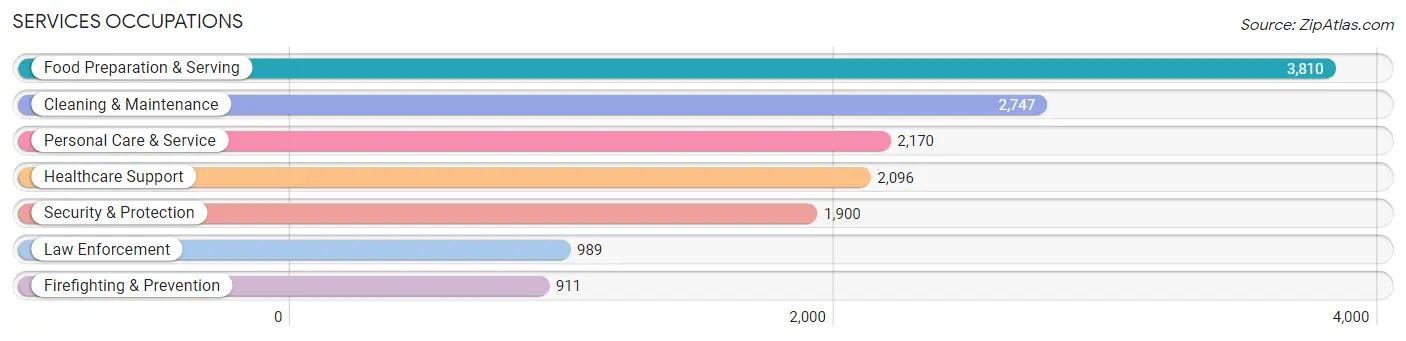
Services Occupations
The most common Services occupations in Rensselaer County are Food Preparation & Serving (3,810 | 4.7%), Cleaning & Maintenance (2,747 | 3.4%), Personal Care & Service (2,170 | 2.7%), Healthcare Support (2,096 | 2.6%), and Security & Protection (1,900 | 2.4%).
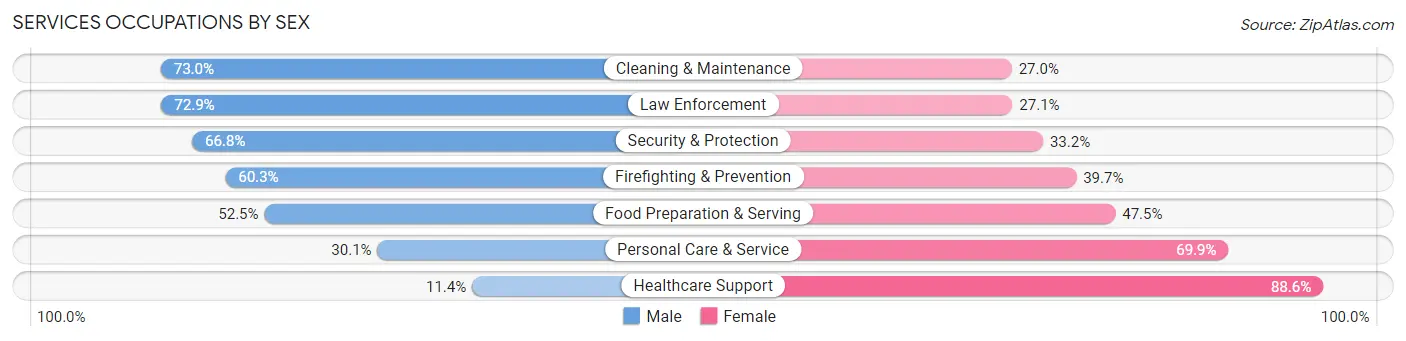
Services Occupations by Sex
Within the Services occupations in Rensselaer County, the most male-oriented occupations are Cleaning & Maintenance (73.0%), Law Enforcement (72.9%), and Security & Protection (66.8%), while the most female-oriented occupations are Healthcare Support (88.6%), Personal Care & Service (69.9%), and Food Preparation & Serving (47.5%).
| Occupation | Male | Female |
| Healthcare Support | 239 (11.4%) | 1,857 (88.6%) |
| Security & Protection | 1,270 (66.8%) | 630 (33.2%) |
| Firefighting & Prevention | 549 (60.3%) | 362 (39.7%) |
| Law Enforcement | 721 (72.9%) | 268 (27.1%) |
| Food Preparation & Serving | 2,001 (52.5%) | 1,809 (47.5%) |
| Cleaning & Maintenance | 2,006 (73.0%) | 741 (27.0%) |
| Personal Care & Service | 654 (30.1%) | 1,516 (69.9%) |
| Total (Category) | 6,170 (48.5%) | 6,553 (51.5%) |
| Total (Overall) | 42,434 (52.4%) | 38,570 (47.6%) |
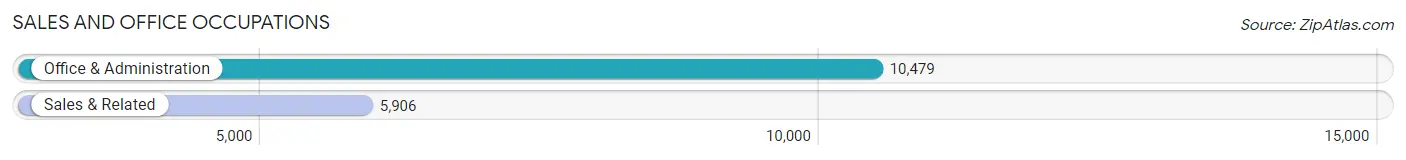
Sales and Office Occupations
The most common Sales and Office occupations in Rensselaer County are Office & Administration (10,479 | 12.9%), and Sales & Related (5,906 | 7.3%).
Sales and Office Occupations by Sex
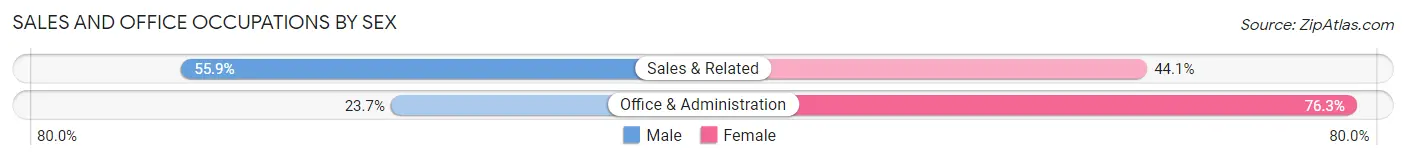
| Occupation | Male | Female |
| Sales & Related | 3,301 (55.9%) | 2,605 (44.1%) |
| Office & Administration | 2,480 (23.7%) | 7,999 (76.3%) |
| Total (Category) | 5,781 (35.3%) | 10,604 (64.7%) |
| Total (Overall) | 42,434 (52.4%) | 38,570 (47.6%) |
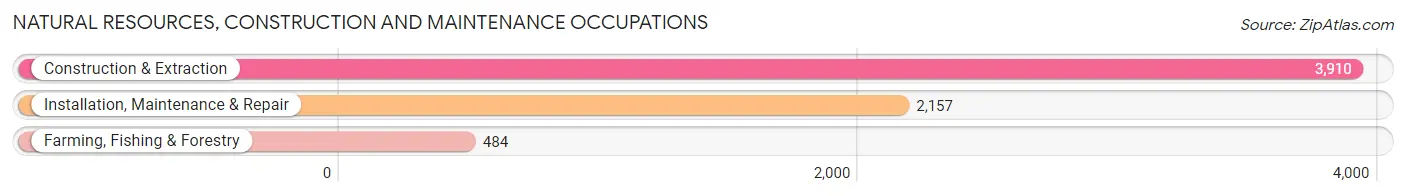
Natural Resources, Construction and Maintenance Occupations
The most common Natural Resources, Construction and Maintenance occupations in Rensselaer County are Construction & Extraction (3,910 | 4.8%), Installation, Maintenance & Repair (2,157 | 2.7%), and Farming, Fishing & Forestry (484 | 0.6%).
Natural Resources, Construction and Maintenance Occupations by Sex
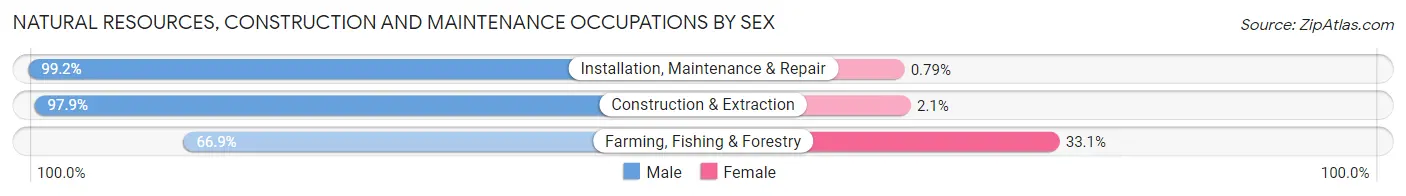
| Occupation | Male | Female |
| Farming, Fishing & Forestry | 324 (66.9%) | 160 (33.1%) |
| Construction & Extraction | 3,828 (97.9%) | 82 (2.1%) |
| Installation, Maintenance & Repair | 2,140 (99.2%) | 17 (0.8%) |
| Total (Category) | 6,292 (96.1%) | 259 (4.0%) |
| Total (Overall) | 42,434 (52.4%) | 38,570 (47.6%) |
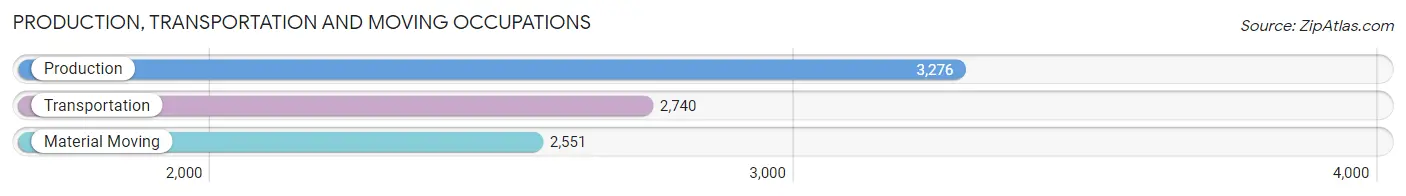
Production, Transportation and Moving Occupations
The most common Production, Transportation and Moving occupations in Rensselaer County are Production (3,276 | 4.0%), Transportation (2,740 | 3.4%), and Material Moving (2,551 | 3.2%).
Production, Transportation and Moving Occupations by Sex
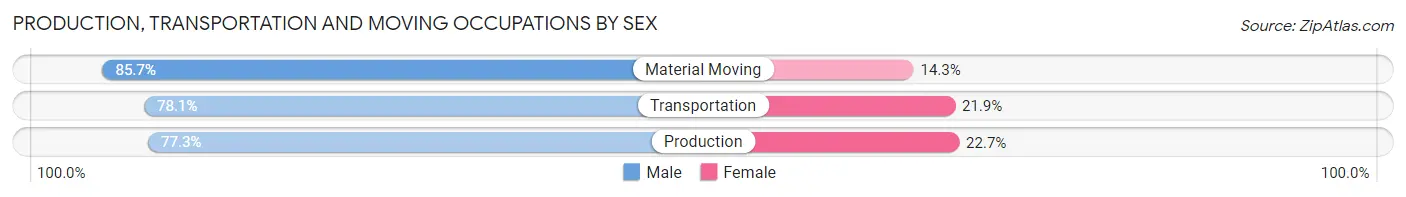
| Occupation | Male | Female |
| Production | 2,533 (77.3%) | 743 (22.7%) |
| Transportation | 2,139 (78.1%) | 601 (21.9%) |
| Material Moving | 2,186 (85.7%) | 365 (14.3%) |
| Total (Category) | 6,858 (80.0%) | 1,709 (20.0%) |
| Total (Overall) | 42,434 (52.4%) | 38,570 (47.6%) |
Employment Industries by Sex in Rensselaer County
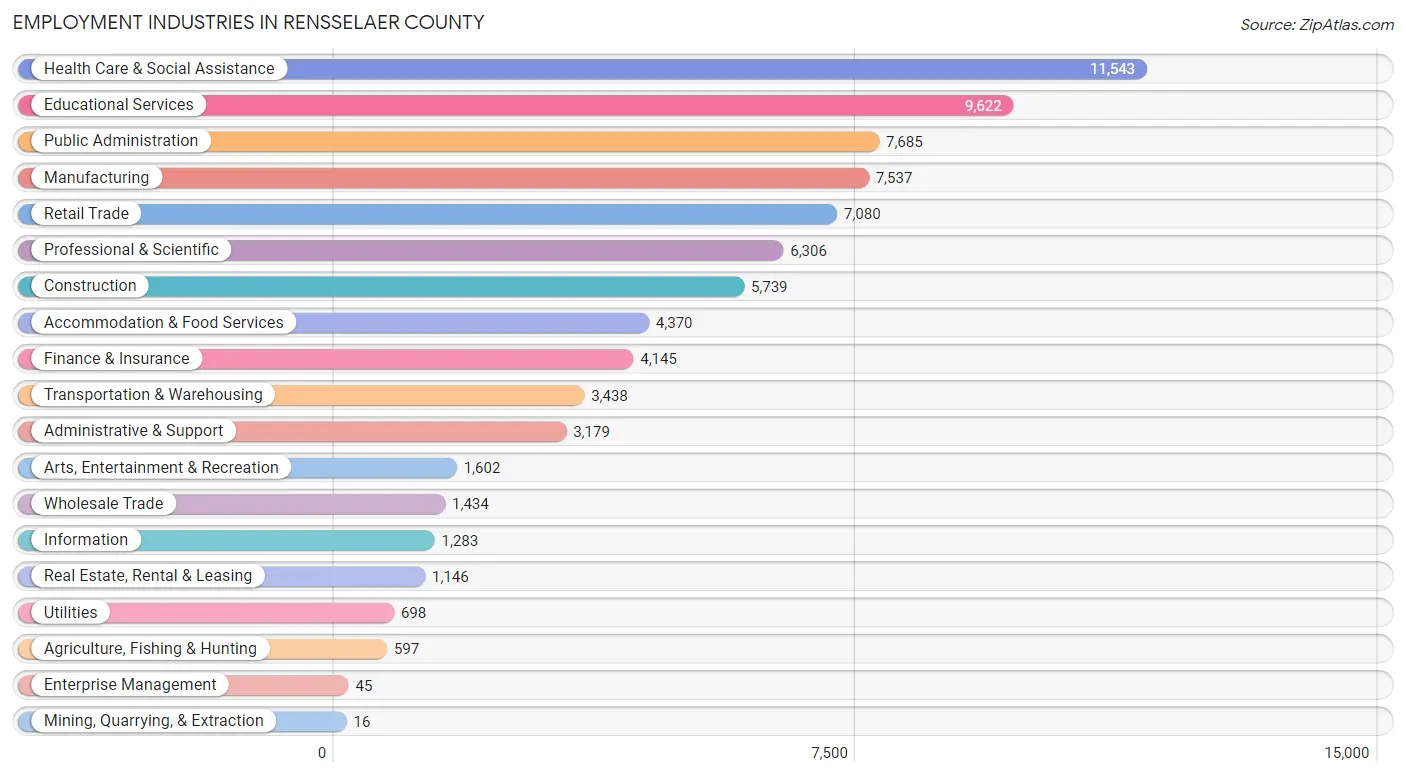
Employment Industries in Rensselaer County
The major employment industries in Rensselaer County include Health Care & Social Assistance (11,543 | 14.2%), Educational Services (9,622 | 11.9%), Public Administration (7,685 | 9.5%), Manufacturing (7,537 | 9.3%), and Retail Trade (7,080 | 8.7%).
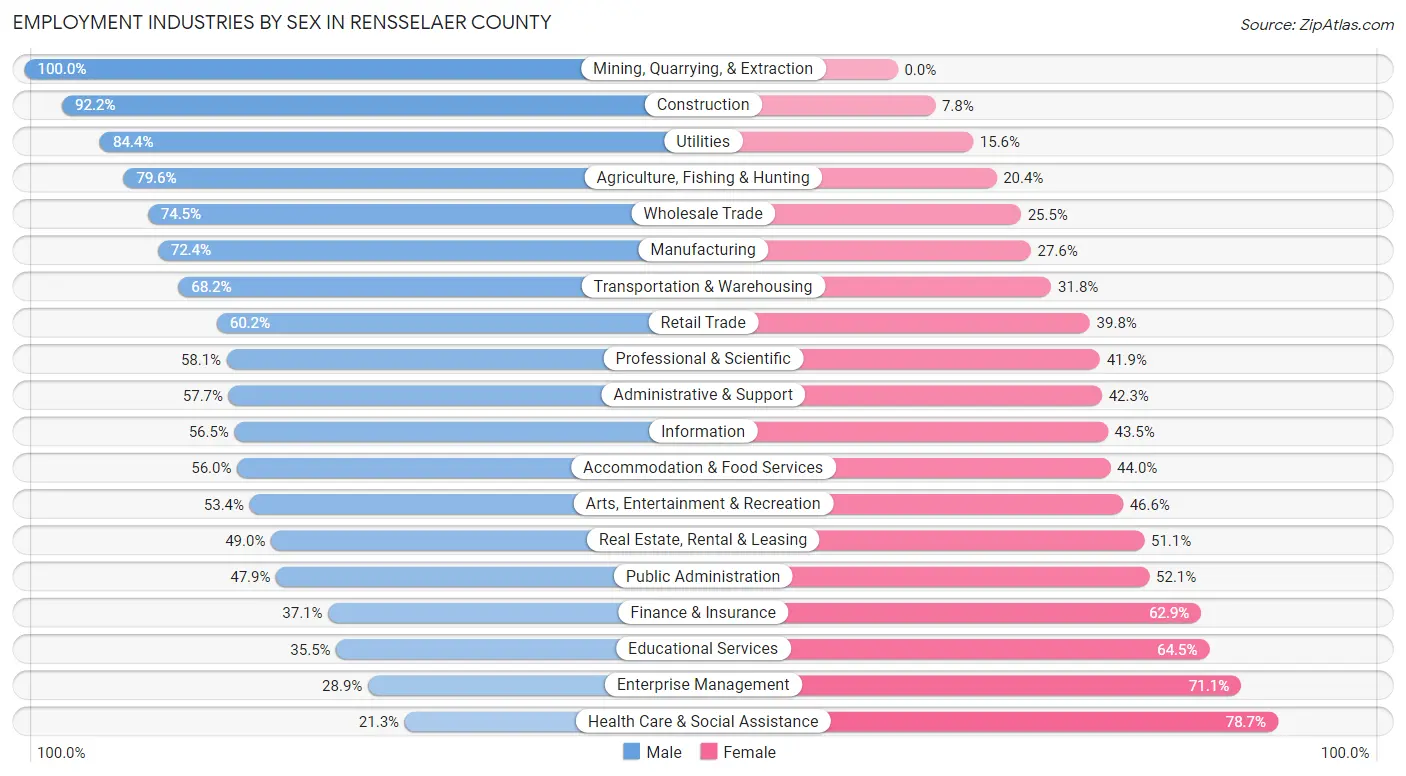
Employment Industries by Sex in Rensselaer County
The Rensselaer County industries that see more men than women are Mining, Quarrying, & Extraction (100.0%), Construction (92.2%), and Utilities (84.4%), whereas the industries that tend to have a higher number of women are Health Care & Social Assistance (78.7%), Enterprise Management (71.1%), and Educational Services (64.5%).
| Industry | Male | Female |
| Agriculture, Fishing & Hunting | 475 (79.6%) | 122 (20.4%) |
| Mining, Quarrying, & Extraction | 16 (100.0%) | 0 (0.0%) |
| Construction | 5,293 (92.2%) | 446 (7.8%) |
| Manufacturing | 5,459 (72.4%) | 2,078 (27.6%) |
| Wholesale Trade | 1,068 (74.5%) | 366 (25.5%) |
| Retail Trade | 4,263 (60.2%) | 2,817 (39.8%) |
| Transportation & Warehousing | 2,344 (68.2%) | 1,094 (31.8%) |
| Utilities | 589 (84.4%) | 109 (15.6%) |
| Information | 725 (56.5%) | 558 (43.5%) |
| Finance & Insurance | 1,539 (37.1%) | 2,606 (62.9%) |
| Real Estate, Rental & Leasing | 561 (48.9%) | 585 (51.0%) |
| Professional & Scientific | 3,665 (58.1%) | 2,641 (41.9%) |
| Enterprise Management | 13 (28.9%) | 32 (71.1%) |
| Administrative & Support | 1,835 (57.7%) | 1,344 (42.3%) |
| Educational Services | 3,412 (35.5%) | 6,210 (64.5%) |
| Health Care & Social Assistance | 2,456 (21.3%) | 9,087 (78.7%) |
| Arts, Entertainment & Recreation | 855 (53.4%) | 747 (46.6%) |
| Accommodation & Food Services | 2,446 (56.0%) | 1,924 (44.0%) |
| Public Administration | 3,681 (47.9%) | 4,004 (52.1%) |
| Total | 42,434 (52.4%) | 38,570 (47.6%) |
Education in Rensselaer County
School Enrollment in Rensselaer County
The most common levels of schooling among the 37,524 students in Rensselaer County are college / undergraduate (10,506 | 28.0%), high school (7,779 | 20.7%), and elementary school (7,306 | 19.5%).
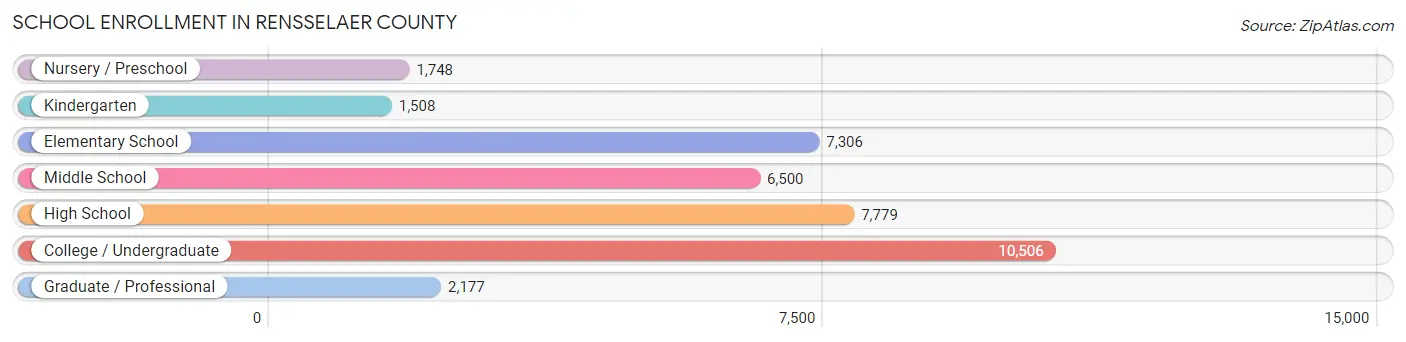
| School Level | # Students | % Students |
| Nursery / Preschool | 1,748 | 4.7% |
| Kindergarten | 1,508 | 4.0% |
| Elementary School | 7,306 | 19.5% |
| Middle School | 6,500 | 17.3% |
| High School | 7,779 | 20.7% |
| College / Undergraduate | 10,506 | 28.0% |
| Graduate / Professional | 2,177 | 5.8% |
| Total | 37,524 | 100.0% |
School Enrollment by Age by Funding Source in Rensselaer County
Out of a total of 37,524 students who are enrolled in schools in Rensselaer County, 10,694 (28.5%) attend a private institution, while the remaining 26,830 (71.5%) are enrolled in public schools. The age group of 20 to 24 year olds has the highest likelihood of being enrolled in private schools, with 3,157 (67.6% in the age bracket) enrolled. Conversely, the age group of 15 to 17 year olds has the lowest likelihood of being enrolled in a private school, with 4,884 (91.3% in the age bracket) attending a public institution.
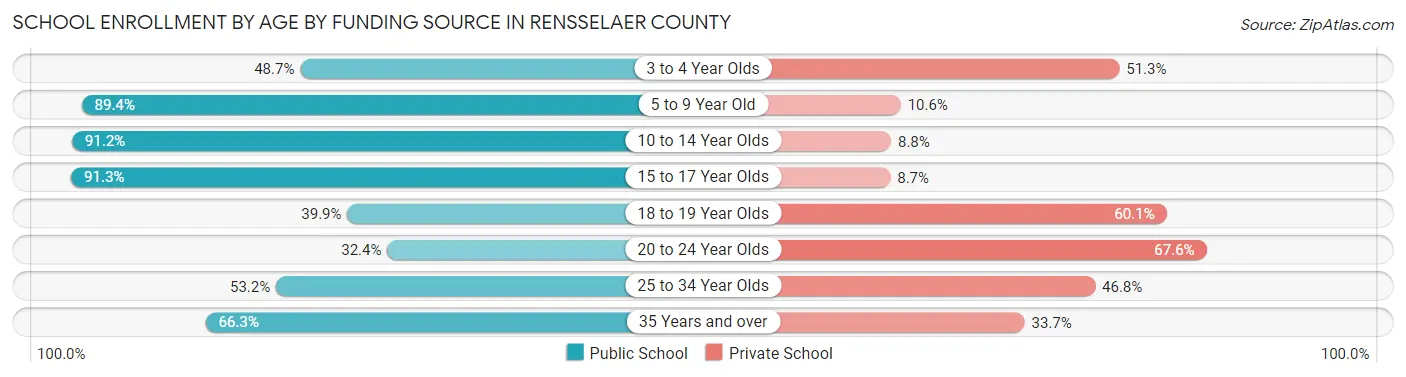
| Age Bracket | Public School | Private School |
| 3 to 4 Year Olds | 760 (48.7%) | 802 (51.3%) |
| 5 to 9 Year Old | 7,293 (89.4%) | 867 (10.6%) |
| 10 to 14 Year Olds | 7,958 (91.2%) | 770 (8.8%) |
| 15 to 17 Year Olds | 4,884 (91.3%) | 464 (8.7%) |
| 18 to 19 Year Olds | 1,996 (39.9%) | 3,009 (60.1%) |
| 20 to 24 Year Olds | 1,516 (32.4%) | 3,157 (67.6%) |
| 25 to 34 Year Olds | 1,048 (53.2%) | 923 (46.8%) |
| 35 Years and over | 1,377 (66.3%) | 700 (33.7%) |
| Total | 26,830 (71.5%) | 10,694 (28.5%) |
Educational Attainment by Field of Study in Rensselaer County
Business (6,511 | 14.9%), education (4,981 | 11.4%), social sciences (4,188 | 9.6%), science & technology (3,669 | 8.4%), and engineering (3,393 | 7.8%) are the most common fields of study among 43,592 individuals in Rensselaer County who have obtained a bachelor's degree or higher.
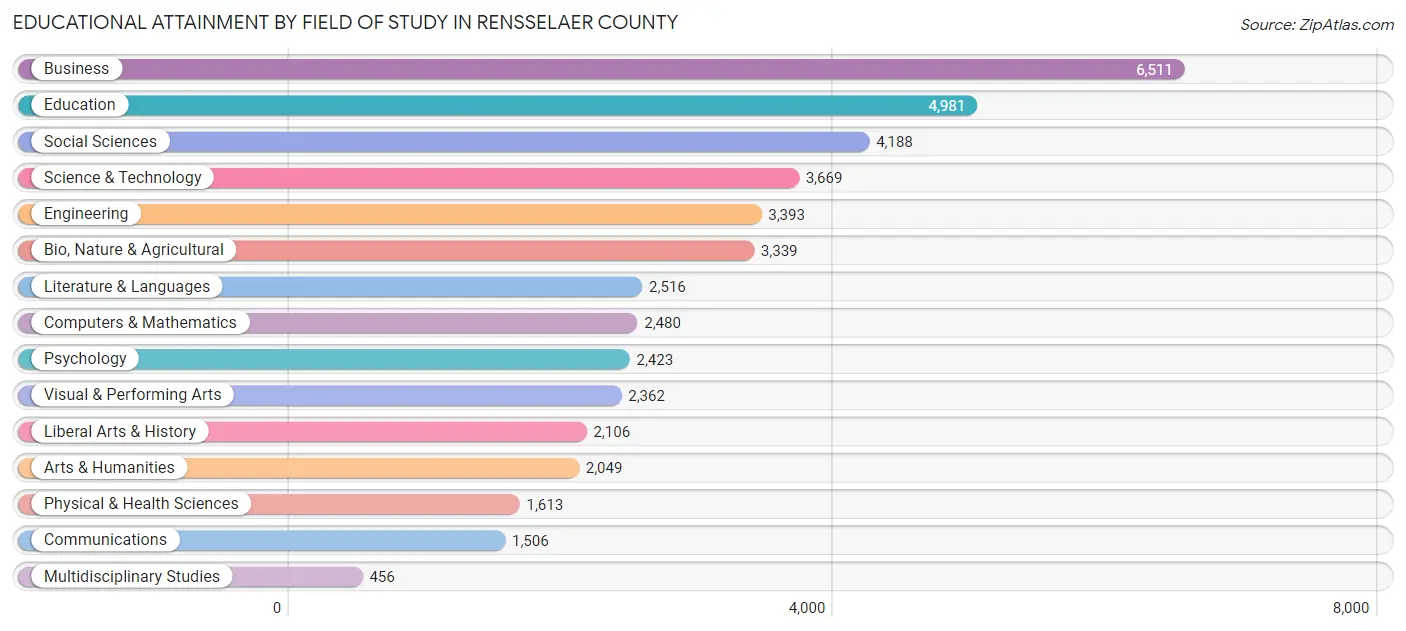
| Field of Study | # Graduates | % Graduates |
| Computers & Mathematics | 2,480 | 5.7% |
| Bio, Nature & Agricultural | 3,339 | 7.7% |
| Physical & Health Sciences | 1,613 | 3.7% |
| Psychology | 2,423 | 5.6% |
| Social Sciences | 4,188 | 9.6% |
| Engineering | 3,393 | 7.8% |
| Multidisciplinary Studies | 456 | 1.1% |
| Science & Technology | 3,669 | 8.4% |
| Business | 6,511 | 14.9% |
| Education | 4,981 | 11.4% |
| Literature & Languages | 2,516 | 5.8% |
| Liberal Arts & History | 2,106 | 4.8% |
| Visual & Performing Arts | 2,362 | 5.4% |
| Communications | 1,506 | 3.5% |
| Arts & Humanities | 2,049 | 4.7% |
| Total | 43,592 | 100.0% |
Transportation & Commute in Rensselaer County
Vehicle Availability by Sex in Rensselaer County
The most prevalent vehicle ownership categories in Rensselaer County are males with 2 vehicles (17,889, accounting for 43.2%) and females with 2 vehicles (16,040, making up 48.5%).
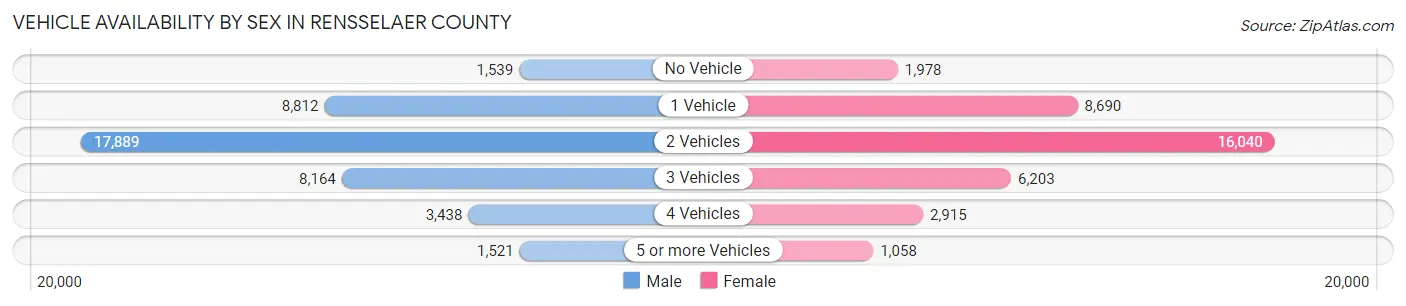
| Vehicles Available | Male | Female |
| No Vehicle | 1,539 (3.7%) | 1,978 (5.4%) |
| 1 Vehicle | 8,812 (21.3%) | 8,690 (23.6%) |
| 2 Vehicles | 17,889 (43.2%) | 16,040 (43.5%) |
| 3 Vehicles | 8,164 (19.7%) | 6,203 (16.8%) |
| 4 Vehicles | 3,438 (8.3%) | 2,915 (7.9%) |
| 5 or more Vehicles | 1,521 (3.7%) | 1,058 (2.9%) |
| Total | 41,363 (100.0%) | 36,884 (100.0%) |
Commute Time in Rensselaer County
The most frequently occuring commute durations in Rensselaer County are 20 to 24 minutes (13,053 commuters, 18.6%), 15 to 19 minutes (12,084 commuters, 17.2%), and 30 to 34 minutes (8,776 commuters, 12.5%).
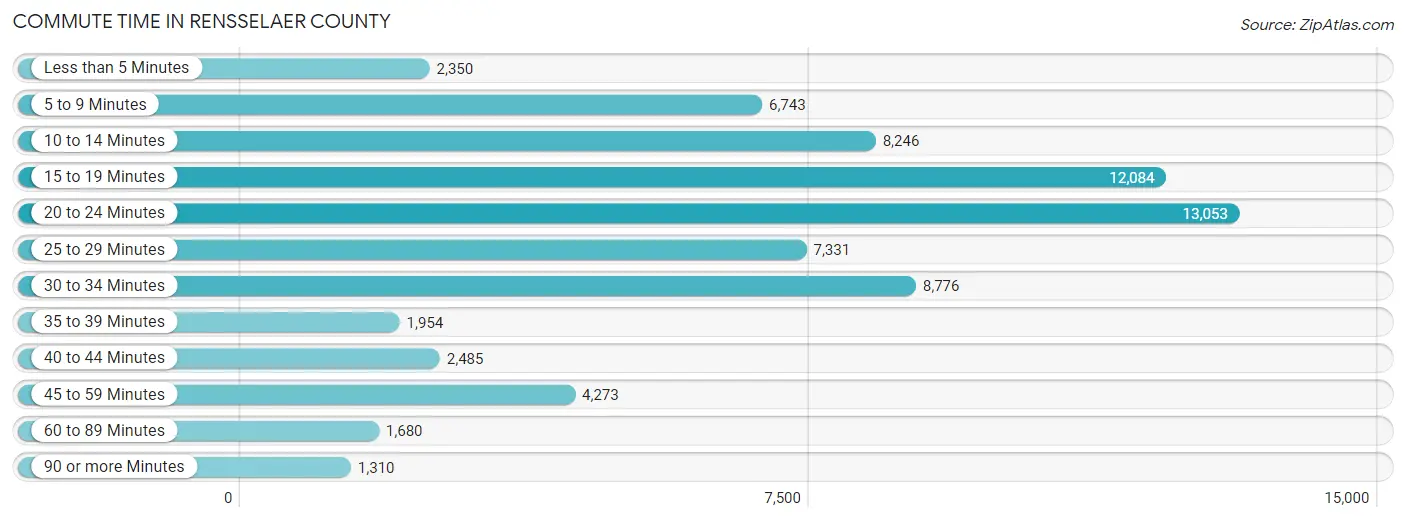
| Commute Time | # Commuters | % Commuters |
| Less than 5 Minutes | 2,350 | 3.3% |
| 5 to 9 Minutes | 6,743 | 9.6% |
| 10 to 14 Minutes | 8,246 | 11.7% |
| 15 to 19 Minutes | 12,084 | 17.2% |
| 20 to 24 Minutes | 13,053 | 18.6% |
| 25 to 29 Minutes | 7,331 | 10.4% |
| 30 to 34 Minutes | 8,776 | 12.5% |
| 35 to 39 Minutes | 1,954 | 2.8% |
| 40 to 44 Minutes | 2,485 | 3.5% |
| 45 to 59 Minutes | 4,273 | 6.1% |
| 60 to 89 Minutes | 1,680 | 2.4% |
| 90 or more Minutes | 1,310 | 1.9% |
Commute Time by Sex in Rensselaer County
The most common commute times in Rensselaer County are 20 to 24 minutes (6,753 commuters, 17.9%) for males and 20 to 24 minutes (6,300 commuters, 19.4%) for females.
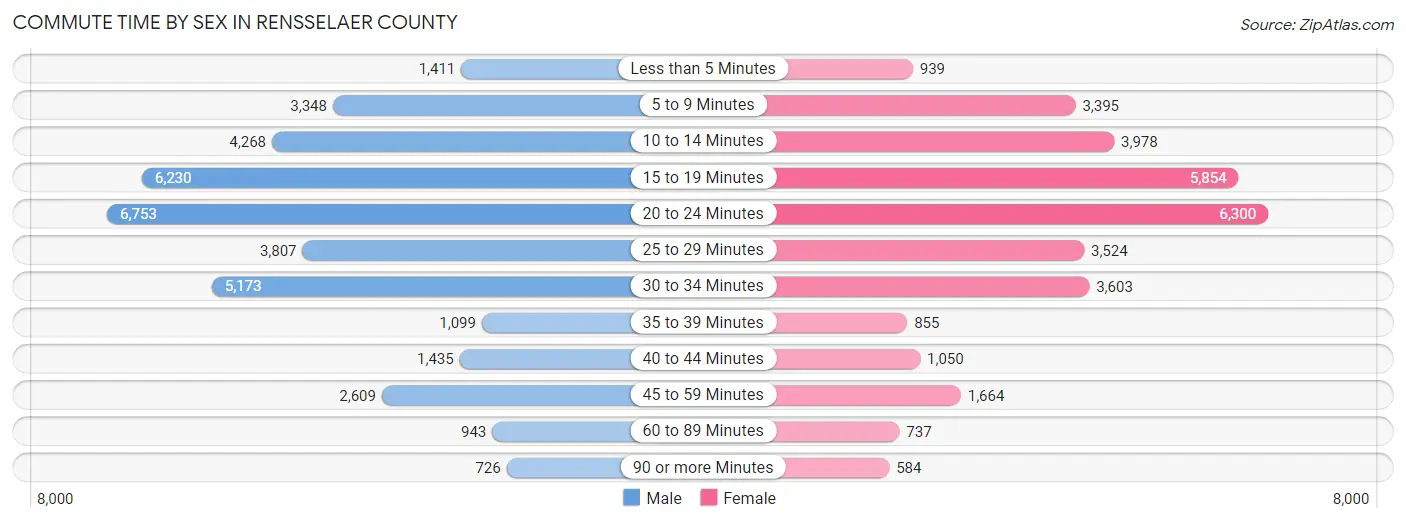
| Commute Time | Male | Female |
| Less than 5 Minutes | 1,411 (3.7%) | 939 (2.9%) |
| 5 to 9 Minutes | 3,348 (8.9%) | 3,395 (10.4%) |
| 10 to 14 Minutes | 4,268 (11.3%) | 3,978 (12.2%) |
| 15 to 19 Minutes | 6,230 (16.5%) | 5,854 (18.0%) |
| 20 to 24 Minutes | 6,753 (17.9%) | 6,300 (19.4%) |
| 25 to 29 Minutes | 3,807 (10.1%) | 3,524 (10.8%) |
| 30 to 34 Minutes | 5,173 (13.7%) | 3,603 (11.1%) |
| 35 to 39 Minutes | 1,099 (2.9%) | 855 (2.6%) |
| 40 to 44 Minutes | 1,435 (3.8%) | 1,050 (3.2%) |
| 45 to 59 Minutes | 2,609 (6.9%) | 1,664 (5.1%) |
| 60 to 89 Minutes | 943 (2.5%) | 737 (2.3%) |
| 90 or more Minutes | 726 (1.9%) | 584 (1.8%) |
Time of Departure to Work by Sex in Rensselaer County
The most frequent times of departure to work in Rensselaer County are 7:00 AM to 7:29 AM (5,395, 14.3%) for males and 7:00 AM to 7:29 AM (5,681, 17.5%) for females.
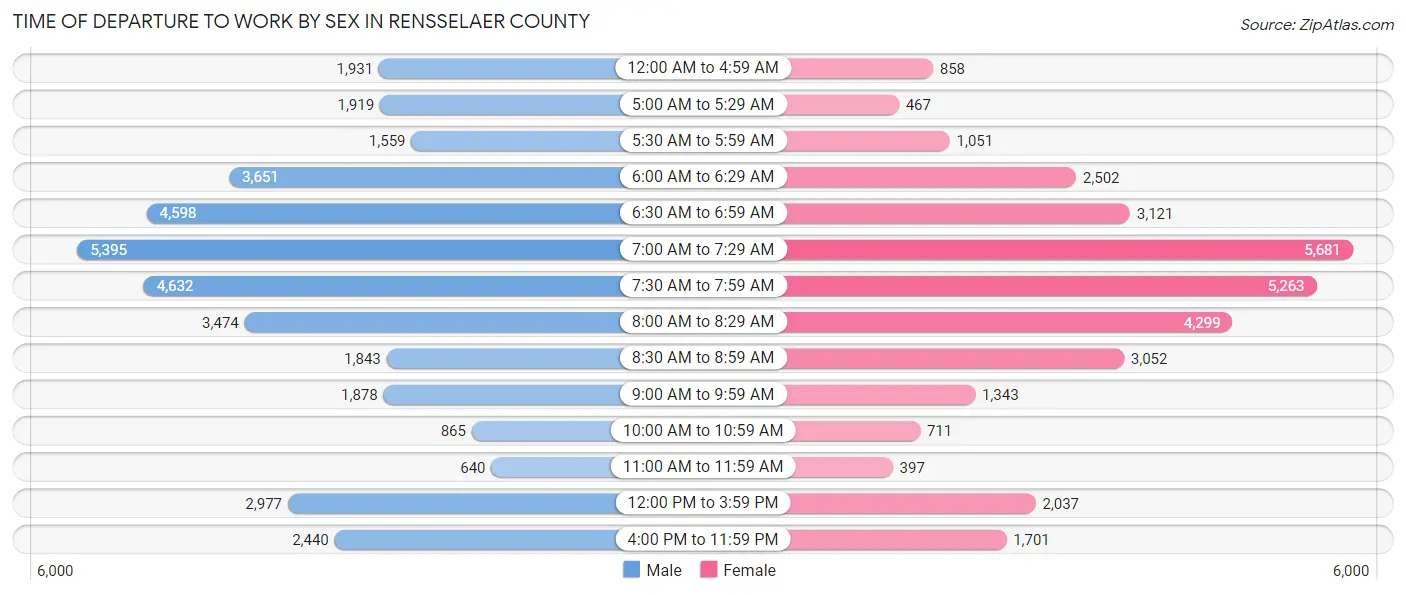
| Time of Departure | Male | Female |
| 12:00 AM to 4:59 AM | 1,931 (5.1%) | 858 (2.6%) |
| 5:00 AM to 5:29 AM | 1,919 (5.1%) | 467 (1.4%) |
| 5:30 AM to 5:59 AM | 1,559 (4.1%) | 1,051 (3.2%) |
| 6:00 AM to 6:29 AM | 3,651 (9.7%) | 2,502 (7.7%) |
| 6:30 AM to 6:59 AM | 4,598 (12.2%) | 3,121 (9.6%) |
| 7:00 AM to 7:29 AM | 5,395 (14.3%) | 5,681 (17.5%) |
| 7:30 AM to 7:59 AM | 4,632 (12.2%) | 5,263 (16.2%) |
| 8:00 AM to 8:29 AM | 3,474 (9.2%) | 4,299 (13.2%) |
| 8:30 AM to 8:59 AM | 1,843 (4.9%) | 3,052 (9.4%) |
| 9:00 AM to 9:59 AM | 1,878 (5.0%) | 1,343 (4.1%) |
| 10:00 AM to 10:59 AM | 865 (2.3%) | 711 (2.2%) |
| 11:00 AM to 11:59 AM | 640 (1.7%) | 397 (1.2%) |
| 12:00 PM to 3:59 PM | 2,977 (7.9%) | 2,037 (6.3%) |
| 4:00 PM to 11:59 PM | 2,440 (6.5%) | 1,701 (5.2%) |
| Total | 37,802 (100.0%) | 32,483 (100.0%) |
Housing Occupancy in Rensselaer County
Occupancy by Ownership in Rensselaer County
Of the total 66,088 dwellings in Rensselaer County, owner-occupied units account for 41,507 (62.8%), while renter-occupied units make up 24,581 (37.2%).
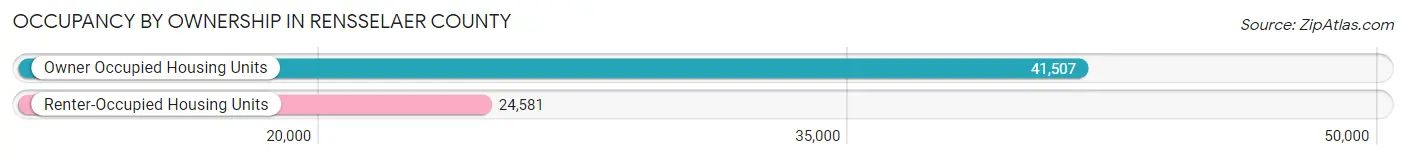
| Occupancy | # Housing Units | % Housing Units |
| Owner Occupied Housing Units | 41,507 | 62.8% |
| Renter-Occupied Housing Units | 24,581 | 37.2% |
| Total Occupied Housing Units | 66,088 | 100.0% |
Occupancy by Household Size in Rensselaer County
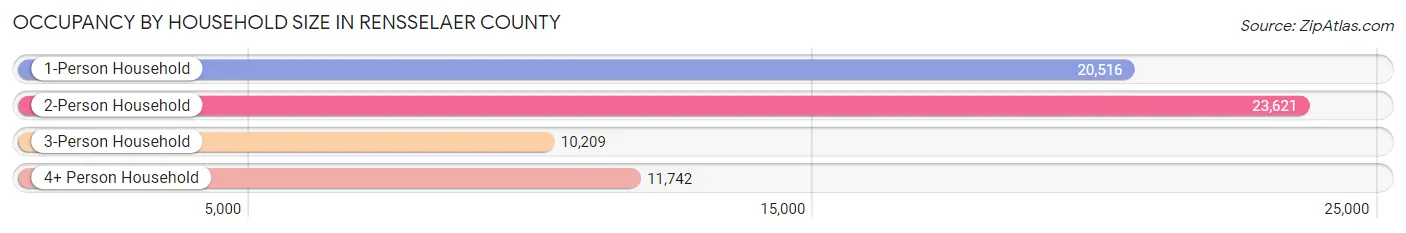
| Household Size | # Housing Units | % Housing Units |
| 1-Person Household | 20,516 | 31.0% |
| 2-Person Household | 23,621 | 35.7% |
| 3-Person Household | 10,209 | 15.4% |
| 4+ Person Household | 11,742 | 17.8% |
| Total Housing Units | 66,088 | 100.0% |
Occupancy by Ownership by Household Size in Rensselaer County
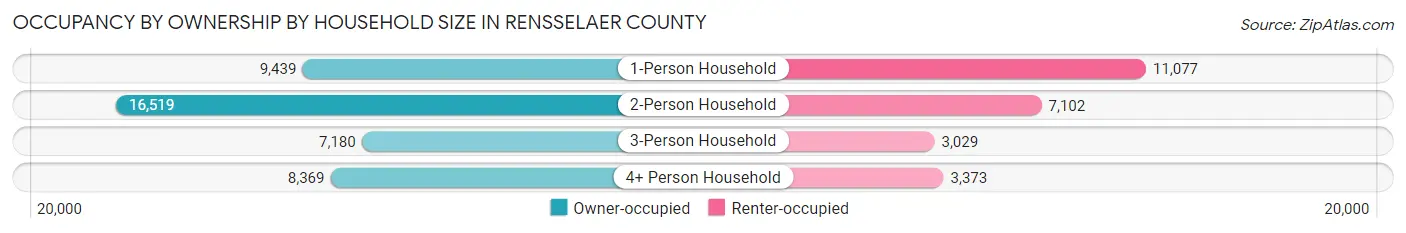
| Household Size | Owner-occupied | Renter-occupied |
| 1-Person Household | 9,439 (46.0%) | 11,077 (54.0%) |
| 2-Person Household | 16,519 (69.9%) | 7,102 (30.1%) |
| 3-Person Household | 7,180 (70.3%) | 3,029 (29.7%) |
| 4+ Person Household | 8,369 (71.3%) | 3,373 (28.7%) |
| Total Housing Units | 41,507 (62.8%) | 24,581 (37.2%) |
Occupancy by Educational Attainment in Rensselaer County
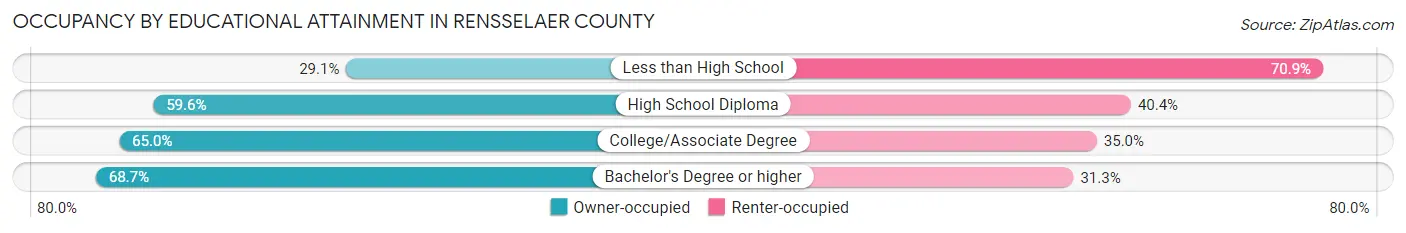
| Household Size | Owner-occupied | Renter-occupied |
| Less than High School | 1,245 (29.1%) | 3,028 (70.9%) |
| High School Diploma | 9,249 (59.6%) | 6,272 (40.4%) |
| College/Associate Degree | 13,894 (65.0%) | 7,480 (35.0%) |
| Bachelor's Degree or higher | 17,119 (68.7%) | 7,801 (31.3%) |
Occupancy by Age of Householder in Rensselaer County
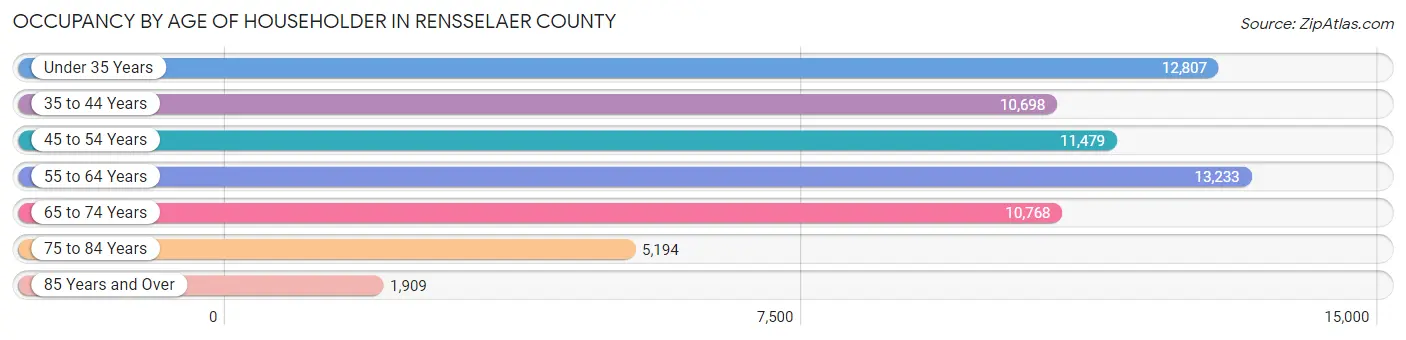
| Age Bracket | # Households | % Households |
| Under 35 Years | 12,807 | 19.4% |
| 35 to 44 Years | 10,698 | 16.2% |
| 45 to 54 Years | 11,479 | 17.4% |
| 55 to 64 Years | 13,233 | 20.0% |
| 65 to 74 Years | 10,768 | 16.3% |
| 75 to 84 Years | 5,194 | 7.9% |
| 85 Years and Over | 1,909 | 2.9% |
| Total | 66,088 | 100.0% |
Housing Finances in Rensselaer County
Median Income by Occupancy in Rensselaer County
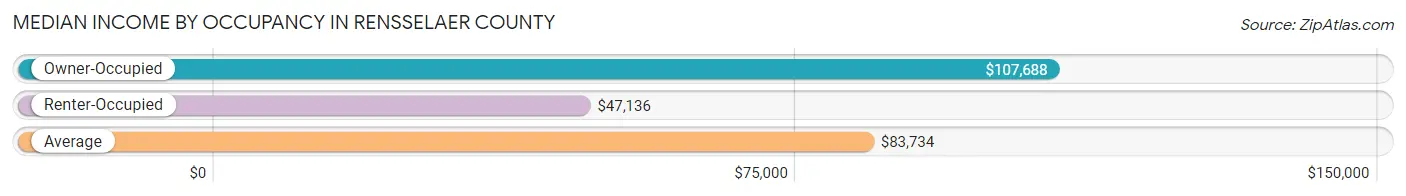
| Occupancy Type | # Households | Median Income |
| Owner-Occupied | 41,507 (62.8%) | $107,688 |
| Renter-Occupied | 24,581 (37.2%) | $47,136 |
| Average | 66,088 (100.0%) | $83,734 |
Occupancy by Householder Income Bracket in Rensselaer County
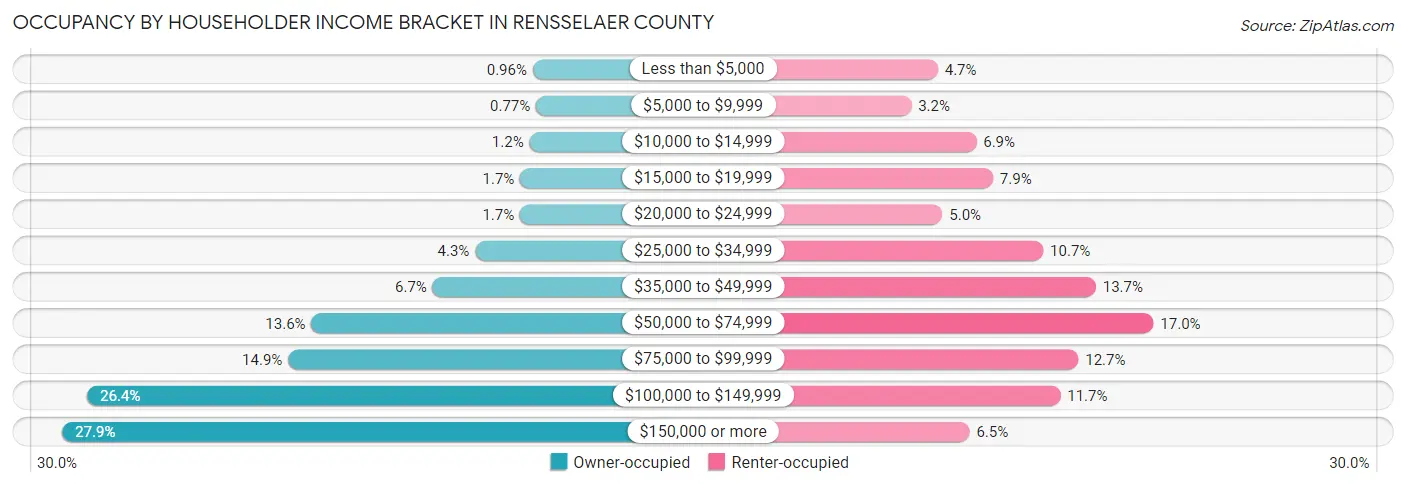
| Income Bracket | Owner-occupied | Renter-occupied |
| Less than $5,000 | 397 (1.0%) | 1,155 (4.7%) |
| $5,000 to $9,999 | 319 (0.8%) | 782 (3.2%) |
| $10,000 to $14,999 | 476 (1.1%) | 1,697 (6.9%) |
| $15,000 to $19,999 | 697 (1.7%) | 1,929 (7.9%) |
| $20,000 to $24,999 | 701 (1.7%) | 1,218 (5.0%) |
| $25,000 to $34,999 | 1,762 (4.3%) | 2,634 (10.7%) |
| $35,000 to $49,999 | 2,771 (6.7%) | 3,376 (13.7%) |
| $50,000 to $74,999 | 5,650 (13.6%) | 4,184 (17.0%) |
| $75,000 to $99,999 | 6,200 (14.9%) | 3,130 (12.7%) |
| $100,000 to $149,999 | 10,969 (26.4%) | 2,876 (11.7%) |
| $150,000 or more | 11,565 (27.9%) | 1,600 (6.5%) |
| Total | 41,507 (100.0%) | 24,581 (100.0%) |
Monthly Housing Cost Tiers in Rensselaer County
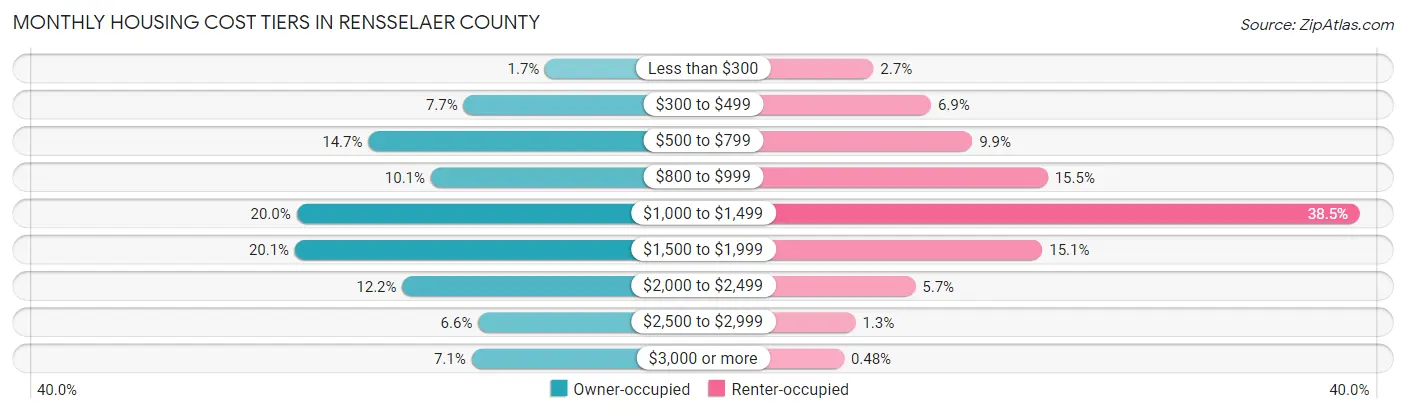
| Monthly Cost | Owner-occupied | Renter-occupied |
| Less than $300 | 688 (1.7%) | 652 (2.6%) |
| $300 to $499 | 3,184 (7.7%) | 1,693 (6.9%) |
| $500 to $799 | 6,096 (14.7%) | 2,442 (9.9%) |
| $800 to $999 | 4,182 (10.1%) | 3,807 (15.5%) |
| $1,000 to $1,499 | 8,290 (20.0%) | 9,458 (38.5%) |
| $1,500 to $1,999 | 8,339 (20.1%) | 3,709 (15.1%) |
| $2,000 to $2,499 | 5,054 (12.2%) | 1,410 (5.7%) |
| $2,500 to $2,999 | 2,735 (6.6%) | 327 (1.3%) |
| $3,000 or more | 2,939 (7.1%) | 117 (0.5%) |
| Total | 41,507 (100.0%) | 24,581 (100.0%) |
Physical Housing Characteristics in Rensselaer County
Housing Structures in Rensselaer County
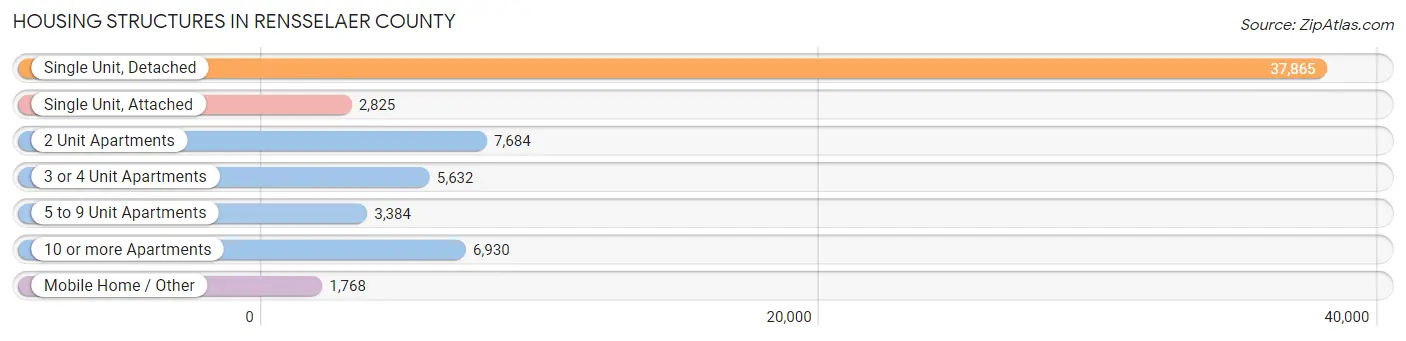
| Structure Type | # Housing Units | % Housing Units |
| Single Unit, Detached | 37,865 | 57.3% |
| Single Unit, Attached | 2,825 | 4.3% |
| 2 Unit Apartments | 7,684 | 11.6% |
| 3 or 4 Unit Apartments | 5,632 | 8.5% |
| 5 to 9 Unit Apartments | 3,384 | 5.1% |
| 10 or more Apartments | 6,930 | 10.5% |
| Mobile Home / Other | 1,768 | 2.7% |
| Total | 66,088 | 100.0% |
Housing Structures by Occupancy in Rensselaer County
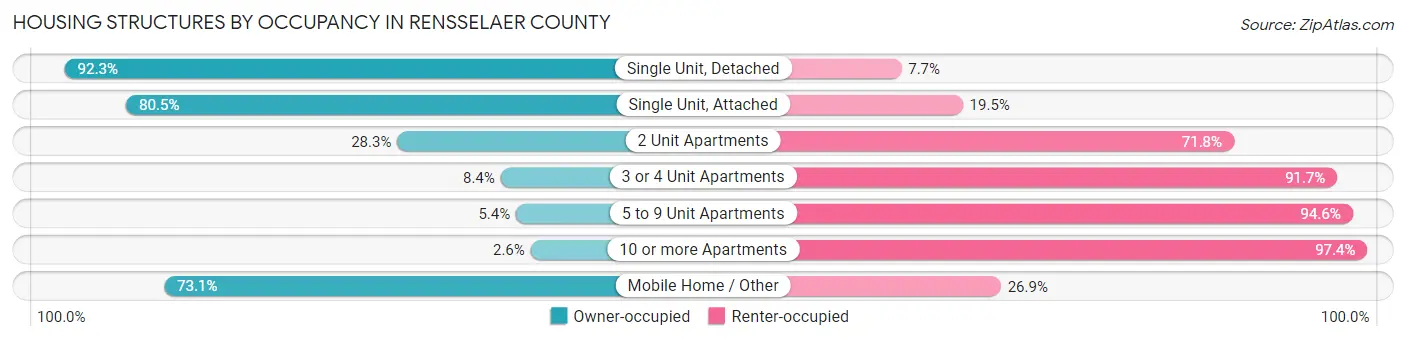
| Structure Type | Owner-occupied | Renter-occupied |
| Single Unit, Detached | 34,940 (92.3%) | 2,925 (7.7%) |
| Single Unit, Attached | 2,273 (80.5%) | 552 (19.5%) |
| 2 Unit Apartments | 2,171 (28.2%) | 5,513 (71.8%) |
| 3 or 4 Unit Apartments | 470 (8.4%) | 5,162 (91.6%) |
| 5 to 9 Unit Apartments | 182 (5.4%) | 3,202 (94.6%) |
| 10 or more Apartments | 178 (2.6%) | 6,752 (97.4%) |
| Mobile Home / Other | 1,293 (73.1%) | 475 (26.9%) |
| Total | 41,507 (62.8%) | 24,581 (37.2%) |
Housing Structures by Number of Rooms in Rensselaer County
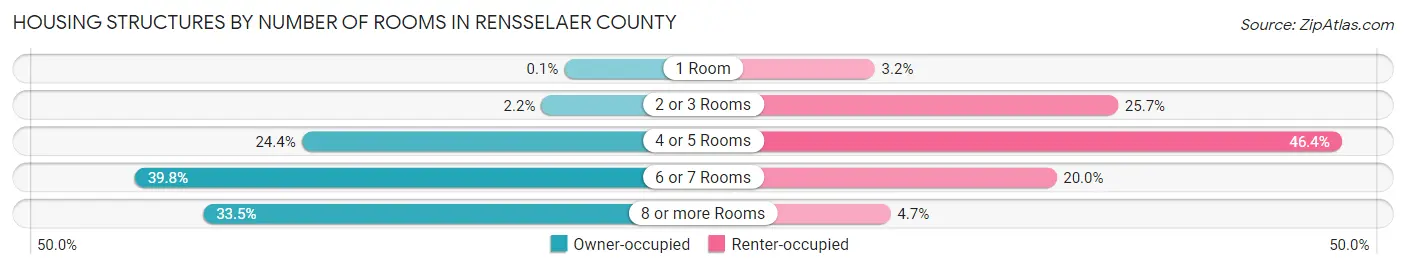
| Number of Rooms | Owner-occupied | Renter-occupied |
| 1 Room | 43 (0.1%) | 790 (3.2%) |
| 2 or 3 Rooms | 921 (2.2%) | 6,320 (25.7%) |
| 4 or 5 Rooms | 10,125 (24.4%) | 11,404 (46.4%) |
| 6 or 7 Rooms | 16,522 (39.8%) | 4,919 (20.0%) |
| 8 or more Rooms | 13,896 (33.5%) | 1,148 (4.7%) |
| Total | 41,507 (100.0%) | 24,581 (100.0%) |
Housing Structure by Heating Type in Rensselaer County
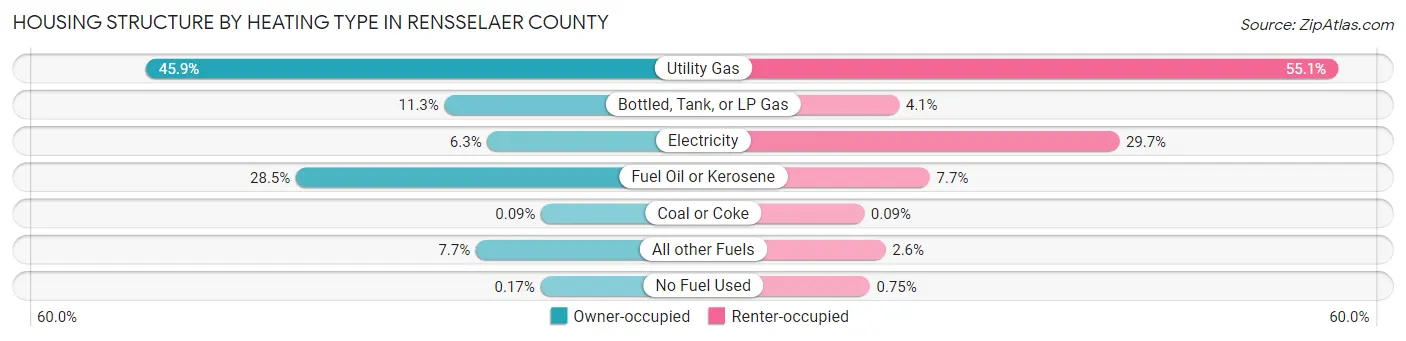
| Heating Type | Owner-occupied | Renter-occupied |
| Utility Gas | 19,065 (45.9%) | 13,531 (55.0%) |
| Bottled, Tank, or LP Gas | 4,690 (11.3%) | 1,018 (4.1%) |
| Electricity | 2,627 (6.3%) | 7,294 (29.7%) |
| Fuel Oil or Kerosene | 11,838 (28.5%) | 1,897 (7.7%) |
| Coal or Coke | 37 (0.1%) | 23 (0.1%) |
| All other Fuels | 3,180 (7.7%) | 634 (2.6%) |
| No Fuel Used | 70 (0.2%) | 184 (0.7%) |
| Total | 41,507 (100.0%) | 24,581 (100.0%) |
Household Vehicle Usage in Rensselaer County
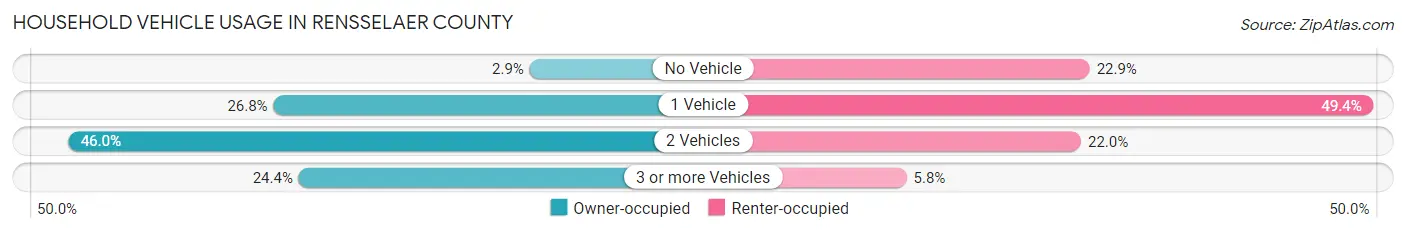
| Vehicles per Household | Owner-occupied | Renter-occupied |
| No Vehicle | 1,184 (2.9%) | 5,617 (22.9%) |
| 1 Vehicle | 11,113 (26.8%) | 12,131 (49.3%) |
| 2 Vehicles | 19,079 (46.0%) | 5,418 (22.0%) |
| 3 or more Vehicles | 10,131 (24.4%) | 1,415 (5.8%) |
| Total | 41,507 (100.0%) | 24,581 (100.0%) |
Real Estate & Mortgages in Rensselaer County
Real Estate and Mortgage Overview in Rensselaer County
| Characteristic | Without Mortgage | With Mortgage |
| Housing Units | 15,662 | 25,845 |
| Median Property Value | $220,000 | $237,000 |
| Median Household Income | $83,712 | $8,642 |
| Monthly Housing Costs | $732 | $2,900 |
| Real Estate Taxes | $4,554 | $542 |
Property Value by Mortgage Status in Rensselaer County
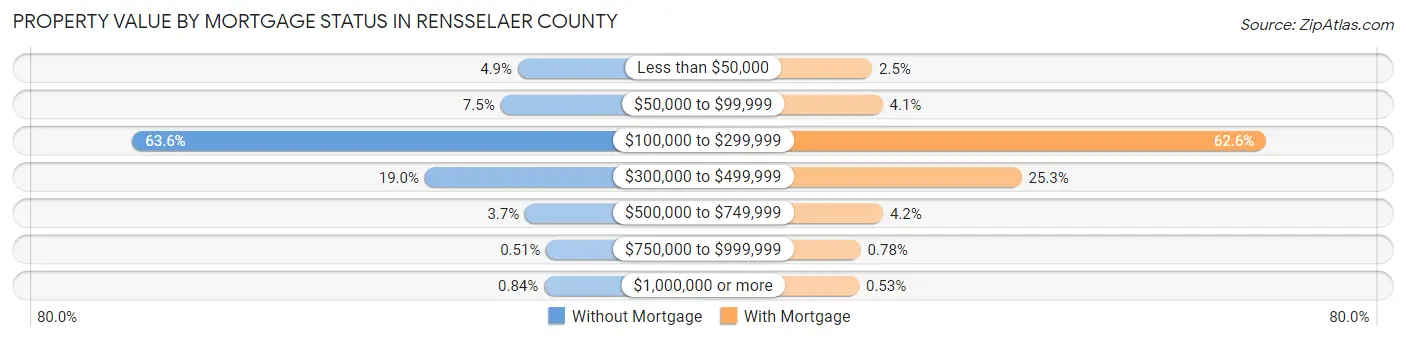
| Property Value | Without Mortgage | With Mortgage |
| Less than $50,000 | 759 (4.9%) | 652 (2.5%) |
| $50,000 to $99,999 | 1,171 (7.5%) | 1,065 (4.1%) |
| $100,000 to $299,999 | 9,956 (63.6%) | 16,169 (62.6%) |
| $300,000 to $499,999 | 2,979 (19.0%) | 6,539 (25.3%) |
| $500,000 to $749,999 | 586 (3.7%) | 1,082 (4.2%) |
| $750,000 to $999,999 | 80 (0.5%) | 201 (0.8%) |
| $1,000,000 or more | 131 (0.8%) | 137 (0.5%) |
| Total | 15,662 (100.0%) | 25,845 (100.0%) |
Household Income by Mortgage Status in Rensselaer County
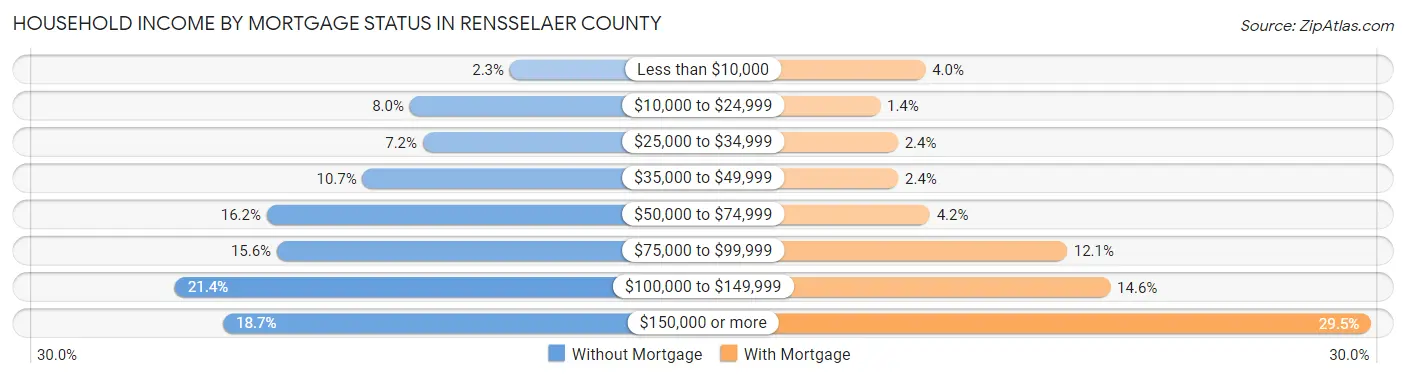
| Household Income | Without Mortgage | With Mortgage |
| Less than $10,000 | 355 (2.3%) | 1,028 (4.0%) |
| $10,000 to $24,999 | 1,251 (8.0%) | 361 (1.4%) |
| $25,000 to $34,999 | 1,134 (7.2%) | 623 (2.4%) |
| $35,000 to $49,999 | 1,674 (10.7%) | 628 (2.4%) |
| $50,000 to $74,999 | 2,531 (16.2%) | 1,097 (4.2%) |
| $75,000 to $99,999 | 2,440 (15.6%) | 3,119 (12.1%) |
| $100,000 to $149,999 | 3,354 (21.4%) | 3,760 (14.5%) |
| $150,000 or more | 2,923 (18.7%) | 7,615 (29.5%) |
| Total | 15,662 (100.0%) | 25,845 (100.0%) |
Property Value to Household Income Ratio in Rensselaer County
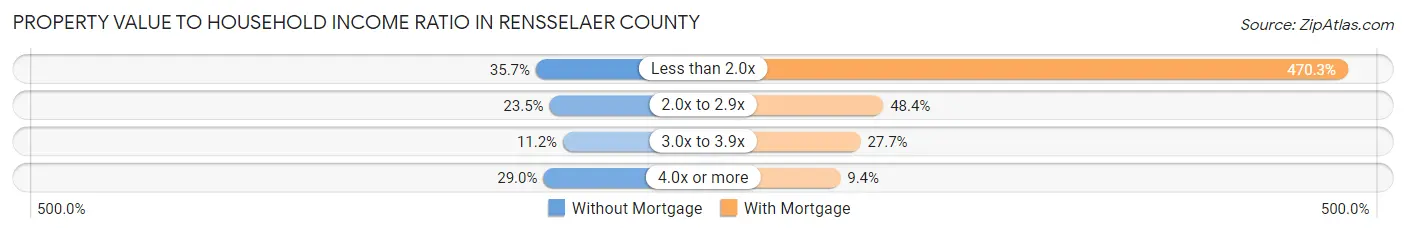
| Value-to-Income Ratio | Without Mortgage | With Mortgage |
| Less than 2.0x | 5,595 (35.7%) | 121,552 (470.3%) |
| 2.0x to 2.9x | 3,675 (23.5%) | 12,510 (48.4%) |
| 3.0x to 3.9x | 1,748 (11.2%) | 7,164 (27.7%) |
| 4.0x or more | 4,539 (29.0%) | 2,437 (9.4%) |
| Total | 15,662 (100.0%) | 25,845 (100.0%) |
Real Estate Taxes by Mortgage Status in Rensselaer County
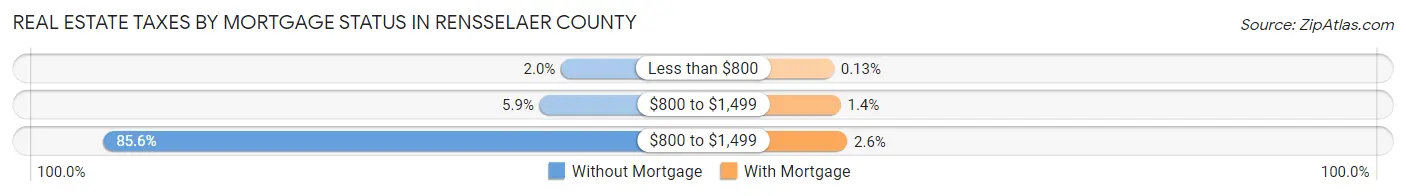
| Property Taxes | Without Mortgage | With Mortgage |
| Less than $800 | 312 (2.0%) | 34 (0.1%) |
| $800 to $1,499 | 925 (5.9%) | 353 (1.4%) |
| $800 to $1,499 | 13,412 (85.6%) | 665 (2.6%) |
| Total | 15,662 (100.0%) | 25,845 (100.0%) |
Health & Disability in Rensselaer County
Health Insurance Coverage by Age in Rensselaer County
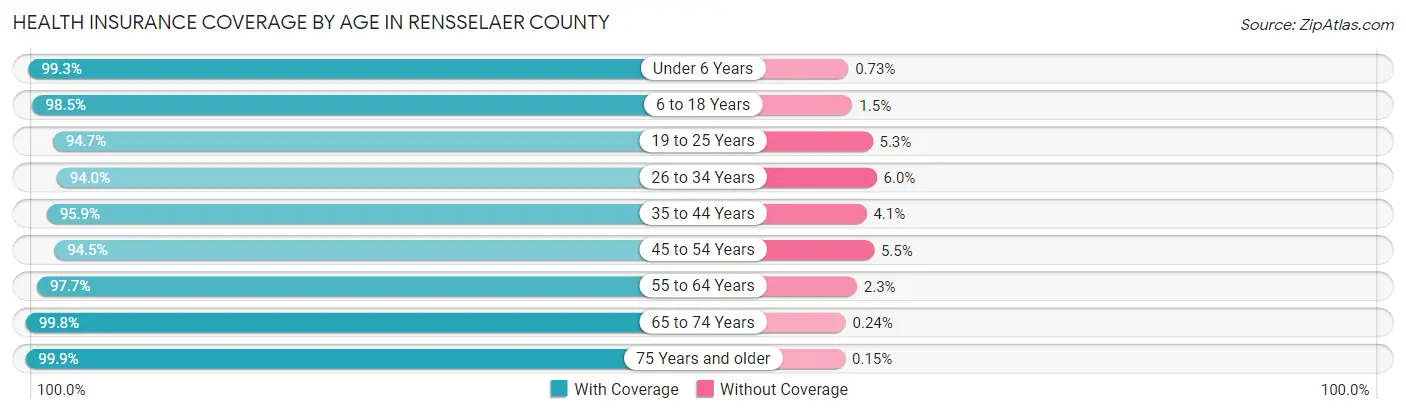
| Age Bracket | With Coverage | Without Coverage |
| Under 6 Years | 9,203 (99.3%) | 68 (0.7%) |
| 6 to 18 Years | 23,830 (98.5%) | 365 (1.5%) |
| 19 to 25 Years | 15,019 (94.7%) | 834 (5.3%) |
| 26 to 34 Years | 18,952 (94.0%) | 1,213 (6.0%) |
| 35 to 44 Years | 18,929 (95.9%) | 816 (4.1%) |
| 45 to 54 Years | 18,638 (94.5%) | 1,092 (5.5%) |
| 55 to 64 Years | 22,284 (97.7%) | 534 (2.3%) |
| 65 to 74 Years | 16,877 (99.8%) | 40 (0.2%) |
| 75 Years and older | 10,588 (99.9%) | 16 (0.2%) |
| Total | 154,320 (96.9%) | 4,978 (3.1%) |
Health Insurance Coverage by Citizenship Status in Rensselaer County
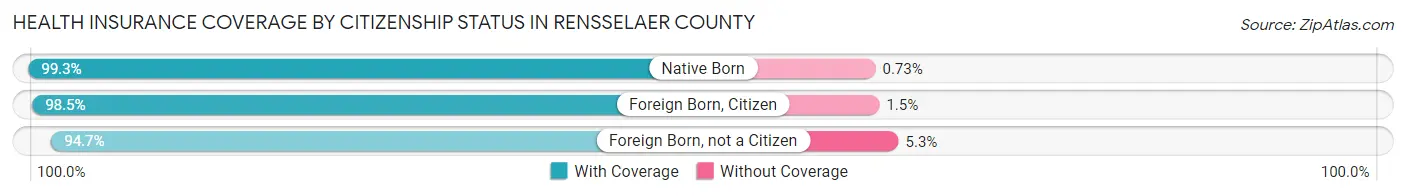
| Citizenship Status | With Coverage | Without Coverage |
| Native Born | 9,203 (99.3%) | 68 (0.7%) |
| Foreign Born, Citizen | 23,830 (98.5%) | 365 (1.5%) |
| Foreign Born, not a Citizen | 15,019 (94.7%) | 834 (5.3%) |
Health Insurance Coverage by Household Income in Rensselaer County
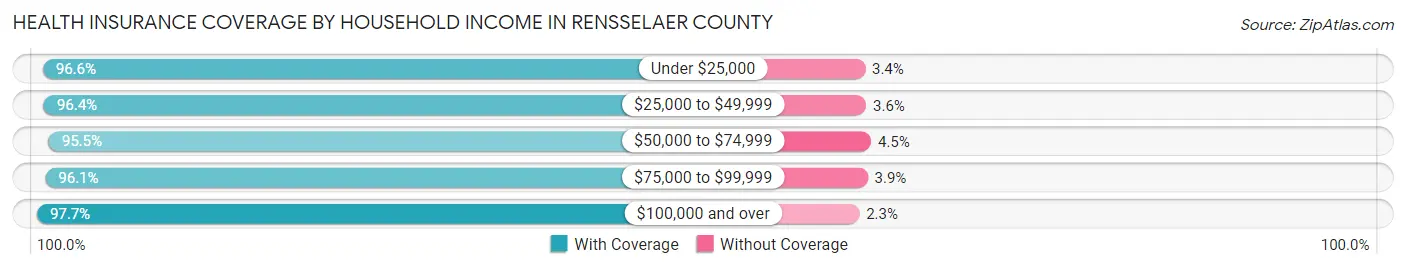
| Household Income | With Coverage | Without Coverage |
| Under $25,000 | 14,752 (96.6%) | 522 (3.4%) |
| $25,000 to $49,999 | 19,236 (96.4%) | 723 (3.6%) |
| $50,000 to $74,999 | 19,269 (95.5%) | 917 (4.5%) |
| $75,000 to $99,999 | 20,554 (96.1%) | 831 (3.9%) |
| $100,000 and over | 75,855 (97.7%) | 1,803 (2.3%) |
Public vs Private Health Insurance Coverage by Age in Rensselaer County
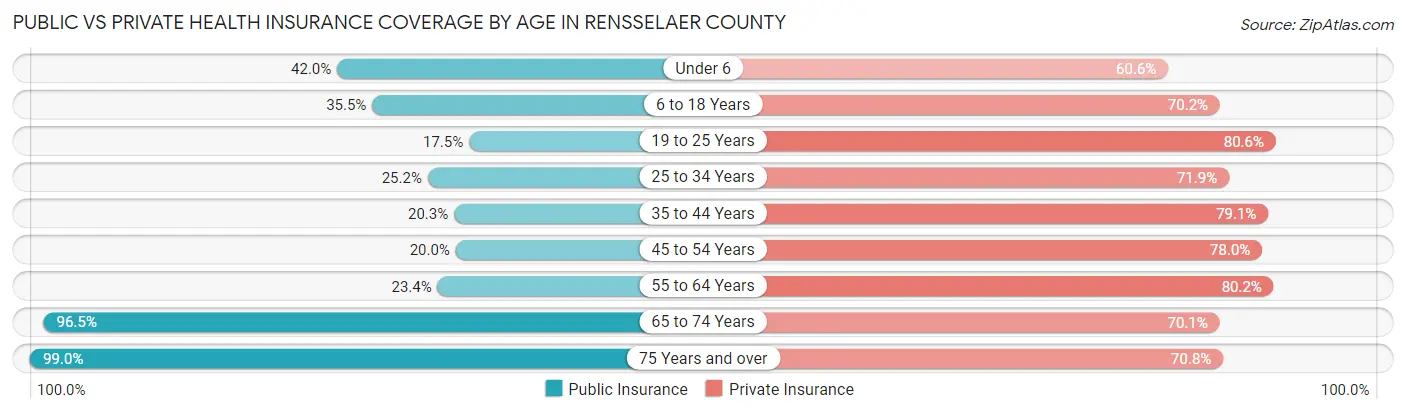
| Age Bracket | Public Insurance | Private Insurance |
| Under 6 | 3,893 (42.0%) | 5,615 (60.6%) |
| 6 to 18 Years | 8,584 (35.5%) | 16,979 (70.2%) |
| 19 to 25 Years | 2,774 (17.5%) | 12,769 (80.5%) |
| 25 to 34 Years | 5,076 (25.2%) | 14,491 (71.9%) |
| 35 to 44 Years | 4,007 (20.3%) | 15,626 (79.1%) |
| 45 to 54 Years | 3,943 (20.0%) | 15,393 (78.0%) |
| 55 to 64 Years | 5,329 (23.4%) | 18,290 (80.2%) |
| 65 to 74 Years | 16,319 (96.5%) | 11,863 (70.1%) |
| 75 Years and over | 10,497 (99.0%) | 7,505 (70.8%) |
| Total | 60,422 (37.9%) | 118,531 (74.4%) |
Disability Status by Sex by Age in Rensselaer County
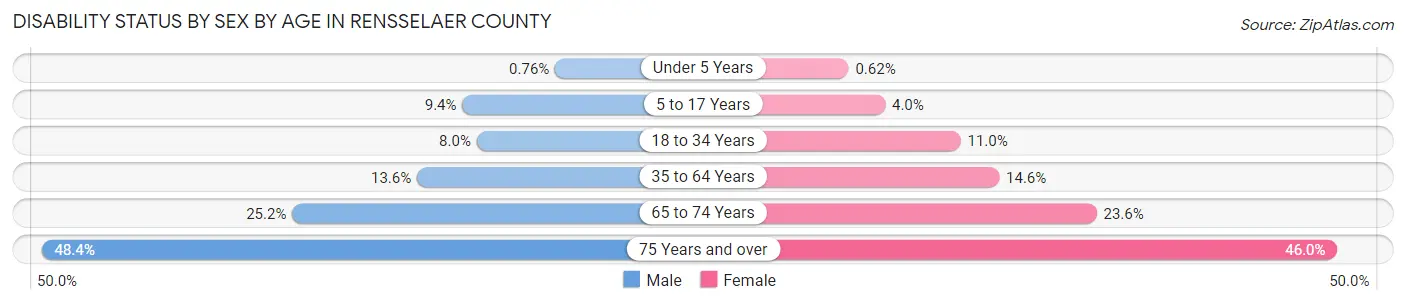
| Age Bracket | Male | Female |
| Under 5 Years | 31 (0.8%) | 24 (0.6%) |
| 5 to 17 Years | 1,100 (9.4%) | 435 (4.0%) |
| 18 to 34 Years | 1,656 (8.0%) | 2,021 (11.0%) |
| 35 to 64 Years | 4,173 (13.6%) | 4,610 (14.6%) |
| 65 to 74 Years | 2,052 (25.2%) | 2,071 (23.6%) |
| 75 Years and over | 2,092 (48.4%) | 2,890 (46.0%) |
Disability Class by Sex by Age in Rensselaer County
Disability Class: Hearing Difficulty
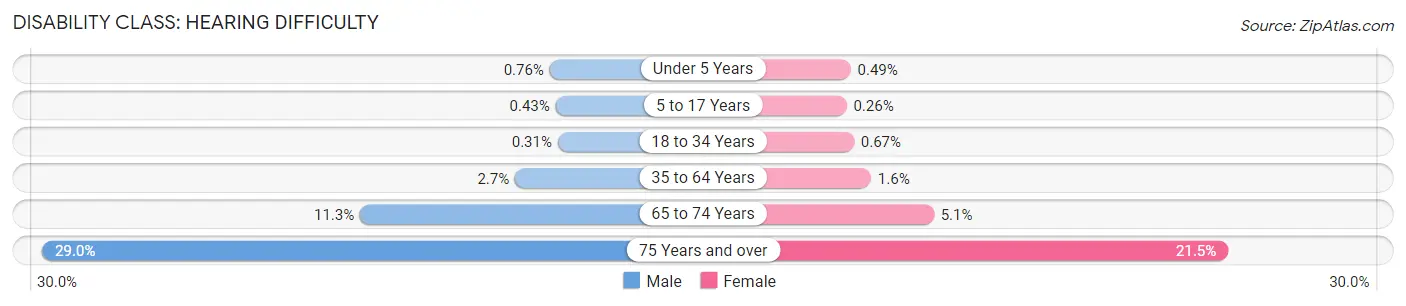
| Age Bracket | Male | Female |
| Under 5 Years | 31 (0.8%) | 19 (0.5%) |
| 5 to 17 Years | 51 (0.4%) | 28 (0.3%) |
| 18 to 34 Years | 63 (0.3%) | 123 (0.7%) |
| 35 to 64 Years | 827 (2.7%) | 511 (1.6%) |
| 65 to 74 Years | 923 (11.3%) | 449 (5.1%) |
| 75 Years and over | 1,254 (29.0%) | 1,352 (21.5%) |
Disability Class: Vision Difficulty
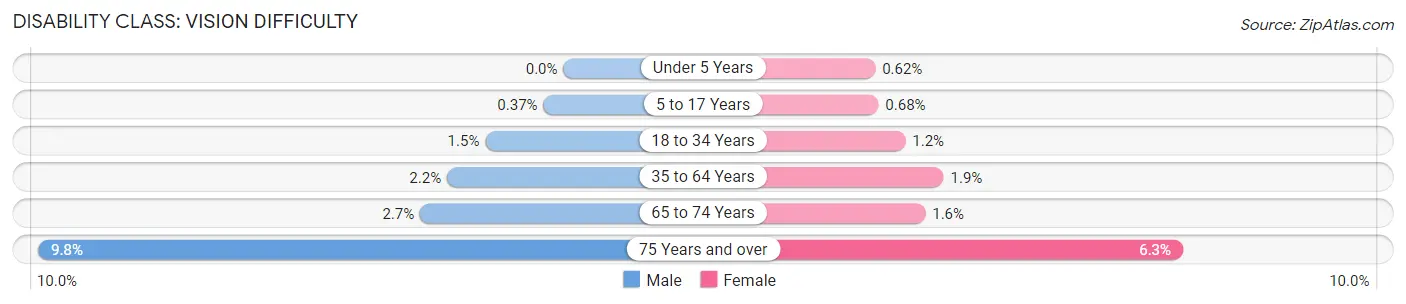
| Age Bracket | Male | Female |
| Under 5 Years | 0 (0.0%) | 24 (0.6%) |
| 5 to 17 Years | 44 (0.4%) | 74 (0.7%) |
| 18 to 34 Years | 298 (1.5%) | 217 (1.2%) |
| 35 to 64 Years | 663 (2.2%) | 596 (1.9%) |
| 65 to 74 Years | 217 (2.7%) | 136 (1.5%) |
| 75 Years and over | 421 (9.8%) | 398 (6.3%) |
Disability Class: Cognitive Difficulty
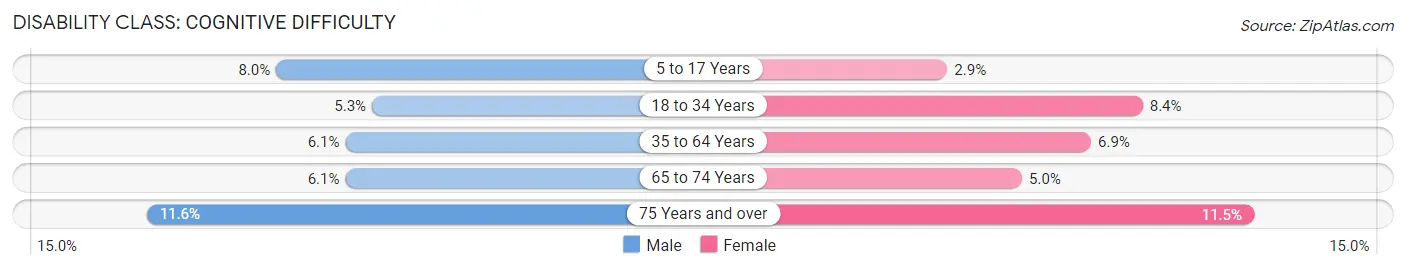
| Age Bracket | Male | Female |
| 5 to 17 Years | 939 (8.0%) | 319 (2.9%) |
| 18 to 34 Years | 1,099 (5.3%) | 1,537 (8.4%) |
| 35 to 64 Years | 1,864 (6.1%) | 2,190 (6.9%) |
| 65 to 74 Years | 495 (6.1%) | 440 (5.0%) |
| 75 Years and over | 501 (11.6%) | 721 (11.5%) |
Disability Class: Ambulatory Difficulty
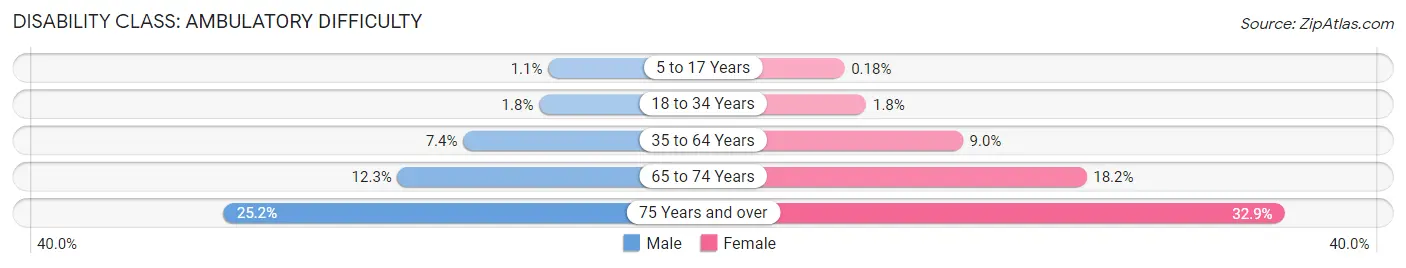
| Age Bracket | Male | Female |
| 5 to 17 Years | 132 (1.1%) | 20 (0.2%) |
| 18 to 34 Years | 369 (1.8%) | 330 (1.8%) |
| 35 to 64 Years | 2,282 (7.4%) | 2,833 (9.0%) |
| 65 to 74 Years | 1,003 (12.3%) | 1,590 (18.1%) |
| 75 Years and over | 1,089 (25.2%) | 2,065 (32.9%) |
Disability Class: Self-Care Difficulty
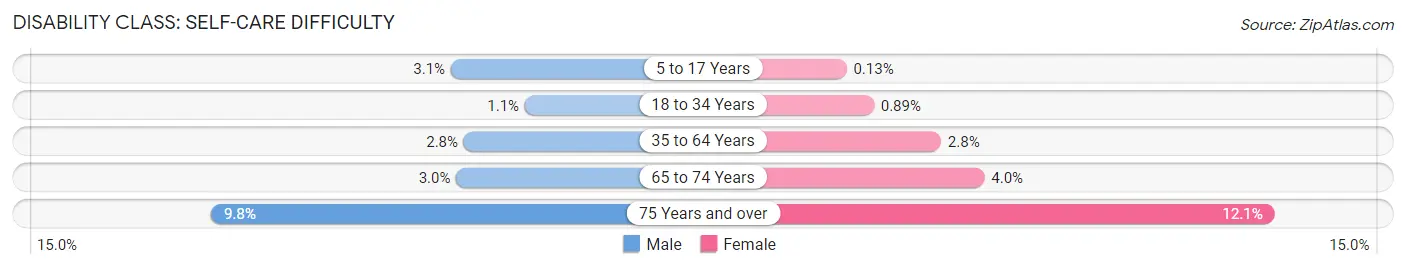
| Age Bracket | Male | Female |
| 5 to 17 Years | 367 (3.1%) | 14 (0.1%) |
| 18 to 34 Years | 221 (1.1%) | 164 (0.9%) |
| 35 to 64 Years | 850 (2.8%) | 872 (2.8%) |
| 65 to 74 Years | 243 (3.0%) | 348 (4.0%) |
| 75 Years and over | 424 (9.8%) | 757 (12.0%) |
Technology Access in Rensselaer County
Computing Device Access in Rensselaer County
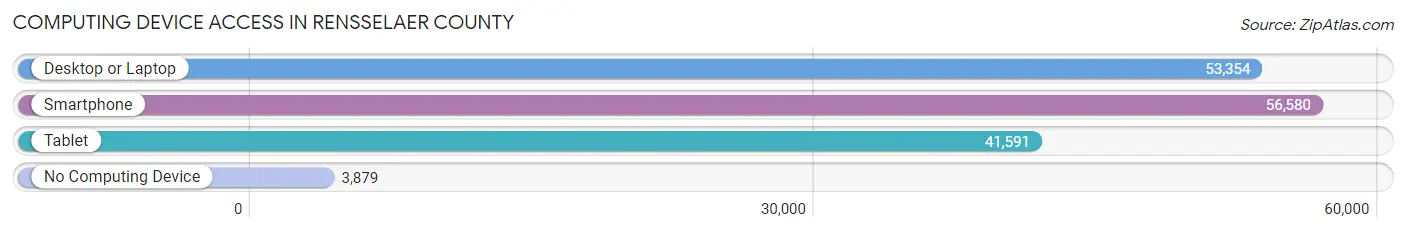
| Device Type | # Households | % Households |
| Desktop or Laptop | 53,354 | 80.7% |
| Smartphone | 56,580 | 85.6% |
| Tablet | 41,591 | 62.9% |
| No Computing Device | 3,879 | 5.9% |
| Total | 66,088 | 100.0% |
Internet Access in Rensselaer County
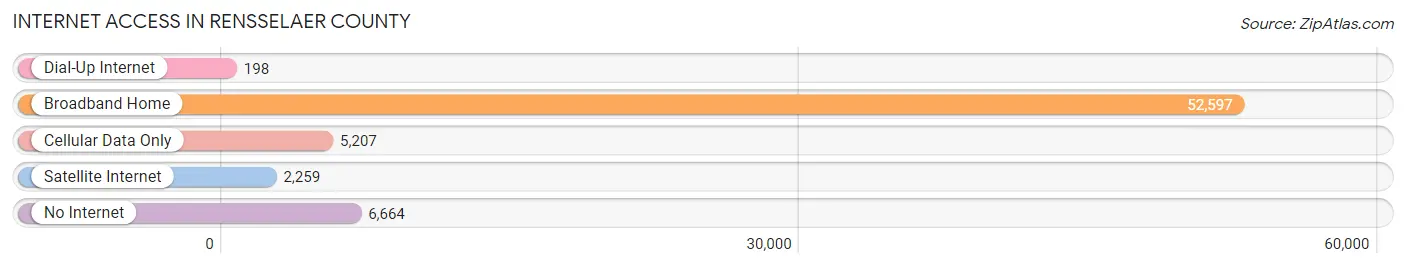
| Internet Type | # Households | % Households |
| Dial-Up Internet | 198 | 0.3% |
| Broadband Home | 52,597 | 79.6% |
| Cellular Data Only | 5,207 | 7.9% |
| Satellite Internet | 2,259 | 3.4% |
| No Internet | 6,664 | 10.1% |
| Total | 66,088 | 100.0% |
Rensselaer County Summary
Rensselaer County is located in the eastern part of New York State, and is part of the Capital District. It is bordered by Albany County to the west, Saratoga County to the north, Washington County to the east, and Columbia County to the south. The county seat is Troy, and the county has a total area of 665 square miles. As of the 2010 census, the population was 159,429, making it the fifth most populous county in the state.
History
Rensselaer County was established in 1791, and was named after the Dutch settler Kiliaen van Rensselaer. The county was originally part of Albany County, and was split off in 1791. The county was originally inhabited by the Mohican and Mahican Native American tribes, and was later settled by Dutch and English colonists. The county was an important center of the Industrial Revolution, and was home to many factories and mills.
Geography
Rensselaer County is located in the eastern part of New York State, and is part of the Capital District. It is bordered by Albany County to the west, Saratoga County to the north, Washington County to the east, and Columbia County to the south. The county has a total area of 665 square miles, and is mostly rural. The terrain is mostly rolling hills, with the highest point being the summit of Mount Rensselaer at 1,929 feet. The county is home to several rivers, including the Hudson, Mohawk, and Hoosic Rivers.
Economy
Rensselaer County has a diverse economy, with a mix of manufacturing, technology, and service industries. The county is home to several large employers, including the GlobalFoundries semiconductor plant in Malta, the Knolls Atomic Power Laboratory in Niskayuna, and the Rensselaer Polytechnic Institute in Troy. The county is also home to several smaller businesses, including several wineries, breweries, and distilleries. The county is also home to several tourist attractions, including the Saratoga Race Course, the Saratoga Performing Arts Center, and the Saratoga National Historical Park.
Demographics
As of the 2010 census, the population of Rensselaer County was 159,429, with a population density of 239 people per square mile. The racial makeup of the county was 87.3% White, 8.2% African American, 0.5% Native American, 1.7% Asian, 0.1% Pacific Islander, and 1.2% from other races. The median household income was $60,837, and the median family income was $71,837. The per capita income was $27,945. The poverty rate was 11.2%.
Rensselaer County is home to several higher education institutions, including Rensselaer Polytechnic Institute, Hudson Valley Community College, and the Sage Colleges. The county is also home to several museums, including the Rensselaer County Historical Society, the USS Slater, and the Albany Institute of History and Art. The county is also home to several parks, including the Saratoga National Historical Park, the Grafton Lakes State Park, and the Saratoga Spa State Park.
Common Questions
What is Per Capita Income in Rensselaer County?
Per Capita income in Rensselaer County is $42,728.
What is the Median Family Income in Rensselaer County?
Median Family Income in Rensselaer County is $104,744.
What is the Median Household income in Rensselaer County?
Median Household Income in Rensselaer County is $83,734.
What is Income or Wage Gap in Rensselaer County?
Income or Wage Gap in Rensselaer County is 20.6%.
Women in Rensselaer County earn 79.4 cents for every dollar earned by a man.
What is Family Income Deficit in Rensselaer County?
Family Income Deficit in Rensselaer County is $10,093.
Families that are below poverty line in Rensselaer County earn $10,093 less on average than the poverty threshold level.
What is Inequality or Gini Index in Rensselaer County?
Inequality or Gini Index in Rensselaer County is 0.42.
What is the Total Population of Rensselaer County?
Total Population of Rensselaer County is 160,943.
What is the Total Male Population of Rensselaer County?
Total Male Population of Rensselaer County is 80,545.
What is the Total Female Population of Rensselaer County?
Total Female Population of Rensselaer County is 80,398.
What is the Ratio of Males per 100 Females in Rensselaer County?
There are 100.18 Males per 100 Females in Rensselaer County.
What is the Ratio of Females per 100 Males in Rensselaer County?
There are 99.82 Females per 100 Males in Rensselaer County.
What is the Median Population Age in Rensselaer County?
Median Population Age in Rensselaer County is 40.0 Years.
What is the Average Family Size in Rensselaer County
Average Family Size in Rensselaer County is 2.9 People.
What is the Average Household Size in Rensselaer County
Average Household Size in Rensselaer County is 2.3 People.
How Large is the Labor Force in Rensselaer County?
There are 86,160 People in the Labor Forcein in Rensselaer County.
What is the Percentage of People in the Labor Force in Rensselaer County?
64.2% of People are in the Labor Force in Rensselaer County.
What is the Unemployment Rate in Rensselaer County?
Unemployment Rate in Rensselaer County is 5.6%.