Oswego County, NY Map & Demographics
Oswego County Map
Oswego County Overview
$33,904
PER CAPITA INCOME
$80,866
AVG FAMILY INCOME
$65,054
AVG HOUSEHOLD INCOME
24.7%
WAGE / INCOME GAP [ % ]
75.3¢/ $1
WAGE / INCOME GAP [ $ ]
$12,412
FAMILY INCOME DEFICIT
0.45
INEQUALITY / GINI INDEX
118,037
TOTAL POPULATION
59,486
MALE POPULATION
58,551
FEMALE POPULATION
101.60
MALES / 100 FEMALES
98.43
FEMALES / 100 MALES
40.3
MEDIAN AGE
2.9
AVG FAMILY SIZE
2.4
AVG HOUSEHOLD SIZE
58,971
LABOR FORCE [ PEOPLE ]
61.1%
PERCENT IN LABOR FORCE
7.3%
UNEMPLOYMENT RATE
Oswego County Area Codes
Income in Oswego County
Income Overview in Oswego County
Per Capita Income in Oswego County is $33,904, while median incomes of families and households are $80,866 and $65,054 respectively.
| Characteristic | Number | Measure |
| Per Capita Income | 118,037 | $33,904 |
| Median Family Income | 30,002 | $80,866 |
| Mean Family Income | 30,002 | $96,969 |
| Median Household Income | 47,203 | $65,054 |
| Mean Household Income | 47,203 | $84,934 |
| Income Deficit | 30,002 | $12,412 |
| Wage / Income Gap (%) | 118,037 | 24.69% |
| Wage / Income Gap ($) | 118,037 | 75.31¢ per $1 |
| Gini / Inequality Index | 118,037 | 0.45 |
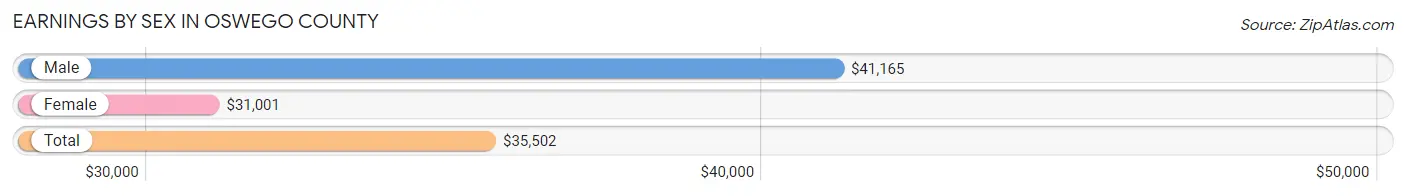
Earnings by Sex in Oswego County
Average Earnings in Oswego County are $35,502, $41,165 for men and $31,001 for women, a difference of 24.7%.
| Sex | Number | Average Earnings |
| Male | 33,312 (52.9%) | $41,165 |
| Female | 29,702 (47.1%) | $31,001 |
| Total | 63,014 (100.0%) | $35,502 |
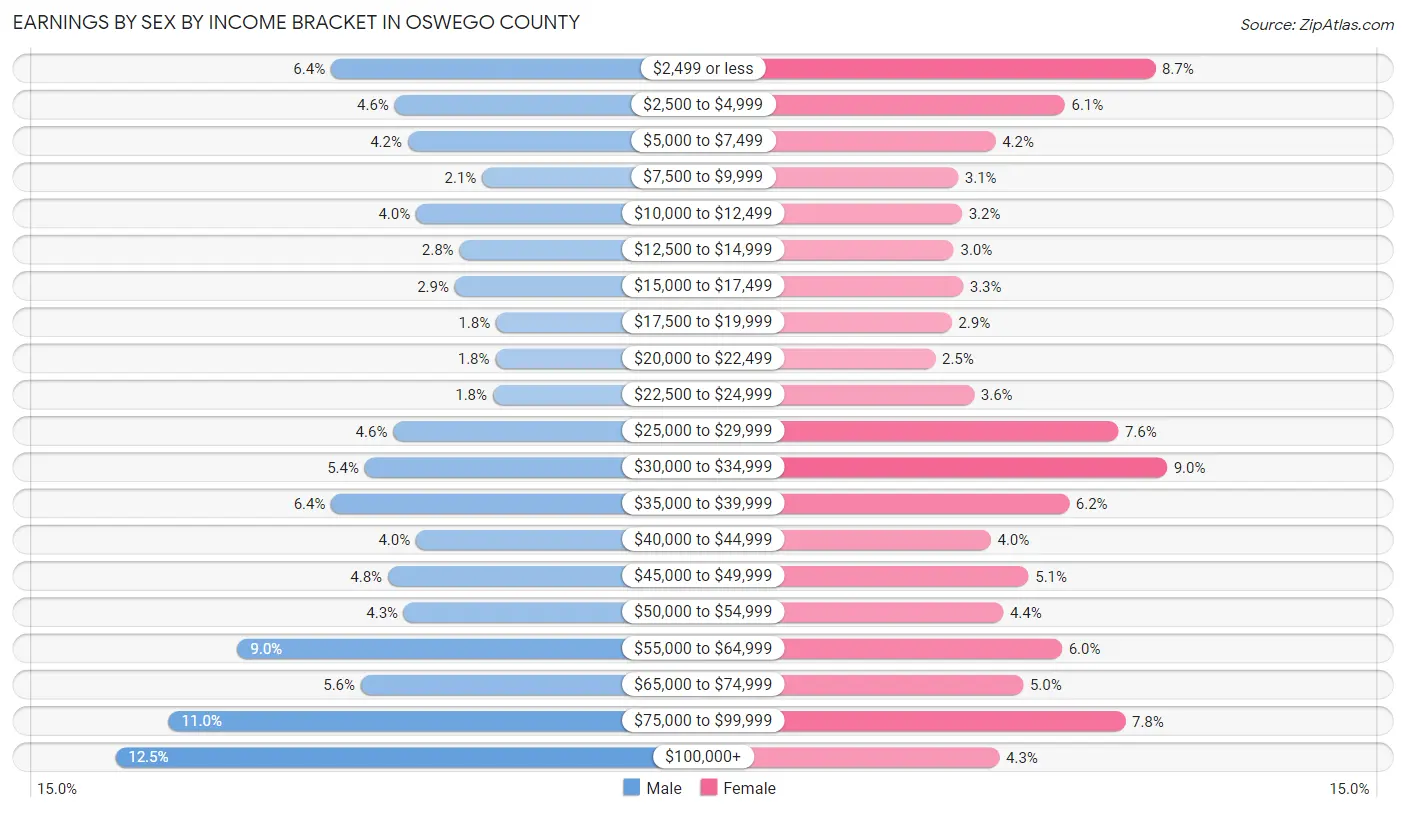
Earnings by Sex by Income Bracket in Oswego County
The most common earnings brackets in Oswego County are $100,000+ for men (4,149 | 12.4%) and $30,000 to $34,999 for women (2,671 | 9.0%).
| Income | Male | Female |
| $2,499 or less | 2,130 (6.4%) | 2,571 (8.7%) |
| $2,500 to $4,999 | 1,534 (4.6%) | 1,819 (6.1%) |
| $5,000 to $7,499 | 1,408 (4.2%) | 1,239 (4.2%) |
| $7,500 to $9,999 | 714 (2.1%) | 927 (3.1%) |
| $10,000 to $12,499 | 1,331 (4.0%) | 958 (3.2%) |
| $12,500 to $14,999 | 926 (2.8%) | 891 (3.0%) |
| $15,000 to $17,499 | 971 (2.9%) | 969 (3.3%) |
| $17,500 to $19,999 | 584 (1.8%) | 872 (2.9%) |
| $20,000 to $22,499 | 591 (1.8%) | 737 (2.5%) |
| $22,500 to $24,999 | 614 (1.8%) | 1,059 (3.6%) |
| $25,000 to $29,999 | 1,546 (4.6%) | 2,263 (7.6%) |
| $30,000 to $34,999 | 1,811 (5.4%) | 2,671 (9.0%) |
| $35,000 to $39,999 | 2,125 (6.4%) | 1,854 (6.2%) |
| $40,000 to $44,999 | 1,332 (4.0%) | 1,199 (4.0%) |
| $45,000 to $49,999 | 1,596 (4.8%) | 1,516 (5.1%) |
| $50,000 to $54,999 | 1,447 (4.3%) | 1,303 (4.4%) |
| $55,000 to $64,999 | 3,004 (9.0%) | 1,793 (6.0%) |
| $65,000 to $74,999 | 1,850 (5.6%) | 1,469 (5.0%) |
| $75,000 to $99,999 | 3,649 (11.0%) | 2,322 (7.8%) |
| $100,000+ | 4,149 (12.4%) | 1,270 (4.3%) |
| Total | 33,312 (100.0%) | 29,702 (100.0%) |
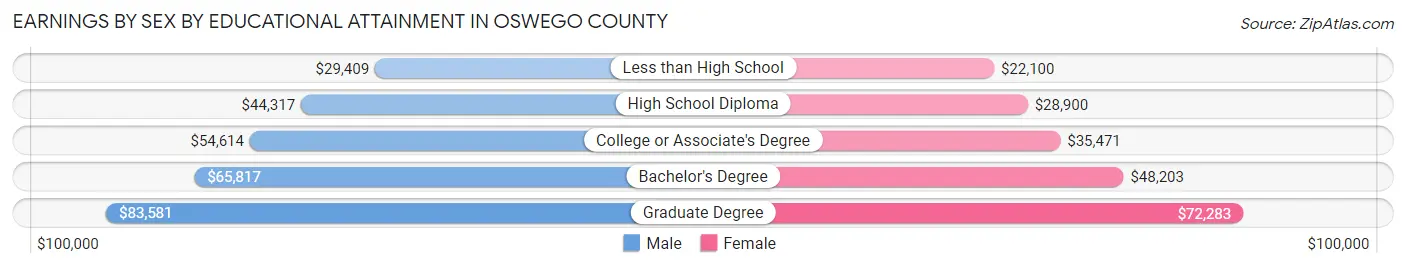
Earnings by Sex by Educational Attainment in Oswego County
Average earnings in Oswego County are $50,480 for men and $36,039 for women, a difference of 28.6%. Men with an educational attainment of graduate degree enjoy the highest average annual earnings of $83,581, while those with less than high school education earn the least with $29,409. Women with an educational attainment of graduate degree earn the most with the average annual earnings of $72,283, while those with less than high school education have the smallest earnings of $22,100.
| Educational Attainment | Male Income | Female Income |
| Less than High School | $29,409 | $22,100 |
| High School Diploma | $44,317 | $28,900 |
| College or Associate's Degree | $54,614 | $35,471 |
| Bachelor's Degree | $65,817 | $48,203 |
| Graduate Degree | $83,581 | $72,283 |
| Total | $50,480 | $36,039 |
Family Income in Oswego County
Family Income Brackets in Oswego County
According to the Oswego County family income data, there are 6,210 families falling into the $100,000 to $149,999 income range, which is the most common income bracket and makes up 20.7% of all families. Conversely, the $10,000 to $14,999 income bracket is the least frequent group with only 690 families (2.3%) belonging to this category.
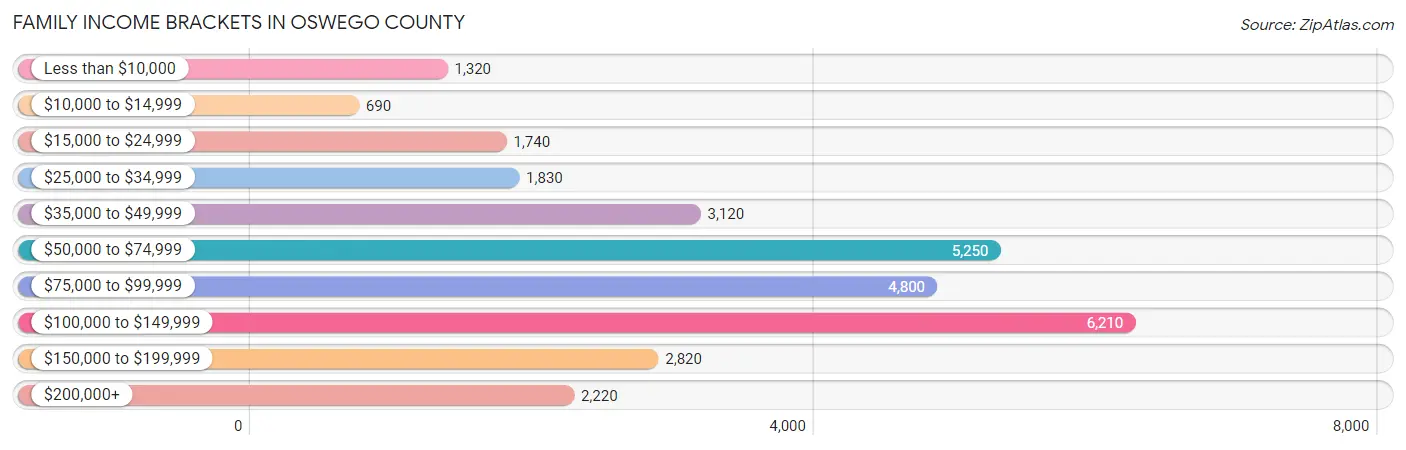
| Income Bracket | # Families | % Families |
| Less than $10,000 | 1,320 | 4.4% |
| $10,000 to $14,999 | 690 | 2.3% |
| $15,000 to $24,999 | 1,740 | 5.8% |
| $25,000 to $34,999 | 1,830 | 6.1% |
| $35,000 to $49,999 | 3,120 | 10.4% |
| $50,000 to $74,999 | 5,250 | 17.5% |
| $75,000 to $99,999 | 4,800 | 16.0% |
| $100,000 to $149,999 | 6,210 | 20.7% |
| $150,000 to $199,999 | 2,820 | 9.4% |
| $200,000+ | 2,220 | 7.4% |
Family Income by Famaliy Size in Oswego County
7+ person families (521 | 1.7%) account for the highest median family income in Oswego County with $115,034 per family, while 2-person families (14,949 | 49.8%) have the highest median income of $36,417 per family member.
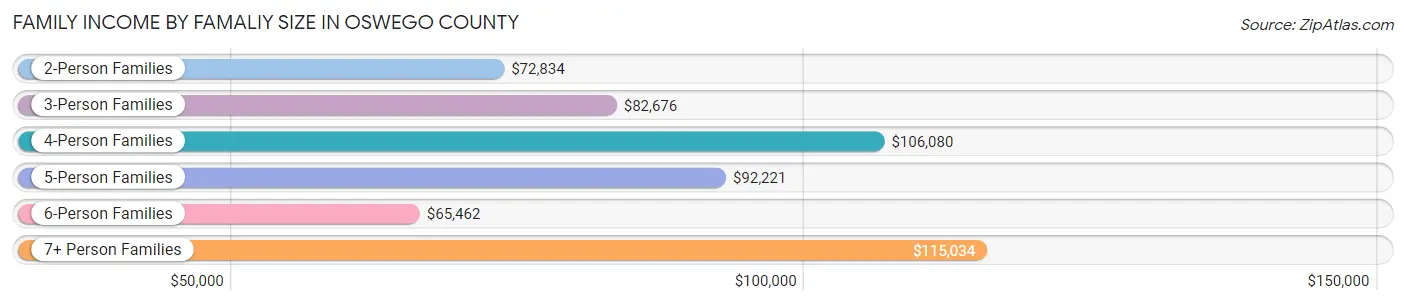
| Income Bracket | # Families | Median Income |
| 2-Person Families | 14,949 (49.8%) | $72,834 |
| 3-Person Families | 7,121 (23.7%) | $82,676 |
| 4-Person Families | 4,729 (15.8%) | $106,080 |
| 5-Person Families | 1,705 (5.7%) | $92,221 |
| 6-Person Families | 977 (3.3%) | $65,462 |
| 7+ Person Families | 521 (1.7%) | $115,034 |
| Total | 30,002 (100.0%) | $80,866 |
Family Income by Number of Earners in Oswego County
The median family income in Oswego County is $80,866, with families comprising 3+ earners (3,232) having the highest median family income of $139,076, while families with no earners (5,576) have the lowest median family income of $42,139, accounting for 10.8% and 18.6% of families, respectively.
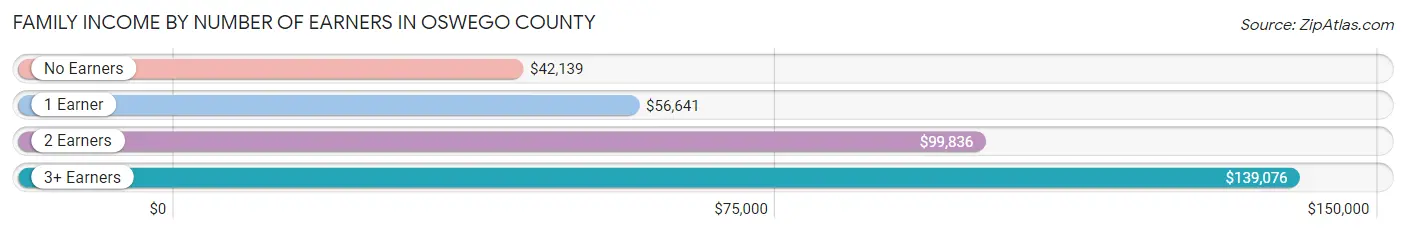
| Number of Earners | # Families | Median Income |
| No Earners | 5,576 (18.6%) | $42,139 |
| 1 Earner | 9,554 (31.8%) | $56,641 |
| 2 Earners | 11,640 (38.8%) | $99,836 |
| 3+ Earners | 3,232 (10.8%) | $139,076 |
| Total | 30,002 (100.0%) | $80,866 |
Household Income in Oswego County
Household Income Brackets in Oswego County
With 8,308 households falling in the category, the $50,000 to $74,999 income range is the most frequent in Oswego County, accounting for 17.6% of all households. In contrast, only 2,030 households (4.3%) fall into the $10,000 to $14,999 income bracket, making it the least populous group.
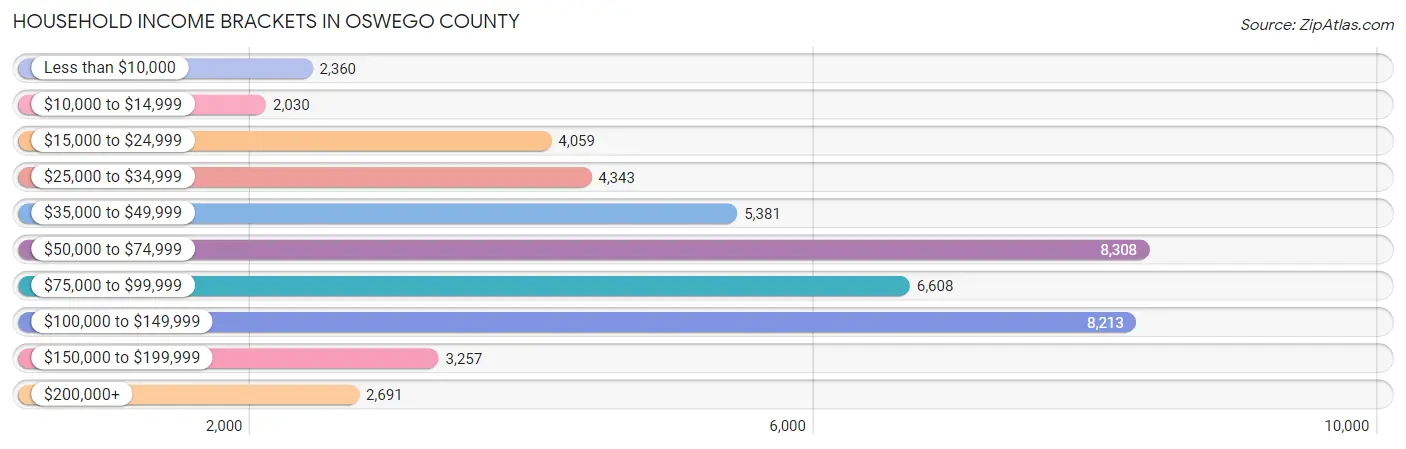
| Income Bracket | # Households | % Households |
| Less than $10,000 | 2,360 | 5.0% |
| $10,000 to $14,999 | 2,030 | 4.3% |
| $15,000 to $24,999 | 4,059 | 8.6% |
| $25,000 to $34,999 | 4,343 | 9.2% |
| $35,000 to $49,999 | 5,381 | 11.4% |
| $50,000 to $74,999 | 8,308 | 17.6% |
| $75,000 to $99,999 | 6,608 | 14.0% |
| $100,000 to $149,999 | 8,213 | 17.4% |
| $150,000 to $199,999 | 3,257 | 6.9% |
| $200,000+ | 2,691 | 5.7% |
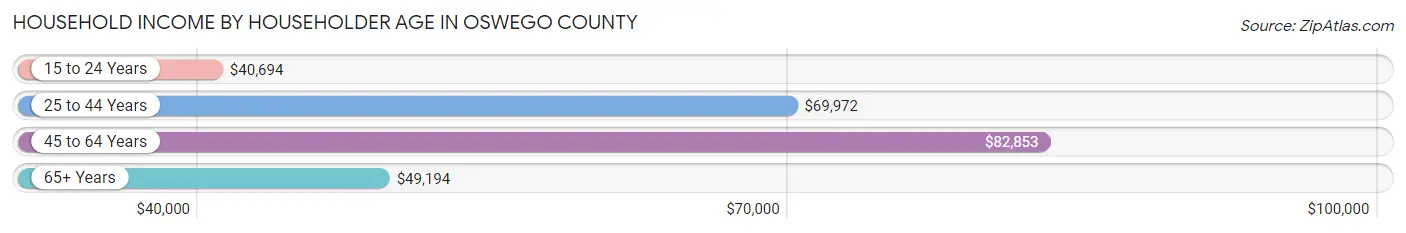
Household Income by Householder Age in Oswego County
The median household income in Oswego County is $65,054, with the highest median household income of $82,853 found in the 45 to 64 years age bracket for the primary householder. A total of 19,136 households (40.5%) fall into this category. Meanwhile, the 15 to 24 years age bracket for the primary householder has the lowest median household income of $40,694, with 1,967 households (4.2%) in this group.
| Income Bracket | # Households | Median Income |
| 15 to 24 Years | 1,967 (4.2%) | $40,694 |
| 25 to 44 Years | 13,162 (27.9%) | $69,972 |
| 45 to 64 Years | 19,136 (40.5%) | $82,853 |
| 65+ Years | 12,938 (27.4%) | $49,194 |
| Total | 47,203 (100.0%) | $65,054 |
Poverty in Oswego County
Income Below Poverty by Sex and Age in Oswego County
With 15.0% poverty level for males and 19.3% for females among the residents of Oswego County, 6 to 11 year old males and 5 year old females are the most vulnerable to poverty, with 1,335 males (32.1%) and 176 females (36.4%) in their respective age groups living below the poverty level.
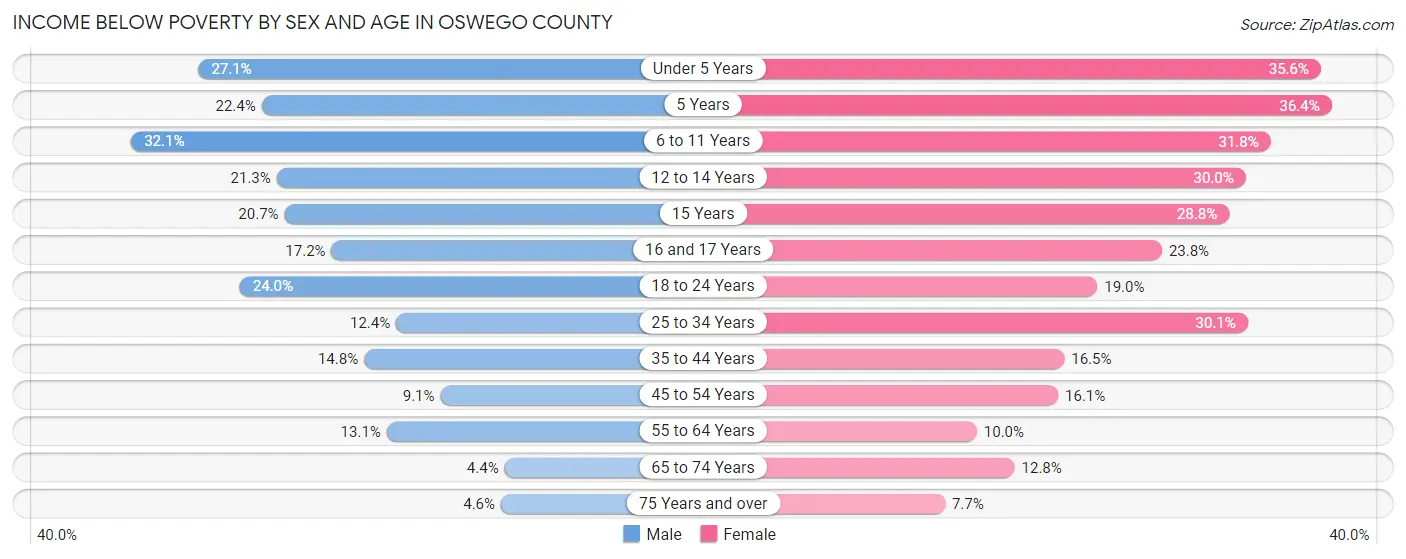
| Age Bracket | Male | Female |
| Under 5 Years | 850 (27.1%) | 1,075 (35.6%) |
| 5 Years | 162 (22.4%) | 176 (36.4%) |
| 6 to 11 Years | 1,335 (32.1%) | 1,105 (31.8%) |
| 12 to 14 Years | 409 (21.3%) | 682 (30.0%) |
| 15 Years | 163 (20.7%) | 209 (28.7%) |
| 16 and 17 Years | 256 (17.2%) | 324 (23.8%) |
| 18 to 24 Years | 1,194 (24.0%) | 881 (19.0%) |
| 25 to 34 Years | 870 (12.4%) | 2,094 (30.1%) |
| 35 to 44 Years | 966 (14.8%) | 1,088 (16.5%) |
| 45 to 54 Years | 686 (9.1%) | 1,187 (16.1%) |
| 55 to 64 Years | 1,201 (13.1%) | 879 (10.0%) |
| 65 to 74 Years | 266 (4.4%) | 784 (12.8%) |
| 75 Years and over | 154 (4.6%) | 324 (7.7%) |
| Total | 8,512 (15.0%) | 10,808 (19.3%) |
Income Above Poverty by Sex and Age in Oswego County
According to the poverty statistics in Oswego County, males aged 65 to 74 years and females aged 75 years and over are the age groups that are most secure financially, with 95.6% of males and 92.3% of females in these age groups living above the poverty line.
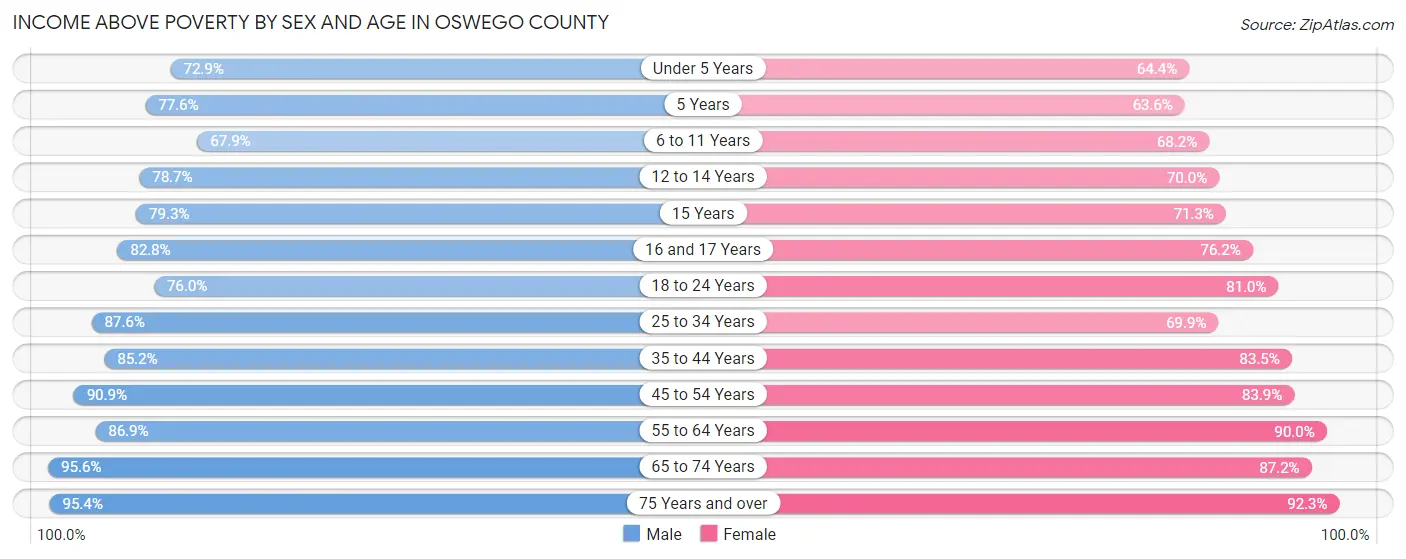
| Age Bracket | Male | Female |
| Under 5 Years | 2,288 (72.9%) | 1,948 (64.4%) |
| 5 Years | 561 (77.6%) | 308 (63.6%) |
| 6 to 11 Years | 2,826 (67.9%) | 2,367 (68.2%) |
| 12 to 14 Years | 1,512 (78.7%) | 1,593 (70.0%) |
| 15 Years | 624 (79.3%) | 518 (71.3%) |
| 16 and 17 Years | 1,231 (82.8%) | 1,039 (76.2%) |
| 18 to 24 Years | 3,776 (76.0%) | 3,763 (81.0%) |
| 25 to 34 Years | 6,137 (87.6%) | 4,856 (69.9%) |
| 35 to 44 Years | 5,559 (85.2%) | 5,497 (83.5%) |
| 45 to 54 Years | 6,826 (90.9%) | 6,203 (83.9%) |
| 55 to 64 Years | 7,953 (86.9%) | 7,889 (90.0%) |
| 65 to 74 Years | 5,824 (95.6%) | 5,326 (87.2%) |
| 75 Years and over | 3,167 (95.4%) | 3,904 (92.3%) |
| Total | 48,284 (85.0%) | 45,211 (80.7%) |
Income Below Poverty Among Married-Couple Families in Oswego County
The poverty statistics for married-couple families in Oswego County show that 5.2% or 1,117 of the total 21,441 families live below the poverty line. Families with 5 or more children have the highest poverty rate of 30.5%, comprising of 93 families. On the other hand, families with no children have the lowest poverty rate of 2.5%, which includes 344 families.
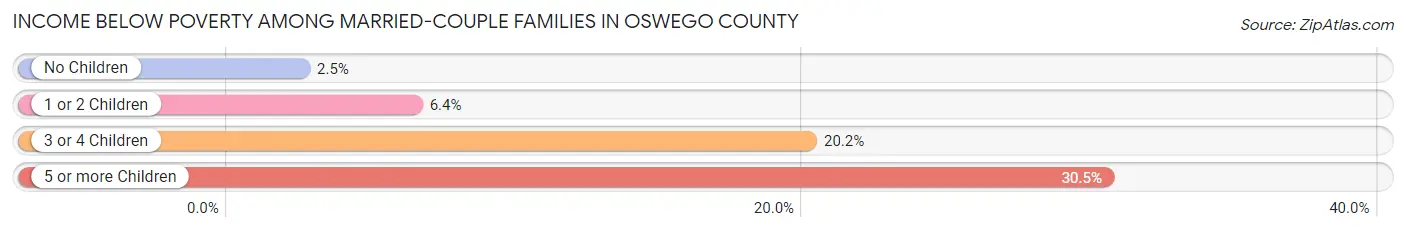
| Children | Above Poverty | Below Poverty |
| No Children | 13,380 (97.5%) | 344 (2.5%) |
| 1 or 2 Children | 5,548 (93.6%) | 381 (6.4%) |
| 3 or 4 Children | 1,184 (79.8%) | 299 (20.2%) |
| 5 or more Children | 212 (69.5%) | 93 (30.5%) |
| Total | 20,324 (94.8%) | 1,117 (5.2%) |
Income Below Poverty Among Single-Parent Households in Oswego County
According to the poverty data in Oswego County, 15.4% or 415 single-father households and 35.5% or 2,081 single-mother households are living below the poverty line. Among single-father households, those with 3 or 4 children have the highest poverty rate, with 150 households (68.5%) experiencing poverty. Likewise, among single-mother households, those with 3 or 4 children have the highest poverty rate, with 547 households (73.1%) falling below the poverty line.
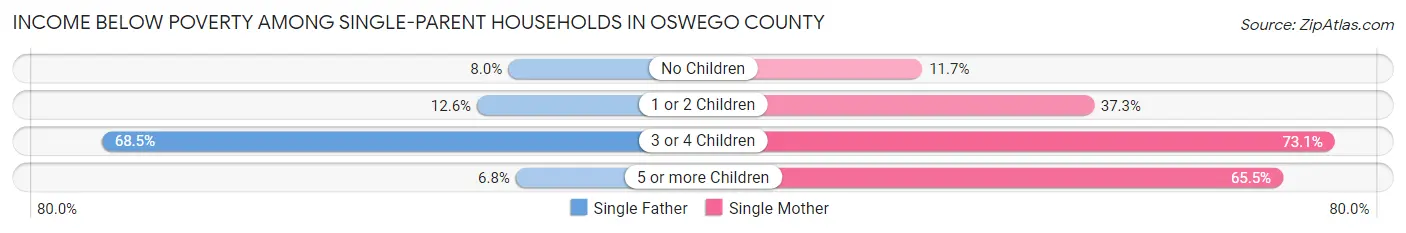
| Children | Single Father | Single Mother |
| No Children | 76 (8.0%) | 193 (11.7%) |
| 1 or 2 Children | 186 (12.6%) | 1,233 (37.3%) |
| 3 or 4 Children | 150 (68.5%) | 547 (73.1%) |
| 5 or more Children | 3 (6.8%) | 108 (65.4%) |
| Total | 415 (15.4%) | 2,081 (35.5%) |
Income Below Poverty Among Married-Couple vs Single-Parent Households in Oswego County
The poverty data for Oswego County shows that 1,117 of the married-couple family households (5.2%) and 2,496 of the single-parent households (29.2%) are living below the poverty level. Within the married-couple family households, those with 5 or more children have the highest poverty rate, with 93 households (30.5%) falling below the poverty line. Among the single-parent households, those with 3 or 4 children have the highest poverty rate, with 697 household (72.1%) living below poverty.
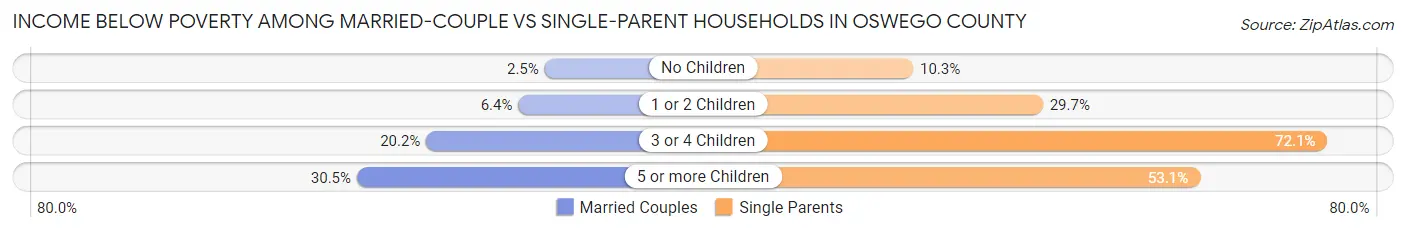
| Children | Married-Couple Families | Single-Parent Households |
| No Children | 344 (2.5%) | 269 (10.3%) |
| 1 or 2 Children | 381 (6.4%) | 1,419 (29.7%) |
| 3 or 4 Children | 299 (20.2%) | 697 (72.1%) |
| 5 or more Children | 93 (30.5%) | 111 (53.1%) |
| Total | 1,117 (5.2%) | 2,496 (29.2%) |
Race in Oswego County
The most populous races in Oswego County are White / Caucasian (110,043 | 93.2%), Two or more Races (4,488 | 3.8%), and Hispanic or Latino (3,401 | 2.9%).
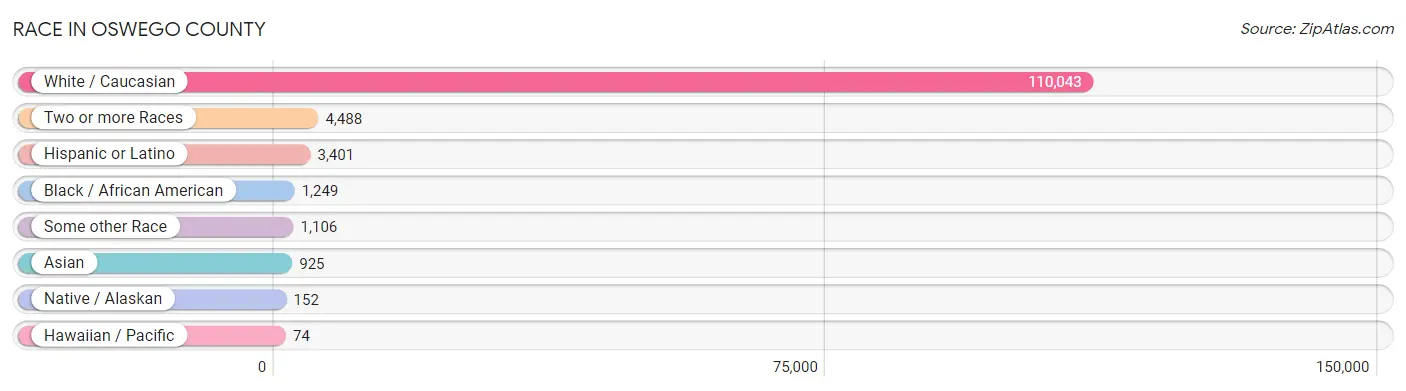
| Race | # Population | % Population |
| Asian | 925 | 0.8% |
| Black / African American | 1,249 | 1.1% |
| Hawaiian / Pacific | 74 | 0.1% |
| Hispanic or Latino | 3,401 | 2.9% |
| Native / Alaskan | 152 | 0.1% |
| White / Caucasian | 110,043 | 93.2% |
| Two or more Races | 4,488 | 3.8% |
| Some other Race | 1,106 | 0.9% |
| Total | 118,037 | 100.0% |
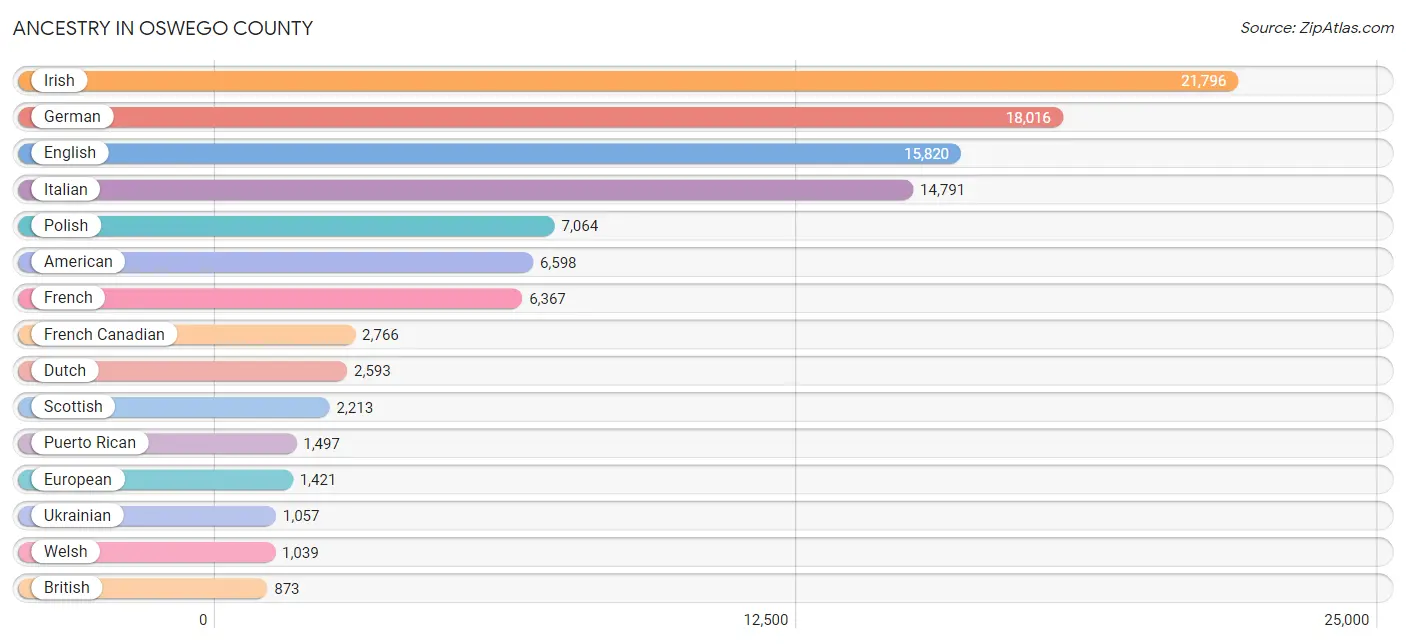
Ancestry in Oswego County
The most populous ancestries reported in Oswego County are Irish (21,796 | 18.5%), German (18,016 | 15.3%), English (15,820 | 13.4%), Italian (14,791 | 12.5%), and Polish (7,064 | 6.0%), together accounting for 65.6% of all Oswego County residents.
| Ancestry | # Population | % Population |
| African | 151 | 0.1% |
| Albanian | 19 | 0.0% |
| American | 6,598 | 5.6% |
| Arab | 474 | 0.4% |
| Argentinean | 115 | 0.1% |
| Armenian | 201 | 0.2% |
| Australian | 19 | 0.0% |
| Austrian | 298 | 0.3% |
| Barbadian | 10 | 0.0% |
| Belgian | 46 | 0.0% |
| Bhutanese | 116 | 0.1% |
| Blackfeet | 65 | 0.1% |
| Bolivian | 7 | 0.0% |
| Brazilian | 51 | 0.0% |
| British | 873 | 0.7% |
| Bulgarian | 31 | 0.0% |
| Burmese | 226 | 0.2% |
| Canadian | 656 | 0.6% |
| Celtic | 35 | 0.0% |
| Central American | 193 | 0.2% |
| Central American Indian | 61 | 0.1% |
| Cherokee | 185 | 0.2% |
| Chilean | 61 | 0.1% |
| Chippewa | 14 | 0.0% |
| Colombian | 57 | 0.1% |
| Comanche | 41 | 0.0% |
| Costa Rican | 14 | 0.0% |
| Cree | 1 | 0.0% |
| Croatian | 7 | 0.0% |
| Cuban | 145 | 0.1% |
| Czech | 127 | 0.1% |
| Czechoslovakian | 64 | 0.1% |
| Danish | 119 | 0.1% |
| Dominican | 289 | 0.2% |
| Dutch | 2,593 | 2.2% |
| Eastern European | 342 | 0.3% |
| Ecuadorian | 167 | 0.1% |
| Egyptian | 24 | 0.0% |
| English | 15,820 | 13.4% |
| Ethiopian | 14 | 0.0% |
| European | 1,421 | 1.2% |
| Filipino | 6 | 0.0% |
| Finnish | 127 | 0.1% |
| French | 6,367 | 5.4% |
| French American Indian | 46 | 0.0% |
| French Canadian | 2,766 | 2.3% |
| German | 18,016 | 15.3% |
| Ghanaian | 40 | 0.0% |
| Greek | 306 | 0.3% |
| Guamanian / Chamorro | 3 | 0.0% |
| Guatemalan | 123 | 0.1% |
| Haitian | 97 | 0.1% |
| Honduran | 22 | 0.0% |
| Hungarian | 193 | 0.2% |
| Indian (Asian) | 319 | 0.3% |
| Indonesian | 161 | 0.1% |
| Iranian | 7 | 0.0% |
| Irish | 21,796 | 18.5% |
| Iroquois | 378 | 0.3% |
| Israeli | 29 | 0.0% |
| Italian | 14,791 | 12.5% |
| Jamaican | 101 | 0.1% |
| Korean | 237 | 0.2% |
| Latvian | 26 | 0.0% |
| Lebanese | 294 | 0.3% |
| Liberian | 15 | 0.0% |
| Lithuanian | 127 | 0.1% |
| Macedonian | 4 | 0.0% |
| Maltese | 19 | 0.0% |
| Mexican | 560 | 0.5% |
| Native Hawaiian | 47 | 0.0% |
| Navajo | 4 | 0.0% |
| Nicaraguan | 1 | 0.0% |
| Nigerian | 21 | 0.0% |
| Northern European | 128 | 0.1% |
| Norwegian | 657 | 0.6% |
| Pakistani | 44 | 0.0% |
| Palestinian | 112 | 0.1% |
| Panamanian | 22 | 0.0% |
| Pennsylvania German | 76 | 0.1% |
| Peruvian | 20 | 0.0% |
| Polish | 7,064 | 6.0% |
| Portuguese | 122 | 0.1% |
| Puerto Rican | 1,497 | 1.3% |
| Romanian | 104 | 0.1% |
| Russian | 755 | 0.6% |
| Salvadoran | 11 | 0.0% |
| Samoan | 3 | 0.0% |
| Scandinavian | 133 | 0.1% |
| Scotch-Irish | 635 | 0.5% |
| Scottish | 2,213 | 1.9% |
| Sioux | 30 | 0.0% |
| Slavic | 22 | 0.0% |
| Slovak | 125 | 0.1% |
| Slovene | 6 | 0.0% |
| South African | 5 | 0.0% |
| South American | 429 | 0.4% |
| South American Indian | 2 | 0.0% |
| Spaniard | 35 | 0.0% |
| Spanish | 66 | 0.1% |
| Sri Lankan | 71 | 0.1% |
| Subsaharan African | 254 | 0.2% |
| Swedish | 459 | 0.4% |
| Swiss | 94 | 0.1% |
| Syrian | 34 | 0.0% |
| Thai | 125 | 0.1% |
| Trinidadian and Tobagonian | 32 | 0.0% |
| Turkish | 74 | 0.1% |
| Ukrainian | 1,057 | 0.9% |
| Venezuelan | 2 | 0.0% |
| Vietnamese | 6 | 0.0% |
| Welsh | 1,039 | 0.9% |
| West Indian | 17 | 0.0% |
| Yugoslavian | 42 | 0.0% | View All 114 Rows |
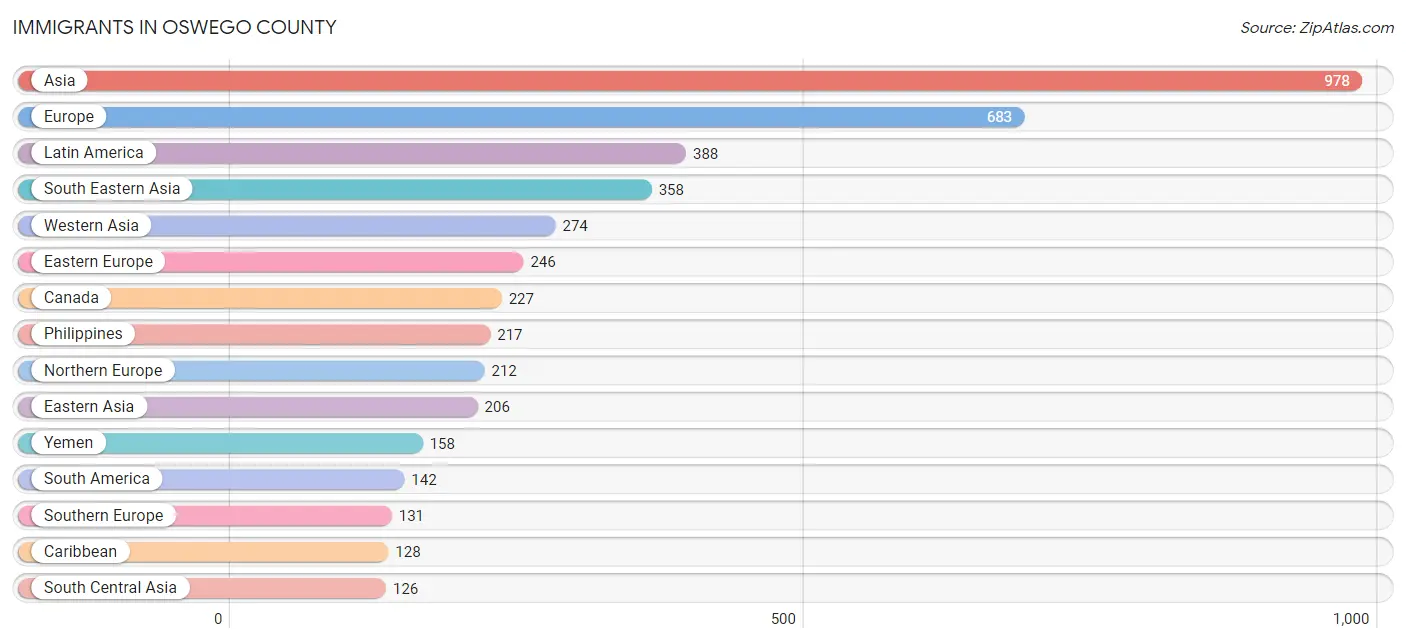
Immigrants in Oswego County
The most numerous immigrant groups reported in Oswego County came from Asia (978 | 0.8%), Europe (683 | 0.6%), Latin America (388 | 0.3%), South Eastern Asia (358 | 0.3%), and Western Asia (274 | 0.2%), together accounting for 2.3% of all Oswego County residents.
| Immigration Origin | # Population | % Population |
| Africa | 124 | 0.1% |
| Argentina | 46 | 0.0% |
| Asia | 978 | 0.8% |
| Australia | 15 | 0.0% |
| Belgium | 10 | 0.0% |
| Brazil | 31 | 0.0% |
| Bulgaria | 5 | 0.0% |
| Canada | 227 | 0.2% |
| Caribbean | 128 | 0.1% |
| Central America | 118 | 0.1% |
| Chile | 39 | 0.0% |
| China | 118 | 0.1% |
| Colombia | 23 | 0.0% |
| Czechoslovakia | 10 | 0.0% |
| Dominican Republic | 67 | 0.1% |
| Eastern Africa | 23 | 0.0% |
| Eastern Asia | 206 | 0.2% |
| Eastern Europe | 246 | 0.2% |
| Ecuador | 1 | 0.0% |
| Egypt | 18 | 0.0% |
| El Salvador | 5 | 0.0% |
| England | 33 | 0.0% |
| Ethiopia | 7 | 0.0% |
| Europe | 683 | 0.6% |
| France | 11 | 0.0% |
| Germany | 73 | 0.1% |
| Ghana | 55 | 0.1% |
| Greece | 41 | 0.0% |
| Guatemala | 45 | 0.0% |
| Haiti | 16 | 0.0% |
| Honduras | 5 | 0.0% |
| Hong Kong | 37 | 0.0% |
| India | 61 | 0.1% |
| Ireland | 94 | 0.1% |
| Israel | 5 | 0.0% |
| Italy | 39 | 0.0% |
| Jamaica | 45 | 0.0% |
| Japan | 7 | 0.0% |
| Korea | 81 | 0.1% |
| Latin America | 388 | 0.3% |
| Lebanon | 54 | 0.1% |
| Liberia | 15 | 0.0% |
| Lithuania | 3 | 0.0% |
| Mexico | 62 | 0.1% |
| Nepal | 18 | 0.0% |
| Nicaragua | 1 | 0.0% |
| Northern Africa | 18 | 0.0% |
| Northern Europe | 212 | 0.2% |
| Oceania | 22 | 0.0% |
| Pakistan | 8 | 0.0% |
| Philippines | 217 | 0.2% |
| Poland | 97 | 0.1% |
| Portugal | 13 | 0.0% |
| Russia | 22 | 0.0% |
| Saudi Arabia | 5 | 0.0% |
| Scotland | 58 | 0.1% |
| Serbia | 19 | 0.0% |
| South Africa | 5 | 0.0% |
| South America | 142 | 0.1% |
| South Central Asia | 126 | 0.1% |
| South Eastern Asia | 358 | 0.3% |
| Southern Europe | 131 | 0.1% |
| Spain | 38 | 0.0% |
| Sri Lanka | 16 | 0.0% |
| Sweden | 9 | 0.0% |
| Taiwan | 14 | 0.0% |
| Thailand | 37 | 0.0% |
| Turkey | 16 | 0.0% |
| Ukraine | 85 | 0.1% |
| Uzbekistan | 23 | 0.0% |
| Venezuela | 2 | 0.0% |
| Vietnam | 32 | 0.0% |
| Western Africa | 70 | 0.1% |
| Western Asia | 274 | 0.2% |
| Western Europe | 94 | 0.1% |
| Yemen | 158 | 0.1% |
| Zimbabwe | 16 | 0.0% | View All 77 Rows |
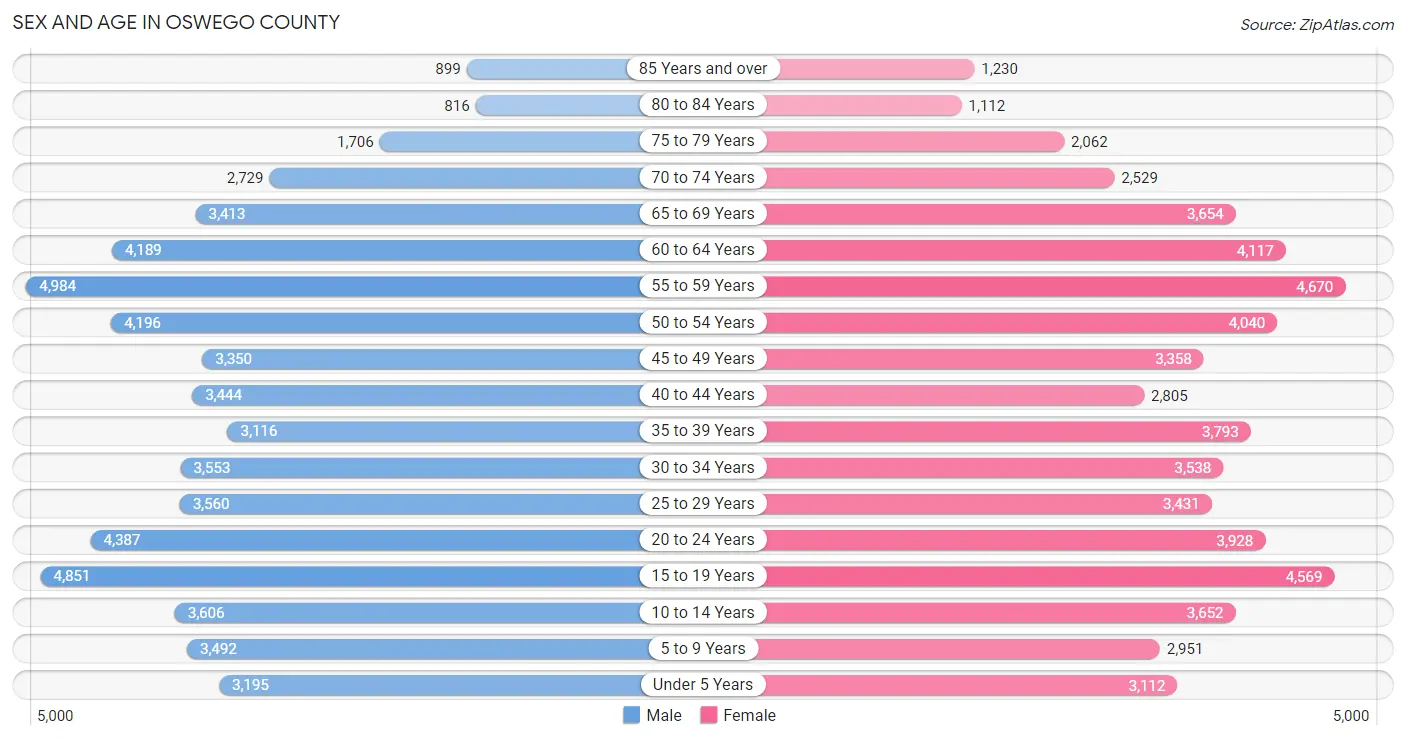
Sex and Age in Oswego County
Sex and Age in Oswego County
The most populous age groups in Oswego County are 55 to 59 Years (4,984 | 8.4%) for men and 55 to 59 Years (4,670 | 8.0%) for women.
| Age Bracket | Male | Female |
| Under 5 Years | 3,195 (5.4%) | 3,112 (5.3%) |
| 5 to 9 Years | 3,492 (5.9%) | 2,951 (5.0%) |
| 10 to 14 Years | 3,606 (6.1%) | 3,652 (6.2%) |
| 15 to 19 Years | 4,851 (8.2%) | 4,569 (7.8%) |
| 20 to 24 Years | 4,387 (7.4%) | 3,928 (6.7%) |
| 25 to 29 Years | 3,560 (6.0%) | 3,431 (5.9%) |
| 30 to 34 Years | 3,553 (6.0%) | 3,538 (6.0%) |
| 35 to 39 Years | 3,116 (5.2%) | 3,793 (6.5%) |
| 40 to 44 Years | 3,444 (5.8%) | 2,805 (4.8%) |
| 45 to 49 Years | 3,350 (5.6%) | 3,358 (5.7%) |
| 50 to 54 Years | 4,196 (7.0%) | 4,040 (6.9%) |
| 55 to 59 Years | 4,984 (8.4%) | 4,670 (8.0%) |
| 60 to 64 Years | 4,189 (7.0%) | 4,117 (7.0%) |
| 65 to 69 Years | 3,413 (5.7%) | 3,654 (6.2%) |
| 70 to 74 Years | 2,729 (4.6%) | 2,529 (4.3%) |
| 75 to 79 Years | 1,706 (2.9%) | 2,062 (3.5%) |
| 80 to 84 Years | 816 (1.4%) | 1,112 (1.9%) |
| 85 Years and over | 899 (1.5%) | 1,230 (2.1%) |
| Total | 59,486 (100.0%) | 58,551 (100.0%) |
Families and Households in Oswego County
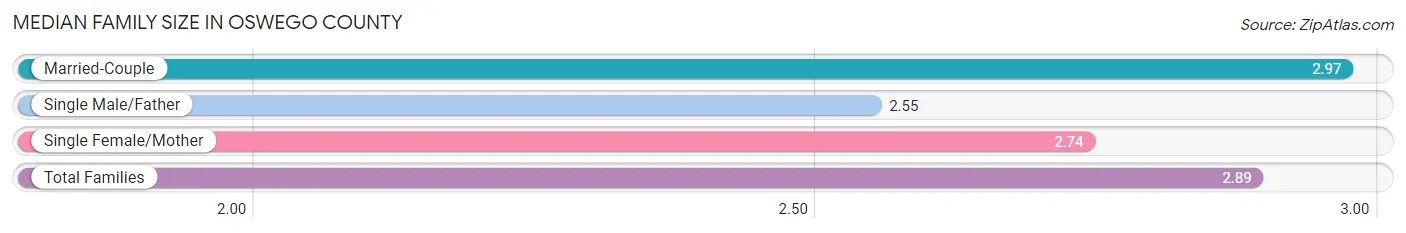
Median Family Size in Oswego County
The median family size in Oswego County is 2.89 persons per family, with married-couple families (21,441 | 71.5%) accounting for the largest median family size of 2.97 persons per family. On the other hand, single male/father families (2,692 | 9.0%) represent the smallest median family size with 2.55 persons per family.
| Family Type | # Families | Family Size |
| Married-Couple | 21,441 (71.5%) | 2.97 |
| Single Male/Father | 2,692 (9.0%) | 2.55 |
| Single Female/Mother | 5,869 (19.6%) | 2.74 |
| Total Families | 30,002 (100.0%) | 2.89 |
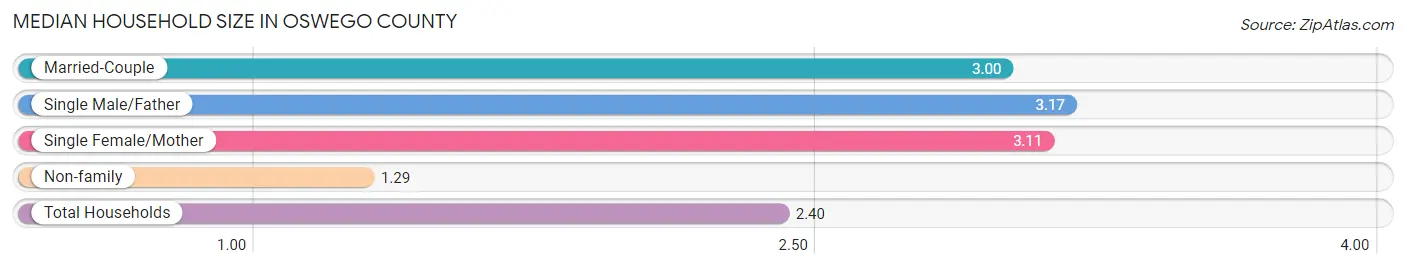
Median Household Size in Oswego County
The median household size in Oswego County is 2.40 persons per household, with single male/father households (2,692 | 5.7%) accounting for the largest median household size of 3.17 persons per household. non-family households (17,201 | 36.4%) represent the smallest median household size with 1.29 persons per household.
| Household Type | # Households | Household Size |
| Married-Couple | 21,441 (45.4%) | 3.00 |
| Single Male/Father | 2,692 (5.7%) | 3.17 |
| Single Female/Mother | 5,869 (12.4%) | 3.11 |
| Non-family | 17,201 (36.4%) | 1.29 |
| Total Households | 47,203 (100.0%) | 2.40 |
Household Size by Marriage Status in Oswego County
Out of a total of 47,203 households in Oswego County, 30,002 (63.6%) are family households, while 17,201 (36.4%) are nonfamily households. The most numerous type of family households are 2-person households, comprising 13,426, and the most common type of nonfamily households are 1-person households, comprising 12,719.
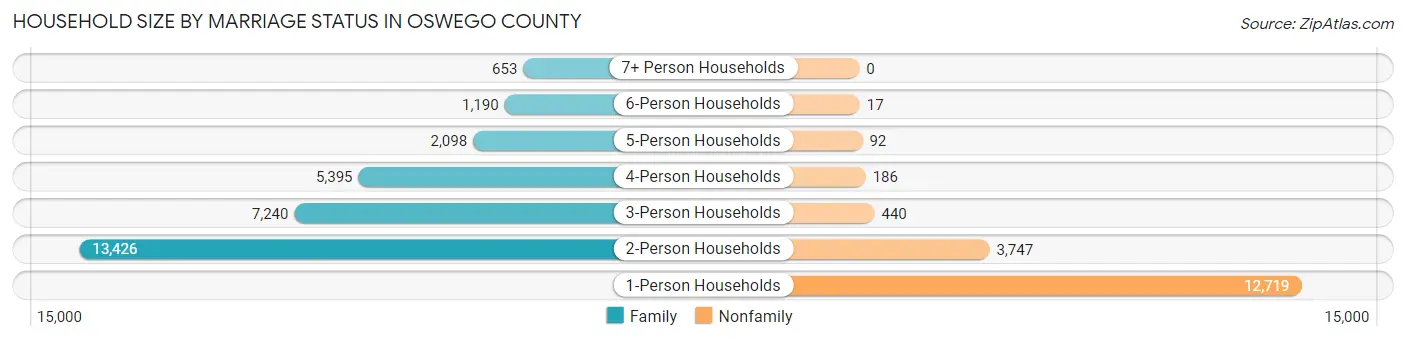
| Household Size | Family Households | Nonfamily Households |
| 1-Person Households | - | 12,719 (27.0%) |
| 2-Person Households | 13,426 (28.4%) | 3,747 (7.9%) |
| 3-Person Households | 7,240 (15.3%) | 440 (0.9%) |
| 4-Person Households | 5,395 (11.4%) | 186 (0.4%) |
| 5-Person Households | 2,098 (4.4%) | 92 (0.2%) |
| 6-Person Households | 1,190 (2.5%) | 17 (0.0%) |
| 7+ Person Households | 653 (1.4%) | 0 (0.0%) |
| Total | 30,002 (63.6%) | 17,201 (36.4%) |
Female Fertility in Oswego County
Fertility by Age in Oswego County
Average fertility rate in Oswego County is 56.0 births per 1,000 women. Women in the age bracket of 20 to 34 years have the highest fertility rate with 104.0 births per 1,000 women. Women in the age bracket of 20 to 34 years acount for 77.1% of all women with births.
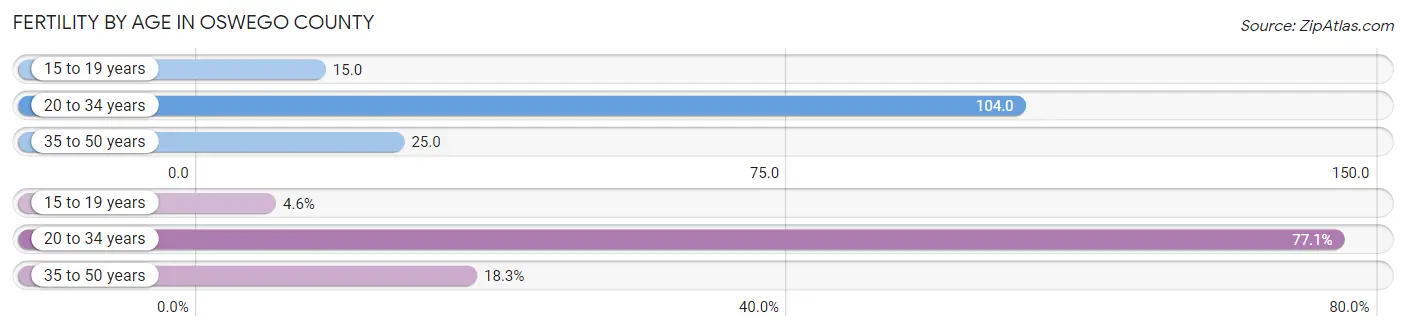
| Age Bracket | Women with Births | Births / 1,000 Women |
| 15 to 19 years | 68 (4.6%) | 15.0 |
| 20 to 34 years | 1,136 (77.1%) | 104.0 |
| 35 to 50 years | 269 (18.3%) | 25.0 |
| Total | 1,473 (100.0%) | 56.0 |
Fertility by Age by Marriage Status in Oswego County
54.2% of women with births (1,473) in Oswego County are married. The highest percentage of unmarried women with births falls into 15 to 19 years age bracket with 100.0% of them unmarried at the time of birth, while the lowest percentage of unmarried women with births belong to 35 to 50 years age bracket with 32.3% of them unmarried.
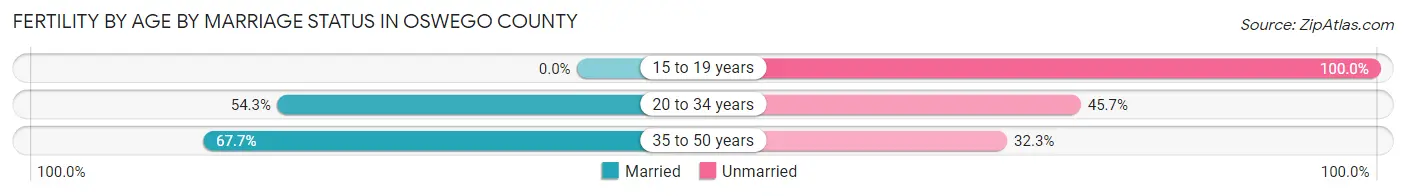
| Age Bracket | Married | Unmarried |
| 15 to 19 years | 0 (0.0%) | 68 (100.0%) |
| 20 to 34 years | 617 (54.3%) | 519 (45.7%) |
| 35 to 50 years | 182 (67.7%) | 87 (32.3%) |
| Total | 798 (54.2%) | 675 (45.8%) |
Fertility by Education in Oswego County
Average fertility rate in Oswego County is 56.0 births per 1,000 women. Women with the education attainment of bachelor's degree have the highest fertility rate of 85.0 births per 1,000 women, while women with the education attainment of less than high school have the lowest fertility at 40.0 births per 1,000 women. Women with the education attainment of college or associate's degree represent 33.7% of all women with births.
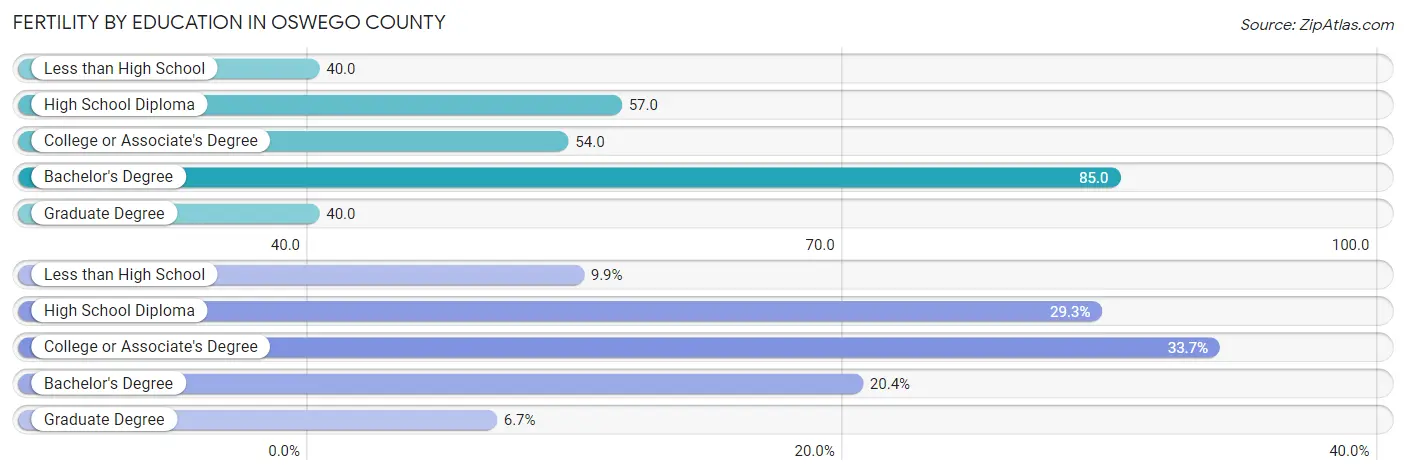
| Educational Attainment | Women with Births | Births / 1,000 Women |
| Less than High School | 146 (9.9%) | 40.0 |
| High School Diploma | 432 (29.3%) | 57.0 |
| College or Associate's Degree | 497 (33.7%) | 54.0 |
| Bachelor's Degree | 300 (20.4%) | 85.0 |
| Graduate Degree | 98 (6.7%) | 40.0 |
| Total | 1,473 (100.0%) | 56.0 |
Fertility by Education by Marriage Status in Oswego County
45.8% of women with births in Oswego County are unmarried. Women with the educational attainment of graduate degree are most likely to be married with 88.8% of them married at childbirth, while women with the educational attainment of less than high school are least likely to be married with 81.5% of them unmarried at childbirth.
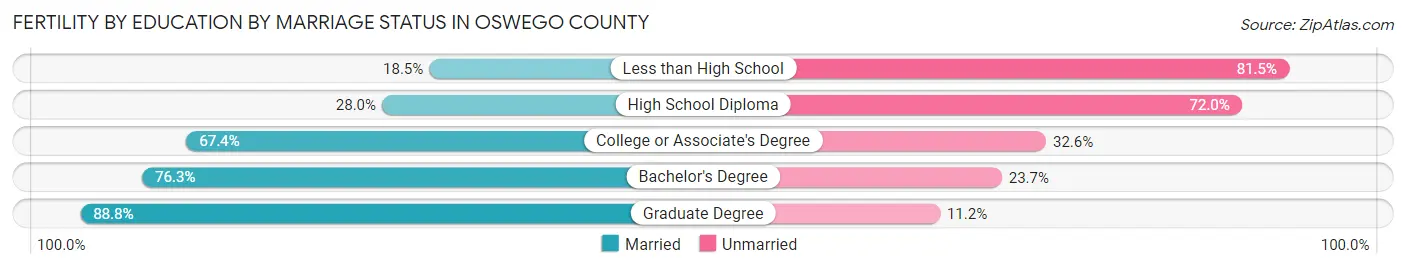
| Educational Attainment | Married | Unmarried |
| Less than High School | 27 (18.5%) | 119 (81.5%) |
| High School Diploma | 121 (28.0%) | 311 (72.0%) |
| College or Associate's Degree | 335 (67.4%) | 162 (32.6%) |
| Bachelor's Degree | 229 (76.3%) | 71 (23.7%) |
| Graduate Degree | 87 (88.8%) | 11 (11.2%) |
| Total | 798 (54.2%) | 675 (45.8%) |
Employment Characteristics in Oswego County
Employment by Class of Employer in Oswego County
Among the 53,261 employed individuals in Oswego County, private company employees (34,039 | 63.9%), local government employees (5,026 | 9.4%), and not-for-profit organizations (4,829 | 9.1%) make up the most common classes of employment.
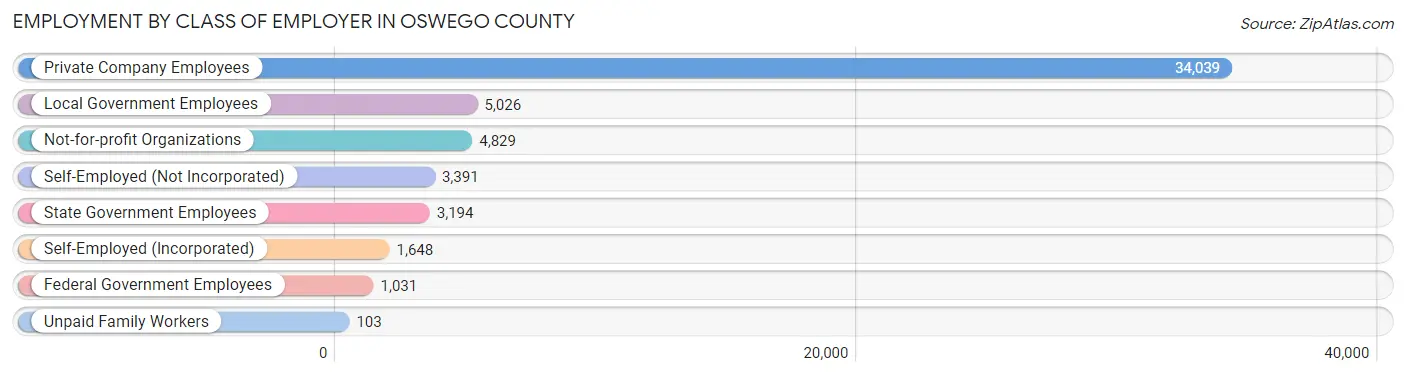
| Employer Class | # Employees | % Employees |
| Private Company Employees | 34,039 | 63.9% |
| Self-Employed (Incorporated) | 1,648 | 3.1% |
| Self-Employed (Not Incorporated) | 3,391 | 6.4% |
| Not-for-profit Organizations | 4,829 | 9.1% |
| Local Government Employees | 5,026 | 9.4% |
| State Government Employees | 3,194 | 6.0% |
| Federal Government Employees | 1,031 | 1.9% |
| Unpaid Family Workers | 103 | 0.2% |
| Total | 53,261 | 100.0% |
Employment Status by Age in Oswego County
According to the labor force statistics for Oswego County, out of the total population over 16 years of age (96,515), 61.1% or 58,971 individuals are in the labor force, with 7.3% or 4,305 of them unemployed. The age group with the highest labor force participation rate is 35 to 44 years, with 85.6% or 11,263 individuals in the labor force. Within the labor force, the 16 to 19 years age range has the highest percentage of unemployed individuals, with 25.8% or 873 of them being unemployed.
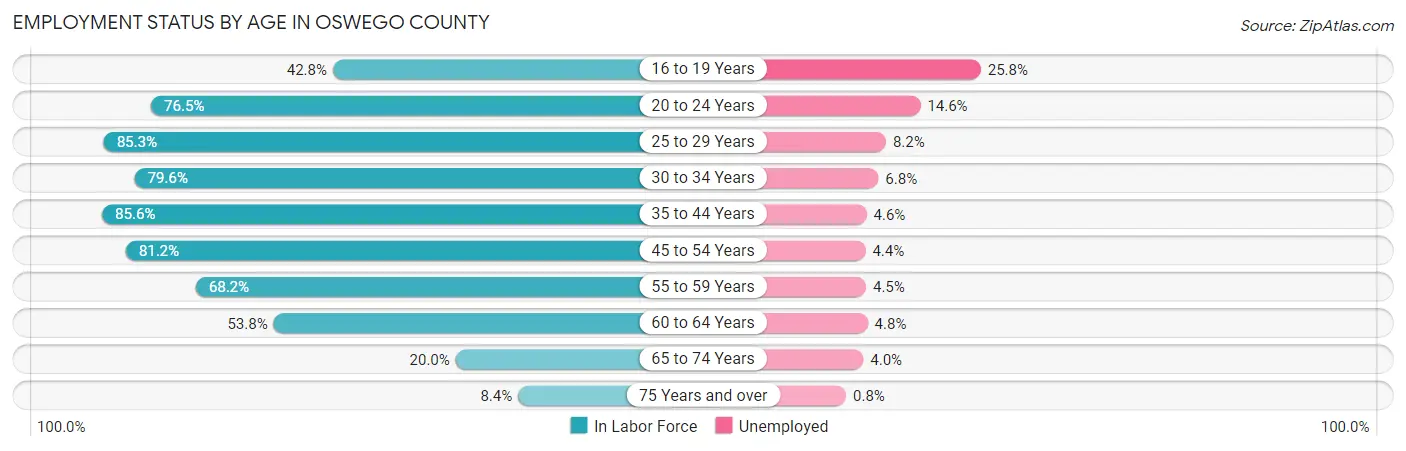
| Age Bracket | In Labor Force | Unemployed |
| 16 to 19 Years | 3,384 (42.8%) | 873 (25.8%) |
| 20 to 24 Years | 6,361 (76.5%) | 929 (14.6%) |
| 25 to 29 Years | 5,963 (85.3%) | 489 (8.2%) |
| 30 to 34 Years | 5,644 (79.6%) | 384 (6.8%) |
| 35 to 44 Years | 11,263 (85.6%) | 518 (4.6%) |
| 45 to 54 Years | 12,135 (81.2%) | 534 (4.4%) |
| 55 to 59 Years | 6,584 (68.2%) | 296 (4.5%) |
| 60 to 64 Years | 4,469 (53.8%) | 215 (4.8%) |
| 65 to 74 Years | 2,465 (20.0%) | 99 (4.0%) |
| 75 Years and over | 657 (8.4%) | 5 (0.8%) |
| Total | 58,971 (61.1%) | 4,305 (7.3%) |
Employment Status by Educational Attainment in Oswego County
According to labor force statistics for Oswego County, 76.6% of individuals (46,070) out of the total population between 25 and 64 years of age (60,144) are in the labor force, with 5.3% or 2,442 of them being unemployed. The group with the highest labor force participation rate are those with the educational attainment of bachelor's degree or higher, with 84.2% or 11,385 individuals in the labor force. Within the labor force, individuals with less than high school education have the highest percentage of unemployment, with 14.5% or 470 of them being unemployed.
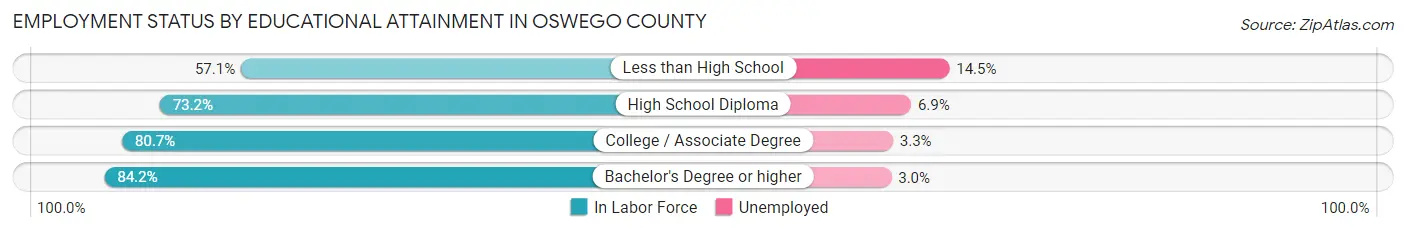
| Educational Attainment | In Labor Force | Unemployed |
| Less than High School | 3,238 (57.1%) | 822 (14.5%) |
| High School Diploma | 15,728 (73.2%) | 1,483 (6.9%) |
| College / Associate Degree | 15,710 (80.7%) | 642 (3.3%) |
| Bachelor's Degree or higher | 11,385 (84.2%) | 406 (3.0%) |
| Total | 46,070 (76.6%) | 3,188 (5.3%) |
Employment Occupations by Sex in Oswego County
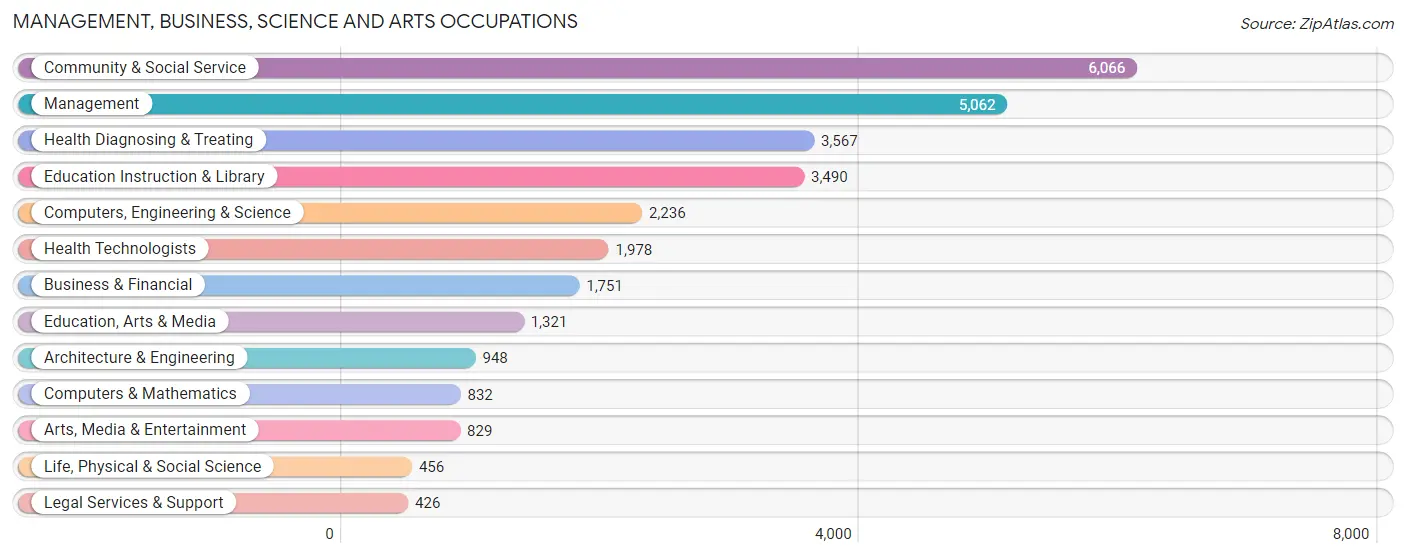
Management, Business, Science and Arts Occupations
The most common Management, Business, Science and Arts occupations in Oswego County are Community & Social Service (6,066 | 11.1%), Management (5,062 | 9.3%), Health Diagnosing & Treating (3,567 | 6.6%), Education Instruction & Library (3,490 | 6.4%), and Computers, Engineering & Science (2,236 | 4.1%).
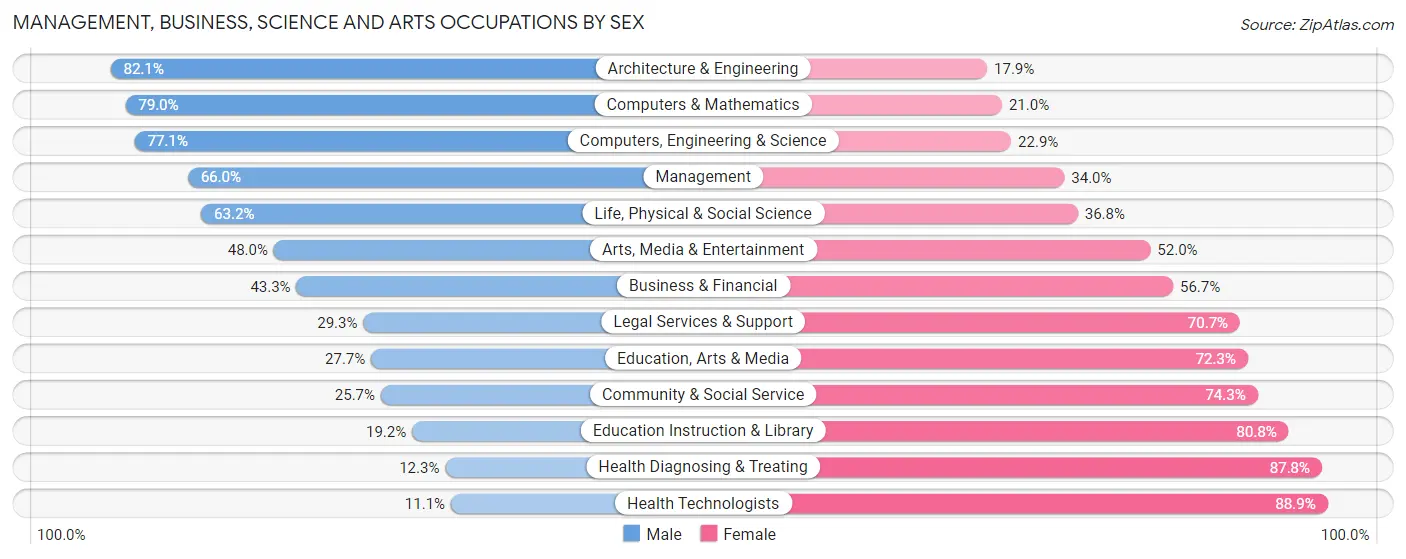
Management, Business, Science and Arts Occupations by Sex
Within the Management, Business, Science and Arts occupations in Oswego County, the most male-oriented occupations are Architecture & Engineering (82.1%), Computers & Mathematics (79.0%), and Computers, Engineering & Science (77.1%), while the most female-oriented occupations are Health Technologists (88.9%), Health Diagnosing & Treating (87.7%), and Education Instruction & Library (80.8%).
| Occupation | Male | Female |
| Management | 3,339 (66.0%) | 1,723 (34.0%) |
| Business & Financial | 758 (43.3%) | 993 (56.7%) |
| Computers, Engineering & Science | 1,723 (77.1%) | 513 (22.9%) |
| Computers & Mathematics | 657 (79.0%) | 175 (21.0%) |
| Architecture & Engineering | 778 (82.1%) | 170 (17.9%) |
| Life, Physical & Social Science | 288 (63.2%) | 168 (36.8%) |
| Community & Social Service | 1,558 (25.7%) | 4,508 (74.3%) |
| Education, Arts & Media | 366 (27.7%) | 955 (72.3%) |
| Legal Services & Support | 125 (29.3%) | 301 (70.7%) |
| Education Instruction & Library | 669 (19.2%) | 2,821 (80.8%) |
| Arts, Media & Entertainment | 398 (48.0%) | 431 (52.0%) |
| Health Diagnosing & Treating | 437 (12.2%) | 3,130 (87.7%) |
| Health Technologists | 219 (11.1%) | 1,759 (88.9%) |
| Total (Category) | 7,815 (41.8%) | 10,867 (58.2%) |
| Total (Overall) | 28,756 (52.8%) | 25,730 (47.2%) |
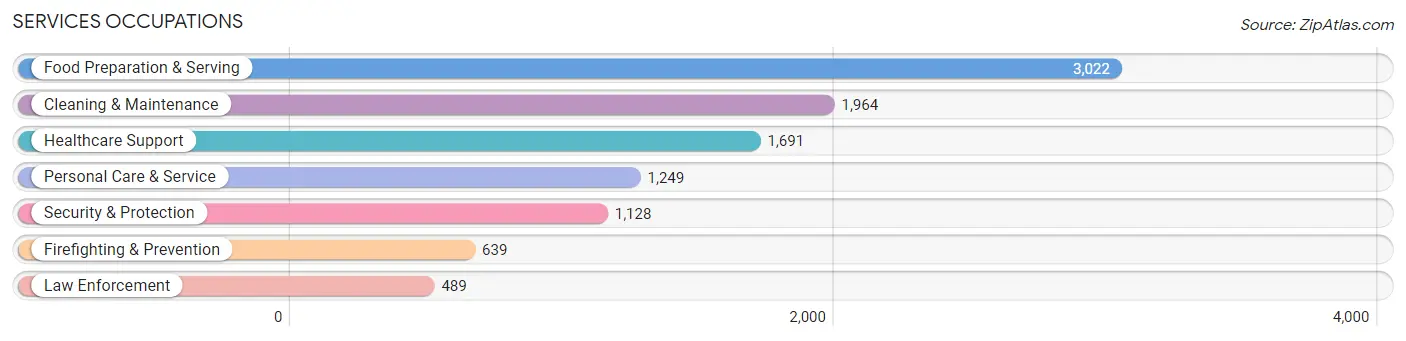
Services Occupations
The most common Services occupations in Oswego County are Food Preparation & Serving (3,022 | 5.6%), Cleaning & Maintenance (1,964 | 3.6%), Healthcare Support (1,691 | 3.1%), Personal Care & Service (1,249 | 2.3%), and Security & Protection (1,128 | 2.1%).
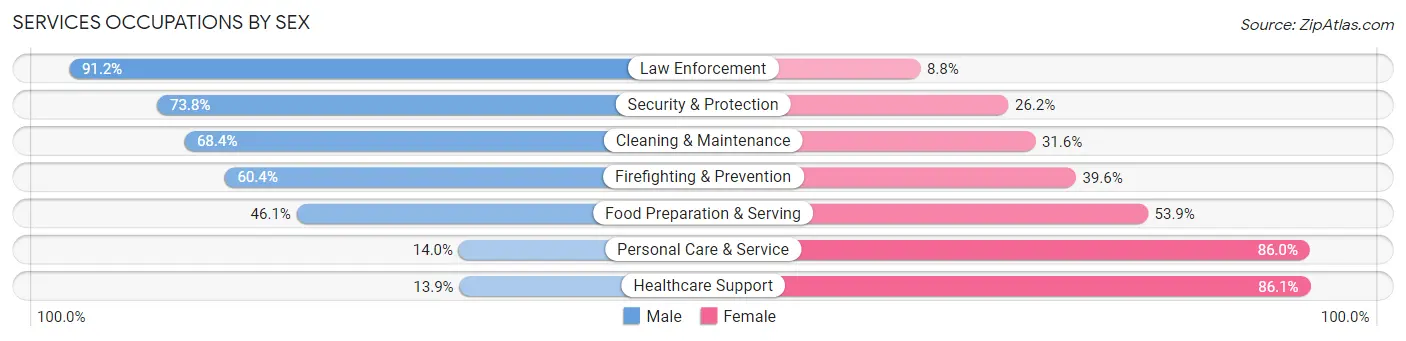
Services Occupations by Sex
Within the Services occupations in Oswego County, the most male-oriented occupations are Law Enforcement (91.2%), Security & Protection (73.8%), and Cleaning & Maintenance (68.4%), while the most female-oriented occupations are Healthcare Support (86.1%), Personal Care & Service (86.0%), and Food Preparation & Serving (53.9%).
| Occupation | Male | Female |
| Healthcare Support | 235 (13.9%) | 1,456 (86.1%) |
| Security & Protection | 832 (73.8%) | 296 (26.2%) |
| Firefighting & Prevention | 386 (60.4%) | 253 (39.6%) |
| Law Enforcement | 446 (91.2%) | 43 (8.8%) |
| Food Preparation & Serving | 1,394 (46.1%) | 1,628 (53.9%) |
| Cleaning & Maintenance | 1,344 (68.4%) | 620 (31.6%) |
| Personal Care & Service | 175 (14.0%) | 1,074 (86.0%) |
| Total (Category) | 3,980 (44.0%) | 5,074 (56.0%) |
| Total (Overall) | 28,756 (52.8%) | 25,730 (47.2%) |
Sales and Office Occupations
The most common Sales and Office occupations in Oswego County are Office & Administration (6,515 | 12.0%), and Sales & Related (4,668 | 8.6%).

Sales and Office Occupations by Sex

| Occupation | Male | Female |
| Sales & Related | 2,253 (48.3%) | 2,415 (51.7%) |
| Office & Administration | 1,565 (24.0%) | 4,950 (76.0%) |
| Total (Category) | 3,818 (34.1%) | 7,365 (65.9%) |
| Total (Overall) | 28,756 (52.8%) | 25,730 (47.2%) |
Natural Resources, Construction and Maintenance Occupations
The most common Natural Resources, Construction and Maintenance occupations in Oswego County are Construction & Extraction (3,141 | 5.8%), Installation, Maintenance & Repair (2,868 | 5.3%), and Farming, Fishing & Forestry (391 | 0.7%).

Natural Resources, Construction and Maintenance Occupations by Sex

| Occupation | Male | Female |
| Farming, Fishing & Forestry | 274 (70.1%) | 117 (29.9%) |
| Construction & Extraction | 3,021 (96.2%) | 120 (3.8%) |
| Installation, Maintenance & Repair | 2,852 (99.4%) | 16 (0.6%) |
| Total (Category) | 6,147 (96.1%) | 253 (4.0%) |
| Total (Overall) | 28,756 (52.8%) | 25,730 (47.2%) |
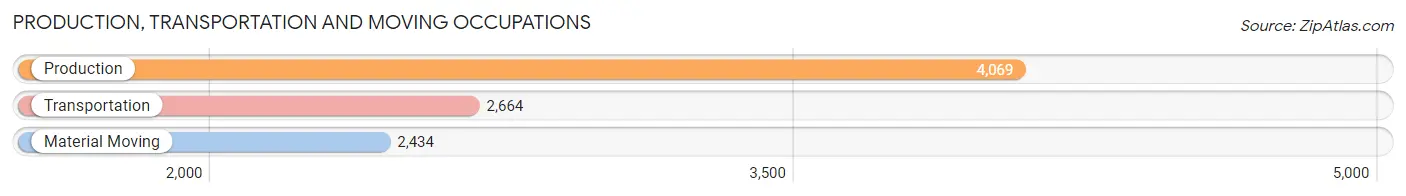
Production, Transportation and Moving Occupations
The most common Production, Transportation and Moving occupations in Oswego County are Production (4,069 | 7.5%), Transportation (2,664 | 4.9%), and Material Moving (2,434 | 4.5%).
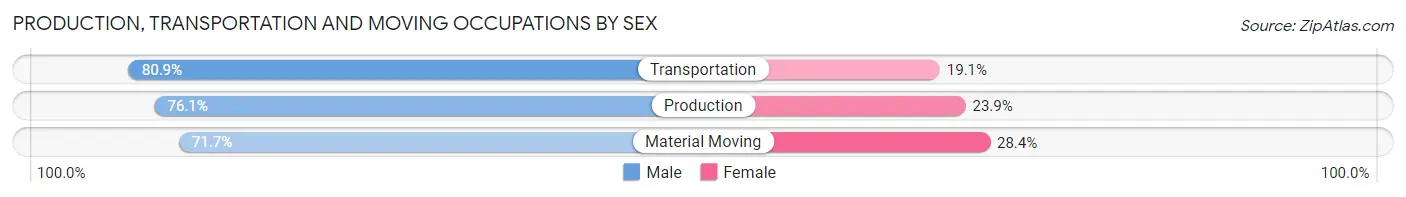
Production, Transportation and Moving Occupations by Sex
| Occupation | Male | Female |
| Production | 3,098 (76.1%) | 971 (23.9%) |
| Transportation | 2,154 (80.9%) | 510 (19.1%) |
| Material Moving | 1,744 (71.7%) | 690 (28.3%) |
| Total (Category) | 6,996 (76.3%) | 2,171 (23.7%) |
| Total (Overall) | 28,756 (52.8%) | 25,730 (47.2%) |
Employment Industries by Sex in Oswego County
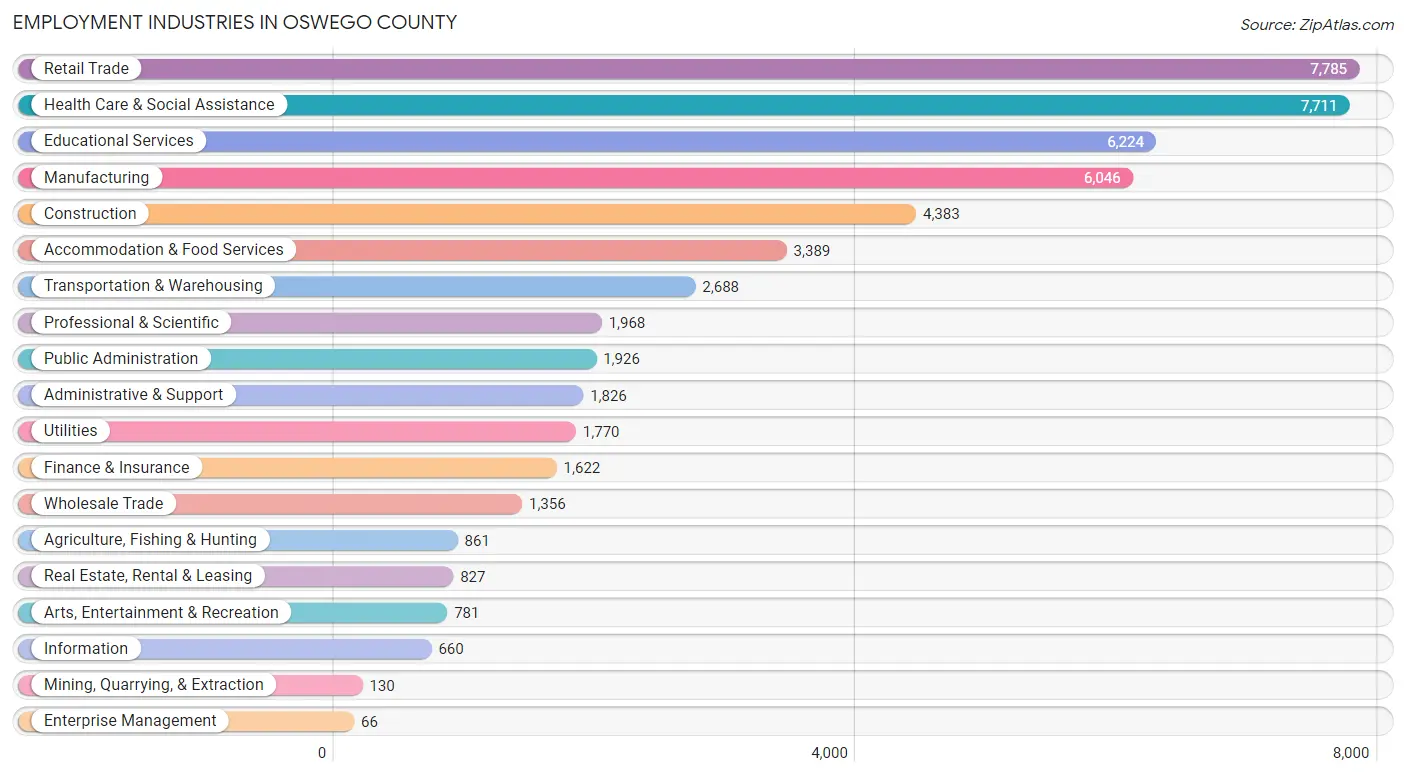
Employment Industries in Oswego County
The major employment industries in Oswego County include Retail Trade (7,785 | 14.3%), Health Care & Social Assistance (7,711 | 14.1%), Educational Services (6,224 | 11.4%), Manufacturing (6,046 | 11.1%), and Construction (4,383 | 8.0%).
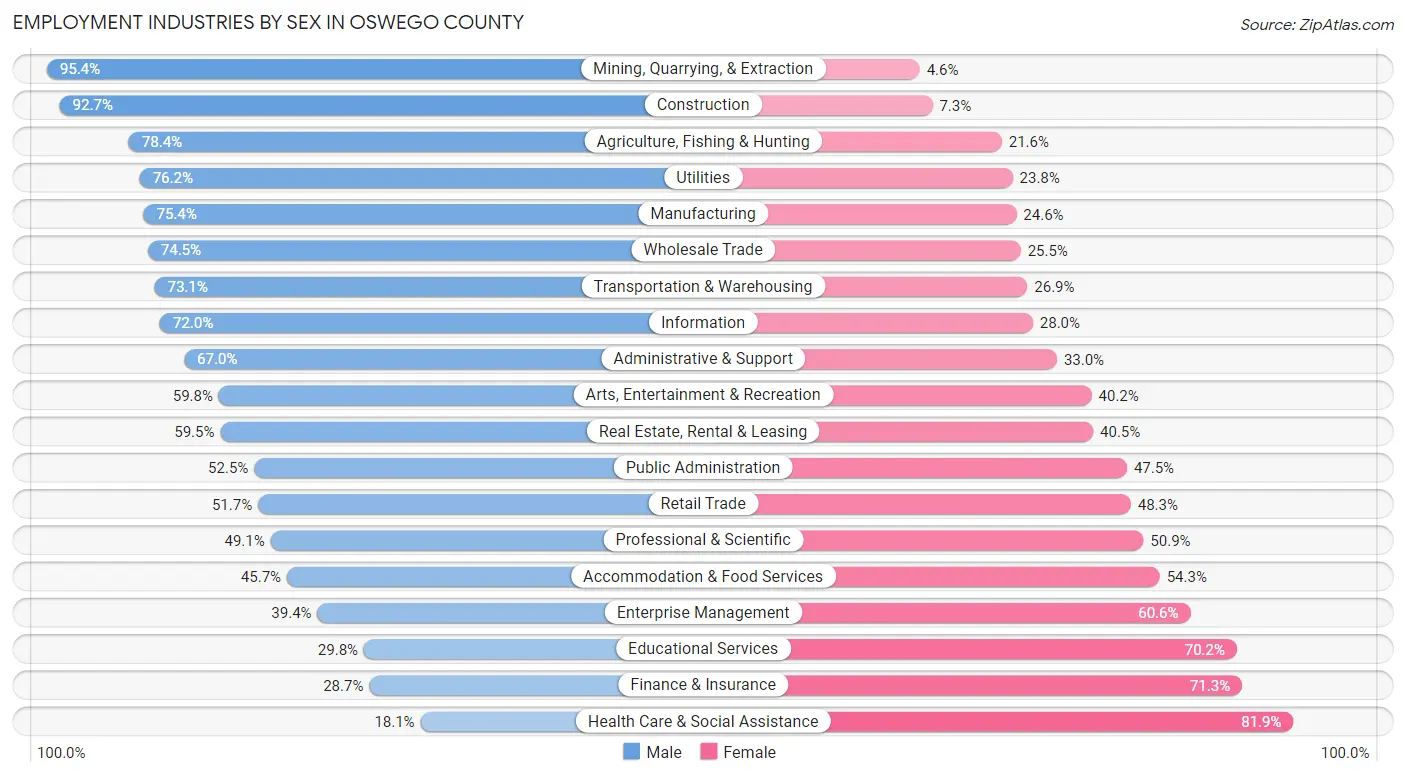
Employment Industries by Sex in Oswego County
The Oswego County industries that see more men than women are Mining, Quarrying, & Extraction (95.4%), Construction (92.7%), and Agriculture, Fishing & Hunting (78.4%), whereas the industries that tend to have a higher number of women are Health Care & Social Assistance (81.9%), Finance & Insurance (71.3%), and Educational Services (70.2%).
| Industry | Male | Female |
| Agriculture, Fishing & Hunting | 675 (78.4%) | 186 (21.6%) |
| Mining, Quarrying, & Extraction | 124 (95.4%) | 6 (4.6%) |
| Construction | 4,065 (92.7%) | 318 (7.3%) |
| Manufacturing | 4,557 (75.4%) | 1,489 (24.6%) |
| Wholesale Trade | 1,010 (74.5%) | 346 (25.5%) |
| Retail Trade | 4,024 (51.7%) | 3,761 (48.3%) |
| Transportation & Warehousing | 1,965 (73.1%) | 723 (26.9%) |
| Utilities | 1,348 (76.2%) | 422 (23.8%) |
| Information | 475 (72.0%) | 185 (28.0%) |
| Finance & Insurance | 465 (28.7%) | 1,157 (71.3%) |
| Real Estate, Rental & Leasing | 492 (59.5%) | 335 (40.5%) |
| Professional & Scientific | 966 (49.1%) | 1,002 (50.9%) |
| Enterprise Management | 26 (39.4%) | 40 (60.6%) |
| Administrative & Support | 1,223 (67.0%) | 603 (33.0%) |
| Educational Services | 1,853 (29.8%) | 4,371 (70.2%) |
| Health Care & Social Assistance | 1,393 (18.1%) | 6,318 (81.9%) |
| Arts, Entertainment & Recreation | 467 (59.8%) | 314 (40.2%) |
| Accommodation & Food Services | 1,549 (45.7%) | 1,840 (54.3%) |
| Public Administration | 1,011 (52.5%) | 915 (47.5%) |
| Total | 28,756 (52.8%) | 25,730 (47.2%) |
Education in Oswego County
School Enrollment in Oswego County
The most common levels of schooling among the 27,375 students in Oswego County are college / undergraduate (7,351 | 26.9%), middle school (5,828 | 21.3%), and high school (5,809 | 21.2%).
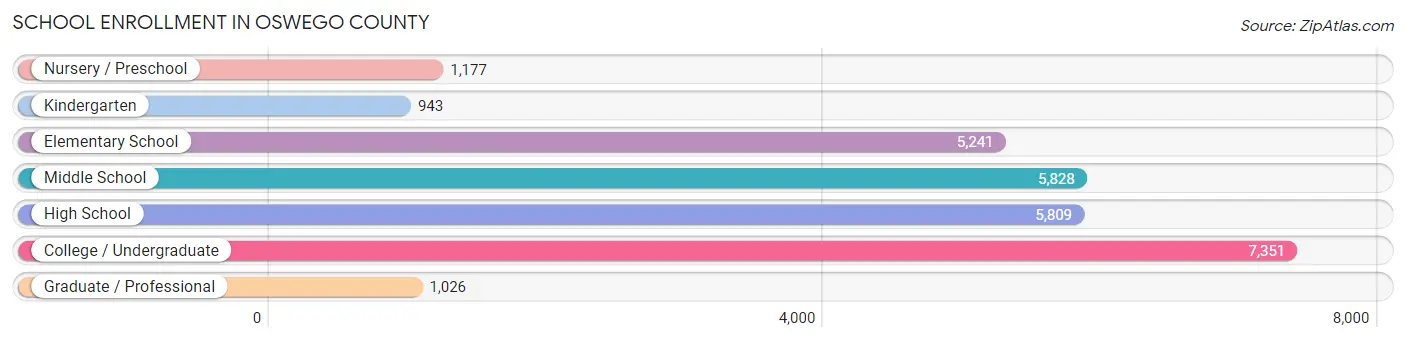
| School Level | # Students | % Students |
| Nursery / Preschool | 1,177 | 4.3% |
| Kindergarten | 943 | 3.4% |
| Elementary School | 5,241 | 19.2% |
| Middle School | 5,828 | 21.3% |
| High School | 5,809 | 21.2% |
| College / Undergraduate | 7,351 | 26.9% |
| Graduate / Professional | 1,026 | 3.7% |
| Total | 27,375 | 100.0% |
School Enrollment by Age by Funding Source in Oswego County
Out of a total of 27,375 students who are enrolled in schools in Oswego County, 2,820 (10.3%) attend a private institution, while the remaining 24,555 (89.7%) are enrolled in public schools. The age group of 25 to 34 year olds has the highest likelihood of being enrolled in private schools, with 341 (34.5% in the age bracket) enrolled. Conversely, the age group of 15 to 17 year olds has the lowest likelihood of being enrolled in a private school, with 3,967 (94.2% in the age bracket) attending a public institution.
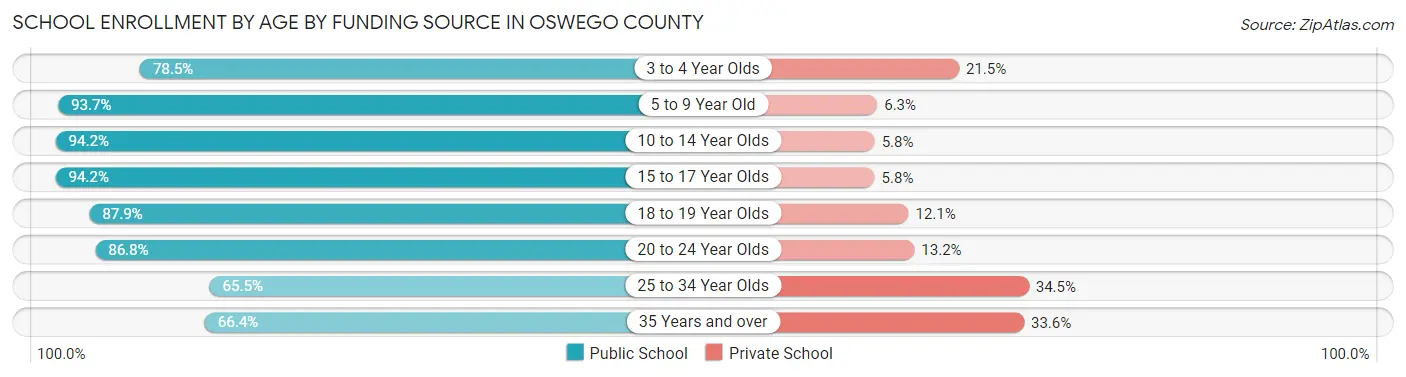
| Age Bracket | Public School | Private School |
| 3 to 4 Year Olds | 771 (78.5%) | 211 (21.5%) |
| 5 to 9 Year Old | 5,658 (93.7%) | 378 (6.3%) |
| 10 to 14 Year Olds | 6,689 (94.2%) | 411 (5.8%) |
| 15 to 17 Year Olds | 3,967 (94.2%) | 243 (5.8%) |
| 18 to 19 Year Olds | 3,508 (87.9%) | 482 (12.1%) |
| 20 to 24 Year Olds | 2,622 (86.8%) | 398 (13.2%) |
| 25 to 34 Year Olds | 648 (65.5%) | 341 (34.5%) |
| 35 Years and over | 696 (66.4%) | 352 (33.6%) |
| Total | 24,555 (89.7%) | 2,820 (10.3%) |
Educational Attainment by Field of Study in Oswego County
Education (3,856 | 21.0%), business (2,357 | 12.9%), science & technology (1,867 | 10.2%), psychology (1,383 | 7.5%), and social sciences (1,205 | 6.6%) are the most common fields of study among 18,340 individuals in Oswego County who have obtained a bachelor's degree or higher.
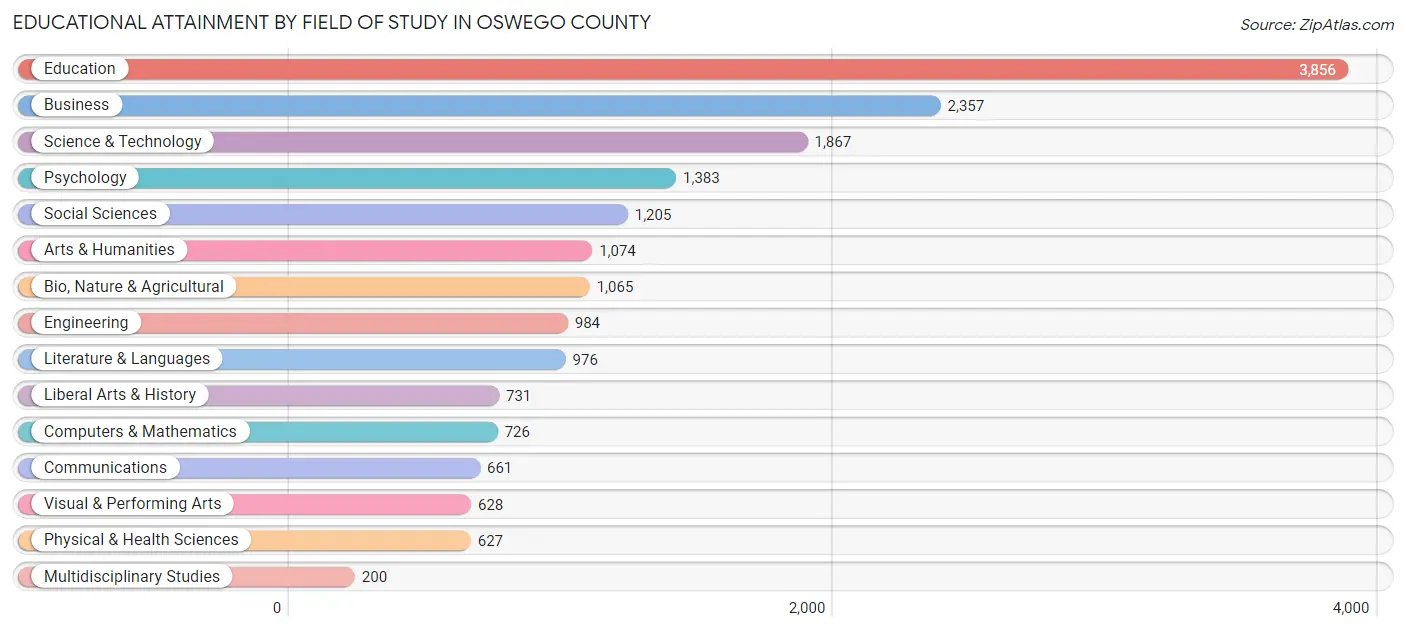
| Field of Study | # Graduates | % Graduates |
| Computers & Mathematics | 726 | 4.0% |
| Bio, Nature & Agricultural | 1,065 | 5.8% |
| Physical & Health Sciences | 627 | 3.4% |
| Psychology | 1,383 | 7.5% |
| Social Sciences | 1,205 | 6.6% |
| Engineering | 984 | 5.4% |
| Multidisciplinary Studies | 200 | 1.1% |
| Science & Technology | 1,867 | 10.2% |
| Business | 2,357 | 12.9% |
| Education | 3,856 | 21.0% |
| Literature & Languages | 976 | 5.3% |
| Liberal Arts & History | 731 | 4.0% |
| Visual & Performing Arts | 628 | 3.4% |
| Communications | 661 | 3.6% |
| Arts & Humanities | 1,074 | 5.9% |
| Total | 18,340 | 100.0% |
Transportation & Commute in Oswego County
Vehicle Availability by Sex in Oswego County
The most prevalent vehicle ownership categories in Oswego County are males with 2 vehicles (12,063, accounting for 43.5%) and females with 2 vehicles (10,474, making up 49.0%).
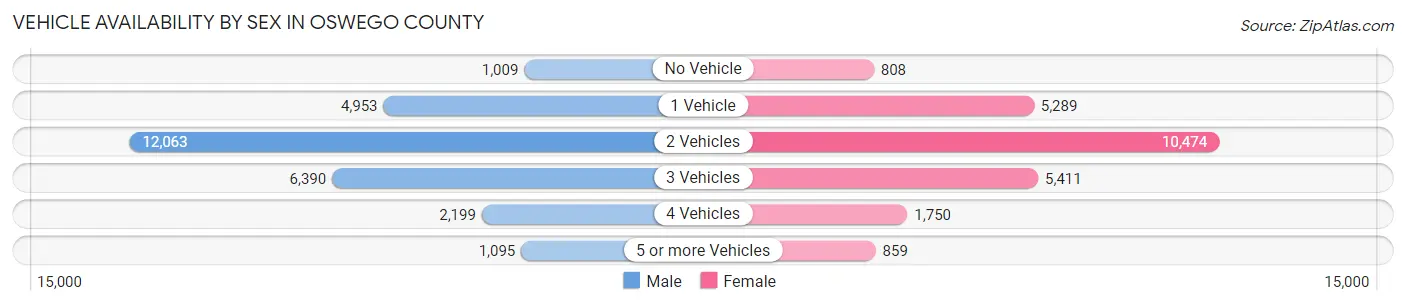
| Vehicles Available | Male | Female |
| No Vehicle | 1,009 (3.6%) | 808 (3.3%) |
| 1 Vehicle | 4,953 (17.9%) | 5,289 (21.5%) |
| 2 Vehicles | 12,063 (43.5%) | 10,474 (42.6%) |
| 3 Vehicles | 6,390 (23.1%) | 5,411 (22.0%) |
| 4 Vehicles | 2,199 (7.9%) | 1,750 (7.1%) |
| 5 or more Vehicles | 1,095 (4.0%) | 859 (3.5%) |
| Total | 27,709 (100.0%) | 24,591 (100.0%) |
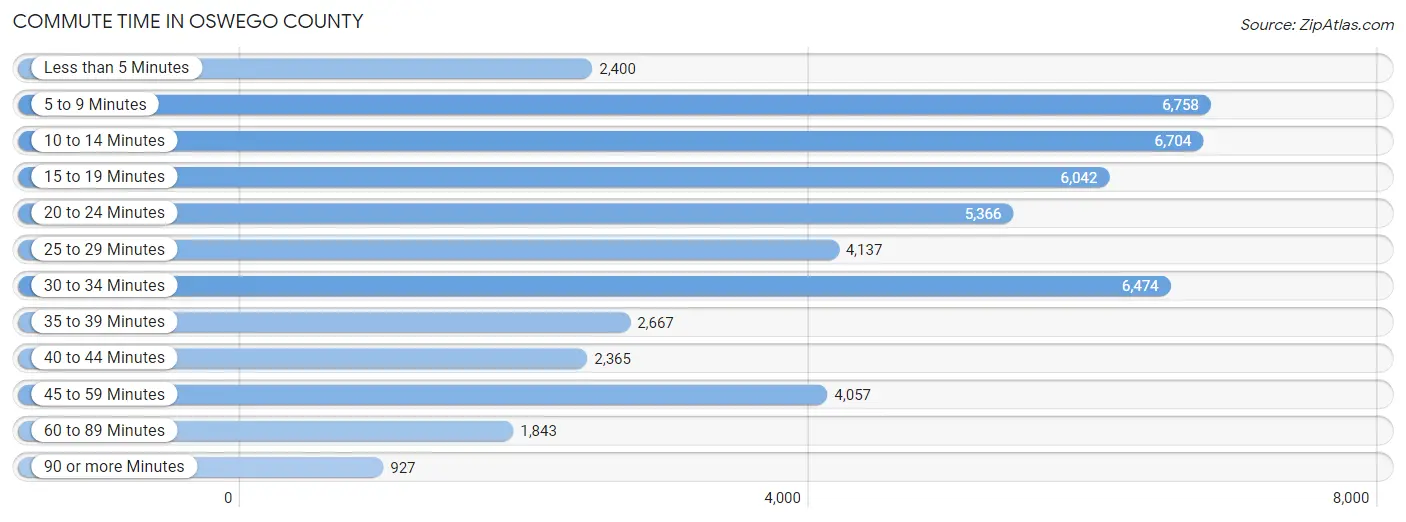
Commute Time in Oswego County
The most frequently occuring commute durations in Oswego County are 5 to 9 minutes (6,758 commuters, 13.6%), 10 to 14 minutes (6,704 commuters, 13.5%), and 30 to 34 minutes (6,474 commuters, 13.0%).
| Commute Time | # Commuters | % Commuters |
| Less than 5 Minutes | 2,400 | 4.8% |
| 5 to 9 Minutes | 6,758 | 13.6% |
| 10 to 14 Minutes | 6,704 | 13.5% |
| 15 to 19 Minutes | 6,042 | 12.1% |
| 20 to 24 Minutes | 5,366 | 10.8% |
| 25 to 29 Minutes | 4,137 | 8.3% |
| 30 to 34 Minutes | 6,474 | 13.0% |
| 35 to 39 Minutes | 2,667 | 5.4% |
| 40 to 44 Minutes | 2,365 | 4.8% |
| 45 to 59 Minutes | 4,057 | 8.2% |
| 60 to 89 Minutes | 1,843 | 3.7% |
| 90 or more Minutes | 927 | 1.9% |
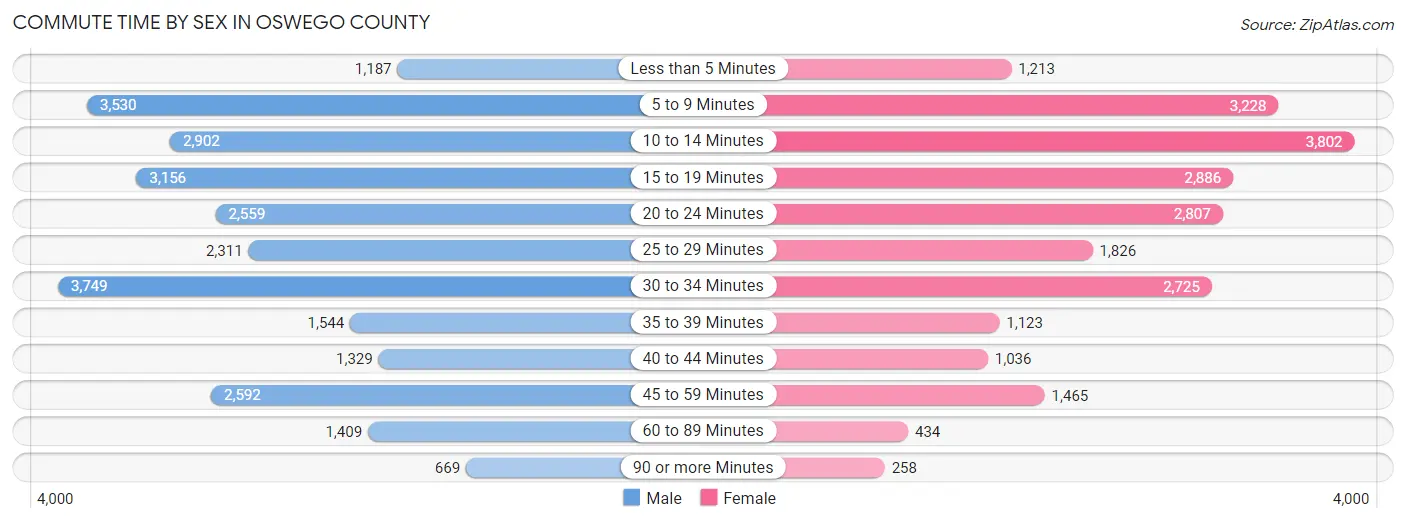
Commute Time by Sex in Oswego County
The most common commute times in Oswego County are 30 to 34 minutes (3,749 commuters, 13.9%) for males and 10 to 14 minutes (3,802 commuters, 16.7%) for females.
| Commute Time | Male | Female |
| Less than 5 Minutes | 1,187 (4.4%) | 1,213 (5.3%) |
| 5 to 9 Minutes | 3,530 (13.1%) | 3,228 (14.2%) |
| 10 to 14 Minutes | 2,902 (10.8%) | 3,802 (16.7%) |
| 15 to 19 Minutes | 3,156 (11.7%) | 2,886 (12.7%) |
| 20 to 24 Minutes | 2,559 (9.5%) | 2,807 (12.3%) |
| 25 to 29 Minutes | 2,311 (8.6%) | 1,826 (8.0%) |
| 30 to 34 Minutes | 3,749 (13.9%) | 2,725 (11.9%) |
| 35 to 39 Minutes | 1,544 (5.7%) | 1,123 (4.9%) |
| 40 to 44 Minutes | 1,329 (4.9%) | 1,036 (4.5%) |
| 45 to 59 Minutes | 2,592 (9.6%) | 1,465 (6.4%) |
| 60 to 89 Minutes | 1,409 (5.2%) | 434 (1.9%) |
| 90 or more Minutes | 669 (2.5%) | 258 (1.1%) |
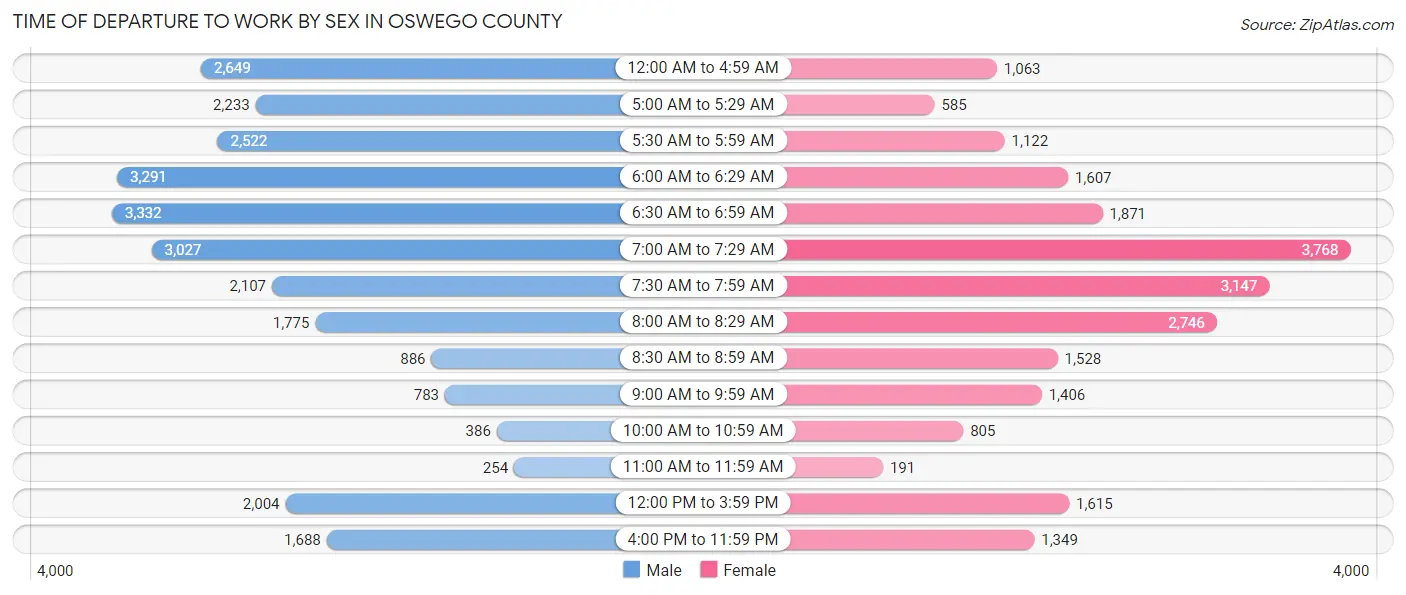
Time of Departure to Work by Sex in Oswego County
The most frequent times of departure to work in Oswego County are 6:30 AM to 6:59 AM (3,332, 12.4%) for males and 7:00 AM to 7:29 AM (3,768, 16.5%) for females.
| Time of Departure | Male | Female |
| 12:00 AM to 4:59 AM | 2,649 (9.8%) | 1,063 (4.7%) |
| 5:00 AM to 5:29 AM | 2,233 (8.3%) | 585 (2.6%) |
| 5:30 AM to 5:59 AM | 2,522 (9.4%) | 1,122 (4.9%) |
| 6:00 AM to 6:29 AM | 3,291 (12.2%) | 1,607 (7.0%) |
| 6:30 AM to 6:59 AM | 3,332 (12.4%) | 1,871 (8.2%) |
| 7:00 AM to 7:29 AM | 3,027 (11.2%) | 3,768 (16.5%) |
| 7:30 AM to 7:59 AM | 2,107 (7.8%) | 3,147 (13.8%) |
| 8:00 AM to 8:29 AM | 1,775 (6.6%) | 2,746 (12.0%) |
| 8:30 AM to 8:59 AM | 886 (3.3%) | 1,528 (6.7%) |
| 9:00 AM to 9:59 AM | 783 (2.9%) | 1,406 (6.2%) |
| 10:00 AM to 10:59 AM | 386 (1.4%) | 805 (3.5%) |
| 11:00 AM to 11:59 AM | 254 (0.9%) | 191 (0.8%) |
| 12:00 PM to 3:59 PM | 2,004 (7.4%) | 1,615 (7.1%) |
| 4:00 PM to 11:59 PM | 1,688 (6.3%) | 1,349 (5.9%) |
| Total | 26,937 (100.0%) | 22,803 (100.0%) |
Housing Occupancy in Oswego County
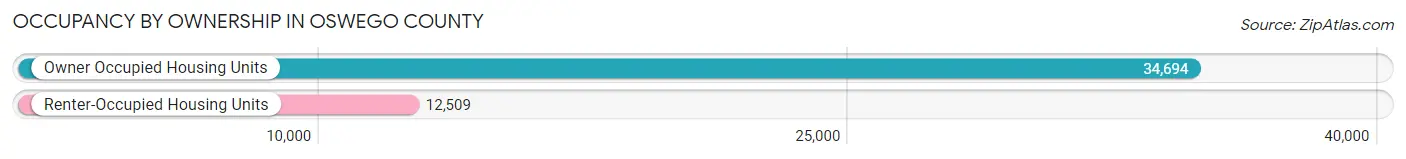
Occupancy by Ownership in Oswego County
Of the total 47,203 dwellings in Oswego County, owner-occupied units account for 34,694 (73.5%), while renter-occupied units make up 12,509 (26.5%).
| Occupancy | # Housing Units | % Housing Units |
| Owner Occupied Housing Units | 34,694 | 73.5% |
| Renter-Occupied Housing Units | 12,509 | 26.5% |
| Total Occupied Housing Units | 47,203 | 100.0% |
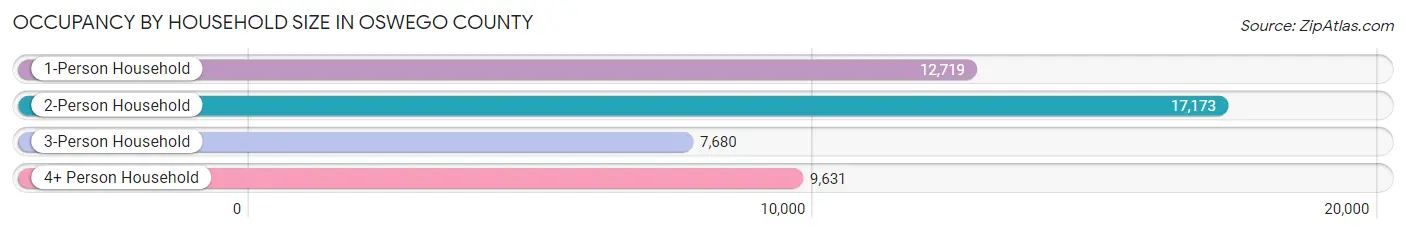
Occupancy by Household Size in Oswego County
| Household Size | # Housing Units | % Housing Units |
| 1-Person Household | 12,719 | 27.0% |
| 2-Person Household | 17,173 | 36.4% |
| 3-Person Household | 7,680 | 16.3% |
| 4+ Person Household | 9,631 | 20.4% |
| Total Housing Units | 47,203 | 100.0% |
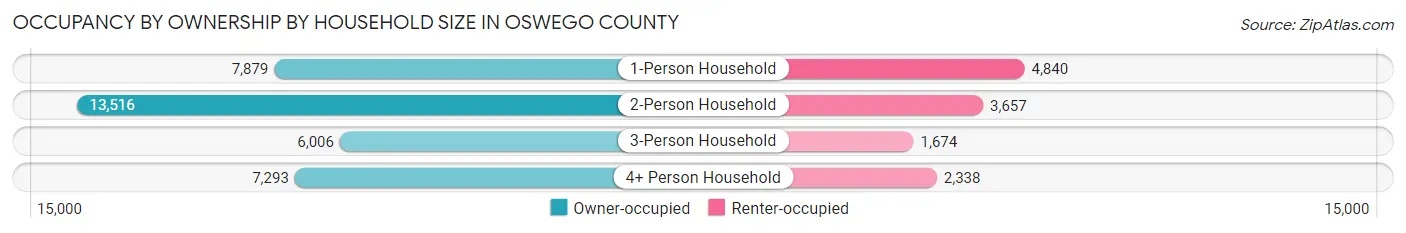
Occupancy by Ownership by Household Size in Oswego County
| Household Size | Owner-occupied | Renter-occupied |
| 1-Person Household | 7,879 (62.0%) | 4,840 (38.1%) |
| 2-Person Household | 13,516 (78.7%) | 3,657 (21.3%) |
| 3-Person Household | 6,006 (78.2%) | 1,674 (21.8%) |
| 4+ Person Household | 7,293 (75.7%) | 2,338 (24.3%) |
| Total Housing Units | 34,694 (73.5%) | 12,509 (26.5%) |
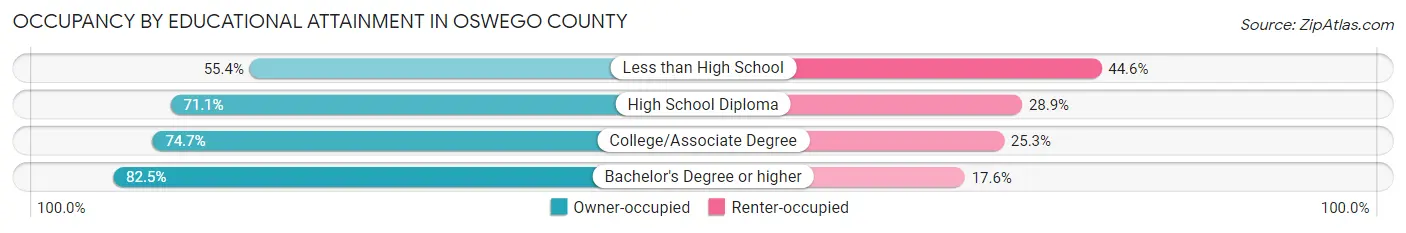
Occupancy by Educational Attainment in Oswego County
| Household Size | Owner-occupied | Renter-occupied |
| Less than High School | 2,433 (55.4%) | 1,962 (44.6%) |
| High School Diploma | 11,355 (71.1%) | 4,615 (28.9%) |
| College/Associate Degree | 11,746 (74.7%) | 3,982 (25.3%) |
| Bachelor's Degree or higher | 9,160 (82.5%) | 1,950 (17.5%) |
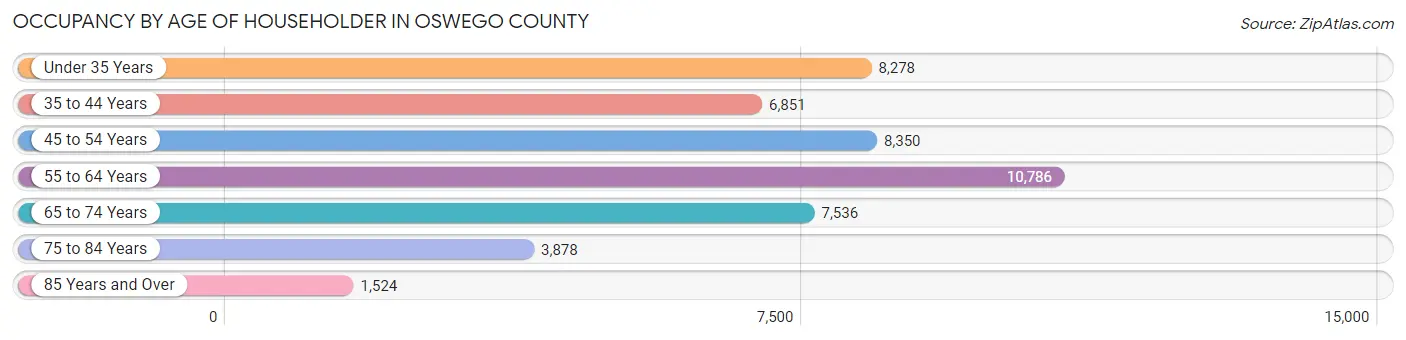
Occupancy by Age of Householder in Oswego County
| Age Bracket | # Households | % Households |
| Under 35 Years | 8,278 | 17.5% |
| 35 to 44 Years | 6,851 | 14.5% |
| 45 to 54 Years | 8,350 | 17.7% |
| 55 to 64 Years | 10,786 | 22.9% |
| 65 to 74 Years | 7,536 | 16.0% |
| 75 to 84 Years | 3,878 | 8.2% |
| 85 Years and Over | 1,524 | 3.2% |
| Total | 47,203 | 100.0% |
Housing Finances in Oswego County
Median Income by Occupancy in Oswego County
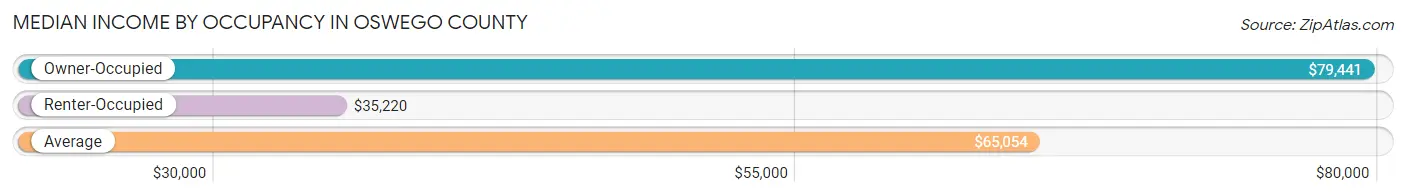
| Occupancy Type | # Households | Median Income |
| Owner-Occupied | 34,694 (73.5%) | $79,441 |
| Renter-Occupied | 12,509 (26.5%) | $35,220 |
| Average | 47,203 (100.0%) | $65,054 |
Occupancy by Householder Income Bracket in Oswego County
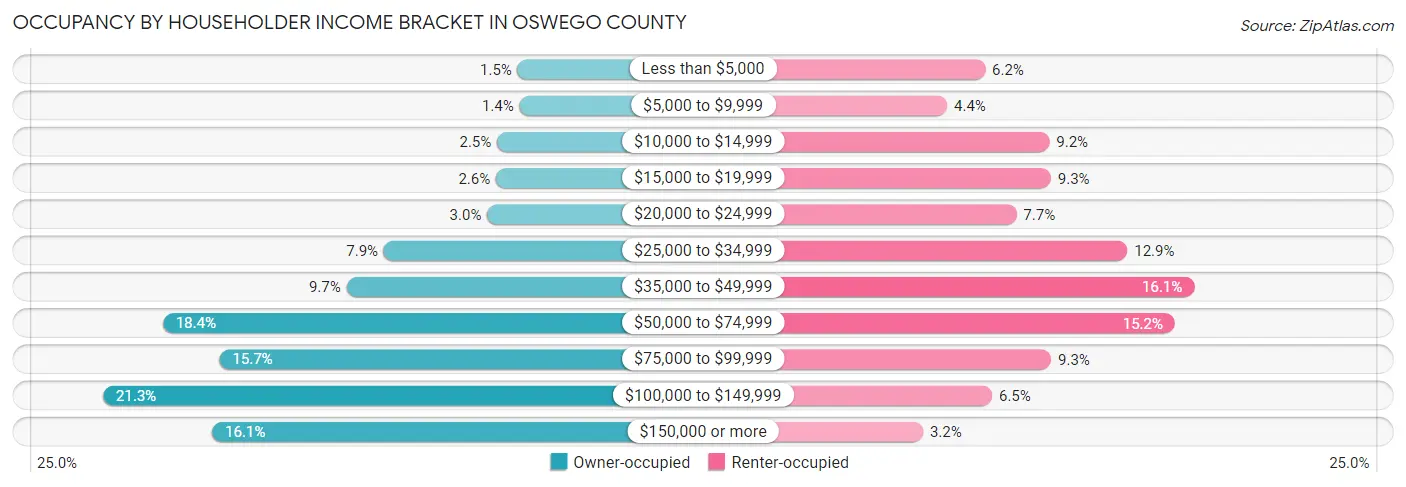
| Income Bracket | Owner-occupied | Renter-occupied |
| Less than $5,000 | 527 (1.5%) | 772 (6.2%) |
| $5,000 to $9,999 | 495 (1.4%) | 545 (4.4%) |
| $10,000 to $14,999 | 868 (2.5%) | 1,155 (9.2%) |
| $15,000 to $19,999 | 886 (2.5%) | 1,163 (9.3%) |
| $20,000 to $24,999 | 1,030 (3.0%) | 958 (7.7%) |
| $25,000 to $34,999 | 2,737 (7.9%) | 1,619 (12.9%) |
| $35,000 to $49,999 | 3,354 (9.7%) | 2,017 (16.1%) |
| $50,000 to $74,999 | 6,390 (18.4%) | 1,901 (15.2%) |
| $75,000 to $99,999 | 5,454 (15.7%) | 1,165 (9.3%) |
| $100,000 to $149,999 | 7,379 (21.3%) | 813 (6.5%) |
| $150,000 or more | 5,574 (16.1%) | 401 (3.2%) |
| Total | 34,694 (100.0%) | 12,509 (100.0%) |
Monthly Housing Cost Tiers in Oswego County
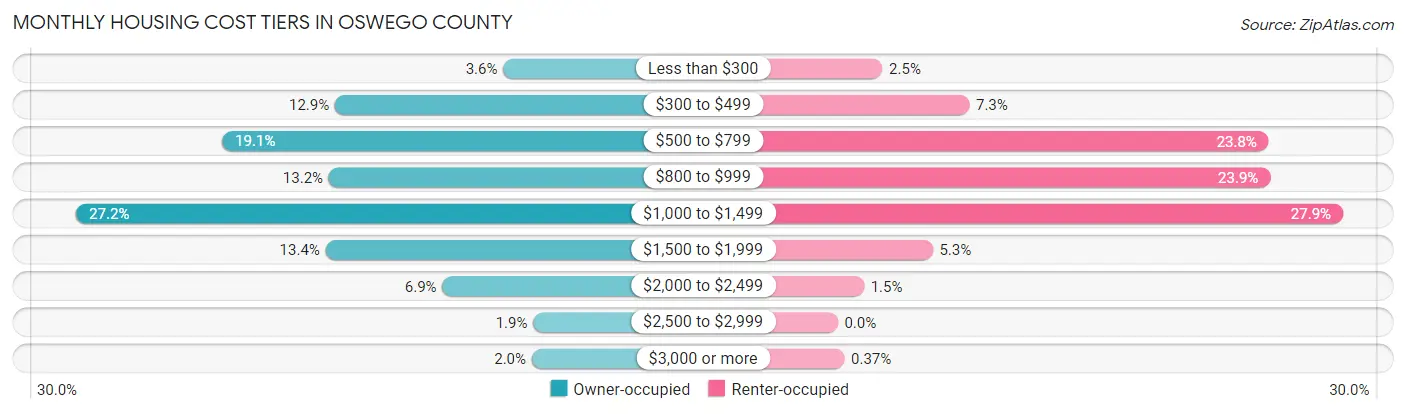
| Monthly Cost | Owner-occupied | Renter-occupied |
| Less than $300 | 1,235 (3.6%) | 309 (2.5%) |
| $300 to $499 | 4,457 (12.9%) | 909 (7.3%) |
| $500 to $799 | 6,624 (19.1%) | 2,980 (23.8%) |
| $800 to $999 | 4,575 (13.2%) | 2,990 (23.9%) |
| $1,000 to $1,499 | 9,419 (27.2%) | 3,492 (27.9%) |
| $1,500 to $1,999 | 4,639 (13.4%) | 657 (5.2%) |
| $2,000 to $2,499 | 2,400 (6.9%) | 182 (1.5%) |
| $2,500 to $2,999 | 658 (1.9%) | 0 (0.0%) |
| $3,000 or more | 687 (2.0%) | 46 (0.4%) |
| Total | 34,694 (100.0%) | 12,509 (100.0%) |
Physical Housing Characteristics in Oswego County
Housing Structures in Oswego County
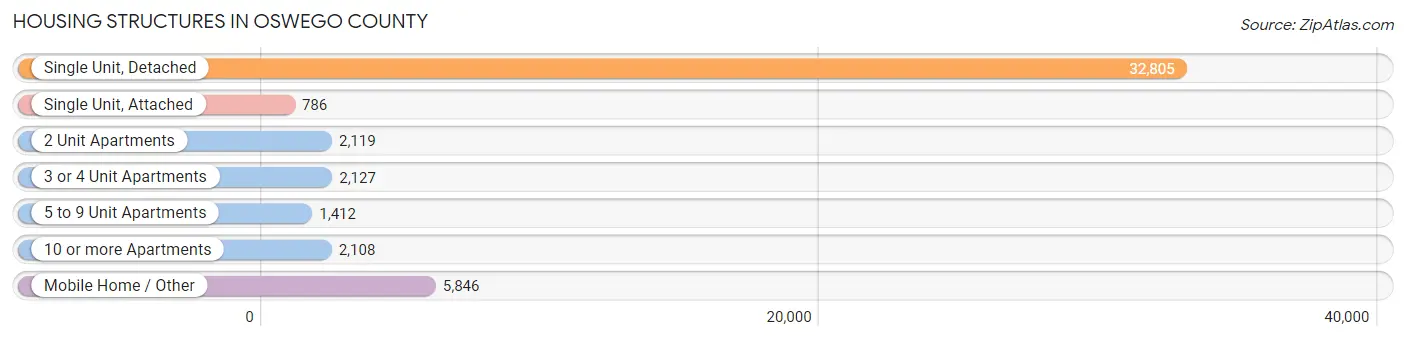
| Structure Type | # Housing Units | % Housing Units |
| Single Unit, Detached | 32,805 | 69.5% |
| Single Unit, Attached | 786 | 1.7% |
| 2 Unit Apartments | 2,119 | 4.5% |
| 3 or 4 Unit Apartments | 2,127 | 4.5% |
| 5 to 9 Unit Apartments | 1,412 | 3.0% |
| 10 or more Apartments | 2,108 | 4.5% |
| Mobile Home / Other | 5,846 | 12.4% |
| Total | 47,203 | 100.0% |
Housing Structures by Occupancy in Oswego County
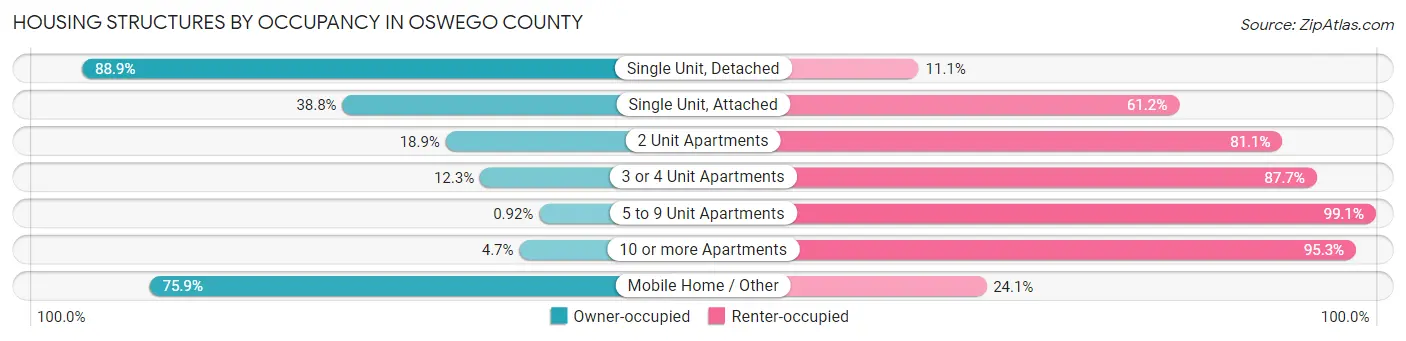
| Structure Type | Owner-occupied | Renter-occupied |
| Single Unit, Detached | 29,174 (88.9%) | 3,631 (11.1%) |
| Single Unit, Attached | 305 (38.8%) | 481 (61.2%) |
| 2 Unit Apartments | 401 (18.9%) | 1,718 (81.1%) |
| 3 or 4 Unit Apartments | 262 (12.3%) | 1,865 (87.7%) |
| 5 to 9 Unit Apartments | 13 (0.9%) | 1,399 (99.1%) |
| 10 or more Apartments | 100 (4.7%) | 2,008 (95.3%) |
| Mobile Home / Other | 4,439 (75.9%) | 1,407 (24.1%) |
| Total | 34,694 (73.5%) | 12,509 (26.5%) |
Housing Structures by Number of Rooms in Oswego County
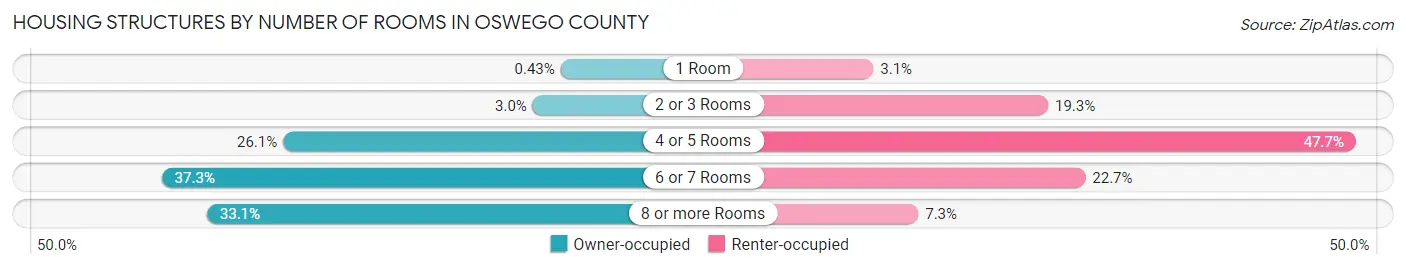
| Number of Rooms | Owner-occupied | Renter-occupied |
| 1 Room | 149 (0.4%) | 386 (3.1%) |
| 2 or 3 Rooms | 1,045 (3.0%) | 2,408 (19.3%) |
| 4 or 5 Rooms | 9,056 (26.1%) | 5,968 (47.7%) |
| 6 or 7 Rooms | 12,947 (37.3%) | 2,840 (22.7%) |
| 8 or more Rooms | 11,497 (33.1%) | 907 (7.2%) |
| Total | 34,694 (100.0%) | 12,509 (100.0%) |
Housing Structure by Heating Type in Oswego County
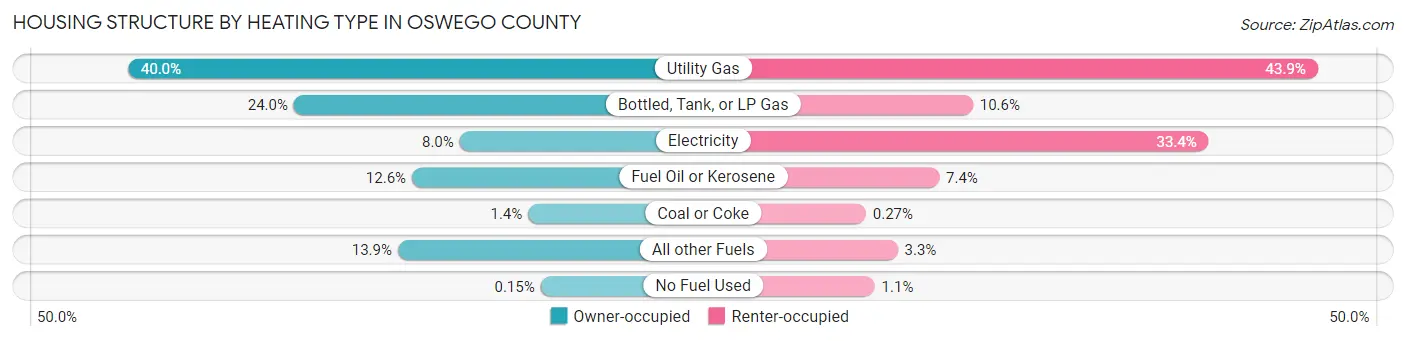
| Heating Type | Owner-occupied | Renter-occupied |
| Utility Gas | 13,885 (40.0%) | 5,494 (43.9%) |
| Bottled, Tank, or LP Gas | 8,322 (24.0%) | 1,326 (10.6%) |
| Electricity | 2,765 (8.0%) | 4,177 (33.4%) |
| Fuel Oil or Kerosene | 4,365 (12.6%) | 920 (7.3%) |
| Coal or Coke | 470 (1.3%) | 34 (0.3%) |
| All other Fuels | 4,836 (13.9%) | 418 (3.3%) |
| No Fuel Used | 51 (0.2%) | 140 (1.1%) |
| Total | 34,694 (100.0%) | 12,509 (100.0%) |
Household Vehicle Usage in Oswego County
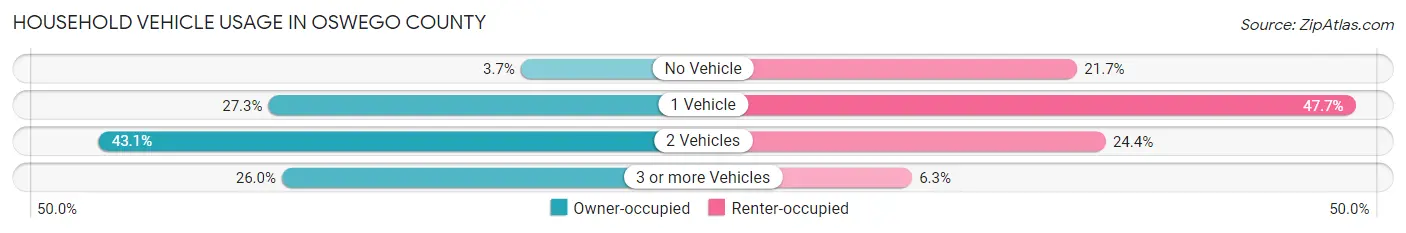
| Vehicles per Household | Owner-occupied | Renter-occupied |
| No Vehicle | 1,279 (3.7%) | 2,714 (21.7%) |
| 1 Vehicle | 9,455 (27.3%) | 5,961 (47.6%) |
| 2 Vehicles | 14,943 (43.1%) | 3,049 (24.4%) |
| 3 or more Vehicles | 9,017 (26.0%) | 785 (6.3%) |
| Total | 34,694 (100.0%) | 12,509 (100.0%) |
Real Estate & Mortgages in Oswego County
Real Estate and Mortgage Overview in Oswego County
| Characteristic | Without Mortgage | With Mortgage |
| Housing Units | 15,096 | 19,598 |
| Median Property Value | $111,500 | $142,500 |
| Median Household Income | $59,572 | $3,843 |
| Monthly Housing Costs | $590 | $652 |
| Real Estate Taxes | $2,806 | $819 |
Property Value by Mortgage Status in Oswego County
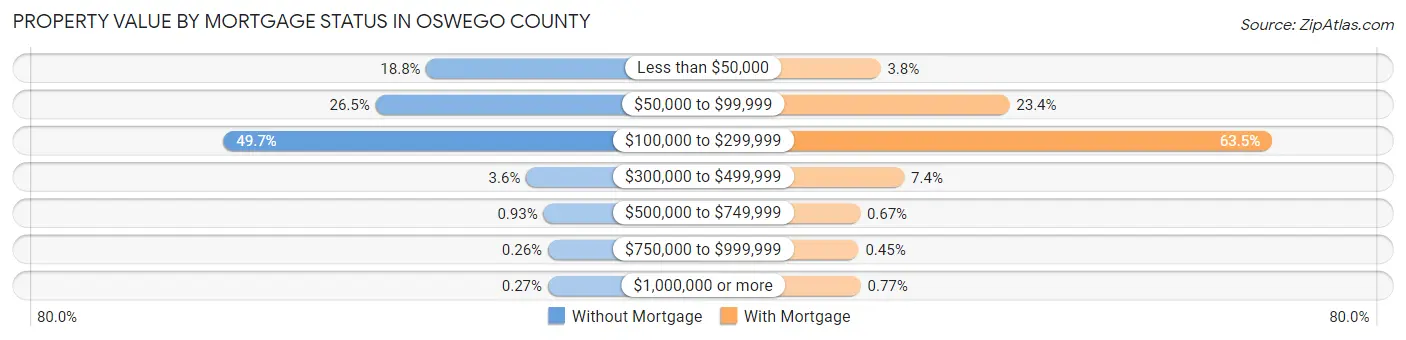
| Property Value | Without Mortgage | With Mortgage |
| Less than $50,000 | 2,833 (18.8%) | 745 (3.8%) |
| $50,000 to $99,999 | 4,002 (26.5%) | 4,594 (23.4%) |
| $100,000 to $299,999 | 7,502 (49.7%) | 12,435 (63.4%) |
| $300,000 to $499,999 | 538 (3.6%) | 1,452 (7.4%) |
| $500,000 to $749,999 | 141 (0.9%) | 132 (0.7%) |
| $750,000 to $999,999 | 39 (0.3%) | 89 (0.4%) |
| $1,000,000 or more | 41 (0.3%) | 151 (0.8%) |
| Total | 15,096 (100.0%) | 19,598 (100.0%) |
Household Income by Mortgage Status in Oswego County
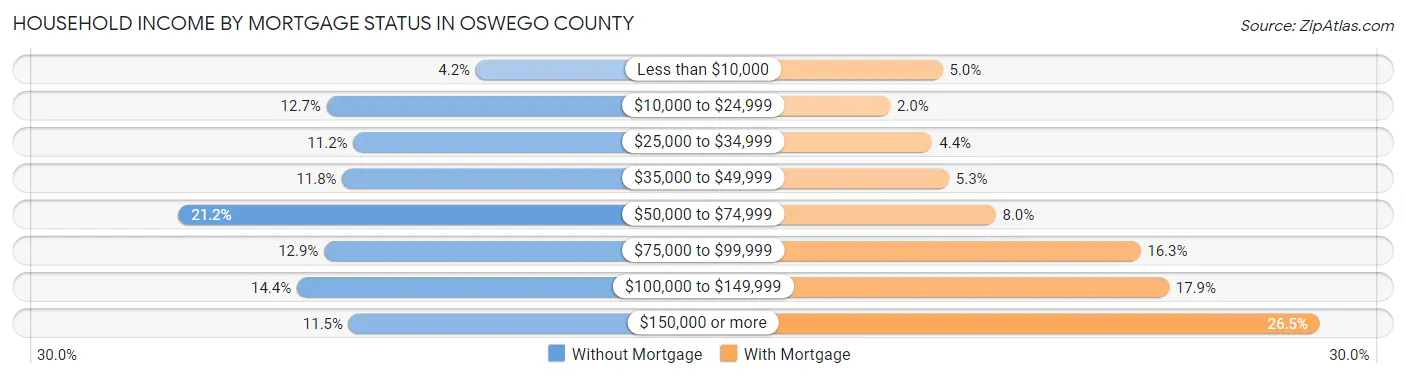
| Household Income | Without Mortgage | With Mortgage |
| Less than $10,000 | 636 (4.2%) | 974 (5.0%) |
| $10,000 to $24,999 | 1,923 (12.7%) | 386 (2.0%) |
| $25,000 to $34,999 | 1,693 (11.2%) | 861 (4.4%) |
| $35,000 to $49,999 | 1,787 (11.8%) | 1,044 (5.3%) |
| $50,000 to $74,999 | 3,202 (21.2%) | 1,567 (8.0%) |
| $75,000 to $99,999 | 1,945 (12.9%) | 3,188 (16.3%) |
| $100,000 to $149,999 | 2,179 (14.4%) | 3,509 (17.9%) |
| $150,000 or more | 1,731 (11.5%) | 5,200 (26.5%) |
| Total | 15,096 (100.0%) | 19,598 (100.0%) |
Property Value to Household Income Ratio in Oswego County
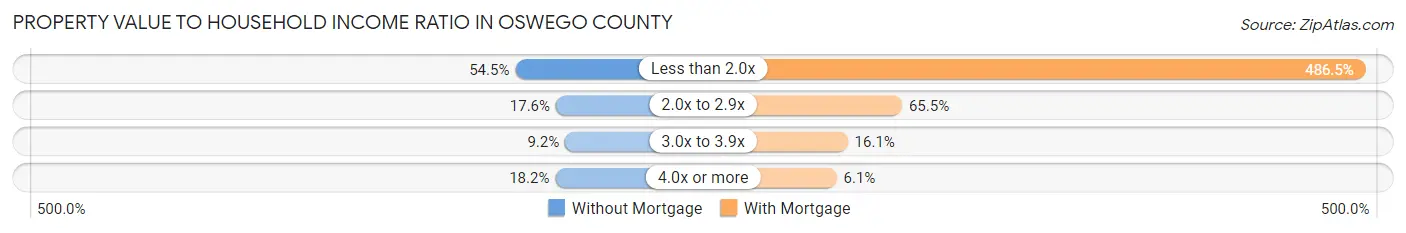
| Value-to-Income Ratio | Without Mortgage | With Mortgage |
| Less than 2.0x | 8,220 (54.4%) | 95,341 (486.5%) |
| 2.0x to 2.9x | 2,651 (17.6%) | 12,827 (65.4%) |
| 3.0x to 3.9x | 1,392 (9.2%) | 3,154 (16.1%) |
| 4.0x or more | 2,740 (18.1%) | 1,191 (6.1%) |
| Total | 15,096 (100.0%) | 19,598 (100.0%) |
Real Estate Taxes by Mortgage Status in Oswego County
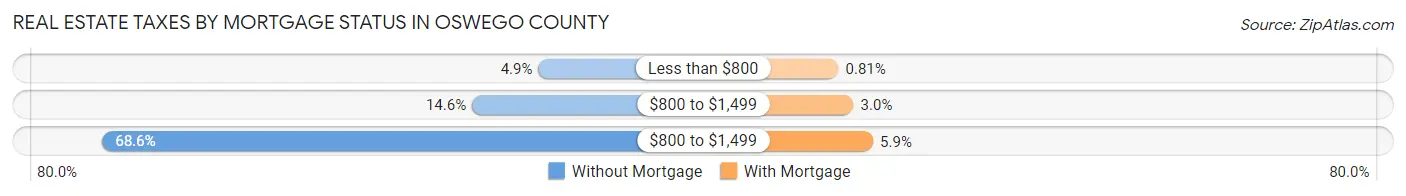
| Property Taxes | Without Mortgage | With Mortgage |
| Less than $800 | 745 (4.9%) | 158 (0.8%) |
| $800 to $1,499 | 2,208 (14.6%) | 589 (3.0%) |
| $800 to $1,499 | 10,362 (68.6%) | 1,148 (5.9%) |
| Total | 15,096 (100.0%) | 19,598 (100.0%) |
Health & Disability in Oswego County
Health Insurance Coverage by Age in Oswego County
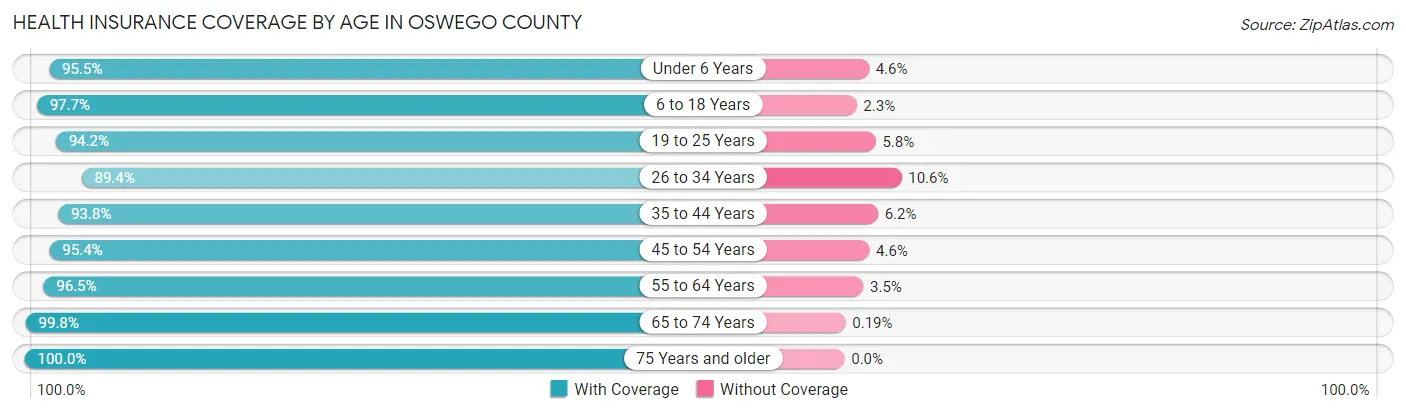
| Age Bracket | With Coverage | Without Coverage |
| Under 6 Years | 7,178 (95.5%) | 342 (4.5%) |
| 6 to 18 Years | 19,318 (97.7%) | 446 (2.3%) |
| 19 to 25 Years | 11,066 (94.2%) | 683 (5.8%) |
| 26 to 34 Years | 11,286 (89.4%) | 1,342 (10.6%) |
| 35 to 44 Years | 12,264 (93.8%) | 815 (6.2%) |
| 45 to 54 Years | 14,208 (95.4%) | 689 (4.6%) |
| 55 to 64 Years | 17,293 (96.5%) | 629 (3.5%) |
| 65 to 74 Years | 12,177 (99.8%) | 23 (0.2%) |
| 75 Years and older | 7,549 (100.0%) | 0 (0.0%) |
| Total | 112,339 (95.8%) | 4,969 (4.2%) |
Health Insurance Coverage by Citizenship Status in Oswego County
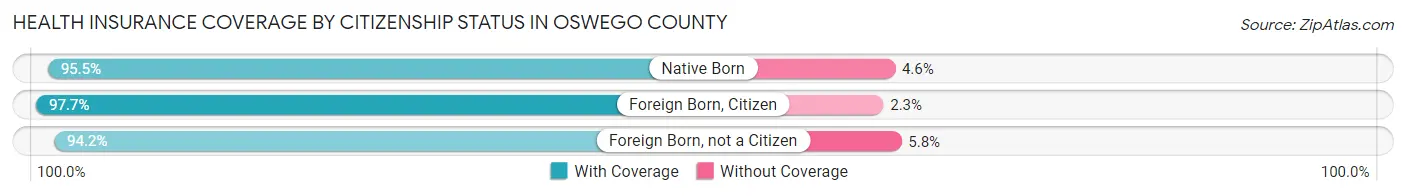
| Citizenship Status | With Coverage | Without Coverage |
| Native Born | 7,178 (95.5%) | 342 (4.5%) |
| Foreign Born, Citizen | 19,318 (97.7%) | 446 (2.3%) |
| Foreign Born, not a Citizen | 11,066 (94.2%) | 683 (5.8%) |
Health Insurance Coverage by Household Income in Oswego County
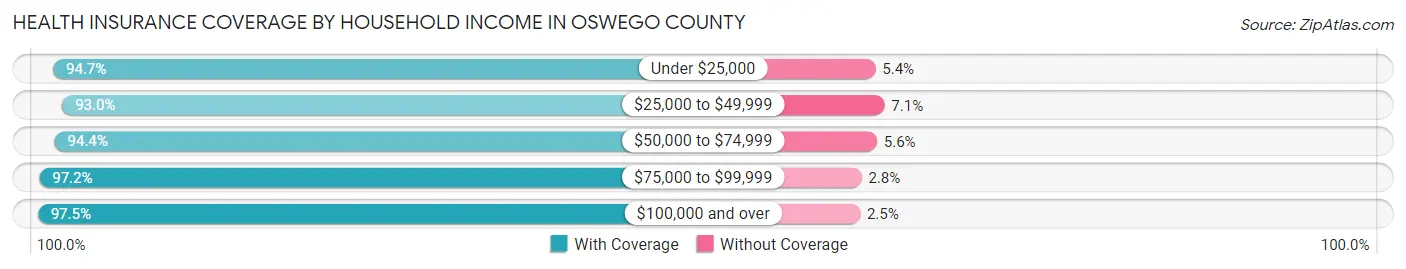
| Household Income | With Coverage | Without Coverage |
| Under $25,000 | 14,676 (94.7%) | 829 (5.3%) |
| $25,000 to $49,999 | 18,072 (92.9%) | 1,370 (7.0%) |
| $50,000 to $74,999 | 18,694 (94.4%) | 1,116 (5.6%) |
| $75,000 to $99,999 | 16,264 (97.2%) | 461 (2.8%) |
| $100,000 and over | 40,699 (97.5%) | 1,032 (2.5%) |
Public vs Private Health Insurance Coverage by Age in Oswego County
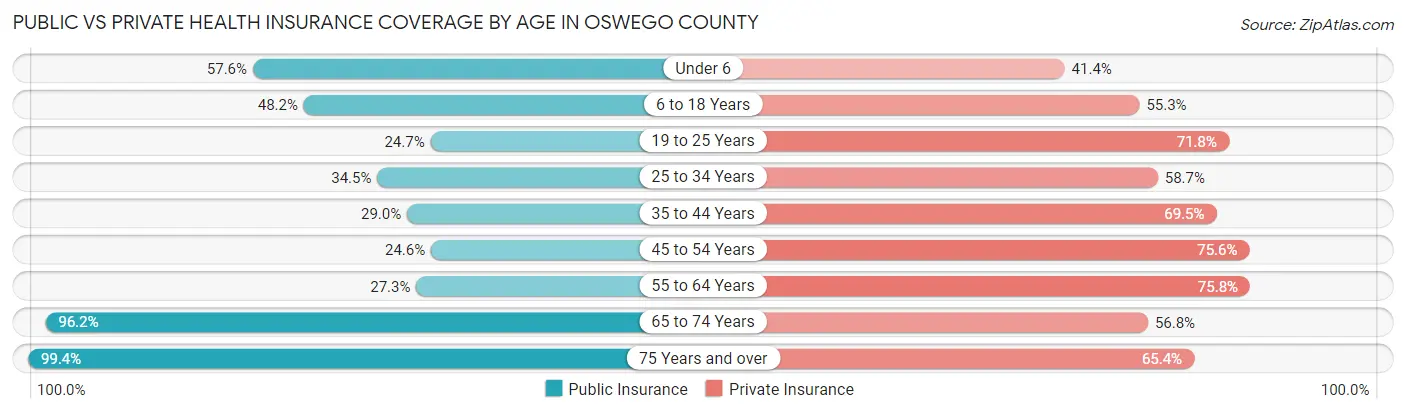
| Age Bracket | Public Insurance | Private Insurance |
| Under 6 | 4,334 (57.6%) | 3,111 (41.4%) |
| 6 to 18 Years | 9,520 (48.2%) | 10,920 (55.2%) |
| 19 to 25 Years | 2,897 (24.7%) | 8,439 (71.8%) |
| 25 to 34 Years | 4,361 (34.5%) | 7,407 (58.7%) |
| 35 to 44 Years | 3,796 (29.0%) | 9,093 (69.5%) |
| 45 to 54 Years | 3,659 (24.6%) | 11,267 (75.6%) |
| 55 to 64 Years | 4,893 (27.3%) | 13,576 (75.7%) |
| 65 to 74 Years | 11,732 (96.2%) | 6,933 (56.8%) |
| 75 Years and over | 7,503 (99.4%) | 4,934 (65.4%) |
| Total | 52,695 (44.9%) | 75,680 (64.5%) |
Disability Status by Sex by Age in Oswego County
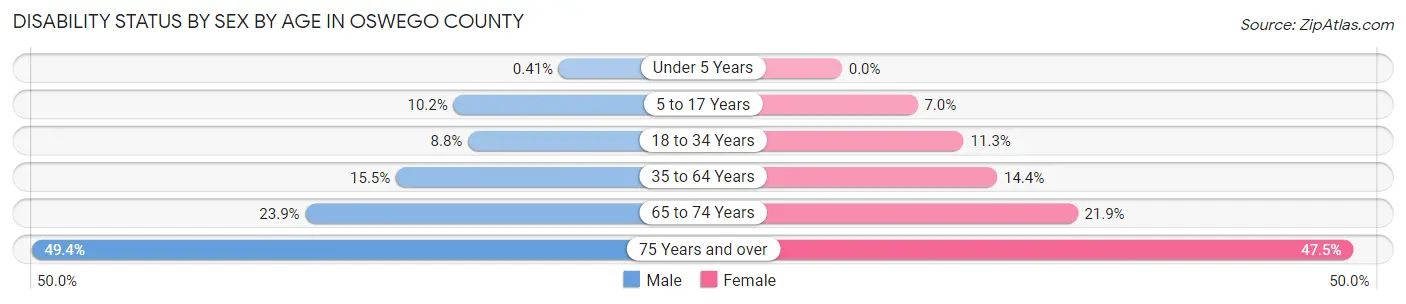
| Age Bracket | Male | Female |
| Under 5 Years | 13 (0.4%) | 0 (0.0%) |
| 5 to 17 Years | 961 (10.2%) | 611 (7.0%) |
| 18 to 34 Years | 1,225 (8.8%) | 1,509 (11.3%) |
| 35 to 64 Years | 3,593 (15.5%) | 3,277 (14.4%) |
| 65 to 74 Years | 1,458 (23.9%) | 1,336 (21.9%) |
| 75 Years and over | 1,639 (49.3%) | 2,007 (47.5%) |
Disability Class by Sex by Age in Oswego County
Disability Class: Hearing Difficulty
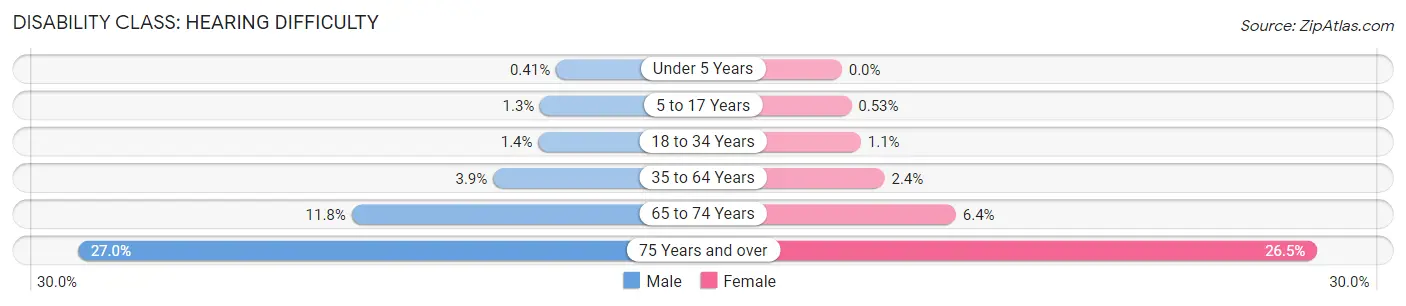
| Age Bracket | Male | Female |
| Under 5 Years | 13 (0.4%) | 0 (0.0%) |
| 5 to 17 Years | 122 (1.3%) | 46 (0.5%) |
| 18 to 34 Years | 193 (1.4%) | 142 (1.1%) |
| 35 to 64 Years | 906 (3.9%) | 542 (2.4%) |
| 65 to 74 Years | 718 (11.8%) | 388 (6.4%) |
| 75 Years and over | 898 (27.0%) | 1,119 (26.5%) |
Disability Class: Vision Difficulty
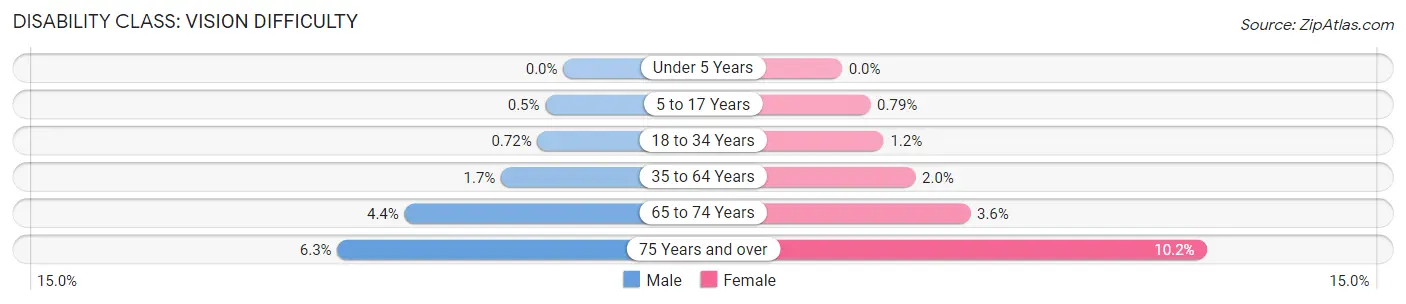
| Age Bracket | Male | Female |
| Under 5 Years | 0 (0.0%) | 0 (0.0%) |
| 5 to 17 Years | 47 (0.5%) | 69 (0.8%) |
| 18 to 34 Years | 100 (0.7%) | 155 (1.2%) |
| 35 to 64 Years | 400 (1.7%) | 465 (2.0%) |
| 65 to 74 Years | 269 (4.4%) | 218 (3.6%) |
| 75 Years and over | 209 (6.3%) | 429 (10.2%) |
Disability Class: Cognitive Difficulty
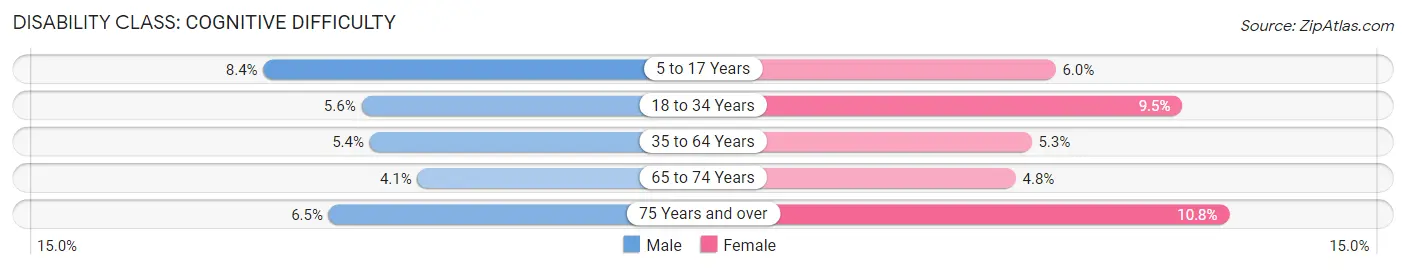
| Age Bracket | Male | Female |
| 5 to 17 Years | 788 (8.4%) | 518 (5.9%) |
| 18 to 34 Years | 779 (5.6%) | 1,265 (9.5%) |
| 35 to 64 Years | 1,249 (5.4%) | 1,201 (5.3%) |
| 65 to 74 Years | 247 (4.1%) | 296 (4.8%) |
| 75 Years and over | 217 (6.5%) | 456 (10.8%) |
Disability Class: Ambulatory Difficulty
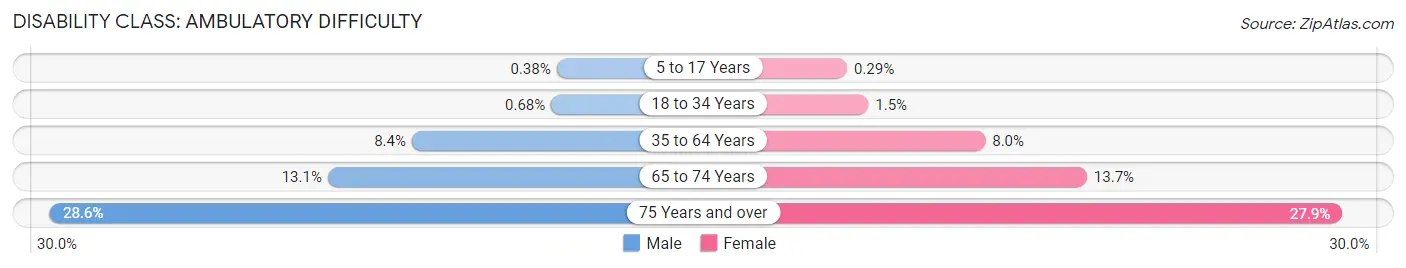
| Age Bracket | Male | Female |
| 5 to 17 Years | 36 (0.4%) | 25 (0.3%) |
| 18 to 34 Years | 95 (0.7%) | 198 (1.5%) |
| 35 to 64 Years | 1,955 (8.4%) | 1,818 (8.0%) |
| 65 to 74 Years | 799 (13.1%) | 834 (13.7%) |
| 75 Years and over | 949 (28.6%) | 1,178 (27.9%) |
Disability Class: Self-Care Difficulty
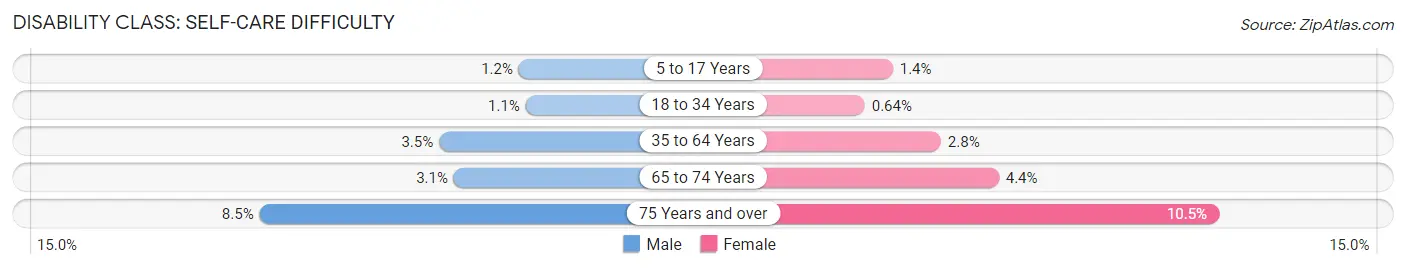
| Age Bracket | Male | Female |
| 5 to 17 Years | 117 (1.2%) | 124 (1.4%) |
| 18 to 34 Years | 145 (1.1%) | 86 (0.6%) |
| 35 to 64 Years | 802 (3.5%) | 628 (2.8%) |
| 65 to 74 Years | 186 (3.0%) | 267 (4.4%) |
| 75 Years and over | 281 (8.5%) | 444 (10.5%) |
Technology Access in Oswego County
Computing Device Access in Oswego County
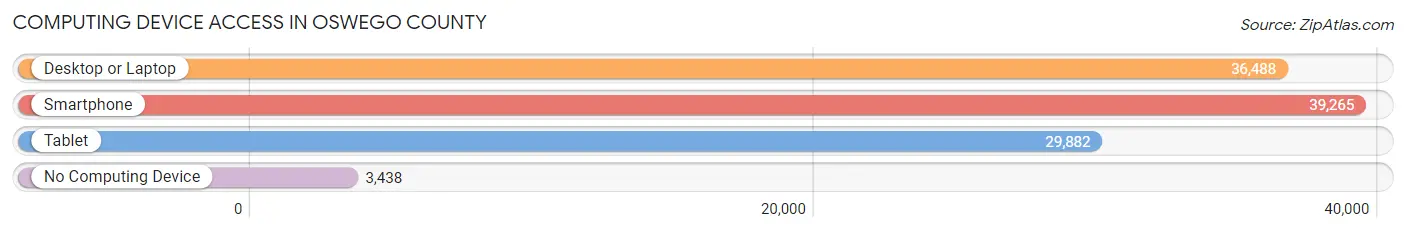
| Device Type | # Households | % Households |
| Desktop or Laptop | 36,488 | 77.3% |
| Smartphone | 39,265 | 83.2% |
| Tablet | 29,882 | 63.3% |
| No Computing Device | 3,438 | 7.3% |
| Total | 47,203 | 100.0% |
Internet Access in Oswego County
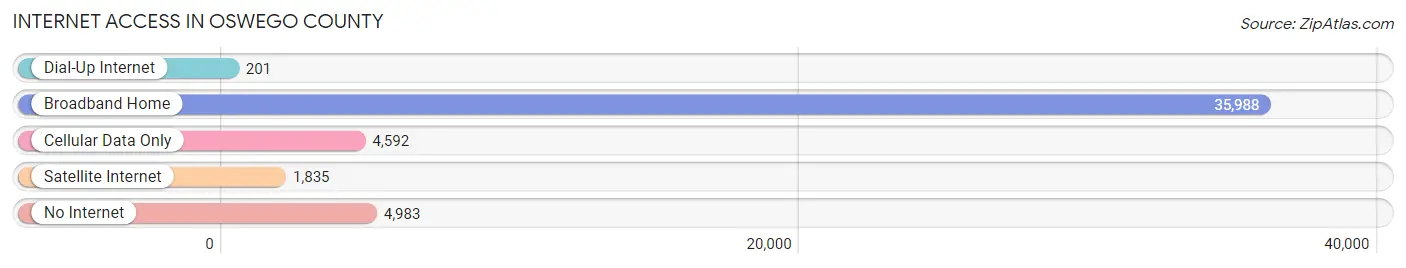
| Internet Type | # Households | % Households |
| Dial-Up Internet | 201 | 0.4% |
| Broadband Home | 35,988 | 76.2% |
| Cellular Data Only | 4,592 | 9.7% |
| Satellite Internet | 1,835 | 3.9% |
| No Internet | 4,983 | 10.6% |
| Total | 47,203 | 100.0% |
Oswego County Summary
Oswego County is located in the north-central part of New York State, along the eastern shore of Lake Ontario. It is bordered by Jefferson County to the east, Cayuga County to the south, and Onondaga County to the west. The county seat is the city of Oswego, which is located on the eastern shore of Lake Ontario. The county has a total area of 1,312 square miles, of which 1,099 square miles is land and 213 square miles is water.
History
The area that is now Oswego County was originally inhabited by the Iroquois and other Native American tribes. The first Europeans to settle in the area were French fur traders in the late 1600s. The area was part of the Central New York Military Tract, which was set aside by the state of New York in 1790 for veterans of the Revolutionary War. The county was officially established in 1816 and was named after the Oswego River, which flows through the county.
In the early 19th century, the county was a major center for shipbuilding and commerce. The Oswego Canal, which connected the Oswego River to Lake Ontario, was completed in 1828 and was a major factor in the county’s economic growth. The canal was used to transport goods and passengers between the Great Lakes and the Atlantic Ocean.
The county was also an important center for the iron and steel industry. The first iron furnace in the county was built in 1837 and the first steel mill was built in 1867. The steel industry was a major employer in the county until the mid-20th century.
Geography
Oswego County is located in the north-central part of New York State, along the eastern shore of Lake Ontario. It is bordered by Jefferson County to the east, Cayuga County to the south, and Onondaga County to the west. The county has a total area of 1,312 square miles, of which 1,099 square miles is land and 213 square miles is water.
The county is mostly flat, with some rolling hills in the northern and western parts. The highest point in the county is the summit of Little Bald Hill, which has an elevation of 1,845 feet. The county is drained by the Oswego River and its tributaries, including the Salmon River and the Oneida River.
Economy
Oswego County’s economy is largely based on manufacturing, agriculture, and tourism. The county is home to several large manufacturing companies, including Novelis, a global aluminum producer, and Novelis, a global aluminum producer. The county is also home to several agricultural operations, including dairy farms, vegetable farms, and fruit orchards.
Tourism is also an important part of the county’s economy. The county is home to several popular tourist attractions, including the Fort Ontario State Historic Site, the Oswego Harbor Lighthouse, and the Salmon River Falls.
Demographics
As of the 2010 census, the population of Oswego County was 122,109. The population has decreased by 4.3% since 2000. The population is spread out with a median age of 40.3 years. The racial makeup of the county is 94.3% White, 2.2% African American, 0.7% Native American, 0.7% Asian, 0.1% Pacific Islander, and 1.9% from two or more races.
The largest ancestry groups in the county are German (25.2%), Irish (17.2%), English (14.2%), Italian (10.2%), and French (7.2%). The median household income in the county is $48,845 and the median family income is $58,945. The per capita income in the county is $24,845.
Common Questions
What is Per Capita Income in Oswego County?
Per Capita income in Oswego County is $33,904.
What is the Median Family Income in Oswego County?
Median Family Income in Oswego County is $80,866.
What is the Median Household income in Oswego County?
Median Household Income in Oswego County is $65,054.
What is Income or Wage Gap in Oswego County?
Income or Wage Gap in Oswego County is 24.7%.
Women in Oswego County earn 75.3 cents for every dollar earned by a man.
What is Family Income Deficit in Oswego County?
Family Income Deficit in Oswego County is $12,412.
Families that are below poverty line in Oswego County earn $12,412 less on average than the poverty threshold level.
What is Inequality or Gini Index in Oswego County?
Inequality or Gini Index in Oswego County is 0.45.
What is the Total Population of Oswego County?
Total Population of Oswego County is 118,037.
What is the Total Male Population of Oswego County?
Total Male Population of Oswego County is 59,486.
What is the Total Female Population of Oswego County?
Total Female Population of Oswego County is 58,551.
What is the Ratio of Males per 100 Females in Oswego County?
There are 101.60 Males per 100 Females in Oswego County.
What is the Ratio of Females per 100 Males in Oswego County?
There are 98.43 Females per 100 Males in Oswego County.
What is the Median Population Age in Oswego County?
Median Population Age in Oswego County is 40.3 Years.
What is the Average Family Size in Oswego County
Average Family Size in Oswego County is 2.9 People.
What is the Average Household Size in Oswego County
Average Household Size in Oswego County is 2.4 People.
How Large is the Labor Force in Oswego County?
There are 58,971 People in the Labor Forcein in Oswego County.
What is the Percentage of People in the Labor Force in Oswego County?
61.1% of People are in the Labor Force in Oswego County.
What is the Unemployment Rate in Oswego County?
Unemployment Rate in Oswego County is 7.3%.