Ontario County, NY Map & Demographics
Ontario County Map
Ontario County Overview
$43,046
PER CAPITA INCOME
$97,331
AVG FAMILY INCOME
$76,603
AVG HOUSEHOLD INCOME
27.1%
WAGE / INCOME GAP [ % ]
72.9¢/ $1
WAGE / INCOME GAP [ $ ]
$10,810
FAMILY INCOME DEFICIT
0.44
INEQUALITY / GINI INDEX
112,288
TOTAL POPULATION
55,283
MALE POPULATION
57,005
FEMALE POPULATION
96.98
MALES / 100 FEMALES
103.11
FEMALES / 100 MALES
43.8
MEDIAN AGE
2.8
AVG FAMILY SIZE
2.3
AVG HOUSEHOLD SIZE
57,631
LABOR FORCE [ PEOPLE ]
61.9%
PERCENT IN LABOR FORCE
4.0%
UNEMPLOYMENT RATE
Income in Ontario County
Income Overview in Ontario County
Per Capita Income in Ontario County is $43,046, while median incomes of families and households are $97,331 and $76,603 respectively.
| Characteristic | Number | Measure |
| Per Capita Income | 112,288 | $43,046 |
| Median Family Income | 29,520 | $97,331 |
| Mean Family Income | 29,520 | $124,108 |
| Median Household Income | 47,080 | $76,603 |
| Mean Household Income | 47,080 | $101,686 |
| Income Deficit | 29,520 | $10,810 |
| Wage / Income Gap (%) | 112,288 | 27.06% |
| Wage / Income Gap ($) | 112,288 | 72.94¢ per $1 |
| Gini / Inequality Index | 112,288 | 0.44 |
Earnings by Sex in Ontario County
Average Earnings in Ontario County are $43,190, $49,244 for men and $35,921 for women, a difference of 27.1%.
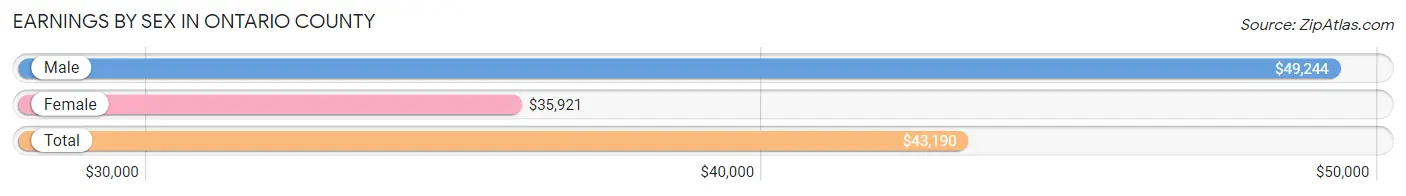
| Sex | Number | Average Earnings |
| Male | 32,161 (52.1%) | $49,244 |
| Female | 29,506 (47.8%) | $35,921 |
| Total | 61,667 (100.0%) | $43,190 |
Earnings by Sex by Income Bracket in Ontario County
The most common earnings brackets in Ontario County are $100,000+ for men (6,024 | 18.7%) and $75,000 to $99,999 for women (2,970 | 10.1%).
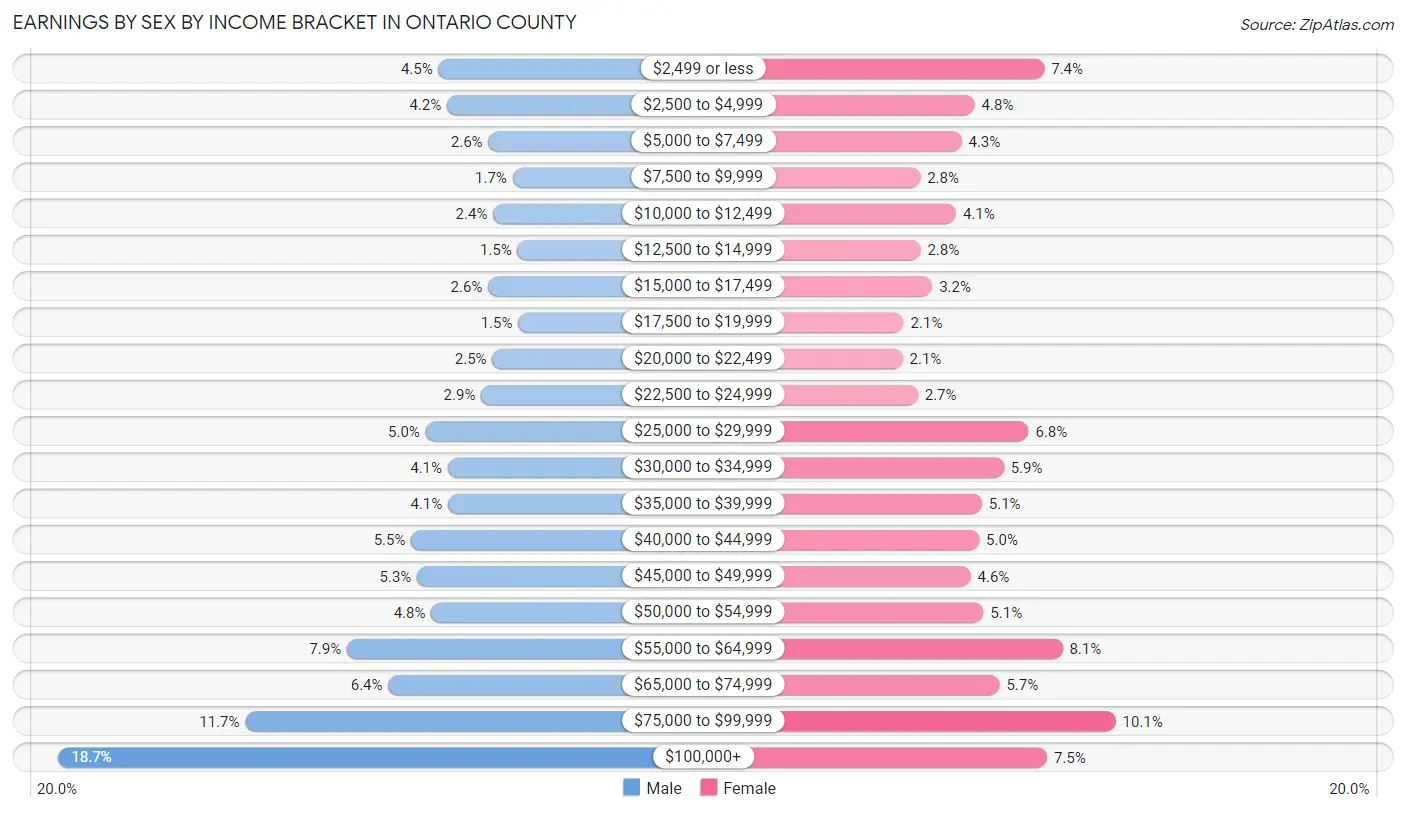
| Income | Male | Female |
| $2,499 or less | 1,444 (4.5%) | 2,183 (7.4%) |
| $2,500 to $4,999 | 1,340 (4.2%) | 1,413 (4.8%) |
| $5,000 to $7,499 | 844 (2.6%) | 1,268 (4.3%) |
| $7,500 to $9,999 | 551 (1.7%) | 811 (2.8%) |
| $10,000 to $12,499 | 784 (2.4%) | 1,207 (4.1%) |
| $12,500 to $14,999 | 493 (1.5%) | 814 (2.8%) |
| $15,000 to $17,499 | 846 (2.6%) | 944 (3.2%) |
| $17,500 to $19,999 | 481 (1.5%) | 629 (2.1%) |
| $20,000 to $22,499 | 793 (2.5%) | 618 (2.1%) |
| $22,500 to $24,999 | 928 (2.9%) | 785 (2.7%) |
| $25,000 to $29,999 | 1,600 (5.0%) | 2,008 (6.8%) |
| $30,000 to $34,999 | 1,330 (4.1%) | 1,735 (5.9%) |
| $35,000 to $39,999 | 1,328 (4.1%) | 1,492 (5.1%) |
| $40,000 to $44,999 | 1,772 (5.5%) | 1,464 (5.0%) |
| $45,000 to $49,999 | 1,702 (5.3%) | 1,369 (4.6%) |
| $50,000 to $54,999 | 1,532 (4.8%) | 1,512 (5.1%) |
| $55,000 to $64,999 | 2,547 (7.9%) | 2,383 (8.1%) |
| $65,000 to $74,999 | 2,050 (6.4%) | 1,687 (5.7%) |
| $75,000 to $99,999 | 3,772 (11.7%) | 2,970 (10.1%) |
| $100,000+ | 6,024 (18.7%) | 2,214 (7.5%) |
| Total | 32,161 (100.0%) | 29,506 (100.0%) |
Earnings by Sex by Educational Attainment in Ontario County
Average earnings in Ontario County are $57,426 for men and $42,994 for women, a difference of 25.1%. Men with an educational attainment of graduate degree enjoy the highest average annual earnings of $90,152, while those with less than high school education earn the least with $29,513. Women with an educational attainment of graduate degree earn the most with the average annual earnings of $67,020, while those with less than high school education have the smallest earnings of $25,417.
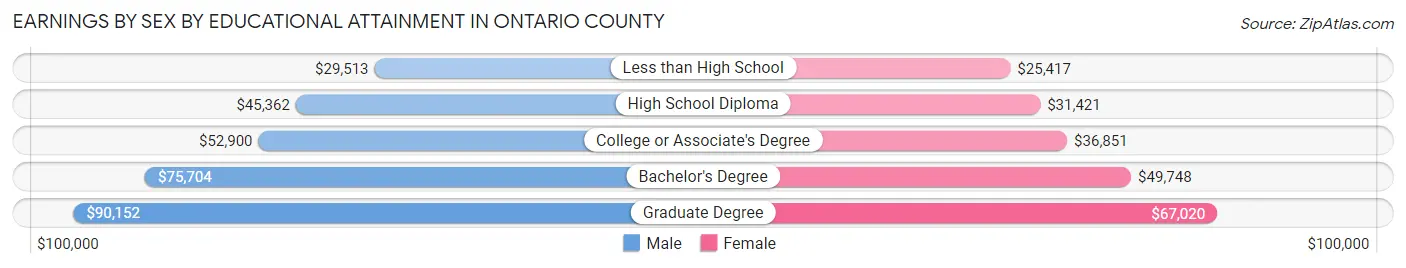
| Educational Attainment | Male Income | Female Income |
| Less than High School | $29,513 | $25,417 |
| High School Diploma | $45,362 | $31,421 |
| College or Associate's Degree | $52,900 | $36,851 |
| Bachelor's Degree | $75,704 | $49,748 |
| Graduate Degree | $90,152 | $67,020 |
| Total | $57,426 | $42,994 |
Family Income in Ontario County
Family Income Brackets in Ontario County
According to the Ontario County family income data, there are 6,583 families falling into the $100,000 to $149,999 income range, which is the most common income bracket and makes up 22.3% of all families. Conversely, the $10,000 to $14,999 income bracket is the least frequent group with only 354 families (1.2%) belonging to this category.
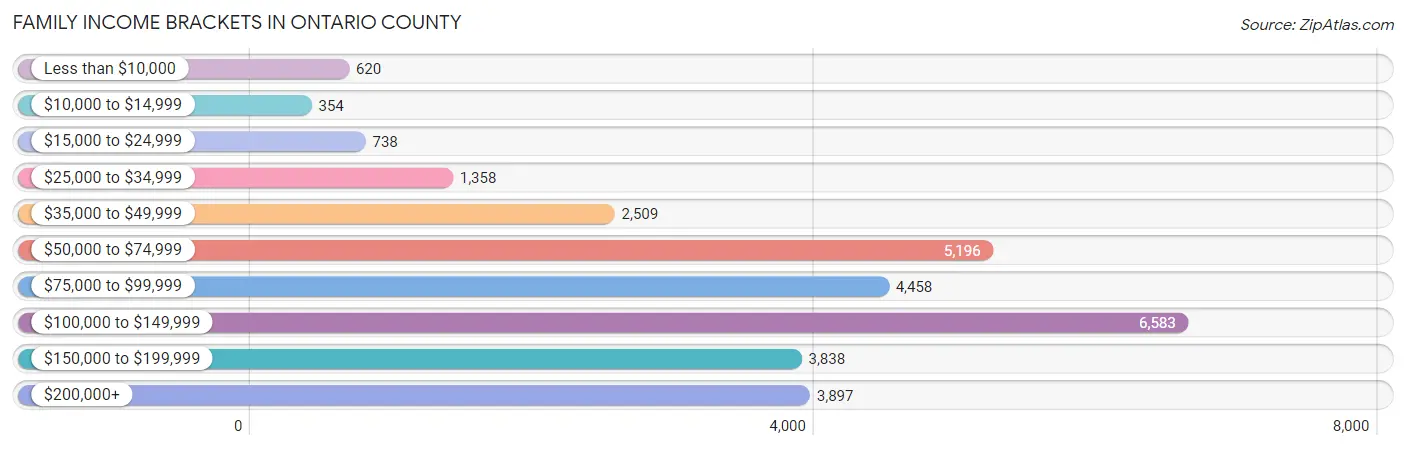
| Income Bracket | # Families | % Families |
| Less than $10,000 | 620 | 2.1% |
| $10,000 to $14,999 | 354 | 1.2% |
| $15,000 to $24,999 | 738 | 2.5% |
| $25,000 to $34,999 | 1,358 | 4.6% |
| $35,000 to $49,999 | 2,509 | 8.5% |
| $50,000 to $74,999 | 5,196 | 17.6% |
| $75,000 to $99,999 | 4,458 | 15.1% |
| $100,000 to $149,999 | 6,583 | 22.3% |
| $150,000 to $199,999 | 3,838 | 13.0% |
| $200,000+ | 3,897 | 13.2% |
Family Income by Famaliy Size in Ontario County
4-person families (5,060 | 17.1%) account for the highest median family income in Ontario County with $130,507 per family, while 2-person families (15,761 | 53.4%) have the highest median income of $42,330 per family member.
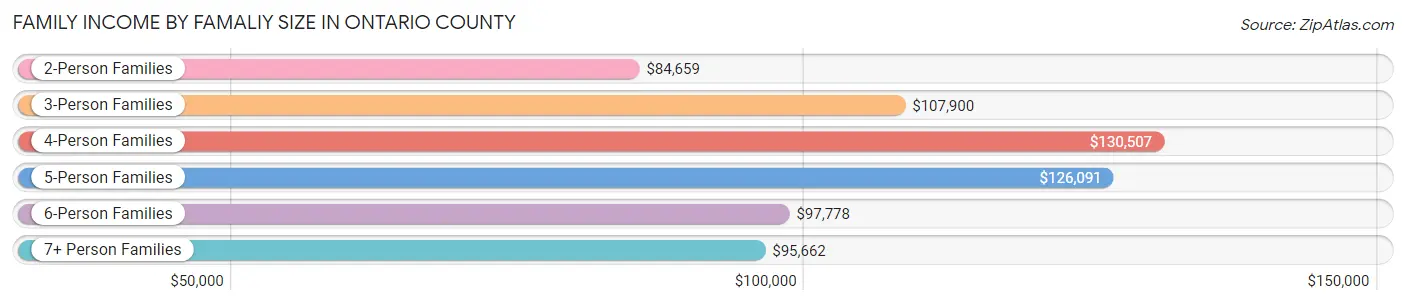
| Income Bracket | # Families | Median Income |
| 2-Person Families | 15,761 (53.4%) | $84,659 |
| 3-Person Families | 6,132 (20.8%) | $107,900 |
| 4-Person Families | 5,060 (17.1%) | $130,507 |
| 5-Person Families | 1,800 (6.1%) | $126,091 |
| 6-Person Families | 464 (1.6%) | $97,778 |
| 7+ Person Families | 303 (1.0%) | $95,662 |
| Total | 29,520 (100.0%) | $97,331 |
Family Income by Number of Earners in Ontario County
The median family income in Ontario County is $97,331, with families comprising 3+ earners (3,078) having the highest median family income of $149,583, while families with no earners (5,237) have the lowest median family income of $58,997, accounting for 10.4% and 17.7% of families, respectively.
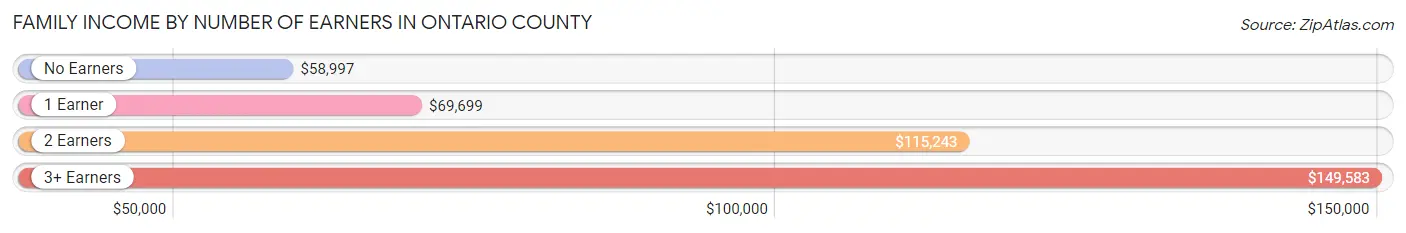
| Number of Earners | # Families | Median Income |
| No Earners | 5,237 (17.7%) | $58,997 |
| 1 Earner | 8,462 (28.7%) | $69,699 |
| 2 Earners | 12,743 (43.2%) | $115,243 |
| 3+ Earners | 3,078 (10.4%) | $149,583 |
| Total | 29,520 (100.0%) | $97,331 |
Household Income in Ontario County
Household Income Brackets in Ontario County
With 8,851 households falling in the category, the $100,000 to $149,999 income range is the most frequent in Ontario County, accounting for 18.8% of all households. In contrast, only 1,365 households (2.9%) fall into the $10,000 to $14,999 income bracket, making it the least populous group.
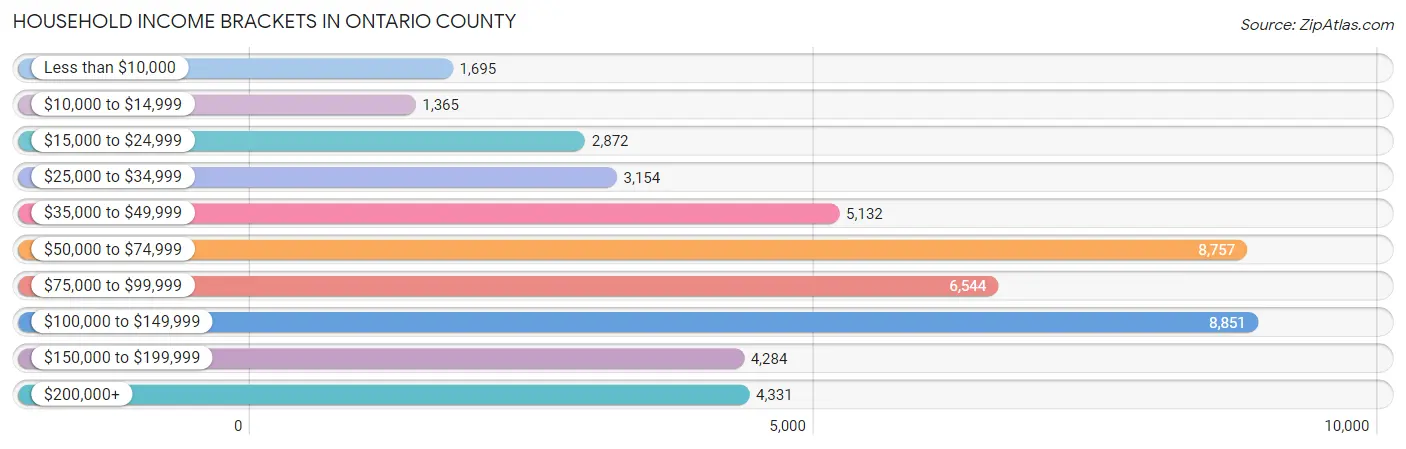
| Income Bracket | # Households | % Households |
| Less than $10,000 | 1,695 | 3.6% |
| $10,000 to $14,999 | 1,365 | 2.9% |
| $15,000 to $24,999 | 2,872 | 6.1% |
| $25,000 to $34,999 | 3,154 | 6.7% |
| $35,000 to $49,999 | 5,132 | 10.9% |
| $50,000 to $74,999 | 8,757 | 18.6% |
| $75,000 to $99,999 | 6,544 | 13.9% |
| $100,000 to $149,999 | 8,851 | 18.8% |
| $150,000 to $199,999 | 4,284 | 9.1% |
| $200,000+ | 4,331 | 9.2% |
Household Income by Householder Age in Ontario County
The median household income in Ontario County is $76,603, with the highest median household income of $96,513 found in the 45 to 64 years age bracket for the primary householder. A total of 18,015 households (38.3%) fall into this category. Meanwhile, the 15 to 24 years age bracket for the primary householder has the lowest median household income of $46,653, with 1,652 households (3.5%) in this group.
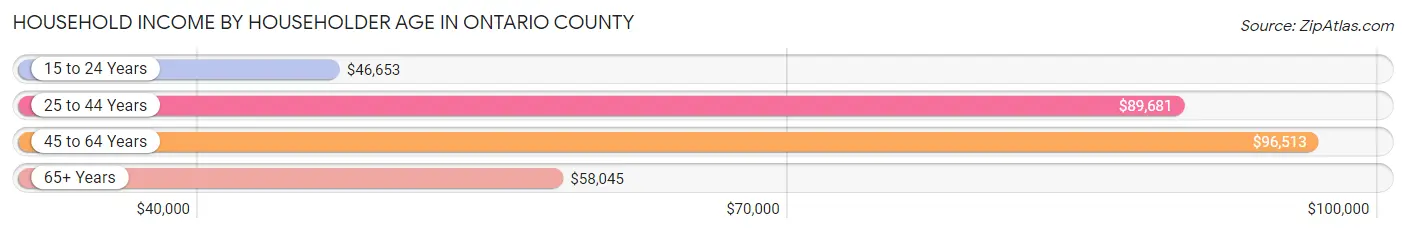
| Income Bracket | # Households | Median Income |
| 15 to 24 Years | 1,652 (3.5%) | $46,653 |
| 25 to 44 Years | 12,360 (26.3%) | $89,681 |
| 45 to 64 Years | 18,015 (38.3%) | $96,513 |
| 65+ Years | 15,053 (32.0%) | $58,045 |
| Total | 47,080 (100.0%) | $76,603 |
Poverty in Ontario County
Income Below Poverty by Sex and Age in Ontario County
With 8.0% poverty level for males and 10.0% for females among the residents of Ontario County, 5 year old males and 18 to 24 year old females are the most vulnerable to poverty, with 79 males (15.0%) and 833 females (20.9%) in their respective age groups living below the poverty level.
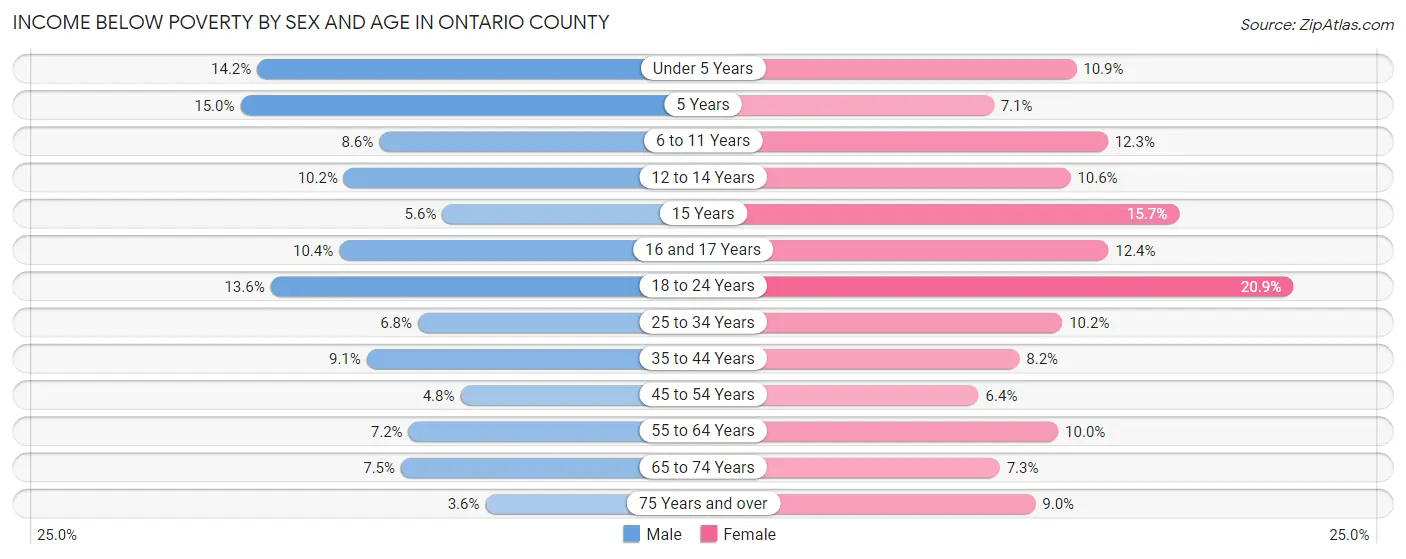
| Age Bracket | Male | Female |
| Under 5 Years | 360 (14.2%) | 292 (10.9%) |
| 5 Years | 79 (15.0%) | 51 (7.0%) |
| 6 to 11 Years | 317 (8.6%) | 435 (12.3%) |
| 12 to 14 Years | 186 (10.2%) | 186 (10.6%) |
| 15 Years | 50 (5.6%) | 82 (15.7%) |
| 16 and 17 Years | 139 (10.4%) | 169 (12.4%) |
| 18 to 24 Years | 577 (13.6%) | 833 (20.9%) |
| 25 to 34 Years | 424 (6.8%) | 615 (10.2%) |
| 35 to 44 Years | 576 (9.1%) | 521 (8.2%) |
| 45 to 54 Years | 340 (4.8%) | 456 (6.4%) |
| 55 to 64 Years | 594 (7.2%) | 862 (10.0%) |
| 65 to 74 Years | 494 (7.5%) | 527 (7.3%) |
| 75 Years and over | 142 (3.6%) | 496 (9.0%) |
| Total | 4,278 (8.0%) | 5,525 (10.0%) |
Income Above Poverty by Sex and Age in Ontario County
According to the poverty statistics in Ontario County, males aged 75 years and over and females aged 45 to 54 years are the age groups that are most secure financially, with 96.4% of males and 93.6% of females in these age groups living above the poverty line.
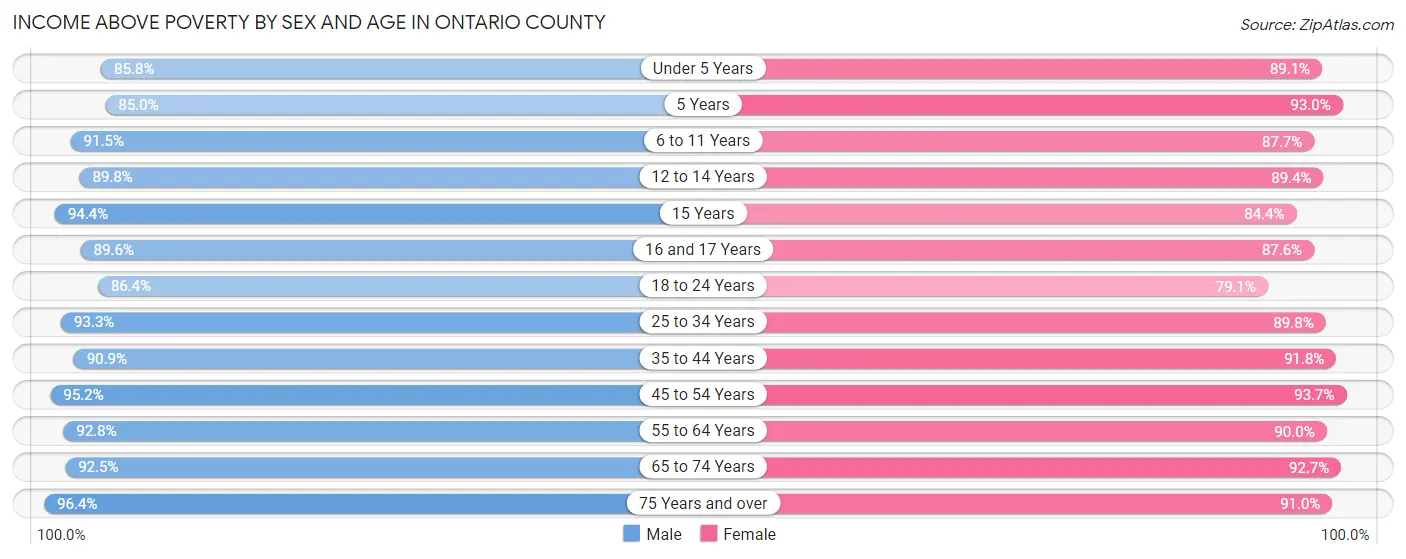
| Age Bracket | Male | Female |
| Under 5 Years | 2,173 (85.8%) | 2,391 (89.1%) |
| 5 Years | 448 (85.0%) | 672 (92.9%) |
| 6 to 11 Years | 3,390 (91.4%) | 3,090 (87.7%) |
| 12 to 14 Years | 1,640 (89.8%) | 1,567 (89.4%) |
| 15 Years | 839 (94.4%) | 442 (84.4%) |
| 16 and 17 Years | 1,196 (89.6%) | 1,197 (87.6%) |
| 18 to 24 Years | 3,668 (86.4%) | 3,145 (79.1%) |
| 25 to 34 Years | 5,858 (93.2%) | 5,395 (89.8%) |
| 35 to 44 Years | 5,734 (90.9%) | 5,800 (91.8%) |
| 45 to 54 Years | 6,780 (95.2%) | 6,730 (93.6%) |
| 55 to 64 Years | 7,665 (92.8%) | 7,726 (90.0%) |
| 65 to 74 Years | 6,058 (92.5%) | 6,659 (92.7%) |
| 75 Years and over | 3,776 (96.4%) | 5,027 (91.0%) |
| Total | 49,225 (92.0%) | 49,841 (90.0%) |
Income Below Poverty Among Married-Couple Families in Ontario County
The poverty statistics for married-couple families in Ontario County show that 2.1% or 475 of the total 22,651 families live below the poverty line. Families with 5 or more children have the highest poverty rate of 27.8%, comprising of 52 families. On the other hand, families with 1 or 2 children have the lowest poverty rate of 1.2%, which includes 80 families.
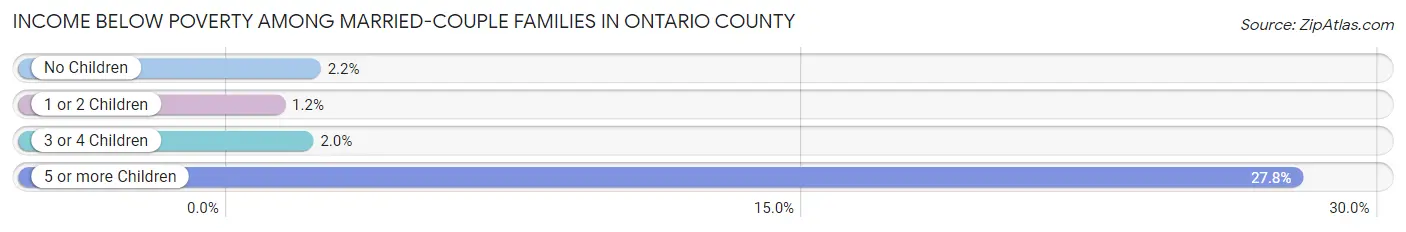
| Children | Above Poverty | Below Poverty |
| No Children | 14,151 (97.8%) | 313 (2.2%) |
| 1 or 2 Children | 6,401 (98.8%) | 80 (1.2%) |
| 3 or 4 Children | 1,489 (98.0%) | 30 (2.0%) |
| 5 or more Children | 135 (72.2%) | 52 (27.8%) |
| Total | 22,176 (97.9%) | 475 (2.1%) |
Income Below Poverty Among Single-Parent Households in Ontario County
According to the poverty data in Ontario County, 9.9% or 194 single-father households and 16.7% or 822 single-mother households are living below the poverty line. Among single-father households, those with 3 or 4 children have the highest poverty rate, with 44 households (26.4%) experiencing poverty. Likewise, among single-mother households, those with 3 or 4 children have the highest poverty rate, with 147 households (40.7%) falling below the poverty line.
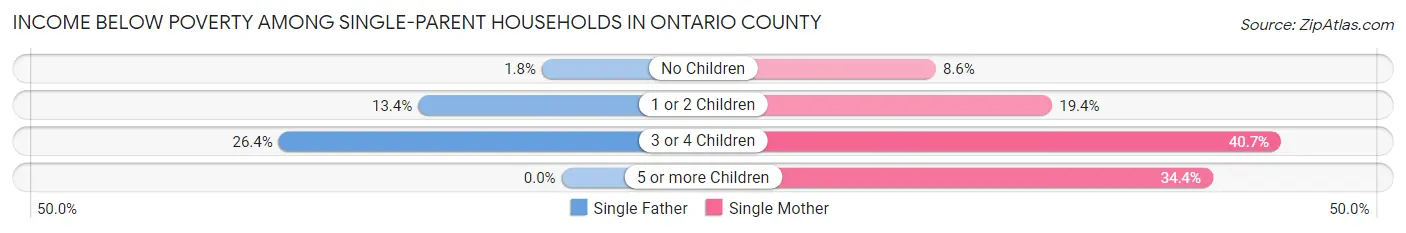
| Children | Single Father | Single Mother |
| No Children | 14 (1.8%) | 174 (8.6%) |
| 1 or 2 Children | 136 (13.4%) | 479 (19.4%) |
| 3 or 4 Children | 44 (26.4%) | 147 (40.7%) |
| 5 or more Children | 0 (0.0%) | 22 (34.4%) |
| Total | 194 (9.9%) | 822 (16.7%) |
Income Below Poverty Among Married-Couple vs Single-Parent Households in Ontario County
The poverty data for Ontario County shows that 475 of the married-couple family households (2.1%) and 1,016 of the single-parent households (14.8%) are living below the poverty level. Within the married-couple family households, those with 5 or more children have the highest poverty rate, with 52 households (27.8%) falling below the poverty line. Among the single-parent households, those with 3 or 4 children have the highest poverty rate, with 191 household (36.2%) living below poverty.
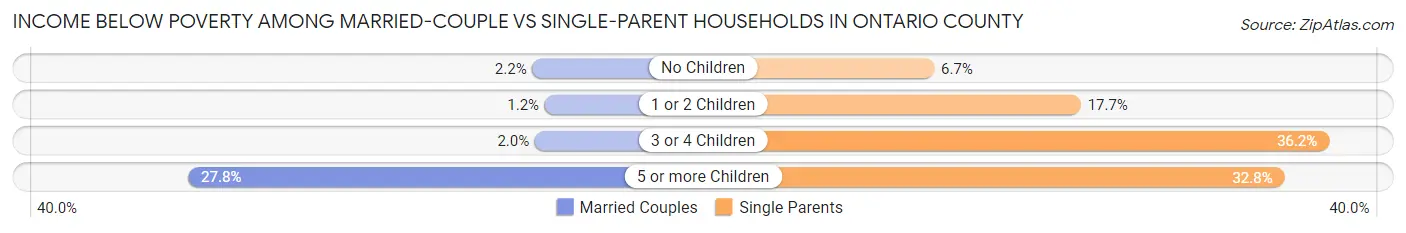
| Children | Married-Couple Families | Single-Parent Households |
| No Children | 313 (2.2%) | 188 (6.7%) |
| 1 or 2 Children | 80 (1.2%) | 615 (17.7%) |
| 3 or 4 Children | 30 (2.0%) | 191 (36.2%) |
| 5 or more Children | 52 (27.8%) | 22 (32.8%) |
| Total | 475 (2.1%) | 1,016 (14.8%) |
Race in Ontario County
The most populous races in Ontario County are White / Caucasian (101,505 | 90.4%), Hispanic or Latino (5,852 | 5.2%), and Two or more Races (4,817 | 4.3%).
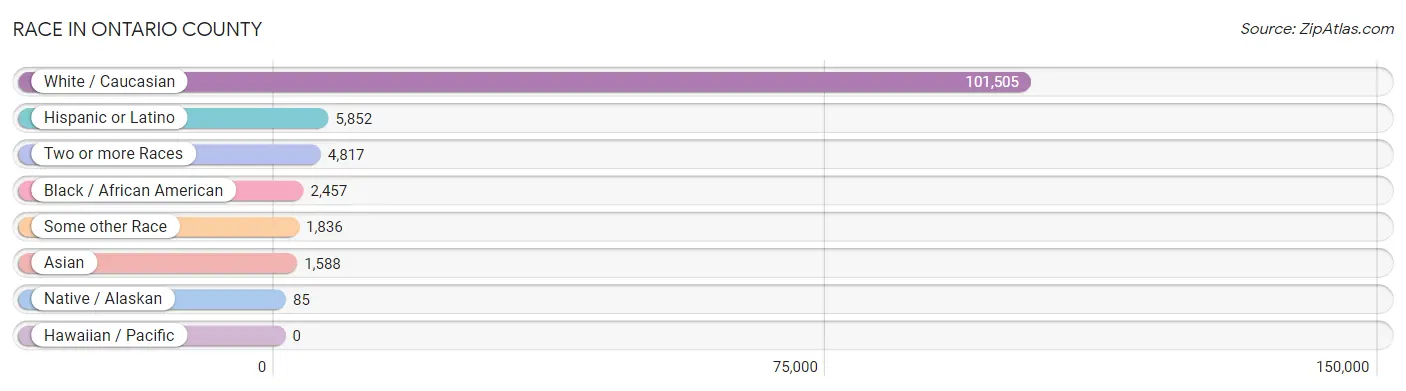
| Race | # Population | % Population |
| Asian | 1,588 | 1.4% |
| Black / African American | 2,457 | 2.2% |
| Hawaiian / Pacific | 0 | 0.0% |
| Hispanic or Latino | 5,852 | 5.2% |
| Native / Alaskan | 85 | 0.1% |
| White / Caucasian | 101,505 | 90.4% |
| Two or more Races | 4,817 | 4.3% |
| Some other Race | 1,836 | 1.6% |
| Total | 112,288 | 100.0% |
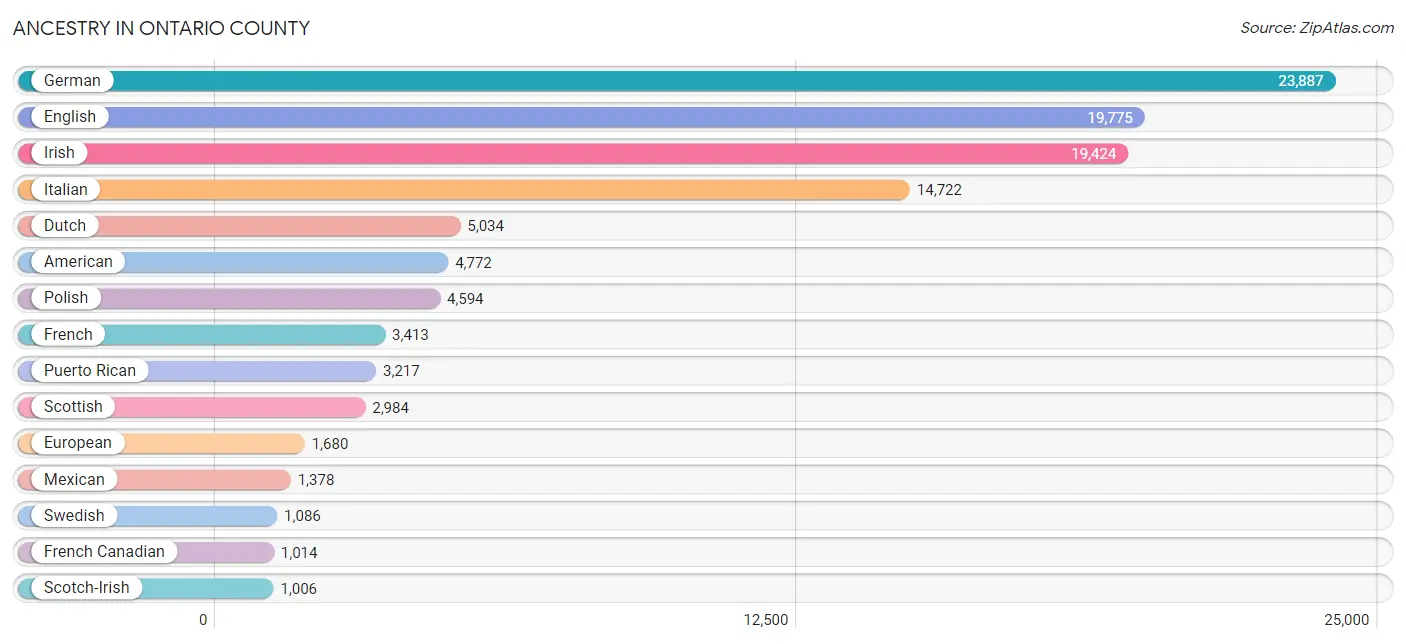
Ancestry in Ontario County
The most populous ancestries reported in Ontario County are German (23,887 | 21.3%), English (19,775 | 17.6%), Irish (19,424 | 17.3%), Italian (14,722 | 13.1%), and Dutch (5,034 | 4.5%), together accounting for 73.8% of all Ontario County residents.
| Ancestry | # Population | % Population |
| Afghan | 1 | 0.0% |
| African | 400 | 0.4% |
| Alaskan Athabascan | 7 | 0.0% |
| Albanian | 23 | 0.0% |
| American | 4,772 | 4.3% |
| Apache | 6 | 0.0% |
| Arab | 829 | 0.7% |
| Argentinean | 7 | 0.0% |
| Armenian | 33 | 0.0% |
| Australian | 72 | 0.1% |
| Austrian | 291 | 0.3% |
| Barbadian | 20 | 0.0% |
| Belgian | 122 | 0.1% |
| Bhutanese | 110 | 0.1% |
| Blackfeet | 115 | 0.1% |
| Bolivian | 10 | 0.0% |
| Brazilian | 38 | 0.0% |
| British | 886 | 0.8% |
| Bulgarian | 18 | 0.0% |
| Burmese | 392 | 0.4% |
| Canadian | 287 | 0.3% |
| Cape Verdean | 10 | 0.0% |
| Celtic | 8 | 0.0% |
| Central American | 353 | 0.3% |
| Central American Indian | 27 | 0.0% |
| Cherokee | 50 | 0.0% |
| Chilean | 60 | 0.1% |
| Chippewa | 14 | 0.0% |
| Choctaw | 6 | 0.0% |
| Colombian | 73 | 0.1% |
| Costa Rican | 12 | 0.0% |
| Croatian | 80 | 0.1% |
| Cuban | 108 | 0.1% |
| Czech | 327 | 0.3% |
| Czechoslovakian | 96 | 0.1% |
| Danish | 810 | 0.7% |
| Dominican | 179 | 0.2% |
| Dutch | 5,034 | 4.5% |
| Eastern European | 434 | 0.4% |
| Ecuadorian | 81 | 0.1% |
| Egyptian | 184 | 0.2% |
| English | 19,775 | 17.6% |
| Estonian | 4 | 0.0% |
| European | 1,680 | 1.5% |
| Filipino | 14 | 0.0% |
| Finnish | 194 | 0.2% |
| French | 3,413 | 3.0% |
| French American Indian | 21 | 0.0% |
| French Canadian | 1,014 | 0.9% |
| German | 23,887 | 21.3% |
| Greek | 373 | 0.3% |
| Guatemalan | 72 | 0.1% |
| Guyanese | 50 | 0.0% |
| Haitian | 83 | 0.1% |
| Honduran | 36 | 0.0% |
| Houma | 2 | 0.0% |
| Hungarian | 204 | 0.2% |
| Icelander | 12 | 0.0% |
| Indian (Asian) | 259 | 0.2% |
| Indonesian | 9 | 0.0% |
| Iranian | 24 | 0.0% |
| Irish | 19,424 | 17.3% |
| Iroquois | 71 | 0.1% |
| Israeli | 5 | 0.0% |
| Italian | 14,722 | 13.1% |
| Jamaican | 430 | 0.4% |
| Japanese | 176 | 0.2% |
| Kenyan | 1 | 0.0% |
| Kiowa | 24 | 0.0% |
| Korean | 232 | 0.2% |
| Laotian | 20 | 0.0% |
| Latvian | 8 | 0.0% |
| Lebanese | 240 | 0.2% |
| Lithuanian | 448 | 0.4% |
| Lumbee | 38 | 0.0% |
| Maltese | 78 | 0.1% |
| Mexican | 1,378 | 1.2% |
| Mexican American Indian | 4 | 0.0% |
| Mongolian | 2 | 0.0% |
| Moroccan | 38 | 0.0% |
| Nicaraguan | 23 | 0.0% |
| Nigerian | 98 | 0.1% |
| Northern European | 255 | 0.2% |
| Norwegian | 477 | 0.4% |
| Pakistani | 95 | 0.1% |
| Panamanian | 66 | 0.1% |
| Pennsylvania German | 107 | 0.1% |
| Peruvian | 4 | 0.0% |
| Polish | 4,594 | 4.1% |
| Portuguese | 117 | 0.1% |
| Puerto Rican | 3,217 | 2.9% |
| Romanian | 94 | 0.1% |
| Russian | 547 | 0.5% |
| Salvadoran | 144 | 0.1% |
| Scandinavian | 220 | 0.2% |
| Scotch-Irish | 1,006 | 0.9% |
| Scottish | 2,984 | 2.7% |
| Serbian | 104 | 0.1% |
| Sioux | 1 | 0.0% |
| Slovak | 225 | 0.2% |
| Slovene | 40 | 0.0% |
| South African | 6 | 0.0% |
| South American | 278 | 0.3% |
| Spaniard | 98 | 0.1% |
| Spanish | 73 | 0.1% |
| Spanish American | 7 | 0.0% |
| Spanish American Indian | 7 | 0.0% |
| Sri Lankan | 31 | 0.0% |
| Subsaharan African | 520 | 0.5% |
| Swedish | 1,086 | 1.0% |
| Swiss | 557 | 0.5% |
| Syrian | 188 | 0.2% |
| Thai | 346 | 0.3% |
| Tlingit-Haida | 6 | 0.0% |
| Trinidadian and Tobagonian | 10 | 0.0% |
| Turkish | 8 | 0.0% |
| Ukrainian | 697 | 0.6% |
| Venezuelan | 43 | 0.0% |
| Vietnamese | 18 | 0.0% |
| Welsh | 926 | 0.8% |
| West Indian | 18 | 0.0% |
| Yugoslavian | 32 | 0.0% | View All 122 Rows |
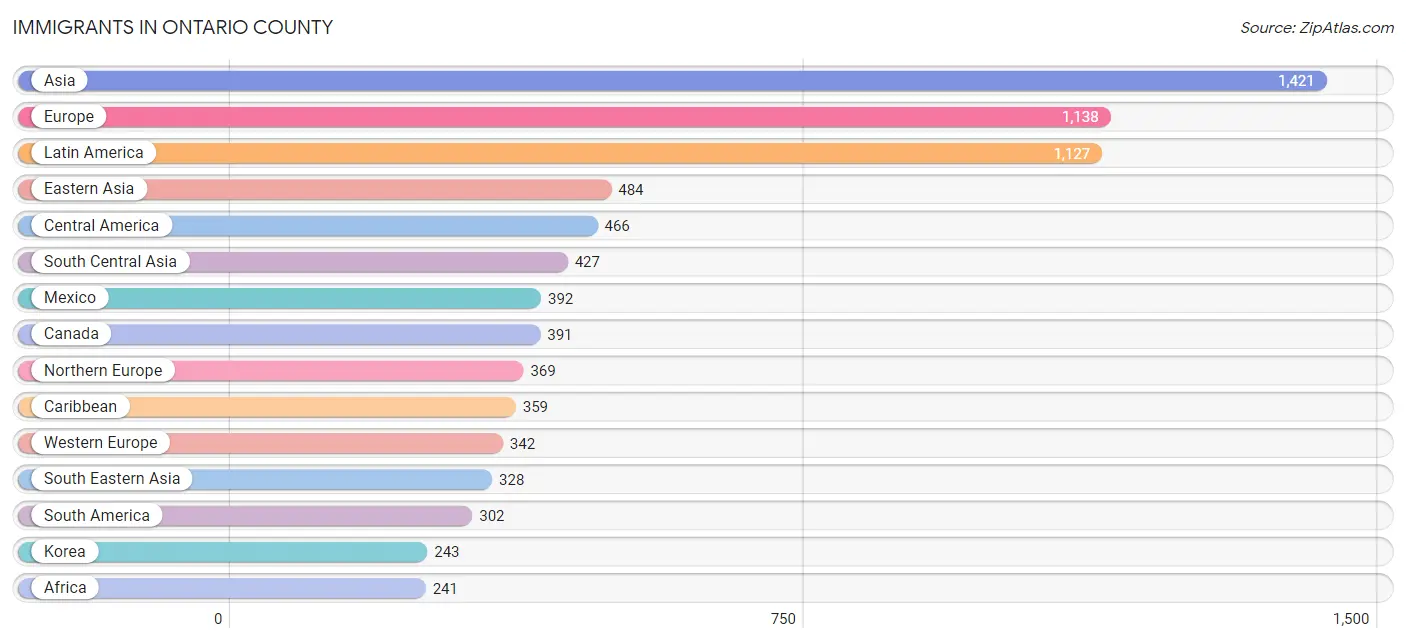
Immigrants in Ontario County
The most numerous immigrant groups reported in Ontario County came from Asia (1,421 | 1.3%), Europe (1,138 | 1.0%), Latin America (1,127 | 1.0%), Eastern Asia (484 | 0.4%), and Central America (466 | 0.4%), together accounting for 4.1% of all Ontario County residents.
| Immigration Origin | # Population | % Population |
| Afghanistan | 1 | 0.0% |
| Africa | 241 | 0.2% |
| Argentina | 17 | 0.0% |
| Asia | 1,421 | 1.3% |
| Australia | 18 | 0.0% |
| Austria | 13 | 0.0% |
| Bangladesh | 6 | 0.0% |
| Barbados | 20 | 0.0% |
| Belgium | 19 | 0.0% |
| Bolivia | 10 | 0.0% |
| Brazil | 114 | 0.1% |
| Cambodia | 85 | 0.1% |
| Canada | 391 | 0.4% |
| Caribbean | 359 | 0.3% |
| Central America | 466 | 0.4% |
| Chile | 6 | 0.0% |
| China | 185 | 0.2% |
| Colombia | 44 | 0.0% |
| Costa Rica | 12 | 0.0% |
| Croatia | 10 | 0.0% |
| Cuba | 43 | 0.0% |
| Czechoslovakia | 4 | 0.0% |
| Denmark | 17 | 0.0% |
| Dominican Republic | 34 | 0.0% |
| Eastern Africa | 1 | 0.0% |
| Eastern Asia | 484 | 0.4% |
| Eastern Europe | 197 | 0.2% |
| Ecuador | 10 | 0.0% |
| Egypt | 132 | 0.1% |
| El Salvador | 6 | 0.0% |
| England | 94 | 0.1% |
| Europe | 1,138 | 1.0% |
| France | 37 | 0.0% |
| Germany | 173 | 0.2% |
| Greece | 18 | 0.0% |
| Guatemala | 9 | 0.0% |
| Guyana | 32 | 0.0% |
| Haiti | 5 | 0.0% |
| Honduras | 39 | 0.0% |
| Hungary | 15 | 0.0% |
| India | 175 | 0.2% |
| Indonesia | 14 | 0.0% |
| Ireland | 95 | 0.1% |
| Israel | 11 | 0.0% |
| Italy | 140 | 0.1% |
| Jamaica | 241 | 0.2% |
| Japan | 56 | 0.1% |
| Kenya | 1 | 0.0% |
| Korea | 243 | 0.2% |
| Latin America | 1,127 | 1.0% |
| Lebanon | 49 | 0.0% |
| Mexico | 392 | 0.4% |
| Morocco | 11 | 0.0% |
| Nepal | 48 | 0.0% |
| Netherlands | 64 | 0.1% |
| Nicaragua | 8 | 0.0% |
| Nigeria | 29 | 0.0% |
| Northern Africa | 184 | 0.2% |
| Northern Europe | 369 | 0.3% |
| Norway | 9 | 0.0% |
| Oceania | 90 | 0.1% |
| Pakistan | 135 | 0.1% |
| Peru | 26 | 0.0% |
| Philippines | 115 | 0.1% |
| Poland | 18 | 0.0% |
| Romania | 16 | 0.0% |
| Russia | 24 | 0.0% |
| Saudi Arabia | 64 | 0.1% |
| Scotland | 11 | 0.0% |
| Serbia | 16 | 0.0% |
| Singapore | 2 | 0.0% |
| South Africa | 25 | 0.0% |
| South America | 302 | 0.3% |
| South Central Asia | 427 | 0.4% |
| South Eastern Asia | 328 | 0.3% |
| Southern Europe | 230 | 0.2% |
| Spain | 34 | 0.0% |
| Sri Lanka | 2 | 0.0% |
| Switzerland | 36 | 0.0% |
| Taiwan | 23 | 0.0% |
| Thailand | 82 | 0.1% |
| Trinidad and Tobago | 10 | 0.0% |
| Turkey | 8 | 0.0% |
| Ukraine | 57 | 0.1% |
| Uzbekistan | 54 | 0.1% |
| Venezuela | 43 | 0.0% |
| Vietnam | 21 | 0.0% |
| West Indies | 6 | 0.0% |
| Western Africa | 29 | 0.0% |
| Western Asia | 182 | 0.2% |
| Western Europe | 342 | 0.3% | View All 91 Rows |
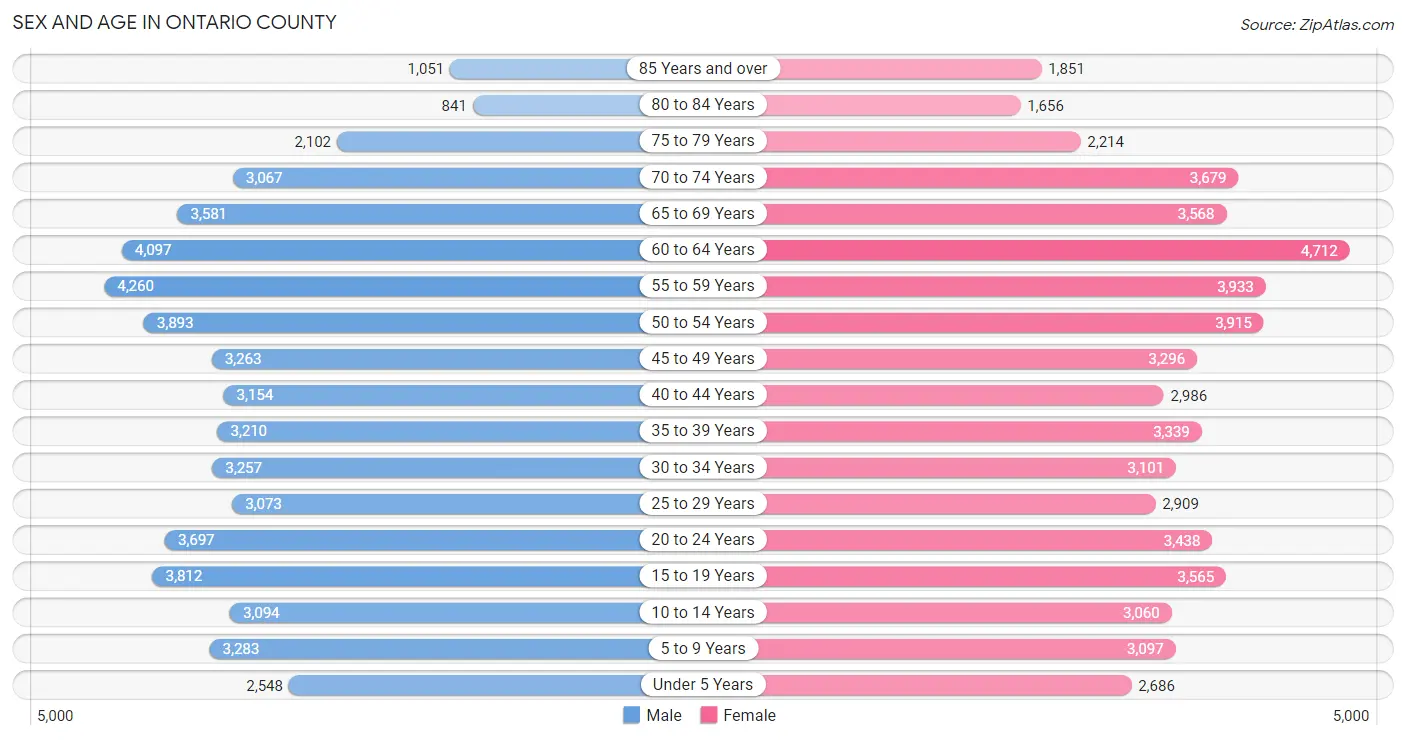
Sex and Age in Ontario County
Sex and Age in Ontario County
The most populous age groups in Ontario County are 55 to 59 Years (4,260 | 7.7%) for men and 60 to 64 Years (4,712 | 8.3%) for women.
| Age Bracket | Male | Female |
| Under 5 Years | 2,548 (4.6%) | 2,686 (4.7%) |
| 5 to 9 Years | 3,283 (5.9%) | 3,097 (5.4%) |
| 10 to 14 Years | 3,094 (5.6%) | 3,060 (5.4%) |
| 15 to 19 Years | 3,812 (6.9%) | 3,565 (6.2%) |
| 20 to 24 Years | 3,697 (6.7%) | 3,438 (6.0%) |
| 25 to 29 Years | 3,073 (5.6%) | 2,909 (5.1%) |
| 30 to 34 Years | 3,257 (5.9%) | 3,101 (5.4%) |
| 35 to 39 Years | 3,210 (5.8%) | 3,339 (5.9%) |
| 40 to 44 Years | 3,154 (5.7%) | 2,986 (5.2%) |
| 45 to 49 Years | 3,263 (5.9%) | 3,296 (5.8%) |
| 50 to 54 Years | 3,893 (7.0%) | 3,915 (6.9%) |
| 55 to 59 Years | 4,260 (7.7%) | 3,933 (6.9%) |
| 60 to 64 Years | 4,097 (7.4%) | 4,712 (8.3%) |
| 65 to 69 Years | 3,581 (6.5%) | 3,568 (6.3%) |
| 70 to 74 Years | 3,067 (5.6%) | 3,679 (6.5%) |
| 75 to 79 Years | 2,102 (3.8%) | 2,214 (3.9%) |
| 80 to 84 Years | 841 (1.5%) | 1,656 (2.9%) |
| 85 Years and over | 1,051 (1.9%) | 1,851 (3.3%) |
| Total | 55,283 (100.0%) | 57,005 (100.0%) |
Families and Households in Ontario County
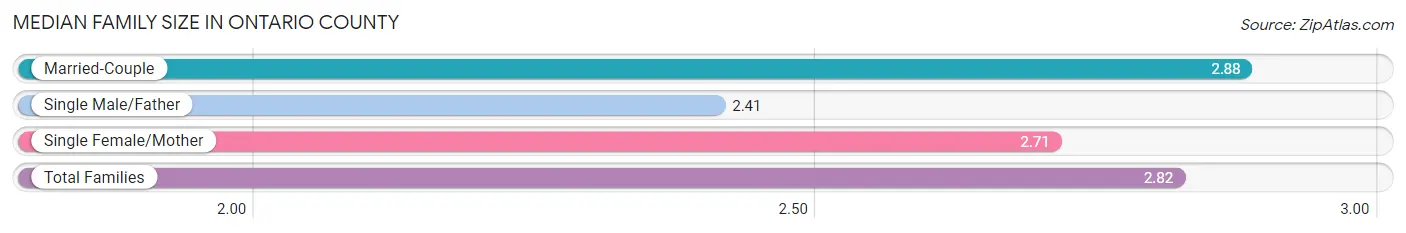
Median Family Size in Ontario County
The median family size in Ontario County is 2.82 persons per family, with married-couple families (22,651 | 76.7%) accounting for the largest median family size of 2.88 persons per family. On the other hand, single male/father families (1,955 | 6.6%) represent the smallest median family size with 2.41 persons per family.
| Family Type | # Families | Family Size |
| Married-Couple | 22,651 (76.7%) | 2.88 |
| Single Male/Father | 1,955 (6.6%) | 2.41 |
| Single Female/Mother | 4,914 (16.7%) | 2.71 |
| Total Families | 29,520 (100.0%) | 2.82 |
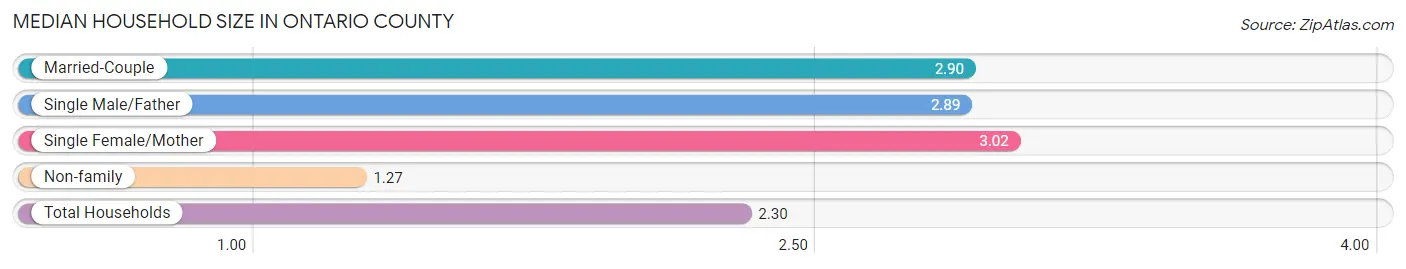
Median Household Size in Ontario County
The median household size in Ontario County is 2.30 persons per household, with single female/mother households (4,914 | 10.4%) accounting for the largest median household size of 3.02 persons per household. non-family households (17,560 | 37.3%) represent the smallest median household size with 1.27 persons per household.
| Household Type | # Households | Household Size |
| Married-Couple | 22,651 (48.1%) | 2.90 |
| Single Male/Father | 1,955 (4.2%) | 2.89 |
| Single Female/Mother | 4,914 (10.4%) | 3.02 |
| Non-family | 17,560 (37.3%) | 1.27 |
| Total Households | 47,080 (100.0%) | 2.30 |
Household Size by Marriage Status in Ontario County
Out of a total of 47,080 households in Ontario County, 29,520 (62.7%) are family households, while 17,560 (37.3%) are nonfamily households. The most numerous type of family households are 2-person households, comprising 14,448, and the most common type of nonfamily households are 1-person households, comprising 13,509.
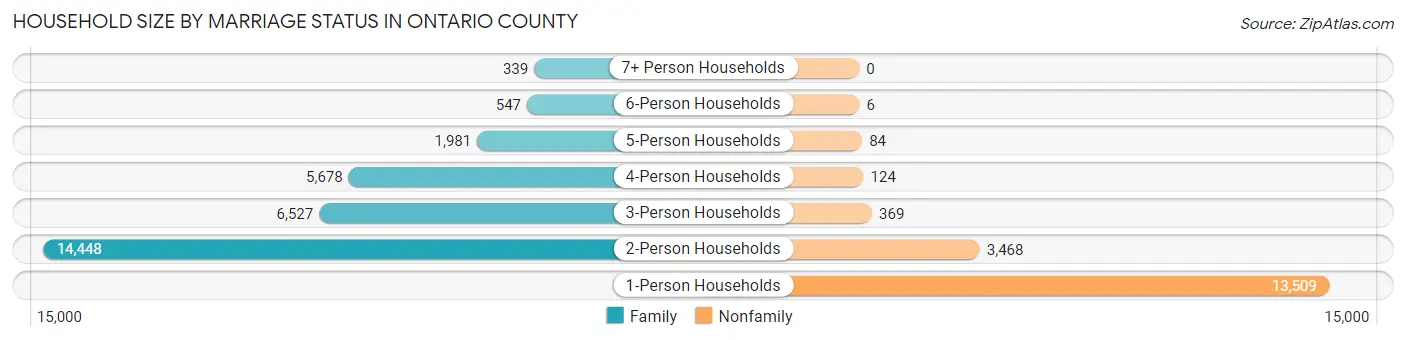
| Household Size | Family Households | Nonfamily Households |
| 1-Person Households | - | 13,509 (28.7%) |
| 2-Person Households | 14,448 (30.7%) | 3,468 (7.4%) |
| 3-Person Households | 6,527 (13.9%) | 369 (0.8%) |
| 4-Person Households | 5,678 (12.1%) | 124 (0.3%) |
| 5-Person Households | 1,981 (4.2%) | 84 (0.2%) |
| 6-Person Households | 547 (1.2%) | 6 (0.0%) |
| 7+ Person Households | 339 (0.7%) | 0 (0.0%) |
| Total | 29,520 (62.7%) | 17,560 (37.3%) |
Female Fertility in Ontario County
Fertility by Age in Ontario County
Average fertility rate in Ontario County is 52.0 births per 1,000 women. Women in the age bracket of 20 to 34 years have the highest fertility rate with 94.0 births per 1,000 women. Women in the age bracket of 20 to 34 years acount for 71.9% of all women with births.
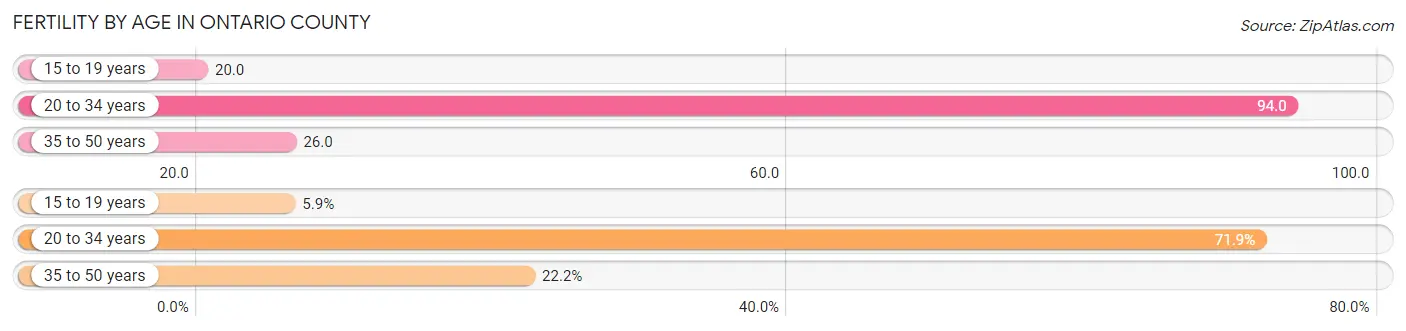
| Age Bracket | Women with Births | Births / 1,000 Women |
| 15 to 19 years | 73 (5.9%) | 20.0 |
| 20 to 34 years | 884 (71.9%) | 94.0 |
| 35 to 50 years | 273 (22.2%) | 26.0 |
| Total | 1,230 (100.0%) | 52.0 |
Fertility by Age by Marriage Status in Ontario County
67.9% of women with births (1,230) in Ontario County are married. The highest percentage of unmarried women with births falls into 15 to 19 years age bracket with 100.0% of them unmarried at the time of birth, while the lowest percentage of unmarried women with births belong to 35 to 50 years age bracket with 0.0% of them unmarried.
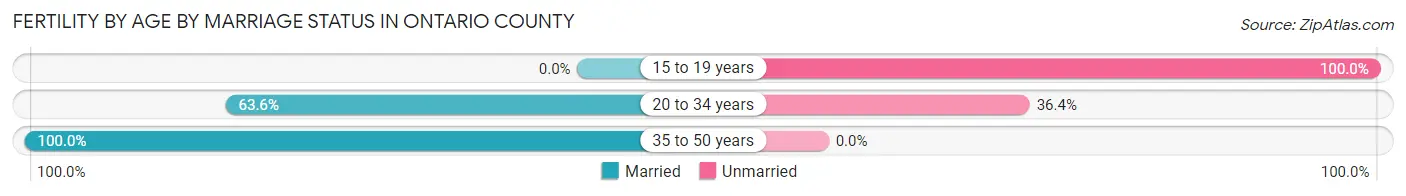
| Age Bracket | Married | Unmarried |
| 15 to 19 years | 0 (0.0%) | 73 (100.0%) |
| 20 to 34 years | 562 (63.6%) | 322 (36.4%) |
| 35 to 50 years | 273 (100.0%) | 0 (0.0%) |
| Total | 835 (67.9%) | 395 (32.1%) |
Fertility by Education in Ontario County
Average fertility rate in Ontario County is 52.0 births per 1,000 women. Women with the education attainment of bachelor's degree have the highest fertility rate of 68.0 births per 1,000 women, while women with the education attainment of less than high school have the lowest fertility at 25.0 births per 1,000 women. Women with the education attainment of college or associate's degree represent 27.1% of all women with births.
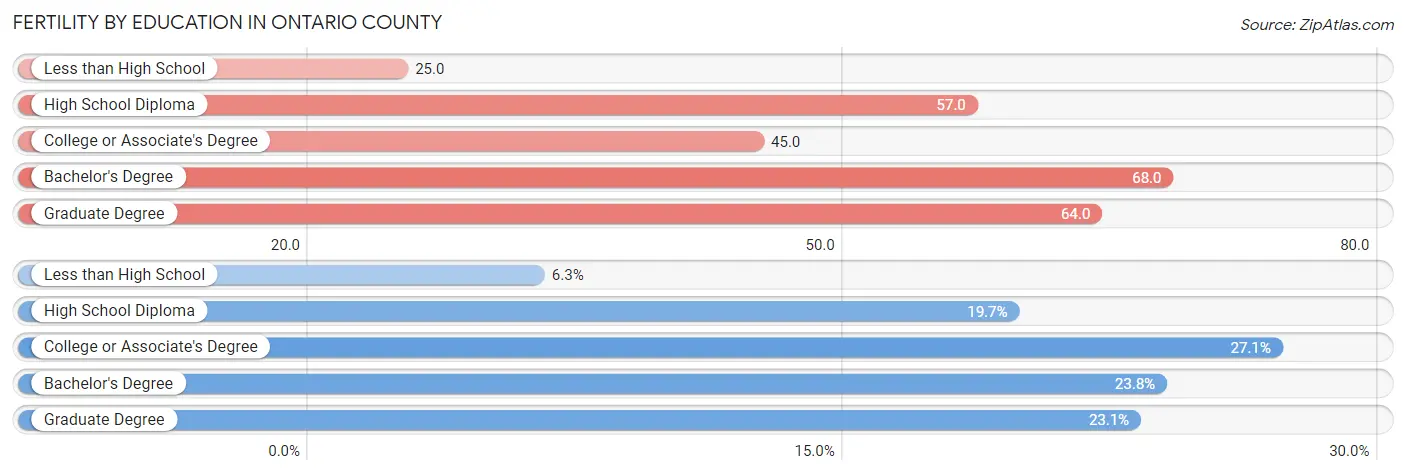
| Educational Attainment | Women with Births | Births / 1,000 Women |
| Less than High School | 78 (6.3%) | 25.0 |
| High School Diploma | 242 (19.7%) | 57.0 |
| College or Associate's Degree | 333 (27.1%) | 45.0 |
| Bachelor's Degree | 293 (23.8%) | 68.0 |
| Graduate Degree | 284 (23.1%) | 64.0 |
| Total | 1,230 (100.0%) | 52.0 |
Fertility by Education by Marriage Status in Ontario County
32.1% of women with births in Ontario County are unmarried. Women with the educational attainment of bachelor's degree are most likely to be married with 97.3% of them married at childbirth, while women with the educational attainment of college or associate's degree are least likely to be married with 57.7% of them unmarried at childbirth.
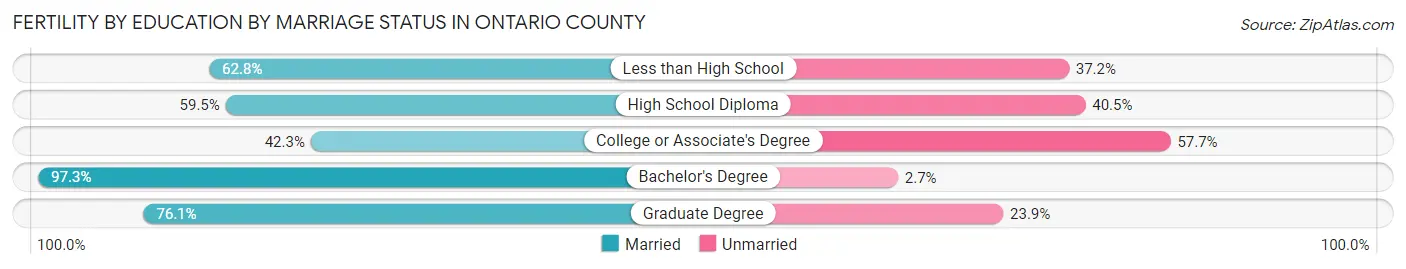
| Educational Attainment | Married | Unmarried |
| Less than High School | 49 (62.8%) | 29 (37.2%) |
| High School Diploma | 144 (59.5%) | 98 (40.5%) |
| College or Associate's Degree | 141 (42.3%) | 192 (57.7%) |
| Bachelor's Degree | 285 (97.3%) | 8 (2.7%) |
| Graduate Degree | 216 (76.1%) | 68 (23.9%) |
| Total | 835 (67.9%) | 395 (32.1%) |
Employment Characteristics in Ontario County
Employment by Class of Employer in Ontario County
Among the 54,283 employed individuals in Ontario County, private company employees (33,239 | 61.2%), not-for-profit organizations (7,153 | 13.2%), and local government employees (5,318 | 9.8%) make up the most common classes of employment.
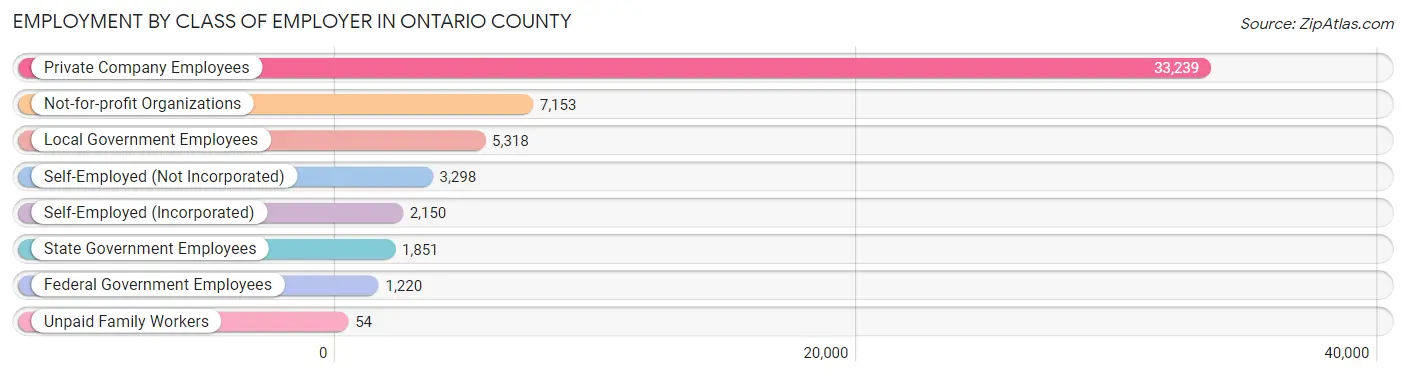
| Employer Class | # Employees | % Employees |
| Private Company Employees | 33,239 | 61.2% |
| Self-Employed (Incorporated) | 2,150 | 4.0% |
| Self-Employed (Not Incorporated) | 3,298 | 6.1% |
| Not-for-profit Organizations | 7,153 | 13.2% |
| Local Government Employees | 5,318 | 9.8% |
| State Government Employees | 1,851 | 3.4% |
| Federal Government Employees | 1,220 | 2.2% |
| Unpaid Family Workers | 54 | 0.1% |
| Total | 54,283 | 100.0% |
Employment Status by Age in Ontario County
According to the labor force statistics for Ontario County, out of the total population over 16 years of age (93,104), 61.9% or 57,631 individuals are in the labor force, with 4.0% or 2,305 of them unemployed. The age group with the highest labor force participation rate is 25 to 29 years, with 89.2% or 5,336 individuals in the labor force. Within the labor force, the 75 years and over age range has the highest percentage of unemployed individuals, with 13.8% or 84 of them being unemployed.
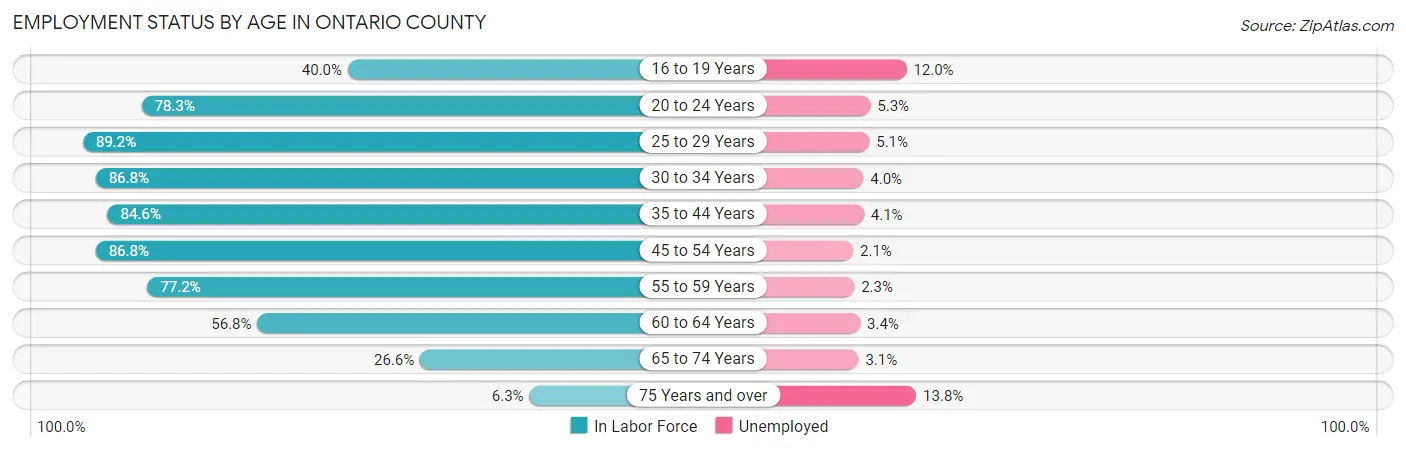
| Age Bracket | In Labor Force | Unemployed |
| 16 to 19 Years | 2,384 (40.0%) | 286 (12.0%) |
| 20 to 24 Years | 5,587 (78.3%) | 296 (5.3%) |
| 25 to 29 Years | 5,336 (89.2%) | 272 (5.1%) |
| 30 to 34 Years | 5,519 (86.8%) | 221 (4.0%) |
| 35 to 44 Years | 10,735 (84.6%) | 440 (4.1%) |
| 45 to 54 Years | 12,471 (86.8%) | 262 (2.1%) |
| 55 to 59 Years | 6,325 (77.2%) | 145 (2.3%) |
| 60 to 64 Years | 5,004 (56.8%) | 170 (3.4%) |
| 65 to 74 Years | 3,696 (26.6%) | 115 (3.1%) |
| 75 Years and over | 612 (6.3%) | 84 (13.8%) |
| Total | 57,631 (61.9%) | 2,305 (4.0%) |
Employment Status by Educational Attainment in Ontario County
According to labor force statistics for Ontario County, 80.5% of individuals (45,400) out of the total population between 25 and 64 years of age (56,398) are in the labor force, with 3.3% or 1,498 of them being unemployed. The group with the highest labor force participation rate are those with the educational attainment of bachelor's degree or higher, with 86.8% or 19,481 individuals in the labor force. Within the labor force, individuals with less than high school education have the highest percentage of unemployment, with 7.8% or 146 of them being unemployed.
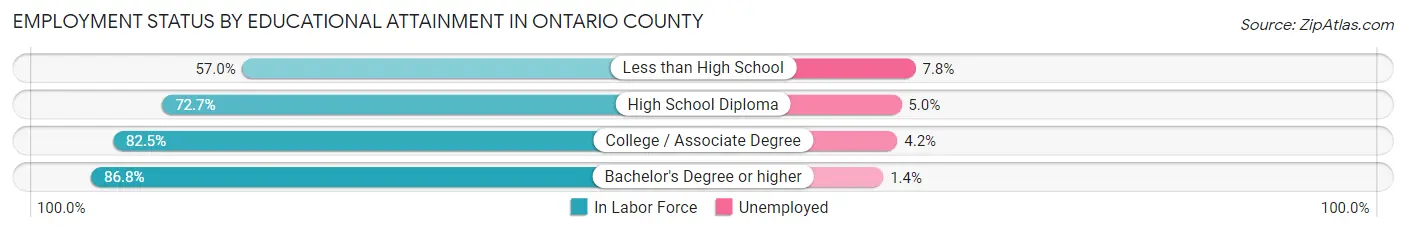
| Educational Attainment | In Labor Force | Unemployed |
| Less than High School | 1,868 (57.0%) | 256 (7.8%) |
| High School Diploma | 9,559 (72.7%) | 657 (5.0%) |
| College / Associate Degree | 14,460 (82.5%) | 736 (4.2%) |
| Bachelor's Degree or higher | 19,481 (86.8%) | 314 (1.4%) |
| Total | 45,400 (80.5%) | 1,861 (3.3%) |
Employment Occupations by Sex in Ontario County
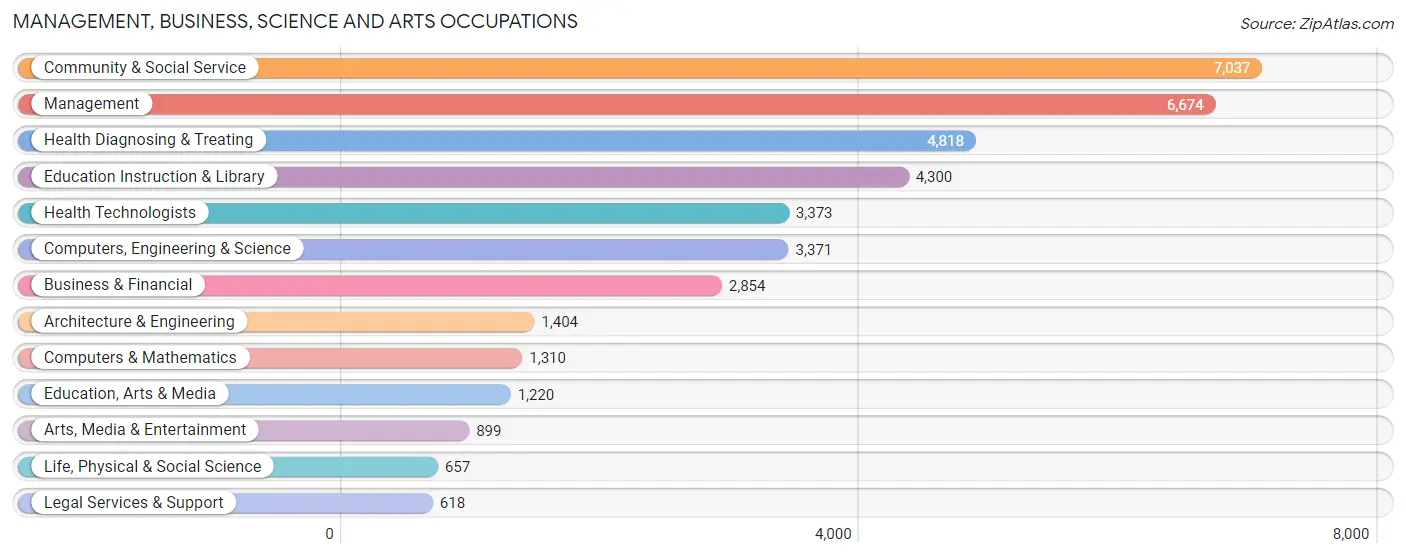
Management, Business, Science and Arts Occupations
The most common Management, Business, Science and Arts occupations in Ontario County are Community & Social Service (7,037 | 12.7%), Management (6,674 | 12.1%), Health Diagnosing & Treating (4,818 | 8.7%), Education Instruction & Library (4,300 | 7.8%), and Health Technologists (3,373 | 6.1%).
Management, Business, Science and Arts Occupations by Sex
Within the Management, Business, Science and Arts occupations in Ontario County, the most male-oriented occupations are Architecture & Engineering (93.3%), Computers, Engineering & Science (76.4%), and Computers & Mathematics (74.9%), while the most female-oriented occupations are Health Diagnosing & Treating (82.3%), Health Technologists (81.7%), and Education Instruction & Library (73.5%).
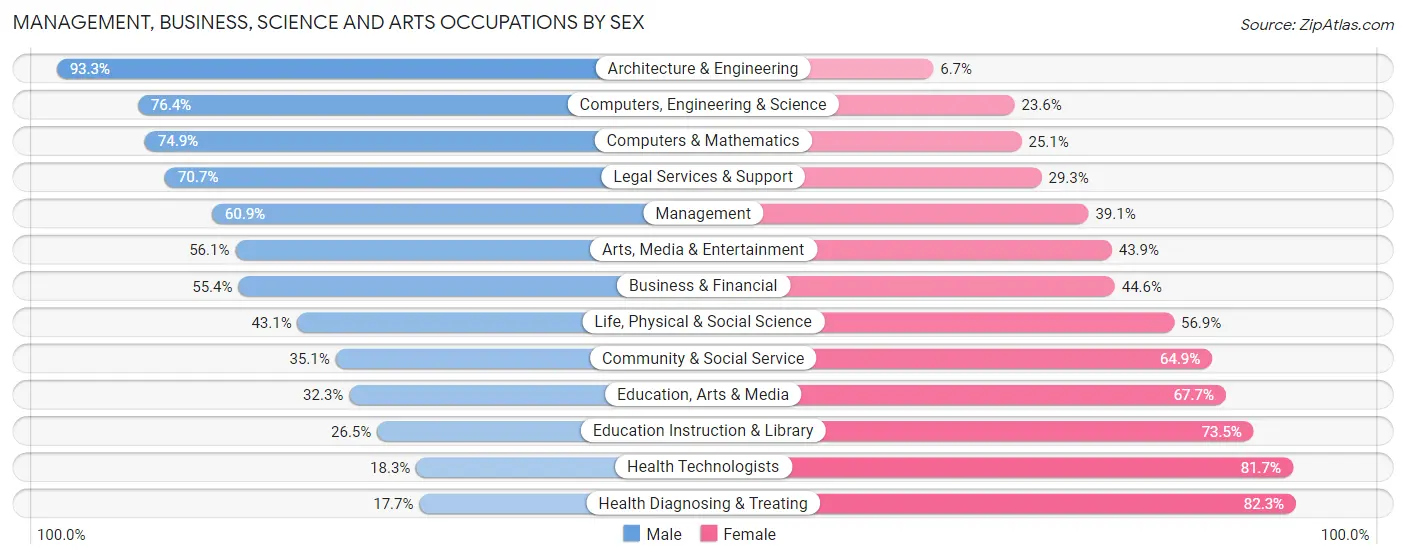
| Occupation | Male | Female |
| Management | 4,066 (60.9%) | 2,608 (39.1%) |
| Business & Financial | 1,582 (55.4%) | 1,272 (44.6%) |
| Computers, Engineering & Science | 2,574 (76.4%) | 797 (23.6%) |
| Computers & Mathematics | 981 (74.9%) | 329 (25.1%) |
| Architecture & Engineering | 1,310 (93.3%) | 94 (6.7%) |
| Life, Physical & Social Science | 283 (43.1%) | 374 (56.9%) |
| Community & Social Service | 2,473 (35.1%) | 4,564 (64.9%) |
| Education, Arts & Media | 394 (32.3%) | 826 (67.7%) |
| Legal Services & Support | 437 (70.7%) | 181 (29.3%) |
| Education Instruction & Library | 1,138 (26.5%) | 3,162 (73.5%) |
| Arts, Media & Entertainment | 504 (56.1%) | 395 (43.9%) |
| Health Diagnosing & Treating | 851 (17.7%) | 3,967 (82.3%) |
| Health Technologists | 618 (18.3%) | 2,755 (81.7%) |
| Total (Category) | 11,546 (46.6%) | 13,208 (53.4%) |
| Total (Overall) | 28,793 (52.1%) | 26,517 (47.9%) |
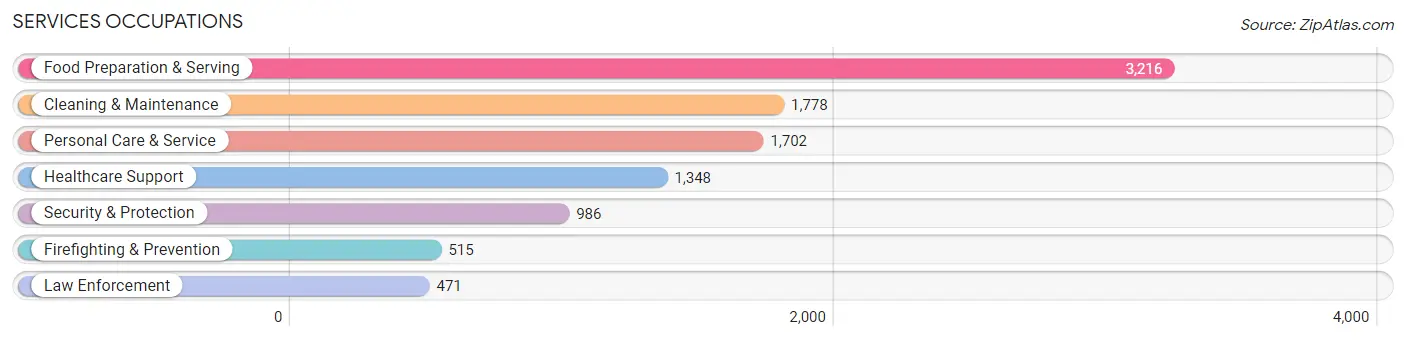
Services Occupations
The most common Services occupations in Ontario County are Food Preparation & Serving (3,216 | 5.8%), Cleaning & Maintenance (1,778 | 3.2%), Personal Care & Service (1,702 | 3.1%), Healthcare Support (1,348 | 2.4%), and Security & Protection (986 | 1.8%).
Services Occupations by Sex
Within the Services occupations in Ontario County, the most male-oriented occupations are Law Enforcement (90.7%), Security & Protection (83.3%), and Firefighting & Prevention (76.5%), while the most female-oriented occupations are Healthcare Support (82.8%), Personal Care & Service (78.7%), and Food Preparation & Serving (55.3%).
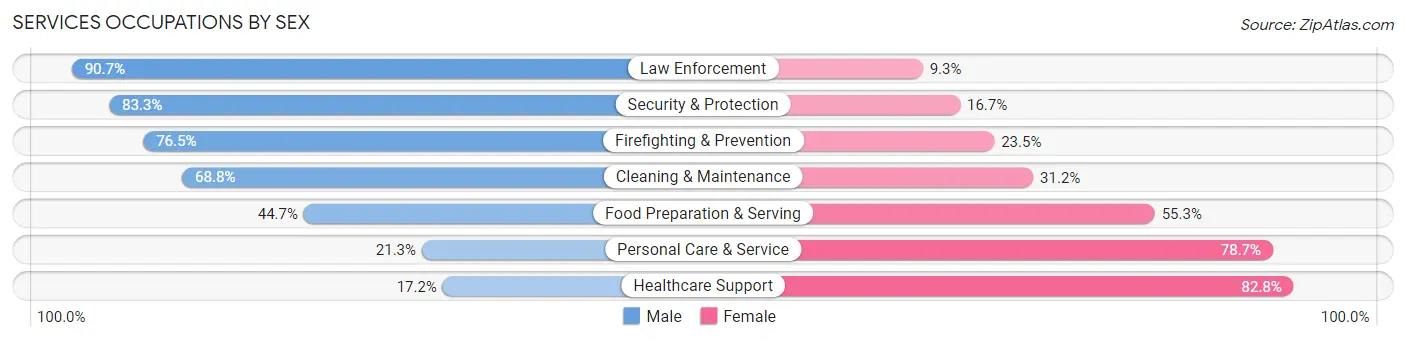
| Occupation | Male | Female |
| Healthcare Support | 232 (17.2%) | 1,116 (82.8%) |
| Security & Protection | 821 (83.3%) | 165 (16.7%) |
| Firefighting & Prevention | 394 (76.5%) | 121 (23.5%) |
| Law Enforcement | 427 (90.7%) | 44 (9.3%) |
| Food Preparation & Serving | 1,438 (44.7%) | 1,778 (55.3%) |
| Cleaning & Maintenance | 1,223 (68.8%) | 555 (31.2%) |
| Personal Care & Service | 363 (21.3%) | 1,339 (78.7%) |
| Total (Category) | 4,077 (45.2%) | 4,953 (54.8%) |
| Total (Overall) | 28,793 (52.1%) | 26,517 (47.9%) |
Sales and Office Occupations
The most common Sales and Office occupations in Ontario County are Office & Administration (5,536 | 10.0%), and Sales & Related (5,439 | 9.8%).

Sales and Office Occupations by Sex
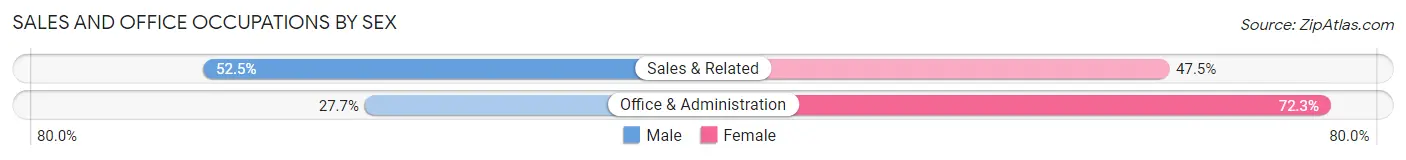
| Occupation | Male | Female |
| Sales & Related | 2,857 (52.5%) | 2,582 (47.5%) |
| Office & Administration | 1,531 (27.7%) | 4,005 (72.3%) |
| Total (Category) | 4,388 (40.0%) | 6,587 (60.0%) |
| Total (Overall) | 28,793 (52.1%) | 26,517 (47.9%) |
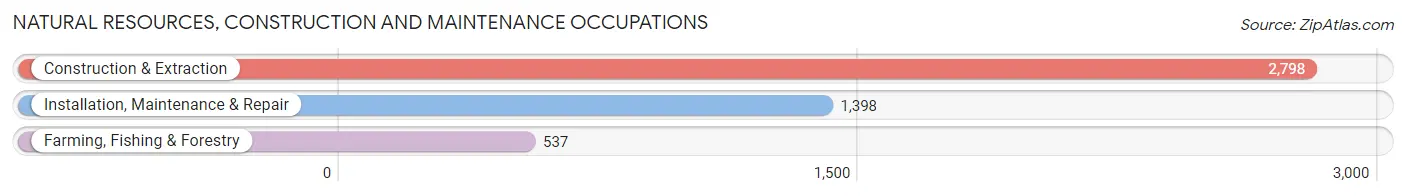
Natural Resources, Construction and Maintenance Occupations
The most common Natural Resources, Construction and Maintenance occupations in Ontario County are Construction & Extraction (2,798 | 5.1%), Installation, Maintenance & Repair (1,398 | 2.5%), and Farming, Fishing & Forestry (537 | 1.0%).
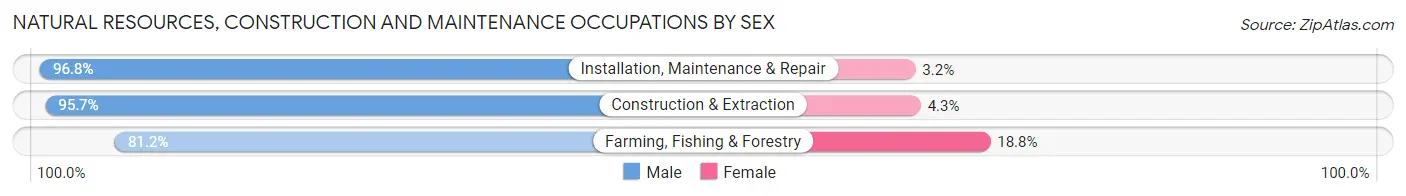
Natural Resources, Construction and Maintenance Occupations by Sex
| Occupation | Male | Female |
| Farming, Fishing & Forestry | 436 (81.2%) | 101 (18.8%) |
| Construction & Extraction | 2,677 (95.7%) | 121 (4.3%) |
| Installation, Maintenance & Repair | 1,353 (96.8%) | 45 (3.2%) |
| Total (Category) | 4,466 (94.4%) | 267 (5.6%) |
| Total (Overall) | 28,793 (52.1%) | 26,517 (47.9%) |
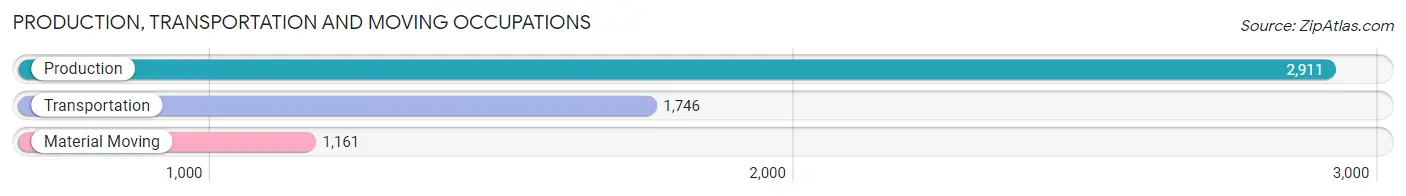
Production, Transportation and Moving Occupations
The most common Production, Transportation and Moving occupations in Ontario County are Production (2,911 | 5.3%), Transportation (1,746 | 3.2%), and Material Moving (1,161 | 2.1%).
Production, Transportation and Moving Occupations by Sex
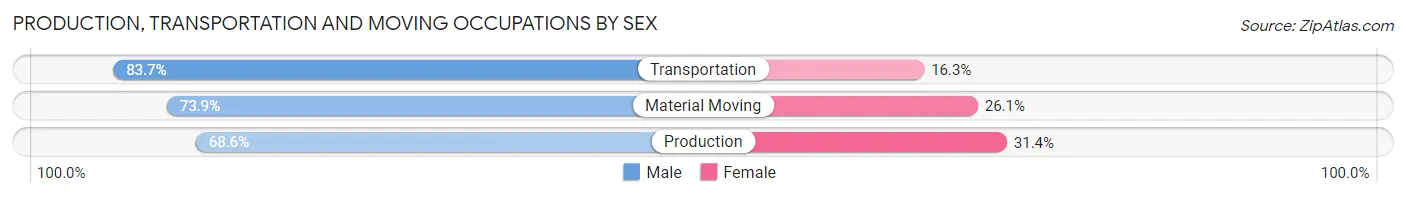
| Occupation | Male | Female |
| Production | 1,996 (68.6%) | 915 (31.4%) |
| Transportation | 1,462 (83.7%) | 284 (16.3%) |
| Material Moving | 858 (73.9%) | 303 (26.1%) |
| Total (Category) | 4,316 (74.2%) | 1,502 (25.8%) |
| Total (Overall) | 28,793 (52.1%) | 26,517 (47.9%) |
Employment Industries by Sex in Ontario County
Employment Industries in Ontario County
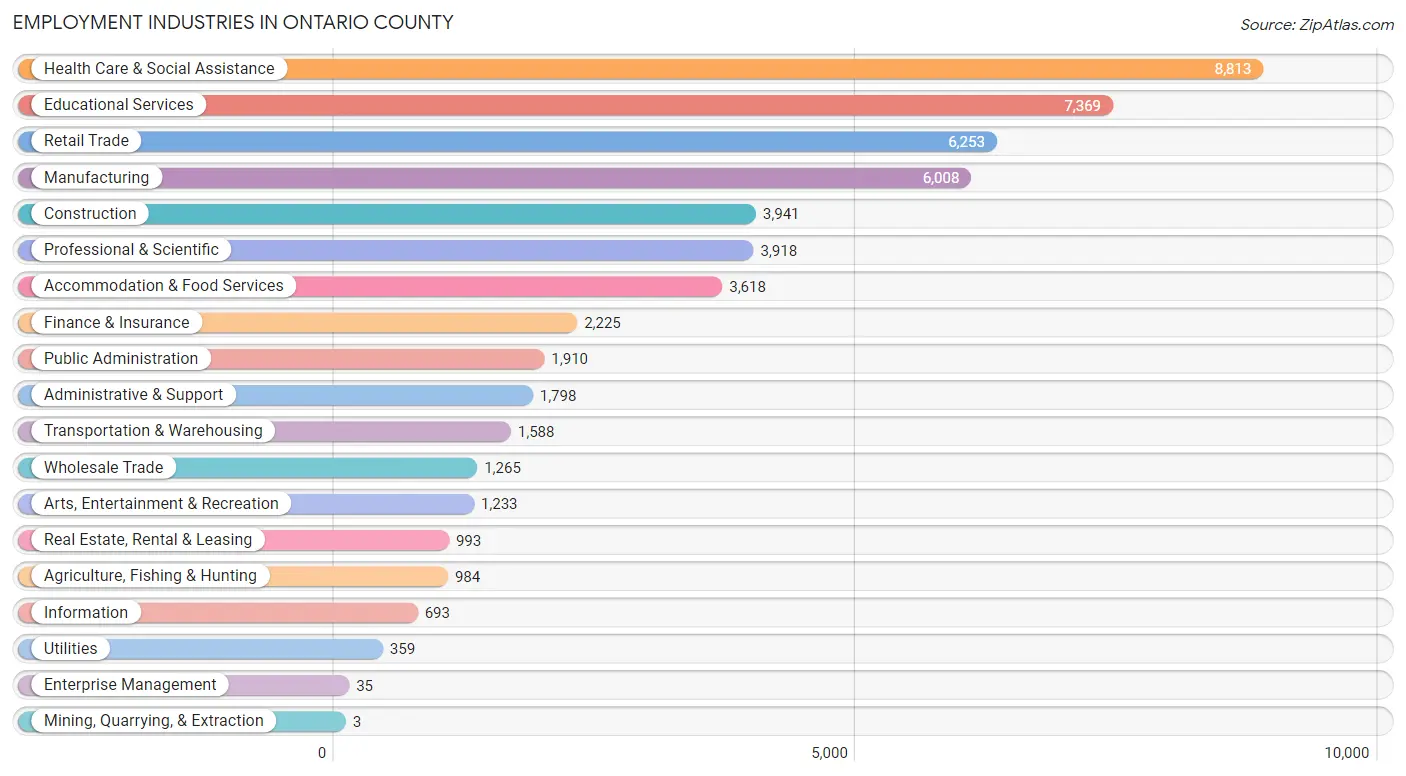
The major employment industries in Ontario County include Health Care & Social Assistance (8,813 | 15.9%), Educational Services (7,369 | 13.3%), Retail Trade (6,253 | 11.3%), Manufacturing (6,008 | 10.9%), and Construction (3,941 | 7.1%).
Employment Industries by Sex in Ontario County
The Ontario County industries that see more men than women are Mining, Quarrying, & Extraction (100.0%), Construction (90.7%), and Transportation & Warehousing (80.3%), whereas the industries that tend to have a higher number of women are Enterprise Management (91.4%), Health Care & Social Assistance (76.9%), and Educational Services (63.6%).
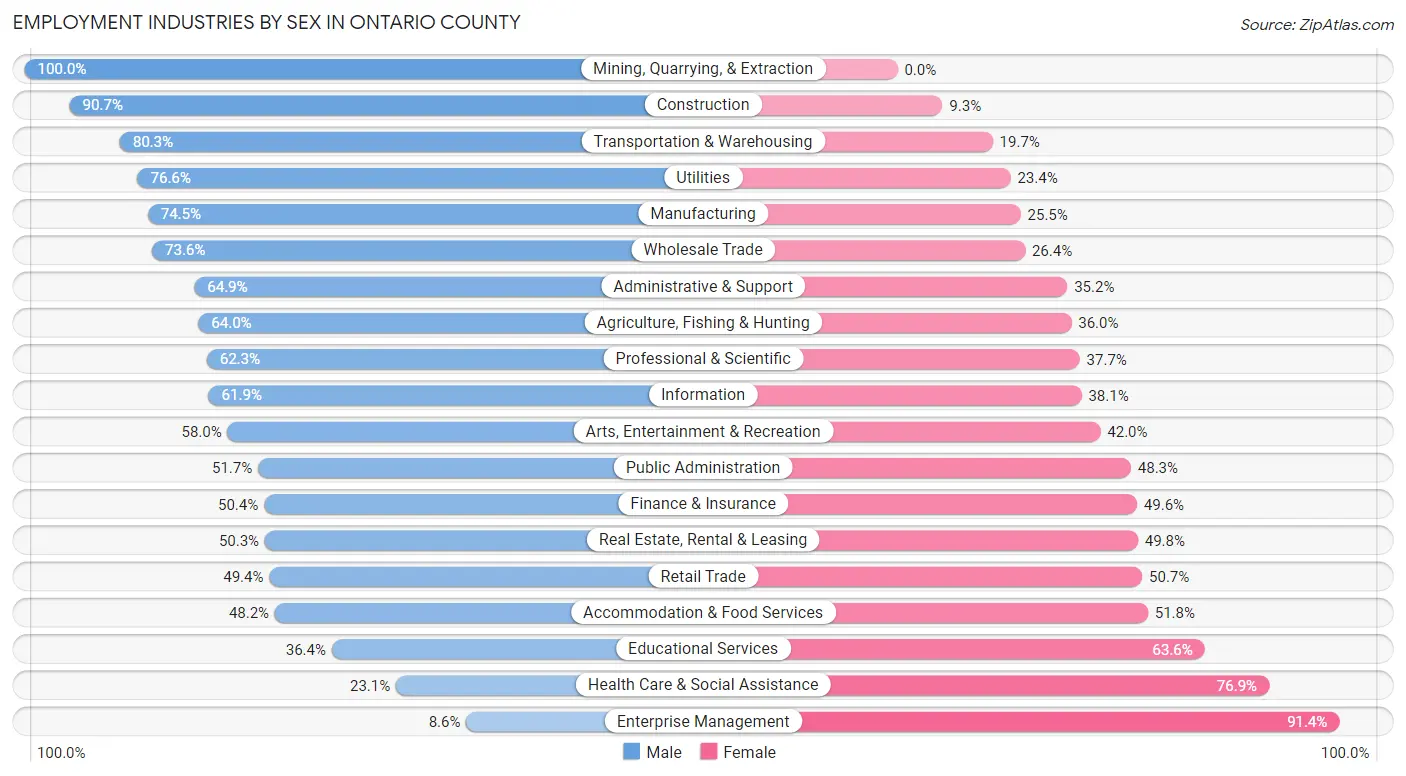
| Industry | Male | Female |
| Agriculture, Fishing & Hunting | 630 (64.0%) | 354 (36.0%) |
| Mining, Quarrying, & Extraction | 3 (100.0%) | 0 (0.0%) |
| Construction | 3,574 (90.7%) | 367 (9.3%) |
| Manufacturing | 4,476 (74.5%) | 1,532 (25.5%) |
| Wholesale Trade | 931 (73.6%) | 334 (26.4%) |
| Retail Trade | 3,086 (49.3%) | 3,167 (50.6%) |
| Transportation & Warehousing | 1,275 (80.3%) | 313 (19.7%) |
| Utilities | 275 (76.6%) | 84 (23.4%) |
| Information | 429 (61.9%) | 264 (38.1%) |
| Finance & Insurance | 1,122 (50.4%) | 1,103 (49.6%) |
| Real Estate, Rental & Leasing | 499 (50.2%) | 494 (49.7%) |
| Professional & Scientific | 2,440 (62.3%) | 1,478 (37.7%) |
| Enterprise Management | 3 (8.6%) | 32 (91.4%) |
| Administrative & Support | 1,166 (64.8%) | 632 (35.1%) |
| Educational Services | 2,684 (36.4%) | 4,685 (63.6%) |
| Health Care & Social Assistance | 2,038 (23.1%) | 6,775 (76.9%) |
| Arts, Entertainment & Recreation | 715 (58.0%) | 518 (42.0%) |
| Accommodation & Food Services | 1,743 (48.2%) | 1,875 (51.8%) |
| Public Administration | 987 (51.7%) | 923 (48.3%) |
| Total | 28,793 (52.1%) | 26,517 (47.9%) |
Education in Ontario County
School Enrollment in Ontario County
The most common levels of schooling among the 25,197 students in Ontario County are college / undergraduate (6,295 | 25.0%), high school (5,495 | 21.8%), and elementary school (4,989 | 19.8%).
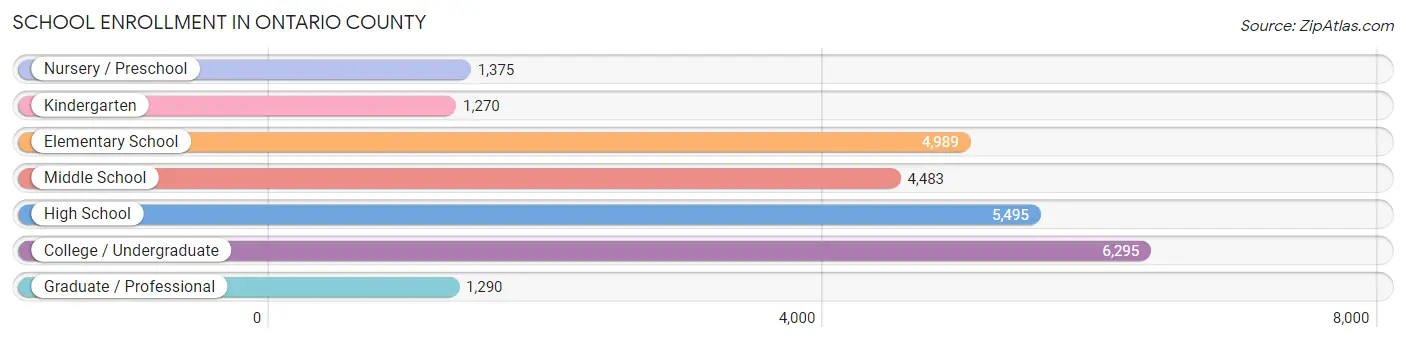
| School Level | # Students | % Students |
| Nursery / Preschool | 1,375 | 5.5% |
| Kindergarten | 1,270 | 5.0% |
| Elementary School | 4,989 | 19.8% |
| Middle School | 4,483 | 17.8% |
| High School | 5,495 | 21.8% |
| College / Undergraduate | 6,295 | 25.0% |
| Graduate / Professional | 1,290 | 5.1% |
| Total | 25,197 | 100.0% |
School Enrollment by Age by Funding Source in Ontario County
Out of a total of 25,197 students who are enrolled in schools in Ontario County, 5,115 (20.3%) attend a private institution, while the remaining 20,082 (79.7%) are enrolled in public schools. The age group of 18 to 19 year olds has the highest likelihood of being enrolled in private schools, with 1,339 (52.0% in the age bracket) enrolled. Conversely, the age group of 10 to 14 year olds has the lowest likelihood of being enrolled in a private school, with 5,592 (93.6% in the age bracket) attending a public institution.
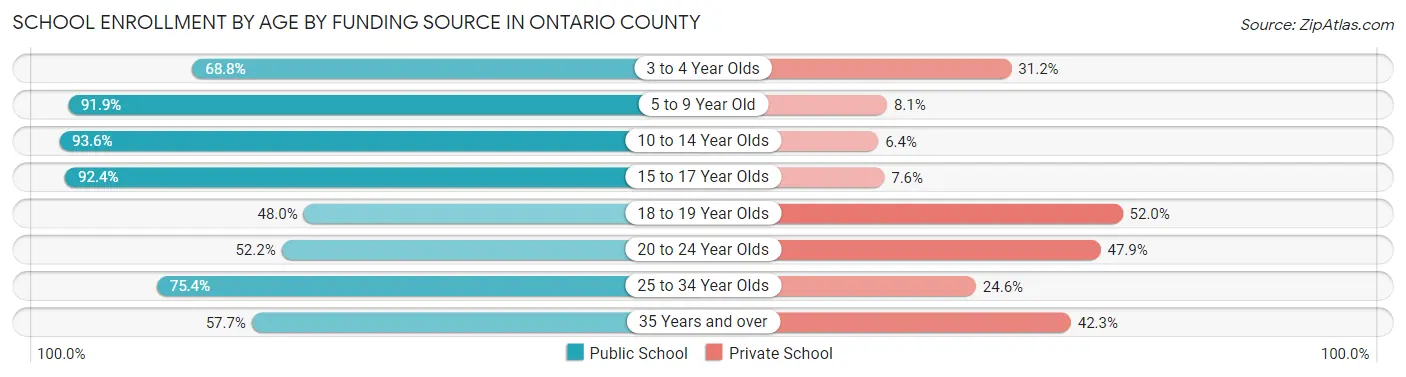
| Age Bracket | Public School | Private School |
| 3 to 4 Year Olds | 733 (68.8%) | 333 (31.2%) |
| 5 to 9 Year Old | 5,561 (91.9%) | 488 (8.1%) |
| 10 to 14 Year Olds | 5,592 (93.6%) | 385 (6.4%) |
| 15 to 17 Year Olds | 3,693 (92.4%) | 302 (7.6%) |
| 18 to 19 Year Olds | 1,238 (48.0%) | 1,339 (52.0%) |
| 20 to 24 Year Olds | 1,531 (52.1%) | 1,405 (47.8%) |
| 25 to 34 Year Olds | 1,013 (75.4%) | 331 (24.6%) |
| 35 Years and over | 723 (57.7%) | 530 (42.3%) |
| Total | 20,082 (79.7%) | 5,115 (20.3%) |
Educational Attainment by Field of Study in Ontario County
Business (4,858 | 15.2%), education (4,755 | 14.8%), science & technology (4,197 | 13.1%), engineering (2,384 | 7.4%), and social sciences (2,232 | 7.0%) are the most common fields of study among 32,016 individuals in Ontario County who have obtained a bachelor's degree or higher.
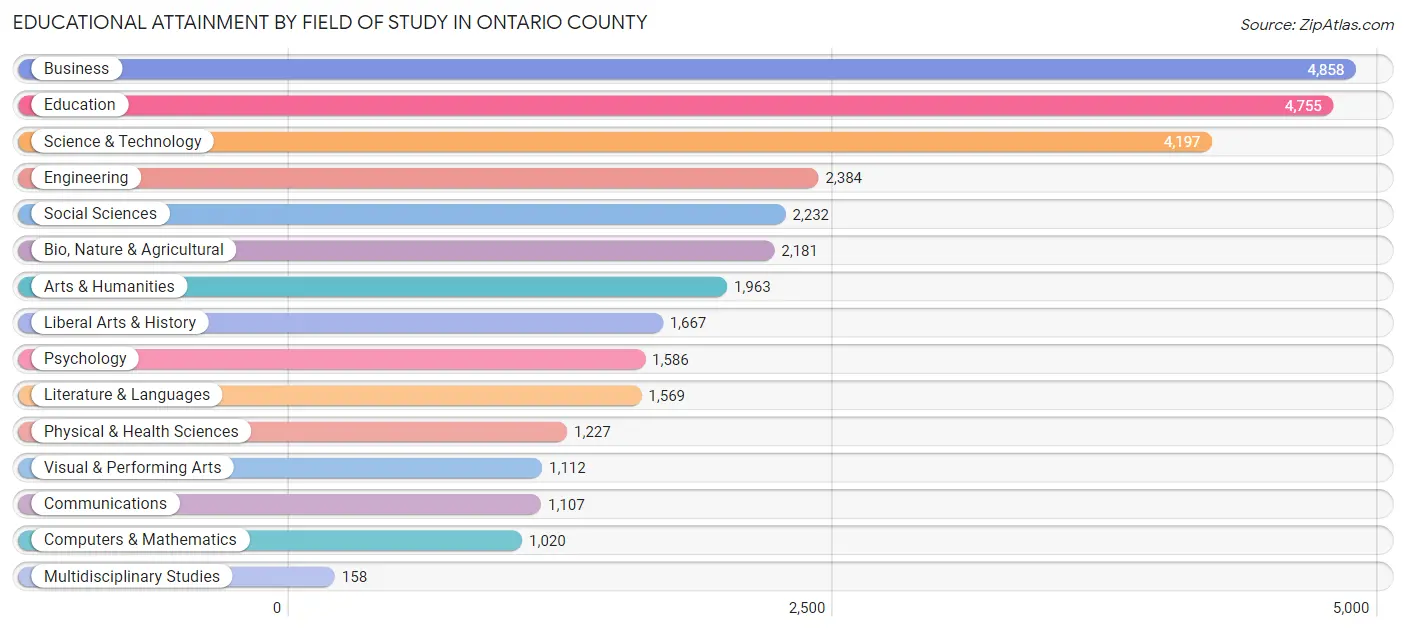
| Field of Study | # Graduates | % Graduates |
| Computers & Mathematics | 1,020 | 3.2% |
| Bio, Nature & Agricultural | 2,181 | 6.8% |
| Physical & Health Sciences | 1,227 | 3.8% |
| Psychology | 1,586 | 5.0% |
| Social Sciences | 2,232 | 7.0% |
| Engineering | 2,384 | 7.4% |
| Multidisciplinary Studies | 158 | 0.5% |
| Science & Technology | 4,197 | 13.1% |
| Business | 4,858 | 15.2% |
| Education | 4,755 | 14.8% |
| Literature & Languages | 1,569 | 4.9% |
| Liberal Arts & History | 1,667 | 5.2% |
| Visual & Performing Arts | 1,112 | 3.5% |
| Communications | 1,107 | 3.5% |
| Arts & Humanities | 1,963 | 6.1% |
| Total | 32,016 | 100.0% |
Transportation & Commute in Ontario County
Vehicle Availability by Sex in Ontario County
The most prevalent vehicle ownership categories in Ontario County are males with 2 vehicles (13,384, accounting for 47.3%) and females with 2 vehicles (12,257, making up 52.9%).
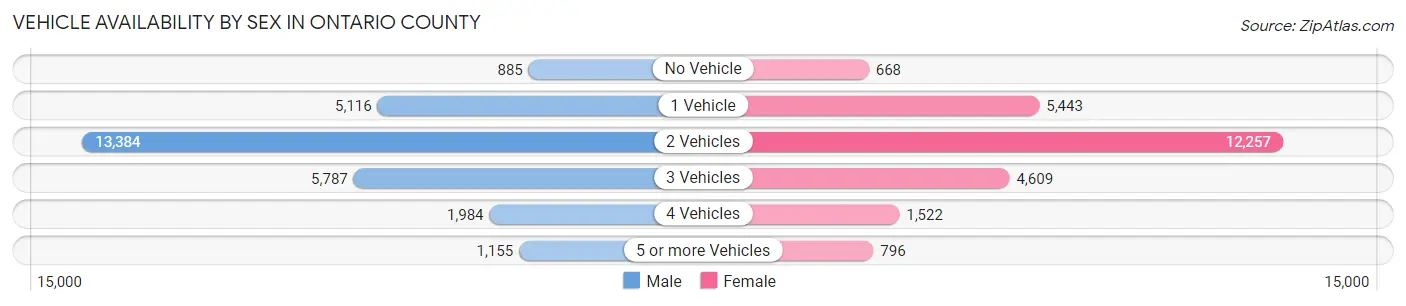
| Vehicles Available | Male | Female |
| No Vehicle | 885 (3.1%) | 668 (2.6%) |
| 1 Vehicle | 5,116 (18.1%) | 5,443 (21.5%) |
| 2 Vehicles | 13,384 (47.3%) | 12,257 (48.5%) |
| 3 Vehicles | 5,787 (20.4%) | 4,609 (18.2%) |
| 4 Vehicles | 1,984 (7.0%) | 1,522 (6.0%) |
| 5 or more Vehicles | 1,155 (4.1%) | 796 (3.2%) |
| Total | 28,311 (100.0%) | 25,295 (100.0%) |
Commute Time in Ontario County
The most frequently occuring commute durations in Ontario County are 5 to 9 minutes (7,172 commuters, 14.7%), 20 to 24 minutes (6,677 commuters, 13.7%), and 10 to 14 minutes (6,614 commuters, 13.5%).
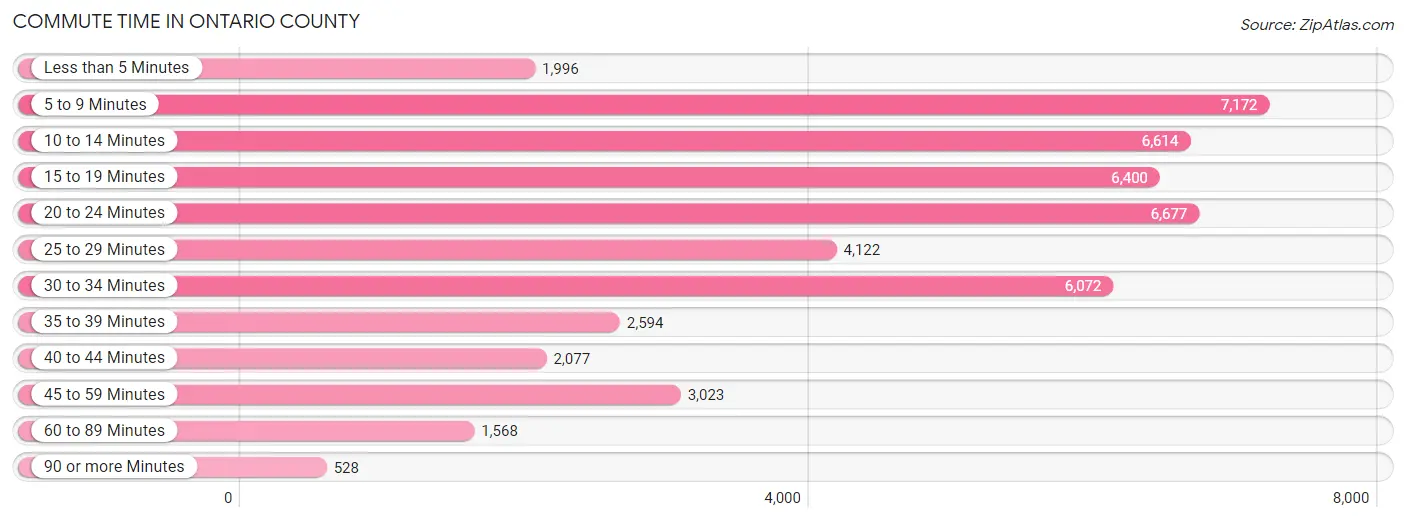
| Commute Time | # Commuters | % Commuters |
| Less than 5 Minutes | 1,996 | 4.1% |
| 5 to 9 Minutes | 7,172 | 14.7% |
| 10 to 14 Minutes | 6,614 | 13.5% |
| 15 to 19 Minutes | 6,400 | 13.1% |
| 20 to 24 Minutes | 6,677 | 13.7% |
| 25 to 29 Minutes | 4,122 | 8.4% |
| 30 to 34 Minutes | 6,072 | 12.4% |
| 35 to 39 Minutes | 2,594 | 5.3% |
| 40 to 44 Minutes | 2,077 | 4.3% |
| 45 to 59 Minutes | 3,023 | 6.2% |
| 60 to 89 Minutes | 1,568 | 3.2% |
| 90 or more Minutes | 528 | 1.1% |
Commute Time by Sex in Ontario County
The most common commute times in Ontario County are 30 to 34 minutes (3,518 commuters, 13.6%) for males and 5 to 9 minutes (3,743 commuters, 16.3%) for females.
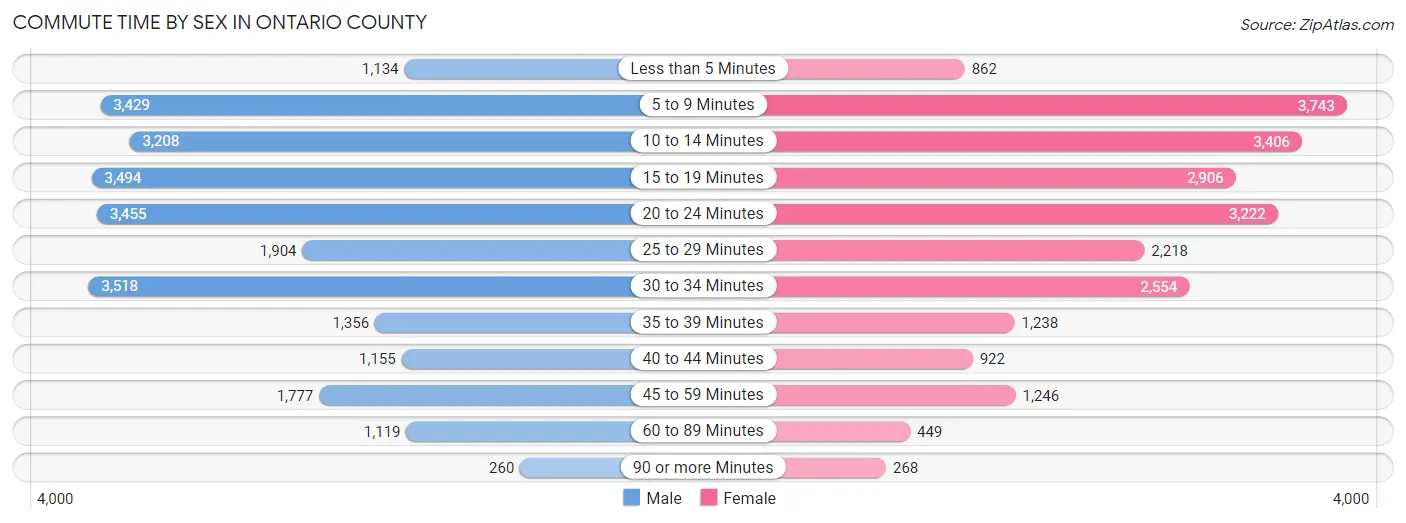
| Commute Time | Male | Female |
| Less than 5 Minutes | 1,134 (4.4%) | 862 (3.7%) |
| 5 to 9 Minutes | 3,429 (13.3%) | 3,743 (16.3%) |
| 10 to 14 Minutes | 3,208 (12.4%) | 3,406 (14.8%) |
| 15 to 19 Minutes | 3,494 (13.5%) | 2,906 (12.6%) |
| 20 to 24 Minutes | 3,455 (13.4%) | 3,222 (14.0%) |
| 25 to 29 Minutes | 1,904 (7.4%) | 2,218 (9.6%) |
| 30 to 34 Minutes | 3,518 (13.6%) | 2,554 (11.1%) |
| 35 to 39 Minutes | 1,356 (5.2%) | 1,238 (5.4%) |
| 40 to 44 Minutes | 1,155 (4.5%) | 922 (4.0%) |
| 45 to 59 Minutes | 1,777 (6.9%) | 1,246 (5.4%) |
| 60 to 89 Minutes | 1,119 (4.3%) | 449 (1.9%) |
| 90 or more Minutes | 260 (1.0%) | 268 (1.2%) |
Time of Departure to Work by Sex in Ontario County
The most frequent times of departure to work in Ontario County are 7:00 AM to 7:29 AM (3,972, 15.4%) for males and 7:00 AM to 7:29 AM (3,830, 16.6%) for females.
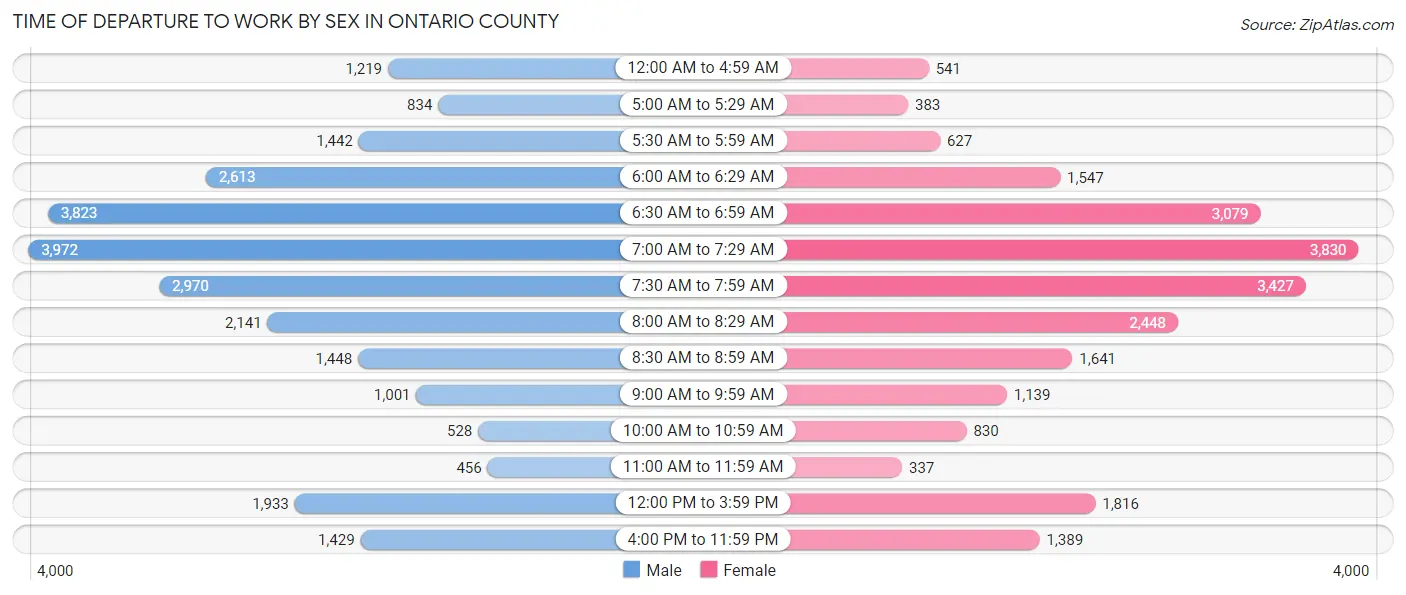
| Time of Departure | Male | Female |
| 12:00 AM to 4:59 AM | 1,219 (4.7%) | 541 (2.4%) |
| 5:00 AM to 5:29 AM | 834 (3.2%) | 383 (1.7%) |
| 5:30 AM to 5:59 AM | 1,442 (5.6%) | 627 (2.7%) |
| 6:00 AM to 6:29 AM | 2,613 (10.1%) | 1,547 (6.7%) |
| 6:30 AM to 6:59 AM | 3,823 (14.8%) | 3,079 (13.4%) |
| 7:00 AM to 7:29 AM | 3,972 (15.4%) | 3,830 (16.6%) |
| 7:30 AM to 7:59 AM | 2,970 (11.5%) | 3,427 (14.9%) |
| 8:00 AM to 8:29 AM | 2,141 (8.3%) | 2,448 (10.6%) |
| 8:30 AM to 8:59 AM | 1,448 (5.6%) | 1,641 (7.1%) |
| 9:00 AM to 9:59 AM | 1,001 (3.9%) | 1,139 (4.9%) |
| 10:00 AM to 10:59 AM | 528 (2.1%) | 830 (3.6%) |
| 11:00 AM to 11:59 AM | 456 (1.8%) | 337 (1.5%) |
| 12:00 PM to 3:59 PM | 1,933 (7.5%) | 1,816 (7.9%) |
| 4:00 PM to 11:59 PM | 1,429 (5.5%) | 1,389 (6.0%) |
| Total | 25,809 (100.0%) | 23,034 (100.0%) |
Housing Occupancy in Ontario County
Occupancy by Ownership in Ontario County
Of the total 47,080 dwellings in Ontario County, owner-occupied units account for 34,133 (72.5%), while renter-occupied units make up 12,947 (27.5%).
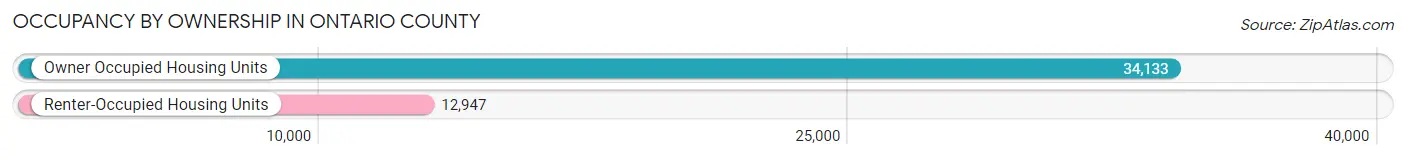
| Occupancy | # Housing Units | % Housing Units |
| Owner Occupied Housing Units | 34,133 | 72.5% |
| Renter-Occupied Housing Units | 12,947 | 27.5% |
| Total Occupied Housing Units | 47,080 | 100.0% |
Occupancy by Household Size in Ontario County
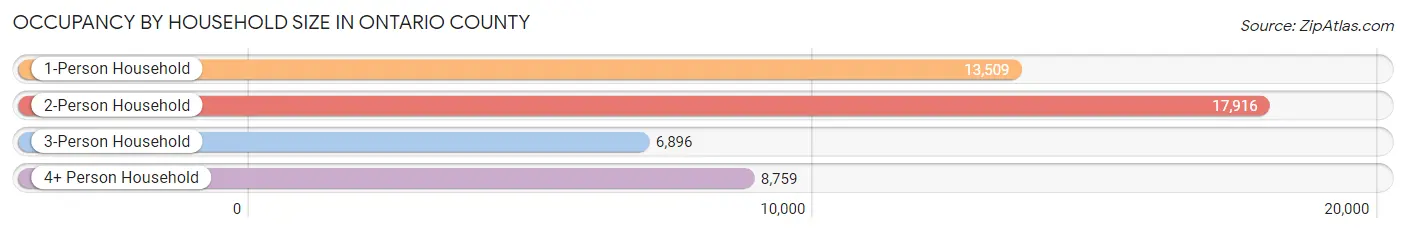
| Household Size | # Housing Units | % Housing Units |
| 1-Person Household | 13,509 | 28.7% |
| 2-Person Household | 17,916 | 38.1% |
| 3-Person Household | 6,896 | 14.6% |
| 4+ Person Household | 8,759 | 18.6% |
| Total Housing Units | 47,080 | 100.0% |
Occupancy by Ownership by Household Size in Ontario County
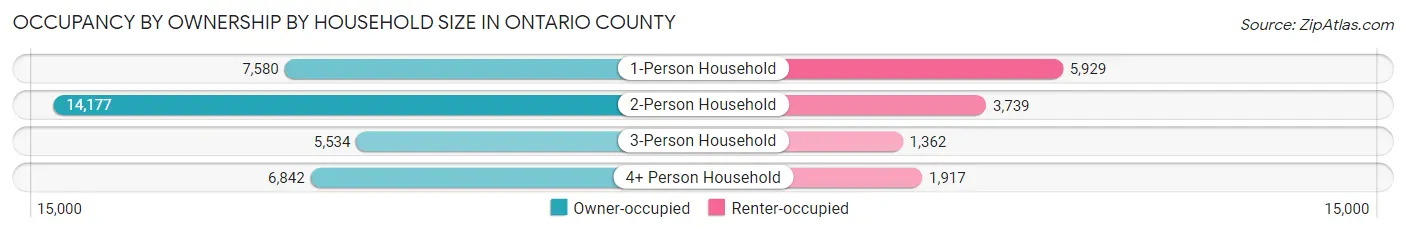
| Household Size | Owner-occupied | Renter-occupied |
| 1-Person Household | 7,580 (56.1%) | 5,929 (43.9%) |
| 2-Person Household | 14,177 (79.1%) | 3,739 (20.9%) |
| 3-Person Household | 5,534 (80.2%) | 1,362 (19.8%) |
| 4+ Person Household | 6,842 (78.1%) | 1,917 (21.9%) |
| Total Housing Units | 34,133 (72.5%) | 12,947 (27.5%) |
Occupancy by Educational Attainment in Ontario County
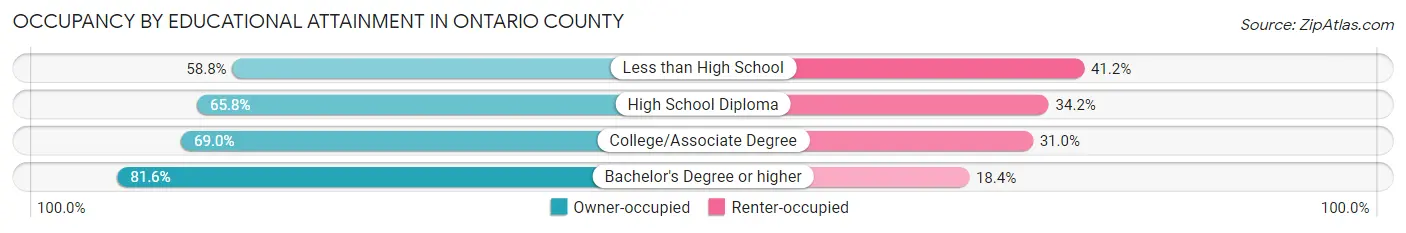
| Household Size | Owner-occupied | Renter-occupied |
| Less than High School | 1,357 (58.8%) | 951 (41.2%) |
| High School Diploma | 7,645 (65.8%) | 3,974 (34.2%) |
| College/Associate Degree | 10,486 (69.0%) | 4,719 (31.0%) |
| Bachelor's Degree or higher | 14,645 (81.6%) | 3,303 (18.4%) |
Occupancy by Age of Householder in Ontario County
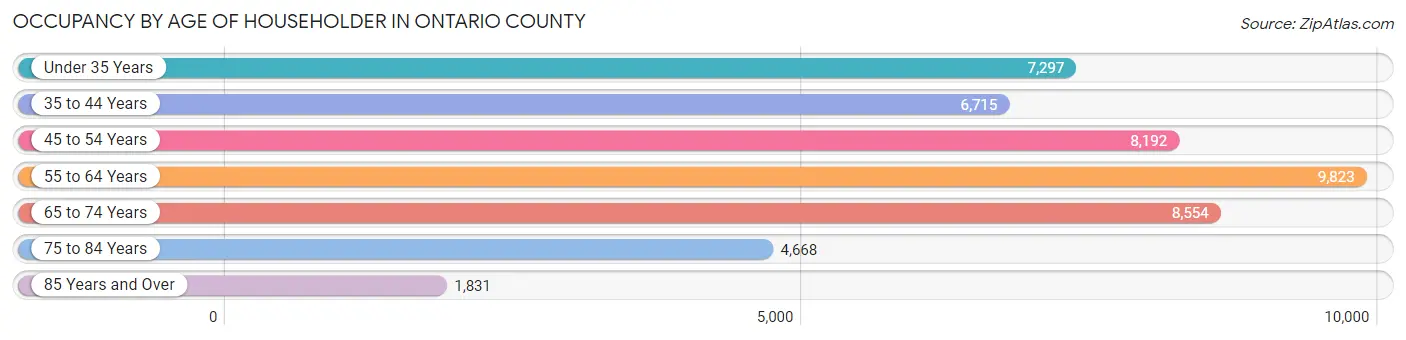
| Age Bracket | # Households | % Households |
| Under 35 Years | 7,297 | 15.5% |
| 35 to 44 Years | 6,715 | 14.3% |
| 45 to 54 Years | 8,192 | 17.4% |
| 55 to 64 Years | 9,823 | 20.9% |
| 65 to 74 Years | 8,554 | 18.2% |
| 75 to 84 Years | 4,668 | 9.9% |
| 85 Years and Over | 1,831 | 3.9% |
| Total | 47,080 | 100.0% |
Housing Finances in Ontario County
Median Income by Occupancy in Ontario County
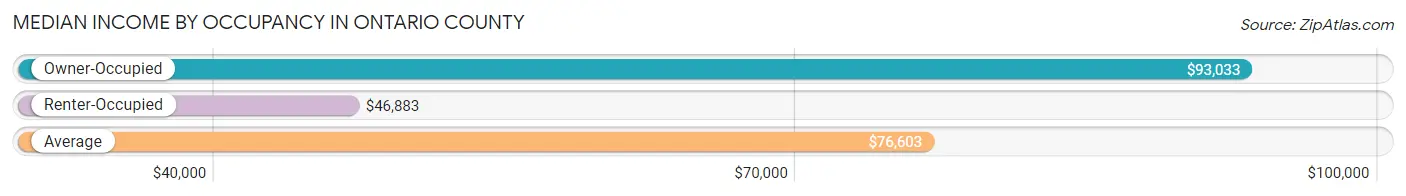
| Occupancy Type | # Households | Median Income |
| Owner-Occupied | 34,133 (72.5%) | $93,033 |
| Renter-Occupied | 12,947 (27.5%) | $46,883 |
| Average | 47,080 (100.0%) | $76,603 |
Occupancy by Householder Income Bracket in Ontario County
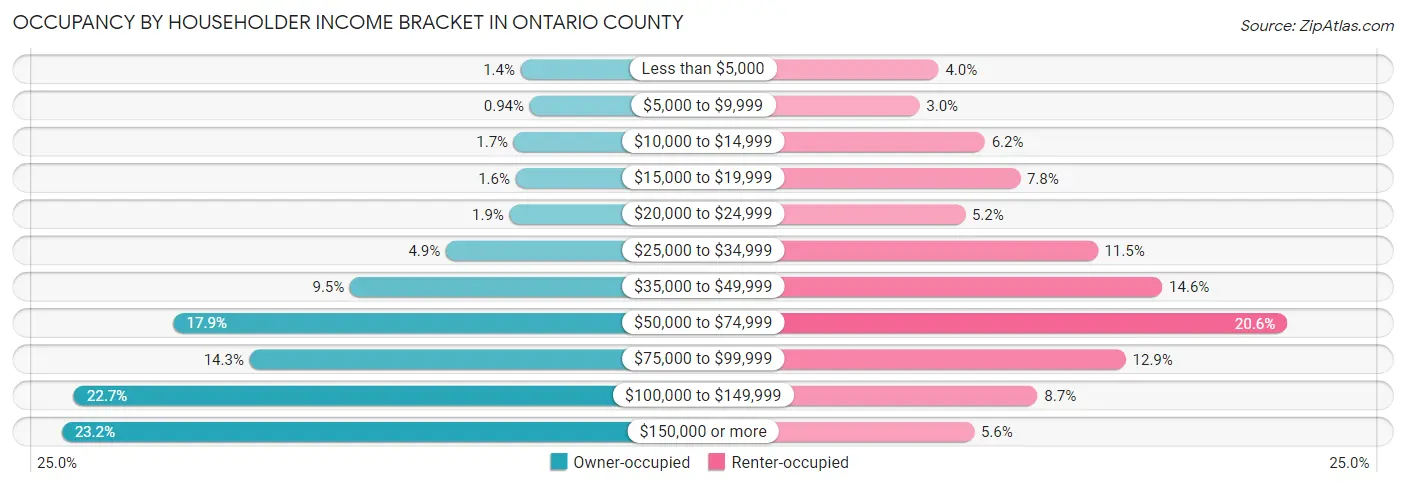
| Income Bracket | Owner-occupied | Renter-occupied |
| Less than $5,000 | 466 (1.4%) | 512 (4.0%) |
| $5,000 to $9,999 | 321 (0.9%) | 393 (3.0%) |
| $10,000 to $14,999 | 579 (1.7%) | 796 (6.1%) |
| $15,000 to $19,999 | 548 (1.6%) | 1,014 (7.8%) |
| $20,000 to $24,999 | 650 (1.9%) | 674 (5.2%) |
| $25,000 to $34,999 | 1,682 (4.9%) | 1,492 (11.5%) |
| $35,000 to $49,999 | 3,241 (9.5%) | 1,890 (14.6%) |
| $50,000 to $74,999 | 6,111 (17.9%) | 2,660 (20.5%) |
| $75,000 to $99,999 | 4,874 (14.3%) | 1,665 (12.9%) |
| $100,000 to $149,999 | 7,732 (22.7%) | 1,121 (8.7%) |
| $150,000 or more | 7,929 (23.2%) | 730 (5.6%) |
| Total | 34,133 (100.0%) | 12,947 (100.0%) |
Monthly Housing Cost Tiers in Ontario County
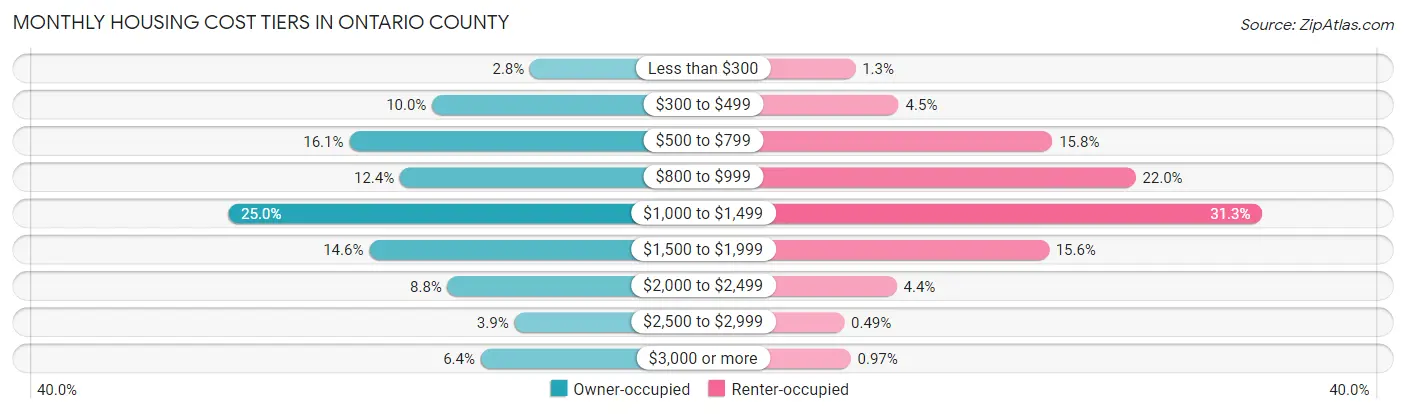
| Monthly Cost | Owner-occupied | Renter-occupied |
| Less than $300 | 946 (2.8%) | 170 (1.3%) |
| $300 to $499 | 3,406 (10.0%) | 584 (4.5%) |
| $500 to $799 | 5,493 (16.1%) | 2,048 (15.8%) |
| $800 to $999 | 4,215 (12.3%) | 2,842 (22.0%) |
| $1,000 to $1,499 | 8,538 (25.0%) | 4,051 (31.3%) |
| $1,500 to $1,999 | 4,991 (14.6%) | 2,015 (15.6%) |
| $2,000 to $2,499 | 3,019 (8.8%) | 564 (4.4%) |
| $2,500 to $2,999 | 1,339 (3.9%) | 64 (0.5%) |
| $3,000 or more | 2,186 (6.4%) | 126 (1.0%) |
| Total | 34,133 (100.0%) | 12,947 (100.0%) |
Physical Housing Characteristics in Ontario County
Housing Structures in Ontario County
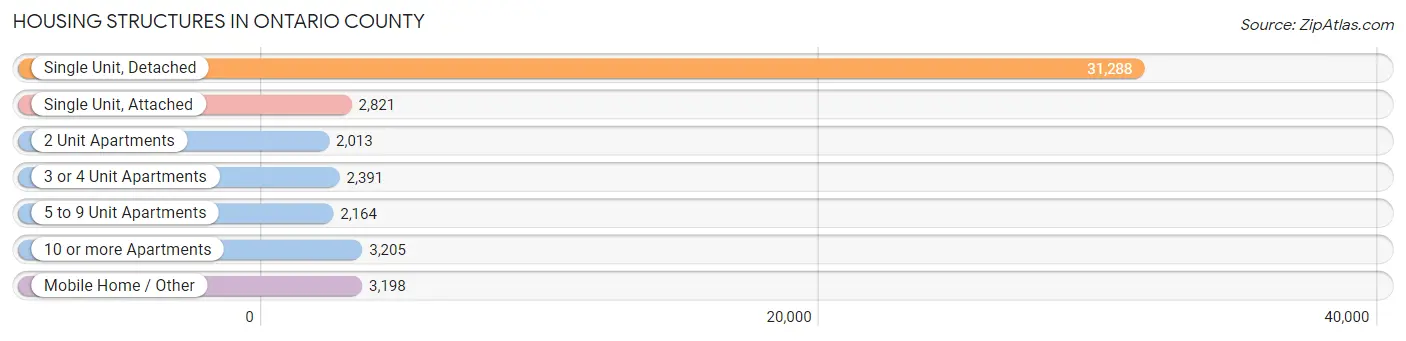
| Structure Type | # Housing Units | % Housing Units |
| Single Unit, Detached | 31,288 | 66.5% |
| Single Unit, Attached | 2,821 | 6.0% |
| 2 Unit Apartments | 2,013 | 4.3% |
| 3 or 4 Unit Apartments | 2,391 | 5.1% |
| 5 to 9 Unit Apartments | 2,164 | 4.6% |
| 10 or more Apartments | 3,205 | 6.8% |
| Mobile Home / Other | 3,198 | 6.8% |
| Total | 47,080 | 100.0% |
Housing Structures by Occupancy in Ontario County
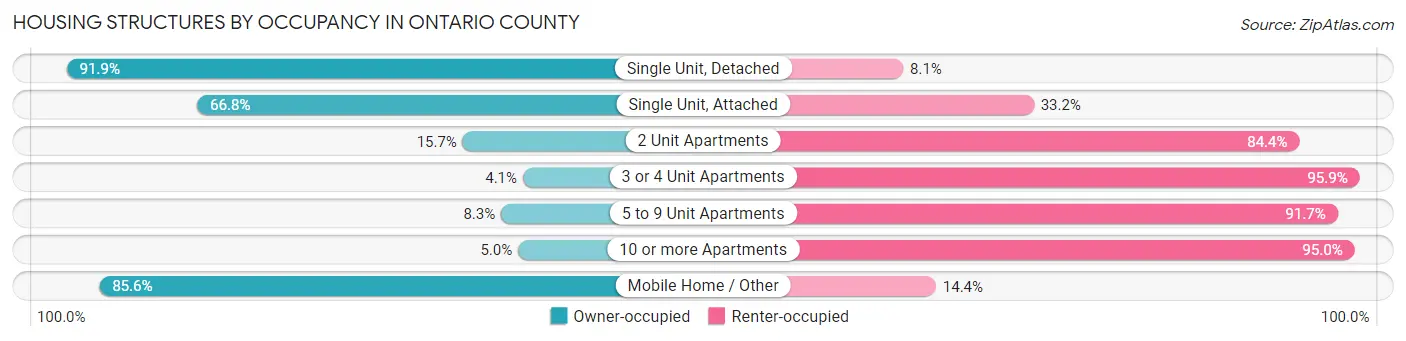
| Structure Type | Owner-occupied | Renter-occupied |
| Single Unit, Detached | 28,760 (91.9%) | 2,528 (8.1%) |
| Single Unit, Attached | 1,884 (66.8%) | 937 (33.2%) |
| 2 Unit Apartments | 315 (15.7%) | 1,698 (84.4%) |
| 3 or 4 Unit Apartments | 97 (4.1%) | 2,294 (95.9%) |
| 5 to 9 Unit Apartments | 179 (8.3%) | 1,985 (91.7%) |
| 10 or more Apartments | 160 (5.0%) | 3,045 (95.0%) |
| Mobile Home / Other | 2,738 (85.6%) | 460 (14.4%) |
| Total | 34,133 (72.5%) | 12,947 (27.5%) |
Housing Structures by Number of Rooms in Ontario County
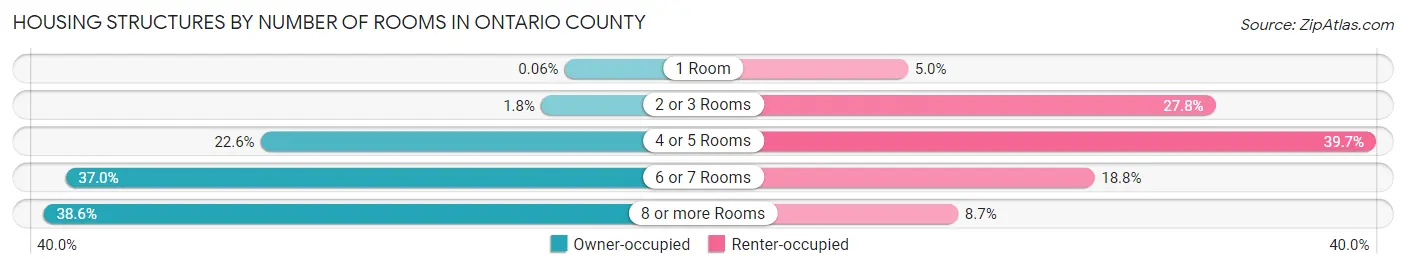
| Number of Rooms | Owner-occupied | Renter-occupied |
| 1 Room | 22 (0.1%) | 650 (5.0%) |
| 2 or 3 Rooms | 617 (1.8%) | 3,597 (27.8%) |
| 4 or 5 Rooms | 7,696 (22.6%) | 5,134 (39.7%) |
| 6 or 7 Rooms | 12,624 (37.0%) | 2,436 (18.8%) |
| 8 or more Rooms | 13,174 (38.6%) | 1,130 (8.7%) |
| Total | 34,133 (100.0%) | 12,947 (100.0%) |
Housing Structure by Heating Type in Ontario County
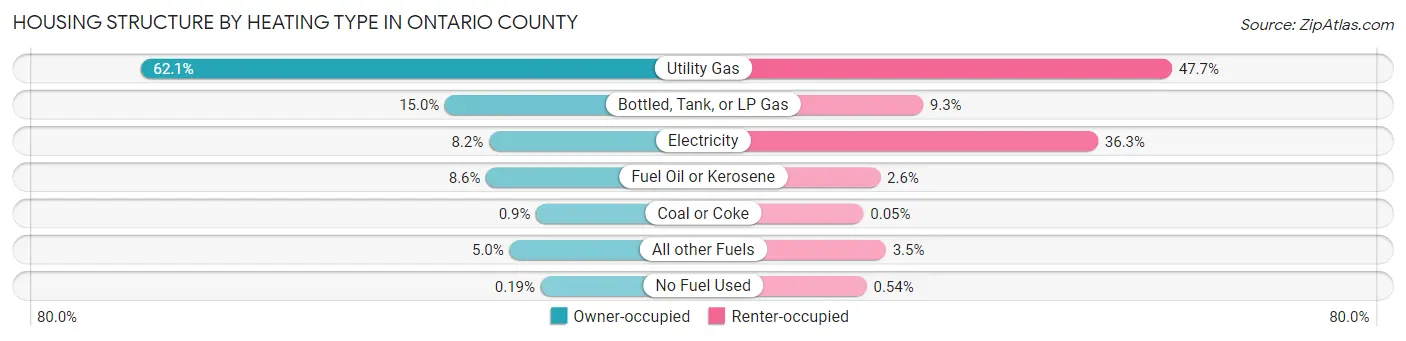
| Heating Type | Owner-occupied | Renter-occupied |
| Utility Gas | 21,197 (62.1%) | 6,179 (47.7%) |
| Bottled, Tank, or LP Gas | 5,112 (15.0%) | 1,198 (9.2%) |
| Electricity | 2,799 (8.2%) | 4,700 (36.3%) |
| Fuel Oil or Kerosene | 2,942 (8.6%) | 340 (2.6%) |
| Coal or Coke | 307 (0.9%) | 6 (0.1%) |
| All other Fuels | 1,712 (5.0%) | 454 (3.5%) |
| No Fuel Used | 64 (0.2%) | 70 (0.5%) |
| Total | 34,133 (100.0%) | 12,947 (100.0%) |
Household Vehicle Usage in Ontario County
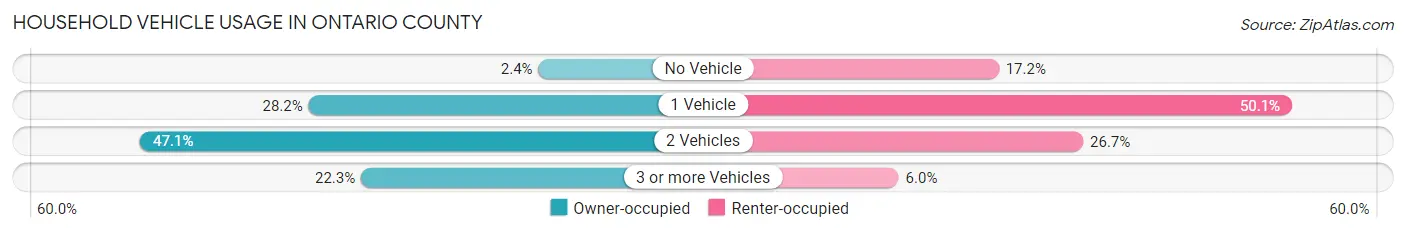
| Vehicles per Household | Owner-occupied | Renter-occupied |
| No Vehicle | 833 (2.4%) | 2,231 (17.2%) |
| 1 Vehicle | 9,623 (28.2%) | 6,482 (50.1%) |
| 2 Vehicles | 16,062 (47.1%) | 3,454 (26.7%) |
| 3 or more Vehicles | 7,615 (22.3%) | 780 (6.0%) |
| Total | 34,133 (100.0%) | 12,947 (100.0%) |
Real Estate & Mortgages in Ontario County
Real Estate and Mortgage Overview in Ontario County
| Characteristic | Without Mortgage | With Mortgage |
| Housing Units | 14,097 | 20,036 |
| Median Property Value | $172,500 | $205,900 |
| Median Household Income | $69,794 | $5,949 |
| Monthly Housing Costs | $674 | $2,103 |
| Real Estate Taxes | $3,830 | $488 |
Property Value by Mortgage Status in Ontario County
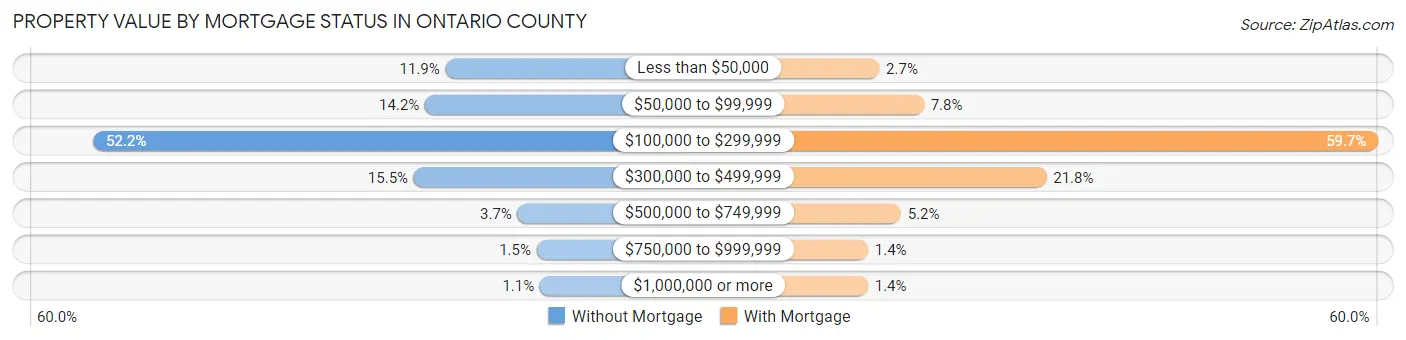
| Property Value | Without Mortgage | With Mortgage |
| Less than $50,000 | 1,676 (11.9%) | 541 (2.7%) |
| $50,000 to $99,999 | 2,004 (14.2%) | 1,561 (7.8%) |
| $100,000 to $299,999 | 7,356 (52.2%) | 11,967 (59.7%) |
| $300,000 to $499,999 | 2,187 (15.5%) | 4,368 (21.8%) |
| $500,000 to $749,999 | 515 (3.6%) | 1,035 (5.2%) |
| $750,000 to $999,999 | 206 (1.5%) | 283 (1.4%) |
| $1,000,000 or more | 153 (1.1%) | 281 (1.4%) |
| Total | 14,097 (100.0%) | 20,036 (100.0%) |
Household Income by Mortgage Status in Ontario County
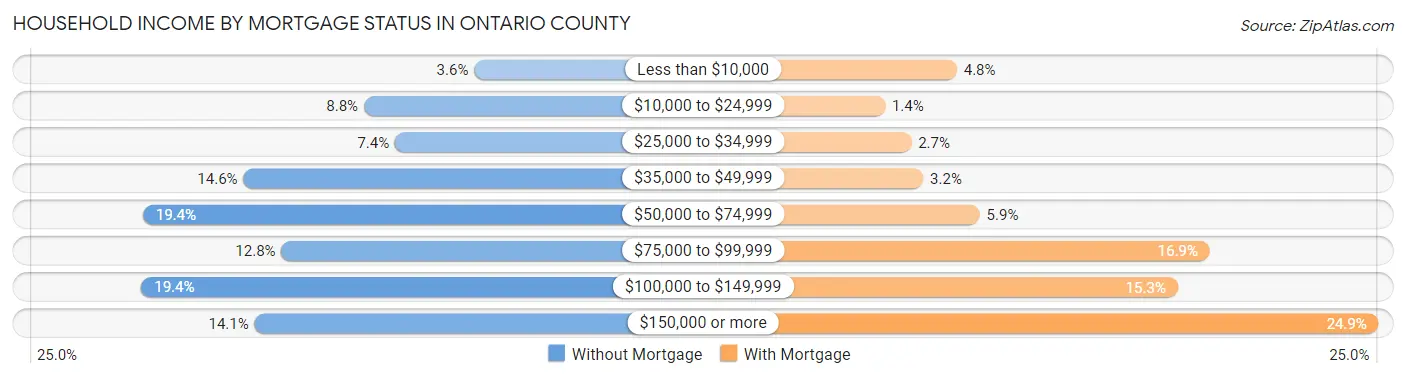
| Household Income | Without Mortgage | With Mortgage |
| Less than $10,000 | 506 (3.6%) | 965 (4.8%) |
| $10,000 to $24,999 | 1,246 (8.8%) | 281 (1.4%) |
| $25,000 to $34,999 | 1,037 (7.4%) | 531 (2.6%) |
| $35,000 to $49,999 | 2,056 (14.6%) | 645 (3.2%) |
| $50,000 to $74,999 | 2,731 (19.4%) | 1,185 (5.9%) |
| $75,000 to $99,999 | 1,800 (12.8%) | 3,380 (16.9%) |
| $100,000 to $149,999 | 2,741 (19.4%) | 3,074 (15.3%) |
| $150,000 or more | 1,980 (14.1%) | 4,991 (24.9%) |
| Total | 14,097 (100.0%) | 20,036 (100.0%) |
Property Value to Household Income Ratio in Ontario County
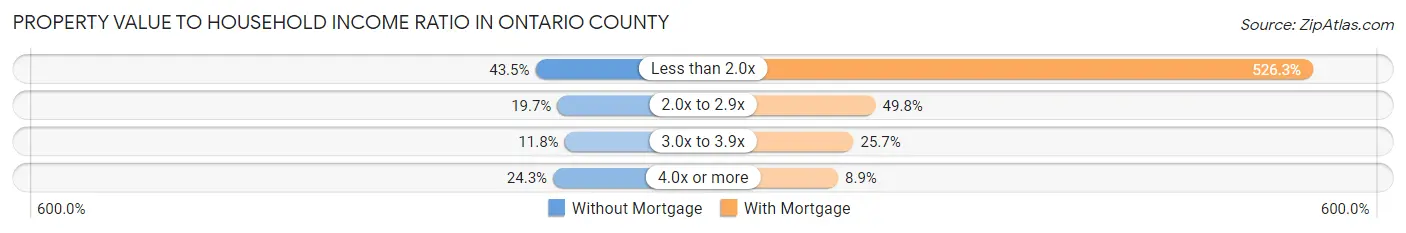
| Value-to-Income Ratio | Without Mortgage | With Mortgage |
| Less than 2.0x | 6,130 (43.5%) | 105,446 (526.3%) |
| 2.0x to 2.9x | 2,772 (19.7%) | 9,985 (49.8%) |
| 3.0x to 3.9x | 1,662 (11.8%) | 5,154 (25.7%) |
| 4.0x or more | 3,431 (24.3%) | 1,783 (8.9%) |
| Total | 14,097 (100.0%) | 20,036 (100.0%) |
Real Estate Taxes by Mortgage Status in Ontario County
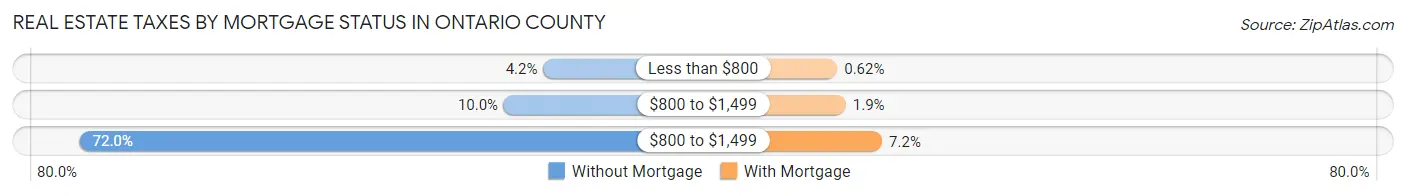
| Property Taxes | Without Mortgage | With Mortgage |
| Less than $800 | 593 (4.2%) | 125 (0.6%) |
| $800 to $1,499 | 1,404 (10.0%) | 374 (1.9%) |
| $800 to $1,499 | 10,144 (72.0%) | 1,438 (7.2%) |
| Total | 14,097 (100.0%) | 20,036 (100.0%) |
Health & Disability in Ontario County
Health Insurance Coverage by Age in Ontario County
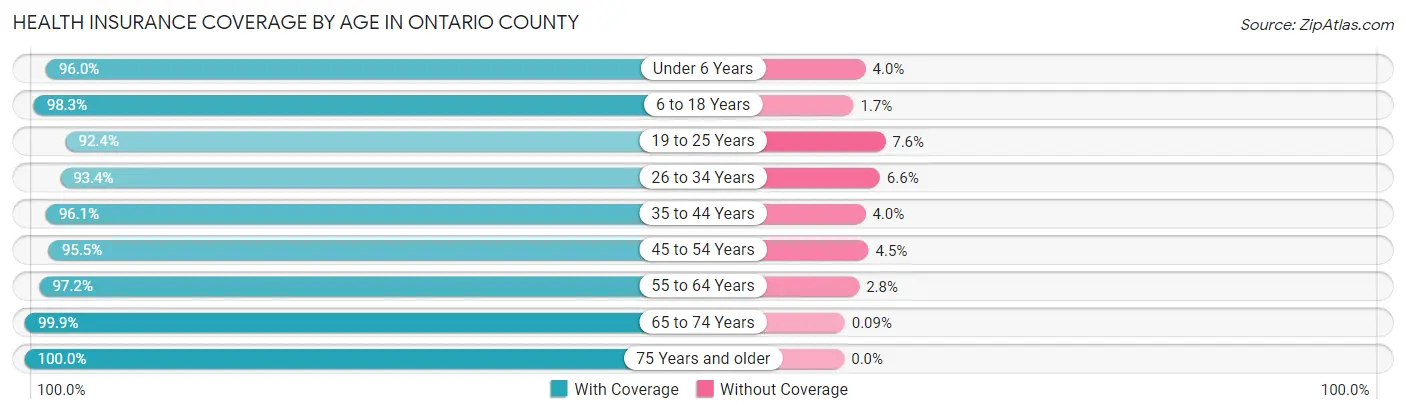
| Age Bracket | With Coverage | Without Coverage |
| Under 6 Years | 6,300 (96.0%) | 261 (4.0%) |
| 6 to 18 Years | 16,427 (98.3%) | 288 (1.7%) |
| 19 to 25 Years | 9,286 (92.4%) | 768 (7.6%) |
| 26 to 34 Years | 10,399 (93.4%) | 740 (6.6%) |
| 35 to 44 Years | 12,112 (96.1%) | 498 (4.0%) |
| 45 to 54 Years | 13,658 (95.5%) | 648 (4.5%) |
| 55 to 64 Years | 16,379 (97.2%) | 468 (2.8%) |
| 65 to 74 Years | 13,726 (99.9%) | 12 (0.1%) |
| 75 Years and older | 9,441 (100.0%) | 0 (0.0%) |
| Total | 107,728 (96.7%) | 3,683 (3.3%) |
Health Insurance Coverage by Citizenship Status in Ontario County
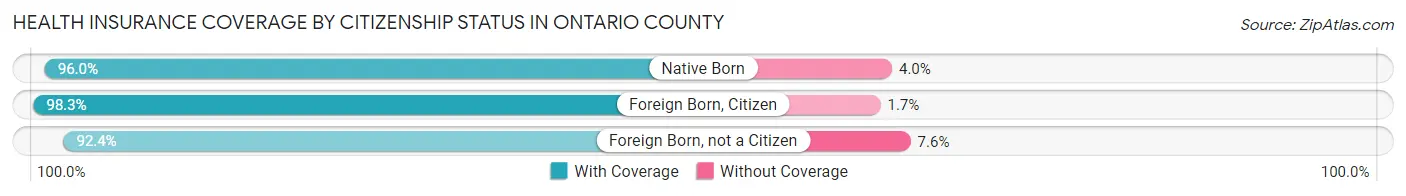
| Citizenship Status | With Coverage | Without Coverage |
| Native Born | 6,300 (96.0%) | 261 (4.0%) |
| Foreign Born, Citizen | 16,427 (98.3%) | 288 (1.7%) |
| Foreign Born, not a Citizen | 9,286 (92.4%) | 768 (7.6%) |
Health Insurance Coverage by Household Income in Ontario County
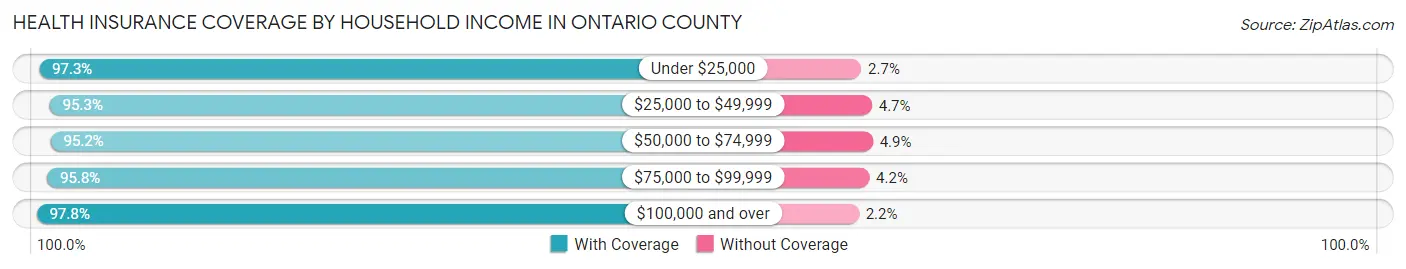
| Household Income | With Coverage | Without Coverage |
| Under $25,000 | 8,668 (97.3%) | 240 (2.7%) |
| $25,000 to $49,999 | 14,024 (95.3%) | 688 (4.7%) |
| $50,000 to $74,999 | 17,829 (95.2%) | 909 (4.9%) |
| $75,000 to $99,999 | 15,268 (95.8%) | 667 (4.2%) |
| $100,000 and over | 48,996 (97.8%) | 1,118 (2.2%) |
Public vs Private Health Insurance Coverage by Age in Ontario County
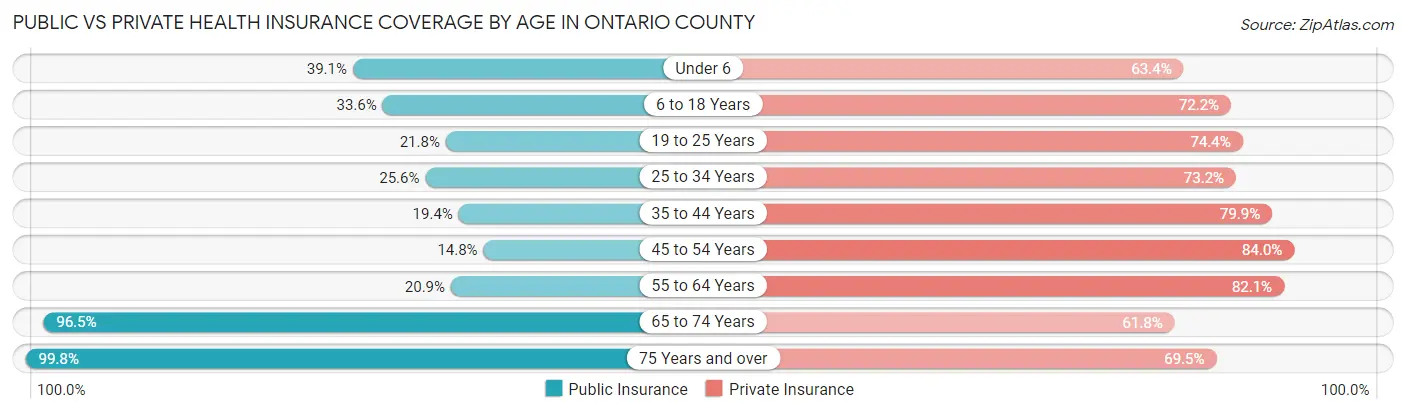
| Age Bracket | Public Insurance | Private Insurance |
| Under 6 | 2,564 (39.1%) | 4,161 (63.4%) |
| 6 to 18 Years | 5,609 (33.6%) | 12,074 (72.2%) |
| 19 to 25 Years | 2,195 (21.8%) | 7,479 (74.4%) |
| 25 to 34 Years | 2,854 (25.6%) | 8,148 (73.2%) |
| 35 to 44 Years | 2,450 (19.4%) | 10,069 (79.8%) |
| 45 to 54 Years | 2,121 (14.8%) | 12,011 (84.0%) |
| 55 to 64 Years | 3,517 (20.9%) | 13,824 (82.1%) |
| 65 to 74 Years | 13,260 (96.5%) | 8,488 (61.8%) |
| 75 Years and over | 9,424 (99.8%) | 6,562 (69.5%) |
| Total | 43,994 (39.5%) | 82,816 (74.3%) |
Disability Status by Sex by Age in Ontario County
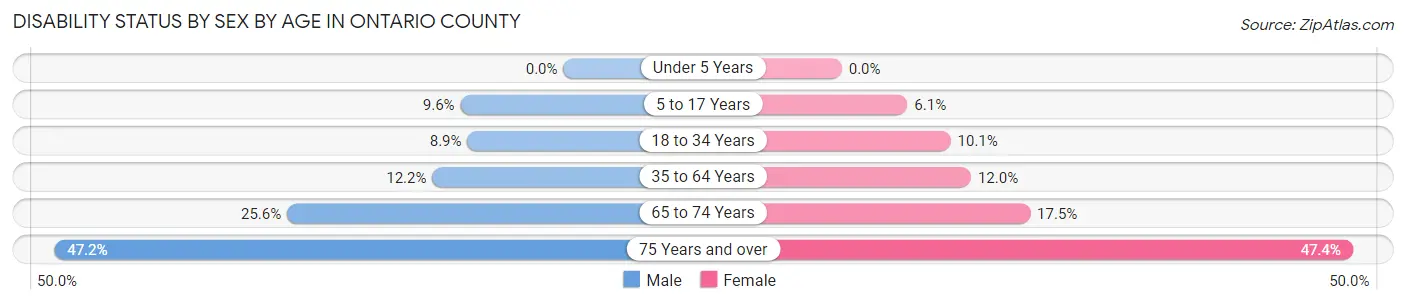
| Age Bracket | Male | Female |
| Under 5 Years | 0 (0.0%) | 0 (0.0%) |
| 5 to 17 Years | 820 (9.6%) | 491 (6.1%) |
| 18 to 34 Years | 1,025 (8.9%) | 1,120 (10.1%) |
| 35 to 64 Years | 2,638 (12.2%) | 2,647 (12.0%) |
| 65 to 74 Years | 1,680 (25.6%) | 1,256 (17.5%) |
| 75 Years and over | 1,851 (47.2%) | 2,619 (47.4%) |
Disability Class by Sex by Age in Ontario County
Disability Class: Hearing Difficulty
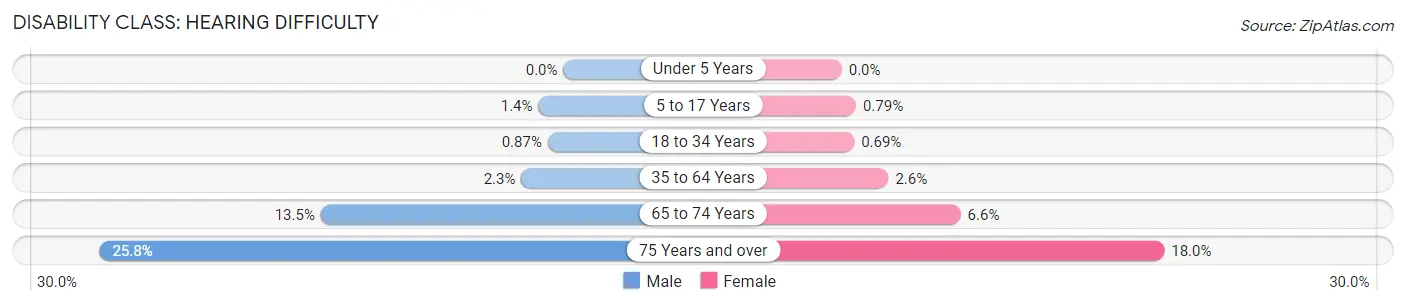
| Age Bracket | Male | Female |
| Under 5 Years | 0 (0.0%) | 0 (0.0%) |
| 5 to 17 Years | 119 (1.4%) | 64 (0.8%) |
| 18 to 34 Years | 100 (0.9%) | 77 (0.7%) |
| 35 to 64 Years | 507 (2.3%) | 575 (2.6%) |
| 65 to 74 Years | 885 (13.5%) | 476 (6.6%) |
| 75 Years and over | 1,012 (25.8%) | 992 (18.0%) |
Disability Class: Vision Difficulty
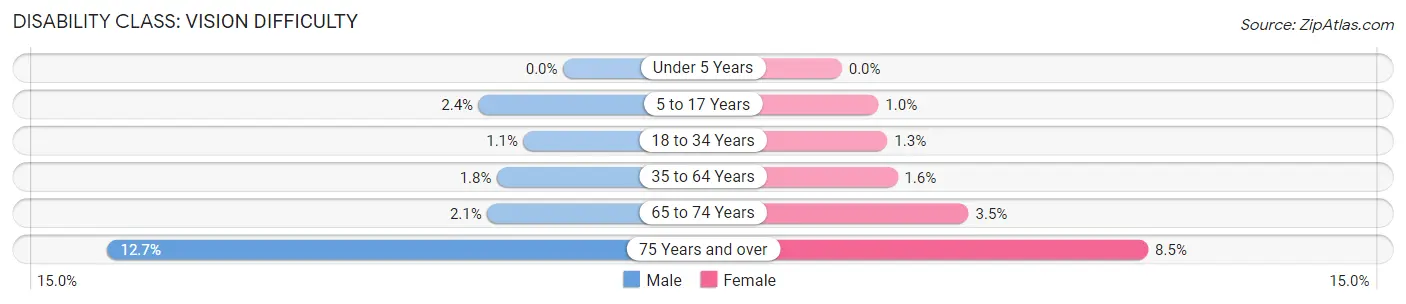
| Age Bracket | Male | Female |
| Under 5 Years | 0 (0.0%) | 0 (0.0%) |
| 5 to 17 Years | 202 (2.4%) | 82 (1.0%) |
| 18 to 34 Years | 127 (1.1%) | 141 (1.3%) |
| 35 to 64 Years | 398 (1.8%) | 342 (1.5%) |
| 65 to 74 Years | 138 (2.1%) | 254 (3.5%) |
| 75 Years and over | 497 (12.7%) | 471 (8.5%) |
Disability Class: Cognitive Difficulty
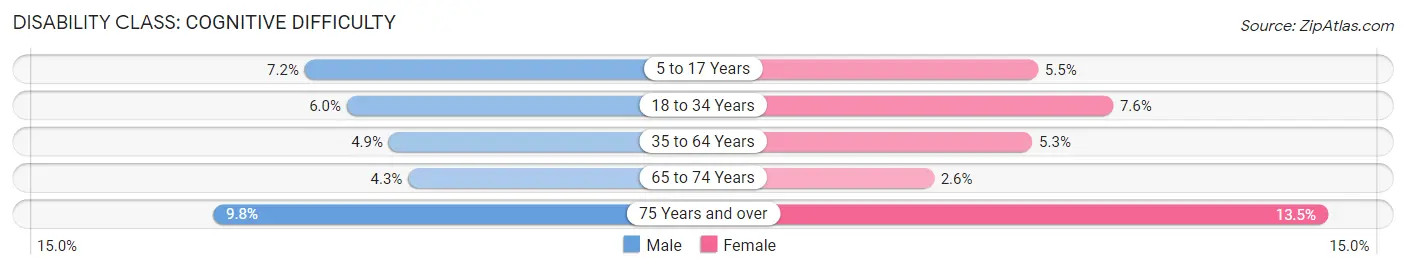
| Age Bracket | Male | Female |
| 5 to 17 Years | 618 (7.2%) | 440 (5.5%) |
| 18 to 34 Years | 694 (6.0%) | 837 (7.5%) |
| 35 to 64 Years | 1,055 (4.9%) | 1,169 (5.3%) |
| 65 to 74 Years | 283 (4.3%) | 184 (2.6%) |
| 75 Years and over | 382 (9.8%) | 747 (13.5%) |
Disability Class: Ambulatory Difficulty
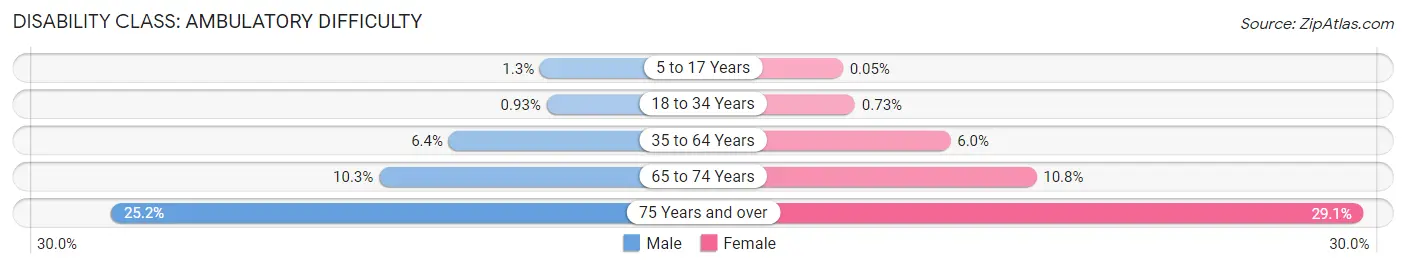
| Age Bracket | Male | Female |
| 5 to 17 Years | 112 (1.3%) | 4 (0.1%) |
| 18 to 34 Years | 107 (0.9%) | 81 (0.7%) |
| 35 to 64 Years | 1,384 (6.4%) | 1,333 (6.0%) |
| 65 to 74 Years | 672 (10.3%) | 778 (10.8%) |
| 75 Years and over | 987 (25.2%) | 1,605 (29.1%) |
Disability Class: Self-Care Difficulty
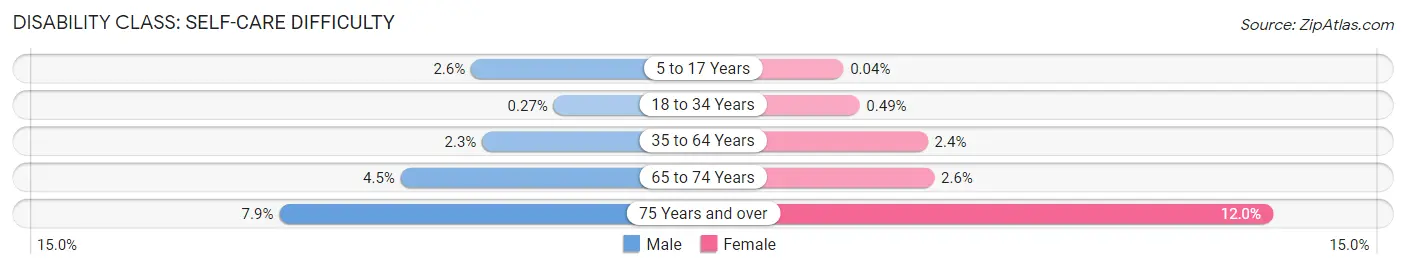
| Age Bracket | Male | Female |
| 5 to 17 Years | 221 (2.6%) | 3 (0.0%) |
| 18 to 34 Years | 31 (0.3%) | 54 (0.5%) |
| 35 to 64 Years | 491 (2.3%) | 528 (2.4%) |
| 65 to 74 Years | 297 (4.5%) | 185 (2.6%) |
| 75 Years and over | 310 (7.9%) | 663 (12.0%) |
Technology Access in Ontario County
Computing Device Access in Ontario County
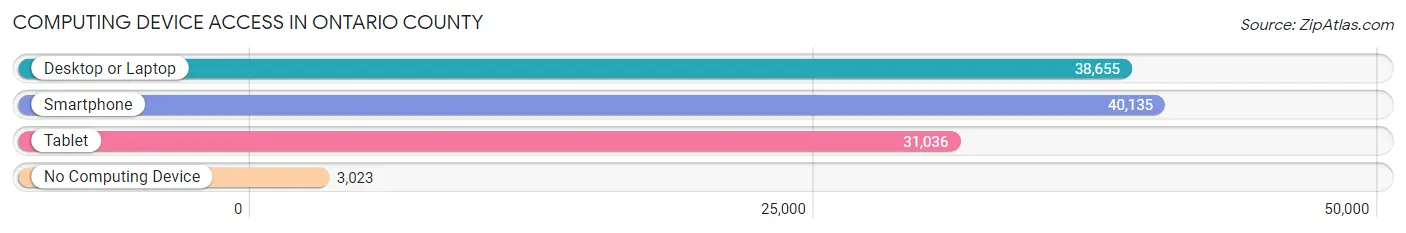
| Device Type | # Households | % Households |
| Desktop or Laptop | 38,655 | 82.1% |
| Smartphone | 40,135 | 85.3% |
| Tablet | 31,036 | 65.9% |
| No Computing Device | 3,023 | 6.4% |
| Total | 47,080 | 100.0% |
Internet Access in Ontario County
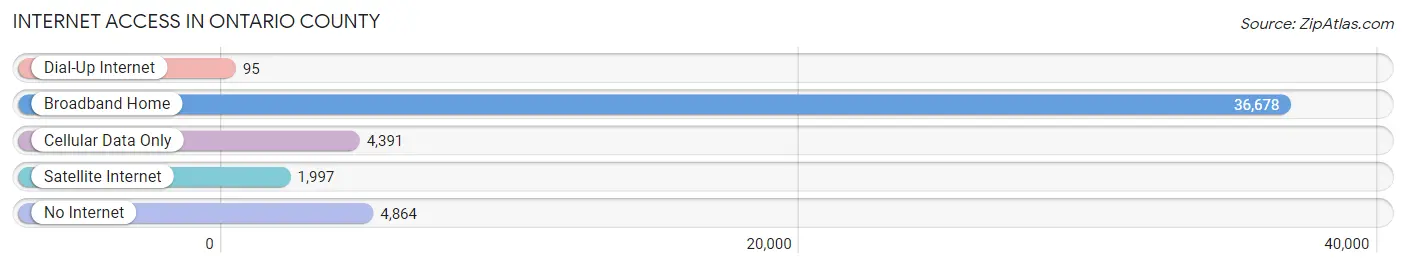
| Internet Type | # Households | % Households |
| Dial-Up Internet | 95 | 0.2% |
| Broadband Home | 36,678 | 77.9% |
| Cellular Data Only | 4,391 | 9.3% |
| Satellite Internet | 1,997 | 4.2% |
| No Internet | 4,864 | 10.3% |
| Total | 47,080 | 100.0% |
Ontario County Summary
Ontario County is located in the Finger Lakes region of New York State. It is bordered by Seneca, Yates, Wayne, Monroe, Livingston, and Steuben counties. The county seat is Canandaigua. The county was established in 1789 and is named after the Great Lake of the same name.
Geography
Ontario County is located in the Finger Lakes region of New York State. It is bordered by Seneca, Yates, Wayne, Monroe, Livingston, and Steuben counties. The county has a total area of 519 square miles, of which 517 square miles is land and 2 square miles is water. The highest point in the county is at the summit of Bristol Mountain, which has an elevation of 2,064 feet. The county is home to several lakes, including Canandaigua Lake, Honeoye Lake, and Seneca Lake.
Economy
Ontario County has a diverse economy, with a mix of agriculture, manufacturing, and tourism. Agriculture is the largest sector of the economy, with dairy farming and fruit production being the most important. Manufacturing is also an important part of the economy, with companies such as Constellation Brands, Wegmans, and Xerox having a presence in the county. Tourism is also an important part of the economy, with the Finger Lakes region being a popular destination for visitors.
Demographics
As of the 2010 census, the population of Ontario County was 107,931. The population is spread out, with the largest city being Canandaigua, which has a population of 10,545. The racial makeup of the county is 94.3% White, 2.3% African American, 0.5% Native American, 1.2% Asian, 0.1% Pacific Islander, 0.7% from other races, and 1.0% from two or more races. The median household income in the county is $51,945, and the median family income is $62,917.
Conclusion
Ontario County is a diverse and vibrant county located in the Finger Lakes region of New York State. It is home to a mix of agriculture, manufacturing, and tourism, and has a population of 107,931. The county is home to several lakes, including Canandaigua Lake, Honeoye Lake, and Seneca Lake. The median household income in the county is $51,945, and the median family income is $62,917. Ontario County is a great place to live, work, and visit.
Common Questions
What is Per Capita Income in Ontario County?
Per Capita income in Ontario County is $43,046.
What is the Median Family Income in Ontario County?
Median Family Income in Ontario County is $97,331.
What is the Median Household income in Ontario County?
Median Household Income in Ontario County is $76,603.
What is Income or Wage Gap in Ontario County?
Income or Wage Gap in Ontario County is 27.1%.
Women in Ontario County earn 72.9 cents for every dollar earned by a man.
What is Family Income Deficit in Ontario County?
Family Income Deficit in Ontario County is $10,810.
Families that are below poverty line in Ontario County earn $10,810 less on average than the poverty threshold level.
What is Inequality or Gini Index in Ontario County?
Inequality or Gini Index in Ontario County is 0.44.
What is the Total Population of Ontario County?
Total Population of Ontario County is 112,288.
What is the Total Male Population of Ontario County?
Total Male Population of Ontario County is 55,283.
What is the Total Female Population of Ontario County?
Total Female Population of Ontario County is 57,005.
What is the Ratio of Males per 100 Females in Ontario County?
There are 96.98 Males per 100 Females in Ontario County.
What is the Ratio of Females per 100 Males in Ontario County?
There are 103.11 Females per 100 Males in Ontario County.
What is the Median Population Age in Ontario County?
Median Population Age in Ontario County is 43.8 Years.
What is the Average Family Size in Ontario County
Average Family Size in Ontario County is 2.8 People.
What is the Average Household Size in Ontario County
Average Household Size in Ontario County is 2.3 People.
How Large is the Labor Force in Ontario County?
There are 57,631 People in the Labor Forcein in Ontario County.
What is the Percentage of People in the Labor Force in Ontario County?
61.9% of People are in the Labor Force in Ontario County.
What is the Unemployment Rate in Ontario County?
Unemployment Rate in Ontario County is 4.0%.