Onondaga County, NY Map & Demographics
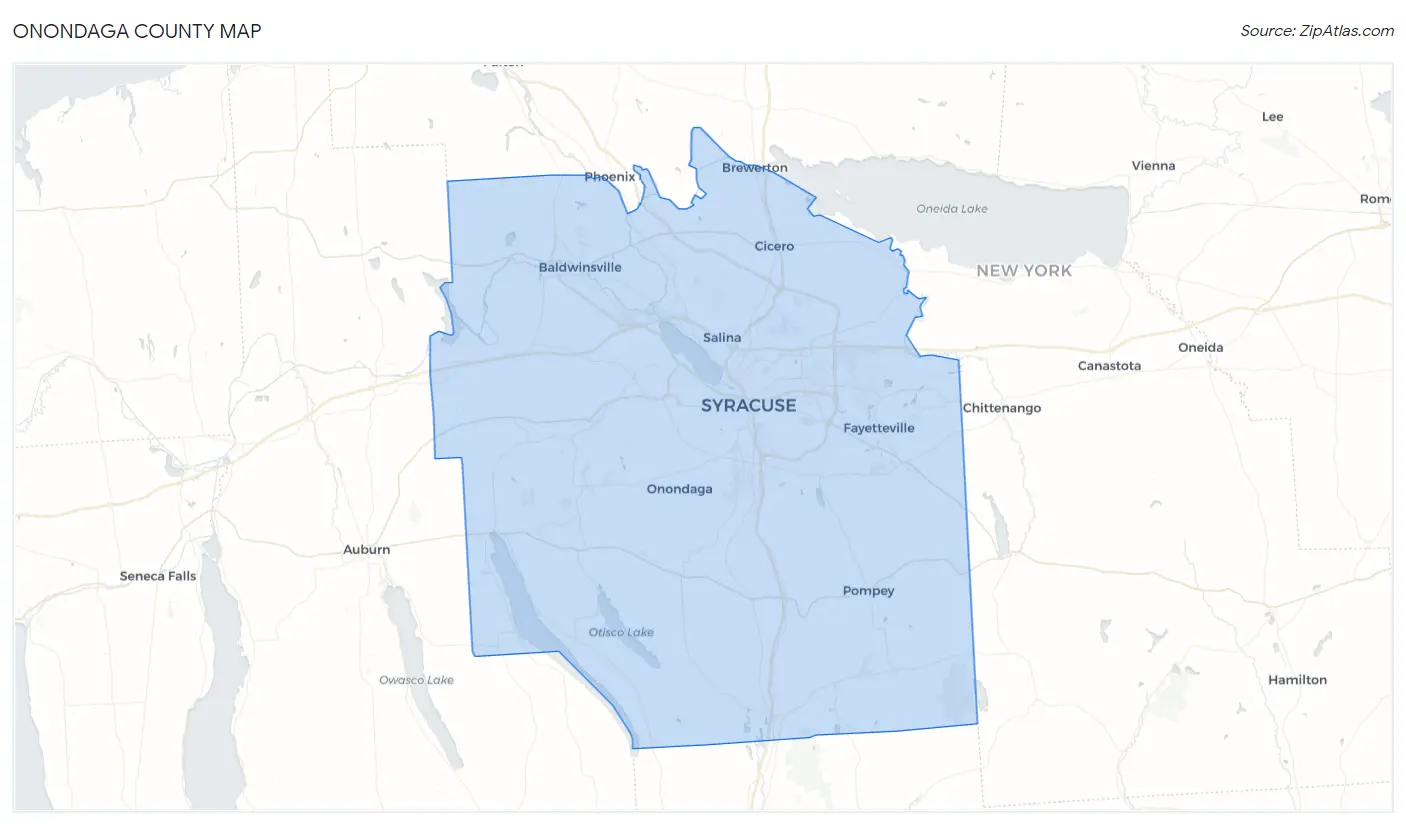
Onondaga County Map
Onondaga County Overview
$39,371
PER CAPITA INCOME
$94,559
AVG FAMILY INCOME
$71,479
AVG HOUSEHOLD INCOME
21.2%
WAGE / INCOME GAP [ % ]
78.8¢/ $1
WAGE / INCOME GAP [ $ ]
$12,248
FAMILY INCOME DEFICIT
0.46
INEQUALITY / GINI INDEX
472,637
TOTAL POPULATION
229,648
MALE POPULATION
242,989
FEMALE POPULATION
94.51
MALES / 100 FEMALES
105.81
FEMALES / 100 MALES
39.4
MEDIAN AGE
3.0
AVG FAMILY SIZE
2.4
AVG HOUSEHOLD SIZE
239,919
LABOR FORCE [ PEOPLE ]
62.4%
PERCENT IN LABOR FORCE
5.6%
UNEMPLOYMENT RATE
Onondaga County Area Codes
Income in Onondaga County
Income Overview in Onondaga County
Per Capita Income in Onondaga County is $39,371, while median incomes of families and households are $94,559 and $71,479 respectively.
| Characteristic | Number | Measure |
| Per Capita Income | 472,637 | $39,371 |
| Median Family Income | 114,297 | $94,559 |
| Mean Family Income | 114,297 | $116,967 |
| Median Household Income | 192,785 | $71,479 |
| Mean Household Income | 192,785 | $94,515 |
| Income Deficit | 114,297 | $12,248 |
| Wage / Income Gap (%) | 472,637 | 21.19% |
| Wage / Income Gap ($) | 472,637 | 78.81¢ per $1 |
| Gini / Inequality Index | 472,637 | 0.46 |
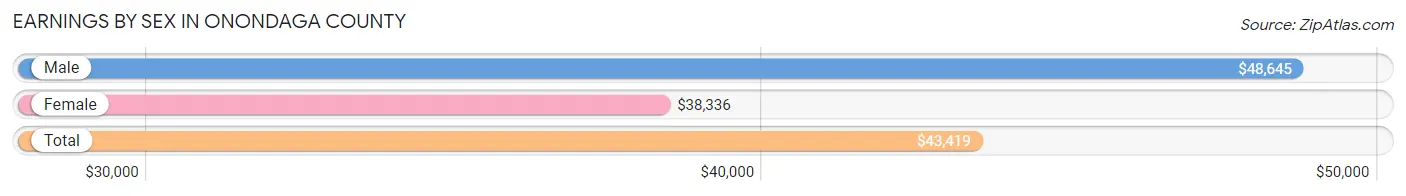
Earnings by Sex in Onondaga County
Average Earnings in Onondaga County are $43,419, $48,645 for men and $38,336 for women, a difference of 21.2%.
| Sex | Number | Average Earnings |
| Male | 128,821 (50.7%) | $48,645 |
| Female | 125,214 (49.3%) | $38,336 |
| Total | 254,035 (100.0%) | $43,419 |
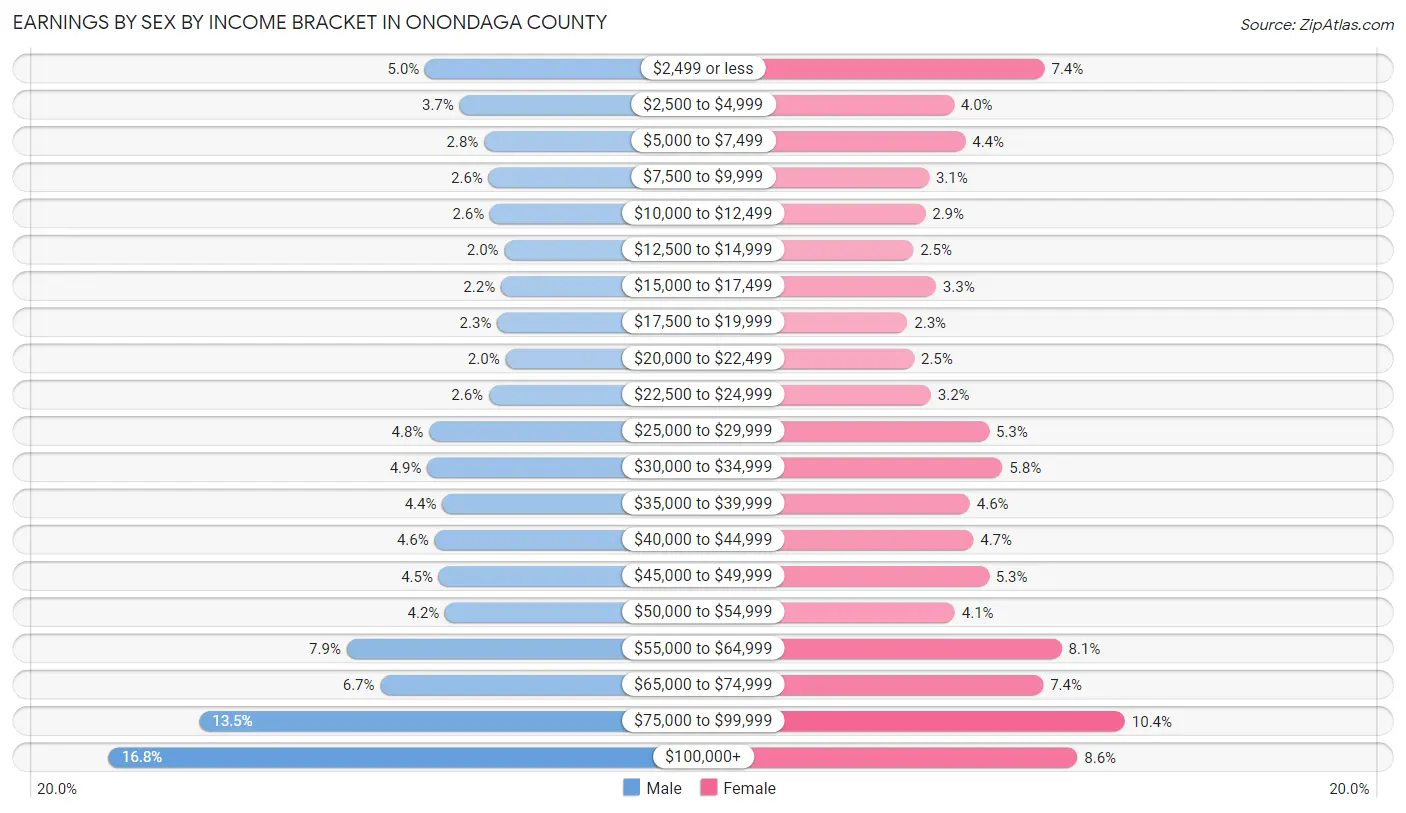
Earnings by Sex by Income Bracket in Onondaga County
The most common earnings brackets in Onondaga County are $100,000+ for men (21,691 | 16.8%) and $75,000 to $99,999 for women (13,048 | 10.4%).
| Income | Male | Female |
| $2,499 or less | 6,427 (5.0%) | 9,276 (7.4%) |
| $2,500 to $4,999 | 4,766 (3.7%) | 5,021 (4.0%) |
| $5,000 to $7,499 | 3,583 (2.8%) | 5,556 (4.4%) |
| $7,500 to $9,999 | 3,356 (2.6%) | 3,857 (3.1%) |
| $10,000 to $12,499 | 3,295 (2.6%) | 3,687 (2.9%) |
| $12,500 to $14,999 | 2,599 (2.0%) | 3,123 (2.5%) |
| $15,000 to $17,499 | 2,769 (2.1%) | 4,184 (3.3%) |
| $17,500 to $19,999 | 2,944 (2.3%) | 2,843 (2.3%) |
| $20,000 to $22,499 | 2,551 (2.0%) | 3,152 (2.5%) |
| $22,500 to $24,999 | 3,347 (2.6%) | 3,938 (3.2%) |
| $25,000 to $29,999 | 6,237 (4.8%) | 6,673 (5.3%) |
| $30,000 to $34,999 | 6,322 (4.9%) | 7,299 (5.8%) |
| $35,000 to $39,999 | 5,600 (4.3%) | 5,769 (4.6%) |
| $40,000 to $44,999 | 5,975 (4.6%) | 5,929 (4.7%) |
| $45,000 to $49,999 | 5,767 (4.5%) | 6,667 (5.3%) |
| $50,000 to $54,999 | 5,460 (4.2%) | 5,068 (4.1%) |
| $55,000 to $64,999 | 10,210 (7.9%) | 10,085 (8.1%) |
| $65,000 to $74,999 | 8,597 (6.7%) | 9,219 (7.4%) |
| $75,000 to $99,999 | 17,325 (13.5%) | 13,048 (10.4%) |
| $100,000+ | 21,691 (16.8%) | 10,820 (8.6%) |
| Total | 128,821 (100.0%) | 125,214 (100.0%) |
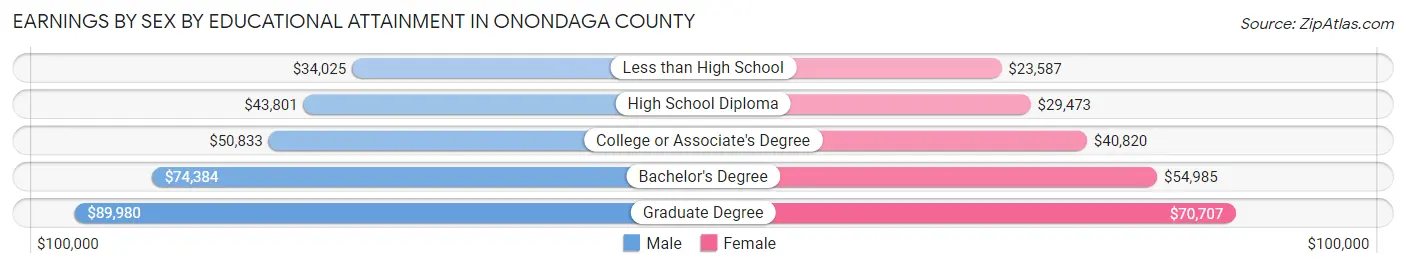
Earnings by Sex by Educational Attainment in Onondaga County
Average earnings in Onondaga County are $56,785 for men and $46,196 for women, a difference of 18.6%. Men with an educational attainment of graduate degree enjoy the highest average annual earnings of $89,980, while those with less than high school education earn the least with $34,025. Women with an educational attainment of graduate degree earn the most with the average annual earnings of $70,707, while those with less than high school education have the smallest earnings of $23,587.
| Educational Attainment | Male Income | Female Income |
| Less than High School | $34,025 | $23,587 |
| High School Diploma | $43,801 | $29,473 |
| College or Associate's Degree | $50,833 | $40,820 |
| Bachelor's Degree | $74,384 | $54,985 |
| Graduate Degree | $89,980 | $70,707 |
| Total | $56,785 | $46,196 |
Family Income in Onondaga County
Family Income Brackets in Onondaga County
According to the Onondaga County family income data, there are 24,917 families falling into the $100,000 to $149,999 income range, which is the most common income bracket and makes up 21.8% of all families. Conversely, the $10,000 to $14,999 income bracket is the least frequent group with only 1,943 families (1.7%) belonging to this category.
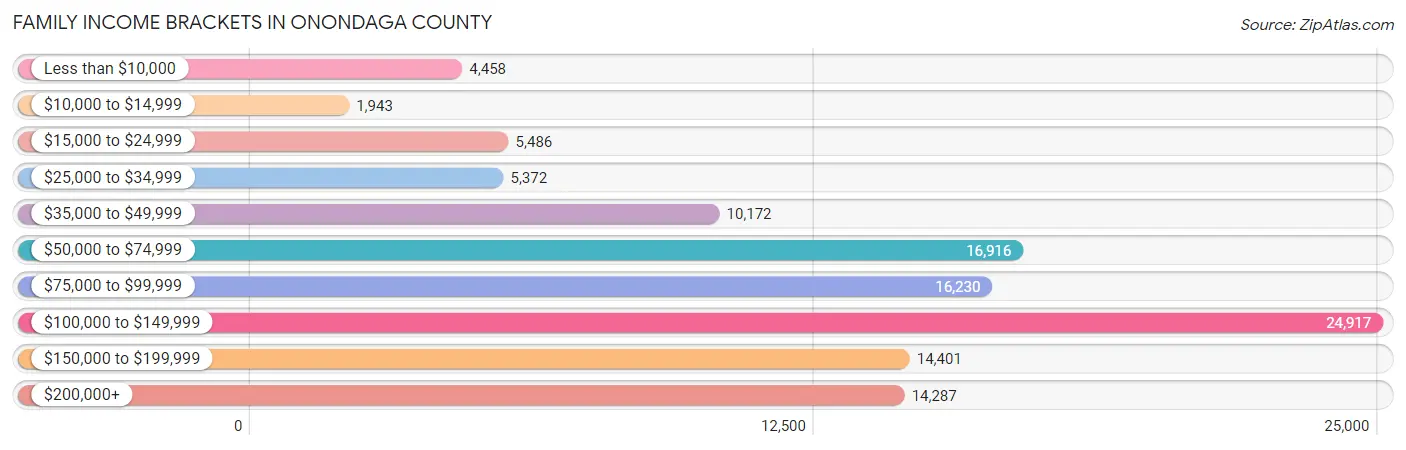
| Income Bracket | # Families | % Families |
| Less than $10,000 | 4,458 | 3.9% |
| $10,000 to $14,999 | 1,943 | 1.7% |
| $15,000 to $24,999 | 5,486 | 4.8% |
| $25,000 to $34,999 | 5,372 | 4.7% |
| $35,000 to $49,999 | 10,172 | 8.9% |
| $50,000 to $74,999 | 16,916 | 14.8% |
| $75,000 to $99,999 | 16,230 | 14.2% |
| $100,000 to $149,999 | 24,917 | 21.8% |
| $150,000 to $199,999 | 14,401 | 12.6% |
| $200,000+ | 14,287 | 12.5% |
Family Income by Famaliy Size in Onondaga County
4-person families (19,014 | 16.6%) account for the highest median family income in Onondaga County with $119,788 per family, while 2-person families (57,023 | 49.9%) have the highest median income of $41,113 per family member.
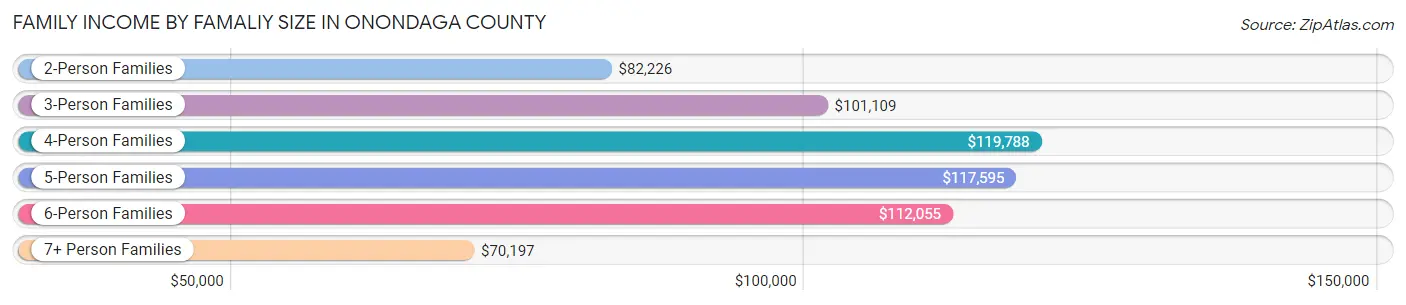
| Income Bracket | # Families | Median Income |
| 2-Person Families | 57,023 (49.9%) | $82,226 |
| 3-Person Families | 26,052 (22.8%) | $101,109 |
| 4-Person Families | 19,014 (16.6%) | $119,788 |
| 5-Person Families | 7,992 (7.0%) | $117,595 |
| 6-Person Families | 2,937 (2.6%) | $112,055 |
| 7+ Person Families | 1,279 (1.1%) | $70,197 |
| Total | 114,297 (100.0%) | $94,559 |
Family Income by Number of Earners in Onondaga County
The median family income in Onondaga County is $94,559, with families comprising 3+ earners (11,736) having the highest median family income of $155,819, while families with no earners (18,376) have the lowest median family income of $50,088, accounting for 10.3% and 16.1% of families, respectively.
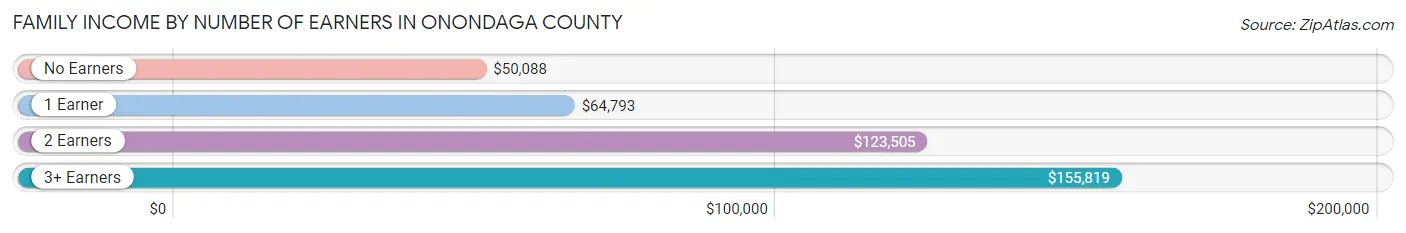
| Number of Earners | # Families | Median Income |
| No Earners | 18,376 (16.1%) | $50,088 |
| 1 Earner | 35,206 (30.8%) | $64,793 |
| 2 Earners | 48,979 (42.8%) | $123,505 |
| 3+ Earners | 11,736 (10.3%) | $155,819 |
| Total | 114,297 (100.0%) | $94,559 |
Household Income in Onondaga County
Household Income Brackets in Onondaga County
With 33,159 households falling in the category, the $100,000 to $149,999 income range is the most frequent in Onondaga County, accounting for 17.2% of all households. In contrast, only 6,940 households (3.6%) fall into the $10,000 to $14,999 income bracket, making it the least populous group.
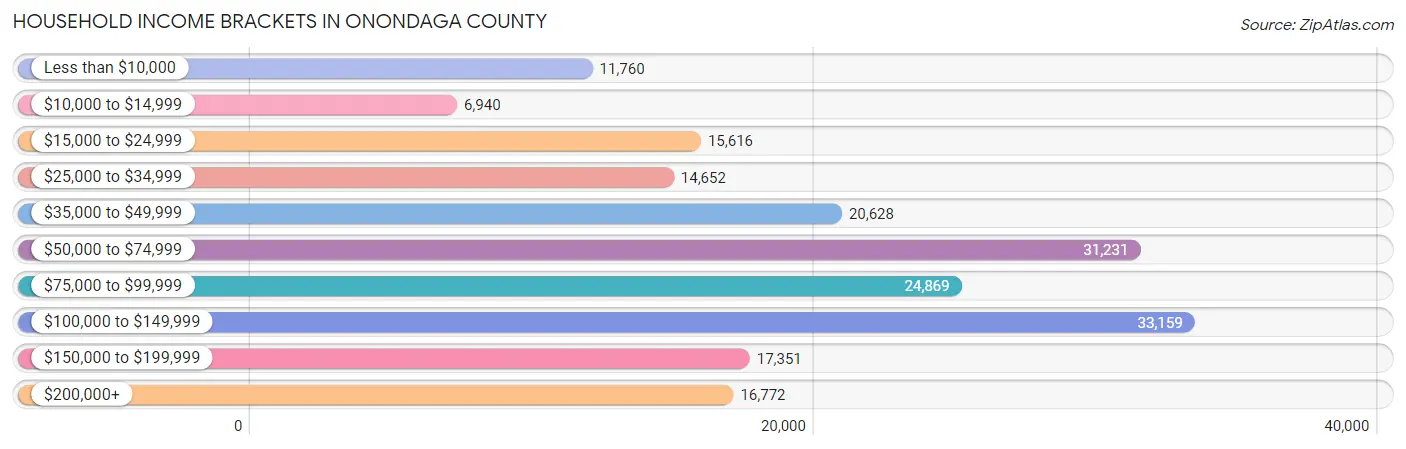
| Income Bracket | # Households | % Households |
| Less than $10,000 | 11,760 | 6.1% |
| $10,000 to $14,999 | 6,940 | 3.6% |
| $15,000 to $24,999 | 15,616 | 8.1% |
| $25,000 to $34,999 | 14,652 | 7.6% |
| $35,000 to $49,999 | 20,628 | 10.7% |
| $50,000 to $74,999 | 31,231 | 16.2% |
| $75,000 to $99,999 | 24,869 | 12.9% |
| $100,000 to $149,999 | 33,159 | 17.2% |
| $150,000 to $199,999 | 17,351 | 9.0% |
| $200,000+ | 16,772 | 8.7% |
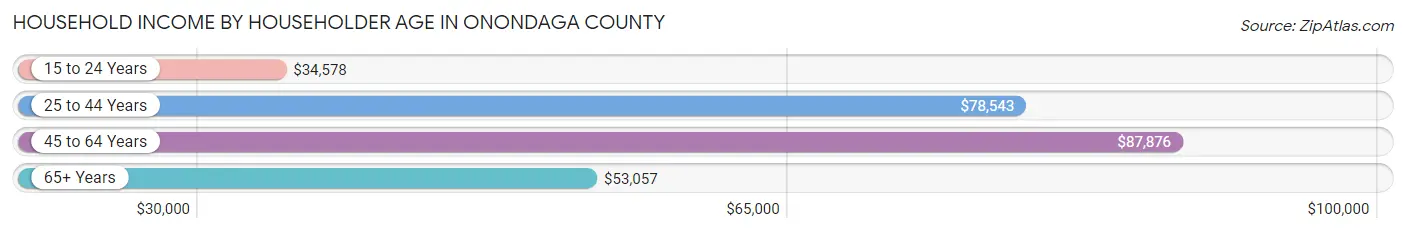
Household Income by Householder Age in Onondaga County
The median household income in Onondaga County is $71,479, with the highest median household income of $87,876 found in the 45 to 64 years age bracket for the primary householder. A total of 71,213 households (36.9%) fall into this category. Meanwhile, the 15 to 24 years age bracket for the primary householder has the lowest median household income of $34,578, with 6,756 households (3.5%) in this group.
| Income Bracket | # Households | Median Income |
| 15 to 24 Years | 6,756 (3.5%) | $34,578 |
| 25 to 44 Years | 59,518 (30.9%) | $78,543 |
| 45 to 64 Years | 71,213 (36.9%) | $87,876 |
| 65+ Years | 55,298 (28.7%) | $53,057 |
| Total | 192,785 (100.0%) | $71,479 |
Poverty in Onondaga County
Income Below Poverty by Sex and Age in Onondaga County
With 12.4% poverty level for males and 15.3% for females among the residents of Onondaga County, 5 year old males and 12 to 14 year old females are the most vulnerable to poverty, with 511 males (23.3%) and 1,816 females (23.5%) in their respective age groups living below the poverty level.
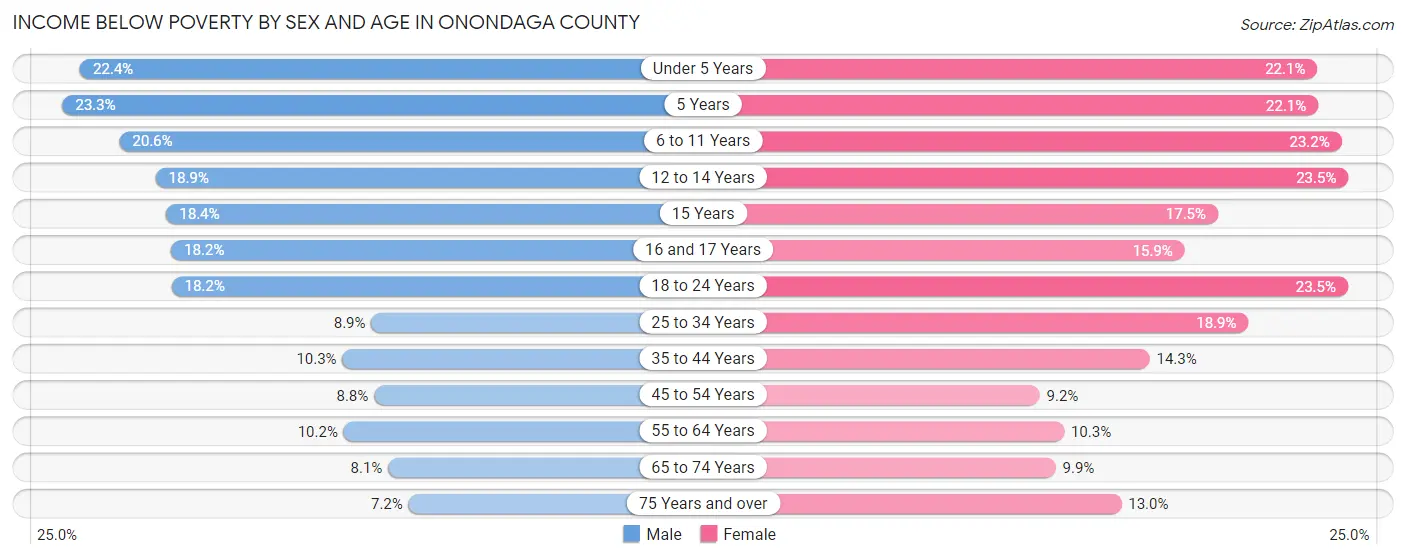
| Age Bracket | Male | Female |
| Under 5 Years | 2,926 (22.4%) | 2,806 (22.1%) |
| 5 Years | 511 (23.3%) | 583 (22.1%) |
| 6 to 11 Years | 3,412 (20.6%) | 3,740 (23.2%) |
| 12 to 14 Years | 1,730 (18.9%) | 1,816 (23.5%) |
| 15 Years | 601 (18.4%) | 539 (17.4%) |
| 16 and 17 Years | 1,025 (18.2%) | 855 (15.9%) |
| 18 to 24 Years | 3,213 (18.2%) | 4,174 (23.5%) |
| 25 to 34 Years | 2,680 (8.9%) | 5,867 (18.9%) |
| 35 to 44 Years | 2,798 (10.2%) | 4,022 (14.3%) |
| 45 to 54 Years | 2,419 (8.8%) | 2,637 (9.2%) |
| 55 to 64 Years | 3,262 (10.2%) | 3,474 (10.3%) |
| 65 to 74 Years | 1,839 (8.1%) | 2,512 (9.9%) |
| 75 Years and over | 970 (7.2%) | 2,655 (13.0%) |
| Total | 27,386 (12.4%) | 35,680 (15.3%) |
Income Above Poverty by Sex and Age in Onondaga County
According to the poverty statistics in Onondaga County, males aged 75 years and over and females aged 45 to 54 years are the age groups that are most secure financially, with 92.8% of males and 90.8% of females in these age groups living above the poverty line.
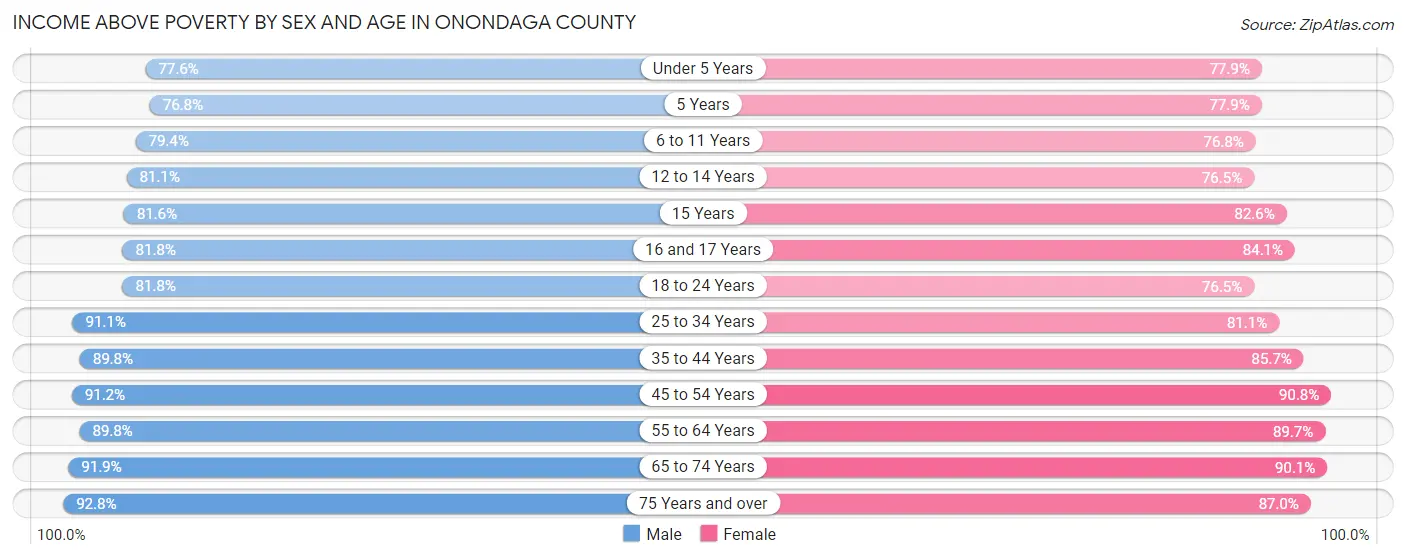
| Age Bracket | Male | Female |
| Under 5 Years | 10,119 (77.6%) | 9,912 (77.9%) |
| 5 Years | 1,687 (76.7%) | 2,055 (77.9%) |
| 6 to 11 Years | 13,148 (79.4%) | 12,391 (76.8%) |
| 12 to 14 Years | 7,414 (81.1%) | 5,913 (76.5%) |
| 15 Years | 2,661 (81.6%) | 2,550 (82.6%) |
| 16 and 17 Years | 4,608 (81.8%) | 4,519 (84.1%) |
| 18 to 24 Years | 14,459 (81.8%) | 13,602 (76.5%) |
| 25 to 34 Years | 27,412 (91.1%) | 25,243 (81.1%) |
| 35 to 44 Years | 24,507 (89.7%) | 24,136 (85.7%) |
| 45 to 54 Years | 25,136 (91.2%) | 26,073 (90.8%) |
| 55 to 64 Years | 28,750 (89.8%) | 30,231 (89.7%) |
| 65 to 74 Years | 20,775 (91.9%) | 22,813 (90.1%) |
| 75 Years and over | 12,545 (92.8%) | 17,816 (87.0%) |
| Total | 193,221 (87.6%) | 197,254 (84.7%) |
Income Below Poverty Among Married-Couple Families in Onondaga County
The poverty statistics for married-couple families in Onondaga County show that 3.4% or 2,732 of the total 80,927 families live below the poverty line. Families with 5 or more children have the highest poverty rate of 32.5%, comprising of 149 families. On the other hand, families with 1 or 2 children have the lowest poverty rate of 2.5%, which includes 602 families.
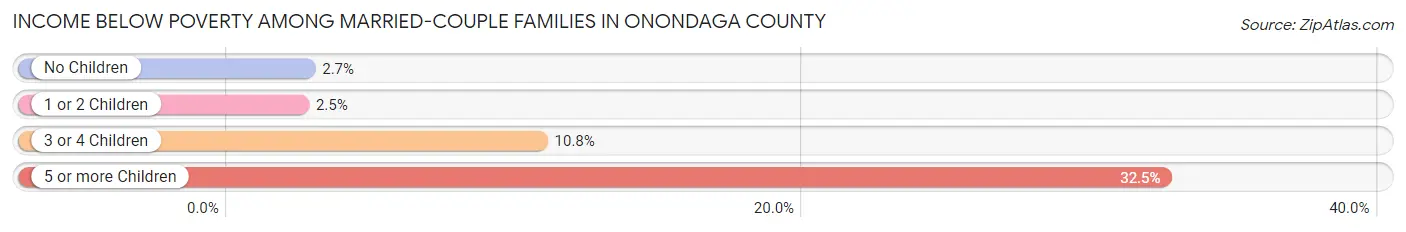
| Children | Above Poverty | Below Poverty |
| No Children | 48,927 (97.3%) | 1,352 (2.7%) |
| 1 or 2 Children | 23,755 (97.5%) | 602 (2.5%) |
| 3 or 4 Children | 5,204 (89.2%) | 629 (10.8%) |
| 5 or more Children | 309 (67.5%) | 149 (32.5%) |
| Total | 78,195 (96.6%) | 2,732 (3.4%) |
Income Below Poverty Among Single-Parent Households in Onondaga County
According to the poverty data in Onondaga County, 12.8% or 1,174 single-father households and 29.2% or 7,064 single-mother households are living below the poverty line. Among single-father households, those with 3 or 4 children have the highest poverty rate, with 266 households (32.0%) experiencing poverty. Likewise, among single-mother households, those with 5 or more children have the highest poverty rate, with 277 households (74.7%) falling below the poverty line.
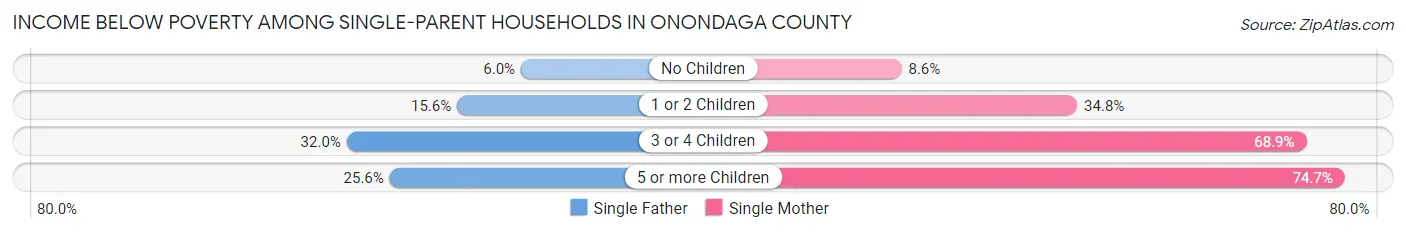
| Children | Single Father | Single Mother |
| No Children | 251 (6.0%) | 776 (8.6%) |
| 1 or 2 Children | 636 (15.5%) | 4,295 (34.8%) |
| 3 or 4 Children | 266 (32.0%) | 1,716 (68.9%) |
| 5 or more Children | 21 (25.6%) | 277 (74.7%) |
| Total | 1,174 (12.8%) | 7,064 (29.2%) |
Income Below Poverty Among Married-Couple vs Single-Parent Households in Onondaga County
The poverty data for Onondaga County shows that 2,732 of the married-couple family households (3.4%) and 8,238 of the single-parent households (24.7%) are living below the poverty level. Within the married-couple family households, those with 5 or more children have the highest poverty rate, with 149 households (32.5%) falling below the poverty line. Among the single-parent households, those with 5 or more children have the highest poverty rate, with 298 household (65.8%) living below poverty.
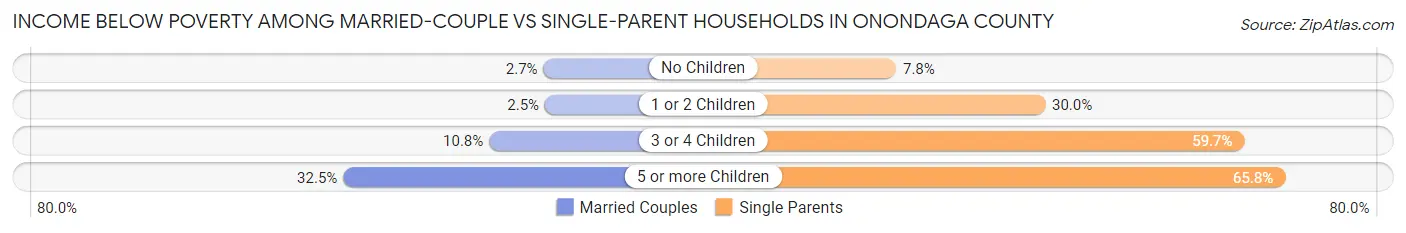
| Children | Married-Couple Families | Single-Parent Households |
| No Children | 1,352 (2.7%) | 1,027 (7.8%) |
| 1 or 2 Children | 602 (2.5%) | 4,931 (30.0%) |
| 3 or 4 Children | 629 (10.8%) | 1,982 (59.7%) |
| 5 or more Children | 149 (32.5%) | 298 (65.8%) |
| Total | 2,732 (3.4%) | 8,238 (24.7%) |
Race in Onondaga County
The most populous races in Onondaga County are White / Caucasian (362,589 | 76.7%), Black / African American (52,245 | 11.1%), and Two or more Races (29,125 | 6.2%).
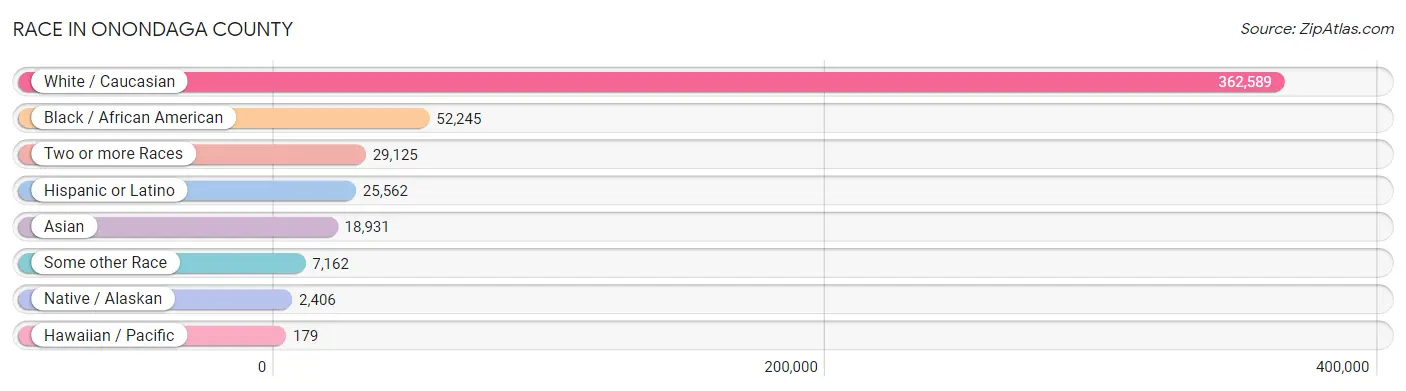
| Race | # Population | % Population |
| Asian | 18,931 | 4.0% |
| Black / African American | 52,245 | 11.1% |
| Hawaiian / Pacific | 179 | 0.0% |
| Hispanic or Latino | 25,562 | 5.4% |
| Native / Alaskan | 2,406 | 0.5% |
| White / Caucasian | 362,589 | 76.7% |
| Two or more Races | 29,125 | 6.2% |
| Some other Race | 7,162 | 1.5% |
| Total | 472,637 | 100.0% |
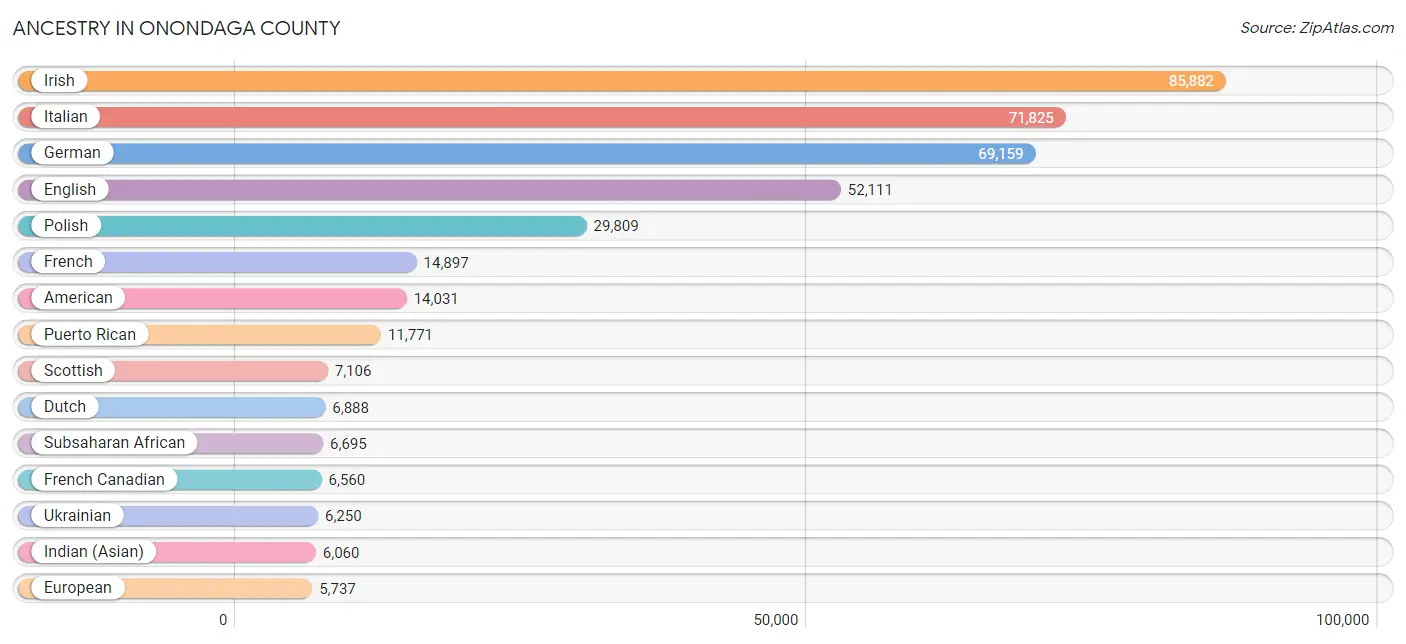
Ancestry in Onondaga County
The most populous ancestries reported in Onondaga County are Irish (85,882 | 18.2%), Italian (71,825 | 15.2%), German (69,159 | 14.6%), English (52,111 | 11.0%), and Polish (29,809 | 6.3%), together accounting for 65.3% of all Onondaga County residents.
| Ancestry | # Population | % Population |
| Afghan | 222 | 0.1% |
| African | 2,474 | 0.5% |
| Alaska Native | 18 | 0.0% |
| Albanian | 246 | 0.1% |
| Aleut | 10 | 0.0% |
| Alsatian | 25 | 0.0% |
| American | 14,031 | 3.0% |
| Apache | 49 | 0.0% |
| Arab | 4,844 | 1.0% |
| Argentinean | 137 | 0.0% |
| Armenian | 419 | 0.1% |
| Assyrian / Chaldean / Syriac | 50 | 0.0% |
| Australian | 36 | 0.0% |
| Austrian | 1,506 | 0.3% |
| Bahamian | 15 | 0.0% |
| Bangladeshi | 215 | 0.1% |
| Barbadian | 61 | 0.0% |
| Basque | 12 | 0.0% |
| Belgian | 228 | 0.1% |
| Belizean | 35 | 0.0% |
| Bhutanese | 568 | 0.1% |
| Blackfeet | 287 | 0.1% |
| Bolivian | 140 | 0.0% |
| Brazilian | 247 | 0.1% |
| British | 1,957 | 0.4% |
| British West Indian | 140 | 0.0% |
| Bulgarian | 58 | 0.0% |
| Burmese | 1,559 | 0.3% |
| Cajun | 13 | 0.0% |
| Cambodian | 1 | 0.0% |
| Canadian | 1,428 | 0.3% |
| Cape Verdean | 17 | 0.0% |
| Celtic | 143 | 0.0% |
| Central American | 1,519 | 0.3% |
| Central American Indian | 337 | 0.1% |
| Cherokee | 658 | 0.1% |
| Chickasaw | 6 | 0.0% |
| Chilean | 388 | 0.1% |
| Chinese | 60 | 0.0% |
| Chippewa | 30 | 0.0% |
| Choctaw | 14 | 0.0% |
| Colombian | 1,064 | 0.2% |
| Costa Rican | 135 | 0.0% |
| Cree | 24 | 0.0% |
| Croatian | 201 | 0.0% |
| Cuban | 2,189 | 0.5% |
| Czech | 1,069 | 0.2% |
| Czechoslovakian | 380 | 0.1% |
| Danish | 774 | 0.2% |
| Delaware | 1 | 0.0% |
| Dominican | 2,524 | 0.5% |
| Dutch | 6,888 | 1.5% |
| Eastern European | 1,812 | 0.4% |
| Ecuadorian | 446 | 0.1% |
| Egyptian | 392 | 0.1% |
| English | 52,111 | 11.0% |
| Estonian | 28 | 0.0% |
| Ethiopian | 395 | 0.1% |
| European | 5,737 | 1.2% |
| Filipino | 105 | 0.0% |
| Finnish | 290 | 0.1% |
| French | 14,897 | 3.2% |
| French American Indian | 58 | 0.0% |
| French Canadian | 6,560 | 1.4% |
| German | 69,159 | 14.6% |
| German Russian | 8 | 0.0% |
| Ghanaian | 326 | 0.1% |
| Greek | 2,573 | 0.5% |
| Guamanian / Chamorro | 9 | 0.0% |
| Guatemalan | 432 | 0.1% |
| Guyanese | 301 | 0.1% |
| Haitian | 651 | 0.1% |
| Honduran | 141 | 0.0% |
| Hungarian | 1,597 | 0.3% |
| Icelander | 10 | 0.0% |
| Indian (Asian) | 6,060 | 1.3% |
| Indonesian | 1,611 | 0.3% |
| Inupiat | 10 | 0.0% |
| Iranian | 149 | 0.0% |
| Iraqi | 590 | 0.1% |
| Irish | 85,882 | 18.2% |
| Iroquois | 2,762 | 0.6% |
| Israeli | 148 | 0.0% |
| Italian | 71,825 | 15.2% |
| Jamaican | 1,875 | 0.4% |
| Japanese | 392 | 0.1% |
| Jordanian | 97 | 0.0% |
| Kenyan | 611 | 0.1% |
| Korean | 1,136 | 0.2% |
| Laotian | 107 | 0.0% |
| Latvian | 228 | 0.1% |
| Lebanese | 865 | 0.2% |
| Liberian | 142 | 0.0% |
| Lithuanian | 846 | 0.2% |
| Luxembourger | 16 | 0.0% |
| Macedonian | 664 | 0.1% |
| Malaysian | 277 | 0.1% |
| Maltese | 26 | 0.0% |
| Mexican | 2,534 | 0.5% |
| Mexican American Indian | 50 | 0.0% |
| Moroccan | 59 | 0.0% |
| Native Hawaiian | 177 | 0.0% |
| Navajo | 87 | 0.0% |
| Nicaraguan | 153 | 0.0% |
| Nigerian | 472 | 0.1% |
| Northern European | 475 | 0.1% |
| Norwegian | 2,003 | 0.4% |
| Okinawan | 47 | 0.0% |
| Osage | 20 | 0.0% |
| Pakistani | 582 | 0.1% |
| Palestinian | 841 | 0.2% |
| Panamanian | 369 | 0.1% |
| Pennsylvania German | 228 | 0.1% |
| Peruvian | 343 | 0.1% |
| Polish | 29,809 | 6.3% |
| Portuguese | 712 | 0.2% |
| Potawatomi | 54 | 0.0% |
| Puerto Rican | 11,771 | 2.5% |
| Romanian | 327 | 0.1% |
| Russian | 4,196 | 0.9% |
| Salvadoran | 265 | 0.1% |
| Samoan | 52 | 0.0% |
| Scandinavian | 895 | 0.2% |
| Scotch-Irish | 2,602 | 0.5% |
| Scottish | 7,106 | 1.5% |
| Seminole | 25 | 0.0% |
| Serbian | 258 | 0.1% |
| Sierra Leonean | 42 | 0.0% |
| Sioux | 18 | 0.0% |
| Slavic | 364 | 0.1% |
| Slovak | 919 | 0.2% |
| Slovene | 371 | 0.1% |
| Somali | 1,239 | 0.3% |
| South African | 65 | 0.0% |
| South American | 2,657 | 0.6% |
| South American Indian | 13 | 0.0% |
| Spaniard | 701 | 0.2% |
| Spanish | 499 | 0.1% |
| Sri Lankan | 2,362 | 0.5% |
| Subsaharan African | 6,695 | 1.4% |
| Sudanese | 270 | 0.1% |
| Swedish | 3,315 | 0.7% |
| Swiss | 1,623 | 0.3% |
| Syrian | 645 | 0.1% |
| Thai | 3,720 | 0.8% |
| Trinidadian and Tobagonian | 119 | 0.0% |
| Turkish | 324 | 0.1% |
| U.S. Virgin Islander | 9 | 0.0% |
| Ukrainian | 6,250 | 1.3% |
| Uruguayan | 26 | 0.0% |
| Venezuelan | 113 | 0.0% |
| Vietnamese | 91 | 0.0% |
| Welsh | 3,205 | 0.7% |
| West Indian | 348 | 0.1% |
| Yaqui | 3 | 0.0% |
| Yugoslavian | 1,286 | 0.3% |
| Zimbabwean | 31 | 0.0% | View All 157 Rows |
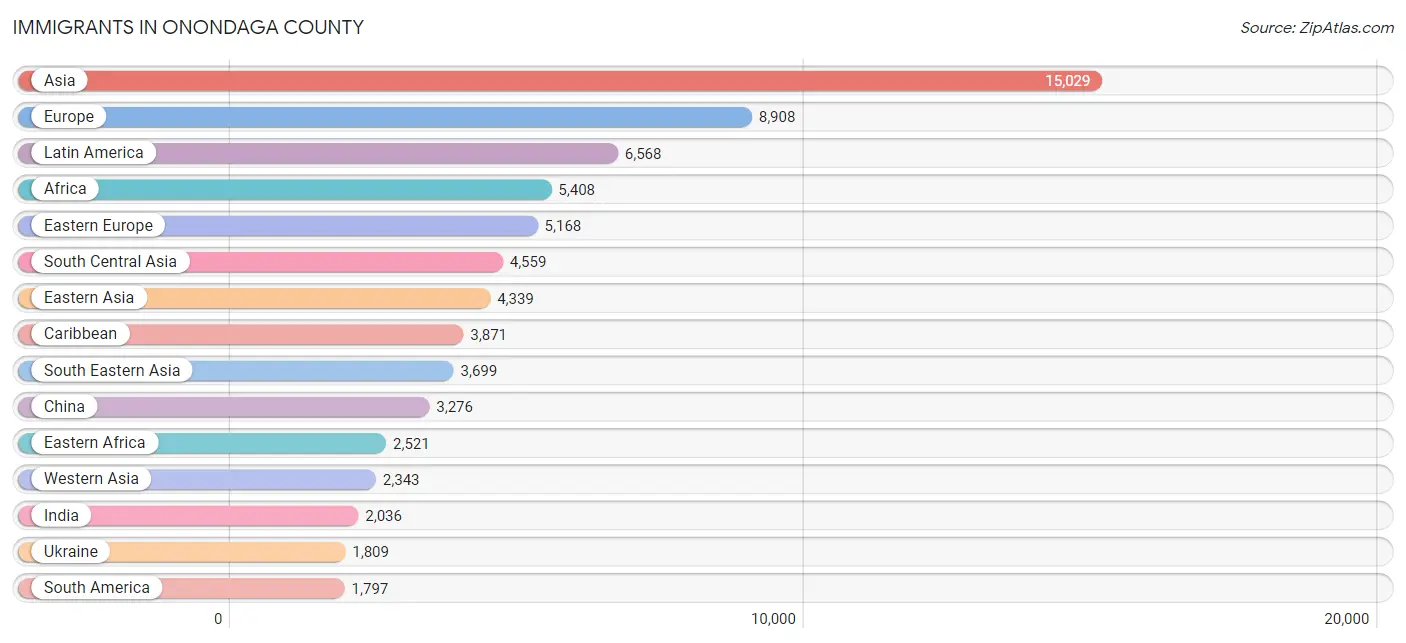
Immigrants in Onondaga County
The most numerous immigrant groups reported in Onondaga County came from Asia (15,029 | 3.2%), Europe (8,908 | 1.9%), Latin America (6,568 | 1.4%), Africa (5,408 | 1.1%), and Eastern Europe (5,168 | 1.1%), together accounting for 8.7% of all Onondaga County residents.
| Immigration Origin | # Population | % Population |
| Afghanistan | 310 | 0.1% |
| Africa | 5,408 | 1.1% |
| Albania | 59 | 0.0% |
| Argentina | 135 | 0.0% |
| Armenia | 17 | 0.0% |
| Asia | 15,029 | 3.2% |
| Australia | 9 | 0.0% |
| Austria | 73 | 0.0% |
| Bahamas | 47 | 0.0% |
| Bangladesh | 321 | 0.1% |
| Barbados | 53 | 0.0% |
| Belarus | 181 | 0.0% |
| Belgium | 43 | 0.0% |
| Belize | 12 | 0.0% |
| Bolivia | 46 | 0.0% |
| Bosnia and Herzegovina | 991 | 0.2% |
| Brazil | 207 | 0.0% |
| Bulgaria | 27 | 0.0% |
| Cambodia | 45 | 0.0% |
| Cameroon | 20 | 0.0% |
| Canada | 1,410 | 0.3% |
| Caribbean | 3,871 | 0.8% |
| Central America | 900 | 0.2% |
| Chile | 110 | 0.0% |
| China | 3,276 | 0.7% |
| Colombia | 511 | 0.1% |
| Congo | 305 | 0.1% |
| Costa Rica | 46 | 0.0% |
| Croatia | 14 | 0.0% |
| Cuba | 1,082 | 0.2% |
| Czechoslovakia | 40 | 0.0% |
| Denmark | 4 | 0.0% |
| Dominica | 295 | 0.1% |
| Dominican Republic | 604 | 0.1% |
| Eastern Africa | 2,521 | 0.5% |
| Eastern Asia | 4,339 | 0.9% |
| Eastern Europe | 5,168 | 1.1% |
| Ecuador | 218 | 0.1% |
| Egypt | 248 | 0.1% |
| El Salvador | 76 | 0.0% |
| England | 247 | 0.1% |
| Eritrea | 146 | 0.0% |
| Ethiopia | 173 | 0.0% |
| Europe | 8,908 | 1.9% |
| France | 231 | 0.1% |
| Germany | 825 | 0.2% |
| Ghana | 371 | 0.1% |
| Greece | 471 | 0.1% |
| Grenada | 78 | 0.0% |
| Guatemala | 210 | 0.0% |
| Guyana | 301 | 0.1% |
| Haiti | 376 | 0.1% |
| Honduras | 94 | 0.0% |
| Hong Kong | 40 | 0.0% |
| Hungary | 73 | 0.0% |
| India | 2,036 | 0.4% |
| Indonesia | 98 | 0.0% |
| Iran | 192 | 0.0% |
| Iraq | 923 | 0.2% |
| Ireland | 67 | 0.0% |
| Israel | 212 | 0.0% |
| Italy | 996 | 0.2% |
| Jamaica | 976 | 0.2% |
| Japan | 120 | 0.0% |
| Jordan | 164 | 0.0% |
| Kazakhstan | 51 | 0.0% |
| Kenya | 704 | 0.2% |
| Korea | 943 | 0.2% |
| Kuwait | 15 | 0.0% |
| Laos | 162 | 0.0% |
| Latin America | 6,568 | 1.4% |
| Latvia | 10 | 0.0% |
| Lebanon | 105 | 0.0% |
| Liberia | 129 | 0.0% |
| Malaysia | 87 | 0.0% |
| Mexico | 378 | 0.1% |
| Micronesia | 3 | 0.0% |
| Middle Africa | 721 | 0.2% |
| Moldova | 11 | 0.0% |
| Morocco | 69 | 0.0% |
| Nepal | 381 | 0.1% |
| Netherlands | 38 | 0.0% |
| Nicaragua | 30 | 0.0% |
| Nigeria | 115 | 0.0% |
| North Macedonia | 356 | 0.1% |
| Northern Africa | 643 | 0.1% |
| Northern Europe | 758 | 0.2% |
| Norway | 1 | 0.0% |
| Oceania | 21 | 0.0% |
| Pakistan | 349 | 0.1% |
| Panama | 54 | 0.0% |
| Peru | 146 | 0.0% |
| Philippines | 421 | 0.1% |
| Poland | 804 | 0.2% |
| Portugal | 68 | 0.0% |
| Romania | 33 | 0.0% |
| Russia | 655 | 0.1% |
| Saudi Arabia | 12 | 0.0% |
| Scotland | 62 | 0.0% |
| Serbia | 30 | 0.0% |
| Sierra Leone | 29 | 0.0% |
| Singapore | 36 | 0.0% |
| Somalia | 1,150 | 0.2% |
| South Africa | 60 | 0.0% |
| South America | 1,797 | 0.4% |
| South Central Asia | 4,559 | 1.0% |
| South Eastern Asia | 3,699 | 0.8% |
| Southern Europe | 1,676 | 0.4% |
| Spain | 141 | 0.0% |
| Sri Lanka | 68 | 0.0% |
| St. Vincent and the Grenadines | 39 | 0.0% |
| Sudan | 311 | 0.1% |
| Sweden | 64 | 0.0% |
| Switzerland | 67 | 0.0% |
| Syria | 499 | 0.1% |
| Taiwan | 175 | 0.0% |
| Thailand | 401 | 0.1% |
| Trinidad and Tobago | 216 | 0.1% |
| Turkey | 222 | 0.1% |
| Uganda | 5 | 0.0% |
| Ukraine | 1,809 | 0.4% |
| Uruguay | 35 | 0.0% |
| Uzbekistan | 172 | 0.0% |
| Venezuela | 88 | 0.0% |
| Vietnam | 1,584 | 0.3% |
| Western Africa | 778 | 0.2% |
| Western Asia | 2,343 | 0.5% |
| Western Europe | 1,306 | 0.3% |
| Yemen | 62 | 0.0% |
| Zaire | 303 | 0.1% |
| Zimbabwe | 71 | 0.0% | View All 131 Rows |
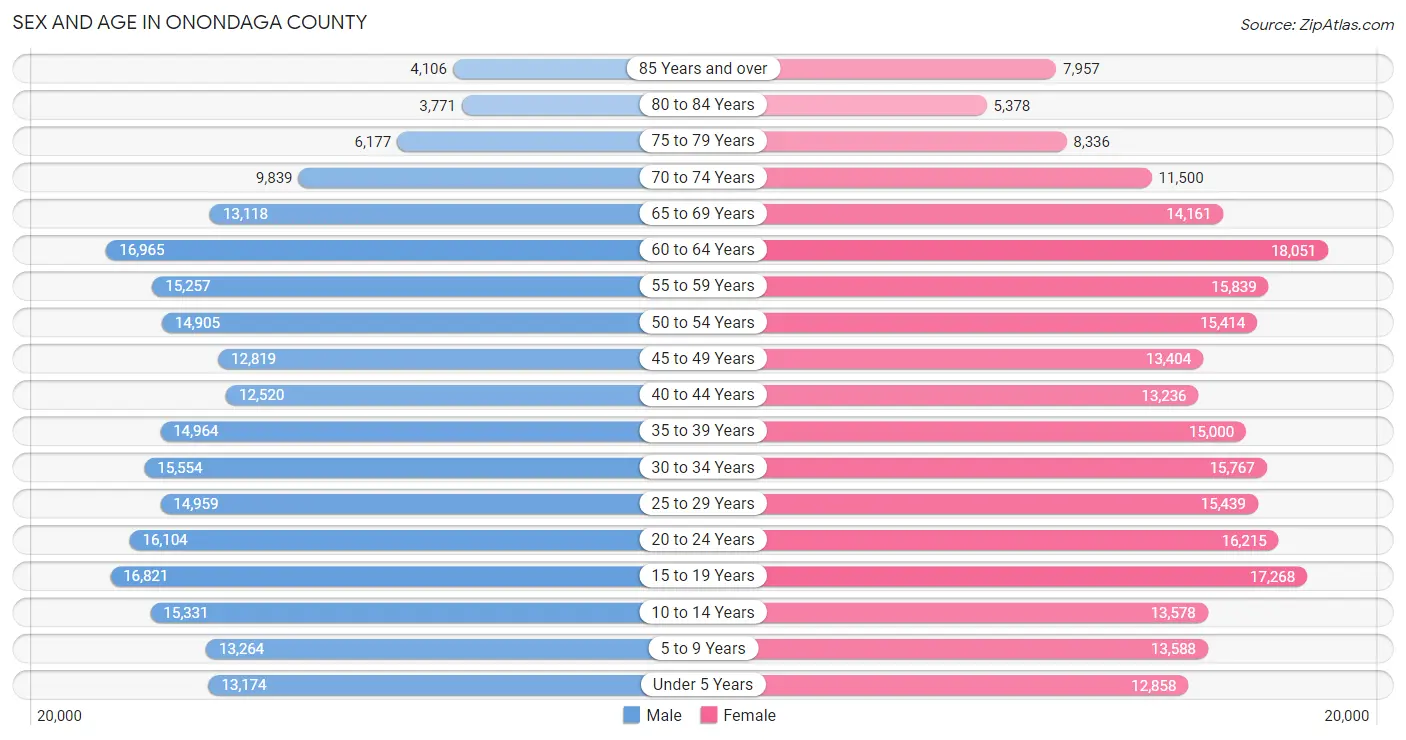
Sex and Age in Onondaga County
Sex and Age in Onondaga County
The most populous age groups in Onondaga County are 60 to 64 Years (16,965 | 7.4%) for men and 60 to 64 Years (18,051 | 7.4%) for women.
| Age Bracket | Male | Female |
| Under 5 Years | 13,174 (5.7%) | 12,858 (5.3%) |
| 5 to 9 Years | 13,264 (5.8%) | 13,588 (5.6%) |
| 10 to 14 Years | 15,331 (6.7%) | 13,578 (5.6%) |
| 15 to 19 Years | 16,821 (7.3%) | 17,268 (7.1%) |
| 20 to 24 Years | 16,104 (7.0%) | 16,215 (6.7%) |
| 25 to 29 Years | 14,959 (6.5%) | 15,439 (6.4%) |
| 30 to 34 Years | 15,554 (6.8%) | 15,767 (6.5%) |
| 35 to 39 Years | 14,964 (6.5%) | 15,000 (6.2%) |
| 40 to 44 Years | 12,520 (5.4%) | 13,236 (5.4%) |
| 45 to 49 Years | 12,819 (5.6%) | 13,404 (5.5%) |
| 50 to 54 Years | 14,905 (6.5%) | 15,414 (6.3%) |
| 55 to 59 Years | 15,257 (6.6%) | 15,839 (6.5%) |
| 60 to 64 Years | 16,965 (7.4%) | 18,051 (7.4%) |
| 65 to 69 Years | 13,118 (5.7%) | 14,161 (5.8%) |
| 70 to 74 Years | 9,839 (4.3%) | 11,500 (4.7%) |
| 75 to 79 Years | 6,177 (2.7%) | 8,336 (3.4%) |
| 80 to 84 Years | 3,771 (1.6%) | 5,378 (2.2%) |
| 85 Years and over | 4,106 (1.8%) | 7,957 (3.3%) |
| Total | 229,648 (100.0%) | 242,989 (100.0%) |
Families and Households in Onondaga County
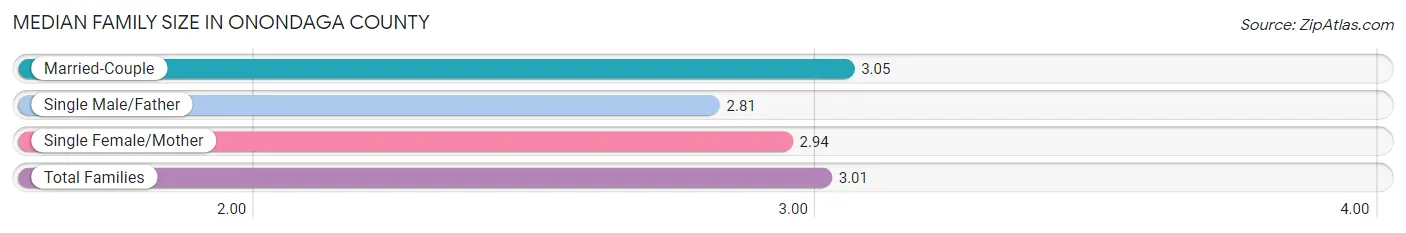
Median Family Size in Onondaga County
The median family size in Onondaga County is 3.01 persons per family, with married-couple families (80,927 | 70.8%) accounting for the largest median family size of 3.05 persons per family. On the other hand, single male/father families (9,160 | 8.0%) represent the smallest median family size with 2.81 persons per family.
| Family Type | # Families | Family Size |
| Married-Couple | 80,927 (70.8%) | 3.05 |
| Single Male/Father | 9,160 (8.0%) | 2.81 |
| Single Female/Mother | 24,210 (21.2%) | 2.94 |
| Total Families | 114,297 (100.0%) | 3.01 |
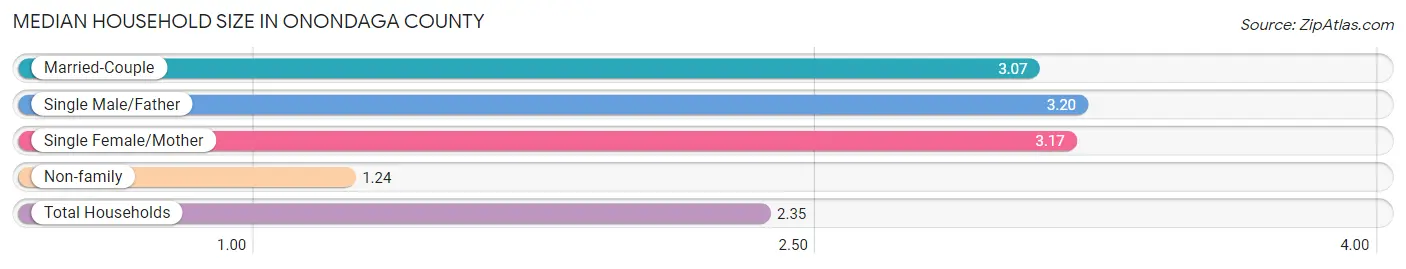
Median Household Size in Onondaga County
The median household size in Onondaga County is 2.35 persons per household, with single male/father households (9,160 | 4.8%) accounting for the largest median household size of 3.2 persons per household. non-family households (78,488 | 40.7%) represent the smallest median household size with 1.24 persons per household.
| Household Type | # Households | Household Size |
| Married-Couple | 80,927 (42.0%) | 3.07 |
| Single Male/Father | 9,160 (4.8%) | 3.20 |
| Single Female/Mother | 24,210 (12.6%) | 3.17 |
| Non-family | 78,488 (40.7%) | 1.24 |
| Total Households | 192,785 (100.0%) | 2.35 |
Household Size by Marriage Status in Onondaga County
Out of a total of 192,785 households in Onondaga County, 114,297 (59.3%) are family households, while 78,488 (40.7%) are nonfamily households. The most numerous type of family households are 2-person households, comprising 52,736, and the most common type of nonfamily households are 1-person households, comprising 63,253.
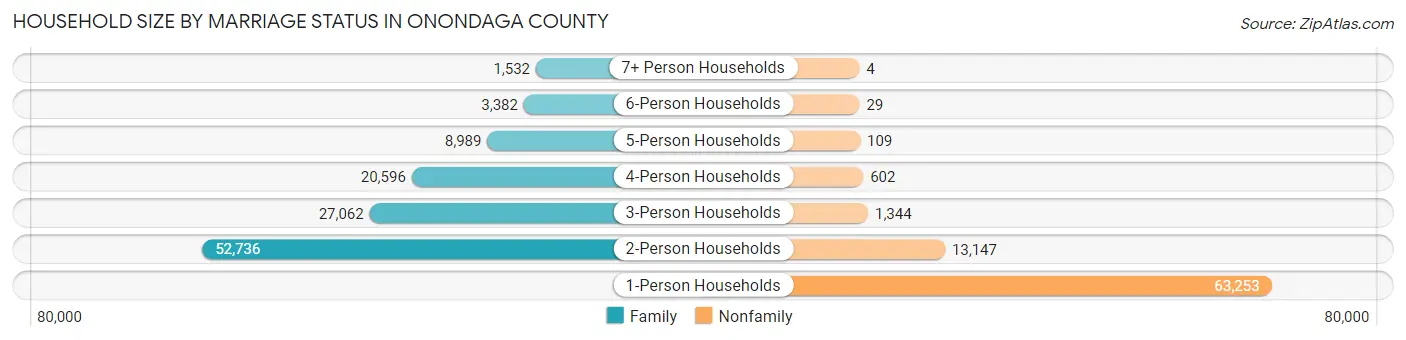
| Household Size | Family Households | Nonfamily Households |
| 1-Person Households | - | 63,253 (32.8%) |
| 2-Person Households | 52,736 (27.4%) | 13,147 (6.8%) |
| 3-Person Households | 27,062 (14.0%) | 1,344 (0.7%) |
| 4-Person Households | 20,596 (10.7%) | 602 (0.3%) |
| 5-Person Households | 8,989 (4.7%) | 109 (0.1%) |
| 6-Person Households | 3,382 (1.8%) | 29 (0.0%) |
| 7+ Person Households | 1,532 (0.8%) | 4 (0.0%) |
| Total | 114,297 (59.3%) | 78,488 (40.7%) |
Female Fertility in Onondaga County
Fertility by Age in Onondaga County
Average fertility rate in Onondaga County is 50.0 births per 1,000 women. Women in the age bracket of 20 to 34 years have the highest fertility rate with 77.0 births per 1,000 women. Women in the age bracket of 20 to 34 years acount for 66.5% of all women with births.
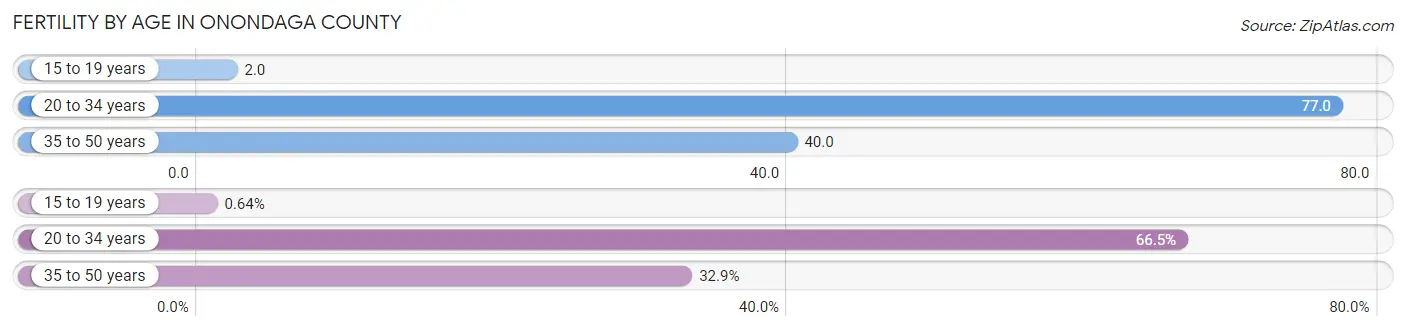
| Age Bracket | Women with Births | Births / 1,000 Women |
| 15 to 19 years | 35 (0.6%) | 2.0 |
| 20 to 34 years | 3,653 (66.5%) | 77.0 |
| 35 to 50 years | 1,805 (32.9%) | 40.0 |
| Total | 5,493 (100.0%) | 50.0 |
Fertility by Age by Marriage Status in Onondaga County
69.2% of women with births (5,493) in Onondaga County are married. The highest percentage of unmarried women with births falls into 15 to 19 years age bracket with 100.0% of them unmarried at the time of birth, while the lowest percentage of unmarried women with births belong to 35 to 50 years age bracket with 30.3% of them unmarried.
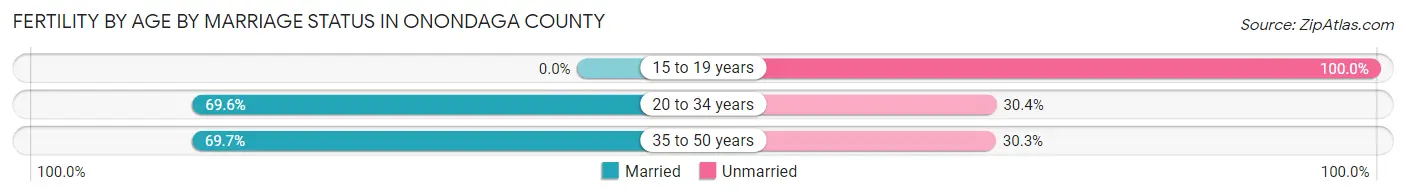
| Age Bracket | Married | Unmarried |
| 15 to 19 years | 0 (0.0%) | 35 (100.0%) |
| 20 to 34 years | 2,542 (69.6%) | 1,111 (30.4%) |
| 35 to 50 years | 1,258 (69.7%) | 547 (30.3%) |
| Total | 3,801 (69.2%) | 1,692 (30.8%) |
Fertility by Education in Onondaga County
Average fertility rate in Onondaga County is 50.0 births per 1,000 women. Women with the education attainment of graduate degree have the highest fertility rate of 74.0 births per 1,000 women, while women with the education attainment of college or associate's degree have the lowest fertility at 35.0 births per 1,000 women. Women with the education attainment of graduate degree represent 24.8% of all women with births.
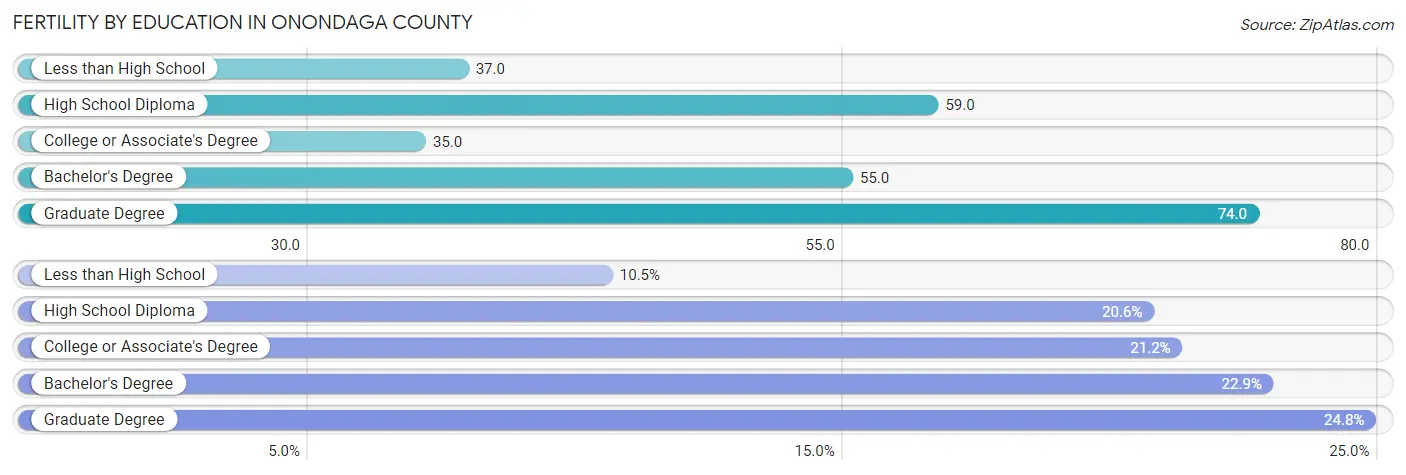
| Educational Attainment | Women with Births | Births / 1,000 Women |
| Less than High School | 577 (10.5%) | 37.0 |
| High School Diploma | 1,134 (20.6%) | 59.0 |
| College or Associate's Degree | 1,163 (21.2%) | 35.0 |
| Bachelor's Degree | 1,257 (22.9%) | 55.0 |
| Graduate Degree | 1,362 (24.8%) | 74.0 |
| Total | 5,493 (100.0%) | 50.0 |
Fertility by Education by Marriage Status in Onondaga County
30.8% of women with births in Onondaga County are unmarried. Women with the educational attainment of graduate degree are most likely to be married with 91.2% of them married at childbirth, while women with the educational attainment of high school diploma are least likely to be married with 62.8% of them unmarried at childbirth.
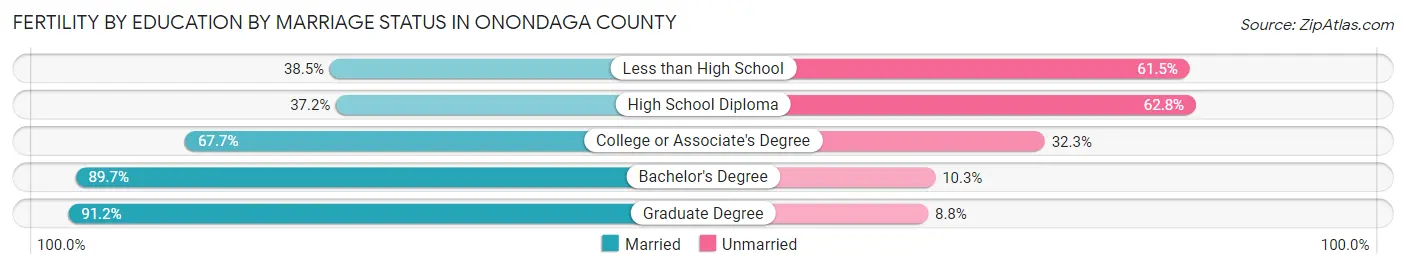
| Educational Attainment | Married | Unmarried |
| Less than High School | 222 (38.5%) | 355 (61.5%) |
| High School Diploma | 422 (37.2%) | 712 (62.8%) |
| College or Associate's Degree | 787 (67.7%) | 376 (32.3%) |
| Bachelor's Degree | 1,128 (89.7%) | 129 (10.3%) |
| Graduate Degree | 1,242 (91.2%) | 120 (8.8%) |
| Total | 3,801 (69.2%) | 1,692 (30.8%) |
Employment Characteristics in Onondaga County
Employment by Class of Employer in Onondaga County
Among the 222,274 employed individuals in Onondaga County, private company employees (137,030 | 61.7%), not-for-profit organizations (27,609 | 12.4%), and local government employees (20,305 | 9.1%) make up the most common classes of employment.
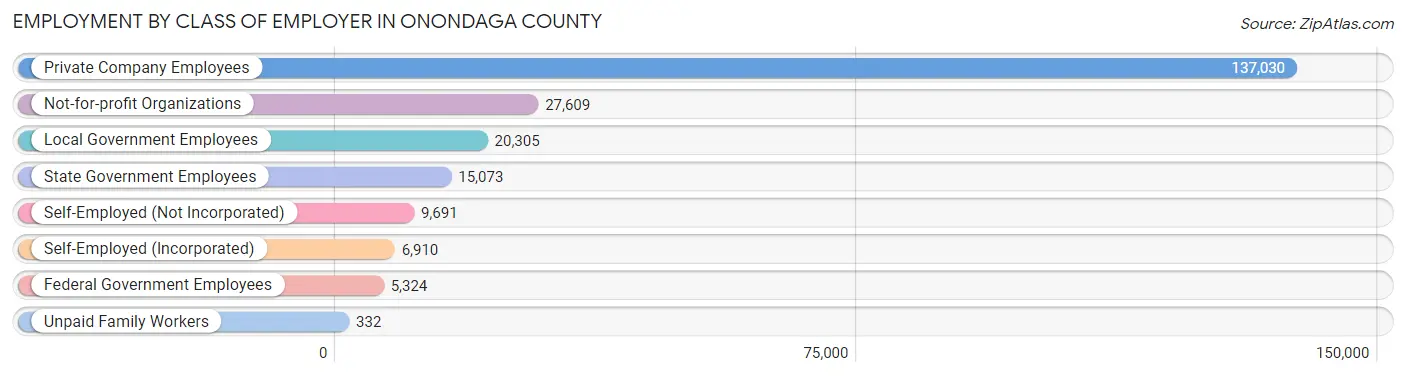
| Employer Class | # Employees | % Employees |
| Private Company Employees | 137,030 | 61.7% |
| Self-Employed (Incorporated) | 6,910 | 3.1% |
| Self-Employed (Not Incorporated) | 9,691 | 4.4% |
| Not-for-profit Organizations | 27,609 | 12.4% |
| Local Government Employees | 20,305 | 9.1% |
| State Government Employees | 15,073 | 6.8% |
| Federal Government Employees | 5,324 | 2.4% |
| Unpaid Family Workers | 332 | 0.2% |
| Total | 222,274 | 100.0% |
Employment Status by Age in Onondaga County
According to the labor force statistics for Onondaga County, out of the total population over 16 years of age (384,486), 62.4% or 239,919 individuals are in the labor force, with 5.6% or 13,435 of them unemployed. The age group with the highest labor force participation rate is 30 to 34 years, with 86.5% or 27,093 individuals in the labor force. Within the labor force, the 16 to 19 years age range has the highest percentage of unemployed individuals, with 16.7% or 1,584 of them being unemployed.
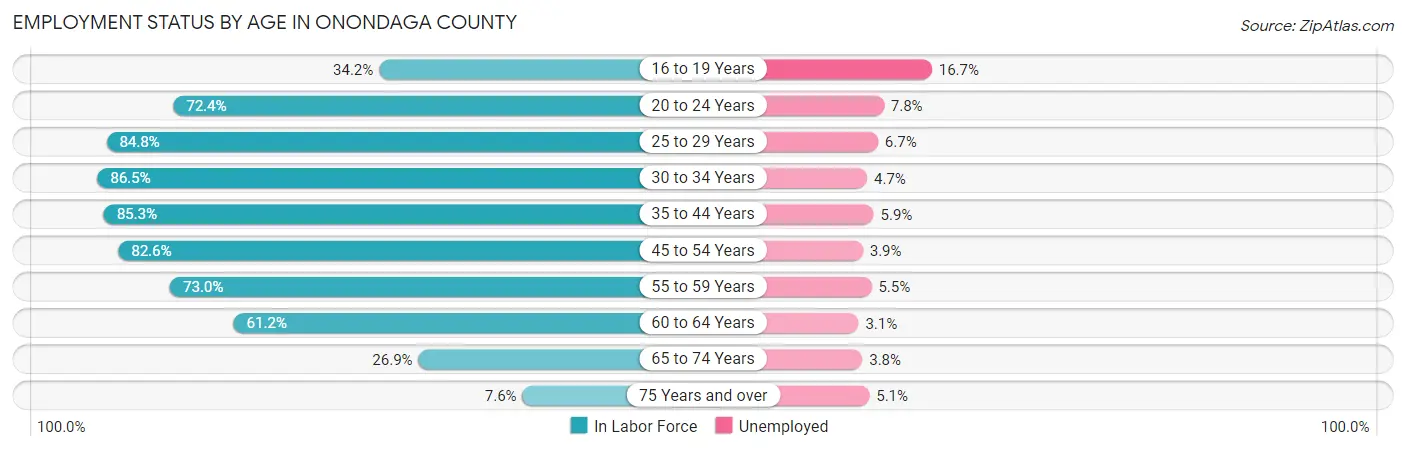
| Age Bracket | In Labor Force | Unemployed |
| 16 to 19 Years | 9,484 (34.2%) | 1,584 (16.7%) |
| 20 to 24 Years | 23,399 (72.4%) | 1,825 (7.8%) |
| 25 to 29 Years | 25,778 (84.8%) | 1,727 (6.7%) |
| 30 to 34 Years | 27,093 (86.5%) | 1,273 (4.7%) |
| 35 to 44 Years | 47,529 (85.3%) | 2,804 (5.9%) |
| 45 to 54 Years | 46,704 (82.6%) | 1,821 (3.9%) |
| 55 to 59 Years | 22,700 (73.0%) | 1,248 (5.5%) |
| 60 to 64 Years | 21,430 (61.2%) | 664 (3.1%) |
| 65 to 74 Years | 13,078 (26.9%) | 497 (3.8%) |
| 75 Years and over | 2,715 (7.6%) | 138 (5.1%) |
| Total | 239,919 (62.4%) | 13,435 (5.6%) |
Employment Status by Educational Attainment in Onondaga County
According to labor force statistics for Onondaga County, 79.7% of individuals (191,354) out of the total population between 25 and 64 years of age (240,093) are in the labor force, with 5.0% or 9,568 of them being unemployed. The group with the highest labor force participation rate are those with the educational attainment of bachelor's degree or higher, with 88.9% or 82,730 individuals in the labor force. Within the labor force, individuals with less than high school education have the highest percentage of unemployment, with 11.1% or 1,212 of them being unemployed.
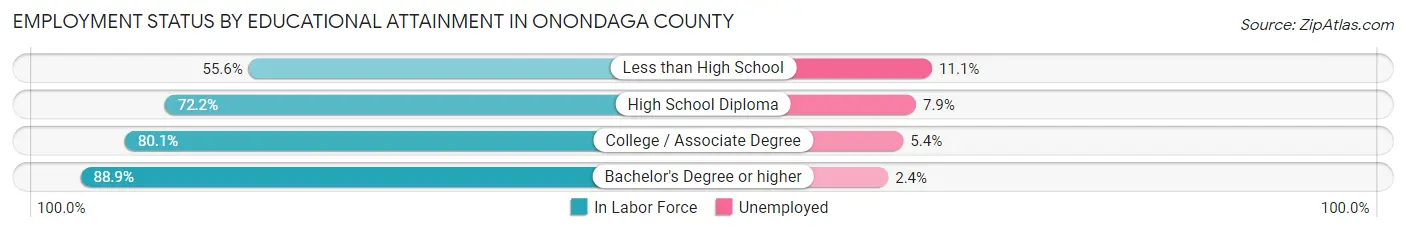
| Educational Attainment | In Labor Force | Unemployed |
| Less than High School | 10,919 (55.6%) | 2,180 (11.1%) |
| High School Diploma | 40,002 (72.2%) | 4,377 (7.9%) |
| College / Associate Degree | 57,664 (80.1%) | 3,887 (5.4%) |
| Bachelor's Degree or higher | 82,730 (88.9%) | 2,233 (2.4%) |
| Total | 191,354 (79.7%) | 12,005 (5.0%) |
Employment Occupations by Sex in Onondaga County
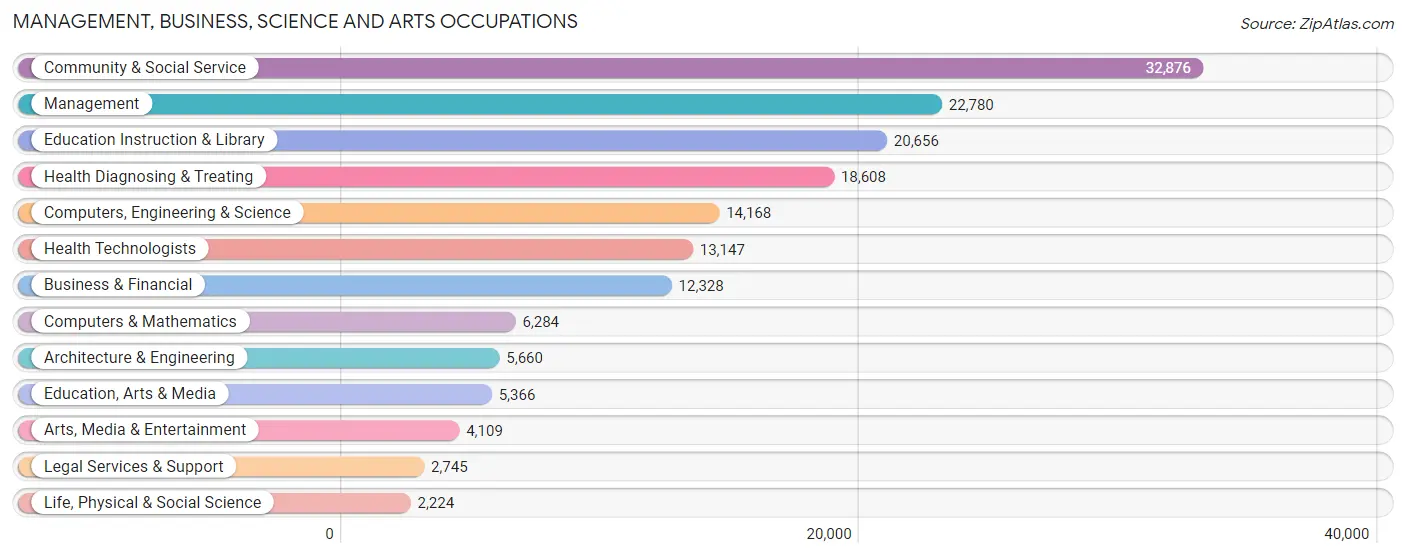
Management, Business, Science and Arts Occupations
The most common Management, Business, Science and Arts occupations in Onondaga County are Community & Social Service (32,876 | 14.5%), Management (22,780 | 10.1%), Education Instruction & Library (20,656 | 9.1%), Health Diagnosing & Treating (18,608 | 8.2%), and Computers, Engineering & Science (14,168 | 6.3%).
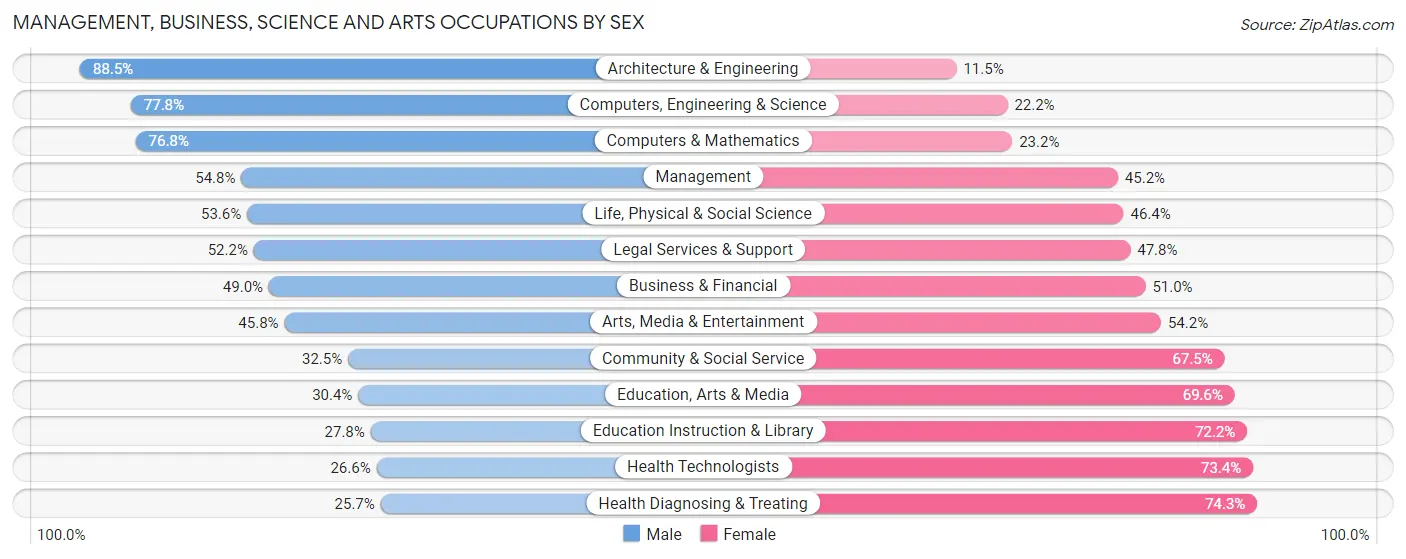
Management, Business, Science and Arts Occupations by Sex
Within the Management, Business, Science and Arts occupations in Onondaga County, the most male-oriented occupations are Architecture & Engineering (88.5%), Computers, Engineering & Science (77.8%), and Computers & Mathematics (76.8%), while the most female-oriented occupations are Health Diagnosing & Treating (74.3%), Health Technologists (73.4%), and Education Instruction & Library (72.2%).
| Occupation | Male | Female |
| Management | 12,482 (54.8%) | 10,298 (45.2%) |
| Business & Financial | 6,046 (49.0%) | 6,282 (51.0%) |
| Computers, Engineering & Science | 11,027 (77.8%) | 3,141 (22.2%) |
| Computers & Mathematics | 4,828 (76.8%) | 1,456 (23.2%) |
| Architecture & Engineering | 5,007 (88.5%) | 653 (11.5%) |
| Life, Physical & Social Science | 1,192 (53.6%) | 1,032 (46.4%) |
| Community & Social Service | 10,693 (32.5%) | 22,183 (67.5%) |
| Education, Arts & Media | 1,632 (30.4%) | 3,734 (69.6%) |
| Legal Services & Support | 1,433 (52.2%) | 1,312 (47.8%) |
| Education Instruction & Library | 5,746 (27.8%) | 14,910 (72.2%) |
| Arts, Media & Entertainment | 1,882 (45.8%) | 2,227 (54.2%) |
| Health Diagnosing & Treating | 4,790 (25.7%) | 13,818 (74.3%) |
| Health Technologists | 3,497 (26.6%) | 9,650 (73.4%) |
| Total (Category) | 45,038 (44.7%) | 55,722 (55.3%) |
| Total (Overall) | 114,462 (50.7%) | 111,445 (49.3%) |
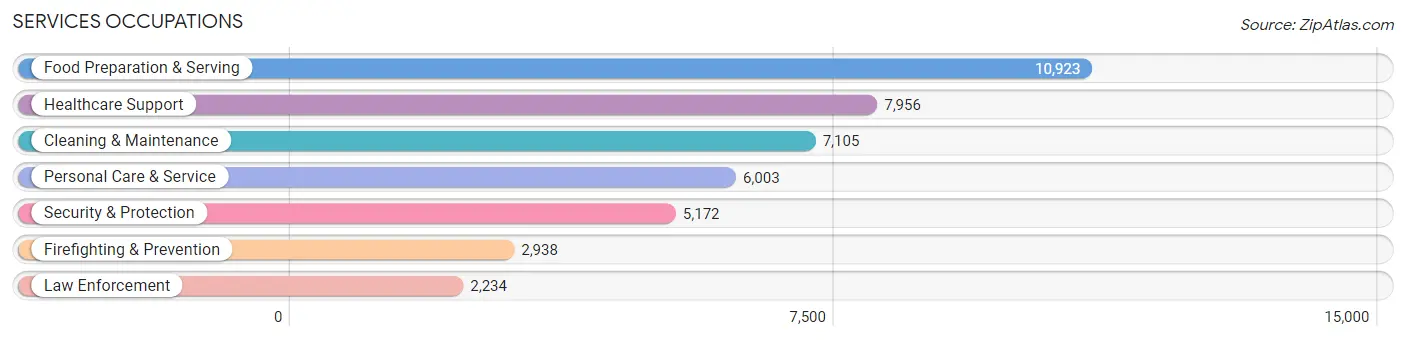
Services Occupations
The most common Services occupations in Onondaga County are Food Preparation & Serving (10,923 | 4.8%), Healthcare Support (7,956 | 3.5%), Cleaning & Maintenance (7,105 | 3.2%), Personal Care & Service (6,003 | 2.7%), and Security & Protection (5,172 | 2.3%).
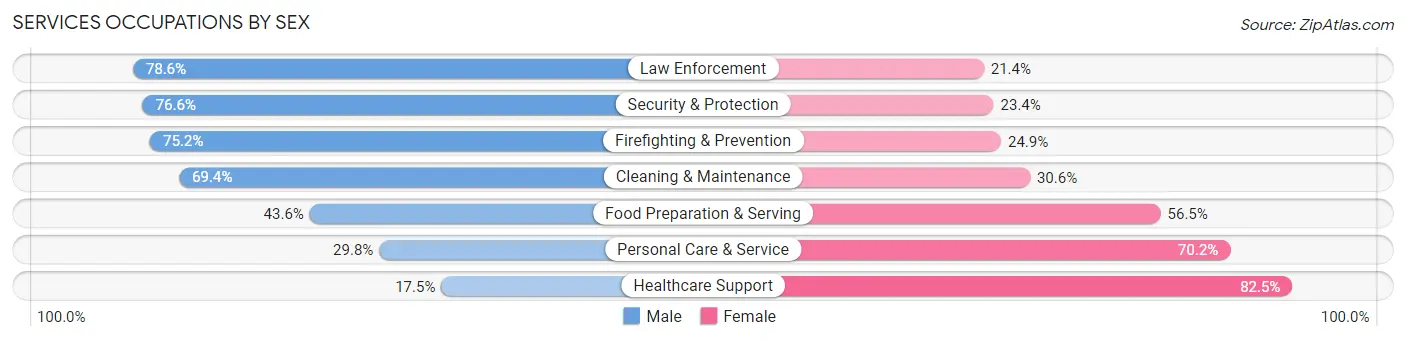
Services Occupations by Sex
Within the Services occupations in Onondaga County, the most male-oriented occupations are Law Enforcement (78.6%), Security & Protection (76.6%), and Firefighting & Prevention (75.1%), while the most female-oriented occupations are Healthcare Support (82.5%), Personal Care & Service (70.2%), and Food Preparation & Serving (56.5%).
| Occupation | Male | Female |
| Healthcare Support | 1,392 (17.5%) | 6,564 (82.5%) |
| Security & Protection | 3,963 (76.6%) | 1,209 (23.4%) |
| Firefighting & Prevention | 2,208 (75.1%) | 730 (24.8%) |
| Law Enforcement | 1,755 (78.6%) | 479 (21.4%) |
| Food Preparation & Serving | 4,757 (43.5%) | 6,166 (56.5%) |
| Cleaning & Maintenance | 4,932 (69.4%) | 2,173 (30.6%) |
| Personal Care & Service | 1,788 (29.8%) | 4,215 (70.2%) |
| Total (Category) | 16,832 (45.3%) | 20,327 (54.7%) |
| Total (Overall) | 114,462 (50.7%) | 111,445 (49.3%) |
Sales and Office Occupations
The most common Sales and Office occupations in Onondaga County are Office & Administration (27,180 | 12.0%), and Sales & Related (22,193 | 9.8%).

Sales and Office Occupations by Sex
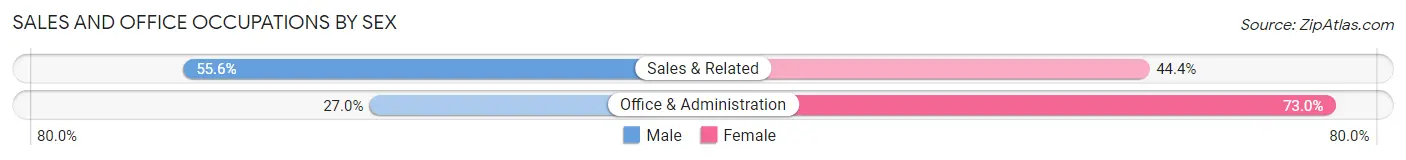
| Occupation | Male | Female |
| Sales & Related | 12,338 (55.6%) | 9,855 (44.4%) |
| Office & Administration | 7,332 (27.0%) | 19,848 (73.0%) |
| Total (Category) | 19,670 (39.8%) | 29,703 (60.2%) |
| Total (Overall) | 114,462 (50.7%) | 111,445 (49.3%) |
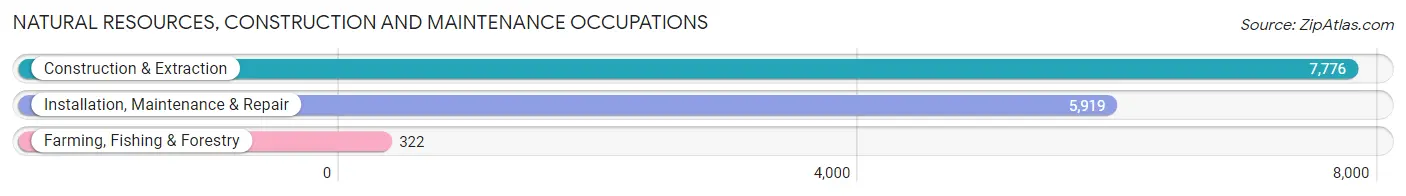
Natural Resources, Construction and Maintenance Occupations
The most common Natural Resources, Construction and Maintenance occupations in Onondaga County are Construction & Extraction (7,776 | 3.4%), Installation, Maintenance & Repair (5,919 | 2.6%), and Farming, Fishing & Forestry (322 | 0.1%).
Natural Resources, Construction and Maintenance Occupations by Sex
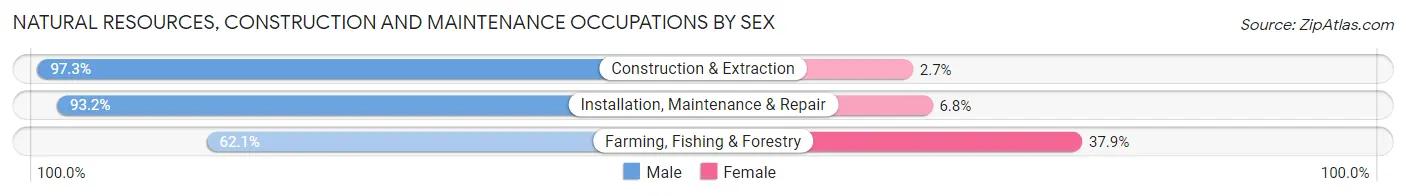
| Occupation | Male | Female |
| Farming, Fishing & Forestry | 200 (62.1%) | 122 (37.9%) |
| Construction & Extraction | 7,567 (97.3%) | 209 (2.7%) |
| Installation, Maintenance & Repair | 5,518 (93.2%) | 401 (6.8%) |
| Total (Category) | 13,285 (94.8%) | 732 (5.2%) |
| Total (Overall) | 114,462 (50.7%) | 111,445 (49.3%) |
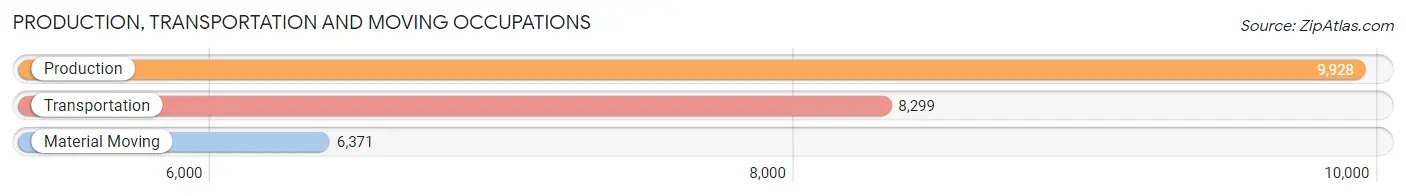
Production, Transportation and Moving Occupations
The most common Production, Transportation and Moving occupations in Onondaga County are Production (9,928 | 4.4%), Transportation (8,299 | 3.7%), and Material Moving (6,371 | 2.8%).
Production, Transportation and Moving Occupations by Sex
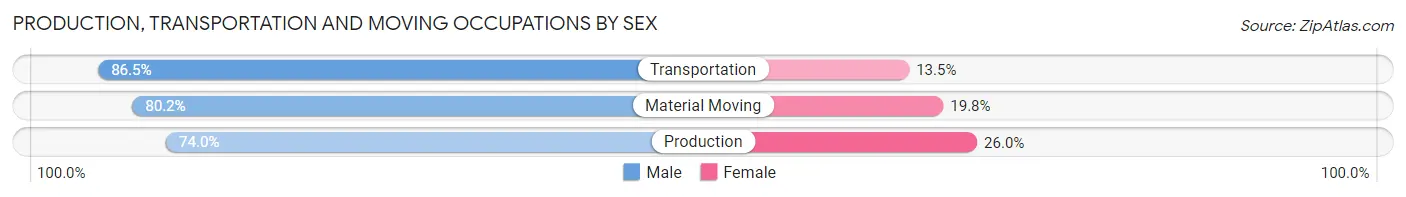
| Occupation | Male | Female |
| Production | 7,349 (74.0%) | 2,579 (26.0%) |
| Transportation | 7,177 (86.5%) | 1,122 (13.5%) |
| Material Moving | 5,111 (80.2%) | 1,260 (19.8%) |
| Total (Category) | 19,637 (79.8%) | 4,961 (20.2%) |
| Total (Overall) | 114,462 (50.7%) | 111,445 (49.3%) |
Employment Industries by Sex in Onondaga County
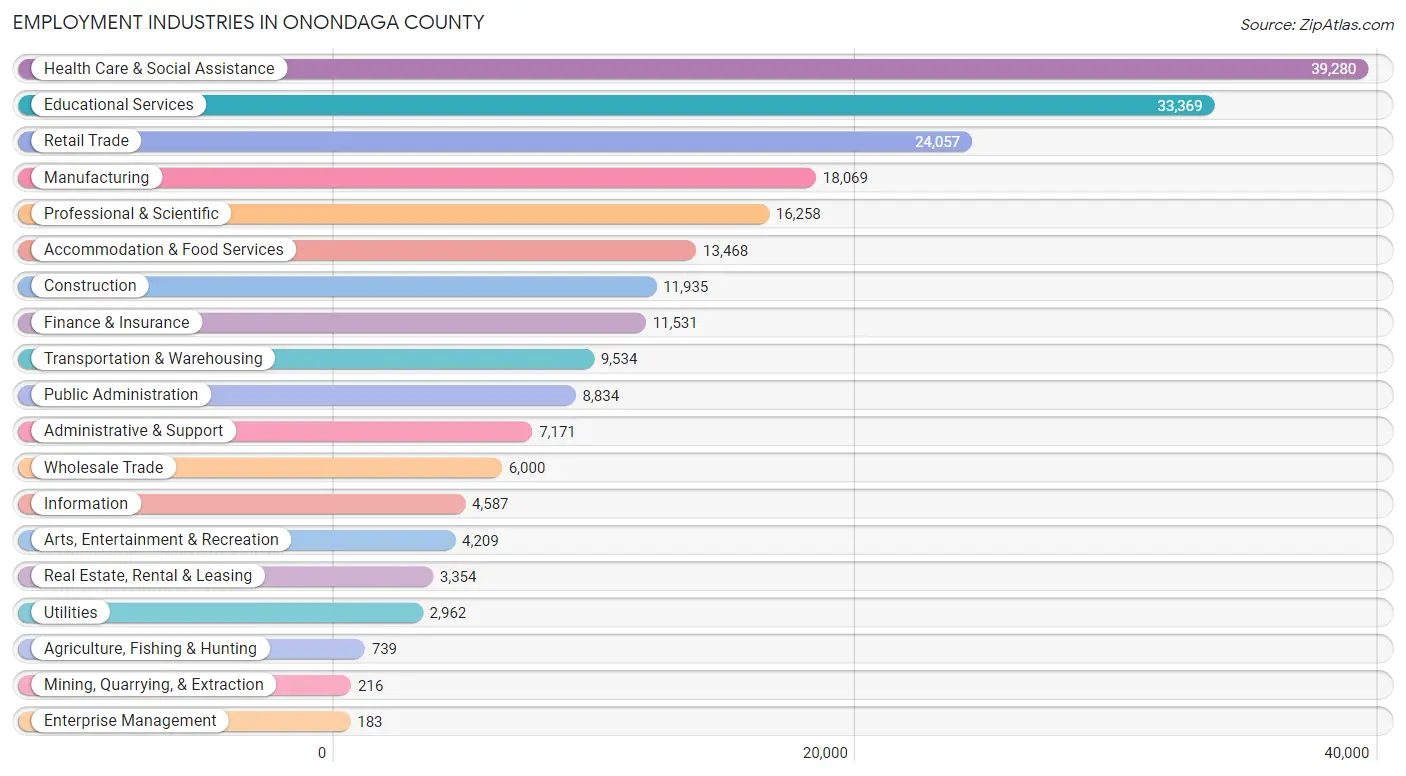
Employment Industries in Onondaga County
The major employment industries in Onondaga County include Health Care & Social Assistance (39,280 | 17.4%), Educational Services (33,369 | 14.8%), Retail Trade (24,057 | 10.6%), Manufacturing (18,069 | 8.0%), and Professional & Scientific (16,258 | 7.2%).
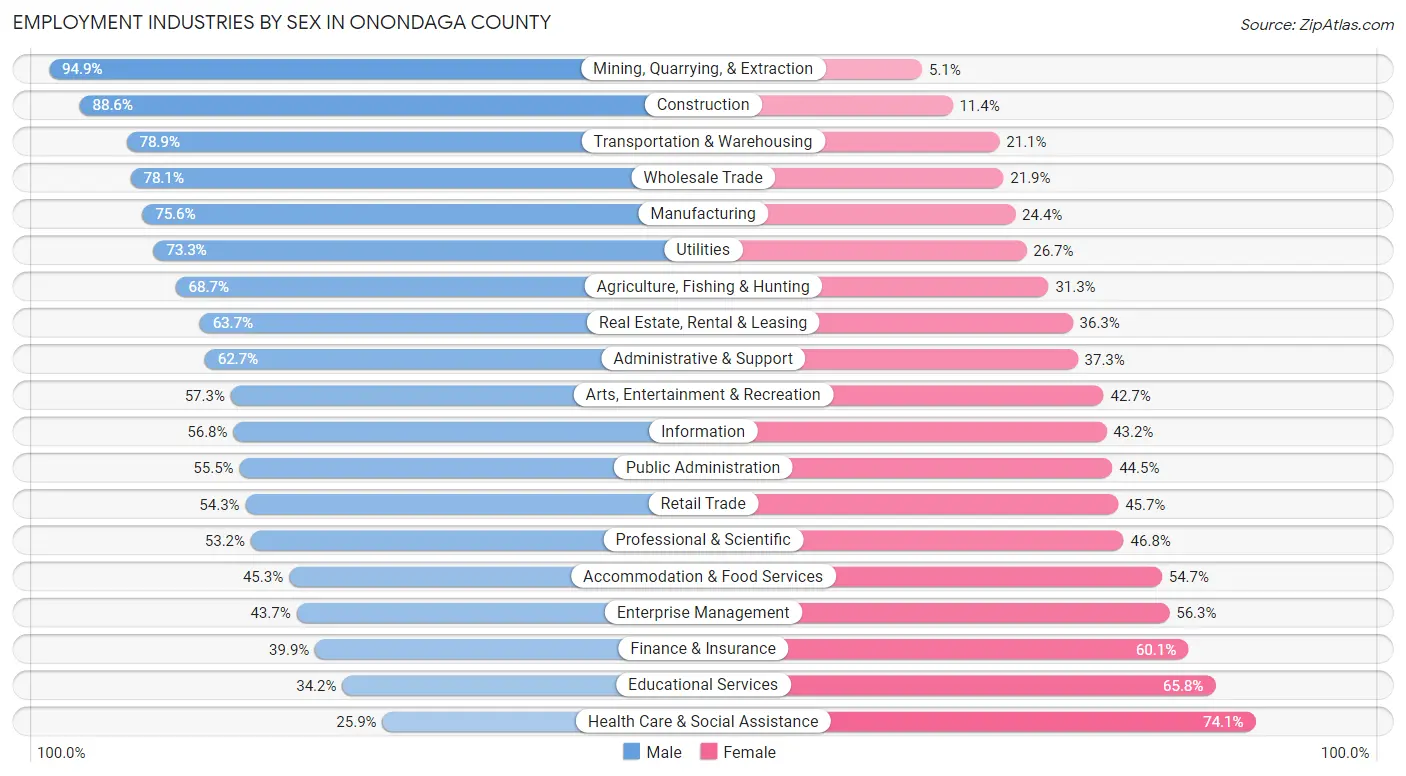
Employment Industries by Sex in Onondaga County
The Onondaga County industries that see more men than women are Mining, Quarrying, & Extraction (94.9%), Construction (88.6%), and Transportation & Warehousing (78.9%), whereas the industries that tend to have a higher number of women are Health Care & Social Assistance (74.1%), Educational Services (65.8%), and Finance & Insurance (60.1%).
| Industry | Male | Female |
| Agriculture, Fishing & Hunting | 508 (68.7%) | 231 (31.3%) |
| Mining, Quarrying, & Extraction | 205 (94.9%) | 11 (5.1%) |
| Construction | 10,575 (88.6%) | 1,360 (11.4%) |
| Manufacturing | 13,666 (75.6%) | 4,403 (24.4%) |
| Wholesale Trade | 4,684 (78.1%) | 1,316 (21.9%) |
| Retail Trade | 13,062 (54.3%) | 10,995 (45.7%) |
| Transportation & Warehousing | 7,522 (78.9%) | 2,012 (21.1%) |
| Utilities | 2,172 (73.3%) | 790 (26.7%) |
| Information | 2,605 (56.8%) | 1,982 (43.2%) |
| Finance & Insurance | 4,596 (39.9%) | 6,935 (60.1%) |
| Real Estate, Rental & Leasing | 2,138 (63.7%) | 1,216 (36.3%) |
| Professional & Scientific | 8,644 (53.2%) | 7,614 (46.8%) |
| Enterprise Management | 80 (43.7%) | 103 (56.3%) |
| Administrative & Support | 4,496 (62.7%) | 2,675 (37.3%) |
| Educational Services | 11,427 (34.2%) | 21,942 (65.8%) |
| Health Care & Social Assistance | 10,188 (25.9%) | 29,092 (74.1%) |
| Arts, Entertainment & Recreation | 2,413 (57.3%) | 1,796 (42.7%) |
| Accommodation & Food Services | 6,098 (45.3%) | 7,370 (54.7%) |
| Public Administration | 4,906 (55.5%) | 3,928 (44.5%) |
| Total | 114,462 (50.7%) | 111,445 (49.3%) |
Education in Onondaga County
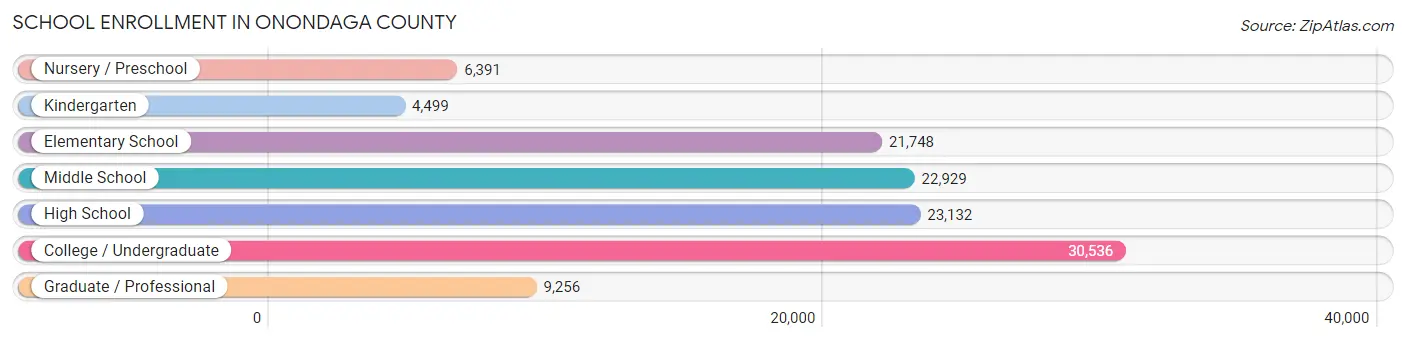
School Enrollment in Onondaga County
The most common levels of schooling among the 118,491 students in Onondaga County are college / undergraduate (30,536 | 25.8%), high school (23,132 | 19.5%), and middle school (22,929 | 19.4%).
| School Level | # Students | % Students |
| Nursery / Preschool | 6,391 | 5.4% |
| Kindergarten | 4,499 | 3.8% |
| Elementary School | 21,748 | 18.3% |
| Middle School | 22,929 | 19.4% |
| High School | 23,132 | 19.5% |
| College / Undergraduate | 30,536 | 25.8% |
| Graduate / Professional | 9,256 | 7.8% |
| Total | 118,491 | 100.0% |
School Enrollment by Age by Funding Source in Onondaga County
Out of a total of 118,491 students who are enrolled in schools in Onondaga County, 29,860 (25.2%) attend a private institution, while the remaining 88,631 (74.8%) are enrolled in public schools. The age group of 18 to 19 year olds has the highest likelihood of being enrolled in private schools, with 8,389 (57.8% in the age bracket) enrolled. Conversely, the age group of 10 to 14 year olds has the lowest likelihood of being enrolled in a private school, with 26,336 (93.1% in the age bracket) attending a public institution.
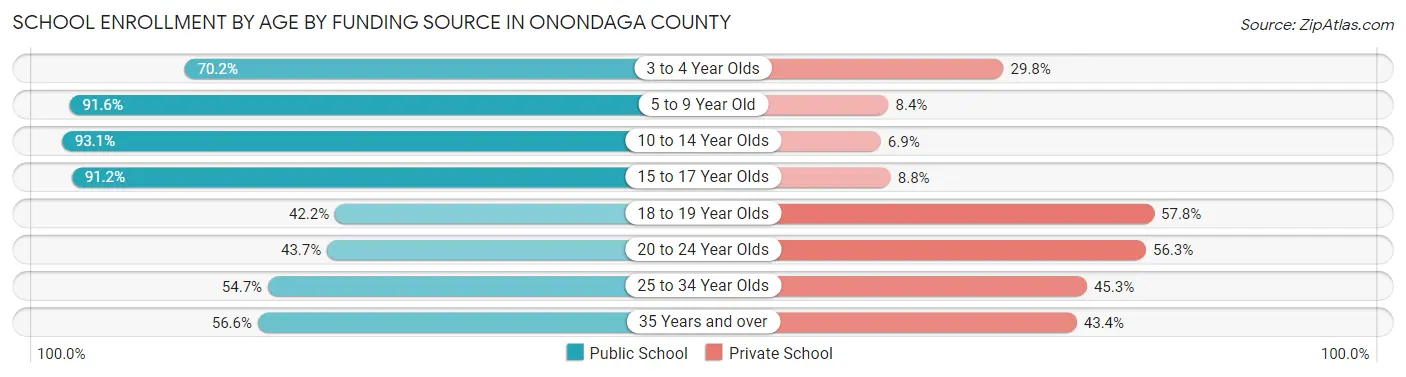
| Age Bracket | Public School | Private School |
| 3 to 4 Year Olds | 3,774 (70.2%) | 1,601 (29.8%) |
| 5 to 9 Year Old | 23,302 (91.6%) | 2,129 (8.4%) |
| 10 to 14 Year Olds | 26,336 (93.1%) | 1,963 (6.9%) |
| 15 to 17 Year Olds | 15,424 (91.2%) | 1,487 (8.8%) |
| 18 to 19 Year Olds | 6,121 (42.2%) | 8,389 (57.8%) |
| 20 to 24 Year Olds | 6,704 (43.7%) | 8,647 (56.3%) |
| 25 to 34 Year Olds | 4,143 (54.7%) | 3,434 (45.3%) |
| 35 Years and over | 2,849 (56.6%) | 2,188 (43.4%) |
| Total | 88,631 (74.8%) | 29,860 (25.2%) |
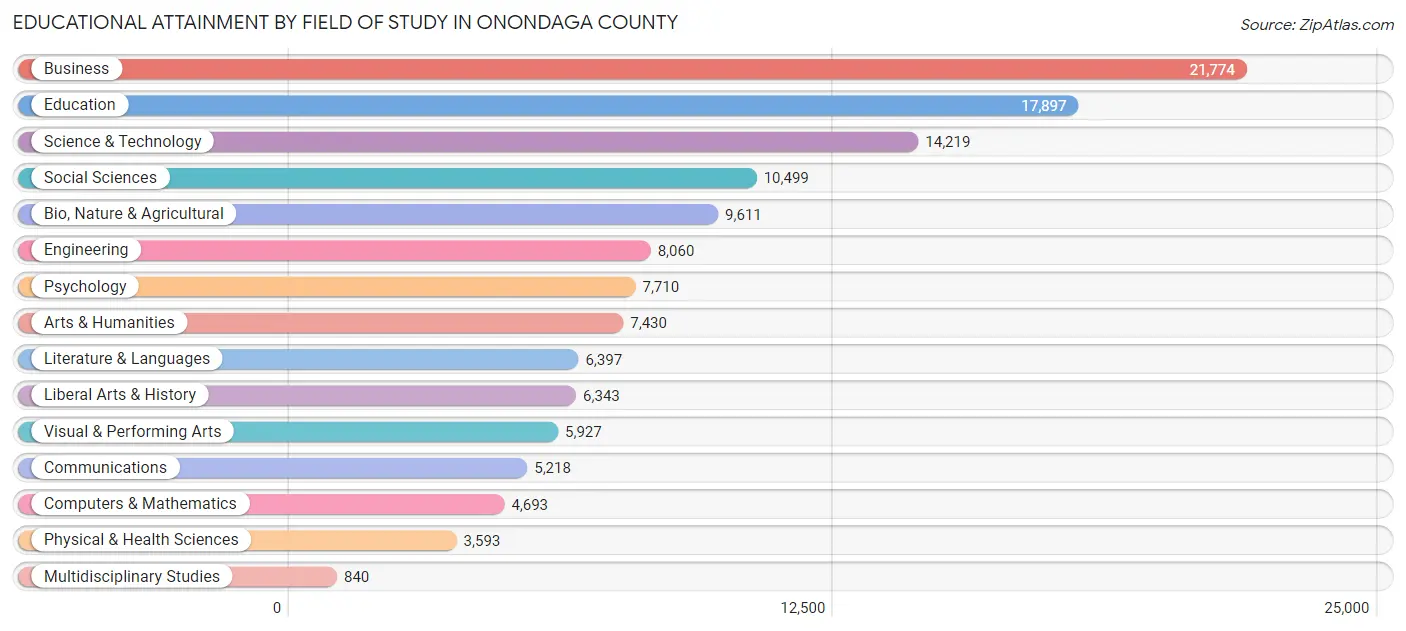
Educational Attainment by Field of Study in Onondaga County
Business (21,774 | 16.7%), education (17,897 | 13.7%), science & technology (14,219 | 10.9%), social sciences (10,499 | 8.1%), and bio, nature & agricultural (9,611 | 7.4%) are the most common fields of study among 130,211 individuals in Onondaga County who have obtained a bachelor's degree or higher.
| Field of Study | # Graduates | % Graduates |
| Computers & Mathematics | 4,693 | 3.6% |
| Bio, Nature & Agricultural | 9,611 | 7.4% |
| Physical & Health Sciences | 3,593 | 2.8% |
| Psychology | 7,710 | 5.9% |
| Social Sciences | 10,499 | 8.1% |
| Engineering | 8,060 | 6.2% |
| Multidisciplinary Studies | 840 | 0.6% |
| Science & Technology | 14,219 | 10.9% |
| Business | 21,774 | 16.7% |
| Education | 17,897 | 13.7% |
| Literature & Languages | 6,397 | 4.9% |
| Liberal Arts & History | 6,343 | 4.9% |
| Visual & Performing Arts | 5,927 | 4.5% |
| Communications | 5,218 | 4.0% |
| Arts & Humanities | 7,430 | 5.7% |
| Total | 130,211 | 100.0% |
Transportation & Commute in Onondaga County
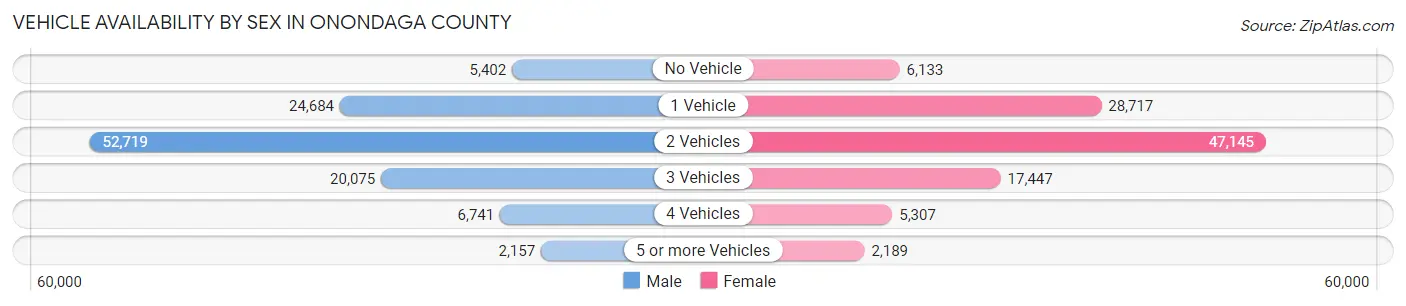
Vehicle Availability by Sex in Onondaga County
The most prevalent vehicle ownership categories in Onondaga County are males with 2 vehicles (52,719, accounting for 47.2%) and females with 2 vehicles (47,145, making up 49.3%).
| Vehicles Available | Male | Female |
| No Vehicle | 5,402 (4.8%) | 6,133 (5.7%) |
| 1 Vehicle | 24,684 (22.1%) | 28,717 (26.9%) |
| 2 Vehicles | 52,719 (47.2%) | 47,145 (44.1%) |
| 3 Vehicles | 20,075 (18.0%) | 17,447 (16.3%) |
| 4 Vehicles | 6,741 (6.0%) | 5,307 (5.0%) |
| 5 or more Vehicles | 2,157 (1.9%) | 2,189 (2.1%) |
| Total | 111,778 (100.0%) | 106,938 (100.0%) |
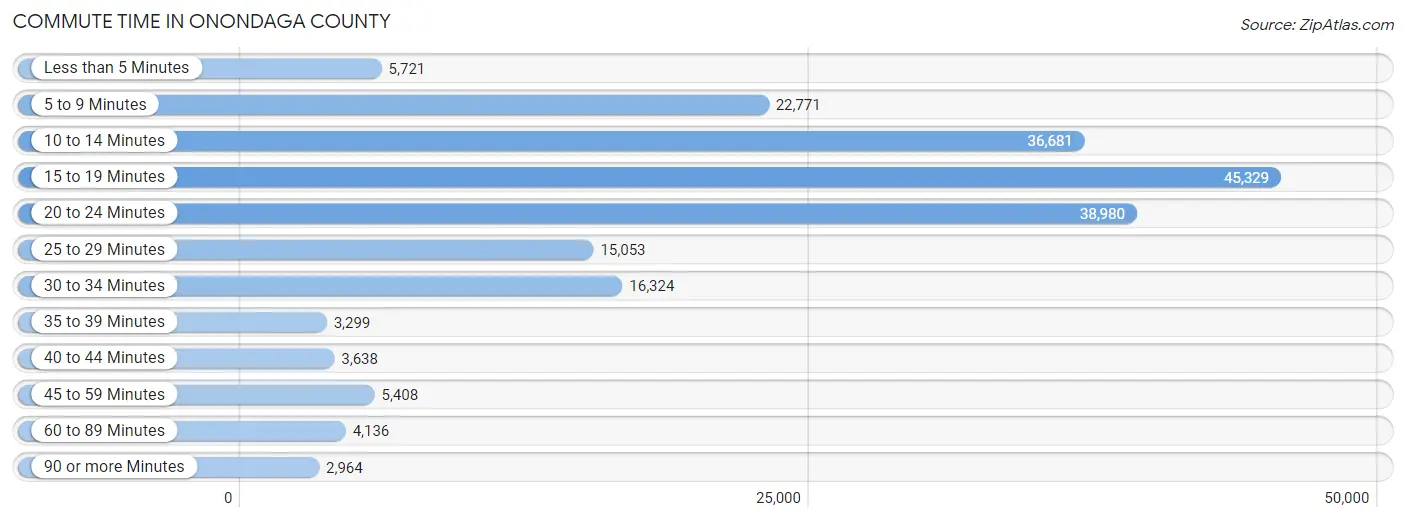
Commute Time in Onondaga County
The most frequently occuring commute durations in Onondaga County are 15 to 19 minutes (45,329 commuters, 22.6%), 20 to 24 minutes (38,980 commuters, 19.5%), and 10 to 14 minutes (36,681 commuters, 18.3%).
| Commute Time | # Commuters | % Commuters |
| Less than 5 Minutes | 5,721 | 2.9% |
| 5 to 9 Minutes | 22,771 | 11.4% |
| 10 to 14 Minutes | 36,681 | 18.3% |
| 15 to 19 Minutes | 45,329 | 22.6% |
| 20 to 24 Minutes | 38,980 | 19.5% |
| 25 to 29 Minutes | 15,053 | 7.5% |
| 30 to 34 Minutes | 16,324 | 8.2% |
| 35 to 39 Minutes | 3,299 | 1.7% |
| 40 to 44 Minutes | 3,638 | 1.8% |
| 45 to 59 Minutes | 5,408 | 2.7% |
| 60 to 89 Minutes | 4,136 | 2.1% |
| 90 or more Minutes | 2,964 | 1.5% |
Commute Time by Sex in Onondaga County
The most common commute times in Onondaga County are 15 to 19 minutes (22,448 commuters, 21.8%) for males and 15 to 19 minutes (22,881 commuters, 23.5%) for females.
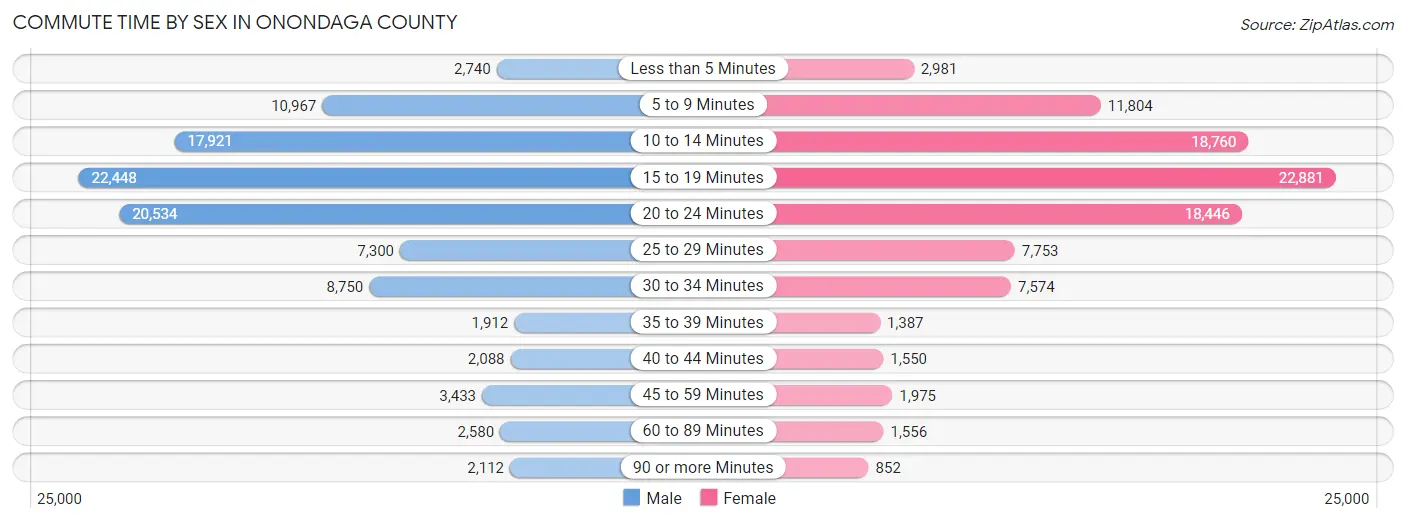
| Commute Time | Male | Female |
| Less than 5 Minutes | 2,740 (2.7%) | 2,981 (3.1%) |
| 5 to 9 Minutes | 10,967 (10.7%) | 11,804 (12.1%) |
| 10 to 14 Minutes | 17,921 (17.4%) | 18,760 (19.2%) |
| 15 to 19 Minutes | 22,448 (21.8%) | 22,881 (23.5%) |
| 20 to 24 Minutes | 20,534 (20.0%) | 18,446 (18.9%) |
| 25 to 29 Minutes | 7,300 (7.1%) | 7,753 (8.0%) |
| 30 to 34 Minutes | 8,750 (8.5%) | 7,574 (7.8%) |
| 35 to 39 Minutes | 1,912 (1.9%) | 1,387 (1.4%) |
| 40 to 44 Minutes | 2,088 (2.0%) | 1,550 (1.6%) |
| 45 to 59 Minutes | 3,433 (3.3%) | 1,975 (2.0%) |
| 60 to 89 Minutes | 2,580 (2.5%) | 1,556 (1.6%) |
| 90 or more Minutes | 2,112 (2.1%) | 852 (0.9%) |
Time of Departure to Work by Sex in Onondaga County
The most frequent times of departure to work in Onondaga County are 7:00 AM to 7:29 AM (14,006, 13.6%) for males and 7:30 AM to 7:59 AM (16,806, 17.2%) for females.
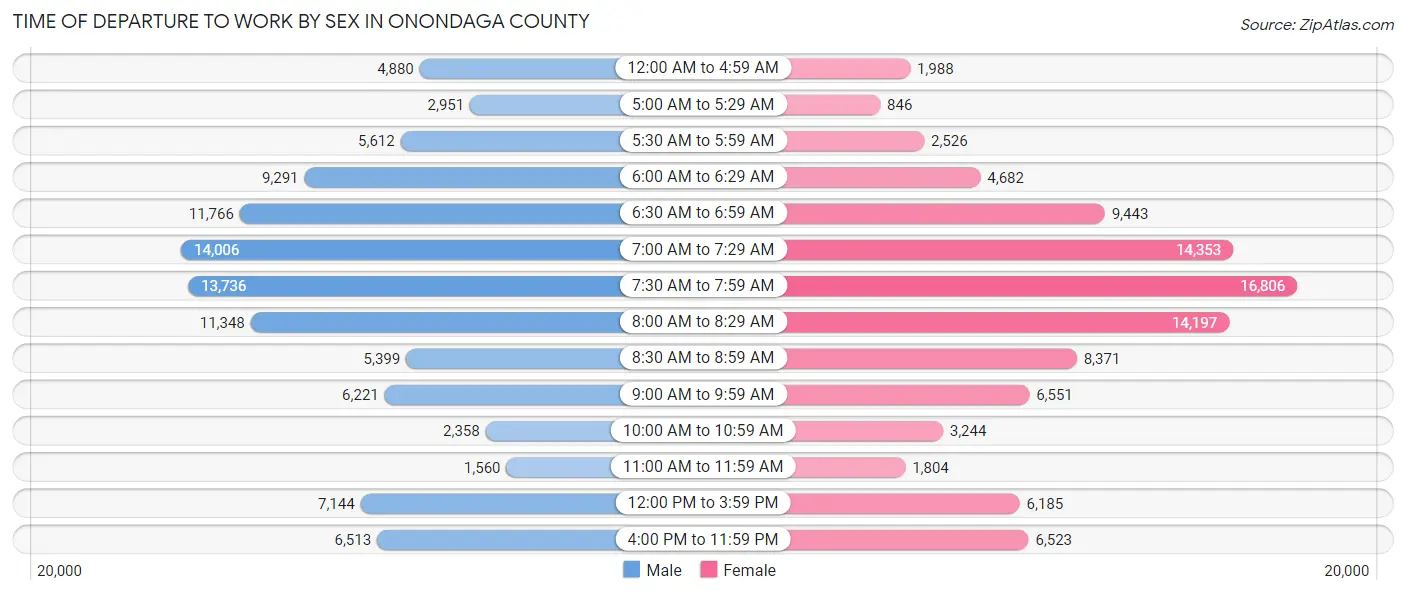
| Time of Departure | Male | Female |
| 12:00 AM to 4:59 AM | 4,880 (4.8%) | 1,988 (2.0%) |
| 5:00 AM to 5:29 AM | 2,951 (2.9%) | 846 (0.9%) |
| 5:30 AM to 5:59 AM | 5,612 (5.5%) | 2,526 (2.6%) |
| 6:00 AM to 6:29 AM | 9,291 (9.0%) | 4,682 (4.8%) |
| 6:30 AM to 6:59 AM | 11,766 (11.5%) | 9,443 (9.7%) |
| 7:00 AM to 7:29 AM | 14,006 (13.6%) | 14,353 (14.7%) |
| 7:30 AM to 7:59 AM | 13,736 (13.4%) | 16,806 (17.2%) |
| 8:00 AM to 8:29 AM | 11,348 (11.0%) | 14,197 (14.6%) |
| 8:30 AM to 8:59 AM | 5,399 (5.2%) | 8,371 (8.6%) |
| 9:00 AM to 9:59 AM | 6,221 (6.0%) | 6,551 (6.7%) |
| 10:00 AM to 10:59 AM | 2,358 (2.3%) | 3,244 (3.3%) |
| 11:00 AM to 11:59 AM | 1,560 (1.5%) | 1,804 (1.8%) |
| 12:00 PM to 3:59 PM | 7,144 (7.0%) | 6,185 (6.3%) |
| 4:00 PM to 11:59 PM | 6,513 (6.3%) | 6,523 (6.7%) |
| Total | 102,785 (100.0%) | 97,519 (100.0%) |
Housing Occupancy in Onondaga County
Occupancy by Ownership in Onondaga County
Of the total 192,785 dwellings in Onondaga County, owner-occupied units account for 125,899 (65.3%), while renter-occupied units make up 66,886 (34.7%).
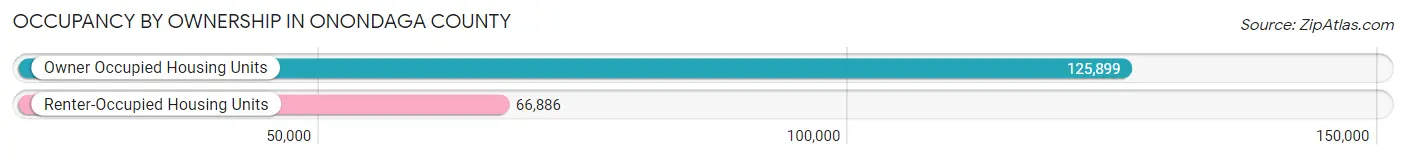
| Occupancy | # Housing Units | % Housing Units |
| Owner Occupied Housing Units | 125,899 | 65.3% |
| Renter-Occupied Housing Units | 66,886 | 34.7% |
| Total Occupied Housing Units | 192,785 | 100.0% |
Occupancy by Household Size in Onondaga County
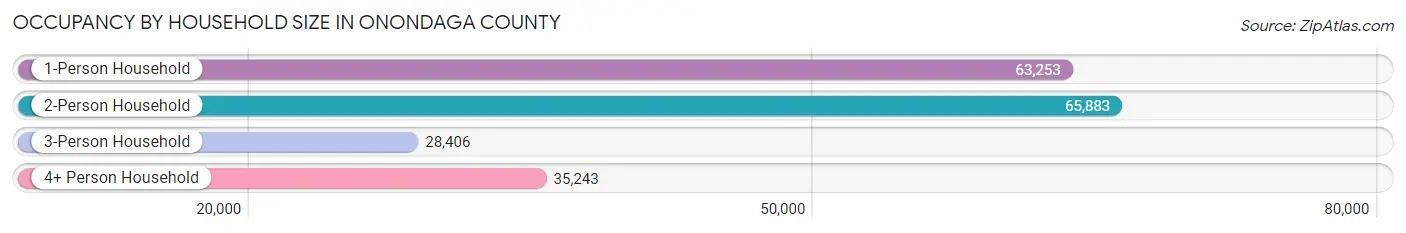
| Household Size | # Housing Units | % Housing Units |
| 1-Person Household | 63,253 | 32.8% |
| 2-Person Household | 65,883 | 34.2% |
| 3-Person Household | 28,406 | 14.7% |
| 4+ Person Household | 35,243 | 18.3% |
| Total Housing Units | 192,785 | 100.0% |
Occupancy by Ownership by Household Size in Onondaga County
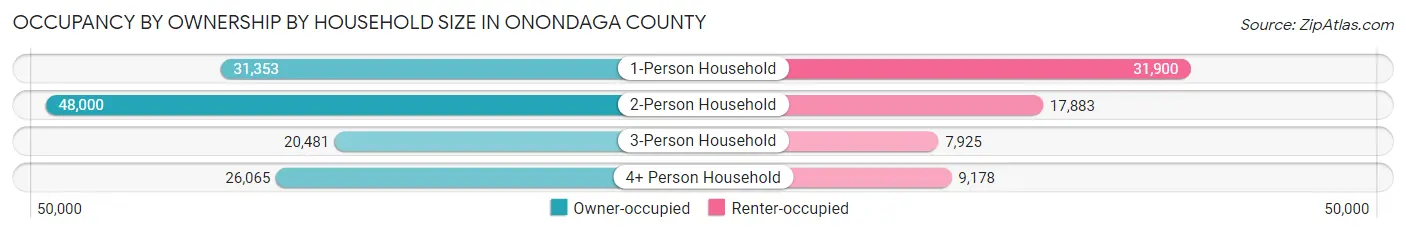
| Household Size | Owner-occupied | Renter-occupied |
| 1-Person Household | 31,353 (49.6%) | 31,900 (50.4%) |
| 2-Person Household | 48,000 (72.9%) | 17,883 (27.1%) |
| 3-Person Household | 20,481 (72.1%) | 7,925 (27.9%) |
| 4+ Person Household | 26,065 (74.0%) | 9,178 (26.0%) |
| Total Housing Units | 125,899 (65.3%) | 66,886 (34.7%) |
Occupancy by Educational Attainment in Onondaga County
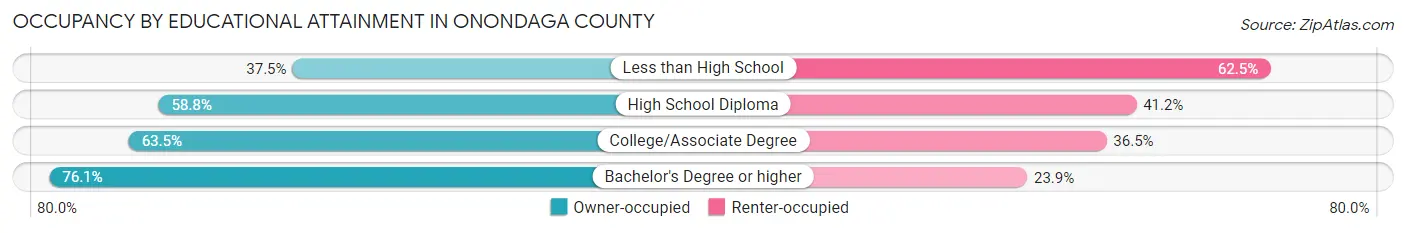
| Household Size | Owner-occupied | Renter-occupied |
| Less than High School | 5,527 (37.5%) | 9,200 (62.5%) |
| High School Diploma | 26,078 (58.8%) | 18,306 (41.2%) |
| College/Associate Degree | 37,282 (63.5%) | 21,445 (36.5%) |
| Bachelor's Degree or higher | 57,012 (76.1%) | 17,935 (23.9%) |
Occupancy by Age of Householder in Onondaga County
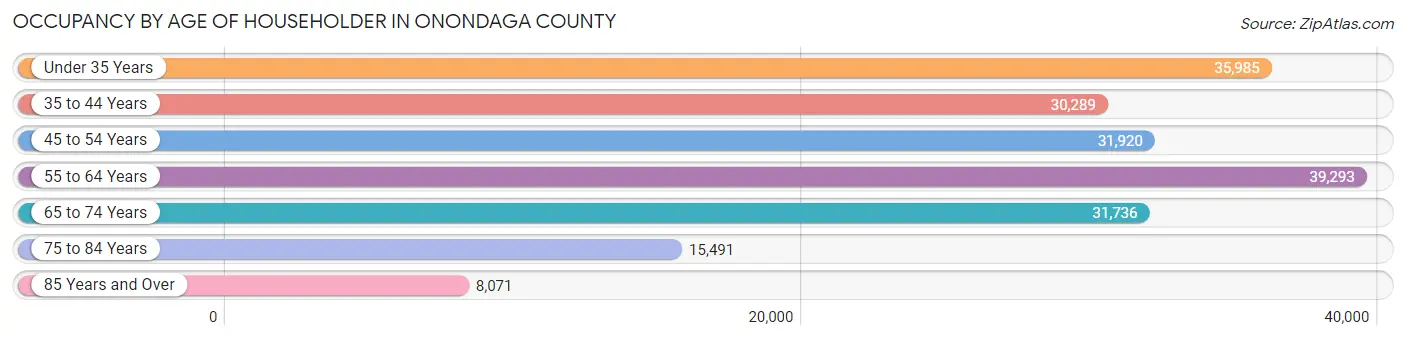
| Age Bracket | # Households | % Households |
| Under 35 Years | 35,985 | 18.7% |
| 35 to 44 Years | 30,289 | 15.7% |
| 45 to 54 Years | 31,920 | 16.6% |
| 55 to 64 Years | 39,293 | 20.4% |
| 65 to 74 Years | 31,736 | 16.5% |
| 75 to 84 Years | 15,491 | 8.0% |
| 85 Years and Over | 8,071 | 4.2% |
| Total | 192,785 | 100.0% |
Housing Finances in Onondaga County
Median Income by Occupancy in Onondaga County
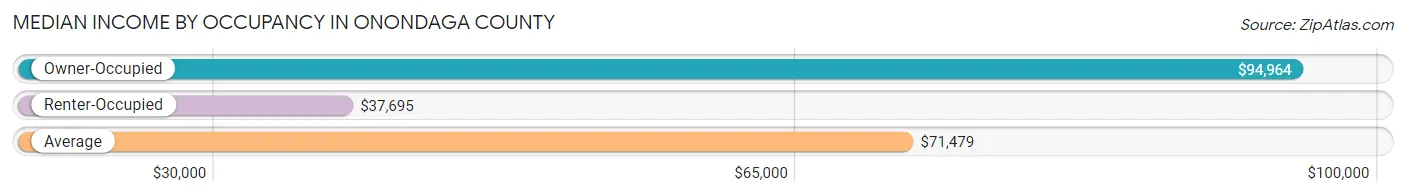
| Occupancy Type | # Households | Median Income |
| Owner-Occupied | 125,899 (65.3%) | $94,964 |
| Renter-Occupied | 66,886 (34.7%) | $37,695 |
| Average | 192,785 (100.0%) | $71,479 |
Occupancy by Householder Income Bracket in Onondaga County
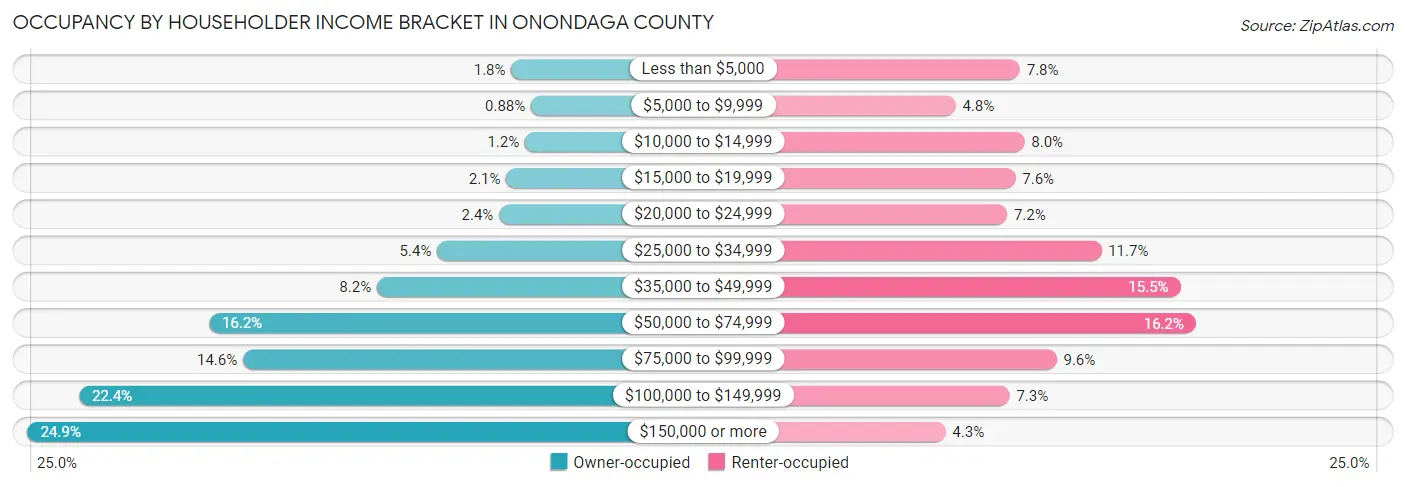
| Income Bracket | Owner-occupied | Renter-occupied |
| Less than $5,000 | 2,290 (1.8%) | 5,231 (7.8%) |
| $5,000 to $9,999 | 1,114 (0.9%) | 3,187 (4.8%) |
| $10,000 to $14,999 | 1,469 (1.2%) | 5,378 (8.0%) |
| $15,000 to $19,999 | 2,599 (2.1%) | 5,092 (7.6%) |
| $20,000 to $24,999 | 3,026 (2.4%) | 4,822 (7.2%) |
| $25,000 to $34,999 | 6,741 (5.3%) | 7,828 (11.7%) |
| $35,000 to $49,999 | 10,349 (8.2%) | 10,349 (15.5%) |
| $50,000 to $74,999 | 20,424 (16.2%) | 10,837 (16.2%) |
| $75,000 to $99,999 | 18,380 (14.6%) | 6,401 (9.6%) |
| $100,000 to $149,999 | 28,210 (22.4%) | 4,901 (7.3%) |
| $150,000 or more | 31,297 (24.9%) | 2,860 (4.3%) |
| Total | 125,899 (100.0%) | 66,886 (100.0%) |
Monthly Housing Cost Tiers in Onondaga County
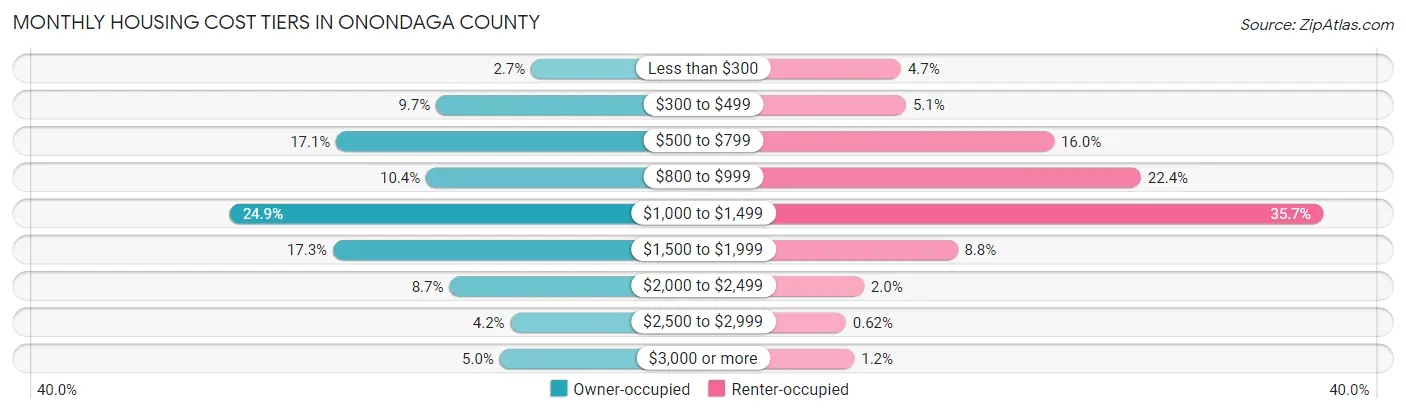
| Monthly Cost | Owner-occupied | Renter-occupied |
| Less than $300 | 3,398 (2.7%) | 3,130 (4.7%) |
| $300 to $499 | 12,207 (9.7%) | 3,379 (5.1%) |
| $500 to $799 | 21,463 (17.1%) | 10,671 (16.0%) |
| $800 to $999 | 13,130 (10.4%) | 14,947 (22.4%) |
| $1,000 to $1,499 | 31,334 (24.9%) | 23,899 (35.7%) |
| $1,500 to $1,999 | 21,765 (17.3%) | 5,912 (8.8%) |
| $2,000 to $2,499 | 10,978 (8.7%) | 1,301 (1.9%) |
| $2,500 to $2,999 | 5,318 (4.2%) | 416 (0.6%) |
| $3,000 or more | 6,306 (5.0%) | 829 (1.2%) |
| Total | 125,899 (100.0%) | 66,886 (100.0%) |
Physical Housing Characteristics in Onondaga County
Housing Structures in Onondaga County
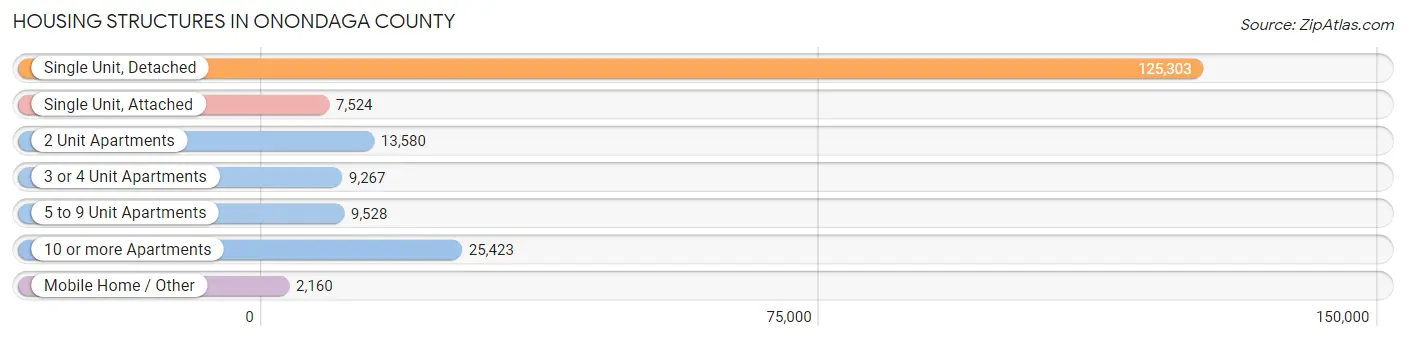
| Structure Type | # Housing Units | % Housing Units |
| Single Unit, Detached | 125,303 | 65.0% |
| Single Unit, Attached | 7,524 | 3.9% |
| 2 Unit Apartments | 13,580 | 7.0% |
| 3 or 4 Unit Apartments | 9,267 | 4.8% |
| 5 to 9 Unit Apartments | 9,528 | 4.9% |
| 10 or more Apartments | 25,423 | 13.2% |
| Mobile Home / Other | 2,160 | 1.1% |
| Total | 192,785 | 100.0% |
Housing Structures by Occupancy in Onondaga County
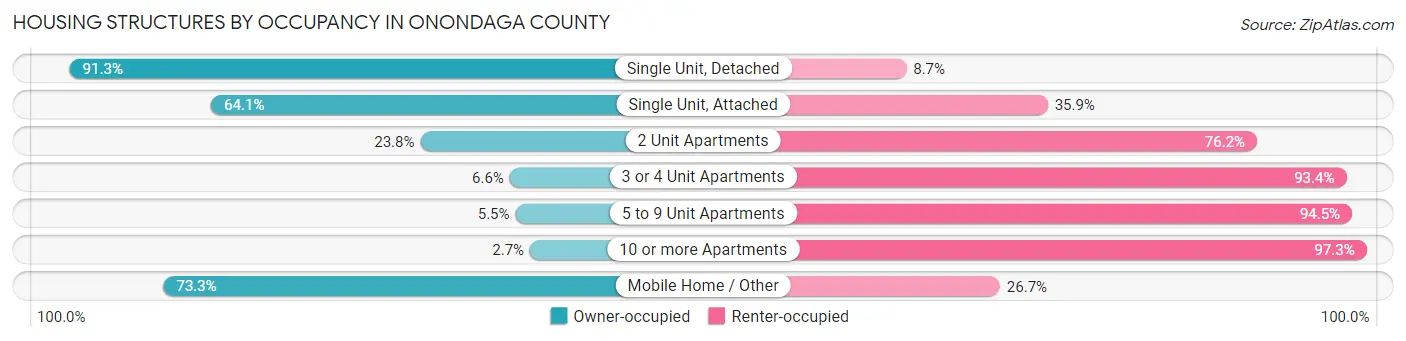
| Structure Type | Owner-occupied | Renter-occupied |
| Single Unit, Detached | 114,432 (91.3%) | 10,871 (8.7%) |
| Single Unit, Attached | 4,822 (64.1%) | 2,702 (35.9%) |
| 2 Unit Apartments | 3,234 (23.8%) | 10,346 (76.2%) |
| 3 or 4 Unit Apartments | 613 (6.6%) | 8,654 (93.4%) |
| 5 to 9 Unit Apartments | 525 (5.5%) | 9,003 (94.5%) |
| 10 or more Apartments | 690 (2.7%) | 24,733 (97.3%) |
| Mobile Home / Other | 1,583 (73.3%) | 577 (26.7%) |
| Total | 125,899 (65.3%) | 66,886 (34.7%) |
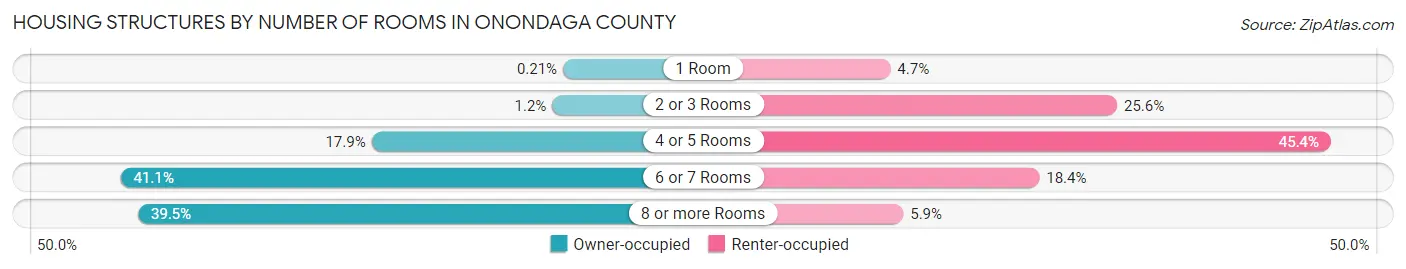
Housing Structures by Number of Rooms in Onondaga County
| Number of Rooms | Owner-occupied | Renter-occupied |
| 1 Room | 263 (0.2%) | 3,121 (4.7%) |
| 2 or 3 Rooms | 1,527 (1.2%) | 17,143 (25.6%) |
| 4 or 5 Rooms | 22,567 (17.9%) | 30,369 (45.4%) |
| 6 or 7 Rooms | 51,781 (41.1%) | 12,336 (18.4%) |
| 8 or more Rooms | 49,761 (39.5%) | 3,917 (5.9%) |
| Total | 125,899 (100.0%) | 66,886 (100.0%) |
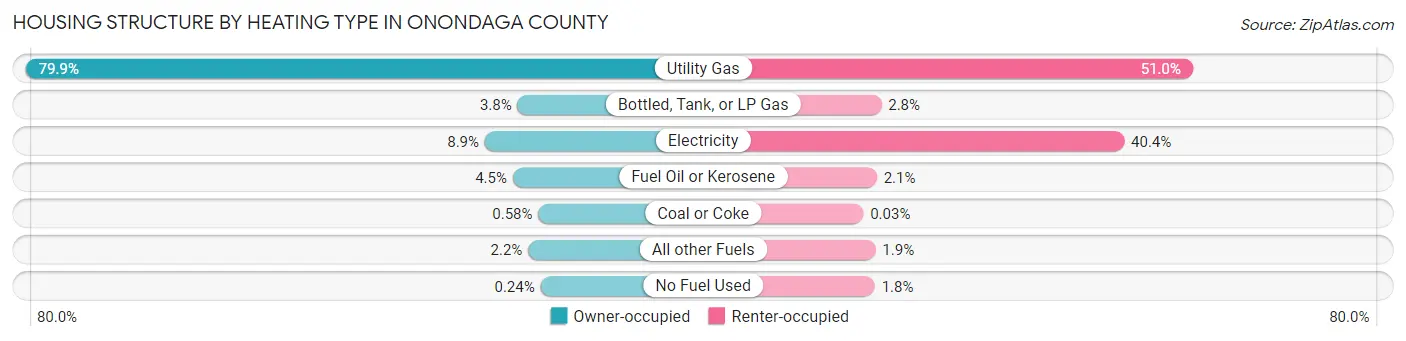
Housing Structure by Heating Type in Onondaga County
| Heating Type | Owner-occupied | Renter-occupied |
| Utility Gas | 100,525 (79.8%) | 34,089 (51.0%) |
| Bottled, Tank, or LP Gas | 4,788 (3.8%) | 1,883 (2.8%) |
| Electricity | 11,140 (8.8%) | 26,993 (40.4%) |
| Fuel Oil or Kerosene | 5,697 (4.5%) | 1,411 (2.1%) |
| Coal or Coke | 734 (0.6%) | 23 (0.0%) |
| All other Fuels | 2,710 (2.1%) | 1,276 (1.9%) |
| No Fuel Used | 305 (0.2%) | 1,211 (1.8%) |
| Total | 125,899 (100.0%) | 66,886 (100.0%) |
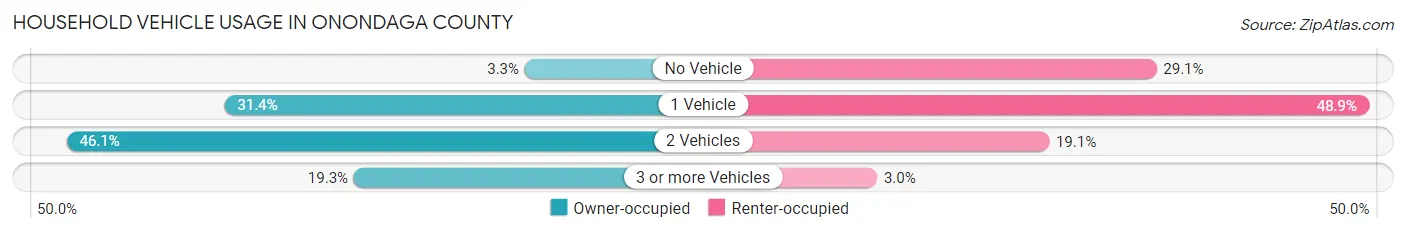
Household Vehicle Usage in Onondaga County
| Vehicles per Household | Owner-occupied | Renter-occupied |
| No Vehicle | 4,153 (3.3%) | 19,441 (29.1%) |
| 1 Vehicle | 39,468 (31.4%) | 32,706 (48.9%) |
| 2 Vehicles | 58,027 (46.1%) | 12,741 (19.1%) |
| 3 or more Vehicles | 24,251 (19.3%) | 1,998 (3.0%) |
| Total | 125,899 (100.0%) | 66,886 (100.0%) |
Real Estate & Mortgages in Onondaga County
Real Estate and Mortgage Overview in Onondaga County
| Characteristic | Without Mortgage | With Mortgage |
| Housing Units | 48,057 | 77,842 |
| Median Property Value | $164,500 | $178,000 |
| Median Household Income | $73,620 | $22,784 |
| Monthly Housing Costs | $650 | $6,184 |
| Real Estate Taxes | $4,057 | $1,961 |
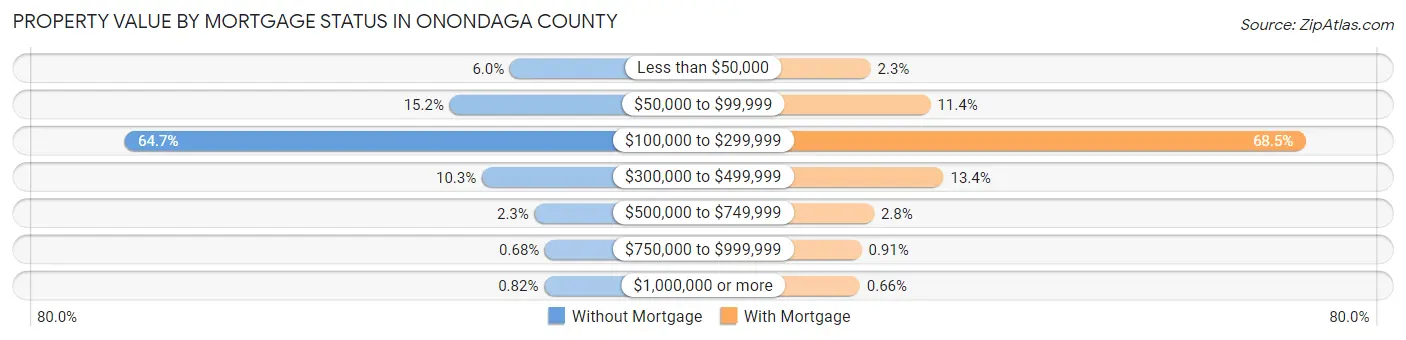
Property Value by Mortgage Status in Onondaga County
| Property Value | Without Mortgage | With Mortgage |
| Less than $50,000 | 2,896 (6.0%) | 1,780 (2.3%) |
| $50,000 to $99,999 | 7,313 (15.2%) | 8,887 (11.4%) |
| $100,000 to $299,999 | 31,080 (64.7%) | 53,333 (68.5%) |
| $300,000 to $499,999 | 4,951 (10.3%) | 10,437 (13.4%) |
| $500,000 to $749,999 | 1,094 (2.3%) | 2,186 (2.8%) |
| $750,000 to $999,999 | 329 (0.7%) | 706 (0.9%) |
| $1,000,000 or more | 394 (0.8%) | 513 (0.7%) |
| Total | 48,057 (100.0%) | 77,842 (100.0%) |
Household Income by Mortgage Status in Onondaga County

| Household Income | Without Mortgage | With Mortgage |
| Less than $10,000 | 2,260 (4.7%) | 3,509 (4.5%) |
| $10,000 to $24,999 | 4,763 (9.9%) | 1,144 (1.5%) |
| $25,000 to $34,999 | 3,768 (7.8%) | 2,331 (3.0%) |
| $35,000 to $49,999 | 5,082 (10.6%) | 2,973 (3.8%) |
| $50,000 to $74,999 | 8,623 (17.9%) | 5,267 (6.8%) |
| $75,000 to $99,999 | 6,733 (14.0%) | 11,801 (15.2%) |
| $100,000 to $149,999 | 8,315 (17.3%) | 11,647 (15.0%) |
| $150,000 or more | 8,513 (17.7%) | 19,895 (25.6%) |
| Total | 48,057 (100.0%) | 77,842 (100.0%) |
Property Value to Household Income Ratio in Onondaga County
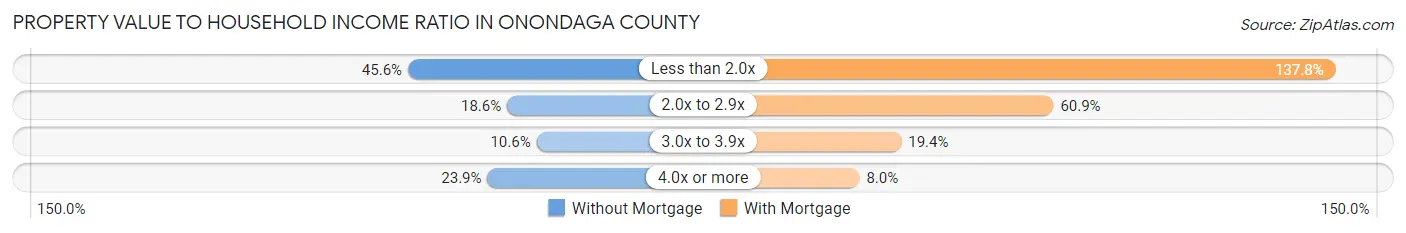
| Value-to-Income Ratio | Without Mortgage | With Mortgage |
| Less than 2.0x | 21,903 (45.6%) | 107,229 (137.7%) |
| 2.0x to 2.9x | 8,924 (18.6%) | 47,399 (60.9%) |
| 3.0x to 3.9x | 5,068 (10.5%) | 15,134 (19.4%) |
| 4.0x or more | 11,502 (23.9%) | 6,260 (8.0%) |
| Total | 48,057 (100.0%) | 77,842 (100.0%) |
Real Estate Taxes by Mortgage Status in Onondaga County
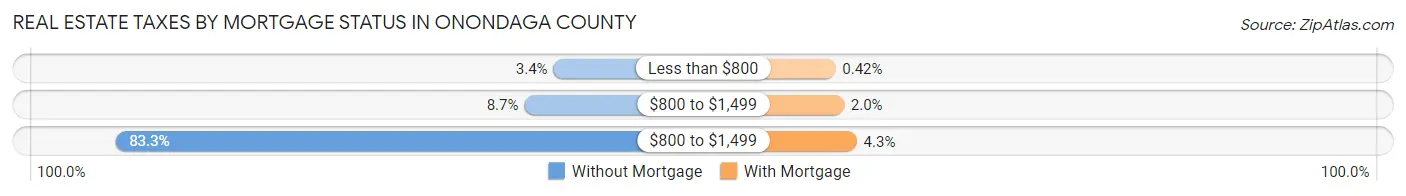
| Property Taxes | Without Mortgage | With Mortgage |
| Less than $800 | 1,640 (3.4%) | 329 (0.4%) |
| $800 to $1,499 | 4,196 (8.7%) | 1,531 (2.0%) |
| $800 to $1,499 | 40,014 (83.3%) | 3,358 (4.3%) |
| Total | 48,057 (100.0%) | 77,842 (100.0%) |
Health & Disability in Onondaga County
Health Insurance Coverage by Age in Onondaga County
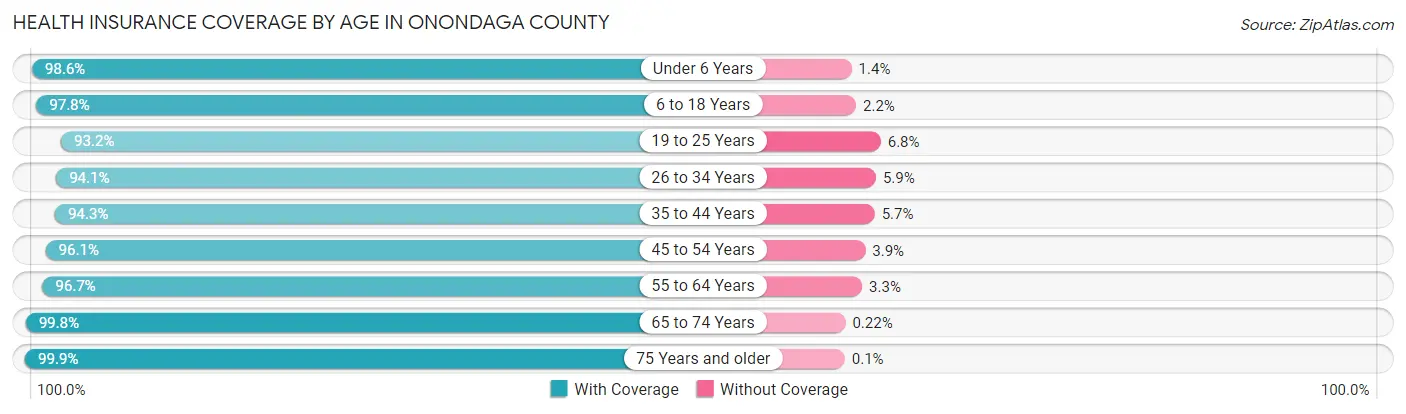
| Age Bracket | With Coverage | Without Coverage |
| Under 6 Years | 30,597 (98.6%) | 426 (1.4%) |
| 6 to 18 Years | 74,452 (97.8%) | 1,675 (2.2%) |
| 19 to 25 Years | 42,964 (93.2%) | 3,133 (6.8%) |
| 26 to 34 Years | 52,505 (94.1%) | 3,298 (5.9%) |
| 35 to 44 Years | 52,094 (94.3%) | 3,134 (5.7%) |
| 45 to 54 Years | 54,030 (96.1%) | 2,211 (3.9%) |
| 55 to 64 Years | 63,531 (96.7%) | 2,186 (3.3%) |
| 65 to 74 Years | 47,834 (99.8%) | 105 (0.2%) |
| 75 Years and older | 33,953 (99.9%) | 33 (0.1%) |
| Total | 451,960 (96.5%) | 16,201 (3.5%) |
Health Insurance Coverage by Citizenship Status in Onondaga County
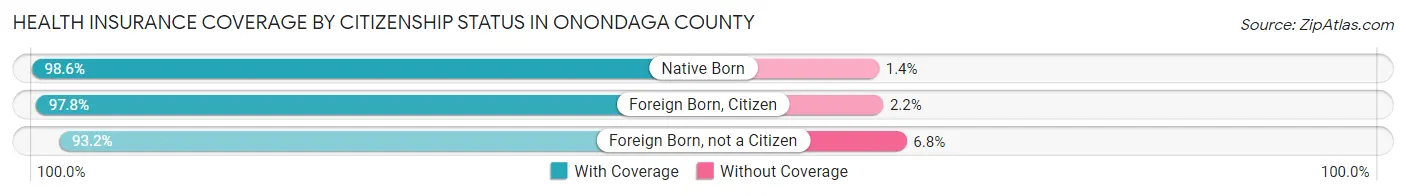
| Citizenship Status | With Coverage | Without Coverage |
| Native Born | 30,597 (98.6%) | 426 (1.4%) |
| Foreign Born, Citizen | 74,452 (97.8%) | 1,675 (2.2%) |
| Foreign Born, not a Citizen | 42,964 (93.2%) | 3,133 (6.8%) |
Health Insurance Coverage by Household Income in Onondaga County
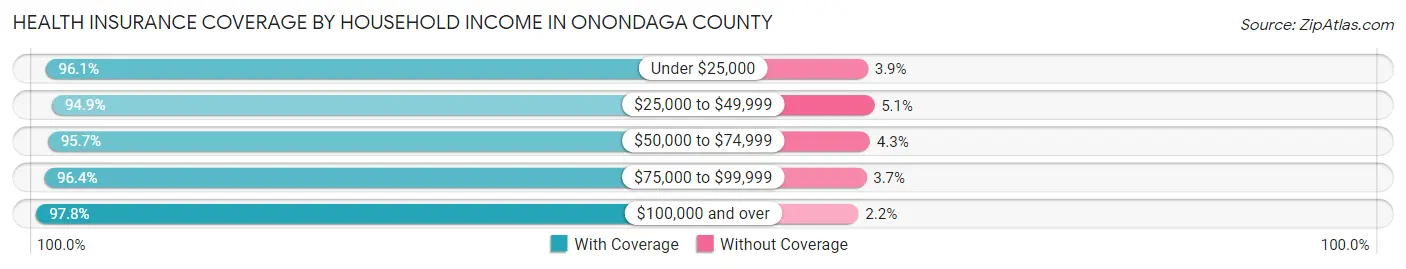
| Household Income | With Coverage | Without Coverage |
| Under $25,000 | 55,895 (96.1%) | 2,287 (3.9%) |
| $25,000 to $49,999 | 65,194 (94.9%) | 3,530 (5.1%) |
| $50,000 to $74,999 | 63,262 (95.7%) | 2,862 (4.3%) |
| $75,000 to $99,999 | 57,149 (96.4%) | 2,163 (3.6%) |
| $100,000 and over | 195,192 (97.8%) | 4,353 (2.2%) |
Public vs Private Health Insurance Coverage by Age in Onondaga County
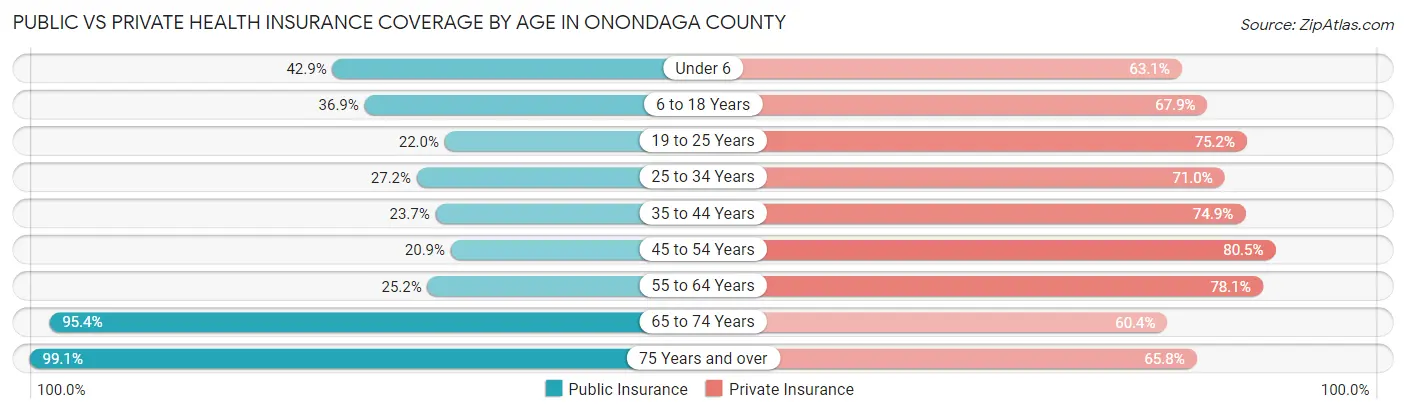
| Age Bracket | Public Insurance | Private Insurance |
| Under 6 | 13,292 (42.8%) | 19,566 (63.1%) |
| 6 to 18 Years | 28,087 (36.9%) | 51,661 (67.9%) |
| 19 to 25 Years | 10,145 (22.0%) | 34,647 (75.2%) |
| 25 to 34 Years | 15,173 (27.2%) | 39,641 (71.0%) |
| 35 to 44 Years | 13,104 (23.7%) | 41,342 (74.9%) |
| 45 to 54 Years | 11,743 (20.9%) | 45,245 (80.4%) |
| 55 to 64 Years | 16,558 (25.2%) | 51,314 (78.1%) |
| 65 to 74 Years | 45,744 (95.4%) | 28,964 (60.4%) |
| 75 Years and over | 33,672 (99.1%) | 22,374 (65.8%) |
| Total | 187,518 (40.1%) | 334,754 (71.5%) |
Disability Status by Sex by Age in Onondaga County
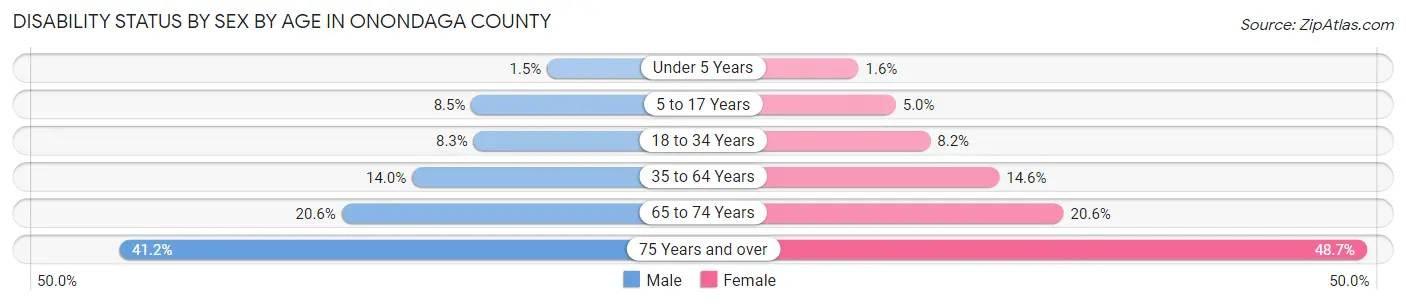
| Age Bracket | Male | Female |
| Under 5 Years | 197 (1.5%) | 200 (1.6%) |
| 5 to 17 Years | 3,204 (8.5%) | 1,792 (5.0%) |
| 18 to 34 Years | 4,485 (8.3%) | 4,600 (8.2%) |
| 35 to 64 Years | 12,169 (14.0%) | 13,238 (14.6%) |
| 65 to 74 Years | 4,654 (20.6%) | 5,215 (20.6%) |
| 75 Years and over | 5,572 (41.2%) | 9,971 (48.7%) |
Disability Class by Sex by Age in Onondaga County
Disability Class: Hearing Difficulty
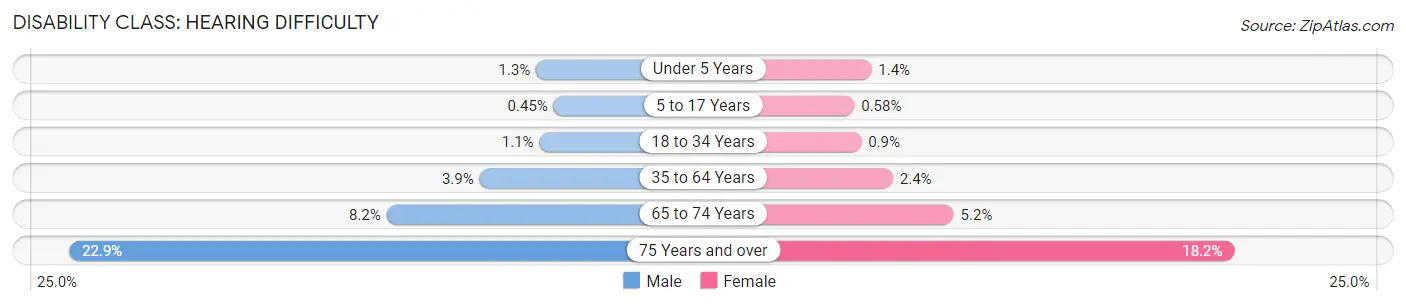
| Age Bracket | Male | Female |
| Under 5 Years | 166 (1.3%) | 176 (1.4%) |
| 5 to 17 Years | 170 (0.4%) | 209 (0.6%) |
| 18 to 34 Years | 599 (1.1%) | 502 (0.9%) |
| 35 to 64 Years | 3,370 (3.9%) | 2,148 (2.4%) |
| 65 to 74 Years | 1,855 (8.2%) | 1,315 (5.2%) |
| 75 Years and over | 3,101 (22.9%) | 3,728 (18.2%) |
Disability Class: Vision Difficulty
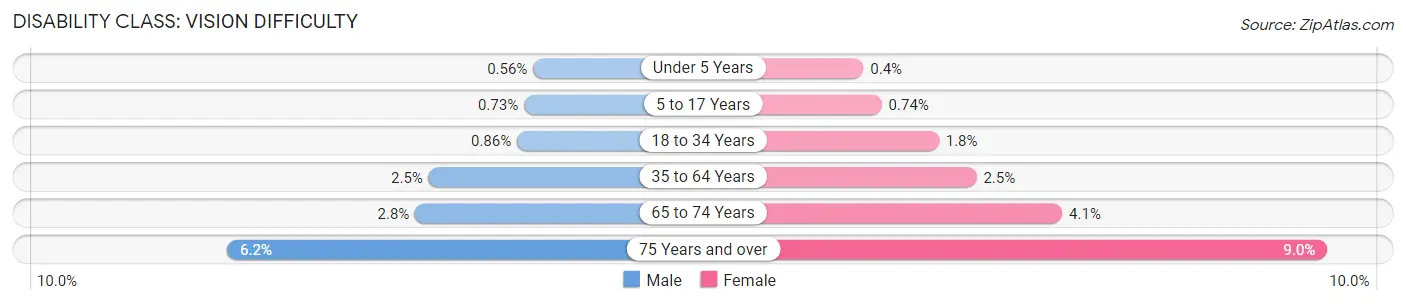
| Age Bracket | Male | Female |
| Under 5 Years | 74 (0.6%) | 52 (0.4%) |
| 5 to 17 Years | 273 (0.7%) | 265 (0.7%) |
| 18 to 34 Years | 461 (0.9%) | 1,006 (1.8%) |
| 35 to 64 Years | 2,166 (2.5%) | 2,266 (2.5%) |
| 65 to 74 Years | 621 (2.8%) | 1,036 (4.1%) |
| 75 Years and over | 843 (6.2%) | 1,844 (9.0%) |
Disability Class: Cognitive Difficulty
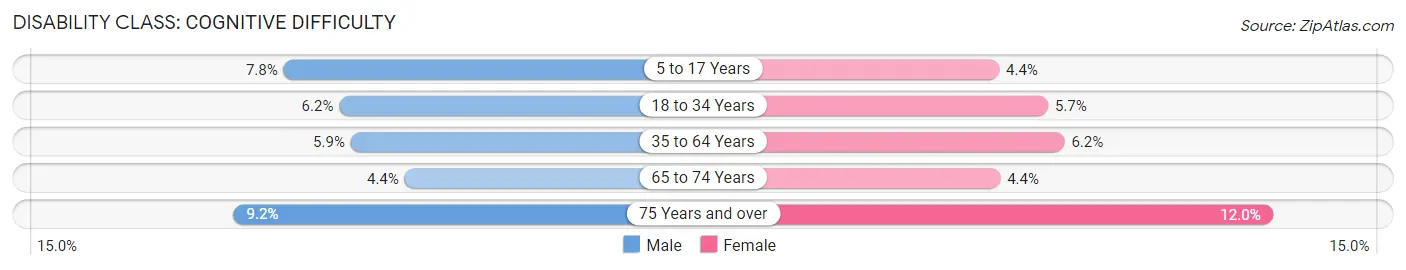
| Age Bracket | Male | Female |
| 5 to 17 Years | 2,923 (7.8%) | 1,566 (4.4%) |
| 18 to 34 Years | 3,358 (6.2%) | 3,210 (5.7%) |
| 35 to 64 Years | 5,132 (5.9%) | 5,614 (6.2%) |
| 65 to 74 Years | 1,000 (4.4%) | 1,116 (4.4%) |
| 75 Years and over | 1,241 (9.2%) | 2,455 (12.0%) |
Disability Class: Ambulatory Difficulty
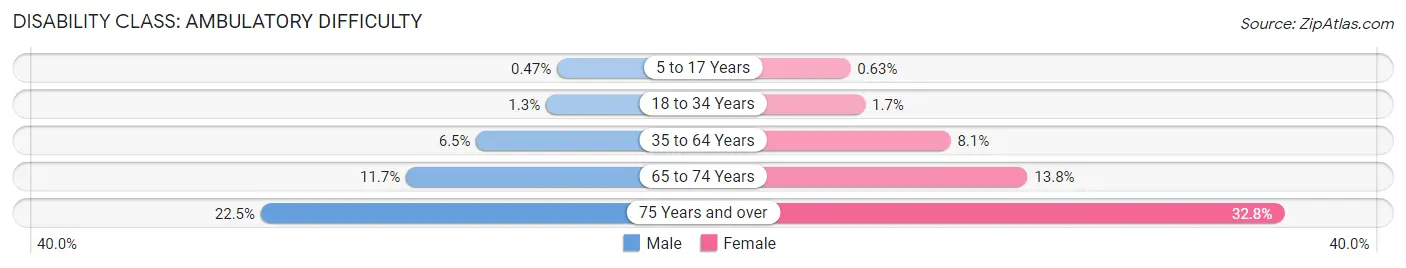
| Age Bracket | Male | Female |
| 5 to 17 Years | 175 (0.5%) | 224 (0.6%) |
| 18 to 34 Years | 694 (1.3%) | 968 (1.7%) |
| 35 to 64 Years | 5,597 (6.5%) | 7,302 (8.1%) |
| 65 to 74 Years | 2,642 (11.7%) | 3,490 (13.8%) |
| 75 Years and over | 3,036 (22.5%) | 6,721 (32.8%) |
Disability Class: Self-Care Difficulty
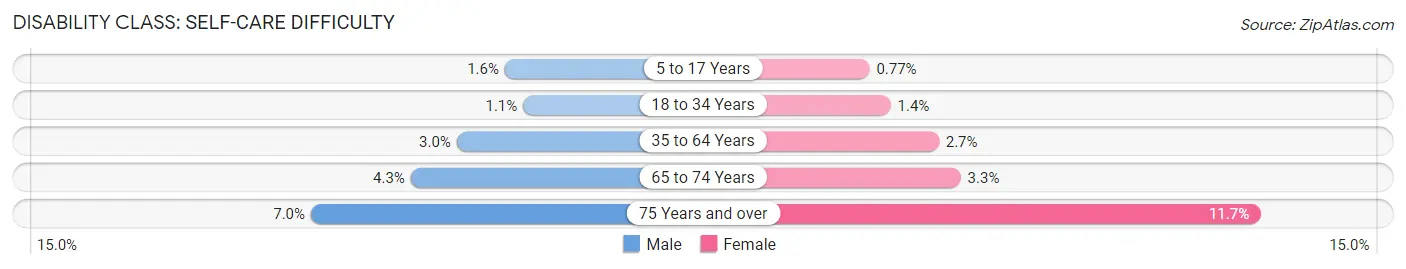
| Age Bracket | Male | Female |
| 5 to 17 Years | 613 (1.6%) | 277 (0.8%) |
| 18 to 34 Years | 602 (1.1%) | 759 (1.4%) |
| 35 to 64 Years | 2,571 (3.0%) | 2,445 (2.7%) |
| 65 to 74 Years | 962 (4.3%) | 837 (3.3%) |
| 75 Years and over | 950 (7.0%) | 2,389 (11.7%) |
Technology Access in Onondaga County
Computing Device Access in Onondaga County
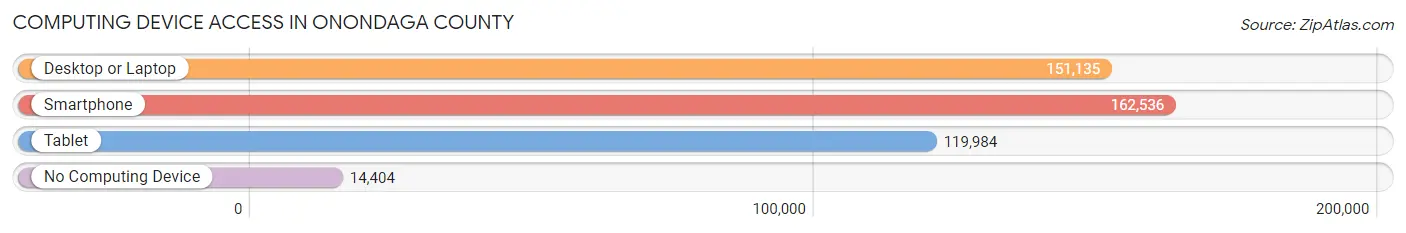
| Device Type | # Households | % Households |
| Desktop or Laptop | 151,135 | 78.4% |
| Smartphone | 162,536 | 84.3% |
| Tablet | 119,984 | 62.2% |
| No Computing Device | 14,404 | 7.5% |
| Total | 192,785 | 100.0% |
Internet Access in Onondaga County
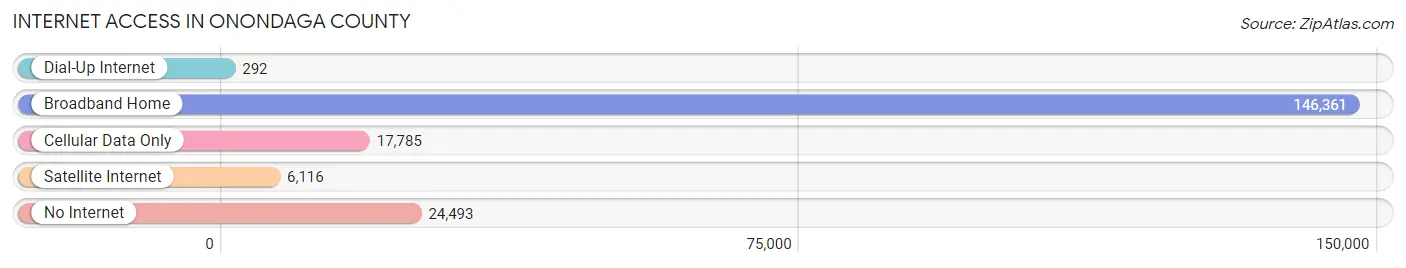
| Internet Type | # Households | % Households |
| Dial-Up Internet | 292 | 0.2% |
| Broadband Home | 146,361 | 75.9% |
| Cellular Data Only | 17,785 | 9.2% |
| Satellite Internet | 6,116 | 3.2% |
| No Internet | 24,493 | 12.7% |
| Total | 192,785 | 100.0% |
Onondaga County Summary
Onondaga County is located in the central part of New York State, and is part of the Syracuse Metropolitan Statistical Area. It is bordered by Oswego County to the north, Cayuga County to the west, Cortland County to the south, and Madison and Oneida Counties to the east. The county seat is Syracuse, the fifth-largest city in the state. Onondaga County has a population of 467,026, making it the fourth-most populous county in New York State.
History
Onondaga County was formed in 1794 from parts of Herkimer and Tioga Counties. It was named after the Onondaga Nation, a member of the Iroquois Confederacy, which had inhabited the area for centuries. The Onondaga Nation was one of the original Five Nations of the Iroquois Confederacy, and was the most powerful of the five. The Onondaga Nation was also known as the “Keepers of the Fire”, and was responsible for keeping the peace among the five nations.
The first settlers in Onondaga County were mostly of English and Dutch descent. The first permanent settlement was established in 1788 in the town of Manlius. The county was officially organized in 1794, and the first county seat was established in the town of Onondaga. The county seat was moved to Syracuse in 1848.
Geography
Onondaga County is located in the central part of New York State, and is part of the Syracuse Metropolitan Statistical Area. It is bordered by Oswego County to the north, Cayuga County to the west, Cortland County to the south, and Madison and Oneida Counties to the east. The county has a total area of 1,042 square miles, of which 1,019 square miles is land and 23 square miles is water.
The terrain of Onondaga County is mostly flat, with some rolling hills in the northern and western parts of the county. The highest point in the county is located in the town of Onondaga, at 1,945 feet above sea level. The county is drained by the Seneca and Oneida Rivers, as well as several smaller streams.
Economy
Onondaga County’s economy is largely based on manufacturing, with the largest employers being Lockheed Martin, Syracuse University, and the Syracuse City School District. Other major employers include the New York State Department of Transportation, the New York State Thruway Authority, and the Onondaga County government.
The county is also home to several major shopping centers, including Destiny USA, Carousel Center, and Shoppingtown Mall. Tourism is also an important part of the economy, with attractions such as the Erie Canal Museum, the Onondaga Lake Park, and the Rosamond Gifford Zoo.
Demographics
As of the 2010 census, Onondaga County had a population of 467,026. The racial makeup of the county was 81.2% White, 11.3% African American, 2.2% Asian, 0.3% Native American, 0.1% Pacific Islander, and 4.9% from two or more races. Hispanic or Latino of any race were 8.2% of the population.
The median income for a household in the county was $50,867, and the median income for a family was $62,817. The per capita income for the county was $25,867. About 8.7% of families and 11.7% of the population were below the poverty line, including 16.2% of those under age 18 and 7.2% of those age 65 or over.
Common Questions
What is Per Capita Income in Onondaga County?
Per Capita income in Onondaga County is $39,371.
What is the Median Family Income in Onondaga County?
Median Family Income in Onondaga County is $94,559.
What is the Median Household income in Onondaga County?
Median Household Income in Onondaga County is $71,479.
What is Income or Wage Gap in Onondaga County?
Income or Wage Gap in Onondaga County is 21.2%.
Women in Onondaga County earn 78.8 cents for every dollar earned by a man.
What is Family Income Deficit in Onondaga County?
Family Income Deficit in Onondaga County is $12,248.
Families that are below poverty line in Onondaga County earn $12,248 less on average than the poverty threshold level.
What is Inequality or Gini Index in Onondaga County?
Inequality or Gini Index in Onondaga County is 0.46.
What is the Total Population of Onondaga County?
Total Population of Onondaga County is 472,637.
What is the Total Male Population of Onondaga County?
Total Male Population of Onondaga County is 229,648.
What is the Total Female Population of Onondaga County?
Total Female Population of Onondaga County is 242,989.
What is the Ratio of Males per 100 Females in Onondaga County?
There are 94.51 Males per 100 Females in Onondaga County.
What is the Ratio of Females per 100 Males in Onondaga County?
There are 105.81 Females per 100 Males in Onondaga County.
What is the Median Population Age in Onondaga County?
Median Population Age in Onondaga County is 39.4 Years.
What is the Average Family Size in Onondaga County
Average Family Size in Onondaga County is 3.0 People.
What is the Average Household Size in Onondaga County
Average Household Size in Onondaga County is 2.4 People.
How Large is the Labor Force in Onondaga County?
There are 239,919 People in the Labor Forcein in Onondaga County.
What is the Percentage of People in the Labor Force in Onondaga County?
62.4% of People are in the Labor Force in Onondaga County.
What is the Unemployment Rate in Onondaga County?
Unemployment Rate in Onondaga County is 5.6%.