Jefferson County, NY Map & Demographics
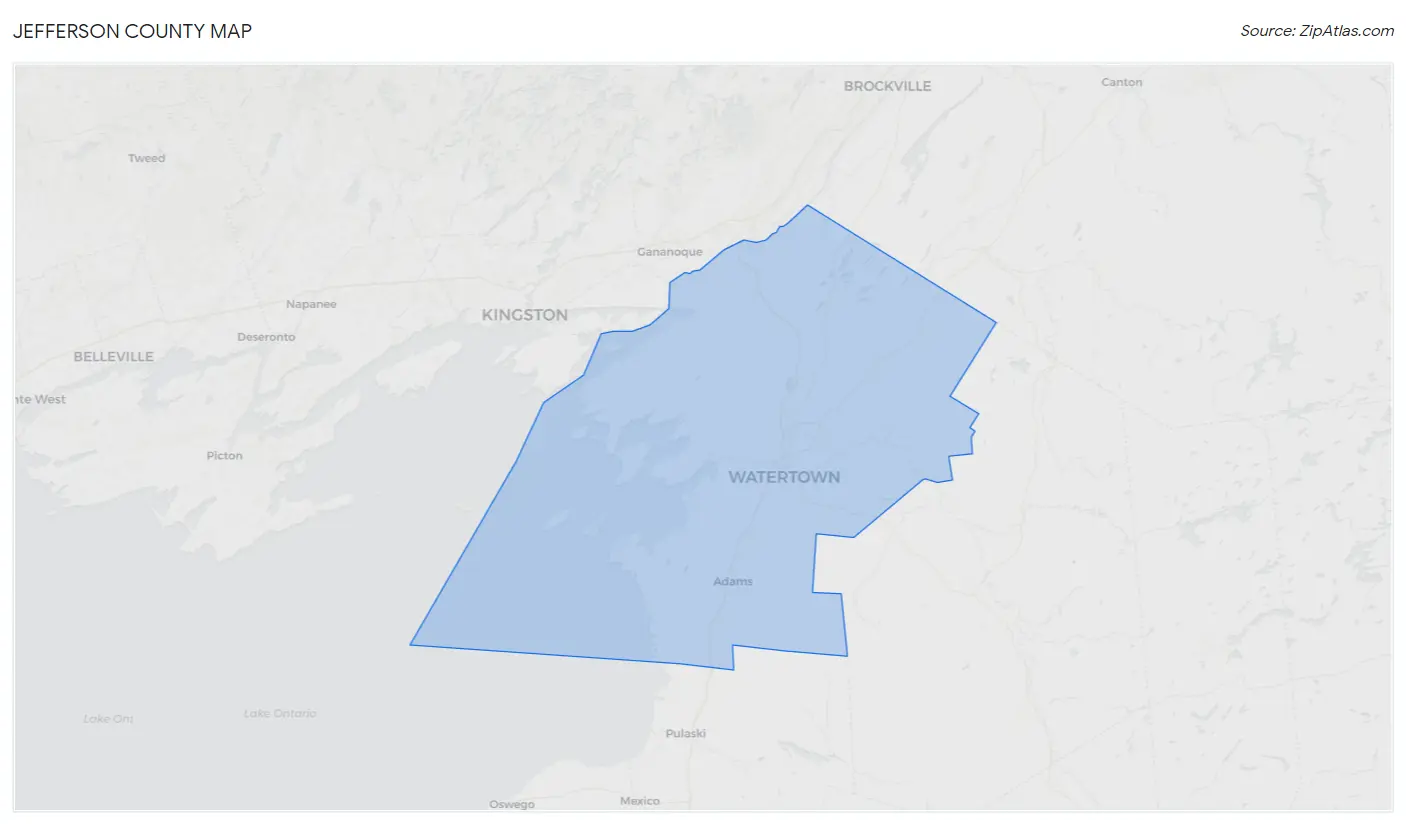
Jefferson County Map
Jefferson County Overview
$32,775
PER CAPITA INCOME
$76,693
AVG FAMILY INCOME
$62,782
AVG HOUSEHOLD INCOME
24.7%
WAGE / INCOME GAP [ % ]
75.3¢/ $1
WAGE / INCOME GAP [ $ ]
$10,942
FAMILY INCOME DEFICIT
0.43
INEQUALITY / GINI INDEX
117,445
TOTAL POPULATION
62,226
MALE POPULATION
55,219
FEMALE POPULATION
112.69
MALES / 100 FEMALES
88.74
FEMALES / 100 MALES
32.8
MEDIAN AGE
3.0
AVG FAMILY SIZE
2.4
AVG HOUSEHOLD SIZE
58,246
LABOR FORCE [ PEOPLE ]
63.2%
PERCENT IN LABOR FORCE
6.4%
UNEMPLOYMENT RATE
Jefferson County Area Codes
Income in Jefferson County
Income Overview in Jefferson County
Per Capita Income in Jefferson County is $32,775, while median incomes of families and households are $76,693 and $62,782 respectively.
| Characteristic | Number | Measure |
| Per Capita Income | 117,445 | $32,775 |
| Median Family Income | 30,093 | $76,693 |
| Mean Family Income | 30,093 | $93,351 |
| Median Household Income | 46,099 | $62,782 |
| Mean Household Income | 46,099 | $80,432 |
| Income Deficit | 30,093 | $10,942 |
| Wage / Income Gap (%) | 117,445 | 24.74% |
| Wage / Income Gap ($) | 117,445 | 75.26¢ per $1 |
| Gini / Inequality Index | 117,445 | 0.43 |
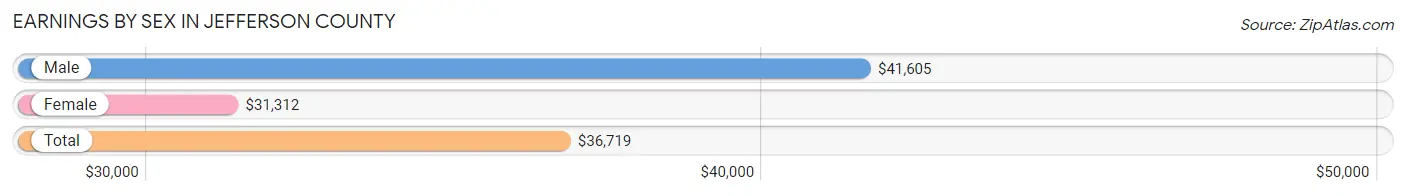
Earnings by Sex in Jefferson County
Average Earnings in Jefferson County are $36,719, $41,605 for men and $31,312 for women, a difference of 24.7%.
| Sex | Number | Average Earnings |
| Male | 35,737 (59.0%) | $41,605 |
| Female | 24,886 (41.0%) | $31,312 |
| Total | 60,623 (100.0%) | $36,719 |
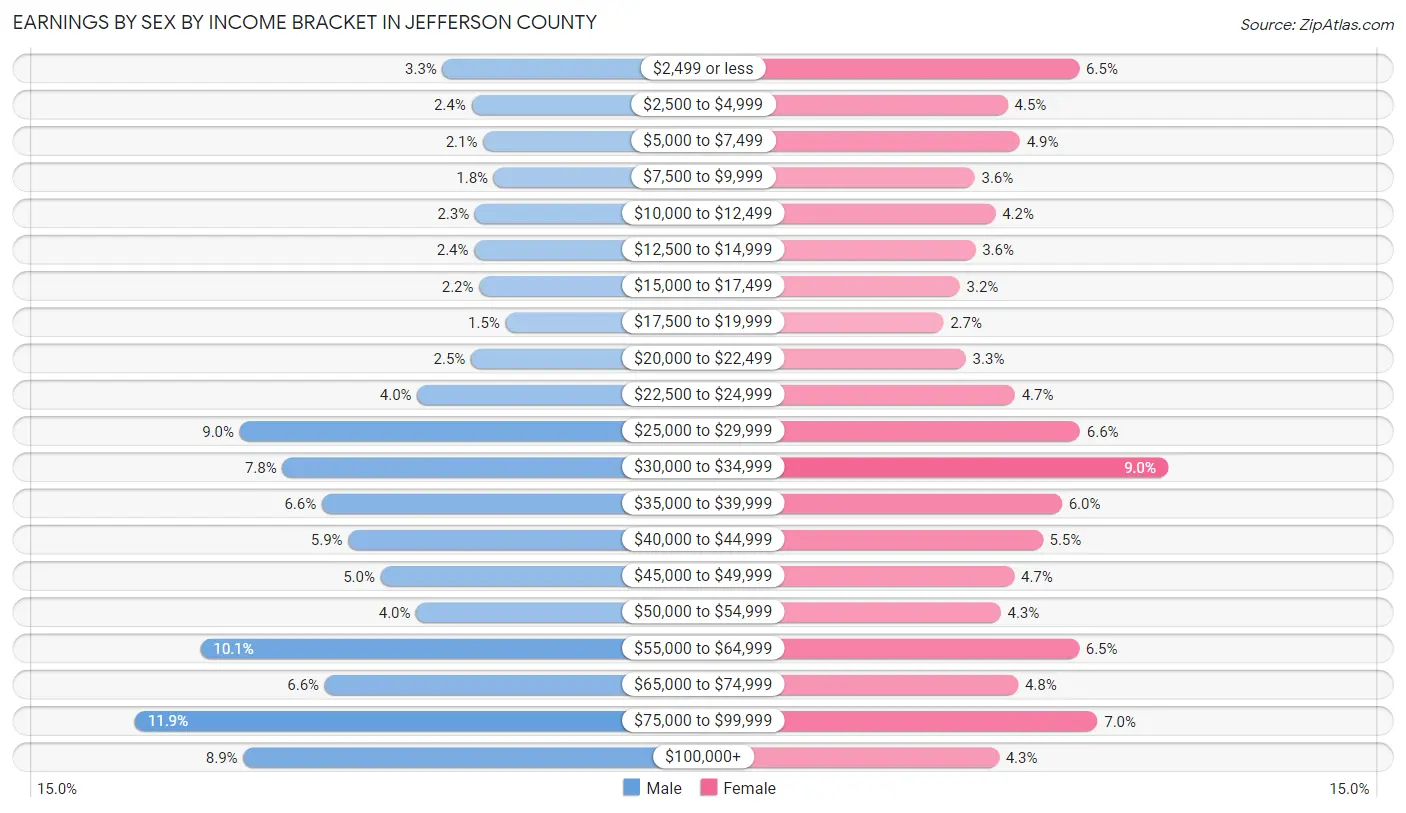
Earnings by Sex by Income Bracket in Jefferson County
The most common earnings brackets in Jefferson County are $75,000 to $99,999 for men (4,251 | 11.9%) and $30,000 to $34,999 for women (2,244 | 9.0%).
| Income | Male | Female |
| $2,499 or less | 1,161 (3.3%) | 1,626 (6.5%) |
| $2,500 to $4,999 | 871 (2.4%) | 1,125 (4.5%) |
| $5,000 to $7,499 | 755 (2.1%) | 1,210 (4.9%) |
| $7,500 to $9,999 | 646 (1.8%) | 894 (3.6%) |
| $10,000 to $12,499 | 835 (2.3%) | 1,038 (4.2%) |
| $12,500 to $14,999 | 842 (2.4%) | 898 (3.6%) |
| $15,000 to $17,499 | 794 (2.2%) | 789 (3.2%) |
| $17,500 to $19,999 | 528 (1.5%) | 674 (2.7%) |
| $20,000 to $22,499 | 874 (2.5%) | 831 (3.3%) |
| $22,500 to $24,999 | 1,414 (4.0%) | 1,175 (4.7%) |
| $25,000 to $29,999 | 3,197 (8.9%) | 1,631 (6.6%) |
| $30,000 to $34,999 | 2,771 (7.7%) | 2,244 (9.0%) |
| $35,000 to $39,999 | 2,374 (6.6%) | 1,502 (6.0%) |
| $40,000 to $44,999 | 2,110 (5.9%) | 1,369 (5.5%) |
| $45,000 to $49,999 | 1,784 (5.0%) | 1,169 (4.7%) |
| $50,000 to $54,999 | 1,426 (4.0%) | 1,076 (4.3%) |
| $55,000 to $64,999 | 3,595 (10.1%) | 1,623 (6.5%) |
| $65,000 to $74,999 | 2,345 (6.6%) | 1,196 (4.8%) |
| $75,000 to $99,999 | 4,251 (11.9%) | 1,753 (7.0%) |
| $100,000+ | 3,164 (8.8%) | 1,063 (4.3%) |
| Total | 35,737 (100.0%) | 24,886 (100.0%) |
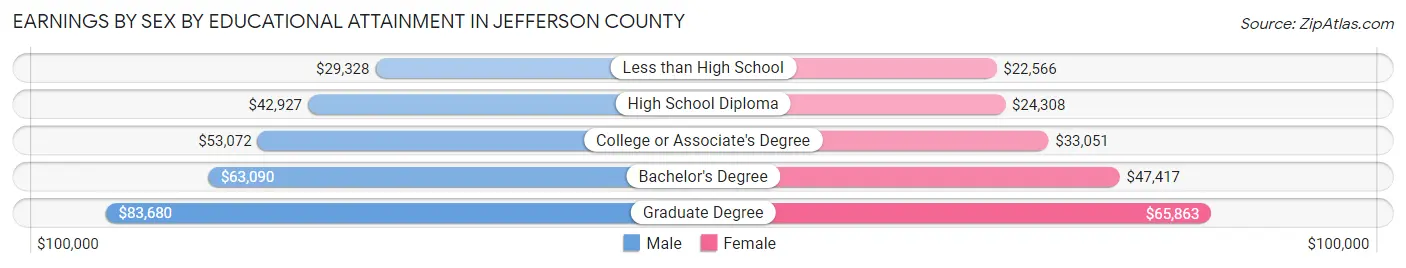
Earnings by Sex by Educational Attainment in Jefferson County
Average earnings in Jefferson County are $52,420 for men and $34,583 for women, a difference of 34.0%. Men with an educational attainment of graduate degree enjoy the highest average annual earnings of $83,680, while those with less than high school education earn the least with $29,328. Women with an educational attainment of graduate degree earn the most with the average annual earnings of $65,863, while those with less than high school education have the smallest earnings of $22,566.
| Educational Attainment | Male Income | Female Income |
| Less than High School | $29,328 | $22,566 |
| High School Diploma | $42,927 | $24,308 |
| College or Associate's Degree | $53,072 | $33,051 |
| Bachelor's Degree | $63,090 | $47,417 |
| Graduate Degree | $83,680 | $65,863 |
| Total | $52,420 | $34,583 |
Family Income in Jefferson County
Family Income Brackets in Jefferson County
According to the Jefferson County family income data, there are 5,928 families falling into the $100,000 to $149,999 income range, which is the most common income bracket and makes up 19.7% of all families. Conversely, the $10,000 to $14,999 income bracket is the least frequent group with only 391 families (1.3%) belonging to this category.
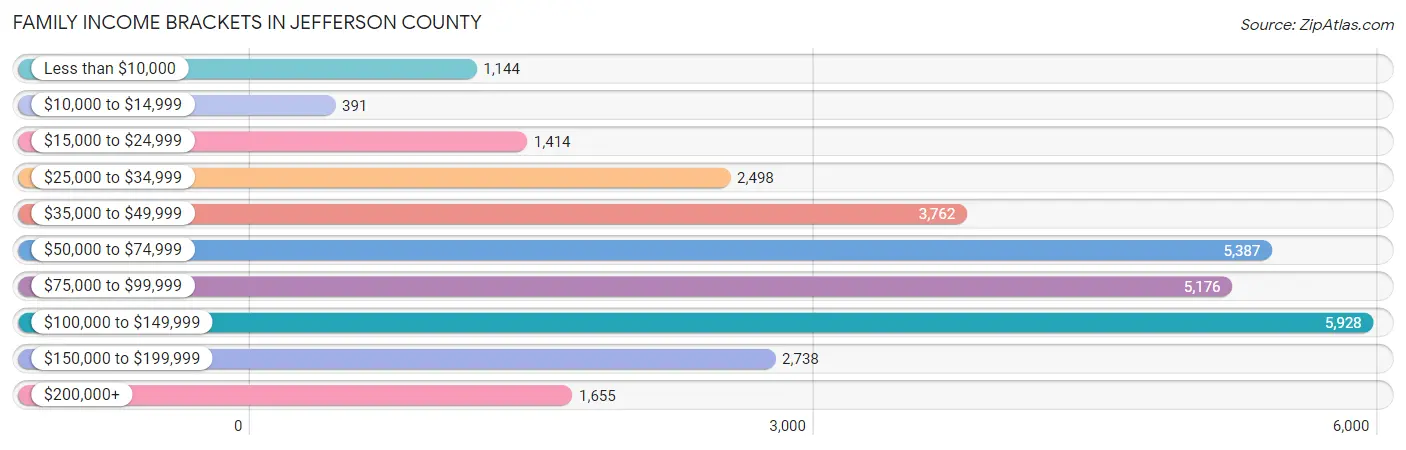
| Income Bracket | # Families | % Families |
| Less than $10,000 | 1,144 | 3.8% |
| $10,000 to $14,999 | 391 | 1.3% |
| $15,000 to $24,999 | 1,414 | 4.7% |
| $25,000 to $34,999 | 2,498 | 8.3% |
| $35,000 to $49,999 | 3,762 | 12.5% |
| $50,000 to $74,999 | 5,387 | 17.9% |
| $75,000 to $99,999 | 5,176 | 17.2% |
| $100,000 to $149,999 | 5,928 | 19.7% |
| $150,000 to $199,999 | 2,738 | 9.1% |
| $200,000+ | 1,655 | 5.5% |
Family Income by Famaliy Size in Jefferson County
6-person families (712 | 2.4%) account for the highest median family income in Jefferson County with $104,318 per family, while 2-person families (15,431 | 51.3%) have the highest median income of $35,594 per family member.
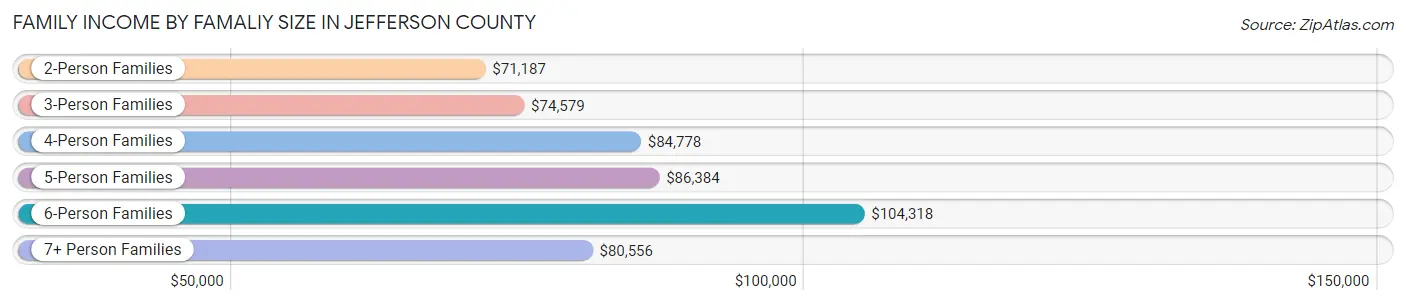
| Income Bracket | # Families | Median Income |
| 2-Person Families | 15,431 (51.3%) | $71,187 |
| 3-Person Families | 6,686 (22.2%) | $74,579 |
| 4-Person Families | 5,105 (17.0%) | $84,778 |
| 5-Person Families | 1,923 (6.4%) | $86,384 |
| 6-Person Families | 712 (2.4%) | $104,318 |
| 7+ Person Families | 236 (0.8%) | $80,556 |
| Total | 30,093 (100.0%) | $76,693 |
Family Income by Number of Earners in Jefferson County
The median family income in Jefferson County is $76,693, with families comprising 3+ earners (2,024) having the highest median family income of $142,095, while families with no earners (4,782) have the lowest median family income of $52,878, accounting for 6.7% and 15.9% of families, respectively.
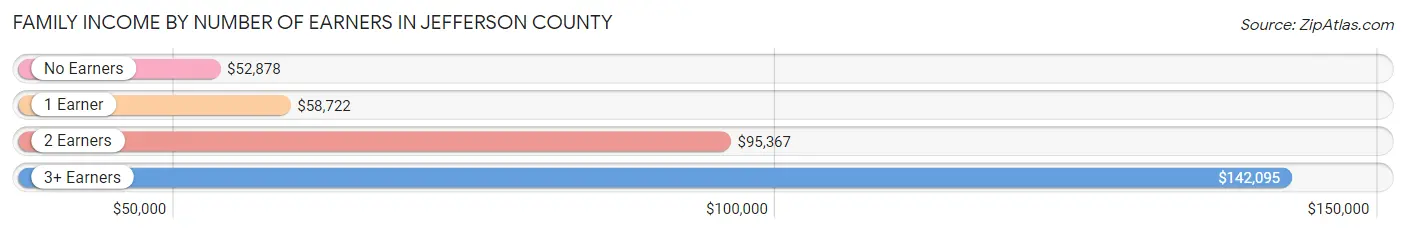
| Number of Earners | # Families | Median Income |
| No Earners | 4,782 (15.9%) | $52,878 |
| 1 Earner | 11,078 (36.8%) | $58,722 |
| 2 Earners | 12,209 (40.6%) | $95,367 |
| 3+ Earners | 2,024 (6.7%) | $142,095 |
| Total | 30,093 (100.0%) | $76,693 |
Household Income in Jefferson County
Household Income Brackets in Jefferson County
With 8,344 households falling in the category, the $50,000 to $74,999 income range is the most frequent in Jefferson County, accounting for 18.1% of all households. In contrast, only 1,890 households (4.1%) fall into the $200,000+ income bracket, making it the least populous group.
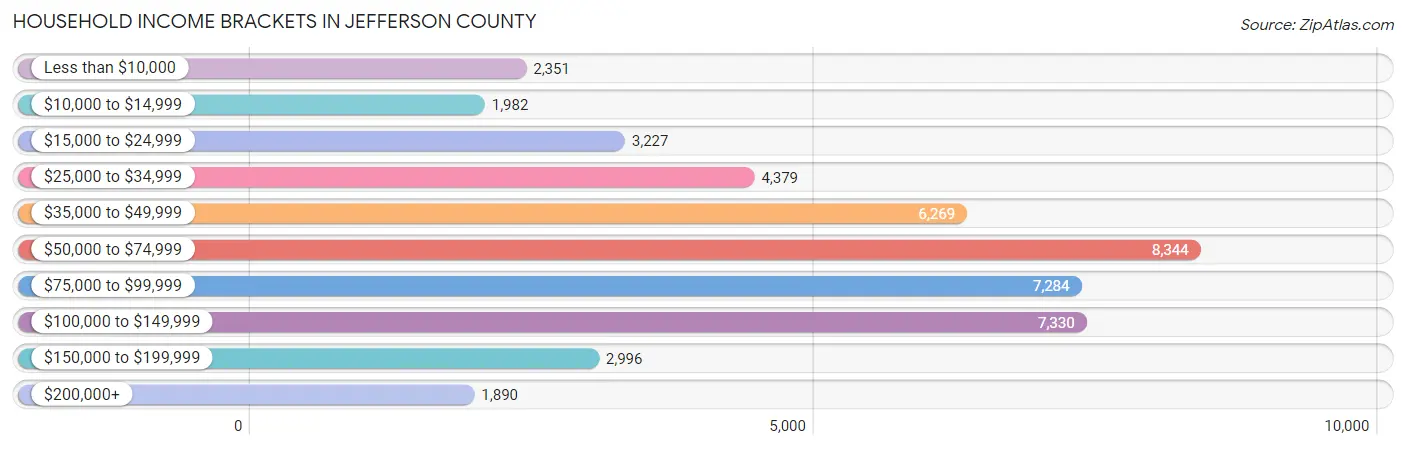
| Income Bracket | # Households | % Households |
| Less than $10,000 | 2,351 | 5.1% |
| $10,000 to $14,999 | 1,982 | 4.3% |
| $15,000 to $24,999 | 3,227 | 7.0% |
| $25,000 to $34,999 | 4,379 | 9.5% |
| $35,000 to $49,999 | 6,269 | 13.6% |
| $50,000 to $74,999 | 8,344 | 18.1% |
| $75,000 to $99,999 | 7,284 | 15.8% |
| $100,000 to $149,999 | 7,330 | 15.9% |
| $150,000 to $199,999 | 2,996 | 6.5% |
| $200,000+ | 1,890 | 4.1% |
Household Income by Householder Age in Jefferson County
The median household income in Jefferson County is $62,782, with the highest median household income of $79,120 found in the 45 to 64 years age bracket for the primary householder. A total of 13,958 households (30.3%) fall into this category. Meanwhile, the 15 to 24 years age bracket for the primary householder has the lowest median household income of $41,700, with 3,988 households (8.6%) in this group.

| Income Bracket | # Households | Median Income |
| 15 to 24 Years | 3,988 (8.6%) | $41,700 |
| 25 to 44 Years | 17,578 (38.1%) | $67,582 |
| 45 to 64 Years | 13,958 (30.3%) | $79,120 |
| 65+ Years | 10,575 (22.9%) | $50,382 |
| Total | 46,099 (100.0%) | $62,782 |
Poverty in Jefferson County
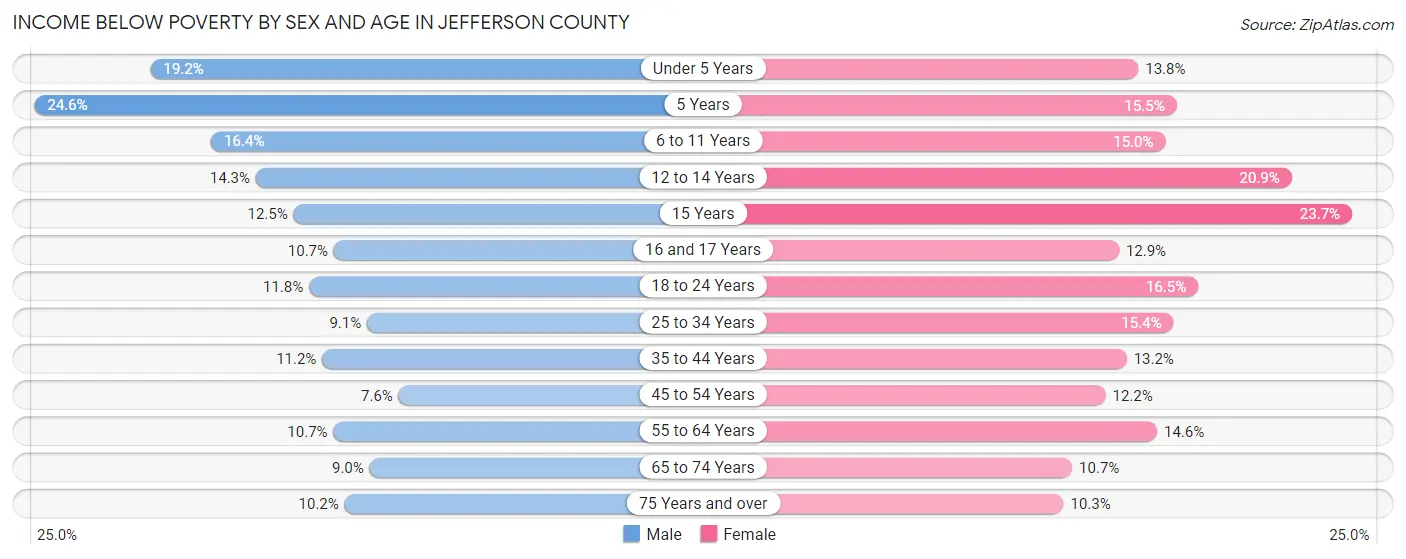
Income Below Poverty by Sex and Age in Jefferson County
With 11.6% poverty level for males and 14.1% for females among the residents of Jefferson County, 5 year old males and 15 year old females are the most vulnerable to poverty, with 218 males (24.5%) and 156 females (23.7%) in their respective age groups living below the poverty level.
| Age Bracket | Male | Female |
| Under 5 Years | 819 (19.2%) | 569 (13.8%) |
| 5 Years | 218 (24.5%) | 91 (15.5%) |
| 6 to 11 Years | 733 (16.4%) | 690 (15.0%) |
| 12 to 14 Years | 297 (14.3%) | 382 (20.9%) |
| 15 Years | 88 (12.5%) | 156 (23.7%) |
| 16 and 17 Years | 139 (10.6%) | 174 (12.9%) |
| 18 to 24 Years | 831 (11.8%) | 867 (16.5%) |
| 25 to 34 Years | 942 (9.1%) | 1,262 (15.4%) |
| 35 to 44 Years | 809 (11.2%) | 864 (13.2%) |
| 45 to 54 Years | 428 (7.6%) | 694 (12.2%) |
| 55 to 64 Years | 677 (10.7%) | 959 (14.6%) |
| 65 to 74 Years | 421 (9.0%) | 536 (10.7%) |
| 75 Years and over | 278 (10.2%) | 386 (10.3%) |
| Total | 6,680 (11.6%) | 7,630 (14.1%) |
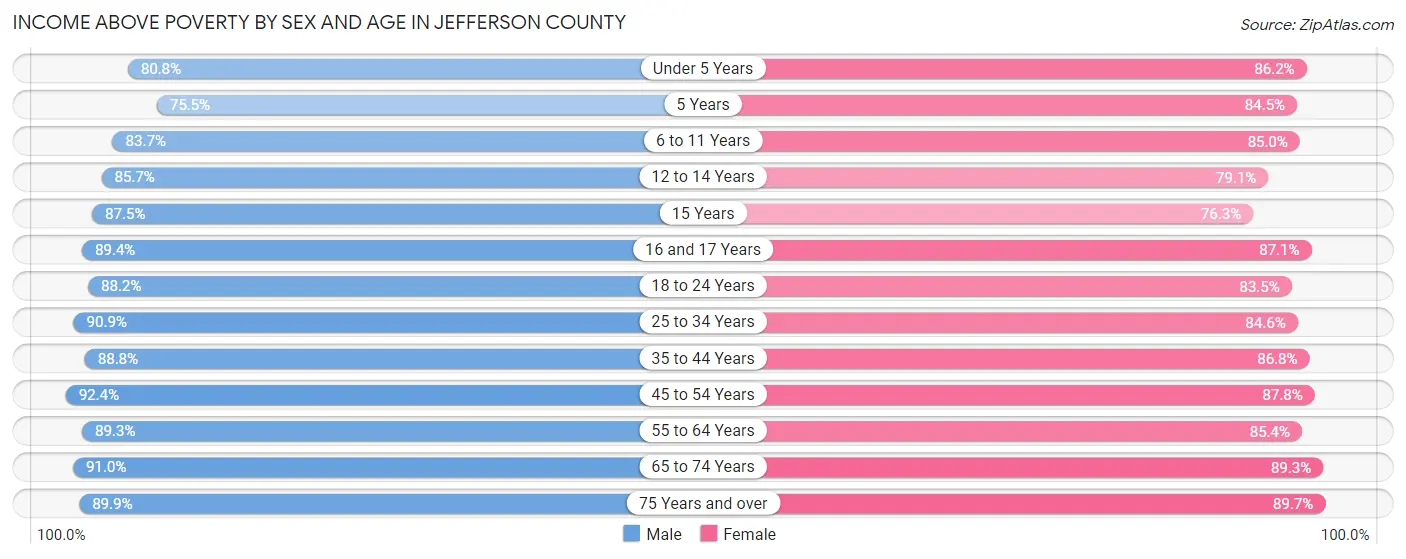
Income Above Poverty by Sex and Age in Jefferson County
According to the poverty statistics in Jefferson County, males aged 45 to 54 years and females aged 75 years and over are the age groups that are most secure financially, with 92.4% of males and 89.7% of females in these age groups living above the poverty line.
| Age Bracket | Male | Female |
| Under 5 Years | 3,455 (80.8%) | 3,567 (86.2%) |
| 5 Years | 670 (75.4%) | 495 (84.5%) |
| 6 to 11 Years | 3,749 (83.7%) | 3,906 (85.0%) |
| 12 to 14 Years | 1,784 (85.7%) | 1,448 (79.1%) |
| 15 Years | 615 (87.5%) | 503 (76.3%) |
| 16 and 17 Years | 1,166 (89.3%) | 1,179 (87.1%) |
| 18 to 24 Years | 6,209 (88.2%) | 4,377 (83.5%) |
| 25 to 34 Years | 9,399 (90.9%) | 6,940 (84.6%) |
| 35 to 44 Years | 6,420 (88.8%) | 5,671 (86.8%) |
| 45 to 54 Years | 5,173 (92.4%) | 4,975 (87.8%) |
| 55 to 64 Years | 5,670 (89.3%) | 5,594 (85.4%) |
| 65 to 74 Years | 4,264 (91.0%) | 4,479 (89.3%) |
| 75 Years and over | 2,460 (89.8%) | 3,365 (89.7%) |
| Total | 51,034 (88.4%) | 46,499 (85.9%) |
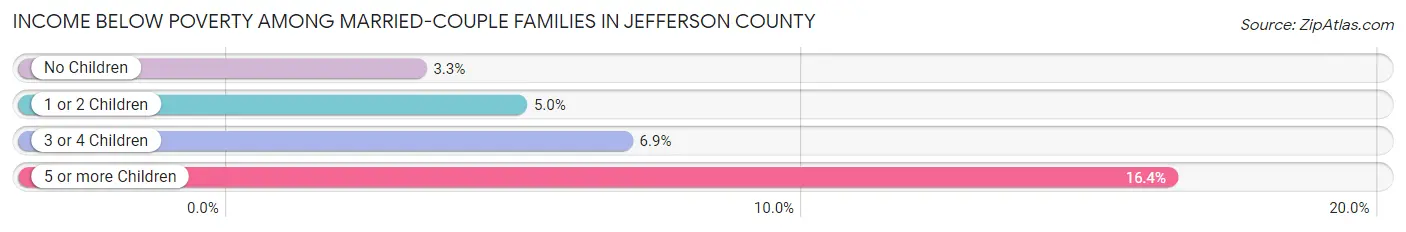
Income Below Poverty Among Married-Couple Families in Jefferson County
The poverty statistics for married-couple families in Jefferson County show that 4.3% or 983 of the total 23,134 families live below the poverty line. Families with 5 or more children have the highest poverty rate of 16.4%, comprising of 27 families. On the other hand, families with no children have the lowest poverty rate of 3.3%, which includes 443 families.
| Children | Above Poverty | Below Poverty |
| No Children | 13,043 (96.7%) | 443 (3.3%) |
| 1 or 2 Children | 7,154 (95.0%) | 379 (5.0%) |
| 3 or 4 Children | 1,816 (93.1%) | 134 (6.9%) |
| 5 or more Children | 138 (83.6%) | 27 (16.4%) |
| Total | 22,151 (95.8%) | 983 (4.3%) |
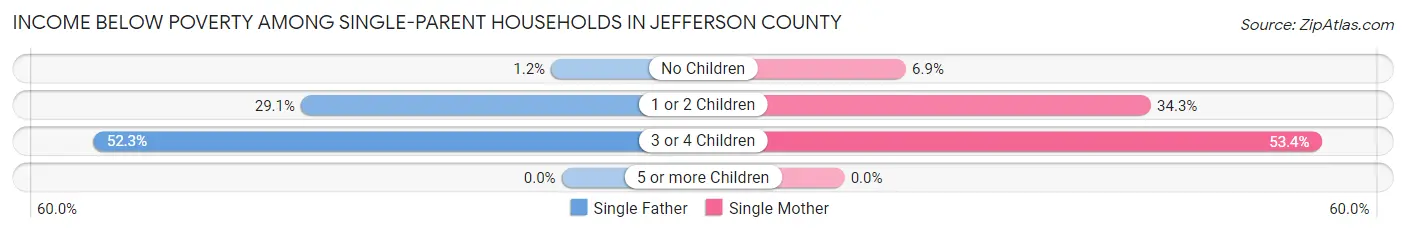
Income Below Poverty Among Single-Parent Households in Jefferson County
According to the poverty data in Jefferson County, 21.5% or 471 single-father households and 26.0% or 1,239 single-mother households are living below the poverty line. Among single-father households, those with 3 or 4 children have the highest poverty rate, with 104 households (52.3%) experiencing poverty. Likewise, among single-mother households, those with 3 or 4 children have the highest poverty rate, with 237 households (53.4%) falling below the poverty line.
| Children | Single Father | Single Mother |
| No Children | 9 (1.2%) | 119 (6.9%) |
| 1 or 2 Children | 358 (29.1%) | 883 (34.3%) |
| 3 or 4 Children | 104 (52.3%) | 237 (53.4%) |
| 5 or more Children | 0 (0.0%) | 0 (0.0%) |
| Total | 471 (21.5%) | 1,239 (26.0%) |
Income Below Poverty Among Married-Couple vs Single-Parent Households in Jefferson County
The poverty data for Jefferson County shows that 983 of the married-couple family households (4.3%) and 1,710 of the single-parent households (24.6%) are living below the poverty level. Within the married-couple family households, those with 5 or more children have the highest poverty rate, with 27 households (16.4%) falling below the poverty line. Among the single-parent households, those with 3 or 4 children have the highest poverty rate, with 341 household (53.0%) living below poverty.
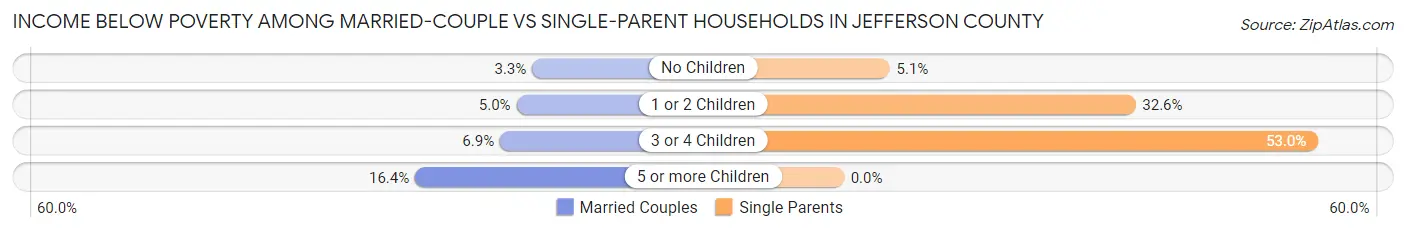
| Children | Married-Couple Families | Single-Parent Households |
| No Children | 443 (3.3%) | 128 (5.1%) |
| 1 or 2 Children | 379 (5.0%) | 1,241 (32.6%) |
| 3 or 4 Children | 134 (6.9%) | 341 (53.0%) |
| 5 or more Children | 27 (16.4%) | 0 (0.0%) |
| Total | 983 (4.3%) | 1,710 (24.6%) |
Race in Jefferson County
The most populous races in Jefferson County are White / Caucasian (98,846 | 84.2%), Hispanic or Latino (9,326 | 7.9%), and Two or more Races (7,133 | 6.1%).
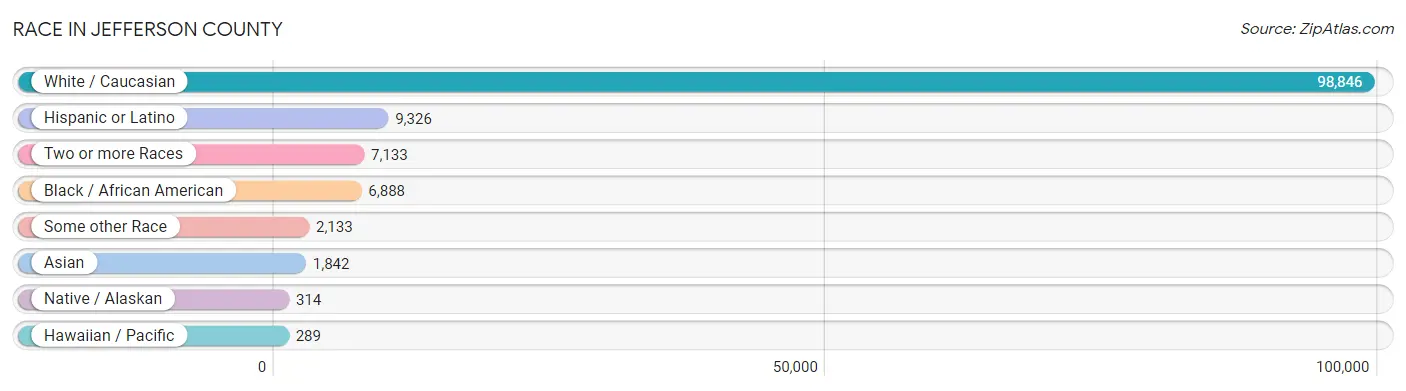
| Race | # Population | % Population |
| Asian | 1,842 | 1.6% |
| Black / African American | 6,888 | 5.9% |
| Hawaiian / Pacific | 289 | 0.3% |
| Hispanic or Latino | 9,326 | 7.9% |
| Native / Alaskan | 314 | 0.3% |
| White / Caucasian | 98,846 | 84.2% |
| Two or more Races | 7,133 | 6.1% |
| Some other Race | 2,133 | 1.8% |
| Total | 117,445 | 100.0% |
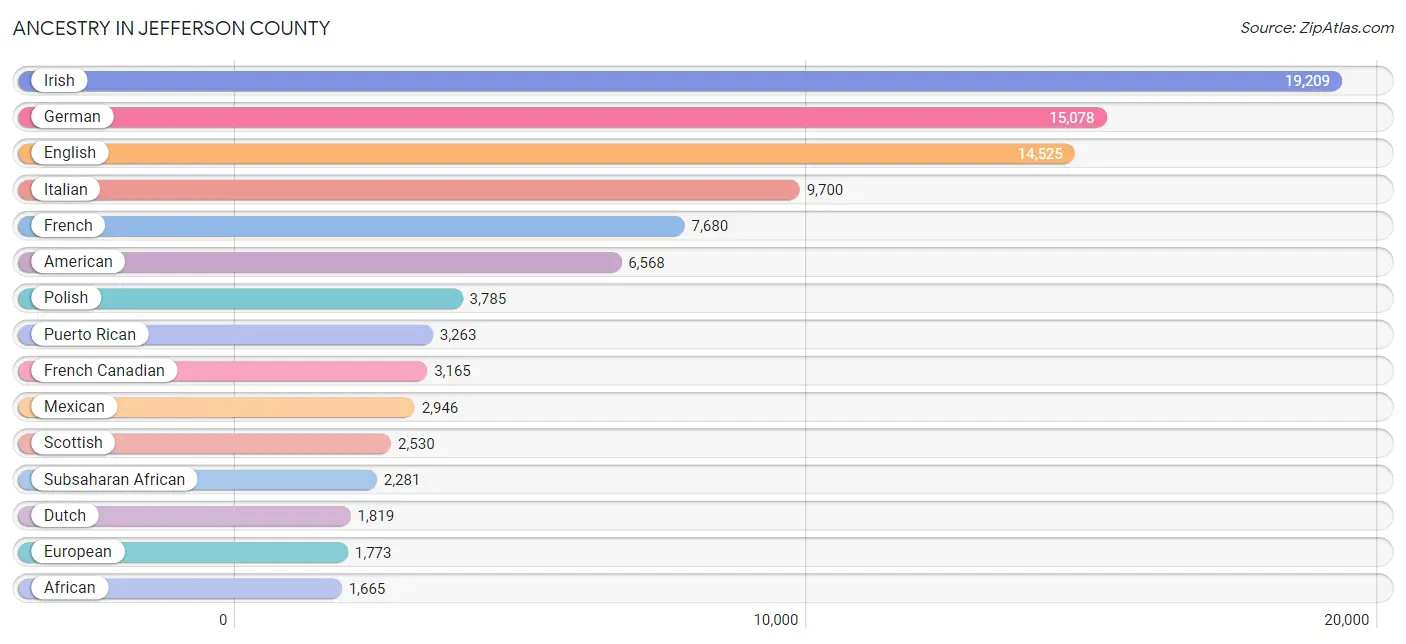
Ancestry in Jefferson County
The most populous ancestries reported in Jefferson County are Irish (19,209 | 16.4%), German (15,078 | 12.8%), English (14,525 | 12.4%), Italian (9,700 | 8.3%), and French (7,680 | 6.5%), together accounting for 56.4% of all Jefferson County residents.
| Ancestry | # Population | % Population |
| Afghan | 16 | 0.0% |
| African | 1,665 | 1.4% |
| Albanian | 15 | 0.0% |
| Alsatian | 21 | 0.0% |
| American | 6,568 | 5.6% |
| Apache | 6 | 0.0% |
| Arab | 302 | 0.3% |
| Argentinean | 14 | 0.0% |
| Armenian | 6 | 0.0% |
| Australian | 5 | 0.0% |
| Austrian | 100 | 0.1% |
| Barbadian | 3 | 0.0% |
| Belgian | 34 | 0.0% |
| Belizean | 181 | 0.2% |
| Bhutanese | 226 | 0.2% |
| Blackfeet | 72 | 0.1% |
| Bolivian | 36 | 0.0% |
| Brazilian | 24 | 0.0% |
| British | 831 | 0.7% |
| Bulgarian | 10 | 0.0% |
| Burmese | 372 | 0.3% |
| Cambodian | 11 | 0.0% |
| Canadian | 681 | 0.6% |
| Celtic | 15 | 0.0% |
| Central American | 573 | 0.5% |
| Central American Indian | 145 | 0.1% |
| Cherokee | 215 | 0.2% |
| Colombian | 376 | 0.3% |
| Costa Rican | 4 | 0.0% |
| Cree | 6 | 0.0% |
| Croatian | 65 | 0.1% |
| Cuban | 75 | 0.1% |
| Czech | 208 | 0.2% |
| Czechoslovakian | 73 | 0.1% |
| Danish | 143 | 0.1% |
| Dominican | 617 | 0.5% |
| Dutch | 1,819 | 1.5% |
| Dutch West Indian | 20 | 0.0% |
| Eastern European | 191 | 0.2% |
| Ecuadorian | 486 | 0.4% |
| Egyptian | 27 | 0.0% |
| English | 14,525 | 12.4% |
| Ethiopian | 70 | 0.1% |
| European | 1,773 | 1.5% |
| Fijian | 36 | 0.0% |
| Finnish | 8 | 0.0% |
| French | 7,680 | 6.5% |
| French American Indian | 19 | 0.0% |
| French Canadian | 3,165 | 2.7% |
| German | 15,078 | 12.8% |
| Ghanaian | 39 | 0.0% |
| Greek | 281 | 0.2% |
| Guamanian / Chamorro | 147 | 0.1% |
| Guatemalan | 85 | 0.1% |
| Guyanese | 41 | 0.0% |
| Haitian | 142 | 0.1% |
| Honduran | 103 | 0.1% |
| Hungarian | 714 | 0.6% |
| Icelander | 3 | 0.0% |
| Indian (Asian) | 420 | 0.4% |
| Indonesian | 64 | 0.1% |
| Inupiat | 16 | 0.0% |
| Iranian | 25 | 0.0% |
| Irish | 19,209 | 16.4% |
| Iroquois | 101 | 0.1% |
| Israeli | 50 | 0.0% |
| Italian | 9,700 | 8.3% |
| Jamaican | 402 | 0.3% |
| Japanese | 210 | 0.2% |
| Kenyan | 26 | 0.0% |
| Korean | 1,184 | 1.0% |
| Laotian | 13 | 0.0% |
| Lebanese | 130 | 0.1% |
| Lithuanian | 104 | 0.1% |
| Malaysian | 4 | 0.0% |
| Mexican | 2,946 | 2.5% |
| Mexican American Indian | 27 | 0.0% |
| Native Hawaiian | 135 | 0.1% |
| Navajo | 31 | 0.0% |
| Nicaraguan | 28 | 0.0% |
| Nigerian | 432 | 0.4% |
| Northern European | 225 | 0.2% |
| Norwegian | 588 | 0.5% |
| Pakistani | 13 | 0.0% |
| Palestinian | 3 | 0.0% |
| Panamanian | 210 | 0.2% |
| Pennsylvania German | 395 | 0.3% |
| Peruvian | 110 | 0.1% |
| Polish | 3,785 | 3.2% |
| Portuguese | 294 | 0.3% |
| Puerto Rican | 3,263 | 2.8% |
| Romanian | 167 | 0.1% |
| Russian | 545 | 0.5% |
| Salvadoran | 87 | 0.1% |
| Samoan | 108 | 0.1% |
| Scandinavian | 341 | 0.3% |
| Scotch-Irish | 757 | 0.6% |
| Scottish | 2,530 | 2.1% |
| Seminole | 5 | 0.0% |
| Serbian | 6 | 0.0% |
| Sioux | 10 | 0.0% |
| Slavic | 28 | 0.0% |
| Slovak | 50 | 0.0% |
| Somali | 4 | 0.0% |
| South African | 11 | 0.0% |
| South American | 1,033 | 0.9% |
| South American Indian | 38 | 0.0% |
| Spaniard | 149 | 0.1% |
| Spanish | 313 | 0.3% |
| Sri Lankan | 15 | 0.0% |
| Subsaharan African | 2,281 | 1.9% |
| Swedish | 700 | 0.6% |
| Swiss | 287 | 0.2% |
| Syrian | 77 | 0.1% |
| Thai | 665 | 0.6% |
| Tongan | 55 | 0.1% |
| Trinidadian and Tobagonian | 53 | 0.1% |
| Turkish | 42 | 0.0% |
| Ukrainian | 337 | 0.3% |
| Venezuelan | 11 | 0.0% |
| Welsh | 781 | 0.7% |
| West Indian | 58 | 0.1% |
| Yaqui | 13 | 0.0% |
| Yugoslavian | 42 | 0.0% | View All 124 Rows |
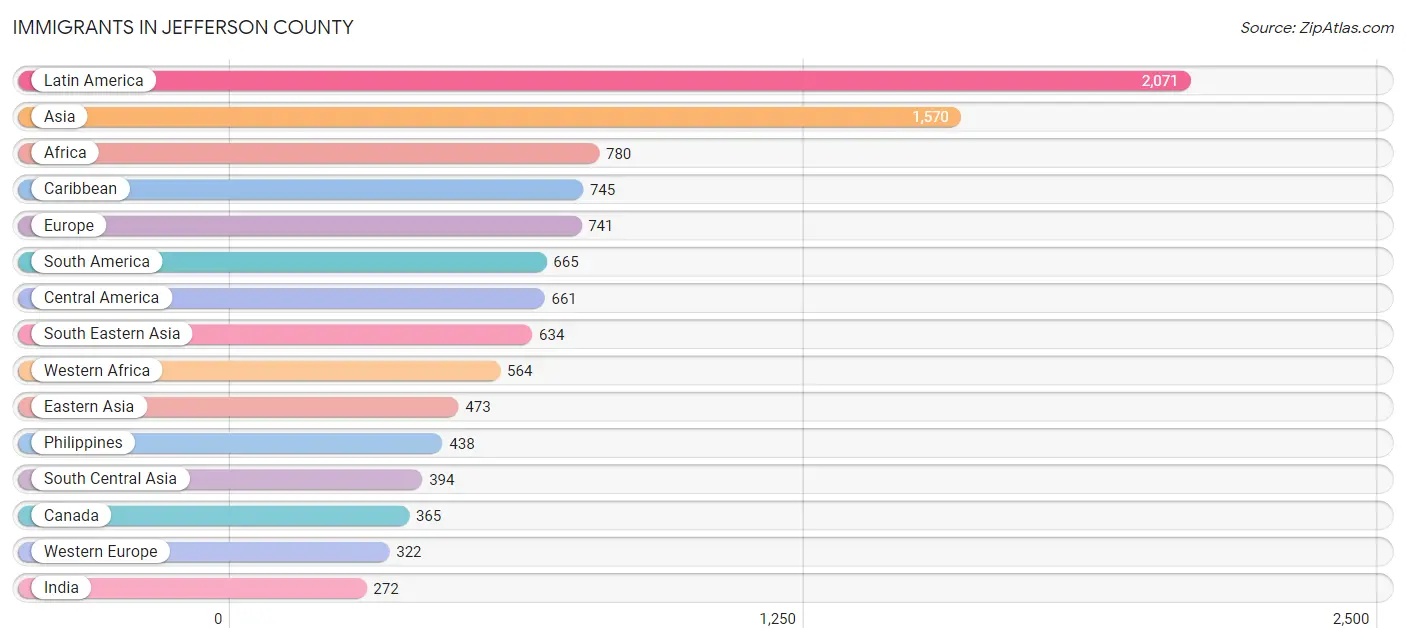
Immigrants in Jefferson County
The most numerous immigrant groups reported in Jefferson County came from Latin America (2,071 | 1.8%), Asia (1,570 | 1.3%), Africa (780 | 0.7%), Caribbean (745 | 0.6%), and Europe (741 | 0.6%), together accounting for 5.0% of all Jefferson County residents.
| Immigration Origin | # Population | % Population |
| Afghanistan | 24 | 0.0% |
| Africa | 780 | 0.7% |
| Albania | 9 | 0.0% |
| Argentina | 14 | 0.0% |
| Asia | 1,570 | 1.3% |
| Bangladesh | 2 | 0.0% |
| Belize | 173 | 0.2% |
| Bolivia | 24 | 0.0% |
| Brazil | 31 | 0.0% |
| Cambodia | 35 | 0.0% |
| Canada | 365 | 0.3% |
| Caribbean | 745 | 0.6% |
| Central America | 661 | 0.6% |
| China | 238 | 0.2% |
| Colombia | 62 | 0.1% |
| Costa Rica | 4 | 0.0% |
| Croatia | 6 | 0.0% |
| Cuba | 2 | 0.0% |
| Dominica | 140 | 0.1% |
| Dominican Republic | 221 | 0.2% |
| Eastern Africa | 98 | 0.1% |
| Eastern Asia | 473 | 0.4% |
| Eastern Europe | 191 | 0.2% |
| Ecuador | 198 | 0.2% |
| Egypt | 4 | 0.0% |
| El Salvador | 12 | 0.0% |
| England | 52 | 0.0% |
| Eritrea | 39 | 0.0% |
| Ethiopia | 31 | 0.0% |
| Europe | 741 | 0.6% |
| France | 56 | 0.1% |
| Germany | 261 | 0.2% |
| Ghana | 146 | 0.1% |
| Greece | 19 | 0.0% |
| Guatemala | 7 | 0.0% |
| Guyana | 194 | 0.2% |
| Haiti | 69 | 0.1% |
| Honduras | 103 | 0.1% |
| Hong Kong | 11 | 0.0% |
| India | 272 | 0.2% |
| Indonesia | 13 | 0.0% |
| Iran | 25 | 0.0% |
| Ireland | 15 | 0.0% |
| Israel | 43 | 0.0% |
| Italy | 43 | 0.0% |
| Jamaica | 270 | 0.2% |
| Japan | 8 | 0.0% |
| Kazakhstan | 21 | 0.0% |
| Kenya | 26 | 0.0% |
| Korea | 216 | 0.2% |
| Latin America | 2,071 | 1.8% |
| Lebanon | 8 | 0.0% |
| Liberia | 2 | 0.0% |
| Lithuania | 2 | 0.0% |
| Malaysia | 2 | 0.0% |
| Mexico | 247 | 0.2% |
| Middle Africa | 44 | 0.0% |
| Nepal | 45 | 0.0% |
| Netherlands | 5 | 0.0% |
| Nicaragua | 9 | 0.0% |
| Nigeria | 172 | 0.2% |
| Northern Africa | 71 | 0.1% |
| Northern Europe | 141 | 0.1% |
| Pakistan | 5 | 0.0% |
| Panama | 106 | 0.1% |
| Peru | 135 | 0.1% |
| Philippines | 438 | 0.4% |
| Poland | 12 | 0.0% |
| Portugal | 1 | 0.0% |
| Russia | 128 | 0.1% |
| Senegal | 140 | 0.1% |
| South Africa | 2 | 0.0% |
| South America | 665 | 0.6% |
| South Central Asia | 394 | 0.3% |
| South Eastern Asia | 634 | 0.5% |
| Southern Europe | 87 | 0.1% |
| Spain | 24 | 0.0% |
| St. Vincent and the Grenadines | 1 | 0.0% |
| Sweden | 21 | 0.0% |
| Syria | 10 | 0.0% |
| Taiwan | 8 | 0.0% |
| Thailand | 61 | 0.1% |
| Trinidad and Tobago | 40 | 0.0% |
| Turkey | 8 | 0.0% |
| Ukraine | 34 | 0.0% |
| Venezuela | 7 | 0.0% |
| Vietnam | 15 | 0.0% |
| Western Africa | 564 | 0.5% |
| Western Asia | 69 | 0.1% |
| Western Europe | 322 | 0.3% |
| Zaire | 17 | 0.0% | View All 91 Rows |
Sex and Age in Jefferson County
Sex and Age in Jefferson County
The most populous age groups in Jefferson County are 20 to 24 Years (7,642 | 12.3%) for men and 25 to 29 Years (4,333 | 7.9%) for women.
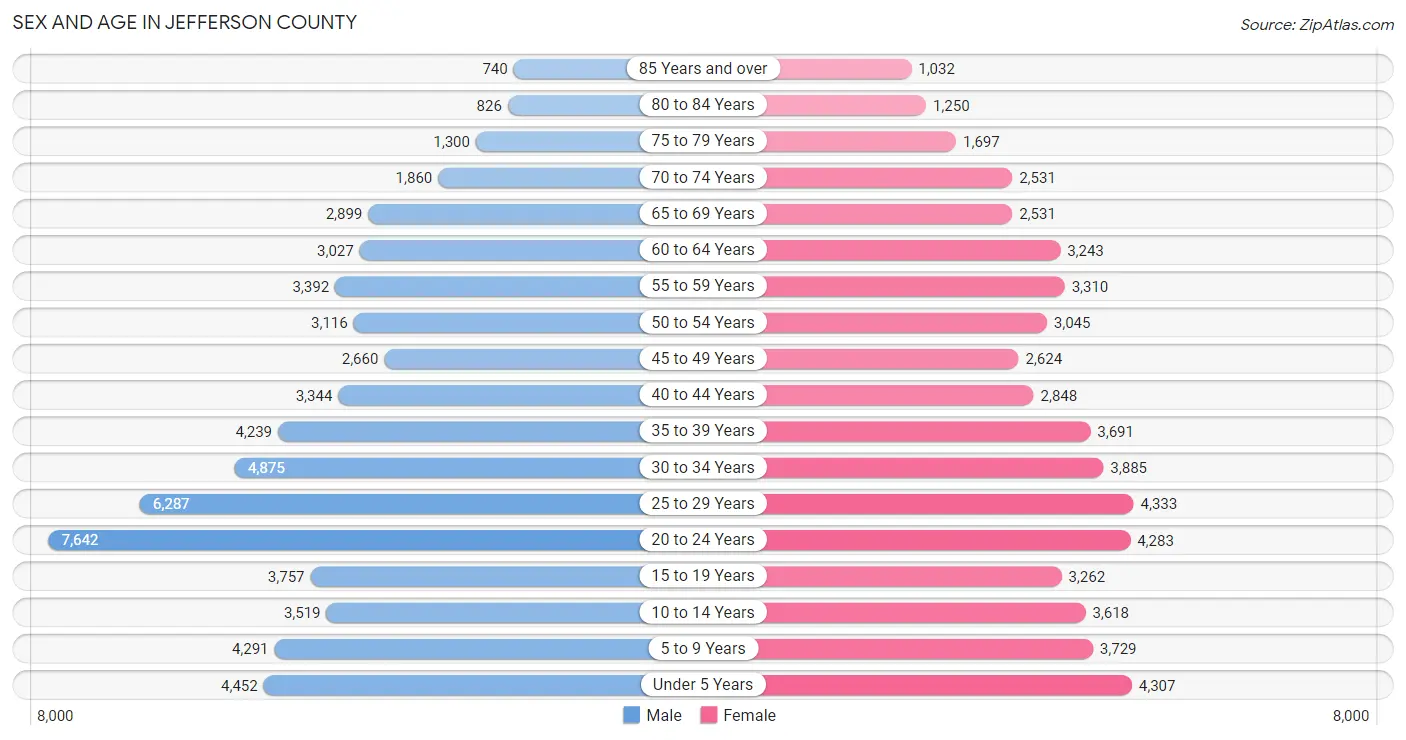
| Age Bracket | Male | Female |
| Under 5 Years | 4,452 (7.1%) | 4,307 (7.8%) |
| 5 to 9 Years | 4,291 (6.9%) | 3,729 (6.8%) |
| 10 to 14 Years | 3,519 (5.7%) | 3,618 (6.6%) |
| 15 to 19 Years | 3,757 (6.0%) | 3,262 (5.9%) |
| 20 to 24 Years | 7,642 (12.3%) | 4,283 (7.8%) |
| 25 to 29 Years | 6,287 (10.1%) | 4,333 (7.9%) |
| 30 to 34 Years | 4,875 (7.8%) | 3,885 (7.0%) |
| 35 to 39 Years | 4,239 (6.8%) | 3,691 (6.7%) |
| 40 to 44 Years | 3,344 (5.4%) | 2,848 (5.2%) |
| 45 to 49 Years | 2,660 (4.3%) | 2,624 (4.8%) |
| 50 to 54 Years | 3,116 (5.0%) | 3,045 (5.5%) |
| 55 to 59 Years | 3,392 (5.4%) | 3,310 (6.0%) |
| 60 to 64 Years | 3,027 (4.9%) | 3,243 (5.9%) |
| 65 to 69 Years | 2,899 (4.7%) | 2,531 (4.6%) |
| 70 to 74 Years | 1,860 (3.0%) | 2,531 (4.6%) |
| 75 to 79 Years | 1,300 (2.1%) | 1,697 (3.1%) |
| 80 to 84 Years | 826 (1.3%) | 1,250 (2.3%) |
| 85 Years and over | 740 (1.2%) | 1,032 (1.9%) |
| Total | 62,226 (100.0%) | 55,219 (100.0%) |
Families and Households in Jefferson County
Median Family Size in Jefferson County
The median family size in Jefferson County is 2.96 persons per family, with married-couple families (23,134 | 76.9%) accounting for the largest median family size of 3.02 persons per family. On the other hand, single male/father families (2,192 | 7.3%) represent the smallest median family size with 2.75 persons per family.
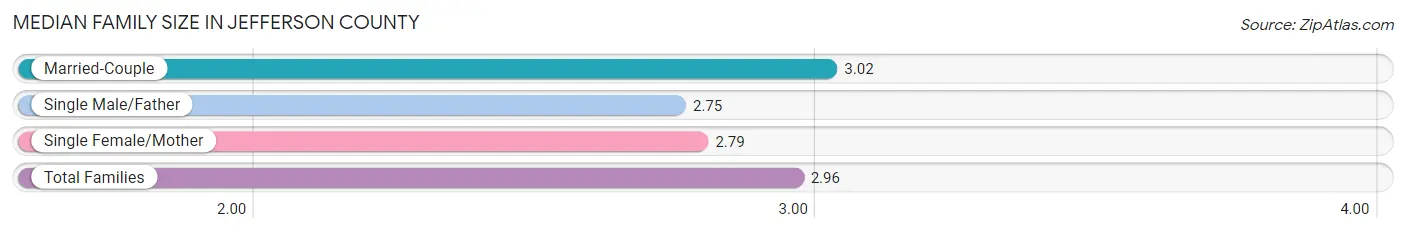
| Family Type | # Families | Family Size |
| Married-Couple | 23,134 (76.9%) | 3.02 |
| Single Male/Father | 2,192 (7.3%) | 2.75 |
| Single Female/Mother | 4,767 (15.8%) | 2.79 |
| Total Families | 30,093 (100.0%) | 2.96 |
Median Household Size in Jefferson County
The median household size in Jefferson County is 2.44 persons per household, with single male/father households (2,192 | 4.8%) accounting for the largest median household size of 3.31 persons per household. non-family households (16,006 | 34.7%) represent the smallest median household size with 1.23 persons per household.
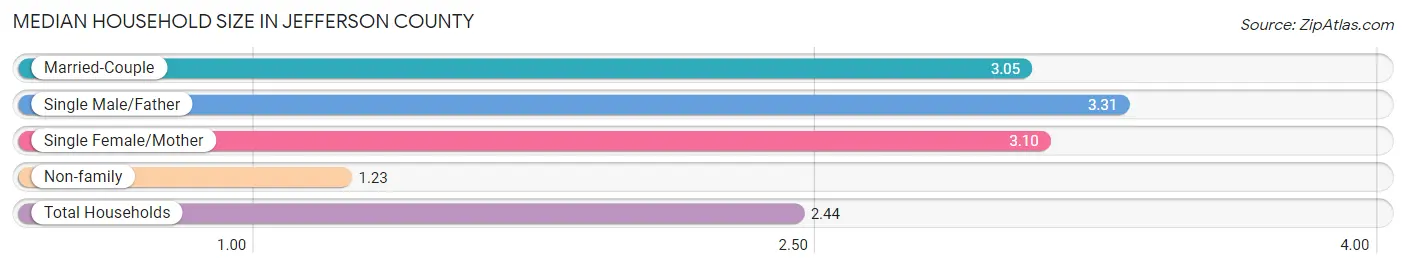
| Household Type | # Households | Household Size |
| Married-Couple | 23,134 (50.2%) | 3.05 |
| Single Male/Father | 2,192 (4.8%) | 3.31 |
| Single Female/Mother | 4,767 (10.3%) | 3.10 |
| Non-family | 16,006 (34.7%) | 1.23 |
| Total Households | 46,099 (100.0%) | 2.44 |
Household Size by Marriage Status in Jefferson County
Out of a total of 46,099 households in Jefferson County, 30,093 (65.3%) are family households, while 16,006 (34.7%) are nonfamily households. The most numerous type of family households are 2-person households, comprising 14,265, and the most common type of nonfamily households are 1-person households, comprising 12,784.
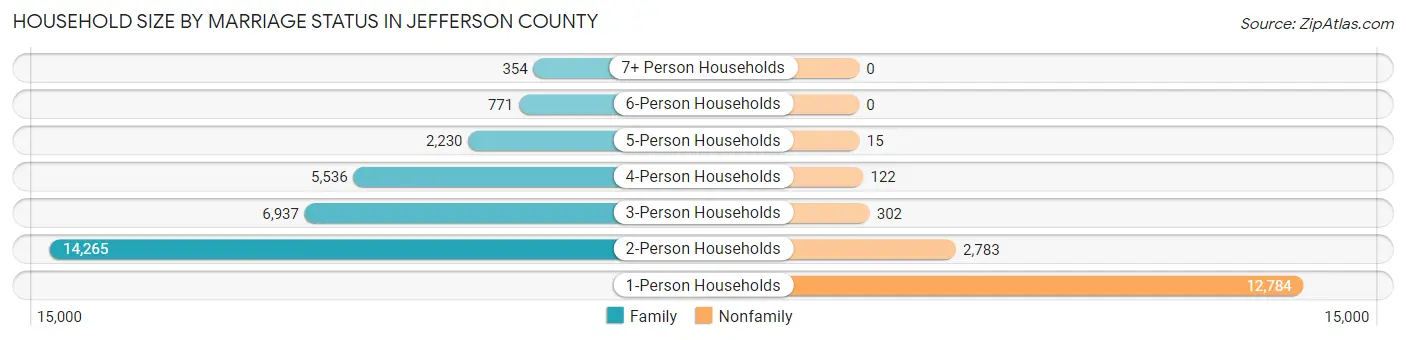
| Household Size | Family Households | Nonfamily Households |
| 1-Person Households | - | 12,784 (27.7%) |
| 2-Person Households | 14,265 (30.9%) | 2,783 (6.0%) |
| 3-Person Households | 6,937 (15.0%) | 302 (0.7%) |
| 4-Person Households | 5,536 (12.0%) | 122 (0.3%) |
| 5-Person Households | 2,230 (4.8%) | 15 (0.0%) |
| 6-Person Households | 771 (1.7%) | 0 (0.0%) |
| 7+ Person Households | 354 (0.8%) | 0 (0.0%) |
| Total | 30,093 (65.3%) | 16,006 (34.7%) |
Female Fertility in Jefferson County
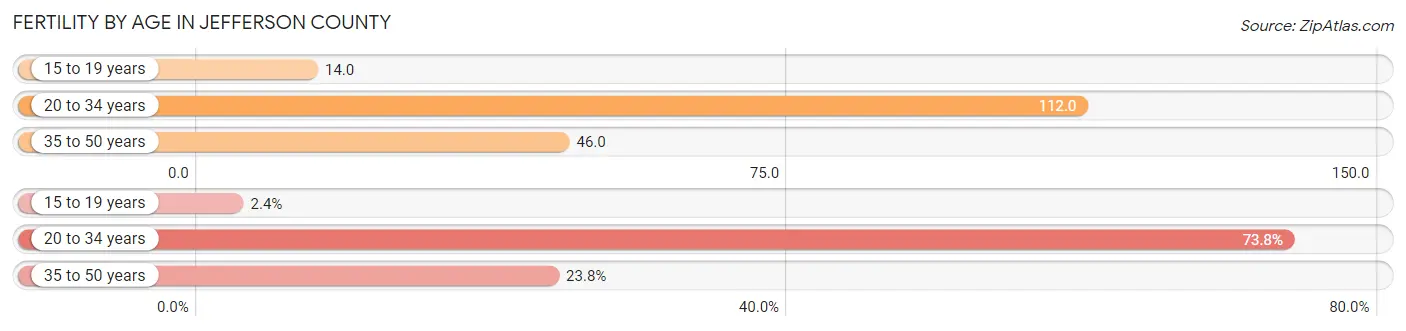
Fertility by Age in Jefferson County
Average fertility rate in Jefferson County is 75.0 births per 1,000 women. Women in the age bracket of 20 to 34 years have the highest fertility rate with 112.0 births per 1,000 women. Women in the age bracket of 20 to 34 years acount for 73.8% of all women with births.
| Age Bracket | Women with Births | Births / 1,000 Women |
| 15 to 19 years | 46 (2.4%) | 14.0 |
| 20 to 34 years | 1,405 (73.8%) | 112.0 |
| 35 to 50 years | 454 (23.8%) | 46.0 |
| Total | 1,905 (100.0%) | 75.0 |
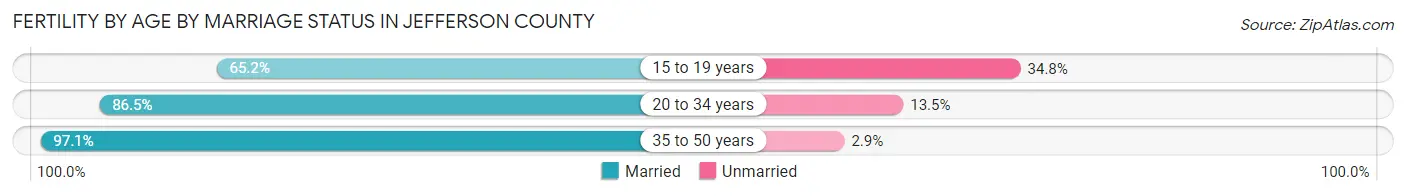
Fertility by Age by Marriage Status in Jefferson County
88.6% of women with births (1,905) in Jefferson County are married. The highest percentage of unmarried women with births falls into 15 to 19 years age bracket with 34.8% of them unmarried at the time of birth, while the lowest percentage of unmarried women with births belong to 35 to 50 years age bracket with 2.9% of them unmarried.
| Age Bracket | Married | Unmarried |
| 15 to 19 years | 30 (65.2%) | 16 (34.8%) |
| 20 to 34 years | 1,215 (86.5%) | 190 (13.5%) |
| 35 to 50 years | 441 (97.1%) | 13 (2.9%) |
| Total | 1,688 (88.6%) | 217 (11.4%) |
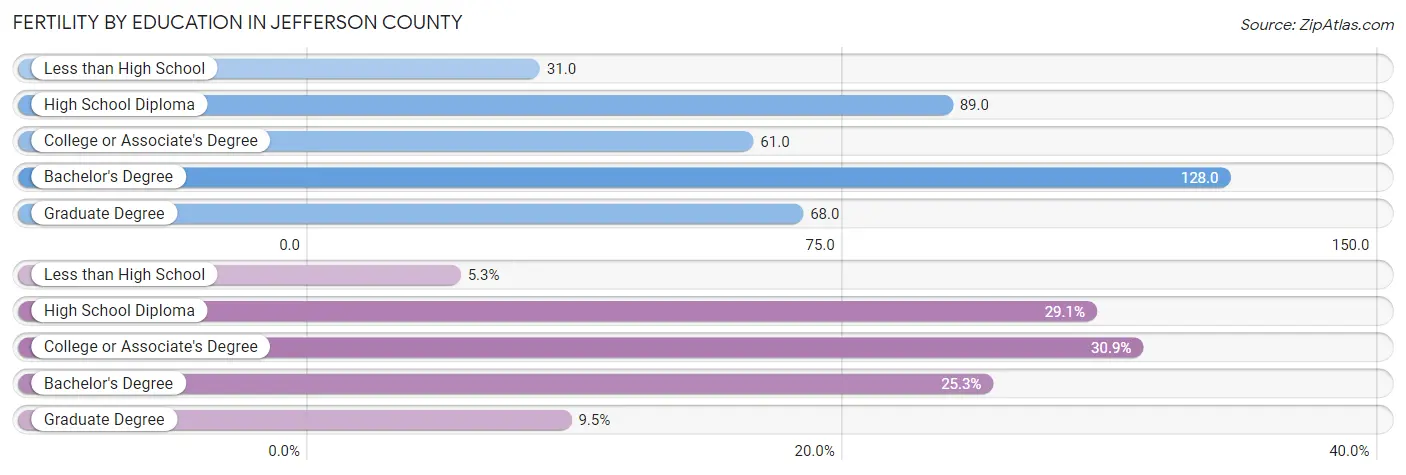
Fertility by Education in Jefferson County
Average fertility rate in Jefferson County is 75.0 births per 1,000 women. Women with the education attainment of bachelor's degree have the highest fertility rate of 128.0 births per 1,000 women, while women with the education attainment of less than high school have the lowest fertility at 31.0 births per 1,000 women. Women with the education attainment of college or associate's degree represent 30.9% of all women with births.
| Educational Attainment | Women with Births | Births / 1,000 Women |
| Less than High School | 101 (5.3%) | 31.0 |
| High School Diploma | 555 (29.1%) | 89.0 |
| College or Associate's Degree | 588 (30.9%) | 61.0 |
| Bachelor's Degree | 481 (25.3%) | 128.0 |
| Graduate Degree | 180 (9.5%) | 68.0 |
| Total | 1,905 (100.0%) | 75.0 |
Fertility by Education by Marriage Status in Jefferson County
11.4% of women with births in Jefferson County are unmarried. Women with the educational attainment of graduate degree are most likely to be married with 100.0% of them married at childbirth, while women with the educational attainment of high school diploma are least likely to be married with 22.7% of them unmarried at childbirth.

| Educational Attainment | Married | Unmarried |
| Less than High School | 87 (86.1%) | 14 (13.9%) |
| High School Diploma | 429 (77.3%) | 126 (22.7%) |
| College or Associate's Degree | 515 (87.6%) | 73 (12.4%) |
| Bachelor's Degree | 476 (99.0%) | 5 (1.0%) |
| Graduate Degree | 180 (100.0%) | 0 (0.0%) |
| Total | 1,688 (88.6%) | 217 (11.4%) |
Employment Characteristics in Jefferson County
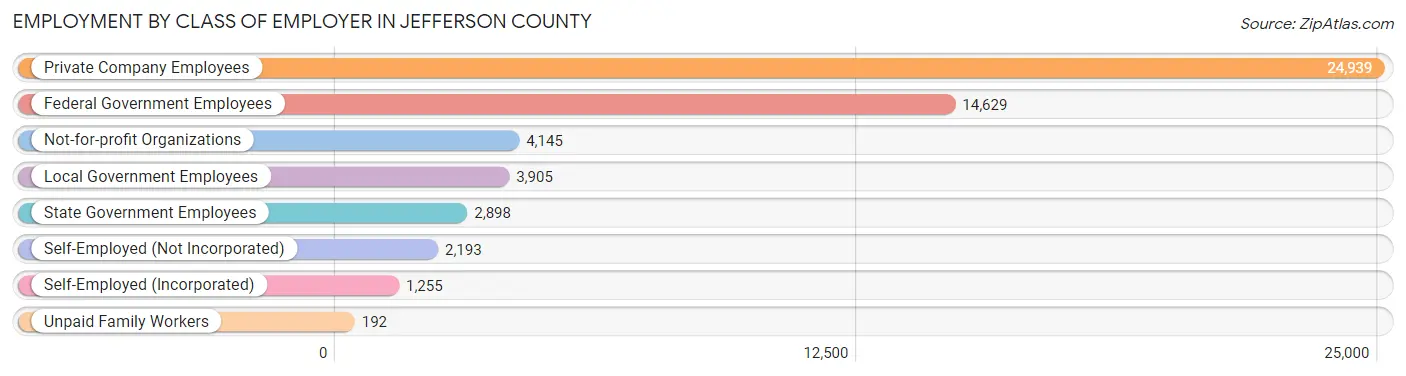
Employment by Class of Employer in Jefferson County
Among the 54,156 employed individuals in Jefferson County, private company employees (24,939 | 46.1%), federal government employees (14,629 | 27.0%), and not-for-profit organizations (4,145 | 7.6%) make up the most common classes of employment.
| Employer Class | # Employees | % Employees |
| Private Company Employees | 24,939 | 46.1% |
| Self-Employed (Incorporated) | 1,255 | 2.3% |
| Self-Employed (Not Incorporated) | 2,193 | 4.1% |
| Not-for-profit Organizations | 4,145 | 7.6% |
| Local Government Employees | 3,905 | 7.2% |
| State Government Employees | 2,898 | 5.3% |
| Federal Government Employees | 14,629 | 27.0% |
| Unpaid Family Workers | 192 | 0.4% |
| Total | 54,156 | 100.0% |
Employment Status by Age in Jefferson County
According to the labor force statistics for Jefferson County, out of the total population over 16 years of age (92,162), 63.2% or 58,246 individuals are in the labor force, with 6.4% or 3,728 of them unemployed. The age group with the highest labor force participation rate is 25 to 29 years, with 83.4% or 8,857 individuals in the labor force. Within the labor force, the 16 to 19 years age range has the highest percentage of unemployed individuals, with 15.0% or 435 of them being unemployed.

| Age Bracket | In Labor Force | Unemployed |
| 16 to 19 Years | 2,899 (51.3%) | 435 (15.0%) |
| 20 to 24 Years | 9,719 (81.5%) | 1,011 (10.4%) |
| 25 to 29 Years | 8,857 (83.4%) | 469 (5.3%) |
| 30 to 34 Years | 6,815 (77.8%) | 532 (7.8%) |
| 35 to 44 Years | 11,029 (78.1%) | 618 (5.6%) |
| 45 to 54 Years | 9,019 (78.8%) | 406 (4.5%) |
| 55 to 59 Years | 4,564 (68.1%) | 260 (5.7%) |
| 60 to 64 Years | 3,179 (50.7%) | 105 (3.3%) |
| 65 to 74 Years | 1,886 (19.2%) | 58 (3.1%) |
| 75 Years and over | 281 (4.1%) | 17 (6.0%) |
| Total | 58,246 (63.2%) | 3,728 (6.4%) |
Employment Status by Educational Attainment in Jefferson County
According to labor force statistics for Jefferson County, 75.0% of individuals (43,439) out of the total population between 25 and 64 years of age (57,919) are in the labor force, with 5.4% or 2,346 of them being unemployed. The group with the highest labor force participation rate are those with the educational attainment of bachelor's degree or higher, with 84.2% or 12,610 individuals in the labor force. Within the labor force, individuals with high school diploma education have the highest percentage of unemployment, with 7.7% or 992 of them being unemployed.
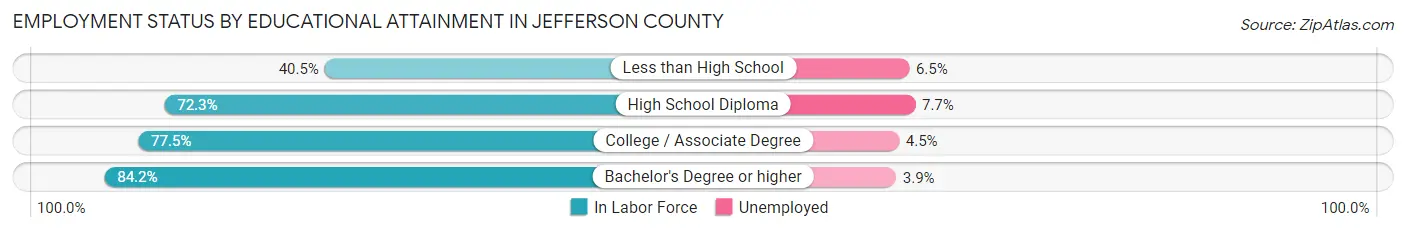
| Educational Attainment | In Labor Force | Unemployed |
| Less than High School | 1,632 (40.5%) | 262 (6.5%) |
| High School Diploma | 12,879 (72.3%) | 1,372 (7.7%) |
| College / Associate Degree | 16,352 (77.5%) | 950 (4.5%) |
| Bachelor's Degree or higher | 12,610 (84.2%) | 584 (3.9%) |
| Total | 43,439 (75.0%) | 3,128 (5.4%) |
Employment Occupations by Sex in Jefferson County
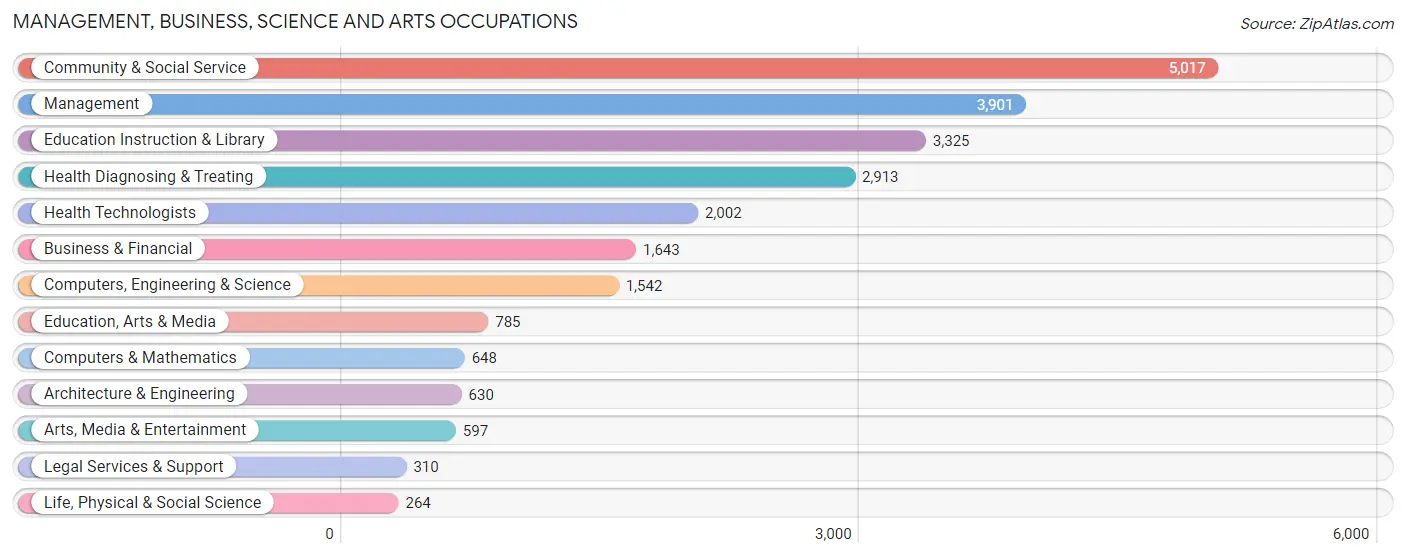
Management, Business, Science and Arts Occupations
The most common Management, Business, Science and Arts occupations in Jefferson County are Community & Social Service (5,017 | 11.4%), Management (3,901 | 8.9%), Education Instruction & Library (3,325 | 7.5%), Health Diagnosing & Treating (2,913 | 6.6%), and Health Technologists (2,002 | 4.5%).
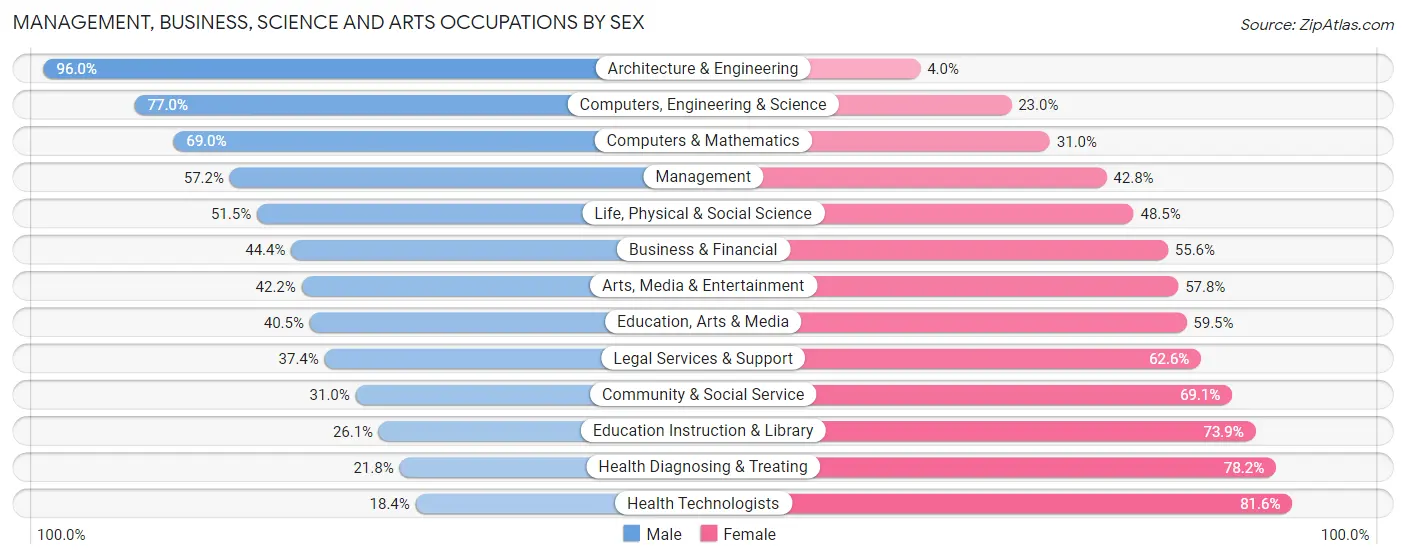
Management, Business, Science and Arts Occupations by Sex
Within the Management, Business, Science and Arts occupations in Jefferson County, the most male-oriented occupations are Architecture & Engineering (96.0%), Computers, Engineering & Science (77.0%), and Computers & Mathematics (69.0%), while the most female-oriented occupations are Health Technologists (81.6%), Health Diagnosing & Treating (78.2%), and Education Instruction & Library (73.9%).
| Occupation | Male | Female |
| Management | 2,231 (57.2%) | 1,670 (42.8%) |
| Business & Financial | 729 (44.4%) | 914 (55.6%) |
| Computers, Engineering & Science | 1,188 (77.0%) | 354 (23.0%) |
| Computers & Mathematics | 447 (69.0%) | 201 (31.0%) |
| Architecture & Engineering | 605 (96.0%) | 25 (4.0%) |
| Life, Physical & Social Science | 136 (51.5%) | 128 (48.5%) |
| Community & Social Service | 1,553 (30.9%) | 3,464 (69.1%) |
| Education, Arts & Media | 318 (40.5%) | 467 (59.5%) |
| Legal Services & Support | 116 (37.4%) | 194 (62.6%) |
| Education Instruction & Library | 867 (26.1%) | 2,458 (73.9%) |
| Arts, Media & Entertainment | 252 (42.2%) | 345 (57.8%) |
| Health Diagnosing & Treating | 635 (21.8%) | 2,278 (78.2%) |
| Health Technologists | 369 (18.4%) | 1,633 (81.6%) |
| Total (Category) | 6,336 (42.2%) | 8,680 (57.8%) |
| Total (Overall) | 22,824 (51.8%) | 21,209 (48.2%) |
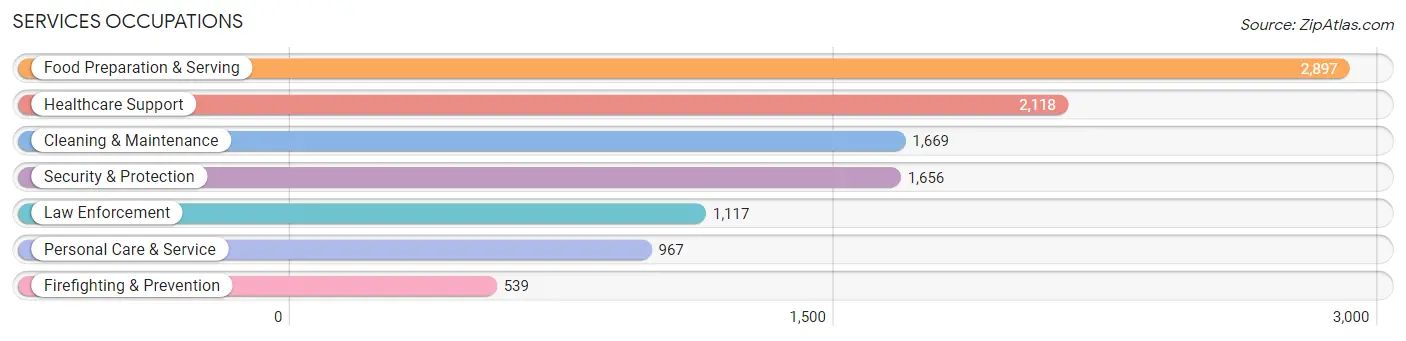
Services Occupations
The most common Services occupations in Jefferson County are Food Preparation & Serving (2,897 | 6.6%), Healthcare Support (2,118 | 4.8%), Cleaning & Maintenance (1,669 | 3.8%), Security & Protection (1,656 | 3.8%), and Law Enforcement (1,117 | 2.5%).
Services Occupations by Sex
Within the Services occupations in Jefferson County, the most male-oriented occupations are Law Enforcement (91.8%), Security & Protection (81.9%), and Cleaning & Maintenance (66.3%), while the most female-oriented occupations are Healthcare Support (82.4%), Personal Care & Service (79.1%), and Food Preparation & Serving (63.0%).
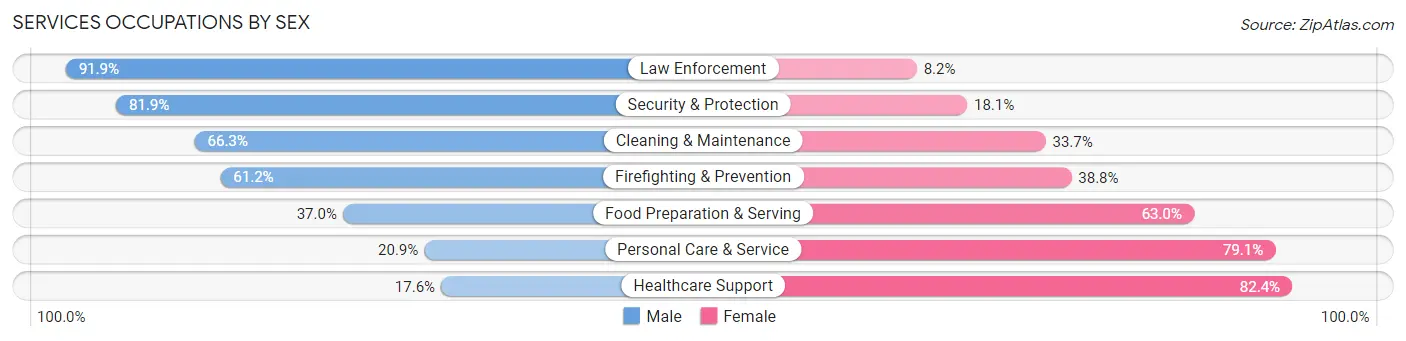
| Occupation | Male | Female |
| Healthcare Support | 372 (17.6%) | 1,746 (82.4%) |
| Security & Protection | 1,356 (81.9%) | 300 (18.1%) |
| Firefighting & Prevention | 330 (61.2%) | 209 (38.8%) |
| Law Enforcement | 1,026 (91.8%) | 91 (8.2%) |
| Food Preparation & Serving | 1,072 (37.0%) | 1,825 (63.0%) |
| Cleaning & Maintenance | 1,107 (66.3%) | 562 (33.7%) |
| Personal Care & Service | 202 (20.9%) | 765 (79.1%) |
| Total (Category) | 4,109 (44.2%) | 5,198 (55.8%) |
| Total (Overall) | 22,824 (51.8%) | 21,209 (48.2%) |
Sales and Office Occupations
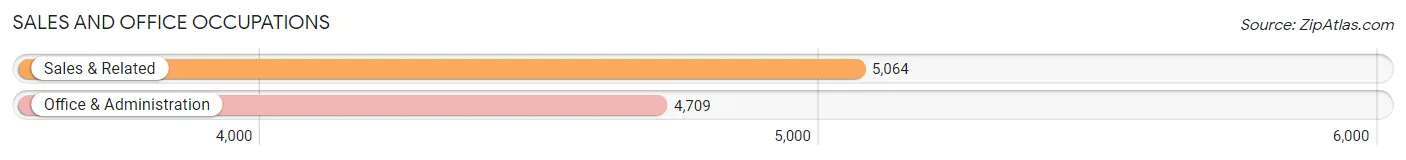
The most common Sales and Office occupations in Jefferson County are Sales & Related (5,064 | 11.5%), and Office & Administration (4,709 | 10.7%).
Sales and Office Occupations by Sex
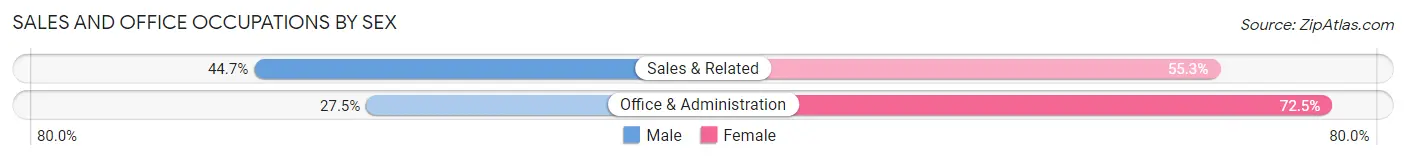
| Occupation | Male | Female |
| Sales & Related | 2,264 (44.7%) | 2,800 (55.3%) |
| Office & Administration | 1,293 (27.5%) | 3,416 (72.5%) |
| Total (Category) | 3,557 (36.4%) | 6,216 (63.6%) |
| Total (Overall) | 22,824 (51.8%) | 21,209 (48.2%) |
Natural Resources, Construction and Maintenance Occupations
The most common Natural Resources, Construction and Maintenance occupations in Jefferson County are Installation, Maintenance & Repair (2,101 | 4.8%), Construction & Extraction (2,065 | 4.7%), and Farming, Fishing & Forestry (260 | 0.6%).
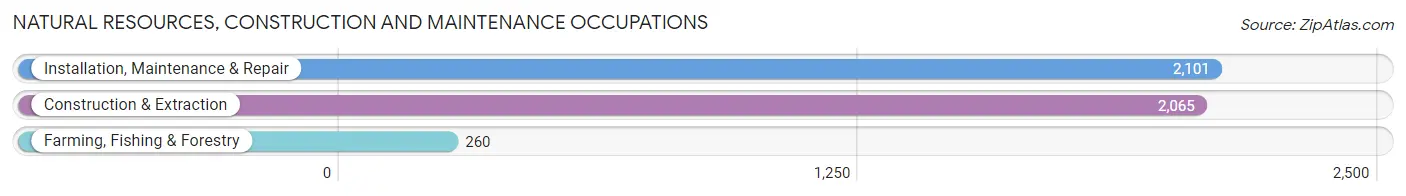
Natural Resources, Construction and Maintenance Occupations by Sex
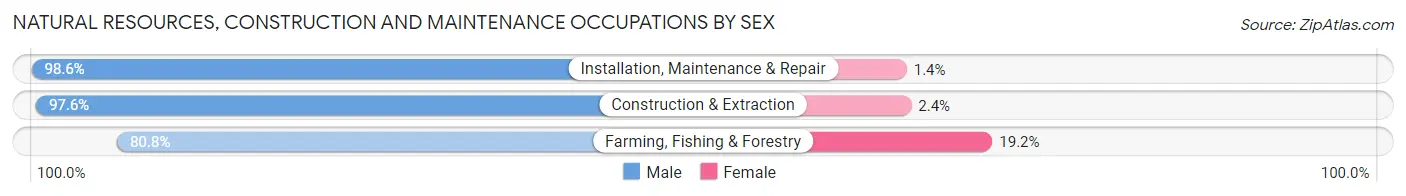
| Occupation | Male | Female |
| Farming, Fishing & Forestry | 210 (80.8%) | 50 (19.2%) |
| Construction & Extraction | 2,016 (97.6%) | 49 (2.4%) |
| Installation, Maintenance & Repair | 2,071 (98.6%) | 30 (1.4%) |
| Total (Category) | 4,297 (97.1%) | 129 (2.9%) |
| Total (Overall) | 22,824 (51.8%) | 21,209 (48.2%) |
Production, Transportation and Moving Occupations
The most common Production, Transportation and Moving occupations in Jefferson County are Production (1,954 | 4.4%), Transportation (1,816 | 4.1%), and Material Moving (1,741 | 4.0%).
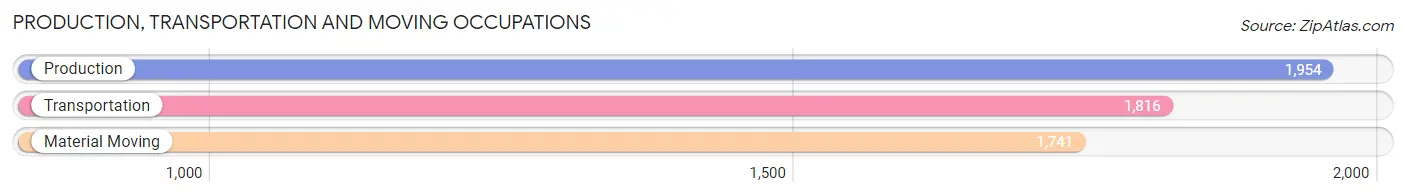
Production, Transportation and Moving Occupations by Sex
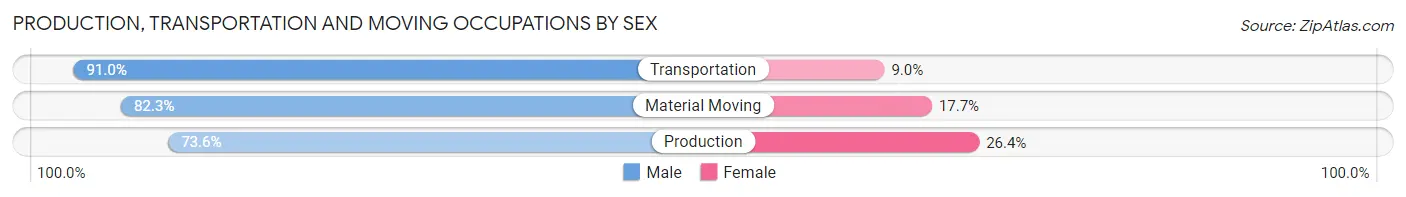
| Occupation | Male | Female |
| Production | 1,439 (73.6%) | 515 (26.4%) |
| Transportation | 1,653 (91.0%) | 163 (9.0%) |
| Material Moving | 1,433 (82.3%) | 308 (17.7%) |
| Total (Category) | 4,525 (82.1%) | 986 (17.9%) |
| Total (Overall) | 22,824 (51.8%) | 21,209 (48.2%) |
Employment Industries by Sex in Jefferson County
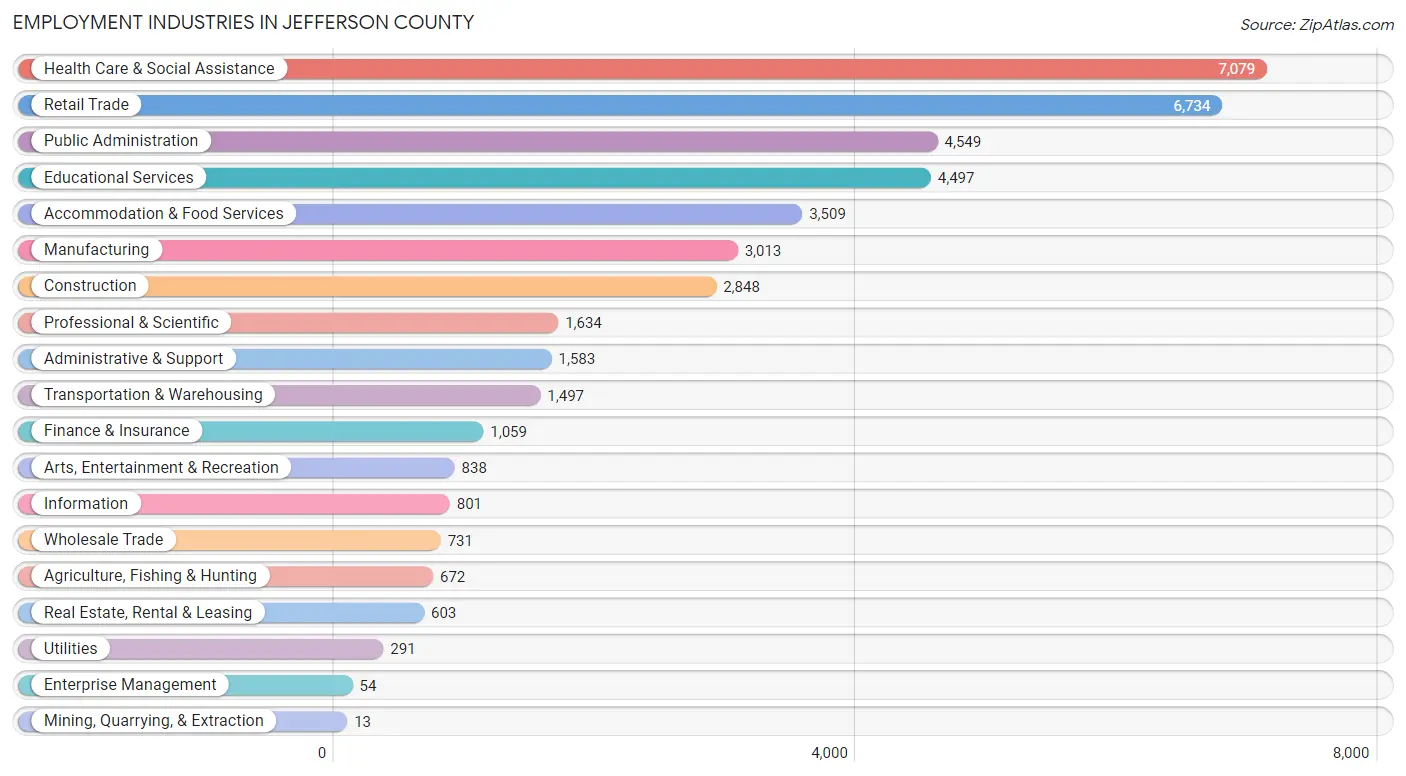
Employment Industries in Jefferson County
The major employment industries in Jefferson County include Health Care & Social Assistance (7,079 | 16.1%), Retail Trade (6,734 | 15.3%), Public Administration (4,549 | 10.3%), Educational Services (4,497 | 10.2%), and Accommodation & Food Services (3,509 | 8.0%).
Employment Industries by Sex in Jefferson County
The Jefferson County industries that see more men than women are Utilities (88.3%), Construction (87.7%), and Mining, Quarrying, & Extraction (84.6%), whereas the industries that tend to have a higher number of women are Health Care & Social Assistance (79.1%), Educational Services (73.5%), and Enterprise Management (72.2%).
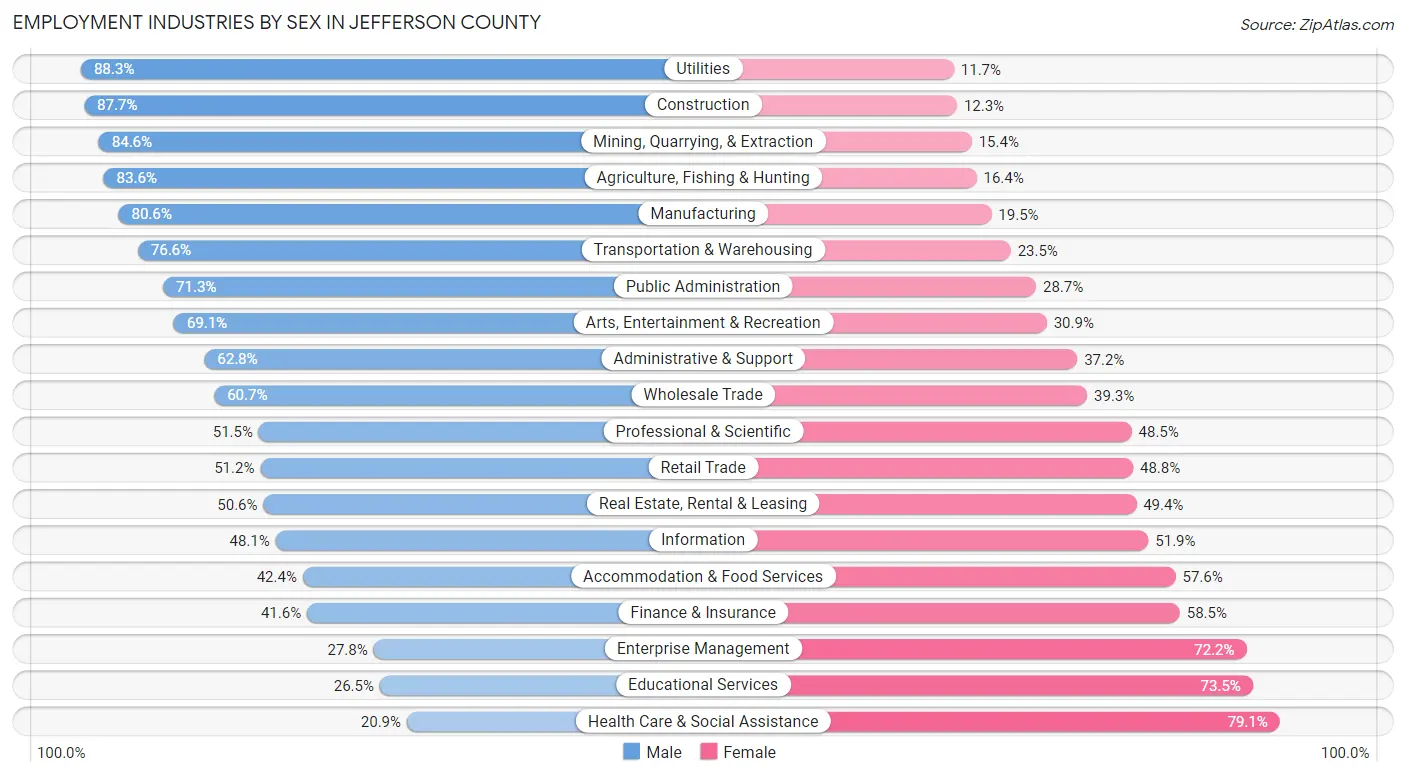
| Industry | Male | Female |
| Agriculture, Fishing & Hunting | 562 (83.6%) | 110 (16.4%) |
| Mining, Quarrying, & Extraction | 11 (84.6%) | 2 (15.4%) |
| Construction | 2,497 (87.7%) | 351 (12.3%) |
| Manufacturing | 2,427 (80.5%) | 586 (19.5%) |
| Wholesale Trade | 444 (60.7%) | 287 (39.3%) |
| Retail Trade | 3,450 (51.2%) | 3,284 (48.8%) |
| Transportation & Warehousing | 1,146 (76.5%) | 351 (23.4%) |
| Utilities | 257 (88.3%) | 34 (11.7%) |
| Information | 385 (48.1%) | 416 (51.9%) |
| Finance & Insurance | 440 (41.5%) | 619 (58.5%) |
| Real Estate, Rental & Leasing | 305 (50.6%) | 298 (49.4%) |
| Professional & Scientific | 842 (51.5%) | 792 (48.5%) |
| Enterprise Management | 15 (27.8%) | 39 (72.2%) |
| Administrative & Support | 994 (62.8%) | 589 (37.2%) |
| Educational Services | 1,191 (26.5%) | 3,306 (73.5%) |
| Health Care & Social Assistance | 1,478 (20.9%) | 5,601 (79.1%) |
| Arts, Entertainment & Recreation | 579 (69.1%) | 259 (30.9%) |
| Accommodation & Food Services | 1,489 (42.4%) | 2,020 (57.6%) |
| Public Administration | 3,244 (71.3%) | 1,305 (28.7%) |
| Total | 22,824 (51.8%) | 21,209 (48.2%) |
Education in Jefferson County
School Enrollment in Jefferson County
The most common levels of schooling among the 27,214 students in Jefferson County are elementary school (6,592 | 24.2%), middle school (5,549 | 20.4%), and college / undergraduate (5,456 | 20.1%).
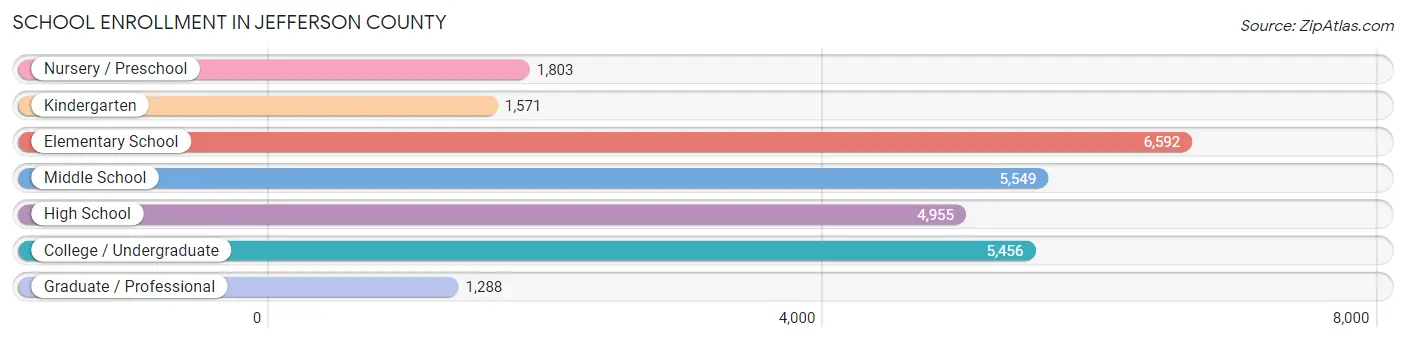
| School Level | # Students | % Students |
| Nursery / Preschool | 1,803 | 6.6% |
| Kindergarten | 1,571 | 5.8% |
| Elementary School | 6,592 | 24.2% |
| Middle School | 5,549 | 20.4% |
| High School | 4,955 | 18.2% |
| College / Undergraduate | 5,456 | 20.1% |
| Graduate / Professional | 1,288 | 4.7% |
| Total | 27,214 | 100.0% |
School Enrollment by Age by Funding Source in Jefferson County
Out of a total of 27,214 students who are enrolled in schools in Jefferson County, 3,266 (12.0%) attend a private institution, while the remaining 23,948 (88.0%) are enrolled in public schools. The age group of 35 years and over has the highest likelihood of being enrolled in private schools, with 460 (32.7% in the age bracket) enrolled. Conversely, the age group of 15 to 17 year olds has the lowest likelihood of being enrolled in a private school, with 3,552 (92.5% in the age bracket) attending a public institution.
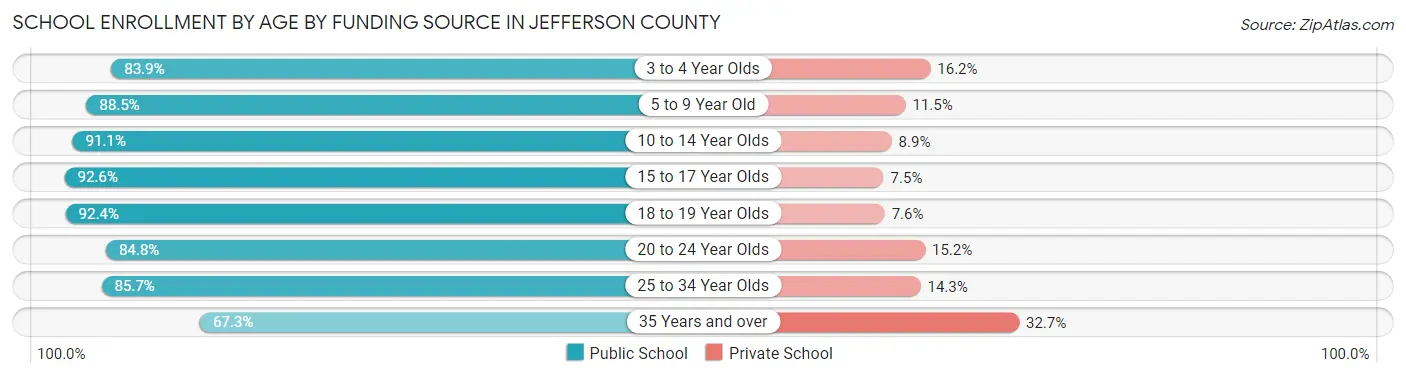
| Age Bracket | Public School | Private School |
| 3 to 4 Year Olds | 1,293 (83.9%) | 249 (16.2%) |
| 5 to 9 Year Old | 6,744 (88.5%) | 878 (11.5%) |
| 10 to 14 Year Olds | 6,284 (91.1%) | 617 (8.9%) |
| 15 to 17 Year Olds | 3,552 (92.5%) | 286 (7.4%) |
| 18 to 19 Year Olds | 1,100 (92.4%) | 91 (7.6%) |
| 20 to 24 Year Olds | 2,037 (84.8%) | 364 (15.2%) |
| 25 to 34 Year Olds | 1,980 (85.7%) | 331 (14.3%) |
| 35 Years and over | 948 (67.3%) | 460 (32.7%) |
| Total | 23,948 (88.0%) | 3,266 (12.0%) |
Educational Attainment by Field of Study in Jefferson County
Education (3,877 | 18.8%), business (2,337 | 11.3%), arts & humanities (2,090 | 10.2%), social sciences (1,960 | 9.5%), and science & technology (1,750 | 8.5%) are the most common fields of study among 20,600 individuals in Jefferson County who have obtained a bachelor's degree or higher.
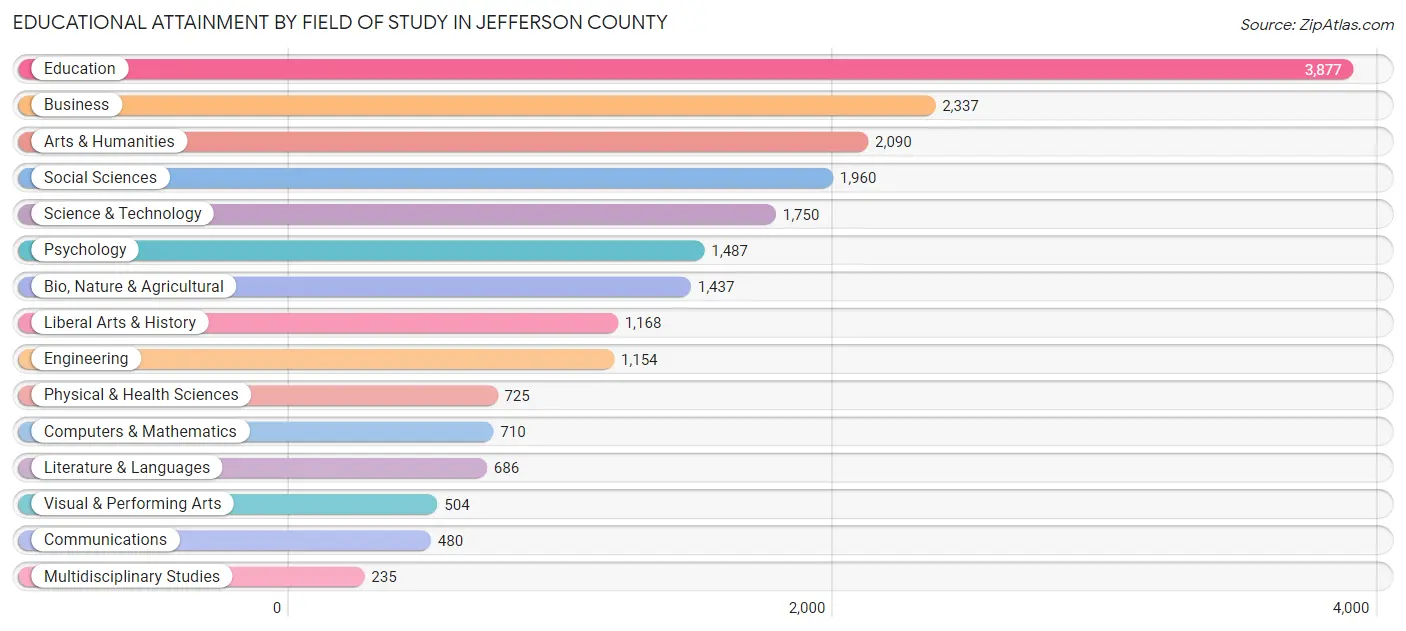
| Field of Study | # Graduates | % Graduates |
| Computers & Mathematics | 710 | 3.5% |
| Bio, Nature & Agricultural | 1,437 | 7.0% |
| Physical & Health Sciences | 725 | 3.5% |
| Psychology | 1,487 | 7.2% |
| Social Sciences | 1,960 | 9.5% |
| Engineering | 1,154 | 5.6% |
| Multidisciplinary Studies | 235 | 1.1% |
| Science & Technology | 1,750 | 8.5% |
| Business | 2,337 | 11.3% |
| Education | 3,877 | 18.8% |
| Literature & Languages | 686 | 3.3% |
| Liberal Arts & History | 1,168 | 5.7% |
| Visual & Performing Arts | 504 | 2.5% |
| Communications | 480 | 2.3% |
| Arts & Humanities | 2,090 | 10.2% |
| Total | 20,600 | 100.0% |
Transportation & Commute in Jefferson County
Vehicle Availability by Sex in Jefferson County
The most prevalent vehicle ownership categories in Jefferson County are males with 2 vehicles (14,381, accounting for 48.0%) and females with 2 vehicles (10,063, making up 67.4%).
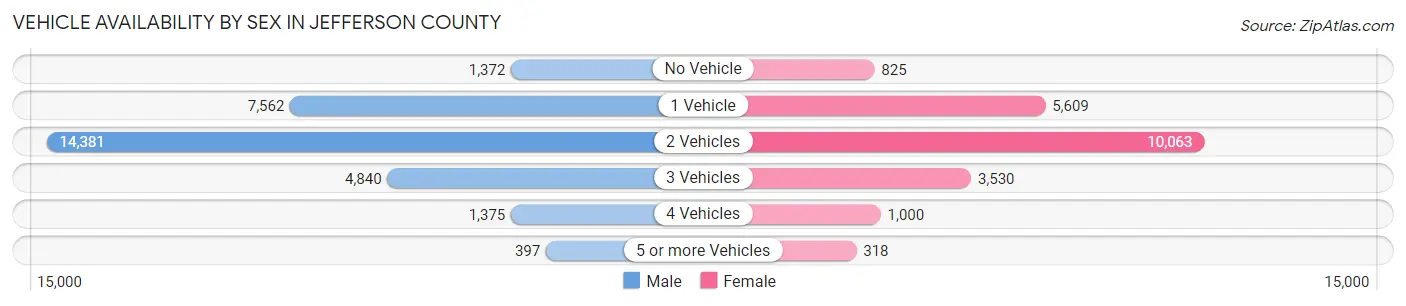
| Vehicles Available | Male | Female |
| No Vehicle | 1,372 (4.6%) | 825 (3.9%) |
| 1 Vehicle | 7,562 (25.3%) | 5,609 (26.3%) |
| 2 Vehicles | 14,381 (48.0%) | 10,063 (47.1%) |
| 3 Vehicles | 4,840 (16.2%) | 3,530 (16.5%) |
| 4 Vehicles | 1,375 (4.6%) | 1,000 (4.7%) |
| 5 or more Vehicles | 397 (1.3%) | 318 (1.5%) |
| Total | 29,927 (100.0%) | 21,345 (100.0%) |
Commute Time in Jefferson County
The most frequently occuring commute durations in Jefferson County are 15 to 19 minutes (9,568 commuters, 18.9%), 5 to 9 minutes (8,795 commuters, 17.3%), and 10 to 14 minutes (8,514 commuters, 16.8%).
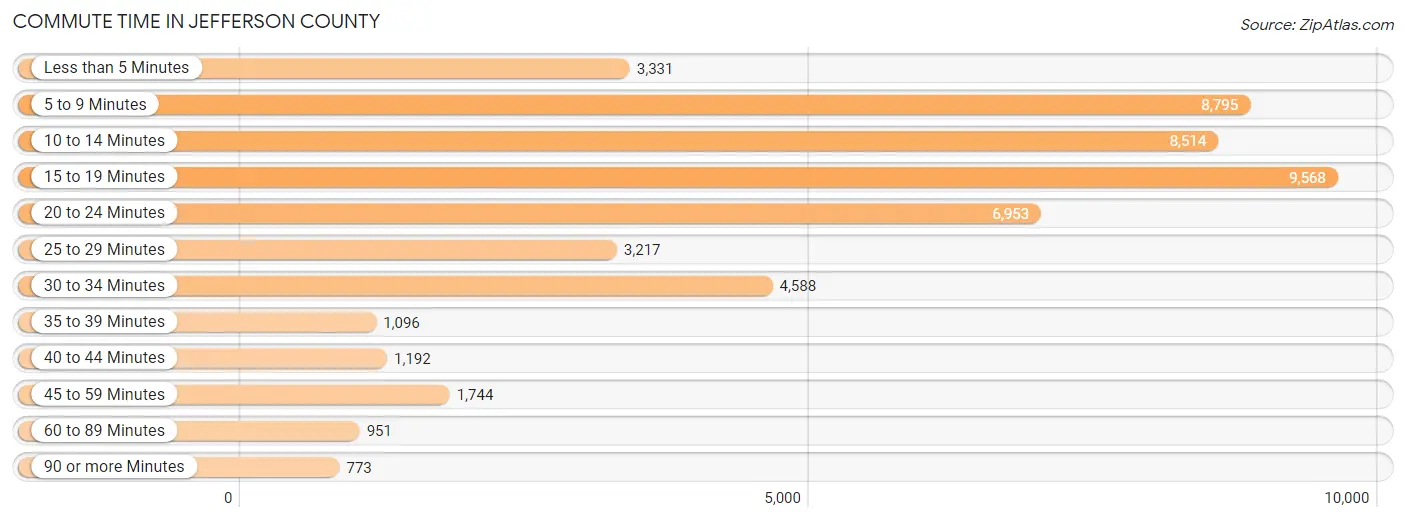
| Commute Time | # Commuters | % Commuters |
| Less than 5 Minutes | 3,331 | 6.6% |
| 5 to 9 Minutes | 8,795 | 17.3% |
| 10 to 14 Minutes | 8,514 | 16.8% |
| 15 to 19 Minutes | 9,568 | 18.9% |
| 20 to 24 Minutes | 6,953 | 13.7% |
| 25 to 29 Minutes | 3,217 | 6.3% |
| 30 to 34 Minutes | 4,588 | 9.0% |
| 35 to 39 Minutes | 1,096 | 2.2% |
| 40 to 44 Minutes | 1,192 | 2.4% |
| 45 to 59 Minutes | 1,744 | 3.4% |
| 60 to 89 Minutes | 951 | 1.9% |
| 90 or more Minutes | 773 | 1.5% |
Commute Time by Sex in Jefferson County
The most common commute times in Jefferson County are 15 to 19 minutes (5,669 commuters, 18.5%) for males and 15 to 19 minutes (3,899 commuters, 19.4%) for females.
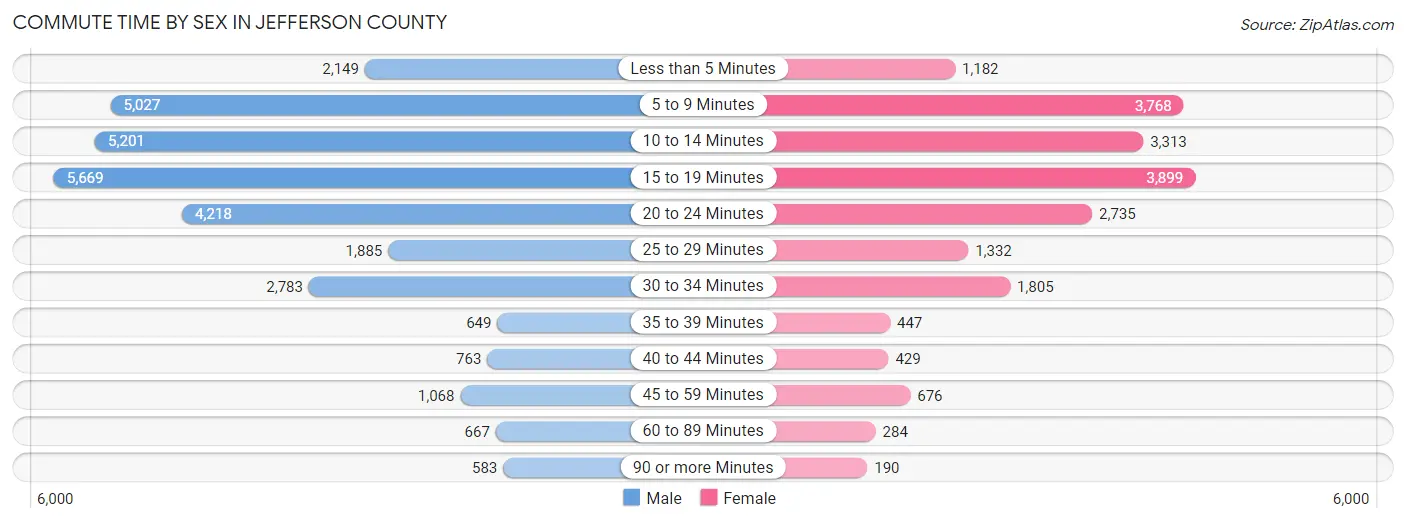
| Commute Time | Male | Female |
| Less than 5 Minutes | 2,149 (7.0%) | 1,182 (5.9%) |
| 5 to 9 Minutes | 5,027 (16.4%) | 3,768 (18.8%) |
| 10 to 14 Minutes | 5,201 (17.0%) | 3,313 (16.5%) |
| 15 to 19 Minutes | 5,669 (18.5%) | 3,899 (19.4%) |
| 20 to 24 Minutes | 4,218 (13.8%) | 2,735 (13.6%) |
| 25 to 29 Minutes | 1,885 (6.1%) | 1,332 (6.6%) |
| 30 to 34 Minutes | 2,783 (9.1%) | 1,805 (9.0%) |
| 35 to 39 Minutes | 649 (2.1%) | 447 (2.2%) |
| 40 to 44 Minutes | 763 (2.5%) | 429 (2.1%) |
| 45 to 59 Minutes | 1,068 (3.5%) | 676 (3.4%) |
| 60 to 89 Minutes | 667 (2.2%) | 284 (1.4%) |
| 90 or more Minutes | 583 (1.9%) | 190 (0.9%) |
Time of Departure to Work by Sex in Jefferson County
The most frequent times of departure to work in Jefferson County are 6:00 AM to 6:29 AM (4,980, 16.2%) for males and 7:30 AM to 7:59 AM (2,943, 14.7%) for females.
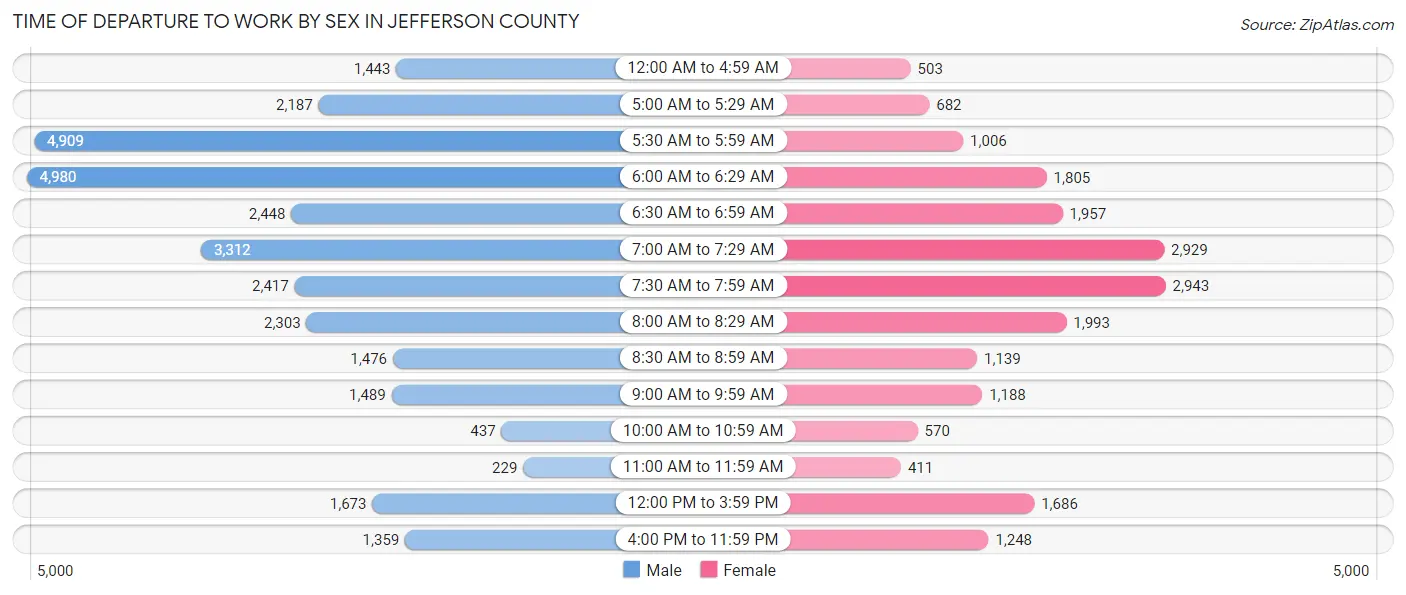
| Time of Departure | Male | Female |
| 12:00 AM to 4:59 AM | 1,443 (4.7%) | 503 (2.5%) |
| 5:00 AM to 5:29 AM | 2,187 (7.1%) | 682 (3.4%) |
| 5:30 AM to 5:59 AM | 4,909 (16.0%) | 1,006 (5.0%) |
| 6:00 AM to 6:29 AM | 4,980 (16.2%) | 1,805 (9.0%) |
| 6:30 AM to 6:59 AM | 2,448 (8.0%) | 1,957 (9.8%) |
| 7:00 AM to 7:29 AM | 3,312 (10.8%) | 2,929 (14.6%) |
| 7:30 AM to 7:59 AM | 2,417 (7.9%) | 2,943 (14.7%) |
| 8:00 AM to 8:29 AM | 2,303 (7.5%) | 1,993 (9.9%) |
| 8:30 AM to 8:59 AM | 1,476 (4.8%) | 1,139 (5.7%) |
| 9:00 AM to 9:59 AM | 1,489 (4.9%) | 1,188 (5.9%) |
| 10:00 AM to 10:59 AM | 437 (1.4%) | 570 (2.8%) |
| 11:00 AM to 11:59 AM | 229 (0.7%) | 411 (2.1%) |
| 12:00 PM to 3:59 PM | 1,673 (5.5%) | 1,686 (8.4%) |
| 4:00 PM to 11:59 PM | 1,359 (4.4%) | 1,248 (6.2%) |
| Total | 30,662 (100.0%) | 20,060 (100.0%) |
Housing Occupancy in Jefferson County
Occupancy by Ownership in Jefferson County
Of the total 46,099 dwellings in Jefferson County, owner-occupied units account for 25,123 (54.5%), while renter-occupied units make up 20,976 (45.5%).
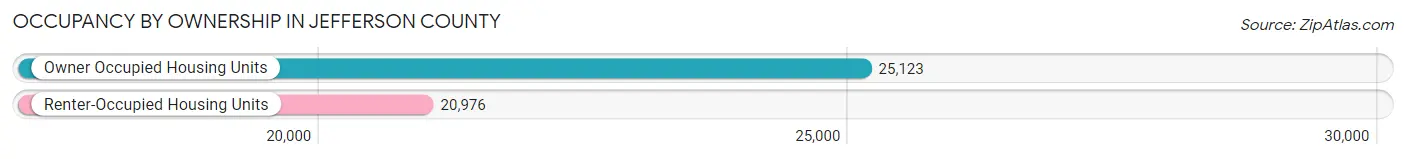
| Occupancy | # Housing Units | % Housing Units |
| Owner Occupied Housing Units | 25,123 | 54.5% |
| Renter-Occupied Housing Units | 20,976 | 45.5% |
| Total Occupied Housing Units | 46,099 | 100.0% |
Occupancy by Household Size in Jefferson County
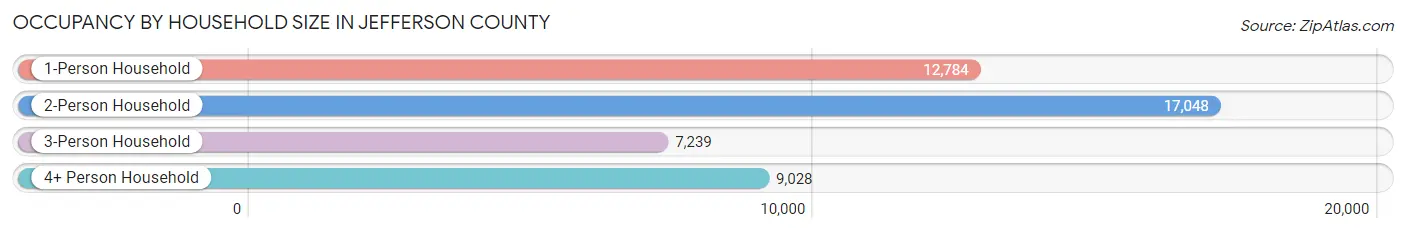
| Household Size | # Housing Units | % Housing Units |
| 1-Person Household | 12,784 | 27.7% |
| 2-Person Household | 17,048 | 37.0% |
| 3-Person Household | 7,239 | 15.7% |
| 4+ Person Household | 9,028 | 19.6% |
| Total Housing Units | 46,099 | 100.0% |
Occupancy by Ownership by Household Size in Jefferson County
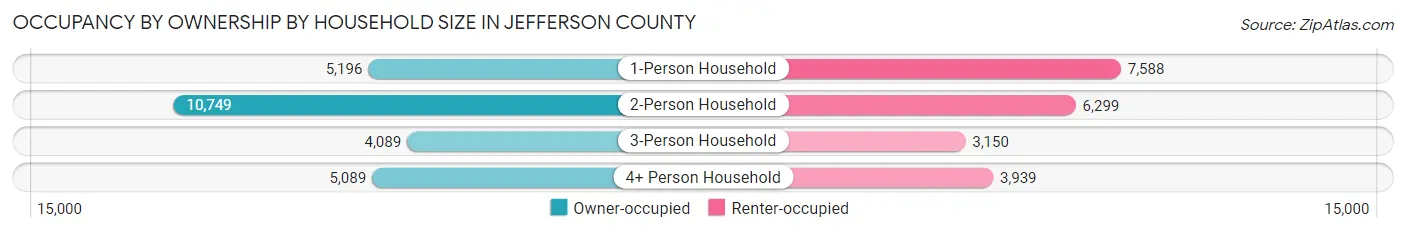
| Household Size | Owner-occupied | Renter-occupied |
| 1-Person Household | 5,196 (40.6%) | 7,588 (59.4%) |
| 2-Person Household | 10,749 (63.0%) | 6,299 (36.9%) |
| 3-Person Household | 4,089 (56.5%) | 3,150 (43.5%) |
| 4+ Person Household | 5,089 (56.4%) | 3,939 (43.6%) |
| Total Housing Units | 25,123 (54.5%) | 20,976 (45.5%) |
Occupancy by Educational Attainment in Jefferson County
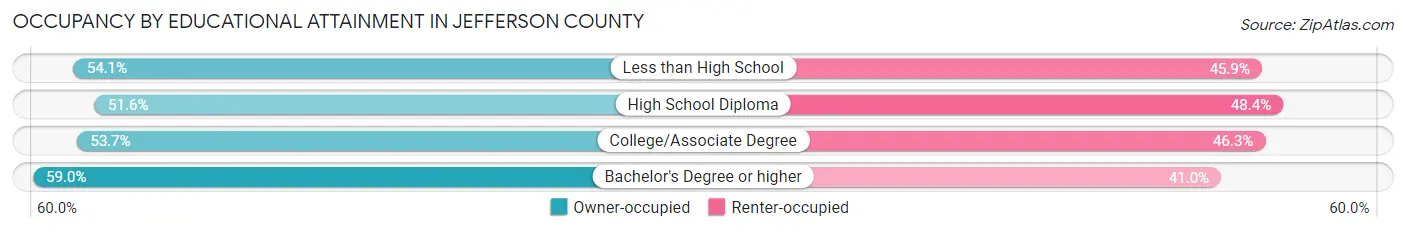
| Household Size | Owner-occupied | Renter-occupied |
| Less than High School | 1,484 (54.1%) | 1,257 (45.9%) |
| High School Diploma | 7,399 (51.6%) | 6,936 (48.4%) |
| College/Associate Degree | 8,992 (53.7%) | 7,744 (46.3%) |
| Bachelor's Degree or higher | 7,248 (59.0%) | 5,039 (41.0%) |
Occupancy by Age of Householder in Jefferson County
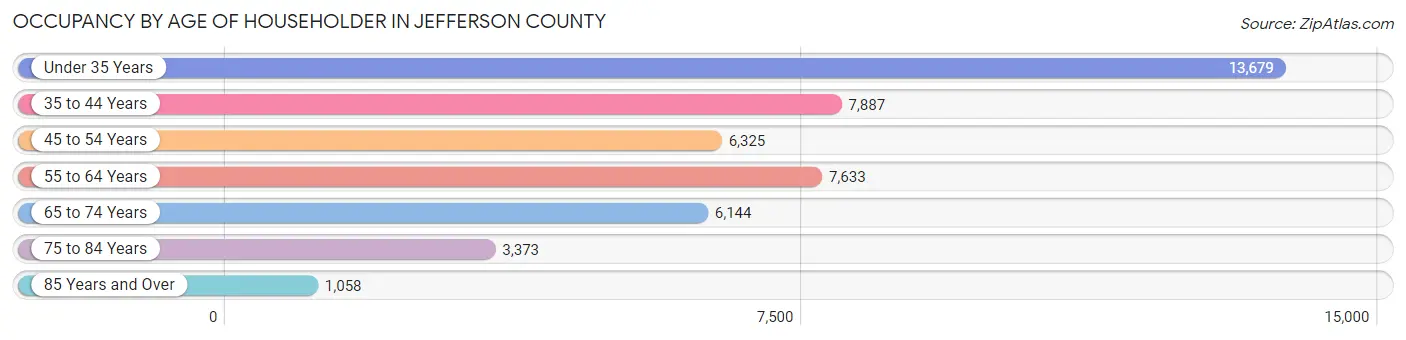
| Age Bracket | # Households | % Households |
| Under 35 Years | 13,679 | 29.7% |
| 35 to 44 Years | 7,887 | 17.1% |
| 45 to 54 Years | 6,325 | 13.7% |
| 55 to 64 Years | 7,633 | 16.6% |
| 65 to 74 Years | 6,144 | 13.3% |
| 75 to 84 Years | 3,373 | 7.3% |
| 85 Years and Over | 1,058 | 2.3% |
| Total | 46,099 | 100.0% |
Housing Finances in Jefferson County
Median Income by Occupancy in Jefferson County
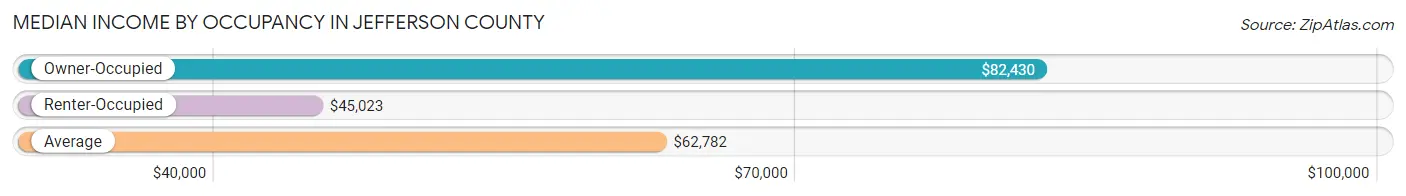
| Occupancy Type | # Households | Median Income |
| Owner-Occupied | 25,123 (54.5%) | $82,430 |
| Renter-Occupied | 20,976 (45.5%) | $45,023 |
| Average | 46,099 (100.0%) | $62,782 |
Occupancy by Householder Income Bracket in Jefferson County
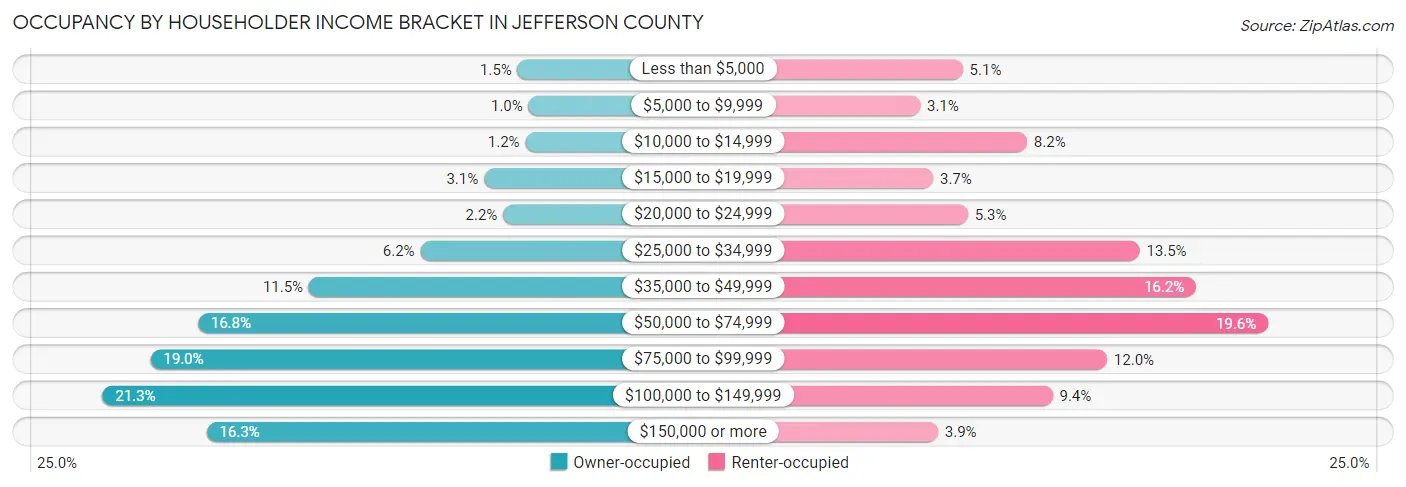
| Income Bracket | Owner-occupied | Renter-occupied |
| Less than $5,000 | 381 (1.5%) | 1,069 (5.1%) |
| $5,000 to $9,999 | 252 (1.0%) | 644 (3.1%) |
| $10,000 to $14,999 | 288 (1.1%) | 1,711 (8.2%) |
| $15,000 to $19,999 | 785 (3.1%) | 773 (3.7%) |
| $20,000 to $24,999 | 556 (2.2%) | 1,120 (5.3%) |
| $25,000 to $34,999 | 1,546 (6.1%) | 2,836 (13.5%) |
| $35,000 to $49,999 | 2,879 (11.5%) | 3,402 (16.2%) |
| $50,000 to $74,999 | 4,207 (16.8%) | 4,119 (19.6%) |
| $75,000 to $99,999 | 4,775 (19.0%) | 2,511 (12.0%) |
| $100,000 to $149,999 | 5,350 (21.3%) | 1,968 (9.4%) |
| $150,000 or more | 4,104 (16.3%) | 823 (3.9%) |
| Total | 25,123 (100.0%) | 20,976 (100.0%) |
Monthly Housing Cost Tiers in Jefferson County
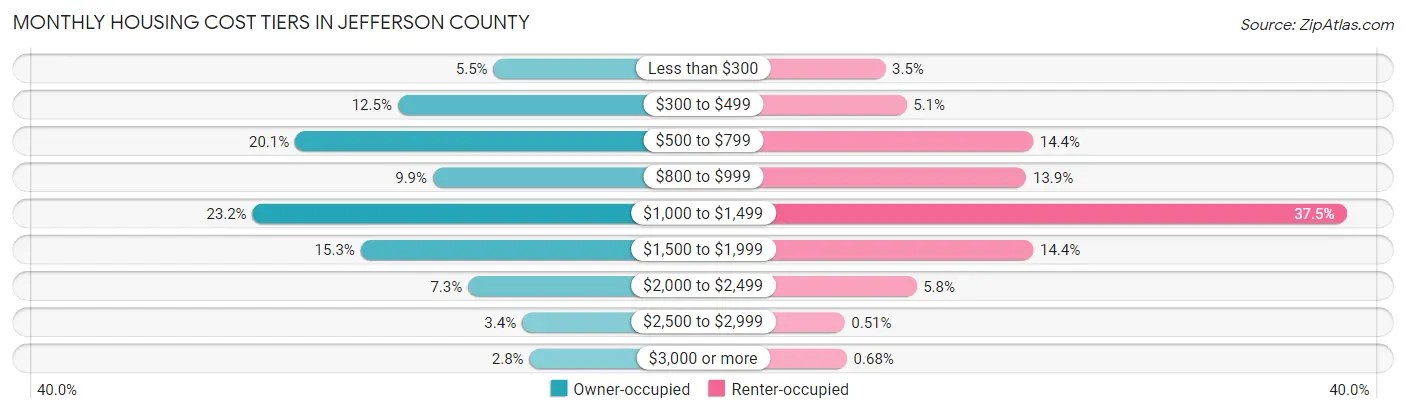
| Monthly Cost | Owner-occupied | Renter-occupied |
| Less than $300 | 1,374 (5.5%) | 737 (3.5%) |
| $300 to $499 | 3,145 (12.5%) | 1,064 (5.1%) |
| $500 to $799 | 5,045 (20.1%) | 3,018 (14.4%) |
| $800 to $999 | 2,495 (9.9%) | 2,914 (13.9%) |
| $1,000 to $1,499 | 5,834 (23.2%) | 7,859 (37.5%) |
| $1,500 to $1,999 | 3,831 (15.2%) | 3,022 (14.4%) |
| $2,000 to $2,499 | 1,844 (7.3%) | 1,216 (5.8%) |
| $2,500 to $2,999 | 847 (3.4%) | 106 (0.5%) |
| $3,000 or more | 708 (2.8%) | 143 (0.7%) |
| Total | 25,123 (100.0%) | 20,976 (100.0%) |
Physical Housing Characteristics in Jefferson County
Housing Structures in Jefferson County
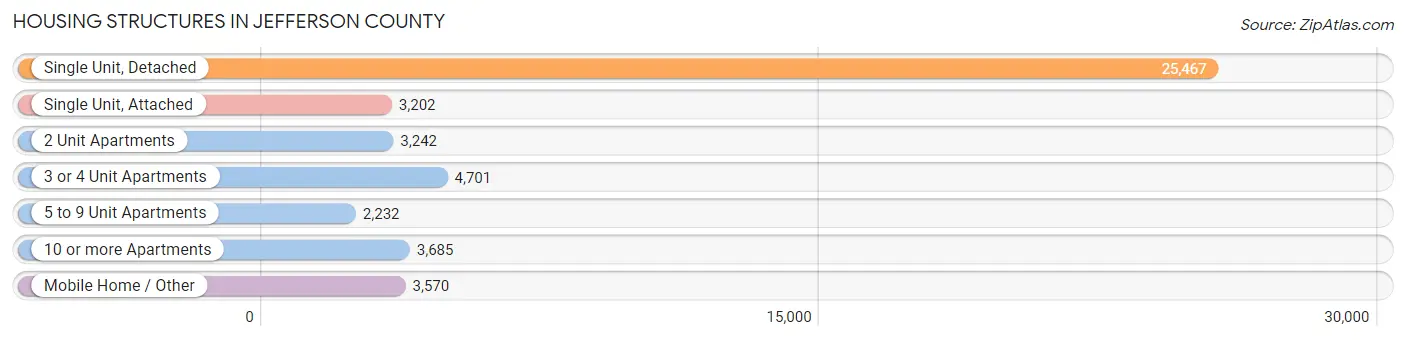
| Structure Type | # Housing Units | % Housing Units |
| Single Unit, Detached | 25,467 | 55.2% |
| Single Unit, Attached | 3,202 | 7.0% |
| 2 Unit Apartments | 3,242 | 7.0% |
| 3 or 4 Unit Apartments | 4,701 | 10.2% |
| 5 to 9 Unit Apartments | 2,232 | 4.8% |
| 10 or more Apartments | 3,685 | 8.0% |
| Mobile Home / Other | 3,570 | 7.7% |
| Total | 46,099 | 100.0% |
Housing Structures by Occupancy in Jefferson County
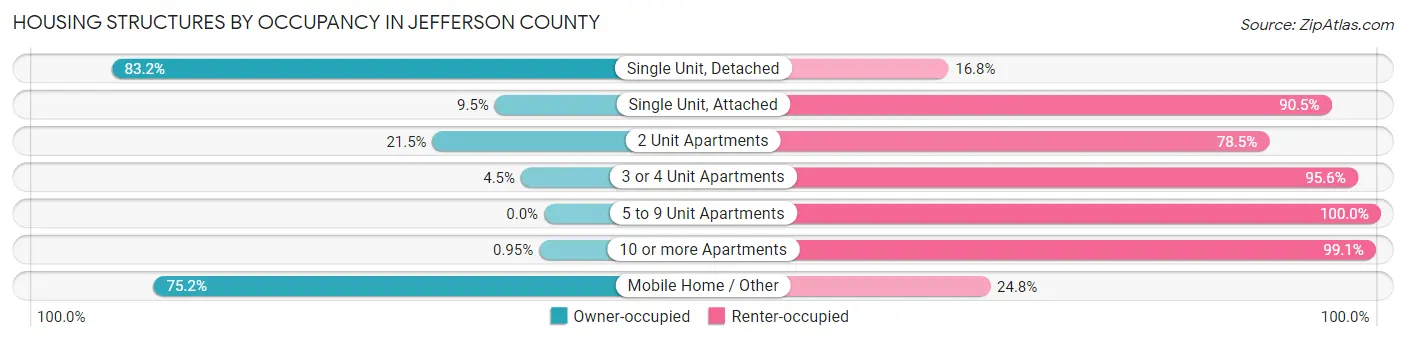
| Structure Type | Owner-occupied | Renter-occupied |
| Single Unit, Detached | 21,195 (83.2%) | 4,272 (16.8%) |
| Single Unit, Attached | 304 (9.5%) | 2,898 (90.5%) |
| 2 Unit Apartments | 696 (21.5%) | 2,546 (78.5%) |
| 3 or 4 Unit Apartments | 209 (4.4%) | 4,492 (95.6%) |
| 5 to 9 Unit Apartments | 0 (0.0%) | 2,232 (100.0%) |
| 10 or more Apartments | 35 (0.9%) | 3,650 (99.1%) |
| Mobile Home / Other | 2,684 (75.2%) | 886 (24.8%) |
| Total | 25,123 (54.5%) | 20,976 (45.5%) |
Housing Structures by Number of Rooms in Jefferson County
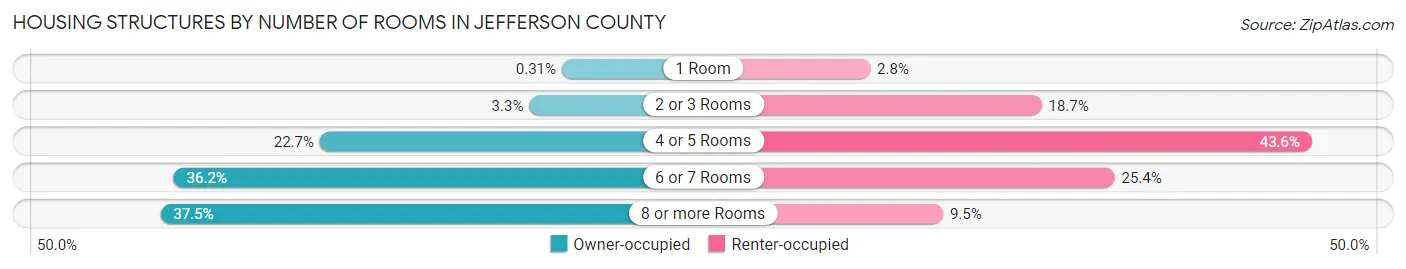
| Number of Rooms | Owner-occupied | Renter-occupied |
| 1 Room | 79 (0.3%) | 586 (2.8%) |
| 2 or 3 Rooms | 836 (3.3%) | 3,911 (18.6%) |
| 4 or 5 Rooms | 5,704 (22.7%) | 9,153 (43.6%) |
| 6 or 7 Rooms | 9,096 (36.2%) | 5,328 (25.4%) |
| 8 or more Rooms | 9,408 (37.4%) | 1,998 (9.5%) |
| Total | 25,123 (100.0%) | 20,976 (100.0%) |
Housing Structure by Heating Type in Jefferson County
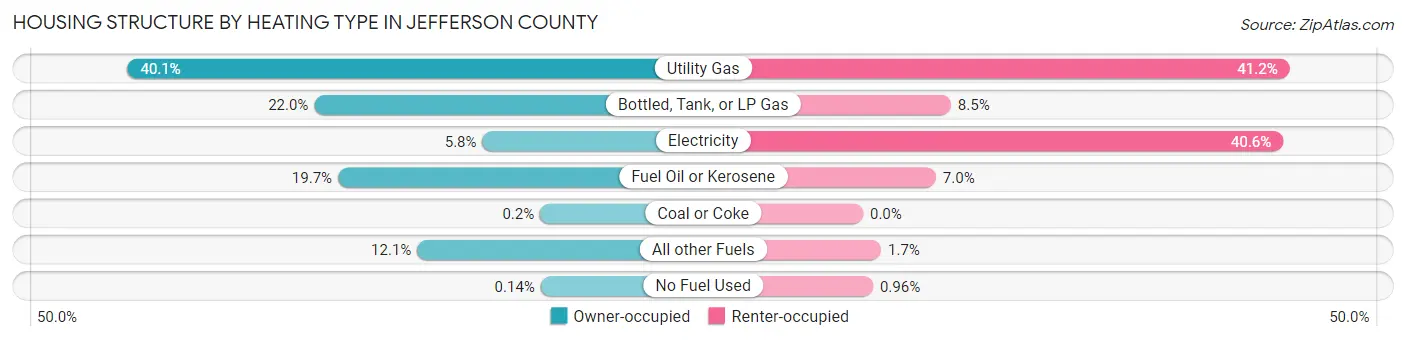
| Heating Type | Owner-occupied | Renter-occupied |
| Utility Gas | 10,064 (40.1%) | 8,642 (41.2%) |
| Bottled, Tank, or LP Gas | 5,532 (22.0%) | 1,781 (8.5%) |
| Electricity | 1,450 (5.8%) | 8,512 (40.6%) |
| Fuel Oil or Kerosene | 4,958 (19.7%) | 1,476 (7.0%) |
| Coal or Coke | 51 (0.2%) | 0 (0.0%) |
| All other Fuels | 3,032 (12.1%) | 364 (1.7%) |
| No Fuel Used | 36 (0.1%) | 201 (1.0%) |
| Total | 25,123 (100.0%) | 20,976 (100.0%) |
Household Vehicle Usage in Jefferson County
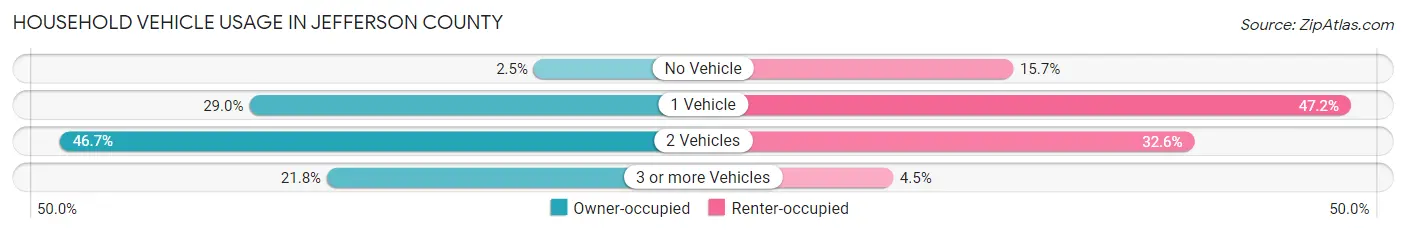
| Vehicles per Household | Owner-occupied | Renter-occupied |
| No Vehicle | 620 (2.5%) | 3,292 (15.7%) |
| 1 Vehicle | 7,292 (29.0%) | 9,905 (47.2%) |
| 2 Vehicles | 11,738 (46.7%) | 6,840 (32.6%) |
| 3 or more Vehicles | 5,473 (21.8%) | 939 (4.5%) |
| Total | 25,123 (100.0%) | 20,976 (100.0%) |
Real Estate & Mortgages in Jefferson County
Real Estate and Mortgage Overview in Jefferson County
| Characteristic | Without Mortgage | With Mortgage |
| Housing Units | 10,715 | 14,408 |
| Median Property Value | $149,300 | $182,000 |
| Median Household Income | $62,492 | $2,900 |
| Monthly Housing Costs | $553 | $642 |
| Real Estate Taxes | $2,469 | $412 |
Property Value by Mortgage Status in Jefferson County
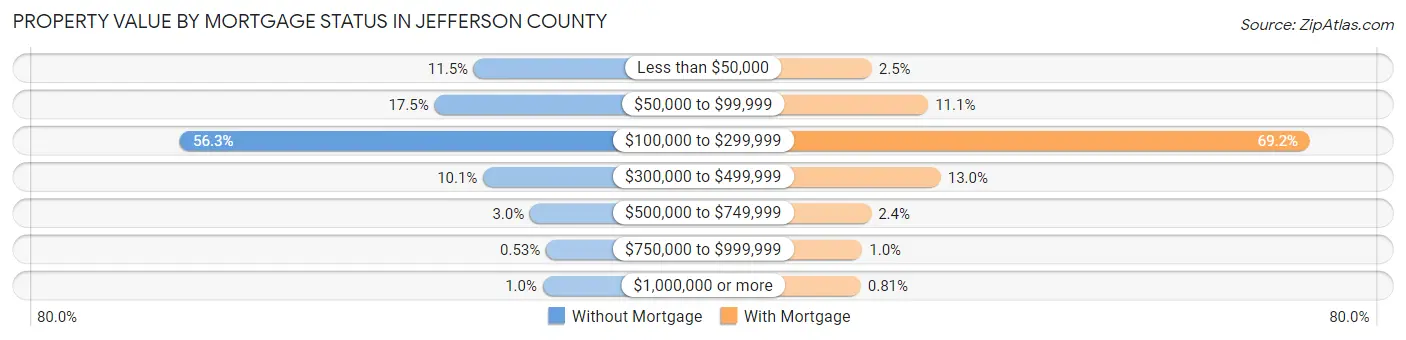
| Property Value | Without Mortgage | With Mortgage |
| Less than $50,000 | 1,235 (11.5%) | 357 (2.5%) |
| $50,000 to $99,999 | 1,879 (17.5%) | 1,597 (11.1%) |
| $100,000 to $299,999 | 6,031 (56.3%) | 9,974 (69.2%) |
| $300,000 to $499,999 | 1,084 (10.1%) | 1,871 (13.0%) |
| $500,000 to $749,999 | 319 (3.0%) | 345 (2.4%) |
| $750,000 to $999,999 | 57 (0.5%) | 148 (1.0%) |
| $1,000,000 or more | 110 (1.0%) | 116 (0.8%) |
| Total | 10,715 (100.0%) | 14,408 (100.0%) |
Household Income by Mortgage Status in Jefferson County
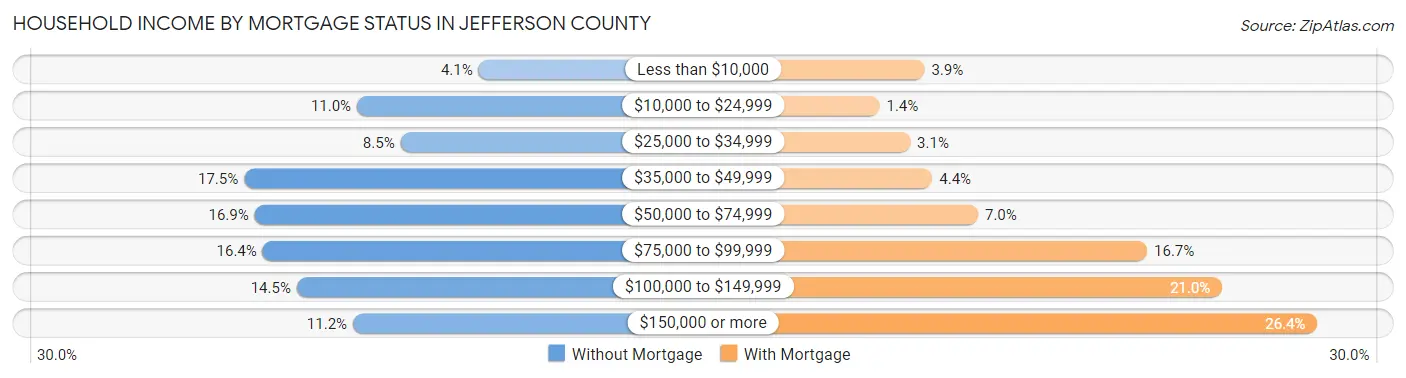
| Household Income | Without Mortgage | With Mortgage |
| Less than $10,000 | 435 (4.1%) | 567 (3.9%) |
| $10,000 to $24,999 | 1,180 (11.0%) | 198 (1.4%) |
| $25,000 to $34,999 | 913 (8.5%) | 449 (3.1%) |
| $35,000 to $49,999 | 1,871 (17.5%) | 633 (4.4%) |
| $50,000 to $74,999 | 1,807 (16.9%) | 1,008 (7.0%) |
| $75,000 to $99,999 | 1,757 (16.4%) | 2,400 (16.7%) |
| $100,000 to $149,999 | 1,548 (14.4%) | 3,018 (20.9%) |
| $150,000 or more | 1,204 (11.2%) | 3,802 (26.4%) |
| Total | 10,715 (100.0%) | 14,408 (100.0%) |
Property Value to Household Income Ratio in Jefferson County
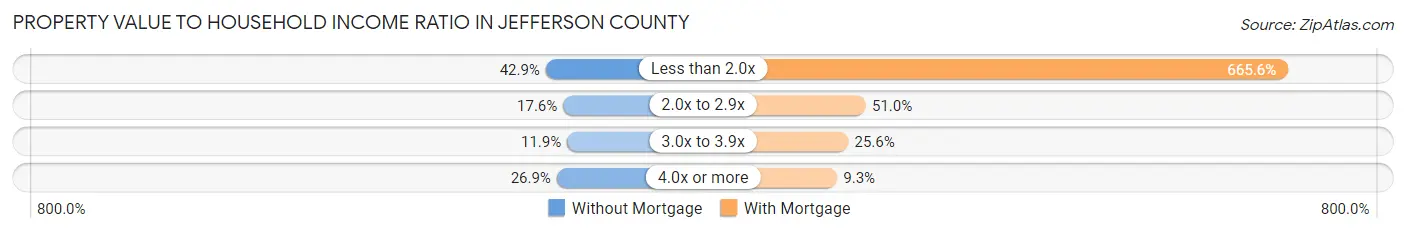
| Value-to-Income Ratio | Without Mortgage | With Mortgage |
| Less than 2.0x | 4,595 (42.9%) | 95,903 (665.6%) |
| 2.0x to 2.9x | 1,886 (17.6%) | 7,347 (51.0%) |
| 3.0x to 3.9x | 1,278 (11.9%) | 3,694 (25.6%) |
| 4.0x or more | 2,884 (26.9%) | 1,338 (9.3%) |
| Total | 10,715 (100.0%) | 14,408 (100.0%) |
Real Estate Taxes by Mortgage Status in Jefferson County
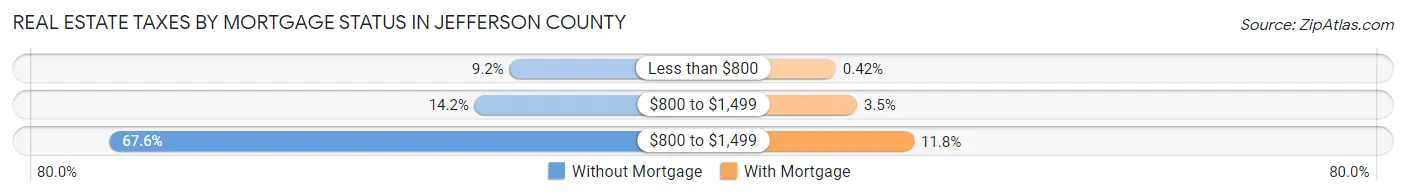
| Property Taxes | Without Mortgage | With Mortgage |
| Less than $800 | 982 (9.2%) | 60 (0.4%) |
| $800 to $1,499 | 1,525 (14.2%) | 504 (3.5%) |
| $800 to $1,499 | 7,243 (67.6%) | 1,705 (11.8%) |
| Total | 10,715 (100.0%) | 14,408 (100.0%) |
Health & Disability in Jefferson County
Health Insurance Coverage by Age in Jefferson County
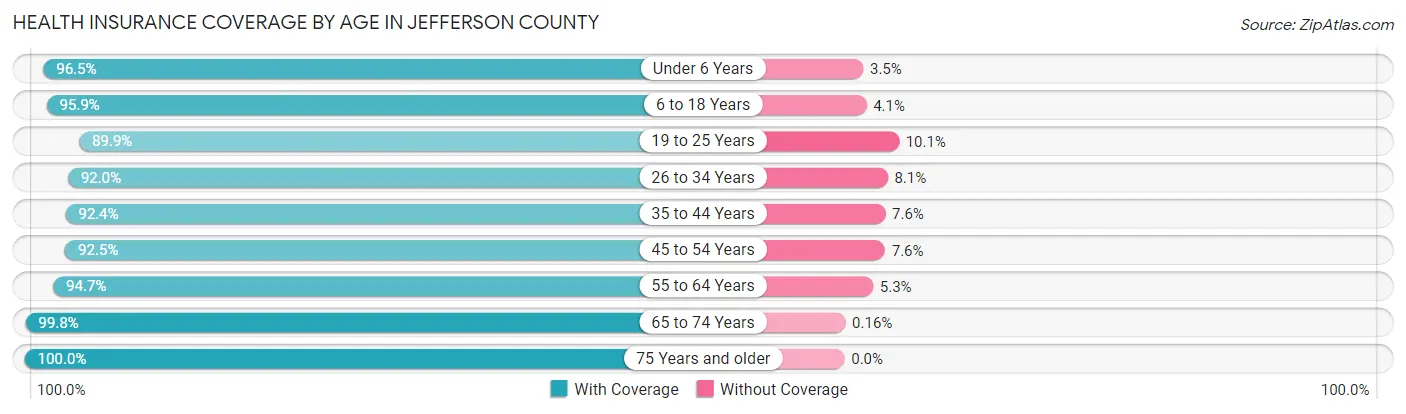
| Age Bracket | With Coverage | Without Coverage |
| Under 6 Years | 9,934 (96.5%) | 360 (3.5%) |
| 6 to 18 Years | 17,871 (95.9%) | 761 (4.1%) |
| 19 to 25 Years | 9,090 (89.9%) | 1,026 (10.1%) |
| 26 to 34 Years | 11,850 (91.9%) | 1,038 (8.1%) |
| 35 to 44 Years | 11,435 (92.4%) | 942 (7.6%) |
| 45 to 54 Years | 10,071 (92.4%) | 822 (7.5%) |
| 55 to 64 Years | 12,207 (94.7%) | 687 (5.3%) |
| 65 to 74 Years | 9,684 (99.8%) | 16 (0.2%) |
| 75 Years and older | 6,489 (100.0%) | 0 (0.0%) |
| Total | 98,631 (94.6%) | 5,652 (5.4%) |
Health Insurance Coverage by Citizenship Status in Jefferson County
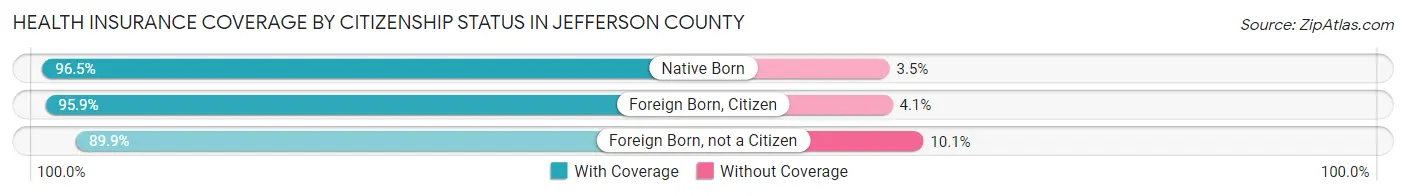
| Citizenship Status | With Coverage | Without Coverage |
| Native Born | 9,934 (96.5%) | 360 (3.5%) |
| Foreign Born, Citizen | 17,871 (95.9%) | 761 (4.1%) |
| Foreign Born, not a Citizen | 9,090 (89.9%) | 1,026 (10.1%) |
Health Insurance Coverage by Household Income in Jefferson County
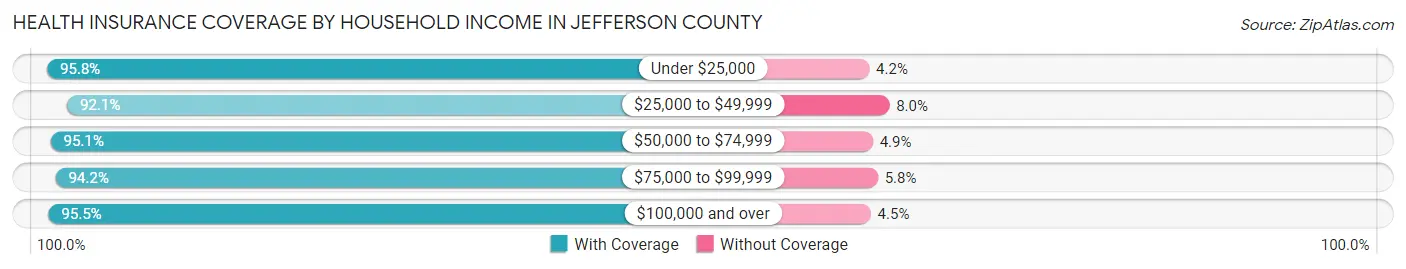
| Household Income | With Coverage | Without Coverage |
| Under $25,000 | 11,948 (95.8%) | 523 (4.2%) |
| $25,000 to $49,999 | 18,960 (92.0%) | 1,638 (8.0%) |
| $50,000 to $74,999 | 16,060 (95.1%) | 821 (4.9%) |
| $75,000 to $99,999 | 16,765 (94.2%) | 1,030 (5.8%) |
| $100,000 and over | 34,368 (95.5%) | 1,609 (4.5%) |
Public vs Private Health Insurance Coverage by Age in Jefferson County
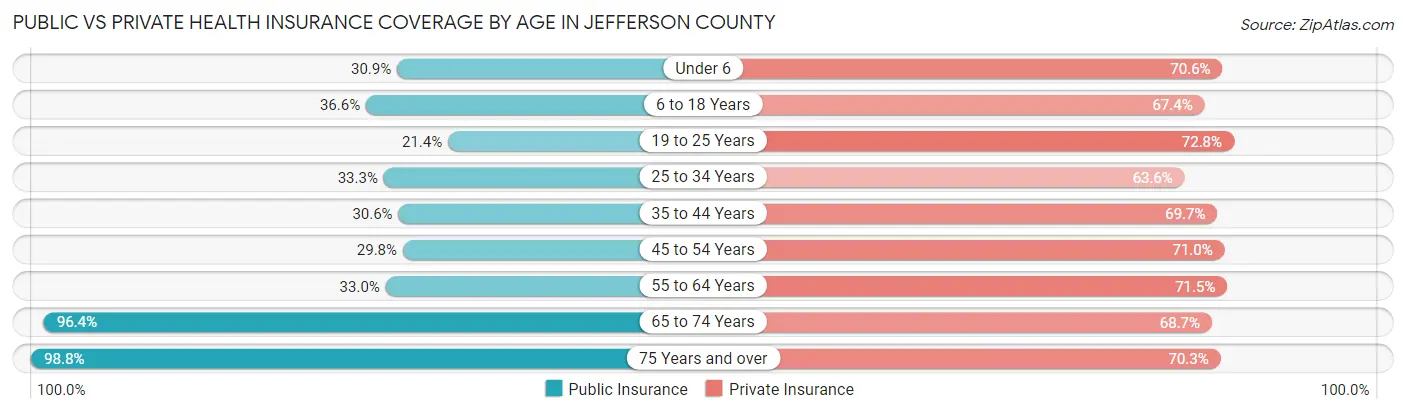
| Age Bracket | Public Insurance | Private Insurance |
| Under 6 | 3,178 (30.9%) | 7,272 (70.6%) |
| 6 to 18 Years | 6,825 (36.6%) | 12,548 (67.3%) |
| 19 to 25 Years | 2,165 (21.4%) | 7,361 (72.8%) |
| 25 to 34 Years | 4,297 (33.3%) | 8,202 (63.6%) |
| 35 to 44 Years | 3,788 (30.6%) | 8,626 (69.7%) |
| 45 to 54 Years | 3,245 (29.8%) | 7,738 (71.0%) |
| 55 to 64 Years | 4,252 (33.0%) | 9,224 (71.5%) |
| 65 to 74 Years | 9,354 (96.4%) | 6,662 (68.7%) |
| 75 Years and over | 6,410 (98.8%) | 4,562 (70.3%) |
| Total | 43,514 (41.7%) | 72,195 (69.2%) |
Disability Status by Sex by Age in Jefferson County
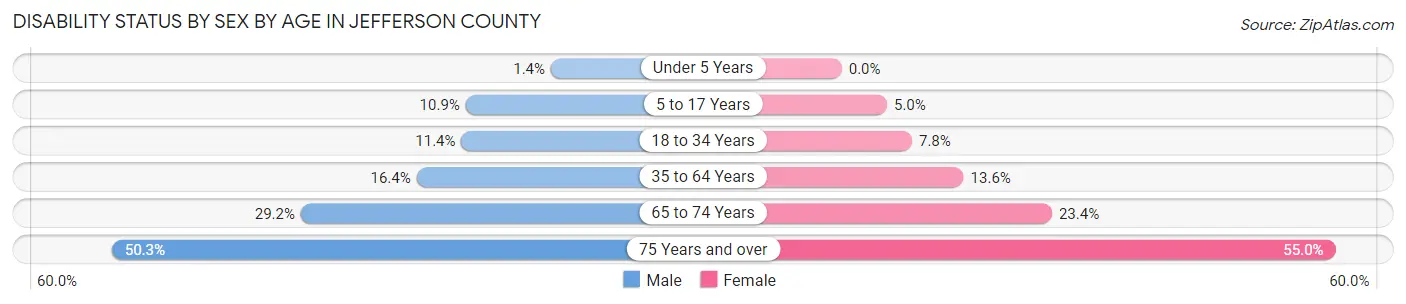
| Age Bracket | Male | Female |
| Under 5 Years | 62 (1.4%) | 0 (0.0%) |
| 5 to 17 Years | 1,067 (10.9%) | 472 (5.0%) |
| 18 to 34 Years | 1,279 (11.4%) | 997 (7.8%) |
| 35 to 64 Years | 2,866 (16.4%) | 2,529 (13.6%) |
| 65 to 74 Years | 1,370 (29.2%) | 1,174 (23.4%) |
| 75 Years and over | 1,377 (50.3%) | 2,062 (55.0%) |
Disability Class by Sex by Age in Jefferson County
Disability Class: Hearing Difficulty
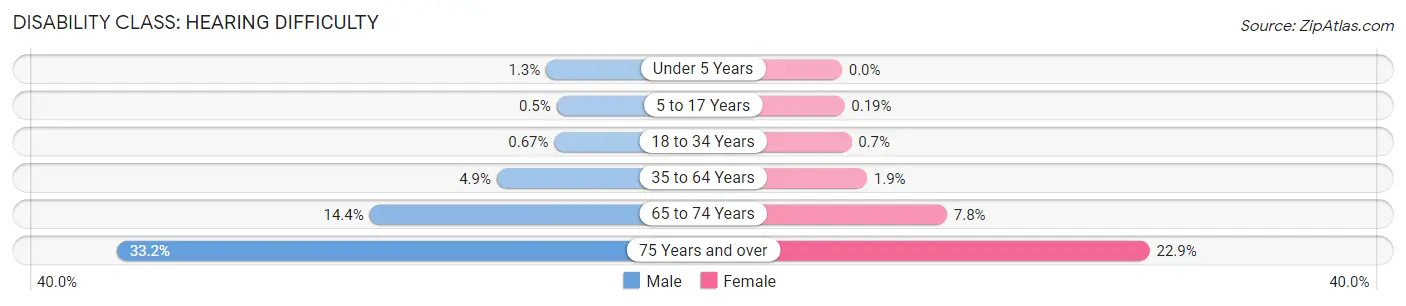
| Age Bracket | Male | Female |
| Under 5 Years | 57 (1.3%) | 0 (0.0%) |
| 5 to 17 Years | 49 (0.5%) | 18 (0.2%) |
| 18 to 34 Years | 75 (0.7%) | 89 (0.7%) |
| 35 to 64 Years | 866 (4.9%) | 347 (1.9%) |
| 65 to 74 Years | 674 (14.4%) | 391 (7.8%) |
| 75 Years and over | 908 (33.2%) | 857 (22.9%) |
Disability Class: Vision Difficulty
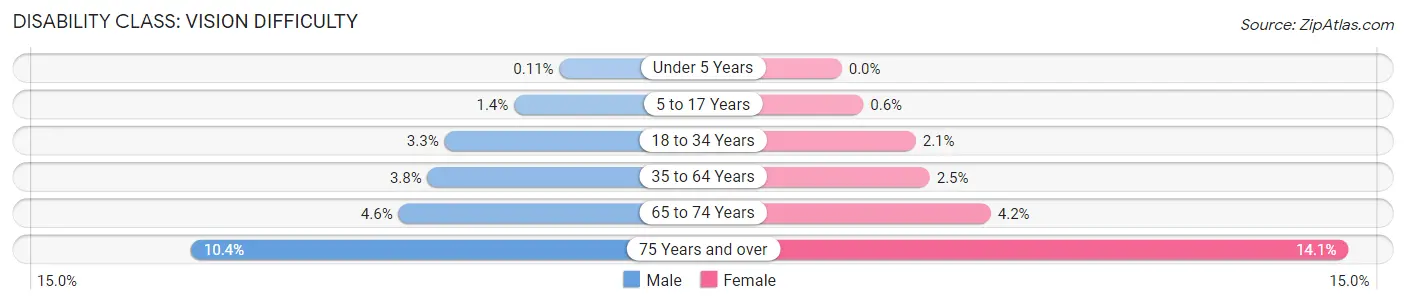
| Age Bracket | Male | Female |
| Under 5 Years | 5 (0.1%) | 0 (0.0%) |
| 5 to 17 Years | 134 (1.4%) | 56 (0.6%) |
| 18 to 34 Years | 373 (3.3%) | 263 (2.1%) |
| 35 to 64 Years | 662 (3.8%) | 456 (2.5%) |
| 65 to 74 Years | 215 (4.6%) | 208 (4.2%) |
| 75 Years and over | 284 (10.4%) | 529 (14.1%) |
Disability Class: Cognitive Difficulty
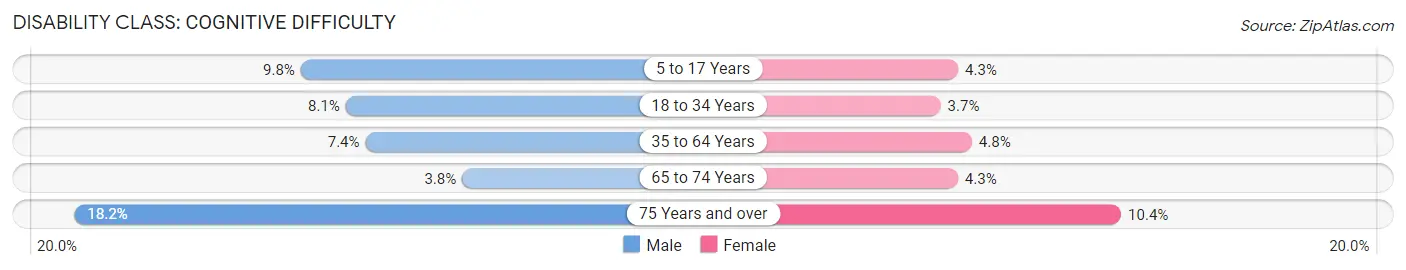
| Age Bracket | Male | Female |
| 5 to 17 Years | 956 (9.8%) | 404 (4.3%) |
| 18 to 34 Years | 910 (8.1%) | 468 (3.7%) |
| 35 to 64 Years | 1,289 (7.3%) | 900 (4.8%) |
| 65 to 74 Years | 176 (3.8%) | 216 (4.3%) |
| 75 Years and over | 497 (18.1%) | 389 (10.4%) |
Disability Class: Ambulatory Difficulty
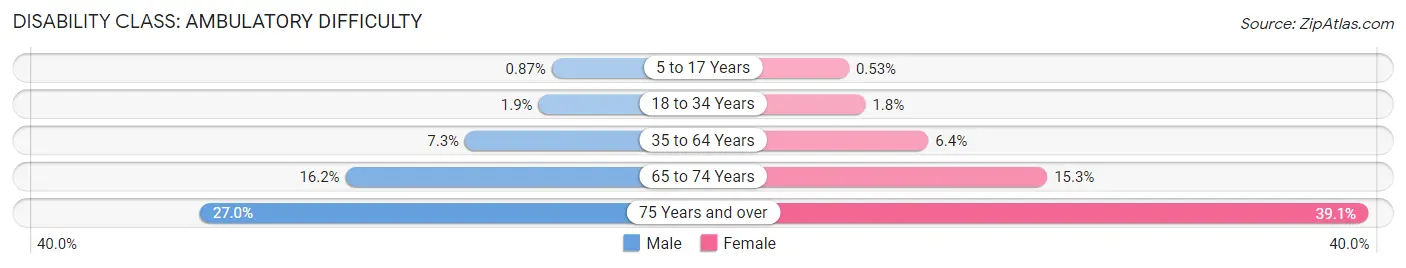
| Age Bracket | Male | Female |
| 5 to 17 Years | 85 (0.9%) | 50 (0.5%) |
| 18 to 34 Years | 208 (1.8%) | 224 (1.8%) |
| 35 to 64 Years | 1,282 (7.3%) | 1,198 (6.4%) |
| 65 to 74 Years | 758 (16.2%) | 765 (15.2%) |
| 75 Years and over | 739 (27.0%) | 1,465 (39.1%) |
Disability Class: Self-Care Difficulty
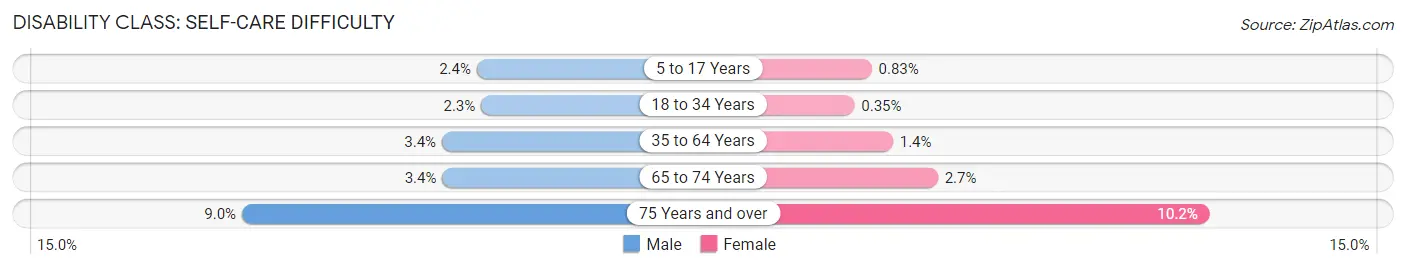
| Age Bracket | Male | Female |
| 5 to 17 Years | 236 (2.4%) | 78 (0.8%) |
| 18 to 34 Years | 258 (2.3%) | 45 (0.4%) |
| 35 to 64 Years | 592 (3.4%) | 265 (1.4%) |
| 65 to 74 Years | 158 (3.4%) | 134 (2.7%) |
| 75 Years and over | 245 (8.9%) | 384 (10.2%) |
Technology Access in Jefferson County
Computing Device Access in Jefferson County
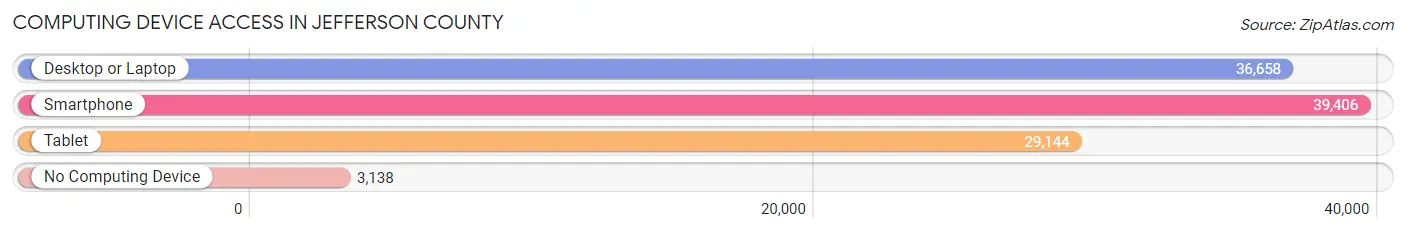
| Device Type | # Households | % Households |
| Desktop or Laptop | 36,658 | 79.5% |
| Smartphone | 39,406 | 85.5% |
| Tablet | 29,144 | 63.2% |
| No Computing Device | 3,138 | 6.8% |
| Total | 46,099 | 100.0% |
Internet Access in Jefferson County
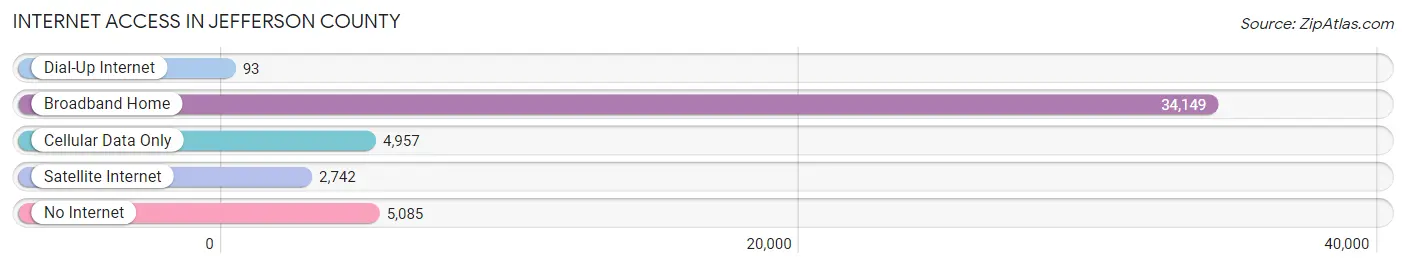
| Internet Type | # Households | % Households |
| Dial-Up Internet | 93 | 0.2% |
| Broadband Home | 34,149 | 74.1% |
| Cellular Data Only | 4,957 | 10.7% |
| Satellite Internet | 2,742 | 5.9% |
| No Internet | 5,085 | 11.0% |
| Total | 46,099 | 100.0% |
Jefferson County Summary
Jefferson County is located in the northern part of the state of New York, and is bordered by Lake Ontario to the north, St. Lawrence County to the east, Lewis County to the west, and Oswego County to the south. The county seat is located in the city of Watertown. The county has a total area of 1,814 square miles, and a population of 116,229 as of the 2010 census.
History
Jefferson County was established in 1805, and was named after Thomas Jefferson, the third President of the United States. The county was formed from parts of Oneida and Onondaga counties. The first settlers in the area were mostly of English and Scottish descent, and the county was largely agricultural in nature.
In the early 19th century, the county was a major center for the production of iron ore, and the county was home to several iron furnaces. The county was also a major center for the production of lumber, and the county was home to several sawmills.
In the late 19th century, the county was a major center for the production of dairy products, and the county was home to several cheese factories. The county was also a major center for the production of apples, and the county was home to several apple orchards.
Geography
Jefferson County is located in the northern part of the state of New York, and is bordered by Lake Ontario to the north, St. Lawrence County to the east, Lewis County to the west, and Oswego County to the south. The county has a total area of 1,814 square miles, and is largely rural in nature. The county is home to several rivers, including the Black River, the Indian River, and the Oswegatchie River. The county is also home to several lakes, including Lake Ontario, Lake Ozonia, and Lake Bonaparte.
The highest point in the county is Mount Arab, which has an elevation of 2,845 feet. The county is home to several state parks, including Black River Bay State Park, Indian River State Park, and Lake Bonaparte State Park.
Economy
The economy of Jefferson County is largely based on agriculture, manufacturing, and tourism. The county is home to several large agricultural operations, including dairy farms, apple orchards, and vegetable farms. The county is also home to several manufacturing operations, including paper mills, food processing plants, and metal fabrication plants.
The county is also home to several tourist attractions, including the Thousand Islands National Park, the Thousand Islands Bridge, and the Thousand Islands Winery. The county is also home to several museums, including the Jefferson County Historical Society Museum, the Thousand Islands Museum, and the Antique Boat Museum.
Demographics
As of the 2010 census, the population of Jefferson County was 116,229. The racial makeup of the county was 94.3% White, 2.2% African American, 0.7% Native American, 0.7% Asian, 0.2% Pacific Islander, 0.7% from other races, and 1.4% from two or more races. Hispanic or Latino of any race were 2.7% of the population.
The median income for a household in the county was $45,945, and the median income for a family was $54,945. The per capita income for the county was $22,945. About 11.2% of families and 14.7% of the population were below the poverty line, including 19.2% of those under age 18 and 8.2% of those age 65 or over.
Common Questions
What is Per Capita Income in Jefferson County?
Per Capita income in Jefferson County is $32,775.
What is the Median Family Income in Jefferson County?
Median Family Income in Jefferson County is $76,693.
What is the Median Household income in Jefferson County?
Median Household Income in Jefferson County is $62,782.
What is Income or Wage Gap in Jefferson County?
Income or Wage Gap in Jefferson County is 24.7%.
Women in Jefferson County earn 75.3 cents for every dollar earned by a man.
What is Family Income Deficit in Jefferson County?
Family Income Deficit in Jefferson County is $10,942.
Families that are below poverty line in Jefferson County earn $10,942 less on average than the poverty threshold level.
What is Inequality or Gini Index in Jefferson County?
Inequality or Gini Index in Jefferson County is 0.43.
What is the Total Population of Jefferson County?
Total Population of Jefferson County is 117,445.
What is the Total Male Population of Jefferson County?
Total Male Population of Jefferson County is 62,226.
What is the Total Female Population of Jefferson County?
Total Female Population of Jefferson County is 55,219.
What is the Ratio of Males per 100 Females in Jefferson County?
There are 112.69 Males per 100 Females in Jefferson County.
What is the Ratio of Females per 100 Males in Jefferson County?
There are 88.74 Females per 100 Males in Jefferson County.
What is the Median Population Age in Jefferson County?
Median Population Age in Jefferson County is 32.8 Years.
What is the Average Family Size in Jefferson County
Average Family Size in Jefferson County is 3.0 People.
What is the Average Household Size in Jefferson County
Average Household Size in Jefferson County is 2.4 People.
How Large is the Labor Force in Jefferson County?
There are 58,246 People in the Labor Forcein in Jefferson County.
What is the Percentage of People in the Labor Force in Jefferson County?
63.2% of People are in the Labor Force in Jefferson County.
What is the Unemployment Rate in Jefferson County?
Unemployment Rate in Jefferson County is 6.4%.