Herkimer County, NY Map & Demographics
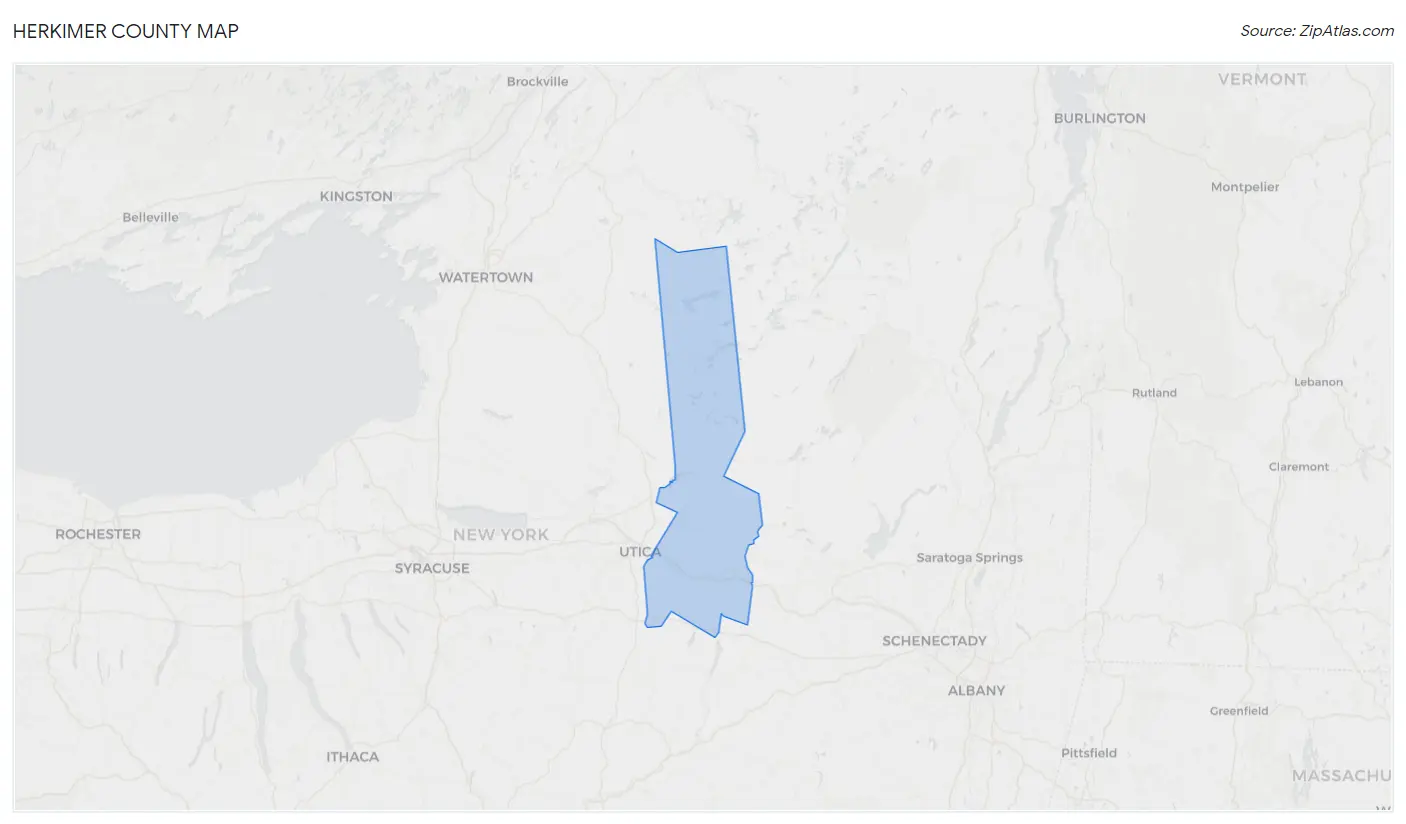
Herkimer County Map
Herkimer County Overview
$34,394
PER CAPITA INCOME
$87,801
AVG FAMILY INCOME
$68,104
AVG HOUSEHOLD INCOME
22.9%
WAGE / INCOME GAP [ % ]
77.1¢/ $1
WAGE / INCOME GAP [ $ ]
$9,608
FAMILY INCOME DEFICIT
0.42
INEQUALITY / GINI INDEX
60,293
TOTAL POPULATION
30,207
MALE POPULATION
30,086
FEMALE POPULATION
100.40
MALES / 100 FEMALES
99.60
FEMALES / 100 MALES
44.3
MEDIAN AGE
3.0
AVG FAMILY SIZE
2.4
AVG HOUSEHOLD SIZE
29,429
LABOR FORCE [ PEOPLE ]
59.5%
PERCENT IN LABOR FORCE
4.2%
UNEMPLOYMENT RATE
Herkimer County Area Codes
Income in Herkimer County
Income Overview in Herkimer County
Per Capita Income in Herkimer County is $34,394, while median incomes of families and households are $87,801 and $68,104 respectively.
| Characteristic | Number | Measure |
| Per Capita Income | 60,293 | $34,394 |
| Median Family Income | 15,235 | $87,801 |
| Mean Family Income | 15,235 | $97,508 |
| Median Household Income | 24,664 | $68,104 |
| Mean Household Income | 24,664 | $82,090 |
| Income Deficit | 15,235 | $9,608 |
| Wage / Income Gap (%) | 60,293 | 22.89% |
| Wage / Income Gap ($) | 60,293 | 77.11¢ per $1 |
| Gini / Inequality Index | 60,293 | 0.42 |
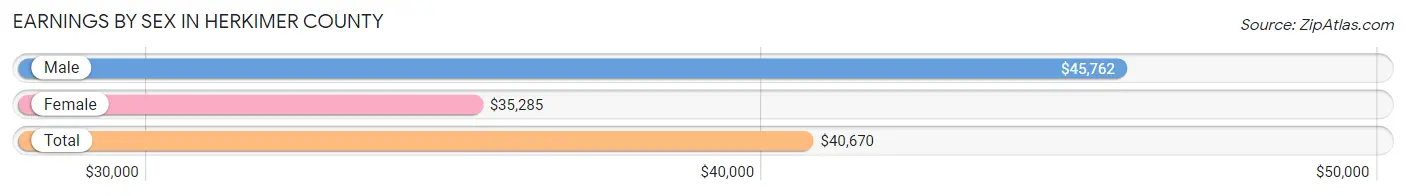
Earnings by Sex in Herkimer County
Average Earnings in Herkimer County are $40,670, $45,762 for men and $35,285 for women, a difference of 22.9%.
| Sex | Number | Average Earnings |
| Male | 16,052 (52.0%) | $45,762 |
| Female | 14,800 (48.0%) | $35,285 |
| Total | 30,852 (100.0%) | $40,670 |
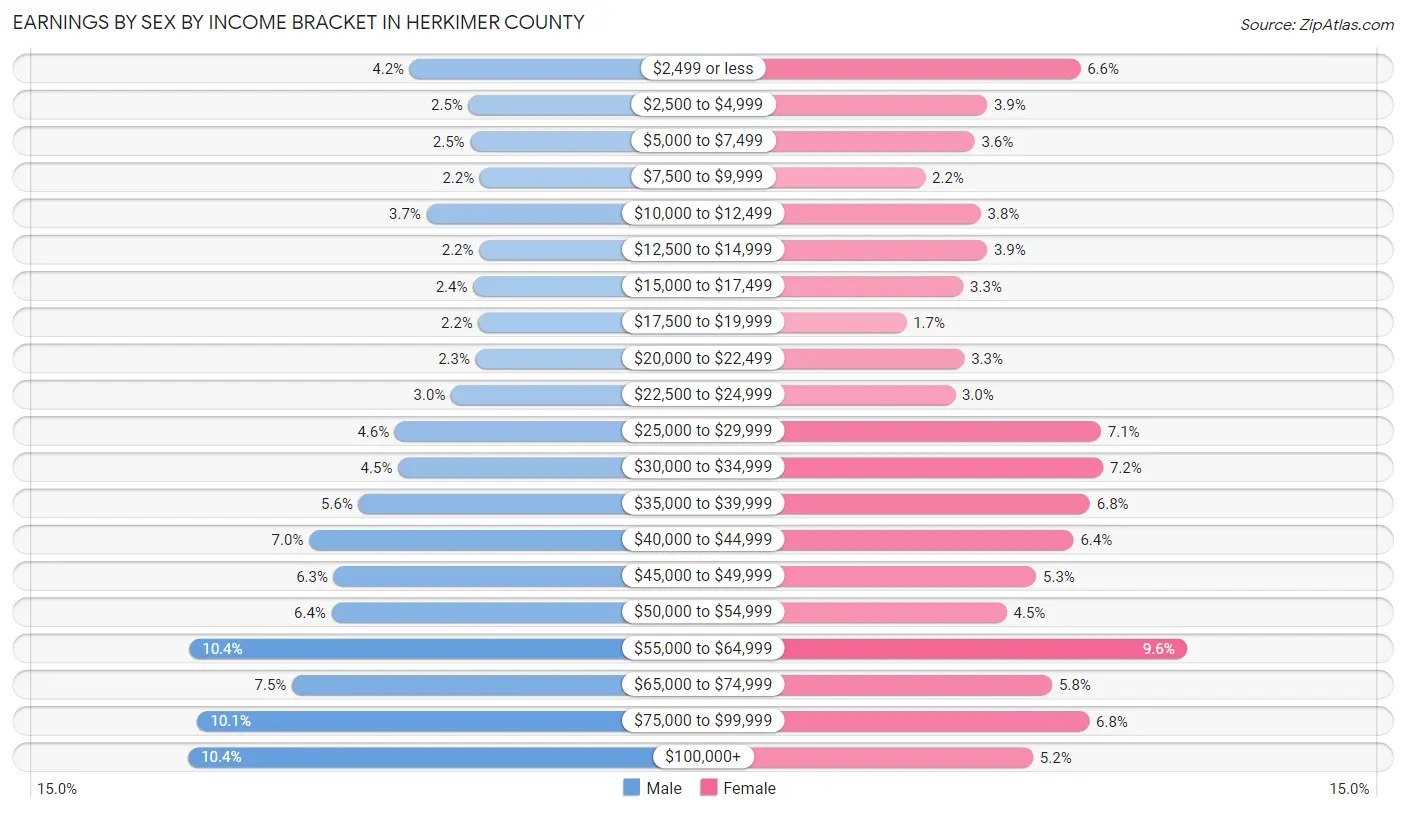
Earnings by Sex by Income Bracket in Herkimer County
The most common earnings brackets in Herkimer County are $100,000+ for men (1,669 | 10.4%) and $55,000 to $64,999 for women (1,414 | 9.6%).
| Income | Male | Female |
| $2,499 or less | 669 (4.2%) | 971 (6.6%) |
| $2,500 to $4,999 | 404 (2.5%) | 583 (3.9%) |
| $5,000 to $7,499 | 397 (2.5%) | 531 (3.6%) |
| $7,500 to $9,999 | 353 (2.2%) | 326 (2.2%) |
| $10,000 to $12,499 | 594 (3.7%) | 557 (3.8%) |
| $12,500 to $14,999 | 356 (2.2%) | 583 (3.9%) |
| $15,000 to $17,499 | 384 (2.4%) | 484 (3.3%) |
| $17,500 to $19,999 | 360 (2.2%) | 247 (1.7%) |
| $20,000 to $22,499 | 372 (2.3%) | 489 (3.3%) |
| $22,500 to $24,999 | 483 (3.0%) | 450 (3.0%) |
| $25,000 to $29,999 | 736 (4.6%) | 1,057 (7.1%) |
| $30,000 to $34,999 | 722 (4.5%) | 1,065 (7.2%) |
| $35,000 to $39,999 | 901 (5.6%) | 1,011 (6.8%) |
| $40,000 to $44,999 | 1,124 (7.0%) | 943 (6.4%) |
| $45,000 to $49,999 | 1,013 (6.3%) | 788 (5.3%) |
| $50,000 to $54,999 | 1,023 (6.4%) | 665 (4.5%) |
| $55,000 to $64,999 | 1,664 (10.4%) | 1,414 (9.6%) |
| $65,000 to $74,999 | 1,200 (7.5%) | 854 (5.8%) |
| $75,000 to $99,999 | 1,628 (10.1%) | 1,008 (6.8%) |
| $100,000+ | 1,669 (10.4%) | 774 (5.2%) |
| Total | 16,052 (100.0%) | 14,800 (100.0%) |
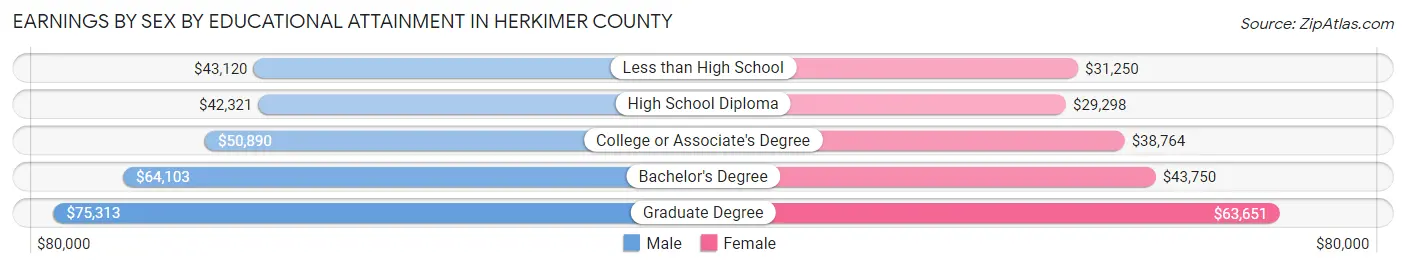
Earnings by Sex by Educational Attainment in Herkimer County
Average earnings in Herkimer County are $49,997 for men and $39,109 for women, a difference of 21.8%. Men with an educational attainment of graduate degree enjoy the highest average annual earnings of $75,313, while those with high school diploma education earn the least with $42,321. Women with an educational attainment of graduate degree earn the most with the average annual earnings of $63,651, while those with high school diploma education have the smallest earnings of $29,298.
| Educational Attainment | Male Income | Female Income |
| Less than High School | $43,120 | $31,250 |
| High School Diploma | $42,321 | $29,298 |
| College or Associate's Degree | $50,890 | $38,764 |
| Bachelor's Degree | $64,103 | $43,750 |
| Graduate Degree | $75,313 | $63,651 |
| Total | $49,997 | $39,109 |
Family Income in Herkimer County
Family Income Brackets in Herkimer County
According to the Herkimer County family income data, there are 3,992 families falling into the $100,000 to $149,999 income range, which is the most common income bracket and makes up 26.2% of all families. Conversely, the $10,000 to $14,999 income bracket is the least frequent group with only 213 families (1.4%) belonging to this category.
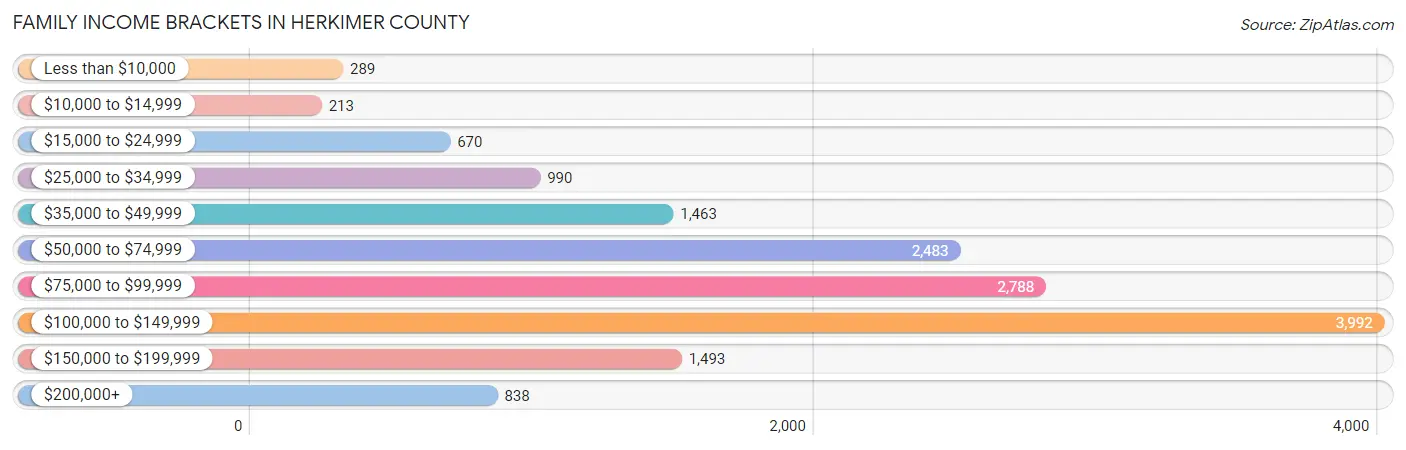
| Income Bracket | # Families | % Families |
| Less than $10,000 | 289 | 1.9% |
| $10,000 to $14,999 | 213 | 1.4% |
| $15,000 to $24,999 | 670 | 4.4% |
| $25,000 to $34,999 | 990 | 6.5% |
| $35,000 to $49,999 | 1,463 | 9.6% |
| $50,000 to $74,999 | 2,483 | 16.3% |
| $75,000 to $99,999 | 2,788 | 18.3% |
| $100,000 to $149,999 | 3,992 | 26.2% |
| $150,000 to $199,999 | 1,493 | 9.8% |
| $200,000+ | 838 | 5.5% |
Family Income by Famaliy Size in Herkimer County
7+ person families (224 | 1.5%) account for the highest median family income in Herkimer County with $107,656 per family, while 2-person families (8,371 | 54.9%) have the highest median income of $39,467 per family member.
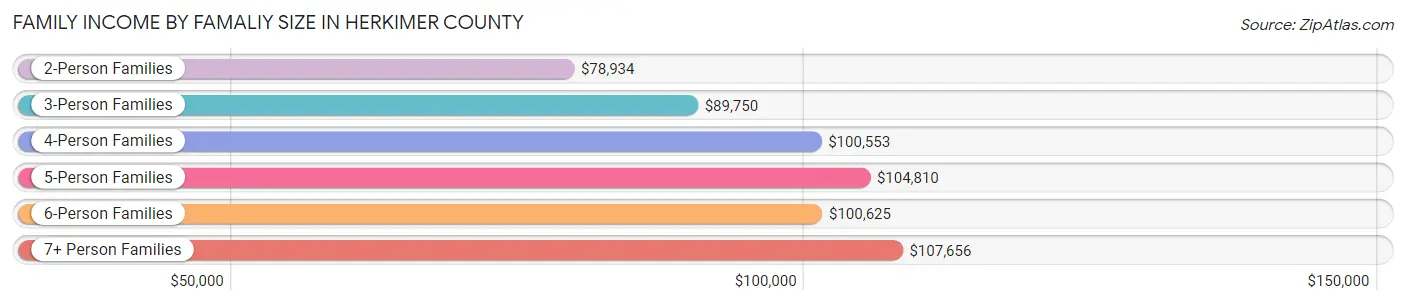
| Income Bracket | # Families | Median Income |
| 2-Person Families | 8,371 (54.9%) | $78,934 |
| 3-Person Families | 3,055 (20.1%) | $89,750 |
| 4-Person Families | 2,462 (16.2%) | $100,553 |
| 5-Person Families | 859 (5.6%) | $104,810 |
| 6-Person Families | 264 (1.7%) | $100,625 |
| 7+ Person Families | 224 (1.5%) | $107,656 |
| Total | 15,235 (100.0%) | $87,801 |
Family Income by Number of Earners in Herkimer County
The median family income in Herkimer County is $87,801, with families comprising 3+ earners (1,451) having the highest median family income of $127,096, while families with no earners (2,660) have the lowest median family income of $44,951, accounting for 9.5% and 17.5% of families, respectively.
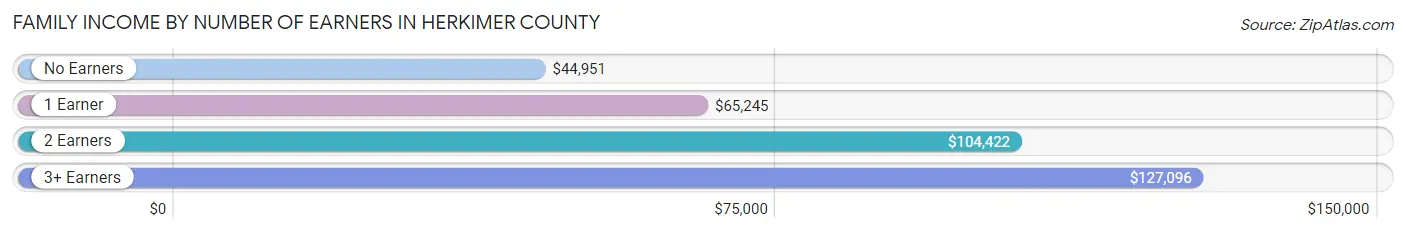
| Number of Earners | # Families | Median Income |
| No Earners | 2,660 (17.5%) | $44,951 |
| 1 Earner | 4,406 (28.9%) | $65,245 |
| 2 Earners | 6,718 (44.1%) | $104,422 |
| 3+ Earners | 1,451 (9.5%) | $127,096 |
| Total | 15,235 (100.0%) | $87,801 |
Household Income in Herkimer County
Household Income Brackets in Herkimer County
With 4,760 households falling in the category, the $100,000 to $149,999 income range is the most frequent in Herkimer County, accounting for 19.3% of all households. In contrast, only 987 households (4.0%) fall into the $10,000 to $14,999 income bracket, making it the least populous group.
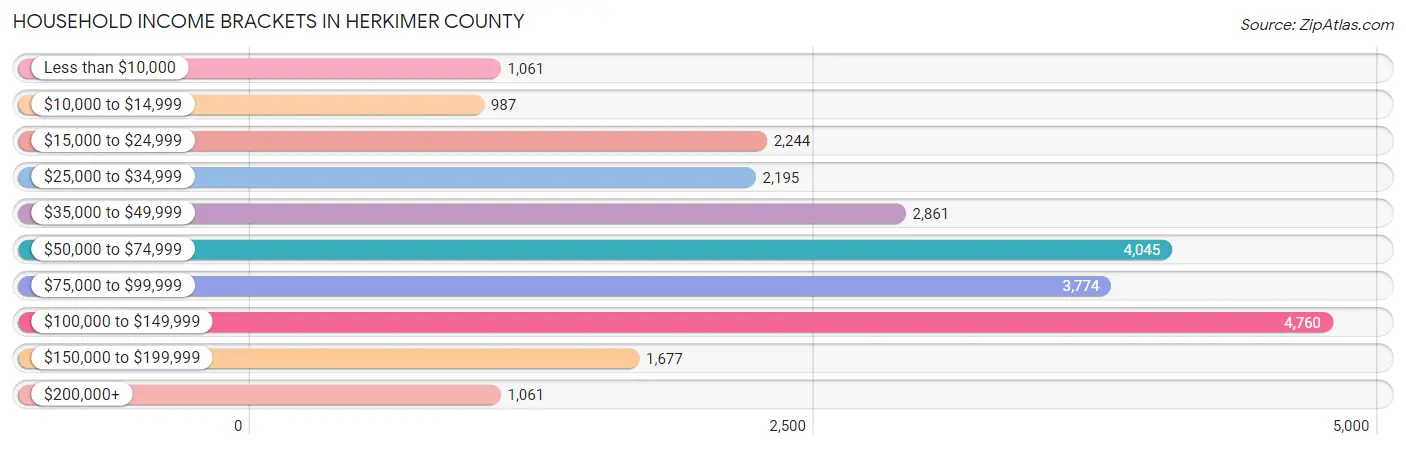
| Income Bracket | # Households | % Households |
| Less than $10,000 | 1,061 | 4.3% |
| $10,000 to $14,999 | 987 | 4.0% |
| $15,000 to $24,999 | 2,244 | 9.1% |
| $25,000 to $34,999 | 2,195 | 8.9% |
| $35,000 to $49,999 | 2,861 | 11.6% |
| $50,000 to $74,999 | 4,045 | 16.4% |
| $75,000 to $99,999 | 3,774 | 15.3% |
| $100,000 to $149,999 | 4,760 | 19.3% |
| $150,000 to $199,999 | 1,677 | 6.8% |
| $200,000+ | 1,061 | 4.3% |
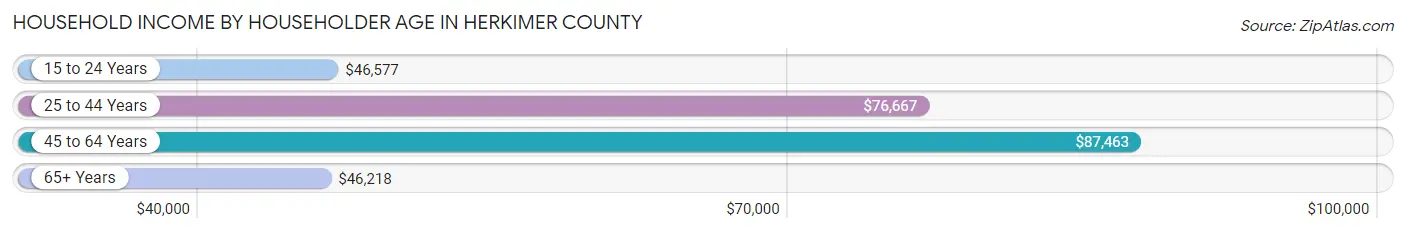
Household Income by Householder Age in Herkimer County
The median household income in Herkimer County is $68,104, with the highest median household income of $87,463 found in the 45 to 64 years age bracket for the primary householder. A total of 9,463 households (38.4%) fall into this category. Meanwhile, the 65+ years age bracket for the primary householder has the lowest median household income of $46,218, with 8,384 households (34.0%) in this group.
| Income Bracket | # Households | Median Income |
| 15 to 24 Years | 639 (2.6%) | $46,577 |
| 25 to 44 Years | 6,178 (25.1%) | $76,667 |
| 45 to 64 Years | 9,463 (38.4%) | $87,463 |
| 65+ Years | 8,384 (34.0%) | $46,218 |
| Total | 24,664 (100.0%) | $68,104 |
Poverty in Herkimer County
Income Below Poverty by Sex and Age in Herkimer County
With 11.5% poverty level for males and 12.6% for females among the residents of Herkimer County, 15 year old males and 5 year old females are the most vulnerable to poverty, with 115 males (26.6%) and 109 females (33.8%) in their respective age groups living below the poverty level.
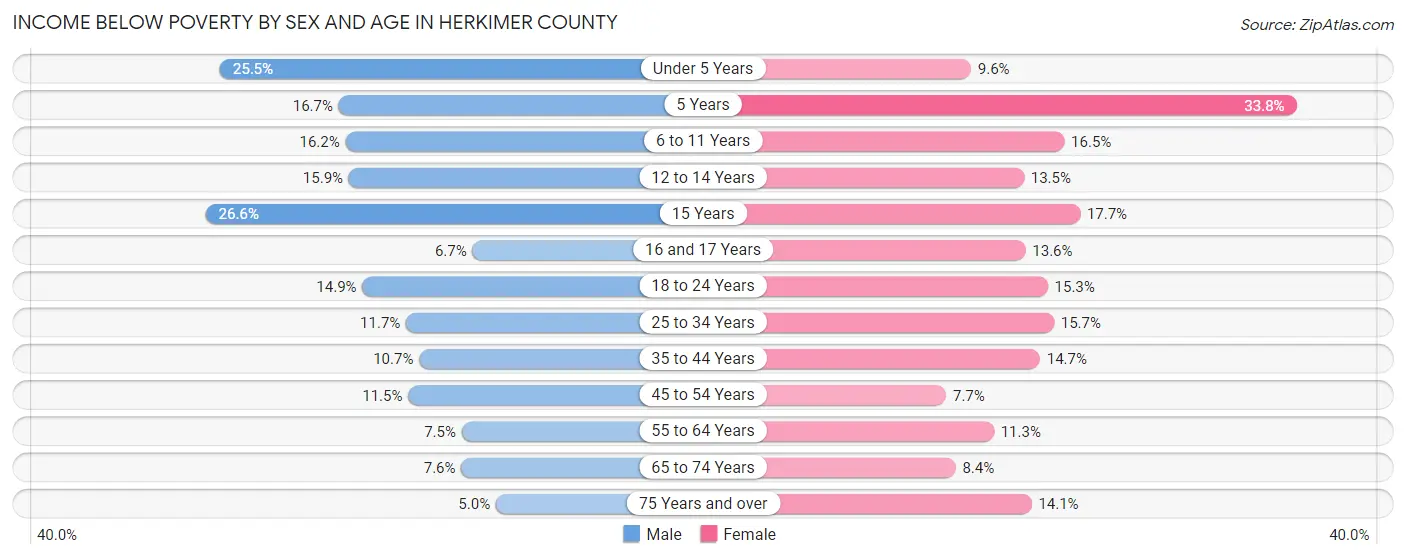
| Age Bracket | Male | Female |
| Under 5 Years | 384 (25.5%) | 132 (9.6%) |
| 5 Years | 67 (16.7%) | 109 (33.8%) |
| 6 to 11 Years | 338 (16.2%) | 292 (16.5%) |
| 12 to 14 Years | 171 (15.9%) | 166 (13.5%) |
| 15 Years | 115 (26.6%) | 58 (17.7%) |
| 16 and 17 Years | 50 (6.7%) | 104 (13.6%) |
| 18 to 24 Years | 371 (14.9%) | 339 (15.3%) |
| 25 to 34 Years | 386 (11.7%) | 507 (15.7%) |
| 35 to 44 Years | 364 (10.7%) | 483 (14.7%) |
| 45 to 54 Years | 440 (11.5%) | 290 (7.7%) |
| 55 to 64 Years | 355 (7.5%) | 515 (11.3%) |
| 65 to 74 Years | 279 (7.6%) | 321 (8.4%) |
| 75 Years and over | 107 (5.0%) | 397 (14.1%) |
| Total | 3,427 (11.5%) | 3,713 (12.6%) |
Income Above Poverty by Sex and Age in Herkimer County
According to the poverty statistics in Herkimer County, males aged 75 years and over and females aged 45 to 54 years are the age groups that are most secure financially, with 95.0% of males and 92.3% of females in these age groups living above the poverty line.
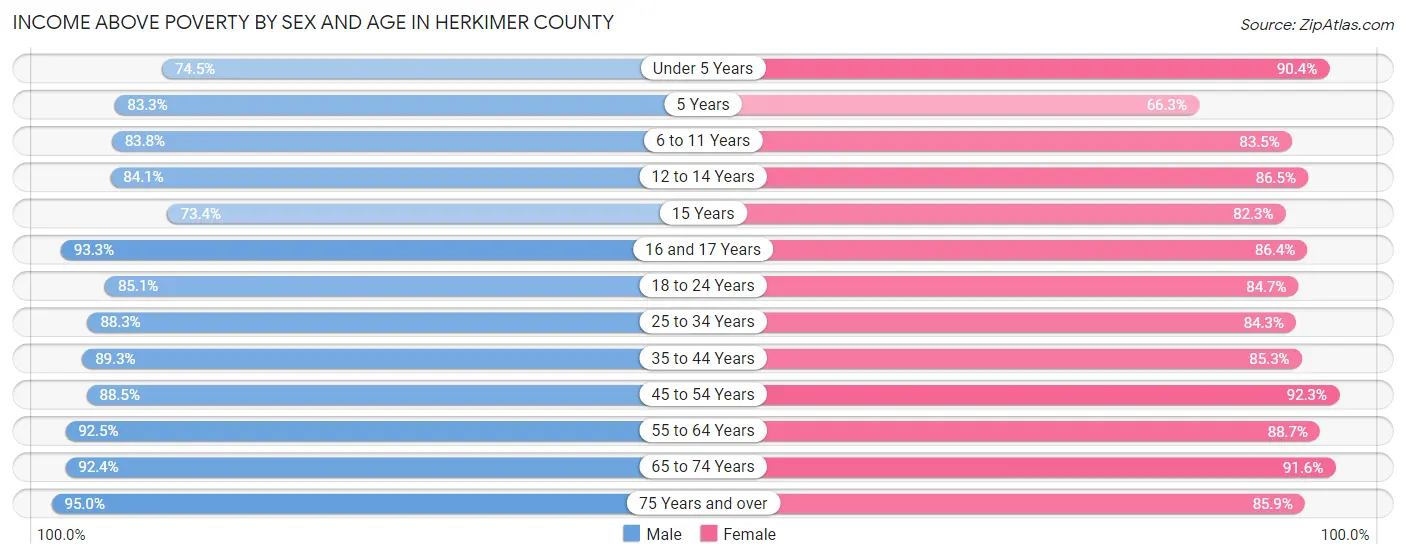
| Age Bracket | Male | Female |
| Under 5 Years | 1,122 (74.5%) | 1,246 (90.4%) |
| 5 Years | 335 (83.3%) | 214 (66.2%) |
| 6 to 11 Years | 1,752 (83.8%) | 1,477 (83.5%) |
| 12 to 14 Years | 903 (84.1%) | 1,063 (86.5%) |
| 15 Years | 318 (73.4%) | 270 (82.3%) |
| 16 and 17 Years | 692 (93.3%) | 659 (86.4%) |
| 18 to 24 Years | 2,115 (85.1%) | 1,880 (84.7%) |
| 25 to 34 Years | 2,923 (88.3%) | 2,714 (84.3%) |
| 35 to 44 Years | 3,037 (89.3%) | 2,803 (85.3%) |
| 45 to 54 Years | 3,383 (88.5%) | 3,457 (92.3%) |
| 55 to 64 Years | 4,354 (92.5%) | 4,051 (88.7%) |
| 65 to 74 Years | 3,405 (92.4%) | 3,483 (91.6%) |
| 75 Years and over | 2,034 (95.0%) | 2,423 (85.9%) |
| Total | 26,373 (88.5%) | 25,740 (87.4%) |
Income Below Poverty Among Married-Couple Families in Herkimer County
The poverty statistics for married-couple families in Herkimer County show that 4.0% or 486 of the total 12,254 families live below the poverty line. Families with 5 or more children have the highest poverty rate of 24.2%, comprising of 24 families. On the other hand, families with no children have the lowest poverty rate of 2.3%, which includes 190 families.
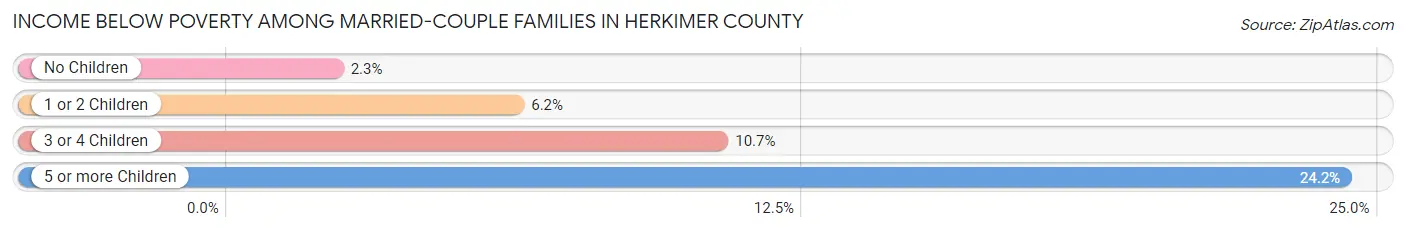
| Children | Above Poverty | Below Poverty |
| No Children | 8,079 (97.7%) | 190 (2.3%) |
| 1 or 2 Children | 3,011 (93.8%) | 200 (6.2%) |
| 3 or 4 Children | 603 (89.3%) | 72 (10.7%) |
| 5 or more Children | 75 (75.8%) | 24 (24.2%) |
| Total | 11,768 (96.0%) | 486 (4.0%) |
Income Below Poverty Among Single-Parent Households in Herkimer County
According to the poverty data in Herkimer County, 26.4% or 224 single-father households and 18.5% or 395 single-mother households are living below the poverty line. Among single-father households, those with 1 or 2 children have the highest poverty rate, with 152 households (40.9%) experiencing poverty. Likewise, among single-mother households, those with 5 or more children have the highest poverty rate, with 39 households (100.0%) falling below the poverty line.
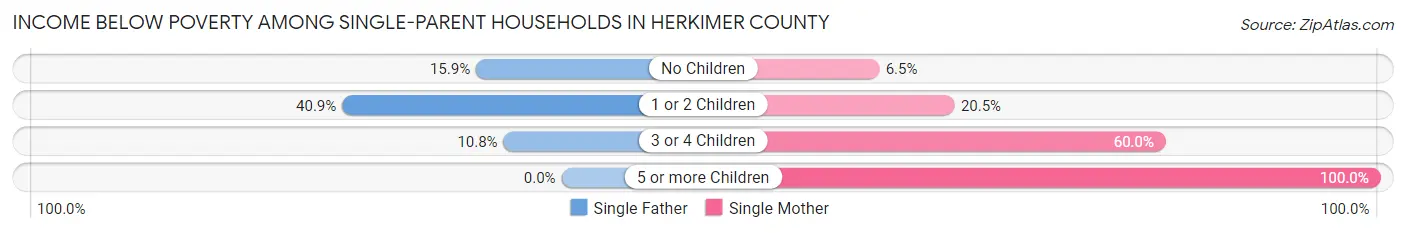
| Children | Single Father | Single Mother |
| No Children | 64 (15.9%) | 51 (6.5%) |
| 1 or 2 Children | 152 (40.9%) | 251 (20.5%) |
| 3 or 4 Children | 8 (10.8%) | 54 (60.0%) |
| 5 or more Children | 0 (0.0%) | 39 (100.0%) |
| Total | 224 (26.4%) | 395 (18.5%) |
Income Below Poverty Among Married-Couple vs Single-Parent Households in Herkimer County
The poverty data for Herkimer County shows that 486 of the married-couple family households (4.0%) and 619 of the single-parent households (20.8%) are living below the poverty level. Within the married-couple family households, those with 5 or more children have the highest poverty rate, with 24 households (24.2%) falling below the poverty line. Among the single-parent households, those with 5 or more children have the highest poverty rate, with 39 household (100.0%) living below poverty.
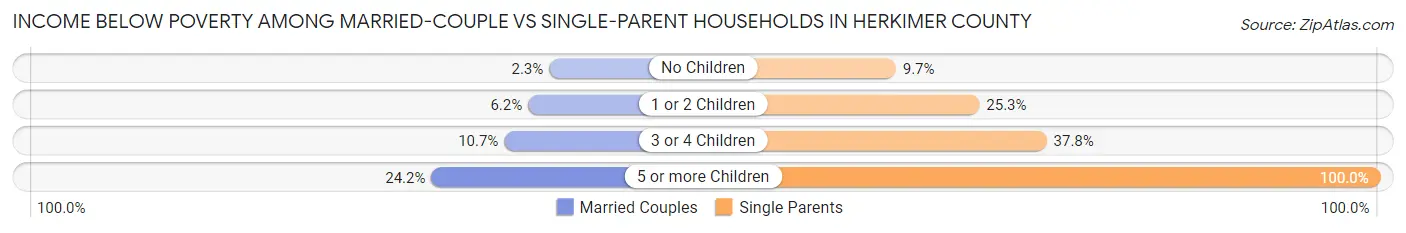
| Children | Married-Couple Families | Single-Parent Households |
| No Children | 190 (2.3%) | 115 (9.7%) |
| 1 or 2 Children | 200 (6.2%) | 403 (25.3%) |
| 3 or 4 Children | 72 (10.7%) | 62 (37.8%) |
| 5 or more Children | 24 (24.2%) | 39 (100.0%) |
| Total | 486 (4.0%) | 619 (20.8%) |
Race in Herkimer County
The most populous races in Herkimer County are White / Caucasian (56,310 | 93.4%), Two or more Races (2,516 | 4.2%), and Hispanic or Latino (1,503 | 2.5%).
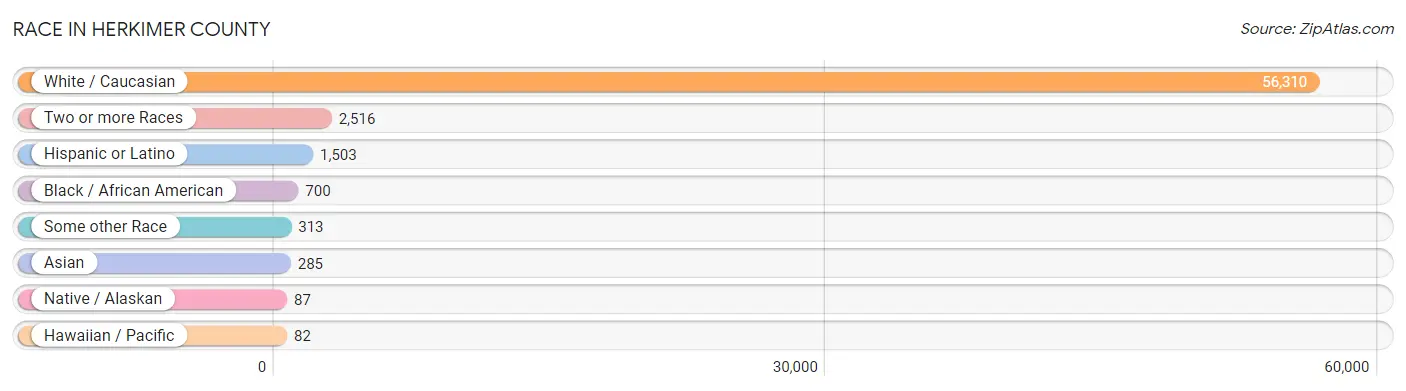
| Race | # Population | % Population |
| Asian | 285 | 0.5% |
| Black / African American | 700 | 1.2% |
| Hawaiian / Pacific | 82 | 0.1% |
| Hispanic or Latino | 1,503 | 2.5% |
| Native / Alaskan | 87 | 0.1% |
| White / Caucasian | 56,310 | 93.4% |
| Two or more Races | 2,516 | 4.2% |
| Some other Race | 313 | 0.5% |
| Total | 60,293 | 100.0% |
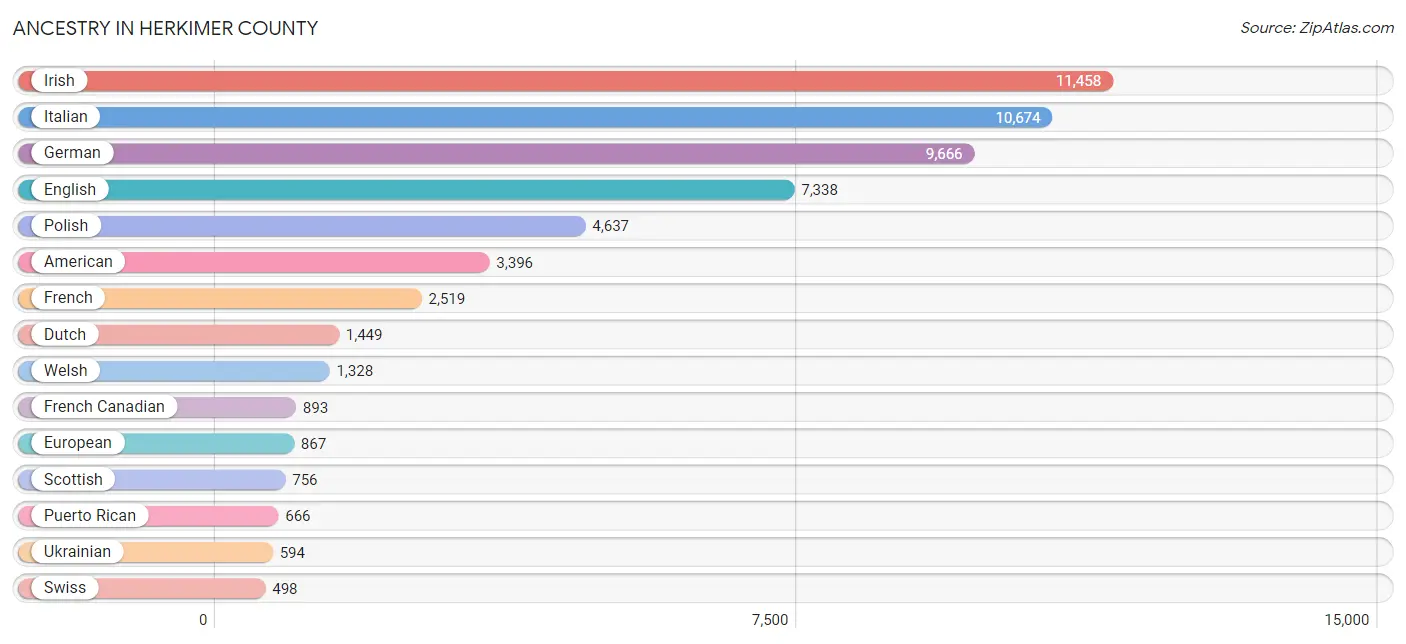
Ancestry in Herkimer County
The most populous ancestries reported in Herkimer County are Irish (11,458 | 19.0%), Italian (10,674 | 17.7%), German (9,666 | 16.0%), English (7,338 | 12.2%), and Polish (4,637 | 7.7%), together accounting for 72.6% of all Herkimer County residents.
| Ancestry | # Population | % Population |
| African | 41 | 0.1% |
| American | 3,396 | 5.6% |
| Apache | 3 | 0.0% |
| Arab | 350 | 0.6% |
| Armenian | 25 | 0.0% |
| Australian | 9 | 0.0% |
| Austrian | 179 | 0.3% |
| Barbadian | 9 | 0.0% |
| Belgian | 66 | 0.1% |
| Bhutanese | 10 | 0.0% |
| Blackfeet | 29 | 0.1% |
| Bolivian | 11 | 0.0% |
| Brazilian | 7 | 0.0% |
| British | 199 | 0.3% |
| Bulgarian | 23 | 0.0% |
| Burmese | 104 | 0.2% |
| Canadian | 44 | 0.1% |
| Celtic | 30 | 0.1% |
| Central American | 175 | 0.3% |
| Cherokee | 20 | 0.0% |
| Chilean | 90 | 0.2% |
| Colombian | 18 | 0.0% |
| Costa Rican | 10 | 0.0% |
| Croatian | 35 | 0.1% |
| Cuban | 10 | 0.0% |
| Czech | 151 | 0.3% |
| Czechoslovakian | 69 | 0.1% |
| Danish | 105 | 0.2% |
| Delaware | 1 | 0.0% |
| Dominican | 36 | 0.1% |
| Dutch | 1,449 | 2.4% |
| Eastern European | 91 | 0.2% |
| Ecuadorian | 7 | 0.0% |
| Egyptian | 90 | 0.2% |
| English | 7,338 | 12.2% |
| Ethiopian | 9 | 0.0% |
| European | 867 | 1.4% |
| Finnish | 15 | 0.0% |
| French | 2,519 | 4.2% |
| French American Indian | 21 | 0.0% |
| French Canadian | 893 | 1.5% |
| German | 9,666 | 16.0% |
| Ghanaian | 9 | 0.0% |
| Greek | 105 | 0.2% |
| Guatemalan | 116 | 0.2% |
| Haitian | 2 | 0.0% |
| Honduran | 2 | 0.0% |
| Hungarian | 226 | 0.4% |
| Indian (Asian) | 128 | 0.2% |
| Indonesian | 19 | 0.0% |
| Irish | 11,458 | 19.0% |
| Iroquois | 116 | 0.2% |
| Israeli | 27 | 0.0% |
| Italian | 10,674 | 17.7% |
| Jamaican | 131 | 0.2% |
| Korean | 104 | 0.2% |
| Latvian | 39 | 0.1% |
| Lebanese | 220 | 0.4% |
| Lithuanian | 89 | 0.2% |
| Mexican | 305 | 0.5% |
| Moroccan | 2 | 0.0% |
| Northern European | 175 | 0.3% |
| Norwegian | 275 | 0.5% |
| Pakistani | 142 | 0.2% |
| Palestinian | 6 | 0.0% |
| Paraguayan | 50 | 0.1% |
| Pennsylvania German | 408 | 0.7% |
| Peruvian | 3 | 0.0% |
| Polish | 4,637 | 7.7% |
| Portuguese | 29 | 0.1% |
| Puerto Rican | 666 | 1.1% |
| Romanian | 42 | 0.1% |
| Russian | 411 | 0.7% |
| Salvadoran | 47 | 0.1% |
| Scandinavian | 103 | 0.2% |
| Scotch-Irish | 187 | 0.3% |
| Scottish | 756 | 1.3% |
| Slavic | 18 | 0.0% |
| Slovak | 141 | 0.2% |
| Slovene | 101 | 0.2% |
| South African | 3 | 0.0% |
| South American | 195 | 0.3% |
| South American Indian | 17 | 0.0% |
| Spaniard | 18 | 0.0% |
| Spanish | 13 | 0.0% |
| Sri Lankan | 70 | 0.1% |
| Subsaharan African | 62 | 0.1% |
| Swedish | 349 | 0.6% |
| Swiss | 498 | 0.8% |
| Syrian | 3 | 0.0% |
| Thai | 74 | 0.1% |
| Trinidadian and Tobagonian | 55 | 0.1% |
| Turkish | 117 | 0.2% |
| Ukrainian | 594 | 1.0% |
| Venezuelan | 16 | 0.0% |
| Vietnamese | 9 | 0.0% |
| Welsh | 1,328 | 2.2% |
| West Indian | 6 | 0.0% |
| Yugoslavian | 320 | 0.5% | View All 99 Rows |
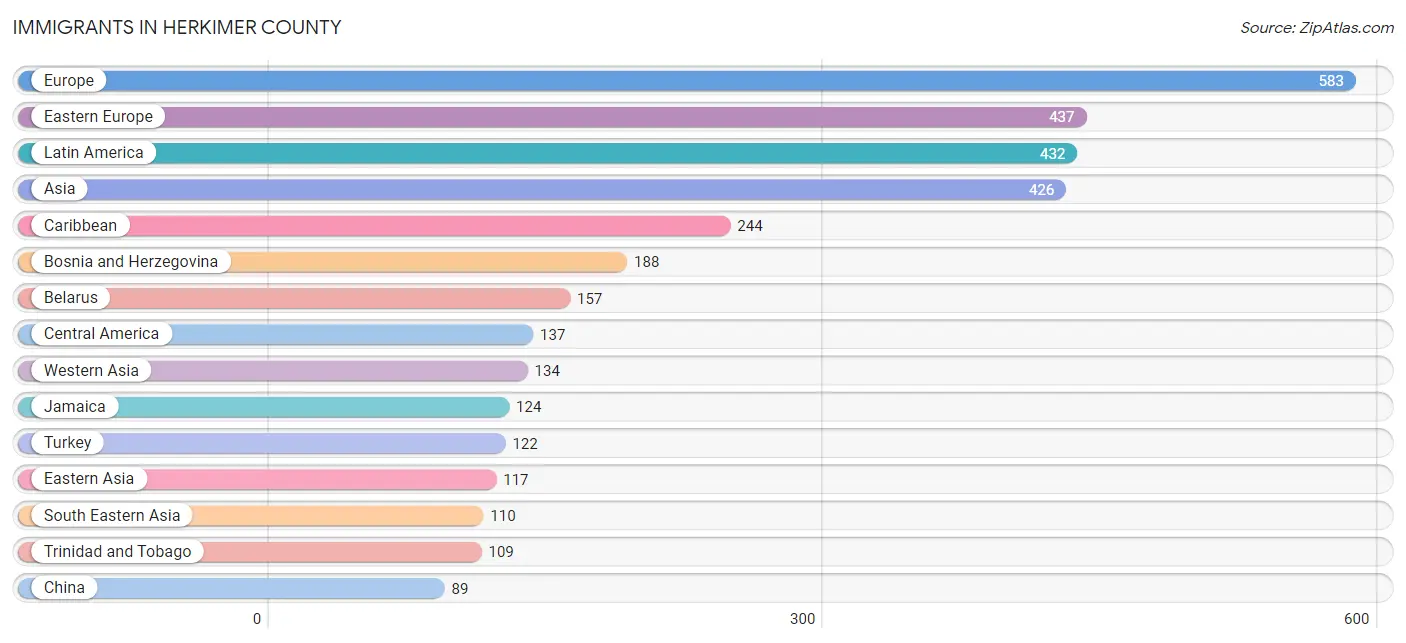
Immigrants in Herkimer County
The most numerous immigrant groups reported in Herkimer County came from Europe (583 | 1.0%), Eastern Europe (437 | 0.7%), Latin America (432 | 0.7%), Asia (426 | 0.7%), and Caribbean (244 | 0.4%), together accounting for 3.5% of all Herkimer County residents.
| Immigration Origin | # Population | % Population |
| Africa | 53 | 0.1% |
| Asia | 426 | 0.7% |
| Bangladesh | 8 | 0.0% |
| Belarus | 157 | 0.3% |
| Bosnia and Herzegovina | 188 | 0.3% |
| Brazil | 6 | 0.0% |
| Cameroon | 25 | 0.0% |
| Canada | 38 | 0.1% |
| Caribbean | 244 | 0.4% |
| Central America | 137 | 0.2% |
| China | 89 | 0.2% |
| Colombia | 12 | 0.0% |
| Costa Rica | 10 | 0.0% |
| Croatia | 18 | 0.0% |
| Dominican Republic | 11 | 0.0% |
| Eastern Africa | 9 | 0.0% |
| Eastern Asia | 117 | 0.2% |
| Eastern Europe | 437 | 0.7% |
| El Salvador | 47 | 0.1% |
| England | 17 | 0.0% |
| Ethiopia | 9 | 0.0% |
| Europe | 583 | 1.0% |
| France | 6 | 0.0% |
| Germany | 12 | 0.0% |
| Guatemala | 76 | 0.1% |
| Guyana | 8 | 0.0% |
| India | 26 | 0.0% |
| Ireland | 1 | 0.0% |
| Israel | 12 | 0.0% |
| Italy | 82 | 0.1% |
| Jamaica | 124 | 0.2% |
| Japan | 10 | 0.0% |
| Korea | 18 | 0.0% |
| Latin America | 432 | 0.7% |
| Latvia | 2 | 0.0% |
| Mexico | 4 | 0.0% |
| Middle Africa | 25 | 0.0% |
| Morocco | 2 | 0.0% |
| Northern Africa | 2 | 0.0% |
| Northern Europe | 31 | 0.1% |
| Norway | 5 | 0.0% |
| Peru | 3 | 0.0% |
| Philippines | 35 | 0.1% |
| Poland | 21 | 0.0% |
| Portugal | 1 | 0.0% |
| Russia | 10 | 0.0% |
| Scotland | 5 | 0.0% |
| South Africa | 3 | 0.0% |
| South America | 51 | 0.1% |
| South Central Asia | 34 | 0.1% |
| South Eastern Asia | 110 | 0.2% |
| Southern Europe | 83 | 0.1% |
| Sweden | 3 | 0.0% |
| Switzerland | 14 | 0.0% |
| Thailand | 42 | 0.1% |
| Trinidad and Tobago | 109 | 0.2% |
| Turkey | 122 | 0.2% |
| Ukraine | 25 | 0.0% |
| Venezuela | 16 | 0.0% |
| Vietnam | 26 | 0.0% |
| Western Asia | 134 | 0.2% |
| Western Europe | 32 | 0.1% | View All 62 Rows |
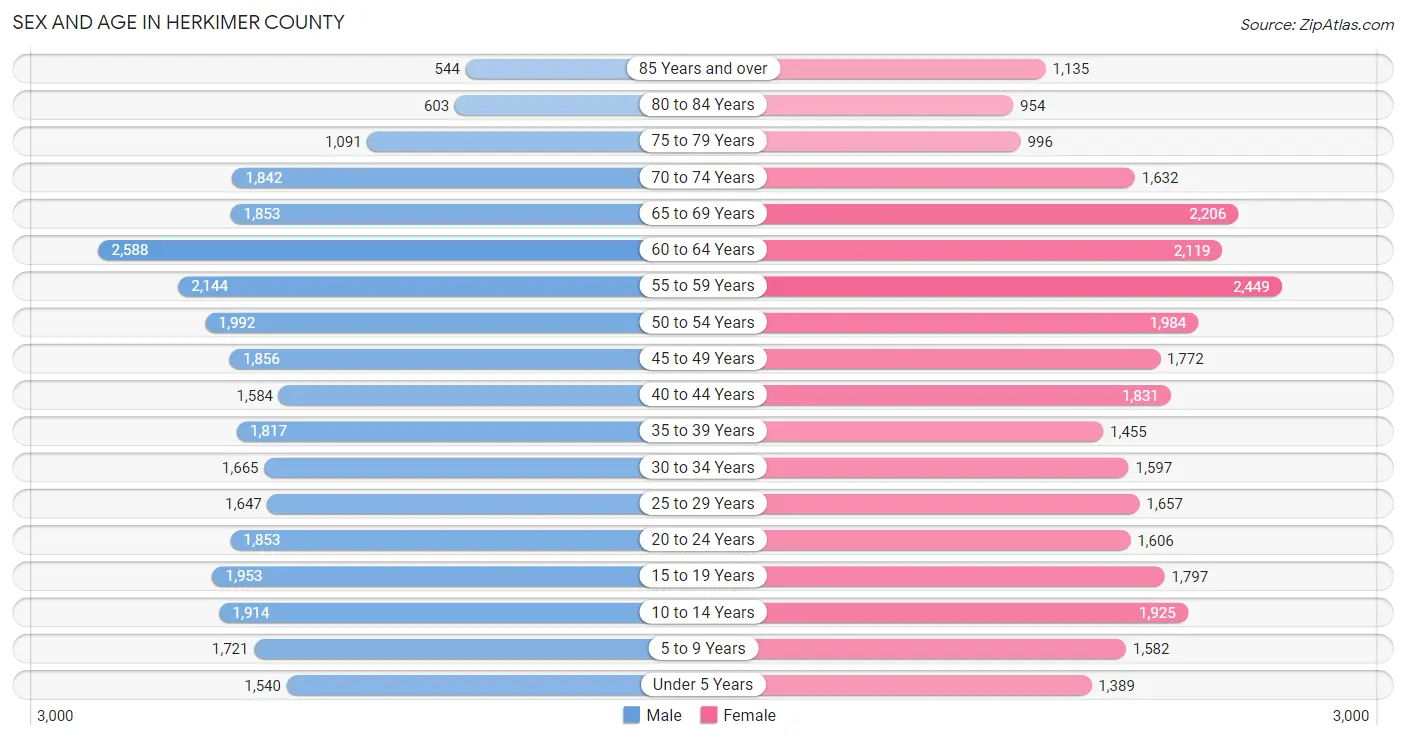
Sex and Age in Herkimer County
Sex and Age in Herkimer County
The most populous age groups in Herkimer County are 60 to 64 Years (2,588 | 8.6%) for men and 55 to 59 Years (2,449 | 8.1%) for women.
| Age Bracket | Male | Female |
| Under 5 Years | 1,540 (5.1%) | 1,389 (4.6%) |
| 5 to 9 Years | 1,721 (5.7%) | 1,582 (5.3%) |
| 10 to 14 Years | 1,914 (6.3%) | 1,925 (6.4%) |
| 15 to 19 Years | 1,953 (6.5%) | 1,797 (6.0%) |
| 20 to 24 Years | 1,853 (6.1%) | 1,606 (5.3%) |
| 25 to 29 Years | 1,647 (5.4%) | 1,657 (5.5%) |
| 30 to 34 Years | 1,665 (5.5%) | 1,597 (5.3%) |
| 35 to 39 Years | 1,817 (6.0%) | 1,455 (4.8%) |
| 40 to 44 Years | 1,584 (5.2%) | 1,831 (6.1%) |
| 45 to 49 Years | 1,856 (6.1%) | 1,772 (5.9%) |
| 50 to 54 Years | 1,992 (6.6%) | 1,984 (6.6%) |
| 55 to 59 Years | 2,144 (7.1%) | 2,449 (8.1%) |
| 60 to 64 Years | 2,588 (8.6%) | 2,119 (7.0%) |
| 65 to 69 Years | 1,853 (6.1%) | 2,206 (7.3%) |
| 70 to 74 Years | 1,842 (6.1%) | 1,632 (5.4%) |
| 75 to 79 Years | 1,091 (3.6%) | 996 (3.3%) |
| 80 to 84 Years | 603 (2.0%) | 954 (3.2%) |
| 85 Years and over | 544 (1.8%) | 1,135 (3.8%) |
| Total | 30,207 (100.0%) | 30,086 (100.0%) |
Families and Households in Herkimer County
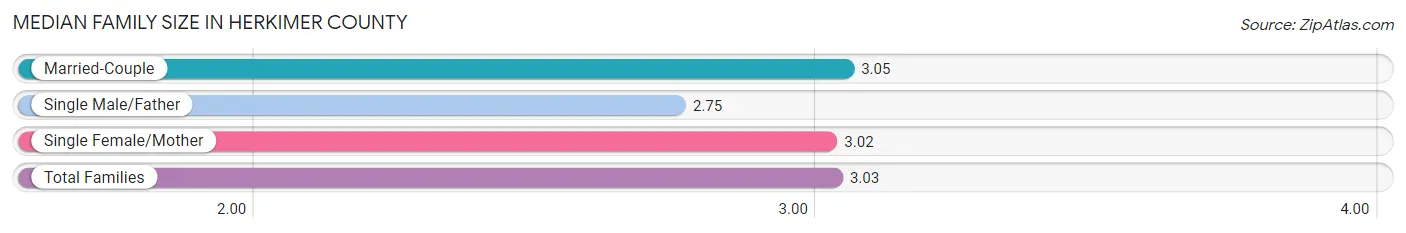
Median Family Size in Herkimer County
The median family size in Herkimer County is 3.03 persons per family, with married-couple families (12,254 | 80.4%) accounting for the largest median family size of 3.05 persons per family. On the other hand, single male/father families (848 | 5.6%) represent the smallest median family size with 2.75 persons per family.
| Family Type | # Families | Family Size |
| Married-Couple | 12,254 (80.4%) | 3.05 |
| Single Male/Father | 848 (5.6%) | 2.75 |
| Single Female/Mother | 2,133 (14.0%) | 3.02 |
| Total Families | 15,235 (100.0%) | 3.03 |
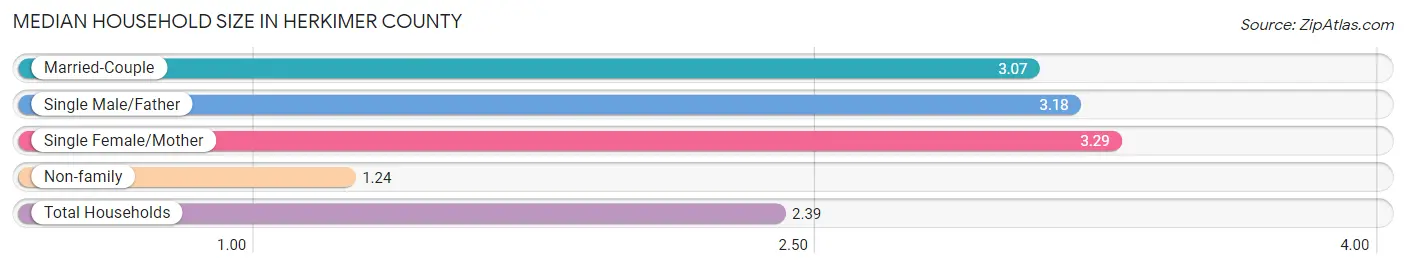
Median Household Size in Herkimer County
The median household size in Herkimer County is 2.39 persons per household, with single female/mother households (2,133 | 8.6%) accounting for the largest median household size of 3.29 persons per household. non-family households (9,429 | 38.2%) represent the smallest median household size with 1.24 persons per household.
| Household Type | # Households | Household Size |
| Married-Couple | 12,254 (49.7%) | 3.07 |
| Single Male/Father | 848 (3.4%) | 3.18 |
| Single Female/Mother | 2,133 (8.6%) | 3.29 |
| Non-family | 9,429 (38.2%) | 1.24 |
| Total Households | 24,664 (100.0%) | 2.39 |
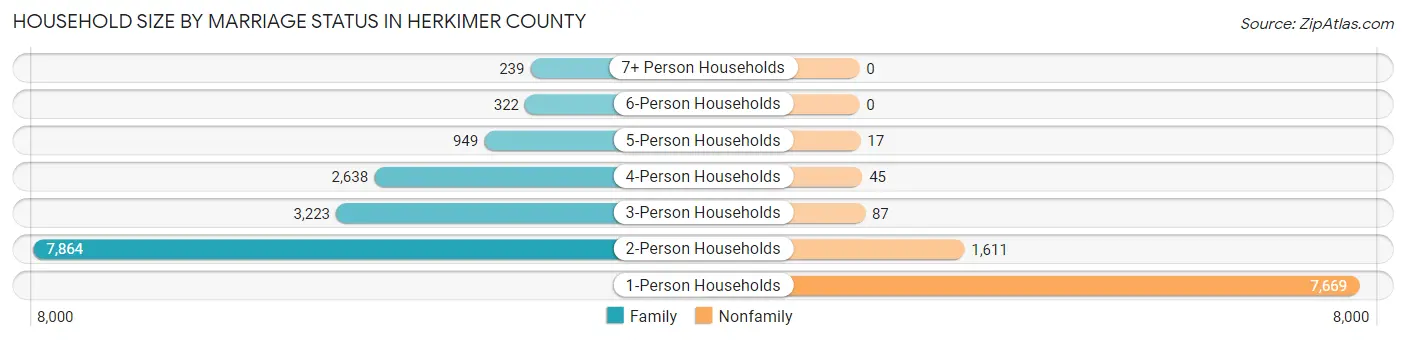
Household Size by Marriage Status in Herkimer County
Out of a total of 24,664 households in Herkimer County, 15,235 (61.8%) are family households, while 9,429 (38.2%) are nonfamily households. The most numerous type of family households are 2-person households, comprising 7,864, and the most common type of nonfamily households are 1-person households, comprising 7,669.
| Household Size | Family Households | Nonfamily Households |
| 1-Person Households | - | 7,669 (31.1%) |
| 2-Person Households | 7,864 (31.9%) | 1,611 (6.5%) |
| 3-Person Households | 3,223 (13.1%) | 87 (0.4%) |
| 4-Person Households | 2,638 (10.7%) | 45 (0.2%) |
| 5-Person Households | 949 (3.8%) | 17 (0.1%) |
| 6-Person Households | 322 (1.3%) | 0 (0.0%) |
| 7+ Person Households | 239 (1.0%) | 0 (0.0%) |
| Total | 15,235 (61.8%) | 9,429 (38.2%) |
Female Fertility in Herkimer County
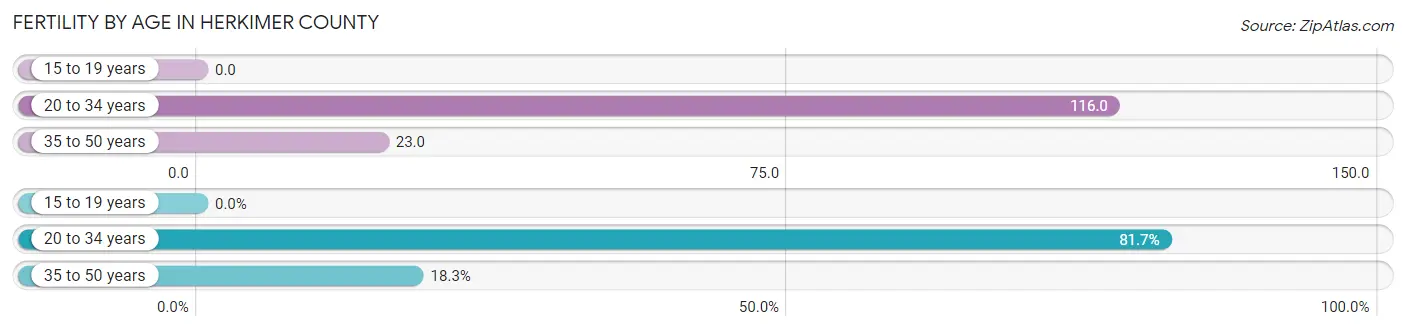
Fertility by Age in Herkimer County
Average fertility rate in Herkimer County is 57.0 births per 1,000 women. Women in the age bracket of 20 to 34 years have the highest fertility rate with 116.0 births per 1,000 women. Women in the age bracket of 20 to 34 years acount for 81.7% of all women with births.
| Age Bracket | Women with Births | Births / 1,000 Women |
| 15 to 19 years | 0 (0.0%) | 0.0 |
| 20 to 34 years | 563 (81.7%) | 116.0 |
| 35 to 50 years | 126 (18.3%) | 23.0 |
| Total | 689 (100.0%) | 57.0 |
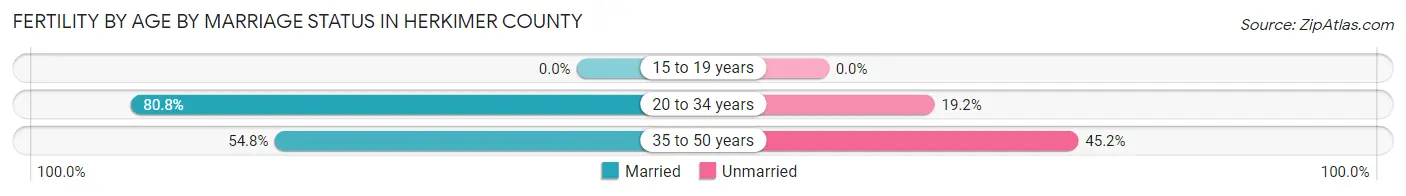
Fertility by Age by Marriage Status in Herkimer County
76.1% of women with births (689) in Herkimer County are married. The highest percentage of unmarried women with births falls into 35 to 50 years age bracket with 45.2% of them unmarried at the time of birth, while the lowest percentage of unmarried women with births belong to 20 to 34 years age bracket with 19.2% of them unmarried.
| Age Bracket | Married | Unmarried |
| 15 to 19 years | 0 (0.0%) | 0 (0.0%) |
| 20 to 34 years | 455 (80.8%) | 108 (19.2%) |
| 35 to 50 years | 69 (54.8%) | 57 (45.2%) |
| Total | 524 (76.0%) | 165 (23.9%) |
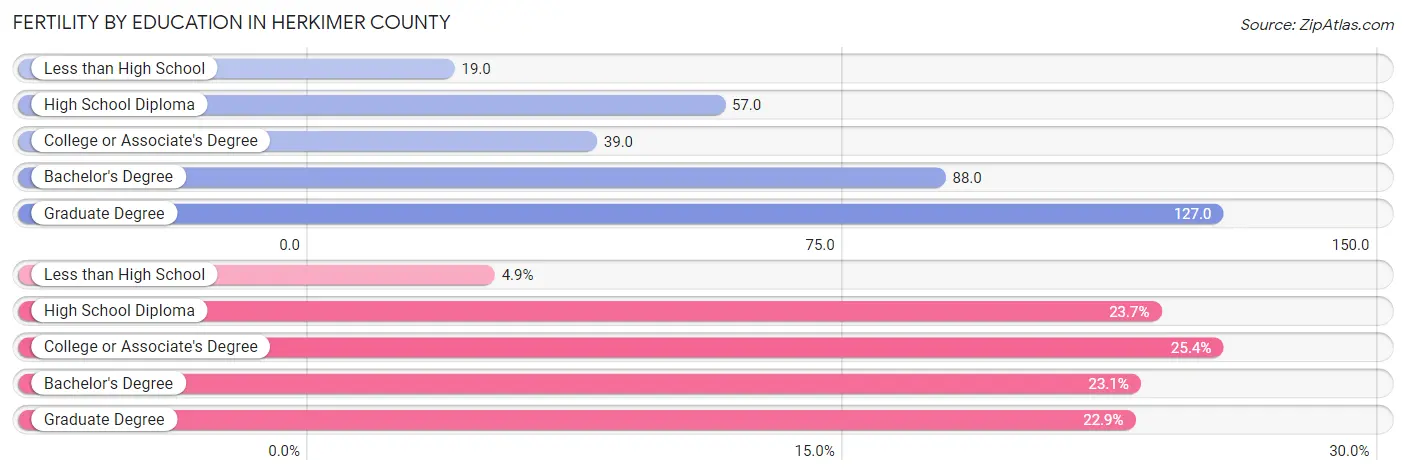
Fertility by Education in Herkimer County
Average fertility rate in Herkimer County is 57.0 births per 1,000 women. Women with the education attainment of graduate degree have the highest fertility rate of 127.0 births per 1,000 women, while women with the education attainment of less than high school have the lowest fertility at 19.0 births per 1,000 women. Women with the education attainment of college or associate's degree represent 25.4% of all women with births.
| Educational Attainment | Women with Births | Births / 1,000 Women |
| Less than High School | 34 (4.9%) | 19.0 |
| High School Diploma | 163 (23.7%) | 57.0 |
| College or Associate's Degree | 175 (25.4%) | 39.0 |
| Bachelor's Degree | 159 (23.1%) | 88.0 |
| Graduate Degree | 158 (22.9%) | 127.0 |
| Total | 689 (100.0%) | 57.0 |
Fertility by Education by Marriage Status in Herkimer County
23.9% of women with births in Herkimer County are unmarried. Women with the educational attainment of less than high school are most likely to be married with 100.0% of them married at childbirth, while women with the educational attainment of high school diploma are least likely to be married with 55.8% of them unmarried at childbirth.
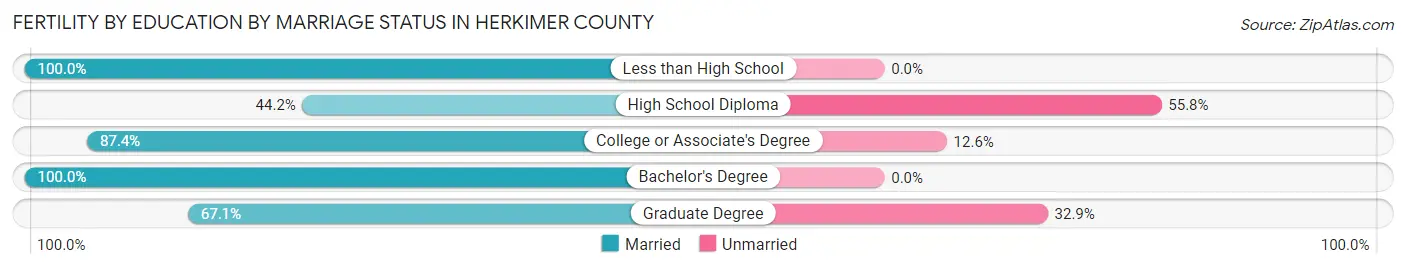
| Educational Attainment | Married | Unmarried |
| Less than High School | 34 (100.0%) | 0 (0.0%) |
| High School Diploma | 72 (44.2%) | 91 (55.8%) |
| College or Associate's Degree | 153 (87.4%) | 22 (12.6%) |
| Bachelor's Degree | 159 (100.0%) | 0 (0.0%) |
| Graduate Degree | 106 (67.1%) | 52 (32.9%) |
| Total | 524 (76.0%) | 165 (23.9%) |
Employment Characteristics in Herkimer County
Employment by Class of Employer in Herkimer County
Among the 27,448 employed individuals in Herkimer County, private company employees (16,788 | 61.2%), not-for-profit organizations (3,321 | 12.1%), and local government employees (2,623 | 9.6%) make up the most common classes of employment.
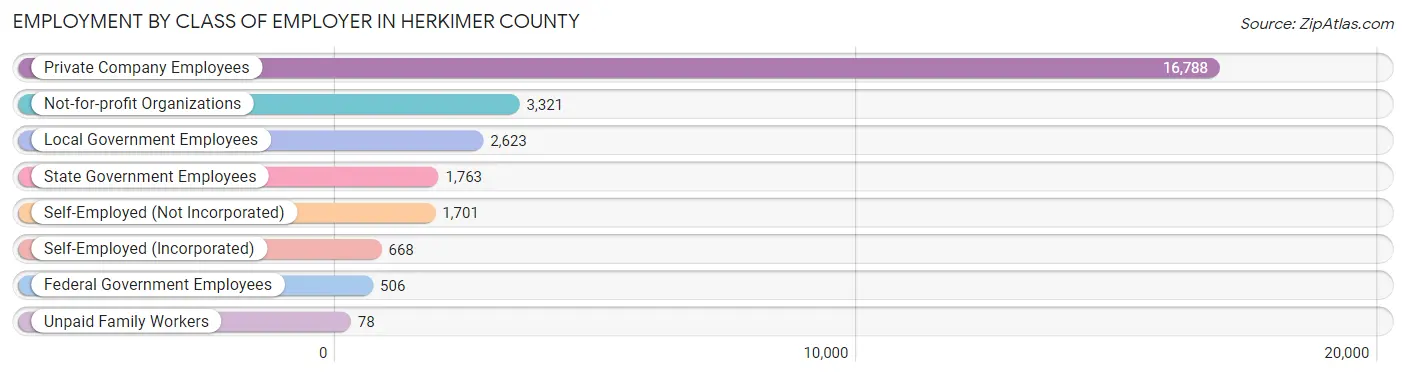
| Employer Class | # Employees | % Employees |
| Private Company Employees | 16,788 | 61.2% |
| Self-Employed (Incorporated) | 668 | 2.4% |
| Self-Employed (Not Incorporated) | 1,701 | 6.2% |
| Not-for-profit Organizations | 3,321 | 12.1% |
| Local Government Employees | 2,623 | 9.6% |
| State Government Employees | 1,763 | 6.4% |
| Federal Government Employees | 506 | 1.8% |
| Unpaid Family Workers | 78 | 0.3% |
| Total | 27,448 | 100.0% |
Employment Status by Age in Herkimer County
According to the labor force statistics for Herkimer County, out of the total population over 16 years of age (49,460), 59.5% or 29,429 individuals are in the labor force, with 4.2% or 1,236 of them unemployed. The age group with the highest labor force participation rate is 45 to 54 years, with 81.6% or 6,205 individuals in the labor force. Within the labor force, the 16 to 19 years age range has the highest percentage of unemployed individuals, with 17.0% or 169 of them being unemployed.
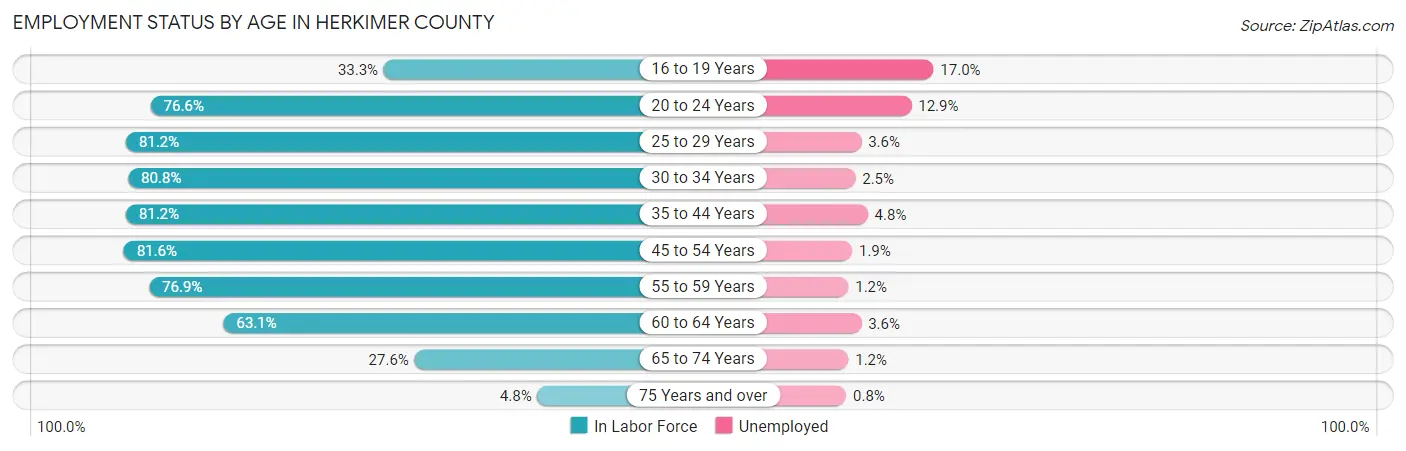
| Age Bracket | In Labor Force | Unemployed |
| 16 to 19 Years | 995 (33.3%) | 169 (17.0%) |
| 20 to 24 Years | 2,650 (76.6%) | 342 (12.9%) |
| 25 to 29 Years | 2,683 (81.2%) | 97 (3.6%) |
| 30 to 34 Years | 2,636 (80.8%) | 66 (2.5%) |
| 35 to 44 Years | 5,430 (81.2%) | 261 (4.8%) |
| 45 to 54 Years | 6,205 (81.6%) | 118 (1.9%) |
| 55 to 59 Years | 3,532 (76.9%) | 42 (1.2%) |
| 60 to 64 Years | 2,970 (63.1%) | 107 (3.6%) |
| 65 to 74 Years | 2,079 (27.6%) | 25 (1.2%) |
| 75 Years and over | 256 (4.8%) | 2 (0.8%) |
| Total | 29,429 (59.5%) | 1,236 (4.2%) |
Employment Status by Educational Attainment in Herkimer County
According to labor force statistics for Herkimer County, 77.8% of individuals (23,462) out of the total population between 25 and 64 years of age (30,157) are in the labor force, with 2.9% or 680 of them being unemployed. The group with the highest labor force participation rate are those with the educational attainment of bachelor's degree or higher, with 88.0% or 6,163 individuals in the labor force. Within the labor force, individuals with high school diploma education have the highest percentage of unemployment, with 5.3% or 377 of them being unemployed.
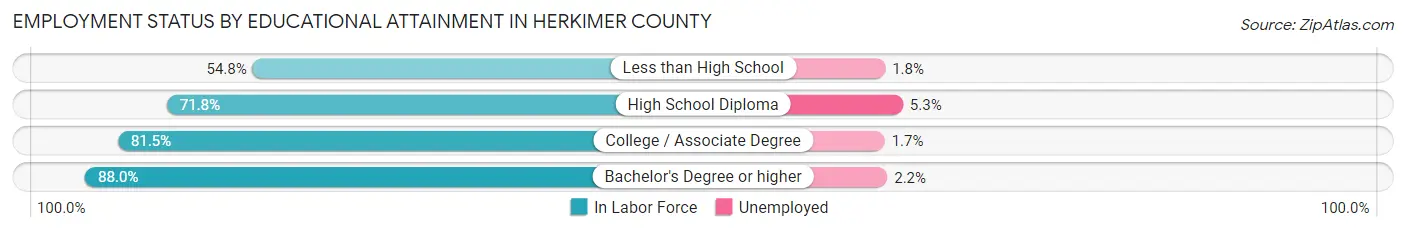
| Educational Attainment | In Labor Force | Unemployed |
| Less than High School | 1,281 (54.8%) | 42 (1.8%) |
| High School Diploma | 7,107 (71.8%) | 525 (5.3%) |
| College / Associate Degree | 8,897 (81.5%) | 186 (1.7%) |
| Bachelor's Degree or higher | 6,163 (88.0%) | 154 (2.2%) |
| Total | 23,462 (77.8%) | 875 (2.9%) |
Employment Occupations by Sex in Herkimer County
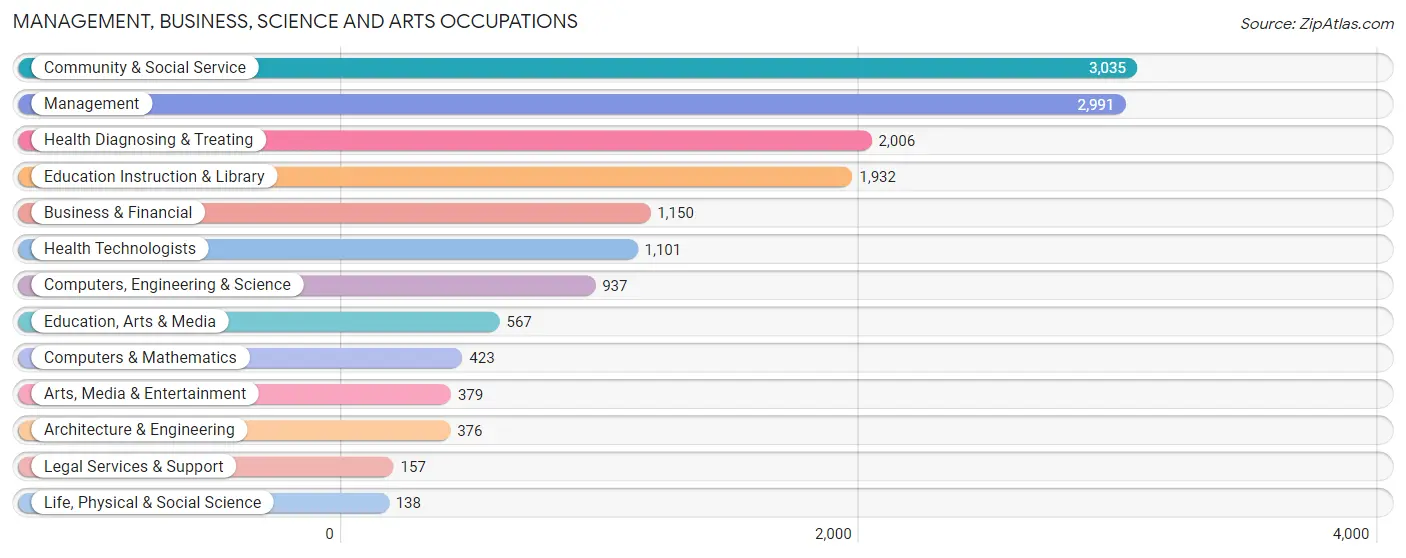
Management, Business, Science and Arts Occupations
The most common Management, Business, Science and Arts occupations in Herkimer County are Community & Social Service (3,035 | 10.8%), Management (2,991 | 10.6%), Health Diagnosing & Treating (2,006 | 7.1%), Education Instruction & Library (1,932 | 6.9%), and Business & Financial (1,150 | 4.1%).
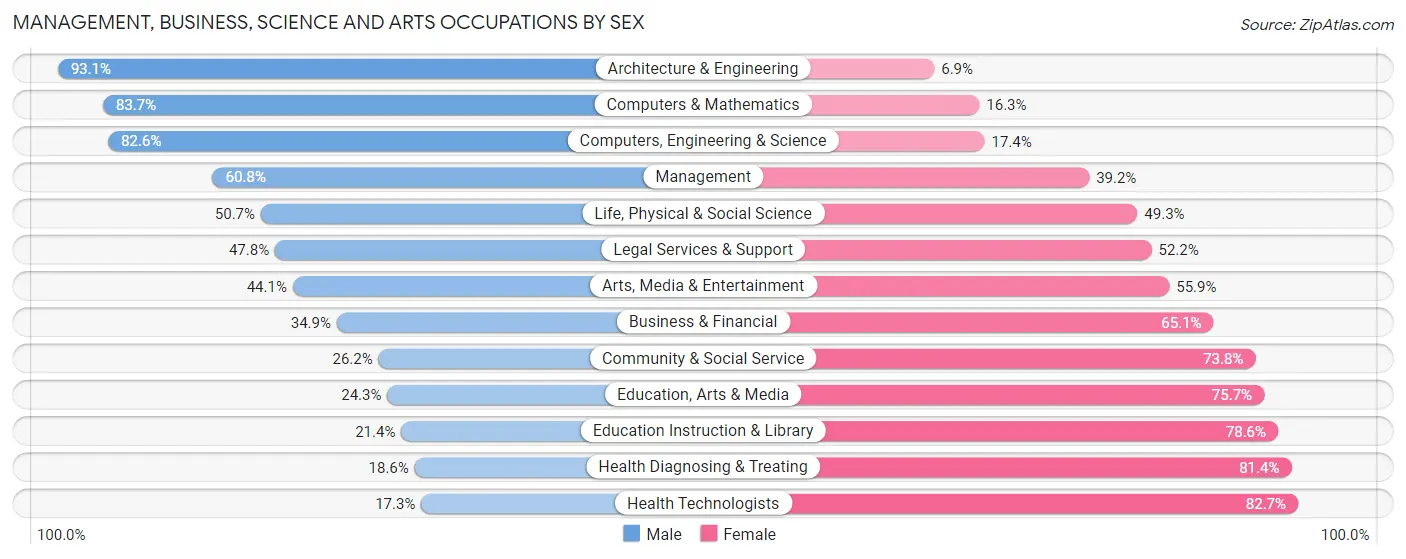
Management, Business, Science and Arts Occupations by Sex
Within the Management, Business, Science and Arts occupations in Herkimer County, the most male-oriented occupations are Architecture & Engineering (93.1%), Computers & Mathematics (83.7%), and Computers, Engineering & Science (82.6%), while the most female-oriented occupations are Health Technologists (82.7%), Health Diagnosing & Treating (81.4%), and Education Instruction & Library (78.6%).
| Occupation | Male | Female |
| Management | 1,818 (60.8%) | 1,173 (39.2%) |
| Business & Financial | 401 (34.9%) | 749 (65.1%) |
| Computers, Engineering & Science | 774 (82.6%) | 163 (17.4%) |
| Computers & Mathematics | 354 (83.7%) | 69 (16.3%) |
| Architecture & Engineering | 350 (93.1%) | 26 (6.9%) |
| Life, Physical & Social Science | 70 (50.7%) | 68 (49.3%) |
| Community & Social Service | 794 (26.2%) | 2,241 (73.8%) |
| Education, Arts & Media | 138 (24.3%) | 429 (75.7%) |
| Legal Services & Support | 75 (47.8%) | 82 (52.2%) |
| Education Instruction & Library | 414 (21.4%) | 1,518 (78.6%) |
| Arts, Media & Entertainment | 167 (44.1%) | 212 (55.9%) |
| Health Diagnosing & Treating | 374 (18.6%) | 1,632 (81.4%) |
| Health Technologists | 190 (17.3%) | 911 (82.7%) |
| Total (Category) | 4,161 (41.1%) | 5,958 (58.9%) |
| Total (Overall) | 14,732 (52.2%) | 13,466 (47.8%) |
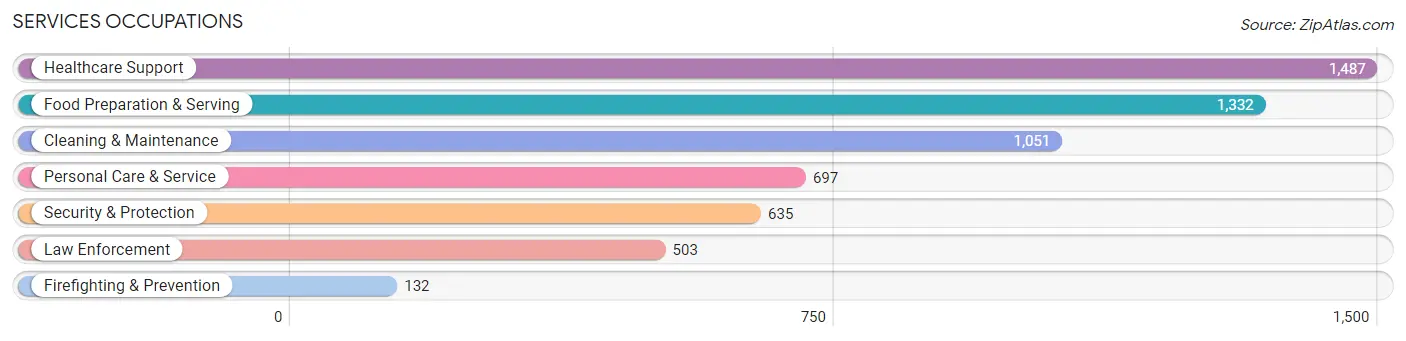
Services Occupations
The most common Services occupations in Herkimer County are Healthcare Support (1,487 | 5.3%), Food Preparation & Serving (1,332 | 4.7%), Cleaning & Maintenance (1,051 | 3.7%), Personal Care & Service (697 | 2.5%), and Security & Protection (635 | 2.2%).
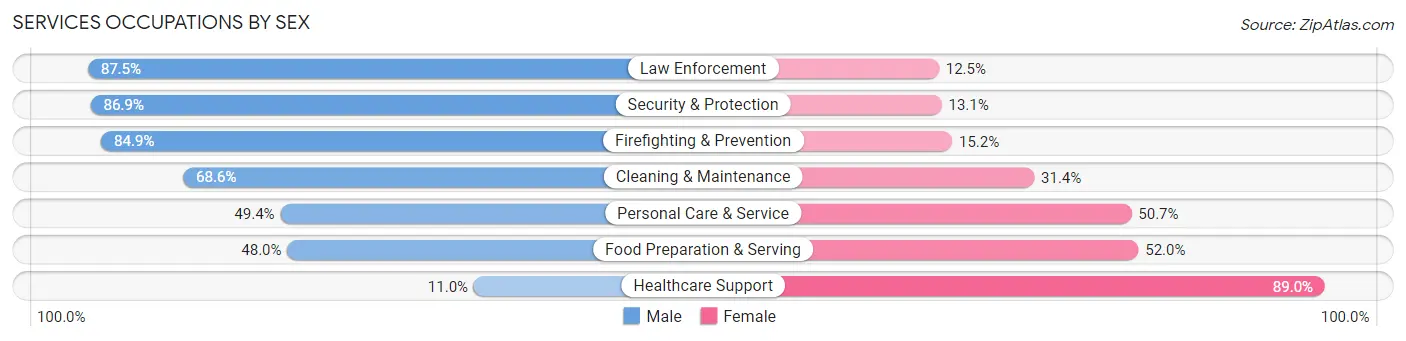
Services Occupations by Sex
Within the Services occupations in Herkimer County, the most male-oriented occupations are Law Enforcement (87.5%), Security & Protection (86.9%), and Firefighting & Prevention (84.9%), while the most female-oriented occupations are Healthcare Support (89.0%), Food Preparation & Serving (52.0%), and Personal Care & Service (50.6%).
| Occupation | Male | Female |
| Healthcare Support | 164 (11.0%) | 1,323 (89.0%) |
| Security & Protection | 552 (86.9%) | 83 (13.1%) |
| Firefighting & Prevention | 112 (84.9%) | 20 (15.1%) |
| Law Enforcement | 440 (87.5%) | 63 (12.5%) |
| Food Preparation & Serving | 639 (48.0%) | 693 (52.0%) |
| Cleaning & Maintenance | 721 (68.6%) | 330 (31.4%) |
| Personal Care & Service | 344 (49.3%) | 353 (50.6%) |
| Total (Category) | 2,420 (46.5%) | 2,782 (53.5%) |
| Total (Overall) | 14,732 (52.2%) | 13,466 (47.8%) |
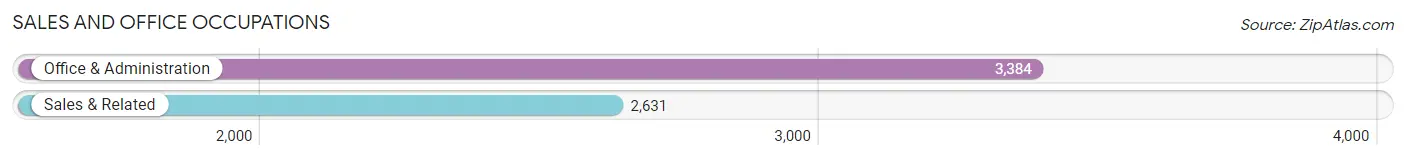
Sales and Office Occupations
The most common Sales and Office occupations in Herkimer County are Office & Administration (3,384 | 12.0%), and Sales & Related (2,631 | 9.3%).
Sales and Office Occupations by Sex
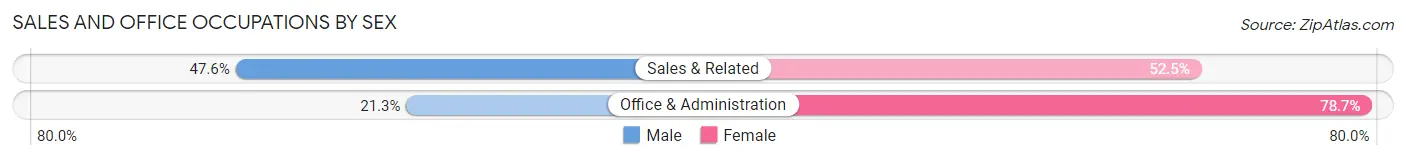
| Occupation | Male | Female |
| Sales & Related | 1,251 (47.5%) | 1,380 (52.4%) |
| Office & Administration | 720 (21.3%) | 2,664 (78.7%) |
| Total (Category) | 1,971 (32.8%) | 4,044 (67.2%) |
| Total (Overall) | 14,732 (52.2%) | 13,466 (47.8%) |
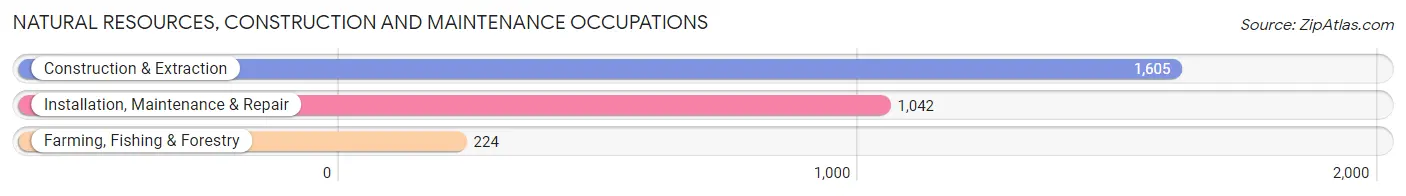
Natural Resources, Construction and Maintenance Occupations
The most common Natural Resources, Construction and Maintenance occupations in Herkimer County are Construction & Extraction (1,605 | 5.7%), Installation, Maintenance & Repair (1,042 | 3.7%), and Farming, Fishing & Forestry (224 | 0.8%).
Natural Resources, Construction and Maintenance Occupations by Sex
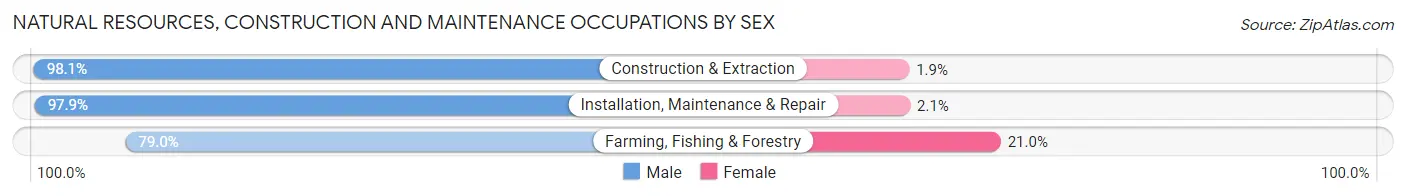
| Occupation | Male | Female |
| Farming, Fishing & Forestry | 177 (79.0%) | 47 (21.0%) |
| Construction & Extraction | 1,574 (98.1%) | 31 (1.9%) |
| Installation, Maintenance & Repair | 1,020 (97.9%) | 22 (2.1%) |
| Total (Category) | 2,771 (96.5%) | 100 (3.5%) |
| Total (Overall) | 14,732 (52.2%) | 13,466 (47.8%) |
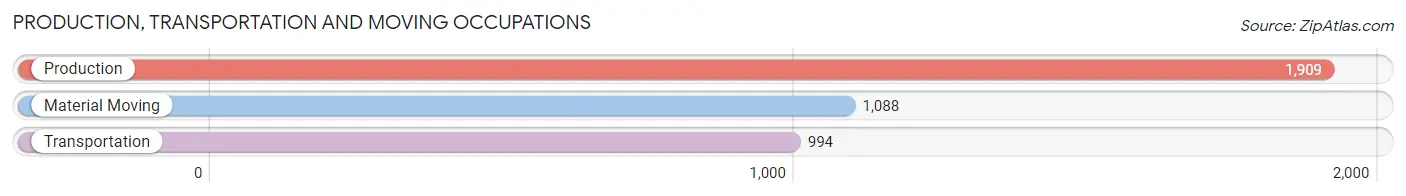
Production, Transportation and Moving Occupations
The most common Production, Transportation and Moving occupations in Herkimer County are Production (1,909 | 6.8%), Material Moving (1,088 | 3.9%), and Transportation (994 | 3.5%).
Production, Transportation and Moving Occupations by Sex
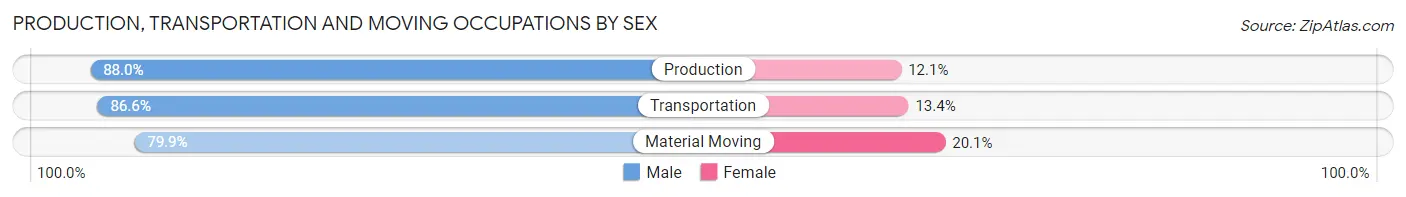
| Occupation | Male | Female |
| Production | 1,679 (87.9%) | 230 (12.0%) |
| Transportation | 861 (86.6%) | 133 (13.4%) |
| Material Moving | 869 (79.9%) | 219 (20.1%) |
| Total (Category) | 3,409 (85.4%) | 582 (14.6%) |
| Total (Overall) | 14,732 (52.2%) | 13,466 (47.8%) |
Employment Industries by Sex in Herkimer County
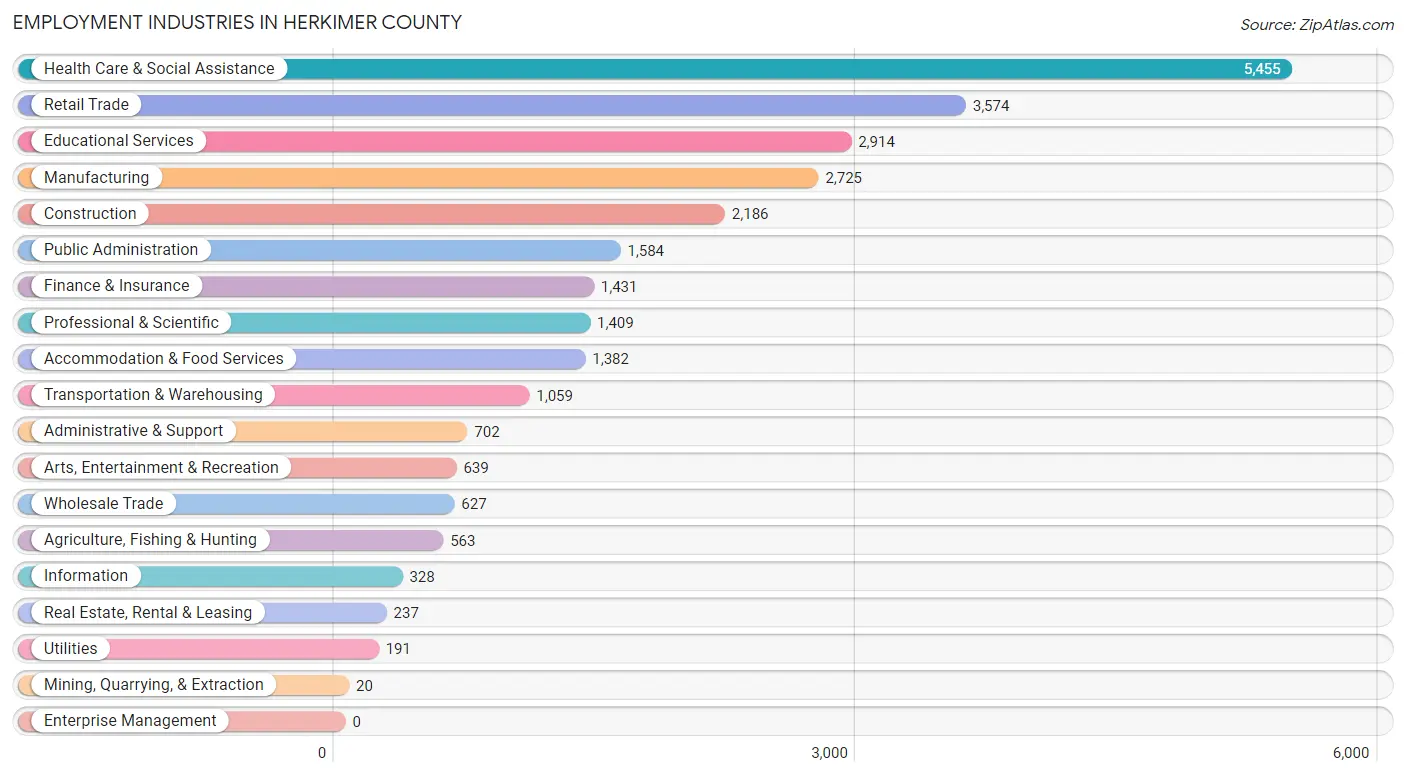
Employment Industries in Herkimer County
The major employment industries in Herkimer County include Health Care & Social Assistance (5,455 | 19.4%), Retail Trade (3,574 | 12.7%), Educational Services (2,914 | 10.3%), Manufacturing (2,725 | 9.7%), and Construction (2,186 | 7.7%).
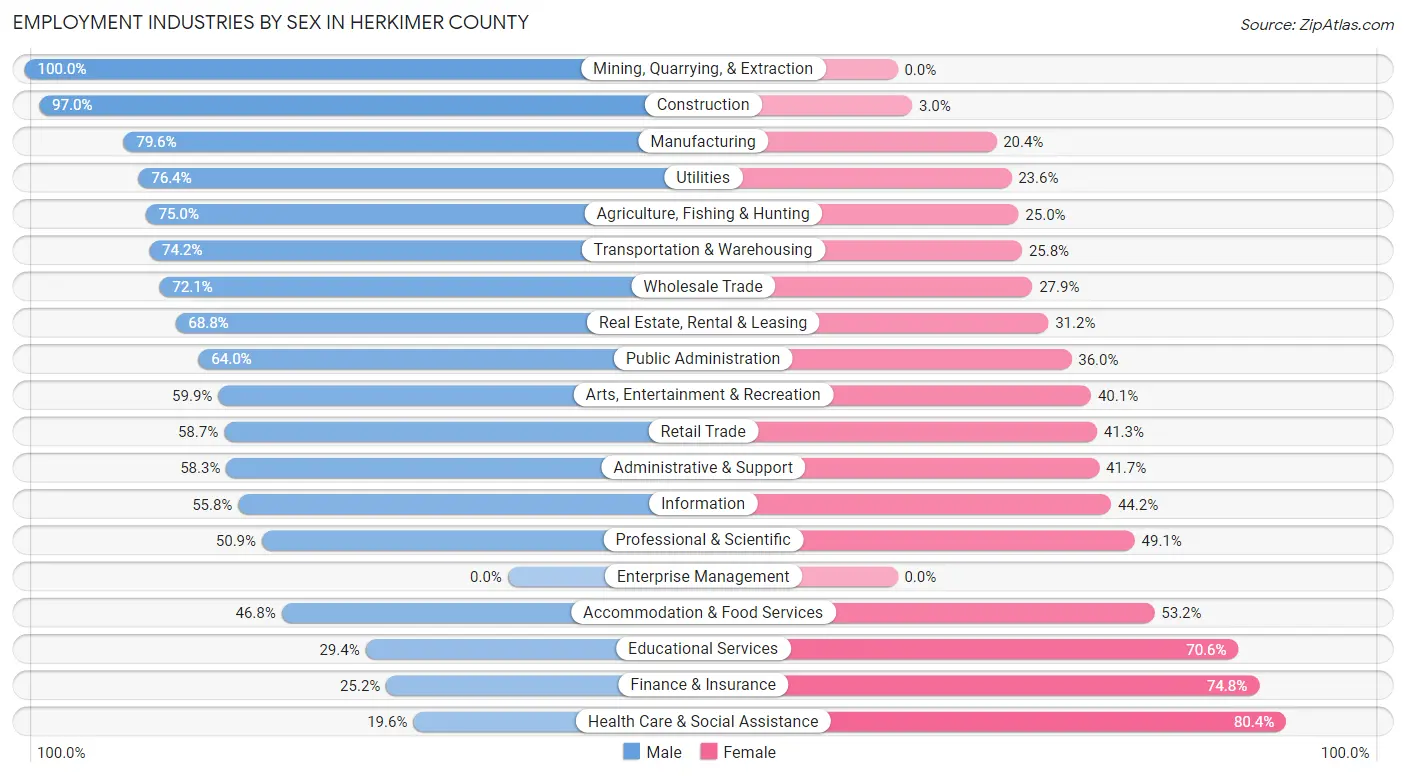
Employment Industries by Sex in Herkimer County
The Herkimer County industries that see more men than women are Mining, Quarrying, & Extraction (100.0%), Construction (97.0%), and Manufacturing (79.6%), whereas the industries that tend to have a higher number of women are Health Care & Social Assistance (80.4%), Finance & Insurance (74.8%), and Educational Services (70.6%).
| Industry | Male | Female |
| Agriculture, Fishing & Hunting | 422 (75.0%) | 141 (25.0%) |
| Mining, Quarrying, & Extraction | 20 (100.0%) | 0 (0.0%) |
| Construction | 2,120 (97.0%) | 66 (3.0%) |
| Manufacturing | 2,168 (79.6%) | 557 (20.4%) |
| Wholesale Trade | 452 (72.1%) | 175 (27.9%) |
| Retail Trade | 2,099 (58.7%) | 1,475 (41.3%) |
| Transportation & Warehousing | 786 (74.2%) | 273 (25.8%) |
| Utilities | 146 (76.4%) | 45 (23.6%) |
| Information | 183 (55.8%) | 145 (44.2%) |
| Finance & Insurance | 360 (25.2%) | 1,071 (74.8%) |
| Real Estate, Rental & Leasing | 163 (68.8%) | 74 (31.2%) |
| Professional & Scientific | 717 (50.9%) | 692 (49.1%) |
| Enterprise Management | 0 (0.0%) | 0 (0.0%) |
| Administrative & Support | 409 (58.3%) | 293 (41.7%) |
| Educational Services | 858 (29.4%) | 2,056 (70.6%) |
| Health Care & Social Assistance | 1,067 (19.6%) | 4,388 (80.4%) |
| Arts, Entertainment & Recreation | 383 (59.9%) | 256 (40.1%) |
| Accommodation & Food Services | 647 (46.8%) | 735 (53.2%) |
| Public Administration | 1,014 (64.0%) | 570 (36.0%) |
| Total | 14,732 (52.2%) | 13,466 (47.8%) |
Education in Herkimer County
School Enrollment in Herkimer County
The most common levels of schooling among the 12,313 students in Herkimer County are high school (2,979 | 24.2%), middle school (2,856 | 23.2%), and elementary school (2,701 | 21.9%).
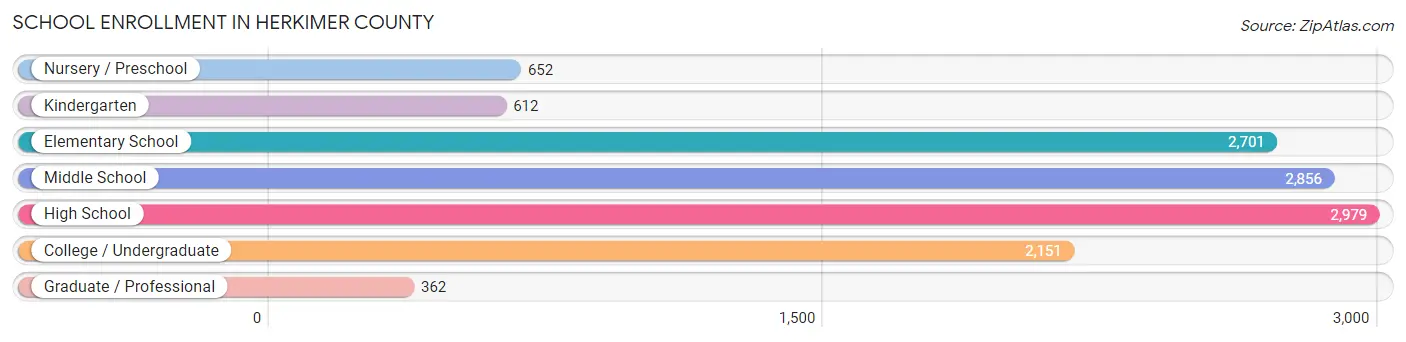
| School Level | # Students | % Students |
| Nursery / Preschool | 652 | 5.3% |
| Kindergarten | 612 | 5.0% |
| Elementary School | 2,701 | 21.9% |
| Middle School | 2,856 | 23.2% |
| High School | 2,979 | 24.2% |
| College / Undergraduate | 2,151 | 17.5% |
| Graduate / Professional | 362 | 2.9% |
| Total | 12,313 | 100.0% |
School Enrollment by Age by Funding Source in Herkimer County
Out of a total of 12,313 students who are enrolled in schools in Herkimer County, 1,699 (13.8%) attend a private institution, while the remaining 10,614 (86.2%) are enrolled in public schools. The age group of 35 years and over has the highest likelihood of being enrolled in private schools, with 301 (54.6% in the age bracket) enrolled. Conversely, the age group of 10 to 14 year olds has the lowest likelihood of being enrolled in a private school, with 3,468 (94.1% in the age bracket) attending a public institution.
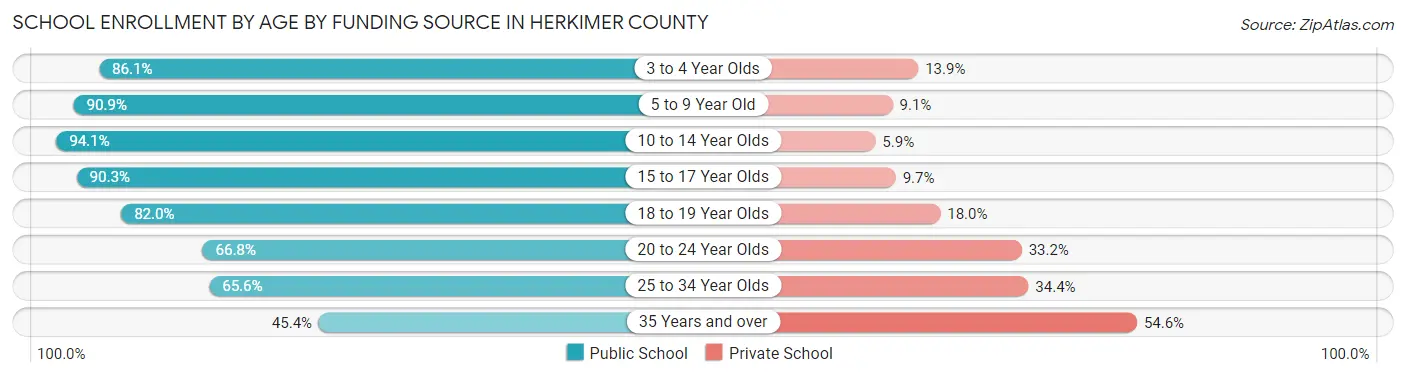
| Age Bracket | Public School | Private School |
| 3 to 4 Year Olds | 502 (86.1%) | 81 (13.9%) |
| 5 to 9 Year Old | 2,831 (90.9%) | 284 (9.1%) |
| 10 to 14 Year Olds | 3,468 (94.1%) | 218 (5.9%) |
| 15 to 17 Year Olds | 1,861 (90.3%) | 200 (9.7%) |
| 18 to 19 Year Olds | 861 (82.0%) | 189 (18.0%) |
| 20 to 24 Year Olds | 639 (66.8%) | 317 (33.2%) |
| 25 to 34 Year Olds | 204 (65.6%) | 107 (34.4%) |
| 35 Years and over | 250 (45.4%) | 301 (54.6%) |
| Total | 10,614 (86.2%) | 1,699 (13.8%) |
Educational Attainment by Field of Study in Herkimer County
Education (2,056 | 19.8%), science & technology (1,392 | 13.4%), business (1,310 | 12.6%), bio, nature & agricultural (936 | 9.0%), and literature & languages (636 | 6.1%) are the most common fields of study among 10,411 individuals in Herkimer County who have obtained a bachelor's degree or higher.
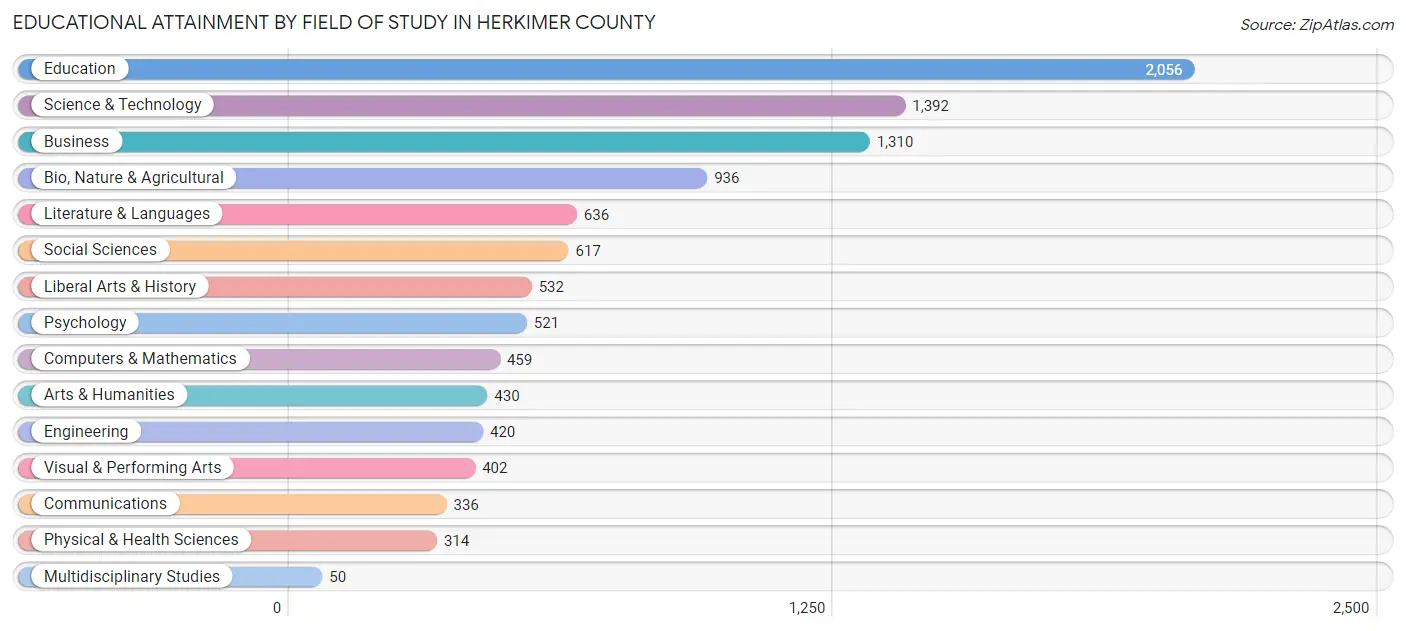
| Field of Study | # Graduates | % Graduates |
| Computers & Mathematics | 459 | 4.4% |
| Bio, Nature & Agricultural | 936 | 9.0% |
| Physical & Health Sciences | 314 | 3.0% |
| Psychology | 521 | 5.0% |
| Social Sciences | 617 | 5.9% |
| Engineering | 420 | 4.0% |
| Multidisciplinary Studies | 50 | 0.5% |
| Science & Technology | 1,392 | 13.4% |
| Business | 1,310 | 12.6% |
| Education | 2,056 | 19.8% |
| Literature & Languages | 636 | 6.1% |
| Liberal Arts & History | 532 | 5.1% |
| Visual & Performing Arts | 402 | 3.9% |
| Communications | 336 | 3.2% |
| Arts & Humanities | 430 | 4.1% |
| Total | 10,411 | 100.0% |
Transportation & Commute in Herkimer County
Vehicle Availability by Sex in Herkimer County
The most prevalent vehicle ownership categories in Herkimer County are males with 2 vehicles (7,034, accounting for 49.5%) and females with 2 vehicles (6,013, making up 53.8%).
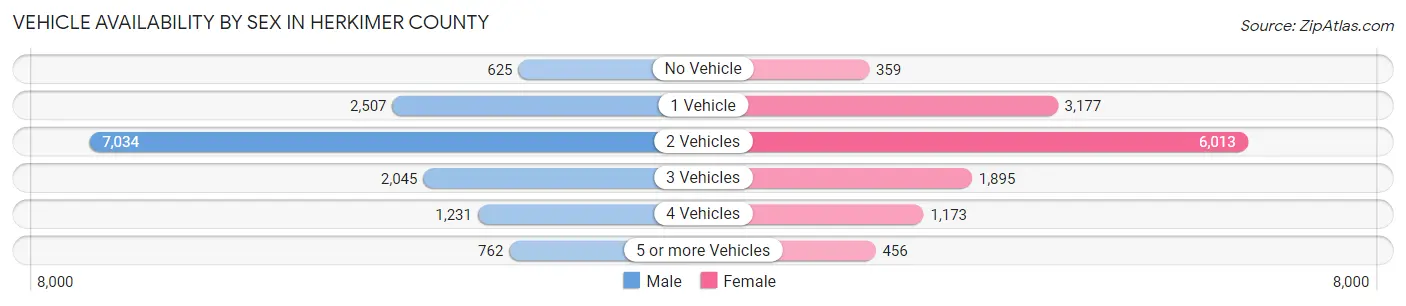
| Vehicles Available | Male | Female |
| No Vehicle | 625 (4.4%) | 359 (2.8%) |
| 1 Vehicle | 2,507 (17.6%) | 3,177 (24.3%) |
| 2 Vehicles | 7,034 (49.5%) | 6,013 (46.0%) |
| 3 Vehicles | 2,045 (14.4%) | 1,895 (14.5%) |
| 4 Vehicles | 1,231 (8.7%) | 1,173 (9.0%) |
| 5 or more Vehicles | 762 (5.4%) | 456 (3.5%) |
| Total | 14,204 (100.0%) | 13,073 (100.0%) |
Commute Time in Herkimer County
The most frequently occuring commute durations in Herkimer County are 5 to 9 minutes (3,706 commuters, 14.6%), 15 to 19 minutes (3,401 commuters, 13.4%), and 30 to 34 minutes (3,040 commuters, 12.0%).
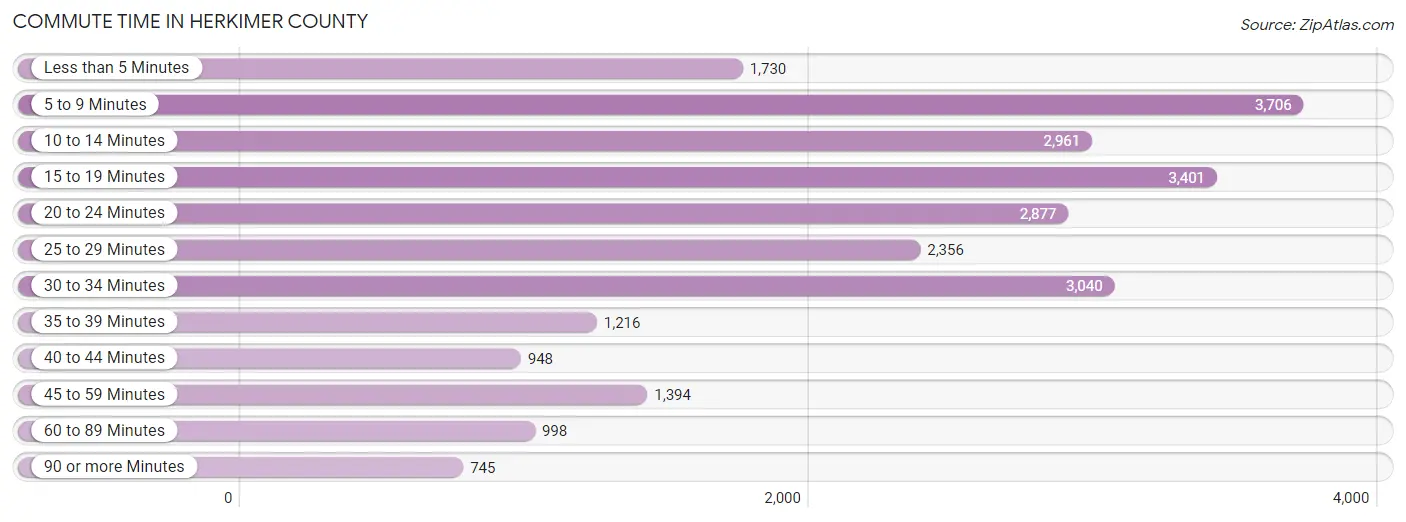
| Commute Time | # Commuters | % Commuters |
| Less than 5 Minutes | 1,730 | 6.8% |
| 5 to 9 Minutes | 3,706 | 14.6% |
| 10 to 14 Minutes | 2,961 | 11.7% |
| 15 to 19 Minutes | 3,401 | 13.4% |
| 20 to 24 Minutes | 2,877 | 11.3% |
| 25 to 29 Minutes | 2,356 | 9.3% |
| 30 to 34 Minutes | 3,040 | 12.0% |
| 35 to 39 Minutes | 1,216 | 4.8% |
| 40 to 44 Minutes | 948 | 3.7% |
| 45 to 59 Minutes | 1,394 | 5.5% |
| 60 to 89 Minutes | 998 | 3.9% |
| 90 or more Minutes | 745 | 2.9% |
Commute Time by Sex in Herkimer County
The most common commute times in Herkimer County are 5 to 9 minutes (1,870 commuters, 14.1%) for males and 5 to 9 minutes (1,836 commuters, 15.2%) for females.
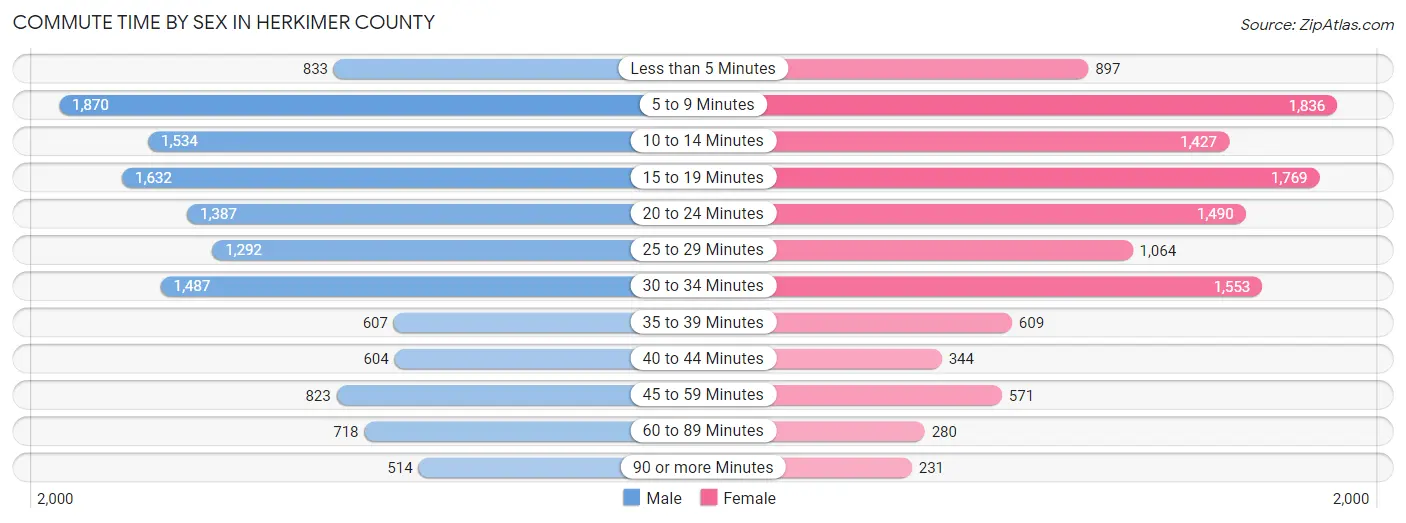
| Commute Time | Male | Female |
| Less than 5 Minutes | 833 (6.3%) | 897 (7.4%) |
| 5 to 9 Minutes | 1,870 (14.1%) | 1,836 (15.2%) |
| 10 to 14 Minutes | 1,534 (11.5%) | 1,427 (11.8%) |
| 15 to 19 Minutes | 1,632 (12.3%) | 1,769 (14.6%) |
| 20 to 24 Minutes | 1,387 (10.4%) | 1,490 (12.3%) |
| 25 to 29 Minutes | 1,292 (9.7%) | 1,064 (8.8%) |
| 30 to 34 Minutes | 1,487 (11.2%) | 1,553 (12.9%) |
| 35 to 39 Minutes | 607 (4.6%) | 609 (5.1%) |
| 40 to 44 Minutes | 604 (4.5%) | 344 (2.9%) |
| 45 to 59 Minutes | 823 (6.2%) | 571 (4.7%) |
| 60 to 89 Minutes | 718 (5.4%) | 280 (2.3%) |
| 90 or more Minutes | 514 (3.9%) | 231 (1.9%) |
Time of Departure to Work by Sex in Herkimer County
The most frequent times of departure to work in Herkimer County are 7:00 AM to 7:29 AM (1,859, 14.0%) for males and 7:30 AM to 7:59 AM (2,698, 22.4%) for females.
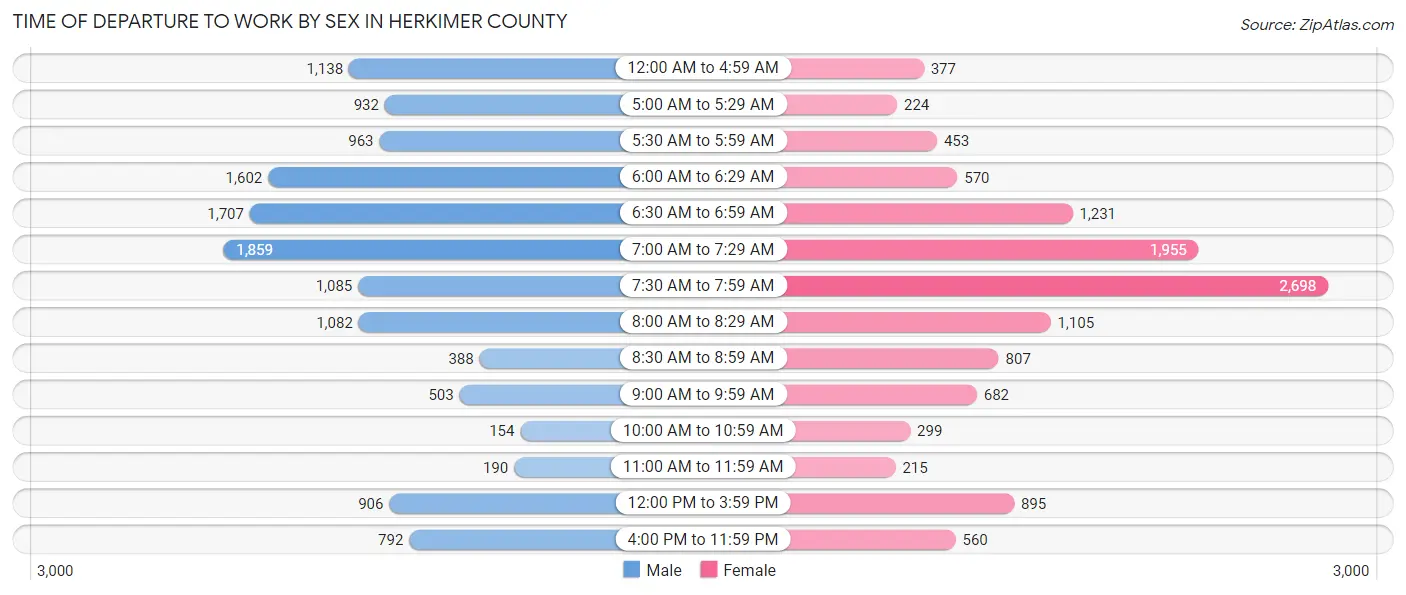
| Time of Departure | Male | Female |
| 12:00 AM to 4:59 AM | 1,138 (8.6%) | 377 (3.1%) |
| 5:00 AM to 5:29 AM | 932 (7.0%) | 224 (1.9%) |
| 5:30 AM to 5:59 AM | 963 (7.2%) | 453 (3.7%) |
| 6:00 AM to 6:29 AM | 1,602 (12.0%) | 570 (4.7%) |
| 6:30 AM to 6:59 AM | 1,707 (12.8%) | 1,231 (10.2%) |
| 7:00 AM to 7:29 AM | 1,859 (14.0%) | 1,955 (16.2%) |
| 7:30 AM to 7:59 AM | 1,085 (8.2%) | 2,698 (22.4%) |
| 8:00 AM to 8:29 AM | 1,082 (8.1%) | 1,105 (9.1%) |
| 8:30 AM to 8:59 AM | 388 (2.9%) | 807 (6.7%) |
| 9:00 AM to 9:59 AM | 503 (3.8%) | 682 (5.7%) |
| 10:00 AM to 10:59 AM | 154 (1.2%) | 299 (2.5%) |
| 11:00 AM to 11:59 AM | 190 (1.4%) | 215 (1.8%) |
| 12:00 PM to 3:59 PM | 906 (6.8%) | 895 (7.4%) |
| 4:00 PM to 11:59 PM | 792 (5.9%) | 560 (4.6%) |
| Total | 13,301 (100.0%) | 12,071 (100.0%) |
Housing Occupancy in Herkimer County
Occupancy by Ownership in Herkimer County
Of the total 24,664 dwellings in Herkimer County, owner-occupied units account for 18,744 (76.0%), while renter-occupied units make up 5,920 (24.0%).
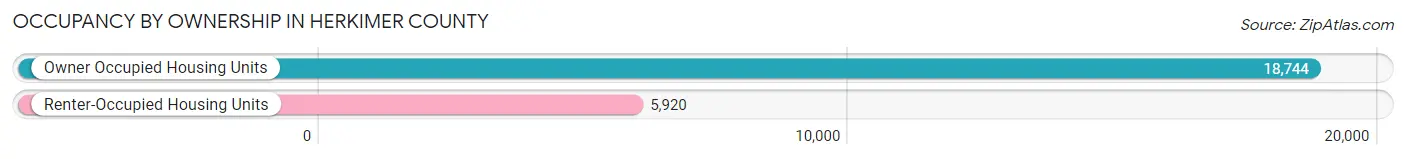
| Occupancy | # Housing Units | % Housing Units |
| Owner Occupied Housing Units | 18,744 | 76.0% |
| Renter-Occupied Housing Units | 5,920 | 24.0% |
| Total Occupied Housing Units | 24,664 | 100.0% |
Occupancy by Household Size in Herkimer County
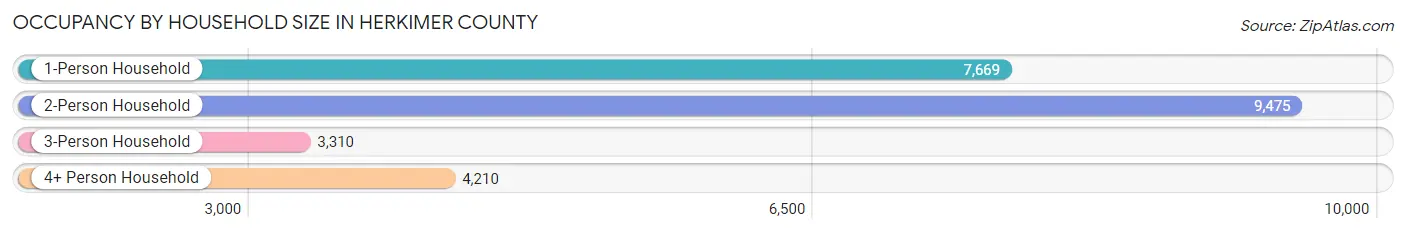
| Household Size | # Housing Units | % Housing Units |
| 1-Person Household | 7,669 | 31.1% |
| 2-Person Household | 9,475 | 38.4% |
| 3-Person Household | 3,310 | 13.4% |
| 4+ Person Household | 4,210 | 17.1% |
| Total Housing Units | 24,664 | 100.0% |
Occupancy by Ownership by Household Size in Herkimer County
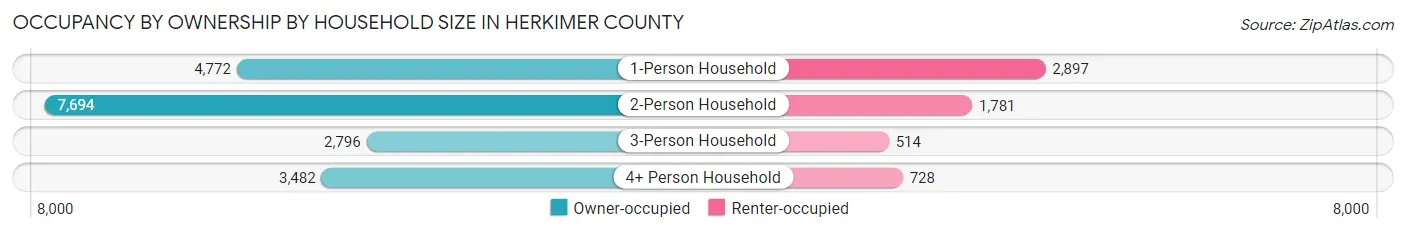
| Household Size | Owner-occupied | Renter-occupied |
| 1-Person Household | 4,772 (62.2%) | 2,897 (37.8%) |
| 2-Person Household | 7,694 (81.2%) | 1,781 (18.8%) |
| 3-Person Household | 2,796 (84.5%) | 514 (15.5%) |
| 4+ Person Household | 3,482 (82.7%) | 728 (17.3%) |
| Total Housing Units | 18,744 (76.0%) | 5,920 (24.0%) |
Occupancy by Educational Attainment in Herkimer County
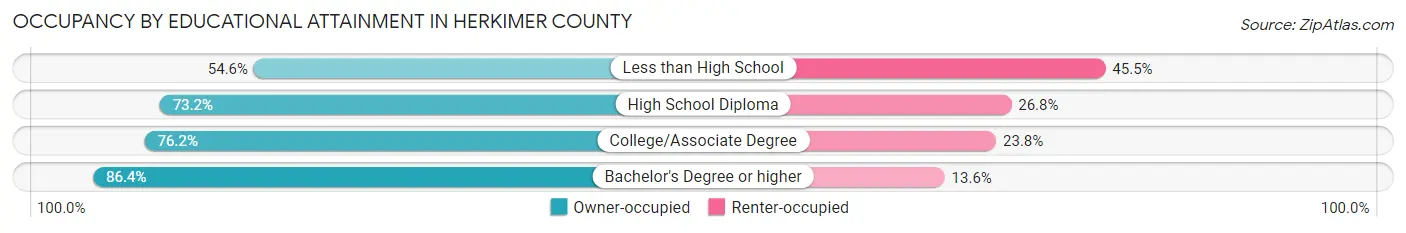
| Household Size | Owner-occupied | Renter-occupied |
| Less than High School | 1,026 (54.5%) | 855 (45.5%) |
| High School Diploma | 5,720 (73.2%) | 2,093 (26.8%) |
| College/Associate Degree | 7,015 (76.2%) | 2,189 (23.8%) |
| Bachelor's Degree or higher | 4,983 (86.4%) | 783 (13.6%) |
Occupancy by Age of Householder in Herkimer County
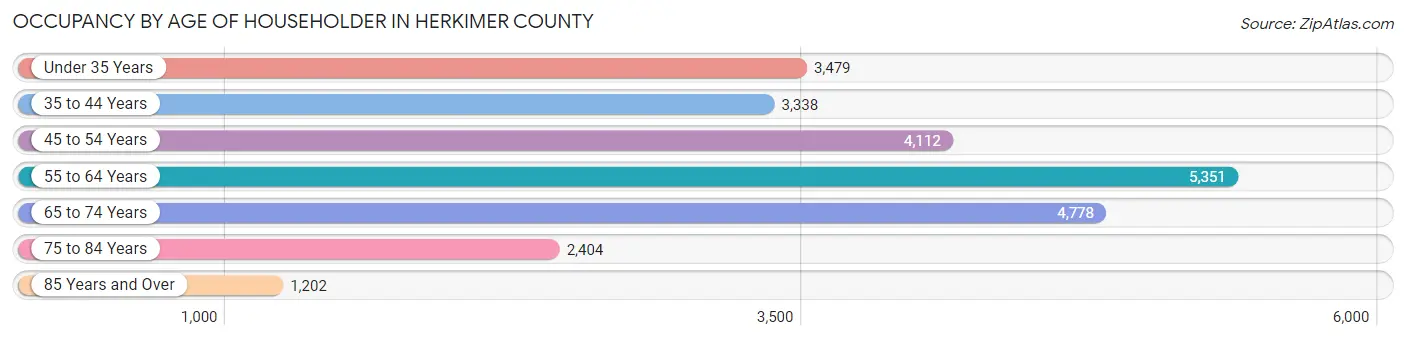
| Age Bracket | # Households | % Households |
| Under 35 Years | 3,479 | 14.1% |
| 35 to 44 Years | 3,338 | 13.5% |
| 45 to 54 Years | 4,112 | 16.7% |
| 55 to 64 Years | 5,351 | 21.7% |
| 65 to 74 Years | 4,778 | 19.4% |
| 75 to 84 Years | 2,404 | 9.8% |
| 85 Years and Over | 1,202 | 4.9% |
| Total | 24,664 | 100.0% |
Housing Finances in Herkimer County
Median Income by Occupancy in Herkimer County
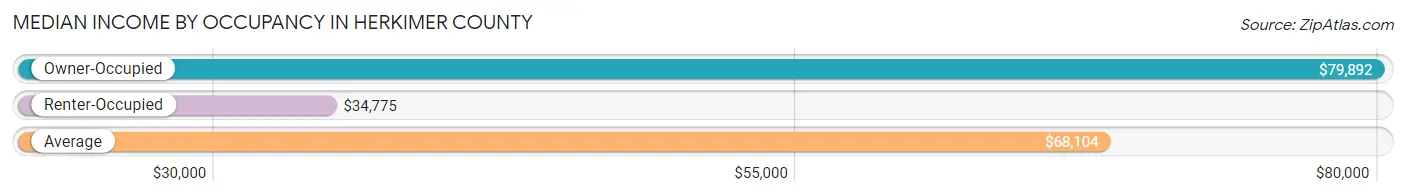
| Occupancy Type | # Households | Median Income |
| Owner-Occupied | 18,744 (76.0%) | $79,892 |
| Renter-Occupied | 5,920 (24.0%) | $34,775 |
| Average | 24,664 (100.0%) | $68,104 |
Occupancy by Householder Income Bracket in Herkimer County
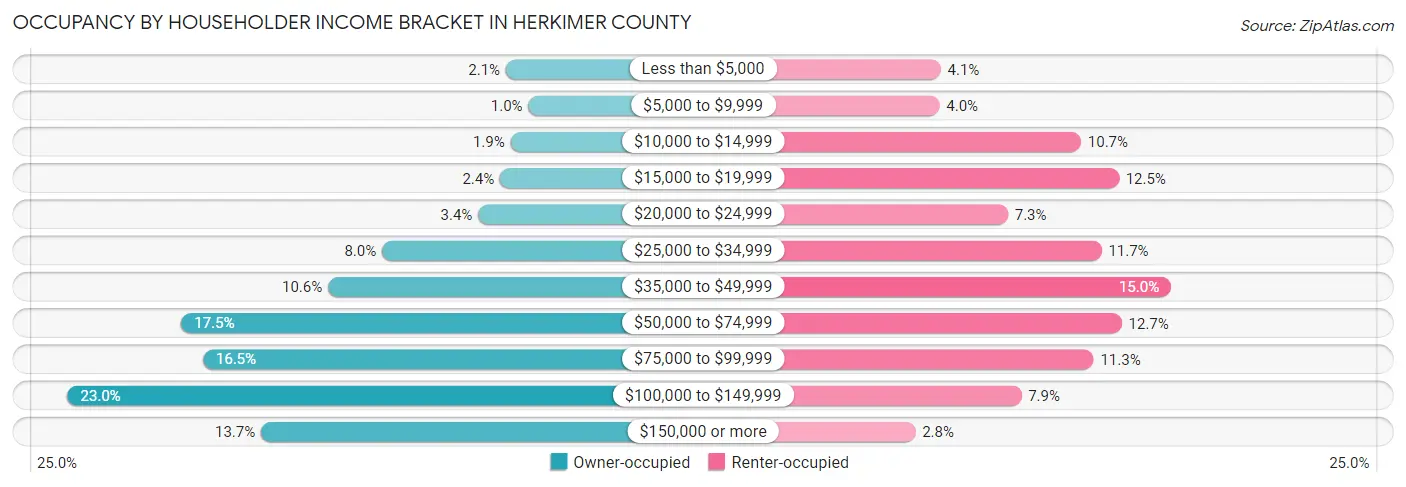
| Income Bracket | Owner-occupied | Renter-occupied |
| Less than $5,000 | 390 (2.1%) | 240 (4.1%) |
| $5,000 to $9,999 | 190 (1.0%) | 236 (4.0%) |
| $10,000 to $14,999 | 349 (1.9%) | 635 (10.7%) |
| $15,000 to $19,999 | 442 (2.4%) | 742 (12.5%) |
| $20,000 to $24,999 | 637 (3.4%) | 429 (7.2%) |
| $25,000 to $34,999 | 1,496 (8.0%) | 693 (11.7%) |
| $35,000 to $49,999 | 1,978 (10.5%) | 889 (15.0%) |
| $50,000 to $74,999 | 3,288 (17.5%) | 750 (12.7%) |
| $75,000 to $99,999 | 3,095 (16.5%) | 671 (11.3%) |
| $100,000 to $149,999 | 4,304 (23.0%) | 467 (7.9%) |
| $150,000 or more | 2,575 (13.7%) | 168 (2.8%) |
| Total | 18,744 (100.0%) | 5,920 (100.0%) |
Monthly Housing Cost Tiers in Herkimer County
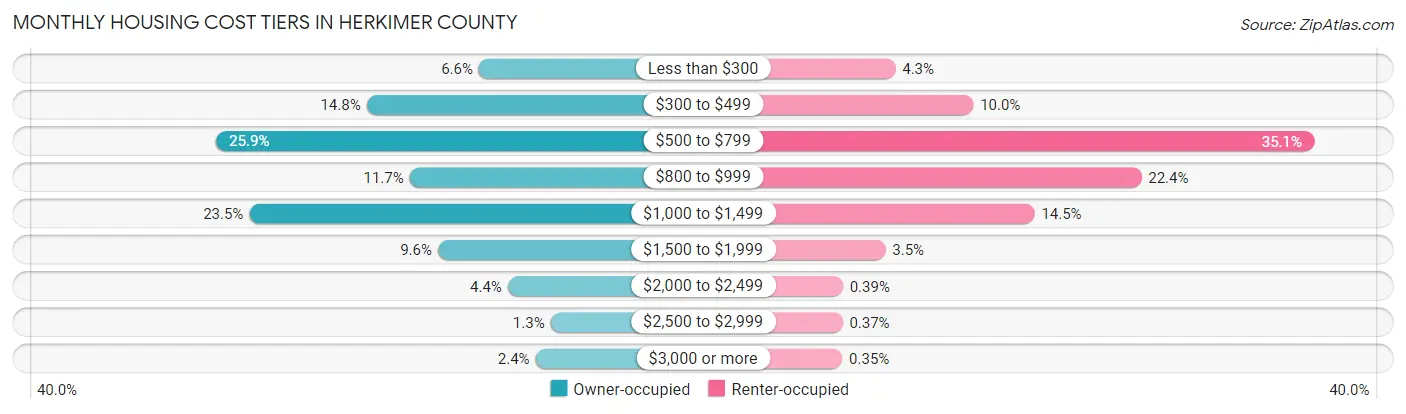
| Monthly Cost | Owner-occupied | Renter-occupied |
| Less than $300 | 1,227 (6.6%) | 252 (4.3%) |
| $300 to $499 | 2,777 (14.8%) | 592 (10.0%) |
| $500 to $799 | 4,853 (25.9%) | 2,077 (35.1%) |
| $800 to $999 | 2,184 (11.7%) | 1,325 (22.4%) |
| $1,000 to $1,499 | 4,397 (23.5%) | 859 (14.5%) |
| $1,500 to $1,999 | 1,793 (9.6%) | 209 (3.5%) |
| $2,000 to $2,499 | 829 (4.4%) | 23 (0.4%) |
| $2,500 to $2,999 | 238 (1.3%) | 22 (0.4%) |
| $3,000 or more | 446 (2.4%) | 21 (0.4%) |
| Total | 18,744 (100.0%) | 5,920 (100.0%) |
Physical Housing Characteristics in Herkimer County
Housing Structures in Herkimer County
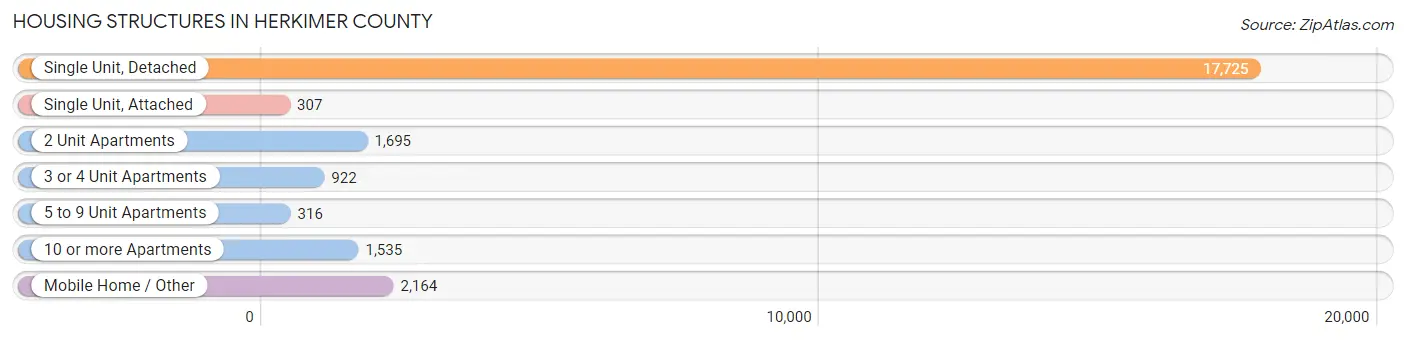
| Structure Type | # Housing Units | % Housing Units |
| Single Unit, Detached | 17,725 | 71.9% |
| Single Unit, Attached | 307 | 1.2% |
| 2 Unit Apartments | 1,695 | 6.9% |
| 3 or 4 Unit Apartments | 922 | 3.7% |
| 5 to 9 Unit Apartments | 316 | 1.3% |
| 10 or more Apartments | 1,535 | 6.2% |
| Mobile Home / Other | 2,164 | 8.8% |
| Total | 24,664 | 100.0% |
Housing Structures by Occupancy in Herkimer County
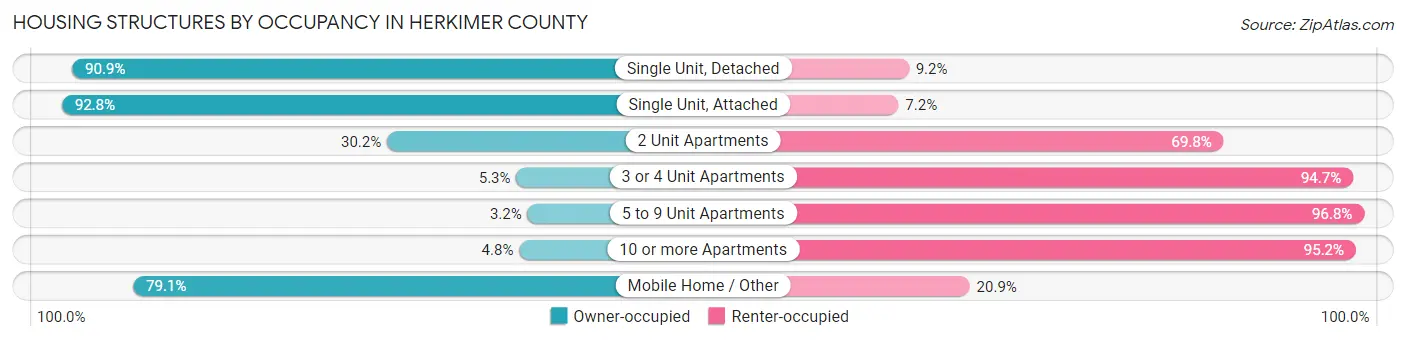
| Structure Type | Owner-occupied | Renter-occupied |
| Single Unit, Detached | 16,103 (90.8%) | 1,622 (9.1%) |
| Single Unit, Attached | 285 (92.8%) | 22 (7.2%) |
| 2 Unit Apartments | 512 (30.2%) | 1,183 (69.8%) |
| 3 or 4 Unit Apartments | 49 (5.3%) | 873 (94.7%) |
| 5 to 9 Unit Apartments | 10 (3.2%) | 306 (96.8%) |
| 10 or more Apartments | 73 (4.8%) | 1,462 (95.2%) |
| Mobile Home / Other | 1,712 (79.1%) | 452 (20.9%) |
| Total | 18,744 (76.0%) | 5,920 (24.0%) |
Housing Structures by Number of Rooms in Herkimer County
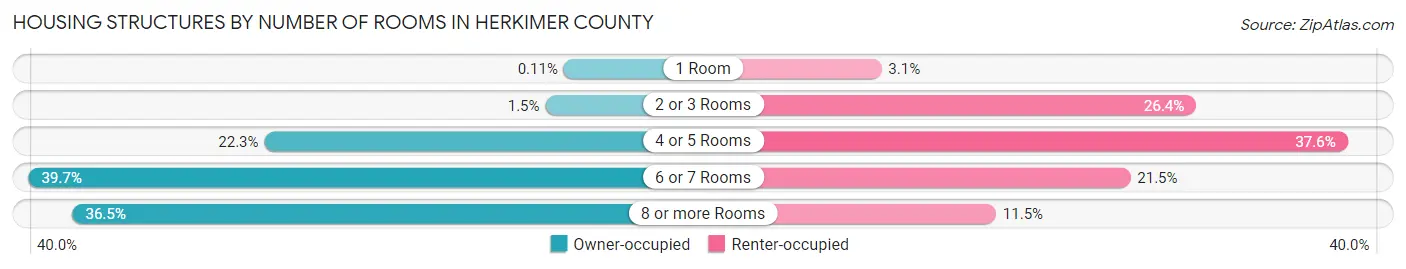
| Number of Rooms | Owner-occupied | Renter-occupied |
| 1 Room | 21 (0.1%) | 182 (3.1%) |
| 2 or 3 Rooms | 275 (1.5%) | 1,560 (26.4%) |
| 4 or 5 Rooms | 4,173 (22.3%) | 2,223 (37.6%) |
| 6 or 7 Rooms | 7,443 (39.7%) | 1,272 (21.5%) |
| 8 or more Rooms | 6,832 (36.4%) | 683 (11.5%) |
| Total | 18,744 (100.0%) | 5,920 (100.0%) |
Housing Structure by Heating Type in Herkimer County
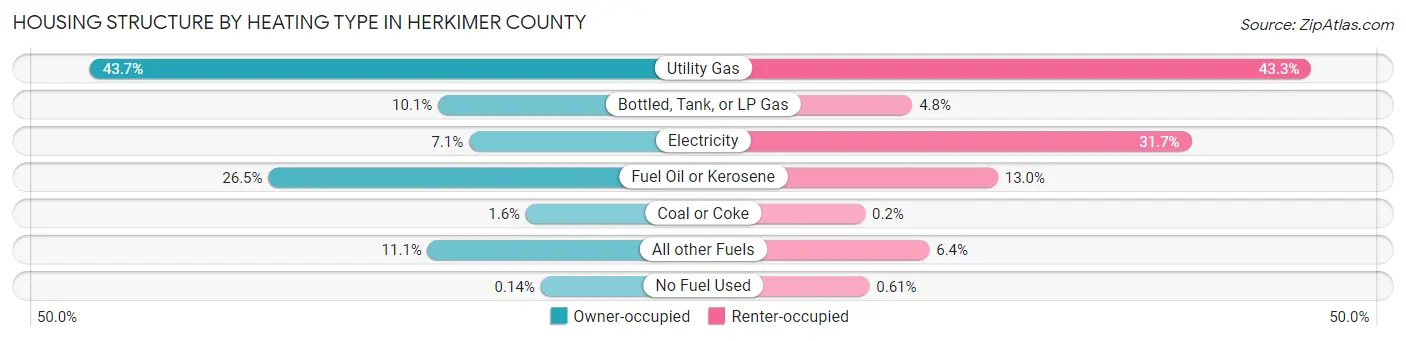
| Heating Type | Owner-occupied | Renter-occupied |
| Utility Gas | 8,189 (43.7%) | 2,563 (43.3%) |
| Bottled, Tank, or LP Gas | 1,883 (10.1%) | 281 (4.8%) |
| Electricity | 1,323 (7.1%) | 1,878 (31.7%) |
| Fuel Oil or Kerosene | 4,957 (26.5%) | 771 (13.0%) |
| Coal or Coke | 292 (1.6%) | 12 (0.2%) |
| All other Fuels | 2,074 (11.1%) | 379 (6.4%) |
| No Fuel Used | 26 (0.1%) | 36 (0.6%) |
| Total | 18,744 (100.0%) | 5,920 (100.0%) |
Household Vehicle Usage in Herkimer County
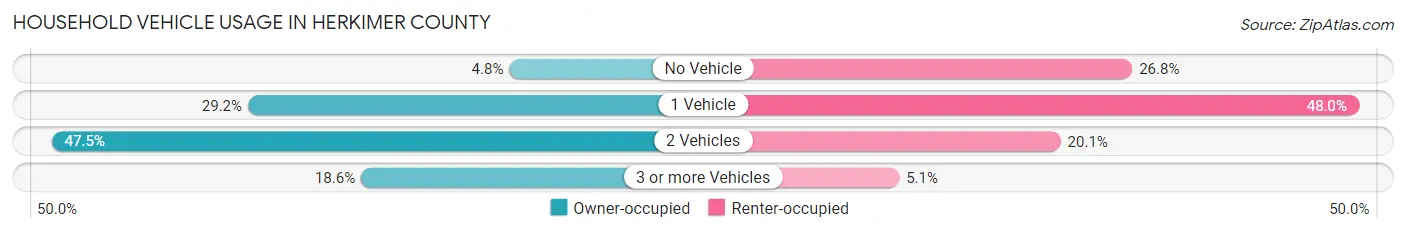
| Vehicles per Household | Owner-occupied | Renter-occupied |
| No Vehicle | 892 (4.8%) | 1,588 (26.8%) |
| 1 Vehicle | 5,466 (29.2%) | 2,840 (48.0%) |
| 2 Vehicles | 8,899 (47.5%) | 1,192 (20.1%) |
| 3 or more Vehicles | 3,487 (18.6%) | 300 (5.1%) |
| Total | 18,744 (100.0%) | 5,920 (100.0%) |
Real Estate & Mortgages in Herkimer County
Real Estate and Mortgage Overview in Herkimer County
| Characteristic | Without Mortgage | With Mortgage |
| Housing Units | 9,369 | 9,375 |
| Median Property Value | $124,300 | $136,700 |
| Median Household Income | $65,072 | $1,696 |
| Monthly Housing Costs | $553 | $414 |
| Real Estate Taxes | $2,818 | $283 |
Property Value by Mortgage Status in Herkimer County
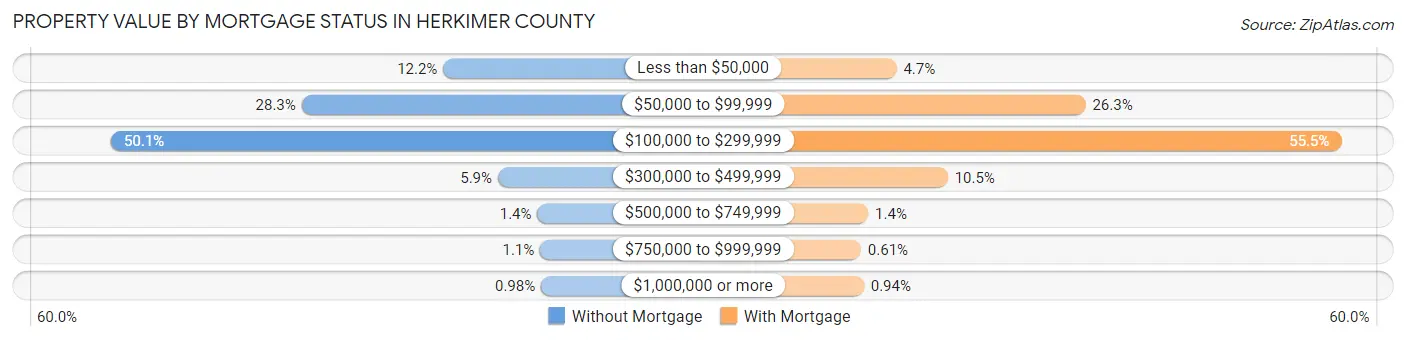
| Property Value | Without Mortgage | With Mortgage |
| Less than $50,000 | 1,139 (12.2%) | 439 (4.7%) |
| $50,000 to $99,999 | 2,655 (28.3%) | 2,464 (26.3%) |
| $100,000 to $299,999 | 4,697 (50.1%) | 5,205 (55.5%) |
| $300,000 to $499,999 | 554 (5.9%) | 987 (10.5%) |
| $500,000 to $749,999 | 131 (1.4%) | 135 (1.4%) |
| $750,000 to $999,999 | 101 (1.1%) | 57 (0.6%) |
| $1,000,000 or more | 92 (1.0%) | 88 (0.9%) |
| Total | 9,369 (100.0%) | 9,375 (100.0%) |
Household Income by Mortgage Status in Herkimer County
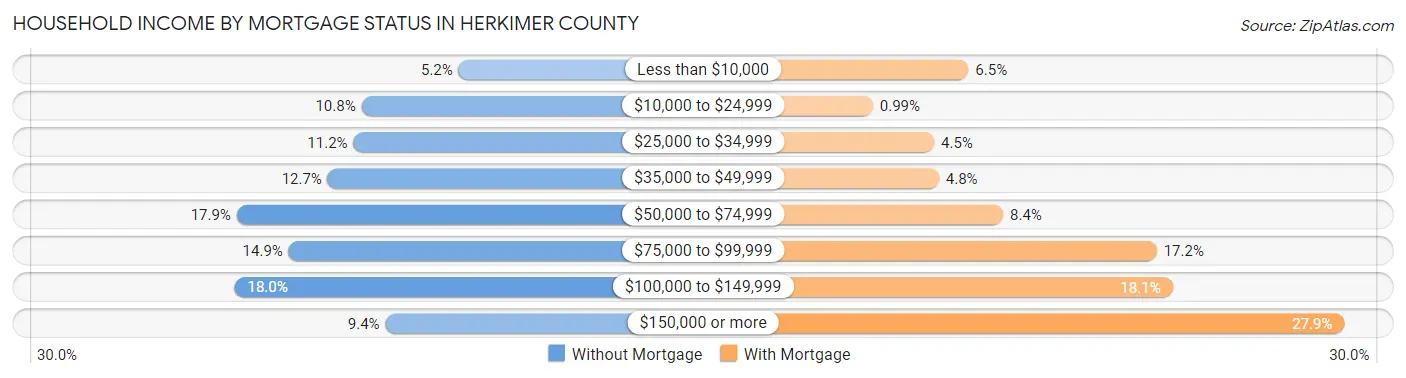
| Household Income | Without Mortgage | With Mortgage |
| Less than $10,000 | 487 (5.2%) | 605 (6.5%) |
| $10,000 to $24,999 | 1,007 (10.7%) | 93 (1.0%) |
| $25,000 to $34,999 | 1,050 (11.2%) | 421 (4.5%) |
| $35,000 to $49,999 | 1,188 (12.7%) | 446 (4.8%) |
| $50,000 to $74,999 | 1,675 (17.9%) | 790 (8.4%) |
| $75,000 to $99,999 | 1,397 (14.9%) | 1,613 (17.2%) |
| $100,000 to $149,999 | 1,686 (18.0%) | 1,698 (18.1%) |
| $150,000 or more | 879 (9.4%) | 2,618 (27.9%) |
| Total | 9,369 (100.0%) | 9,375 (100.0%) |
Property Value to Household Income Ratio in Herkimer County
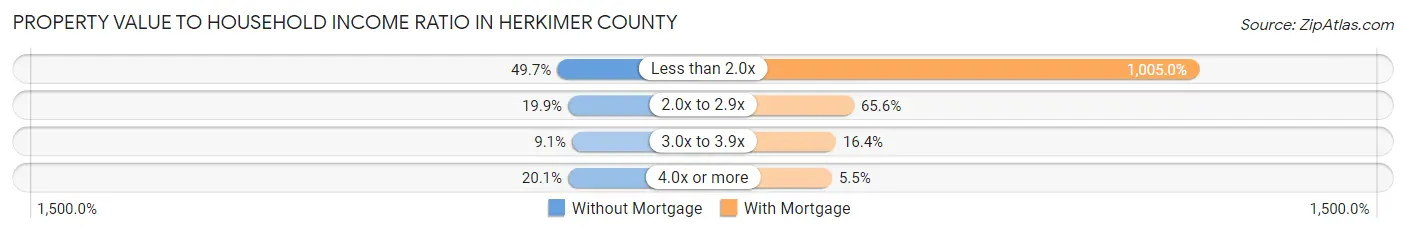
| Value-to-Income Ratio | Without Mortgage | With Mortgage |
| Less than 2.0x | 4,660 (49.7%) | 94,216 (1,005.0%) |
| 2.0x to 2.9x | 1,860 (19.9%) | 6,149 (65.6%) |
| 3.0x to 3.9x | 855 (9.1%) | 1,538 (16.4%) |
| 4.0x or more | 1,879 (20.1%) | 515 (5.5%) |
| Total | 9,369 (100.0%) | 9,375 (100.0%) |
Real Estate Taxes by Mortgage Status in Herkimer County
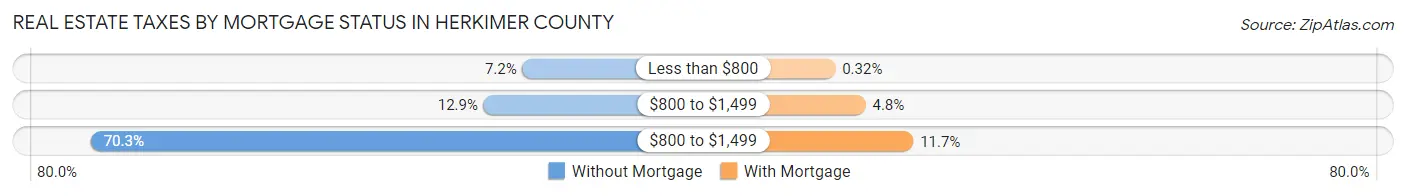
| Property Taxes | Without Mortgage | With Mortgage |
| Less than $800 | 678 (7.2%) | 30 (0.3%) |
| $800 to $1,499 | 1,209 (12.9%) | 445 (4.8%) |
| $800 to $1,499 | 6,589 (70.3%) | 1,098 (11.7%) |
| Total | 9,369 (100.0%) | 9,375 (100.0%) |
Health & Disability in Herkimer County
Health Insurance Coverage by Age in Herkimer County
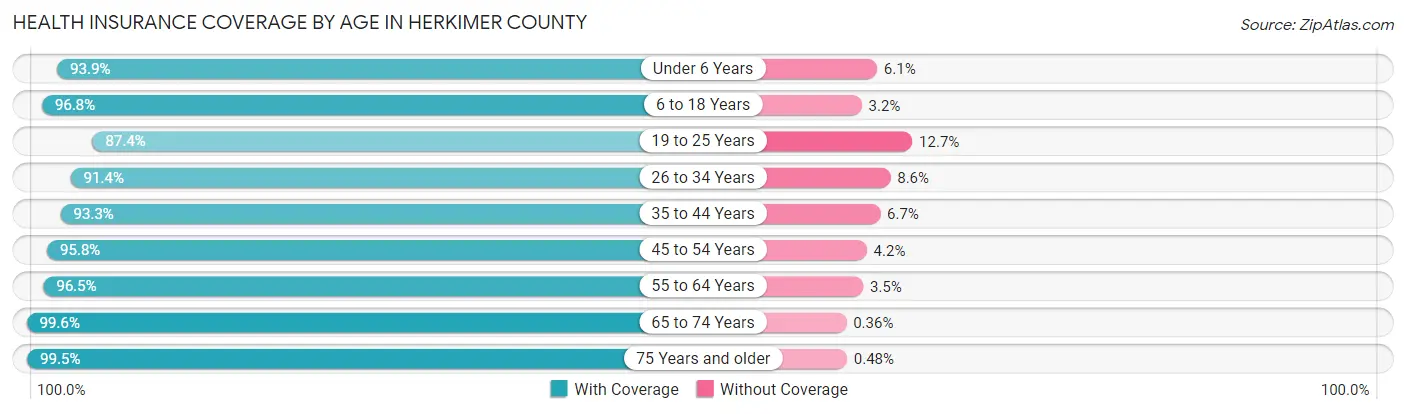
| Age Bracket | With Coverage | Without Coverage |
| Under 6 Years | 3,432 (93.9%) | 222 (6.1%) |
| 6 to 18 Years | 9,087 (96.8%) | 302 (3.2%) |
| 19 to 25 Years | 4,359 (87.4%) | 631 (12.7%) |
| 26 to 34 Years | 5,274 (91.4%) | 495 (8.6%) |
| 35 to 44 Years | 6,233 (93.3%) | 446 (6.7%) |
| 45 to 54 Years | 7,254 (95.8%) | 316 (4.2%) |
| 55 to 64 Years | 8,950 (96.5%) | 325 (3.5%) |
| 65 to 74 Years | 7,461 (99.6%) | 27 (0.4%) |
| 75 Years and older | 4,937 (99.5%) | 24 (0.5%) |
| Total | 56,987 (95.3%) | 2,788 (4.7%) |
Health Insurance Coverage by Citizenship Status in Herkimer County
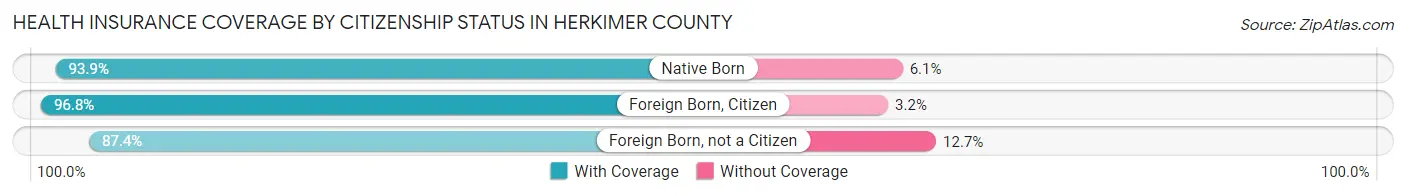
| Citizenship Status | With Coverage | Without Coverage |
| Native Born | 3,432 (93.9%) | 222 (6.1%) |
| Foreign Born, Citizen | 9,087 (96.8%) | 302 (3.2%) |
| Foreign Born, not a Citizen | 4,359 (87.4%) | 631 (12.7%) |
Health Insurance Coverage by Household Income in Herkimer County
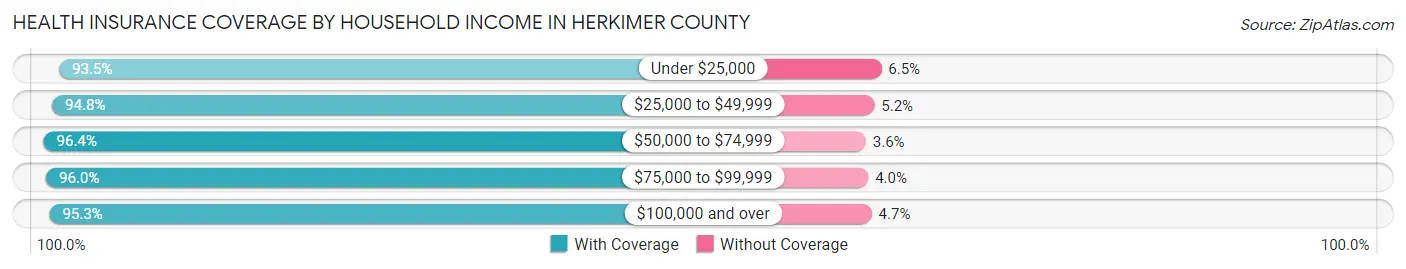
| Household Income | With Coverage | Without Coverage |
| Under $25,000 | 6,011 (93.5%) | 416 (6.5%) |
| $25,000 to $49,999 | 9,527 (94.8%) | 519 (5.2%) |
| $50,000 to $74,999 | 8,755 (96.4%) | 324 (3.6%) |
| $75,000 to $99,999 | 9,770 (96.0%) | 409 (4.0%) |
| $100,000 and over | 22,203 (95.3%) | 1,085 (4.7%) |
Public vs Private Health Insurance Coverage by Age in Herkimer County
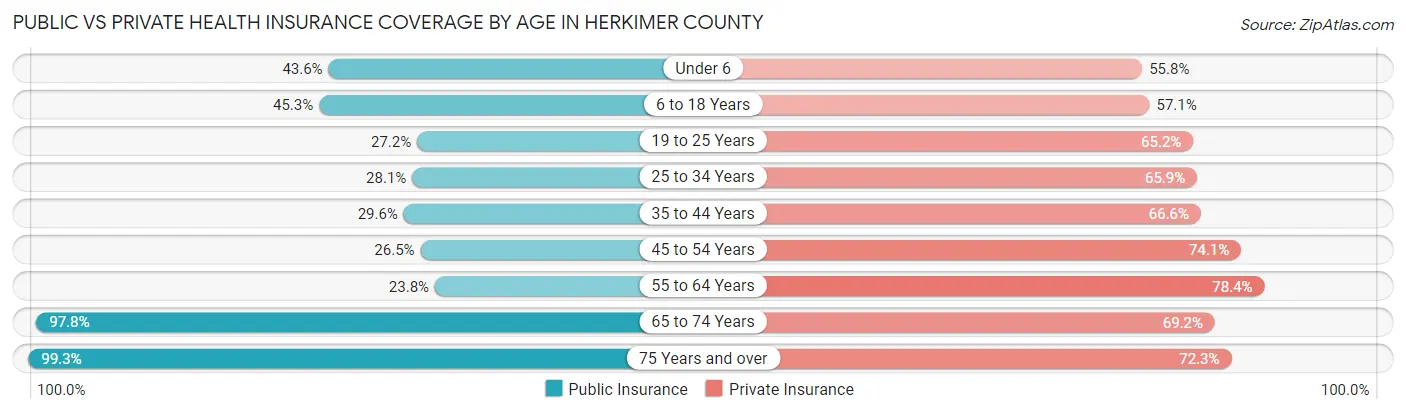
| Age Bracket | Public Insurance | Private Insurance |
| Under 6 | 1,593 (43.6%) | 2,038 (55.8%) |
| 6 to 18 Years | 4,257 (45.3%) | 5,364 (57.1%) |
| 19 to 25 Years | 1,355 (27.2%) | 3,254 (65.2%) |
| 25 to 34 Years | 1,619 (28.1%) | 3,804 (65.9%) |
| 35 to 44 Years | 1,979 (29.6%) | 4,451 (66.6%) |
| 45 to 54 Years | 2,008 (26.5%) | 5,610 (74.1%) |
| 55 to 64 Years | 2,211 (23.8%) | 7,275 (78.4%) |
| 65 to 74 Years | 7,325 (97.8%) | 5,185 (69.2%) |
| 75 Years and over | 4,927 (99.3%) | 3,587 (72.3%) |
| Total | 27,274 (45.6%) | 40,568 (67.9%) |
Disability Status by Sex by Age in Herkimer County
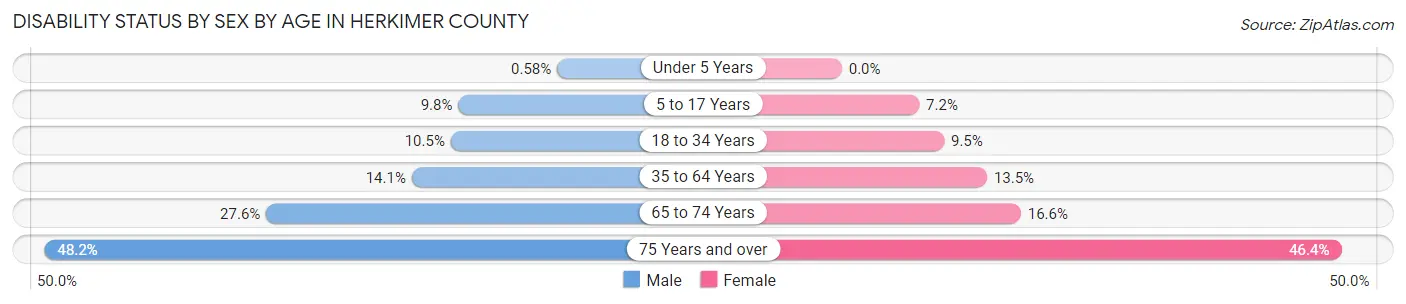
| Age Bracket | Male | Female |
| Under 5 Years | 9 (0.6%) | 0 (0.0%) |
| 5 to 17 Years | 469 (9.8%) | 330 (7.2%) |
| 18 to 34 Years | 619 (10.4%) | 526 (9.5%) |
| 35 to 64 Years | 1,678 (14.1%) | 1,562 (13.5%) |
| 65 to 74 Years | 1,016 (27.6%) | 632 (16.6%) |
| 75 Years and over | 1,031 (48.2%) | 1,307 (46.4%) |
Disability Class by Sex by Age in Herkimer County
Disability Class: Hearing Difficulty
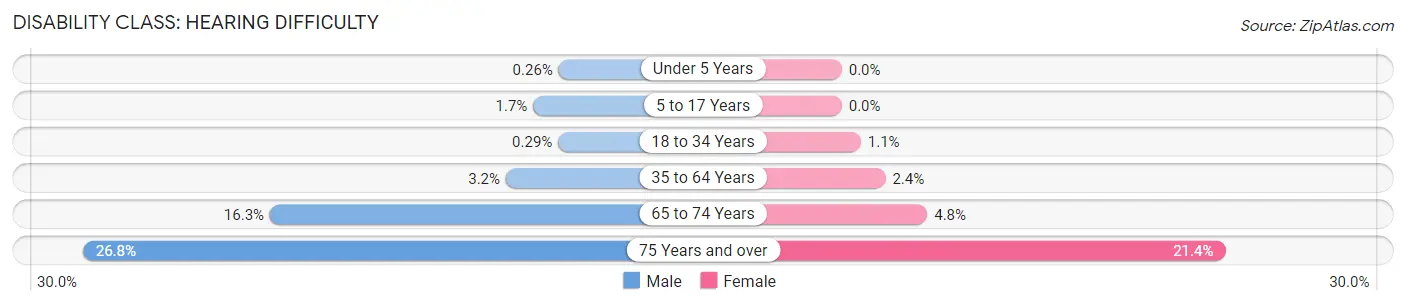
| Age Bracket | Male | Female |
| Under 5 Years | 4 (0.3%) | 0 (0.0%) |
| 5 to 17 Years | 81 (1.7%) | 0 (0.0%) |
| 18 to 34 Years | 17 (0.3%) | 59 (1.1%) |
| 35 to 64 Years | 382 (3.2%) | 282 (2.4%) |
| 65 to 74 Years | 602 (16.3%) | 181 (4.8%) |
| 75 Years and over | 573 (26.8%) | 602 (21.3%) |
Disability Class: Vision Difficulty
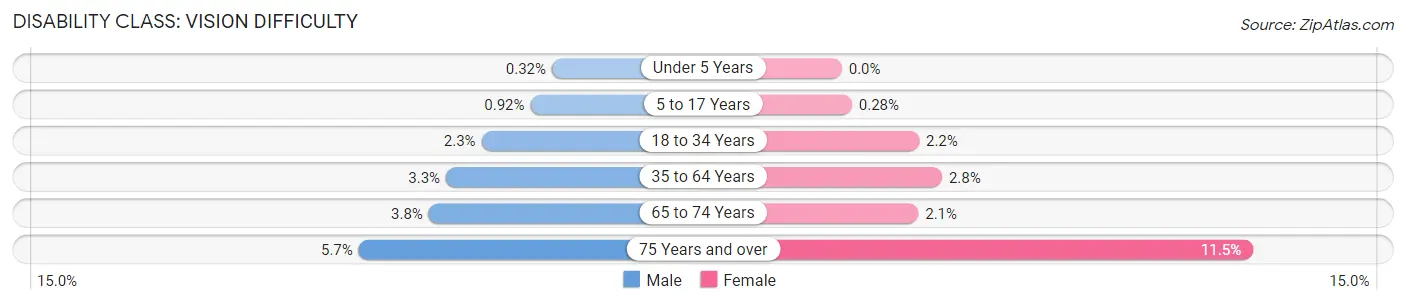
| Age Bracket | Male | Female |
| Under 5 Years | 5 (0.3%) | 0 (0.0%) |
| 5 to 17 Years | 44 (0.9%) | 13 (0.3%) |
| 18 to 34 Years | 135 (2.3%) | 119 (2.1%) |
| 35 to 64 Years | 390 (3.3%) | 324 (2.8%) |
| 65 to 74 Years | 138 (3.7%) | 81 (2.1%) |
| 75 Years and over | 122 (5.7%) | 323 (11.5%) |
Disability Class: Cognitive Difficulty
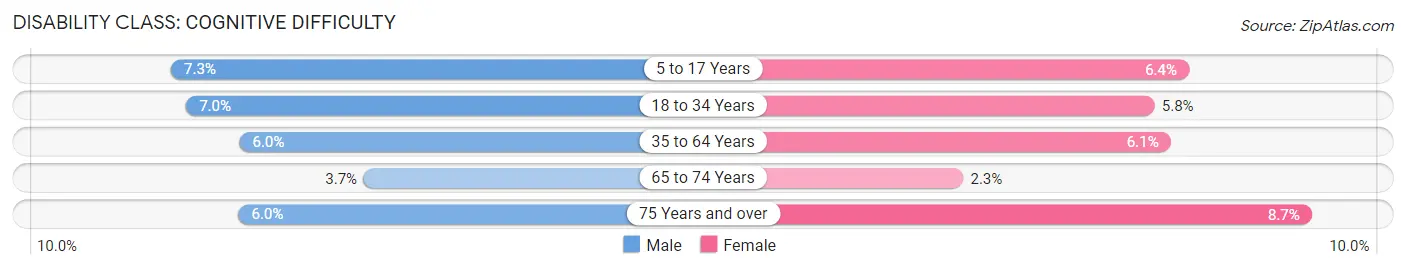
| Age Bracket | Male | Female |
| 5 to 17 Years | 350 (7.3%) | 296 (6.4%) |
| 18 to 34 Years | 415 (7.0%) | 322 (5.8%) |
| 35 to 64 Years | 717 (6.0%) | 708 (6.1%) |
| 65 to 74 Years | 137 (3.7%) | 86 (2.3%) |
| 75 Years and over | 129 (6.0%) | 246 (8.7%) |
Disability Class: Ambulatory Difficulty
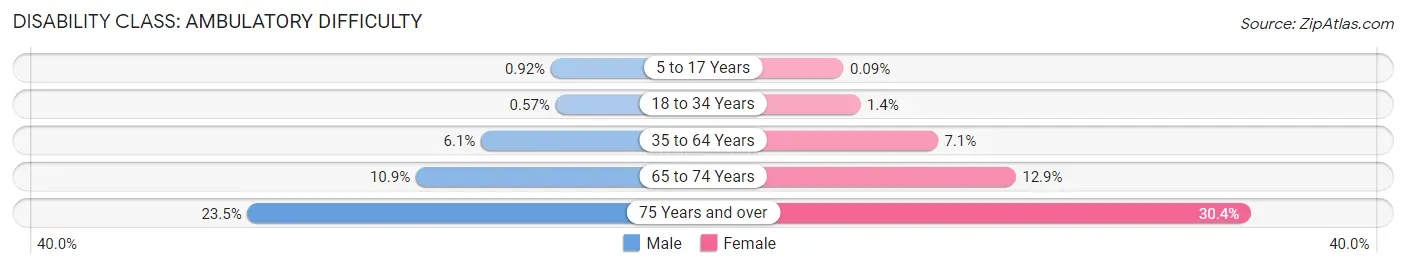
| Age Bracket | Male | Female |
| 5 to 17 Years | 44 (0.9%) | 4 (0.1%) |
| 18 to 34 Years | 34 (0.6%) | 75 (1.3%) |
| 35 to 64 Years | 728 (6.1%) | 824 (7.1%) |
| 65 to 74 Years | 403 (10.9%) | 490 (12.9%) |
| 75 Years and over | 502 (23.4%) | 857 (30.4%) |
Disability Class: Self-Care Difficulty
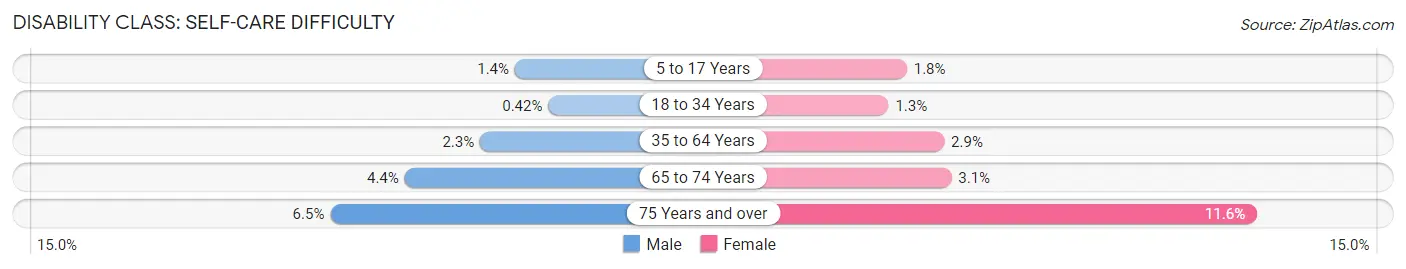
| Age Bracket | Male | Female |
| 5 to 17 Years | 65 (1.3%) | 83 (1.8%) |
| 18 to 34 Years | 25 (0.4%) | 72 (1.3%) |
| 35 to 64 Years | 277 (2.3%) | 330 (2.9%) |
| 65 to 74 Years | 163 (4.4%) | 116 (3.0%) |
| 75 Years and over | 139 (6.5%) | 326 (11.6%) |
Technology Access in Herkimer County
Computing Device Access in Herkimer County
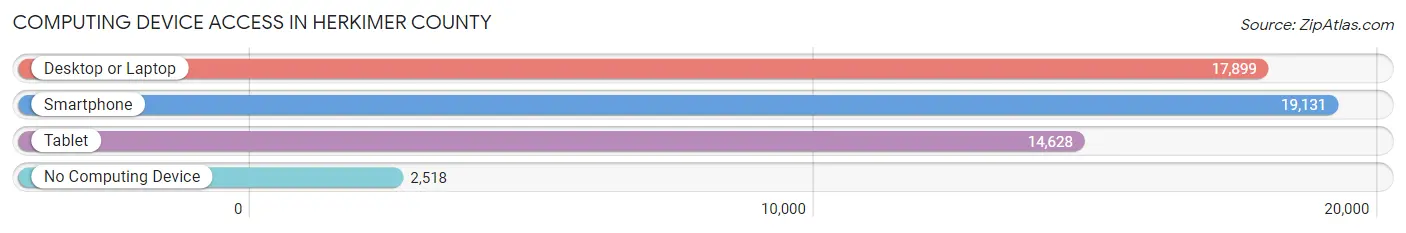
| Device Type | # Households | % Households |
| Desktop or Laptop | 17,899 | 72.6% |
| Smartphone | 19,131 | 77.6% |
| Tablet | 14,628 | 59.3% |
| No Computing Device | 2,518 | 10.2% |
| Total | 24,664 | 100.0% |
Internet Access in Herkimer County
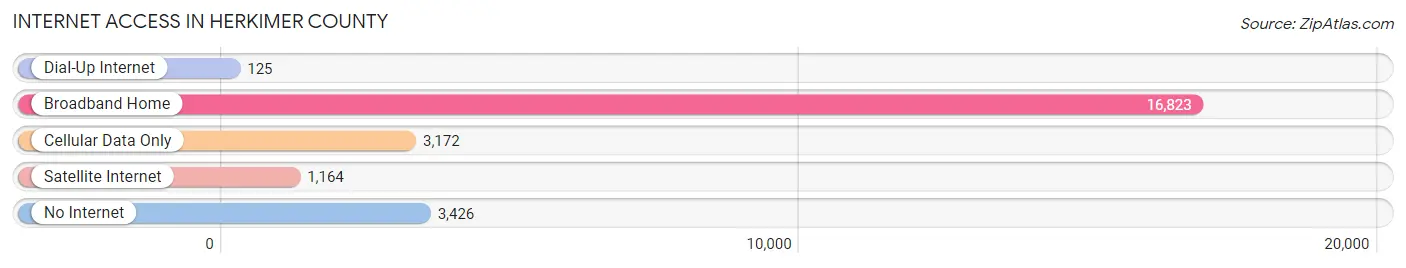
| Internet Type | # Households | % Households |
| Dial-Up Internet | 125 | 0.5% |
| Broadband Home | 16,823 | 68.2% |
| Cellular Data Only | 3,172 | 12.9% |
| Satellite Internet | 1,164 | 4.7% |
| No Internet | 3,426 | 13.9% |
| Total | 24,664 | 100.0% |
Herkimer County Summary
Herkimer County is located in the Mohawk Valley region of New York State. It is bordered by Oneida County to the north, Montgomery County to the east, Otsego County to the south, and Fulton County to the west. The county seat is the village of Herkimer. The county was established in 1791 and is named after Nicholas Herkimer, a hero of the American Revolution.
Geography
Herkimer County covers an area of 837 square miles and is located in the Appalachian Plateau region of New York State. The terrain is mostly hilly and forested, with the highest point being the summit of Bald Mountain at 2,845 feet. The county is drained by the Mohawk River and its tributaries, including the West Canada Creek, East Canada Creek, and Black River. The county is home to several state parks, including the Adirondack Park, which is the largest park in the contiguous United States.
Demographics
As of the 2010 census, Herkimer County had a population of 64,519. The racial makeup of the county was 94.2% White, 2.3% Black or African American, 0.5% Native American, 0.7% Asian, 0.1% Pacific Islander, 1.2% from other races, and 1.1% from two or more races. Hispanic or Latino of any race were 3.3% of the population.
Economy
Herkimer County is home to a diverse economy. The county is home to several manufacturing companies, including Remington Arms, which produces firearms, and Herkimer Diamond Mines, which produces gemstones. Agriculture is also an important part of the economy, with dairy farming being the most common type of farming. Tourism is also an important part of the economy, with the Adirondack Park being a popular destination for outdoor recreation.
History
Herkimer County was established in 1791 and is named after Nicholas Herkimer, a hero of the American Revolution. The county was originally part of Montgomery County, but was split off in 1791. The county was home to several Native American tribes, including the Mohawk, Oneida, and Onondaga. The first European settlers arrived in the area in the late 17th century.
During the American Revolution, Herkimer County was the site of several battles, including the Battle of Oriskany in 1777. The county was also home to several forts, including Fort Herkimer, which was built in 1756.
In the 19th century, Herkimer County was an important center of industry, with several mills and factories being built in the area. The county was also home to several railroads, which helped to spur economic growth.
In the 20th century, Herkimer County continued to be an important center of industry, with several manufacturing companies setting up shop in the area. The county was also home to several military bases, including the former Griffiss Air Force Base, which closed in 1995.
Today, Herkimer County is a vibrant and diverse community. The county is home to several state parks, including the Adirondack Park, which is the largest park in the contiguous United States. The county is also home to several manufacturing companies, including Remington Arms, which produces firearms, and Herkimer Diamond Mines, which produces gemstones. Agriculture is also an important part of the economy, with dairy farming being the most common type of farming. Tourism is also an important part of the economy, with the Adirondack Park being a popular destination for outdoor recreation.
Common Questions
What is Per Capita Income in Herkimer County?
Per Capita income in Herkimer County is $34,394.
What is the Median Family Income in Herkimer County?
Median Family Income in Herkimer County is $87,801.
What is the Median Household income in Herkimer County?
Median Household Income in Herkimer County is $68,104.
What is Income or Wage Gap in Herkimer County?
Income or Wage Gap in Herkimer County is 22.9%.
Women in Herkimer County earn 77.1 cents for every dollar earned by a man.
What is Family Income Deficit in Herkimer County?
Family Income Deficit in Herkimer County is $9,608.
Families that are below poverty line in Herkimer County earn $9,608 less on average than the poverty threshold level.
What is Inequality or Gini Index in Herkimer County?
Inequality or Gini Index in Herkimer County is 0.42.
What is the Total Population of Herkimer County?
Total Population of Herkimer County is 60,293.
What is the Total Male Population of Herkimer County?
Total Male Population of Herkimer County is 30,207.
What is the Total Female Population of Herkimer County?
Total Female Population of Herkimer County is 30,086.
What is the Ratio of Males per 100 Females in Herkimer County?
There are 100.40 Males per 100 Females in Herkimer County.
What is the Ratio of Females per 100 Males in Herkimer County?
There are 99.60 Females per 100 Males in Herkimer County.
What is the Median Population Age in Herkimer County?
Median Population Age in Herkimer County is 44.3 Years.
What is the Average Family Size in Herkimer County
Average Family Size in Herkimer County is 3.0 People.
What is the Average Household Size in Herkimer County
Average Household Size in Herkimer County is 2.4 People.
How Large is the Labor Force in Herkimer County?
There are 29,429 People in the Labor Forcein in Herkimer County.
What is the Percentage of People in the Labor Force in Herkimer County?
59.5% of People are in the Labor Force in Herkimer County.
What is the Unemployment Rate in Herkimer County?
Unemployment Rate in Herkimer County is 4.2%.