Greene County, NY Map & Demographics
Greene County Map
Greene County Overview
$38,587
PER CAPITA INCOME
$90,989
AVG FAMILY INCOME
$70,294
AVG HOUSEHOLD INCOME
27.3%
WAGE / INCOME GAP [ % ]
72.7¢/ $1
WAGE / INCOME GAP [ $ ]
$9,789
FAMILY INCOME DEFICIT
0.46
INEQUALITY / GINI INDEX
48,067
TOTAL POPULATION
24,926
MALE POPULATION
23,141
FEMALE POPULATION
107.71
MALES / 100 FEMALES
92.84
FEMALES / 100 MALES
47.0
MEDIAN AGE
3.2
AVG FAMILY SIZE
2.5
AVG HOUSEHOLD SIZE
22,581
LABOR FORCE [ PEOPLE ]
54.9%
PERCENT IN LABOR FORCE
2.8%
UNEMPLOYMENT RATE
Greene County Area Codes
Income in Greene County
Income Overview in Greene County
Per Capita Income in Greene County is $38,587, while median incomes of families and households are $90,989 and $70,294 respectively.
| Characteristic | Number | Measure |
| Per Capita Income | 48,067 | $38,587 |
| Median Family Income | 10,961 | $90,989 |
| Mean Family Income | 10,961 | $112,809 |
| Median Household Income | 17,903 | $70,294 |
| Mean Household Income | 17,903 | $93,719 |
| Income Deficit | 10,961 | $9,789 |
| Wage / Income Gap (%) | 48,067 | 27.29% |
| Wage / Income Gap ($) | 48,067 | 72.71¢ per $1 |
| Gini / Inequality Index | 48,067 | 0.46 |
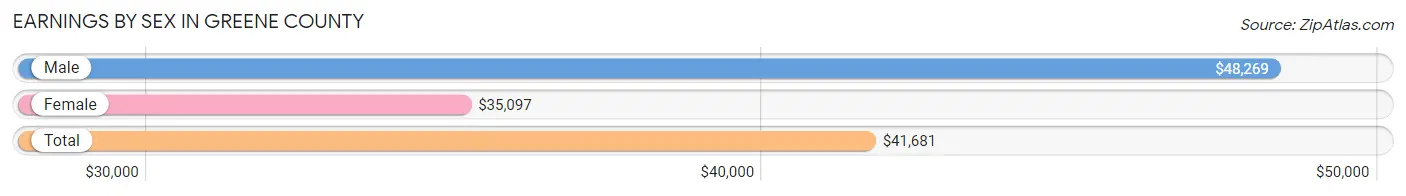
Earnings by Sex in Greene County
Average Earnings in Greene County are $41,681, $48,269 for men and $35,097 for women, a difference of 27.3%.
| Sex | Number | Average Earnings |
| Male | 12,488 (52.7%) | $48,269 |
| Female | 11,203 (47.3%) | $35,097 |
| Total | 23,691 (100.0%) | $41,681 |
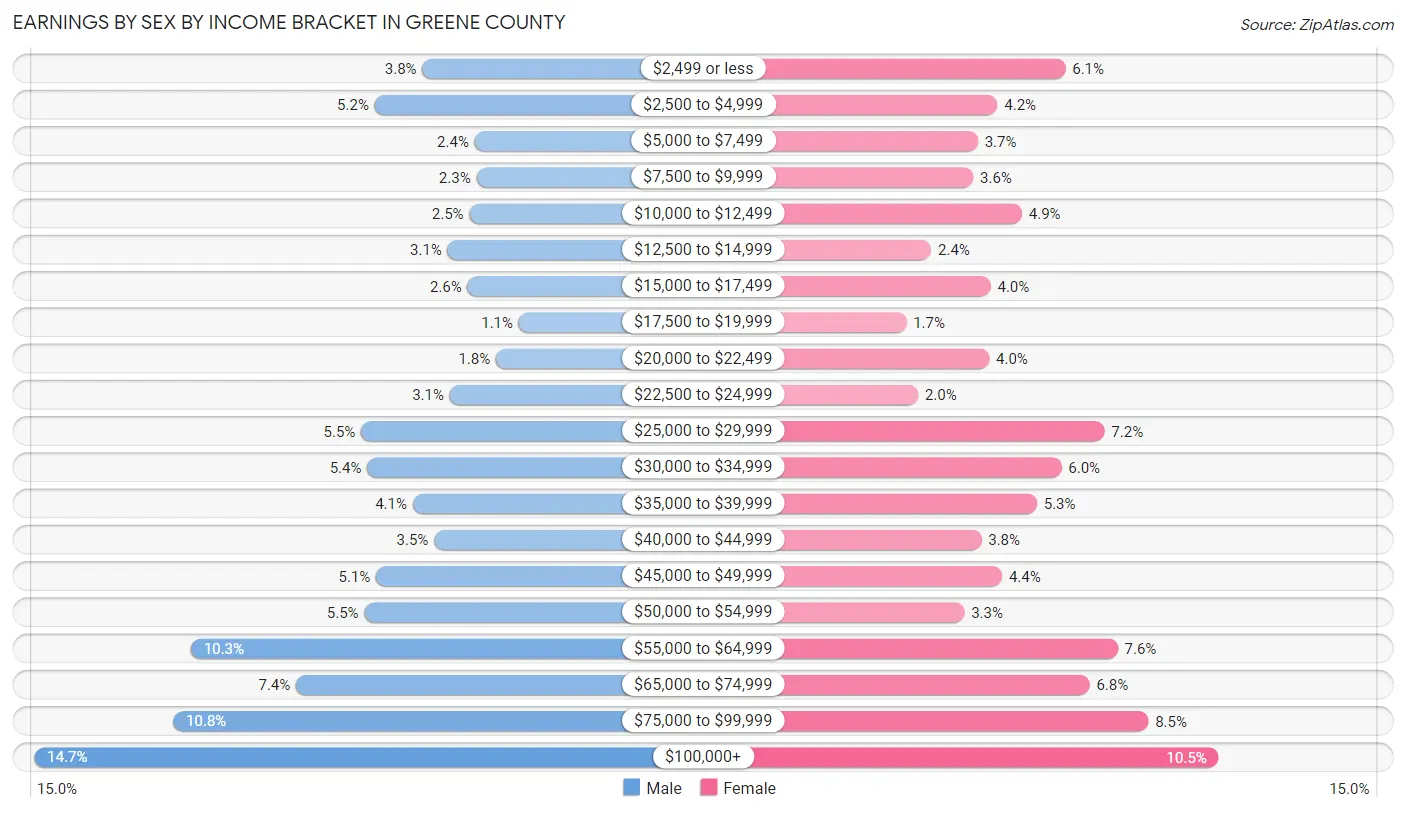
Earnings by Sex by Income Bracket in Greene County
The most common earnings brackets in Greene County are $100,000+ for men (1,839 | 14.7%) and $100,000+ for women (1,171 | 10.4%).
| Income | Male | Female |
| $2,499 or less | 477 (3.8%) | 688 (6.1%) |
| $2,500 to $4,999 | 644 (5.2%) | 474 (4.2%) |
| $5,000 to $7,499 | 293 (2.4%) | 412 (3.7%) |
| $7,500 to $9,999 | 287 (2.3%) | 398 (3.5%) |
| $10,000 to $12,499 | 312 (2.5%) | 551 (4.9%) |
| $12,500 to $14,999 | 389 (3.1%) | 265 (2.4%) |
| $15,000 to $17,499 | 319 (2.5%) | 453 (4.0%) |
| $17,500 to $19,999 | 138 (1.1%) | 187 (1.7%) |
| $20,000 to $22,499 | 218 (1.8%) | 448 (4.0%) |
| $22,500 to $24,999 | 381 (3.0%) | 224 (2.0%) |
| $25,000 to $29,999 | 692 (5.5%) | 811 (7.2%) |
| $30,000 to $34,999 | 670 (5.4%) | 676 (6.0%) |
| $35,000 to $39,999 | 511 (4.1%) | 598 (5.3%) |
| $40,000 to $44,999 | 436 (3.5%) | 423 (3.8%) |
| $45,000 to $49,999 | 639 (5.1%) | 488 (4.4%) |
| $50,000 to $54,999 | 680 (5.4%) | 370 (3.3%) |
| $55,000 to $64,999 | 1,290 (10.3%) | 853 (7.6%) |
| $65,000 to $74,999 | 920 (7.4%) | 764 (6.8%) |
| $75,000 to $99,999 | 1,353 (10.8%) | 949 (8.5%) |
| $100,000+ | 1,839 (14.7%) | 1,171 (10.4%) |
| Total | 12,488 (100.0%) | 11,203 (100.0%) |
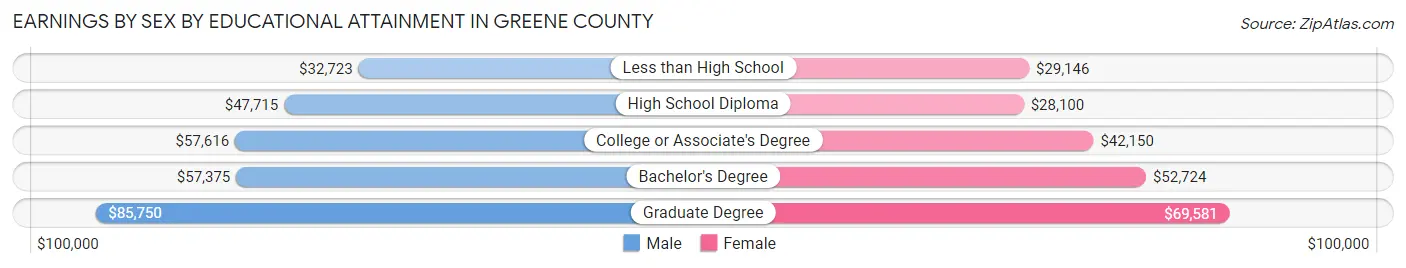
Earnings by Sex by Educational Attainment in Greene County
Average earnings in Greene County are $54,106 for men and $39,834 for women, a difference of 26.4%. Men with an educational attainment of graduate degree enjoy the highest average annual earnings of $85,750, while those with less than high school education earn the least with $32,723. Women with an educational attainment of graduate degree earn the most with the average annual earnings of $69,581, while those with high school diploma education have the smallest earnings of $28,100.
| Educational Attainment | Male Income | Female Income |
| Less than High School | $32,723 | $29,146 |
| High School Diploma | $47,715 | $28,100 |
| College or Associate's Degree | $57,616 | $42,150 |
| Bachelor's Degree | $57,375 | $52,724 |
| Graduate Degree | $85,750 | $69,581 |
| Total | $54,106 | $39,834 |
Family Income in Greene County
Family Income Brackets in Greene County
According to the Greene County family income data, there are 2,400 families falling into the $100,000 to $149,999 income range, which is the most common income bracket and makes up 21.9% of all families. Conversely, the $10,000 to $14,999 income bracket is the least frequent group with only 219 families (2.0%) belonging to this category.
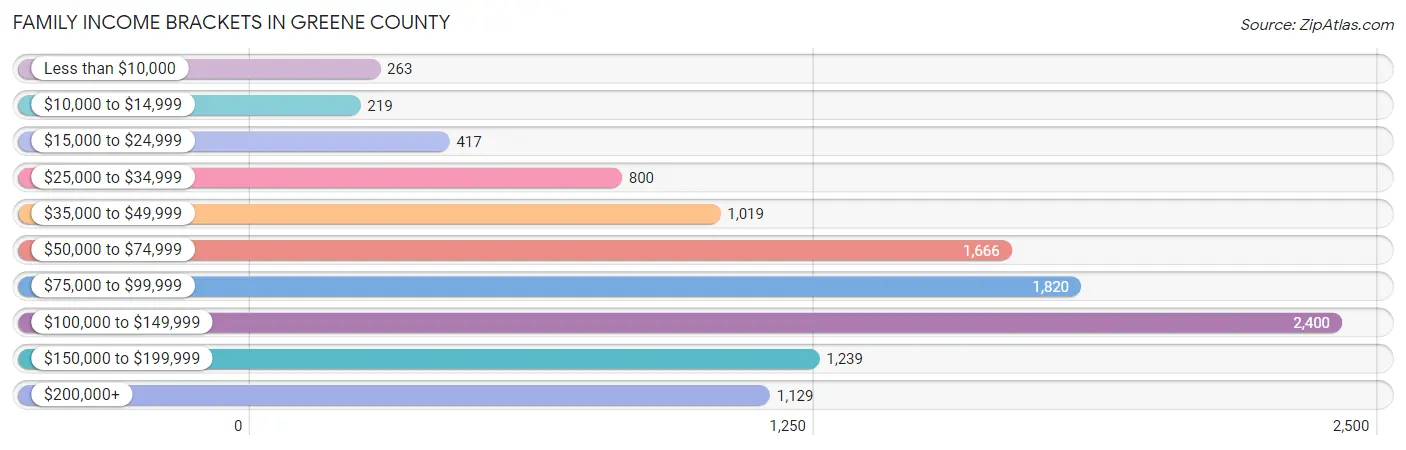
| Income Bracket | # Families | % Families |
| Less than $10,000 | 263 | 2.4% |
| $10,000 to $14,999 | 219 | 2.0% |
| $15,000 to $24,999 | 417 | 3.8% |
| $25,000 to $34,999 | 800 | 7.3% |
| $35,000 to $49,999 | 1,019 | 9.3% |
| $50,000 to $74,999 | 1,666 | 15.2% |
| $75,000 to $99,999 | 1,820 | 16.6% |
| $100,000 to $149,999 | 2,400 | 21.9% |
| $150,000 to $199,999 | 1,239 | 11.3% |
| $200,000+ | 1,129 | 10.3% |
Family Income by Famaliy Size in Greene County
7+ person families (213 | 1.9%) account for the highest median family income in Greene County with $104,918 per family, while 2-person families (6,302 | 57.5%) have the highest median income of $43,624 per family member.
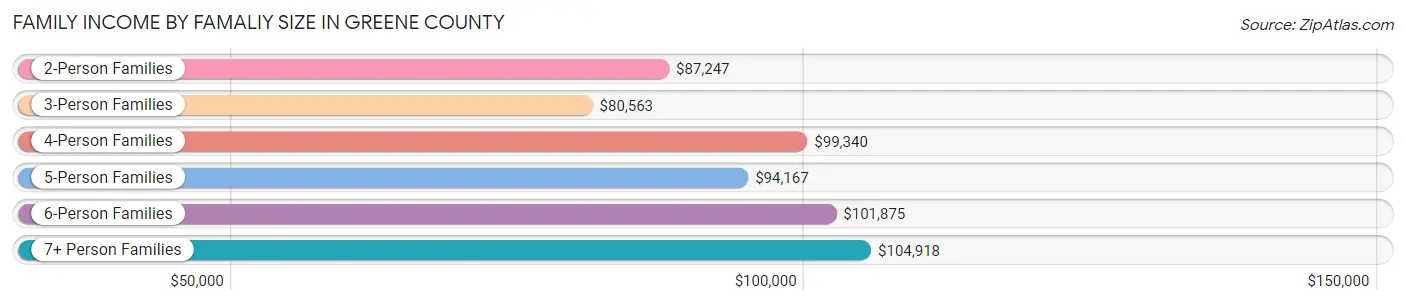
| Income Bracket | # Families | Median Income |
| 2-Person Families | 6,302 (57.5%) | $87,247 |
| 3-Person Families | 2,254 (20.6%) | $80,563 |
| 4-Person Families | 1,405 (12.8%) | $99,340 |
| 5-Person Families | 516 (4.7%) | $94,167 |
| 6-Person Families | 271 (2.5%) | $101,875 |
| 7+ Person Families | 213 (1.9%) | $104,918 |
| Total | 10,961 (100.0%) | $90,989 |
Family Income by Number of Earners in Greene County
The median family income in Greene County is $90,989, with families comprising 3+ earners (1,053) having the highest median family income of $136,250, while families with no earners (2,145) have the lowest median family income of $54,656, accounting for 9.6% and 19.6% of families, respectively.
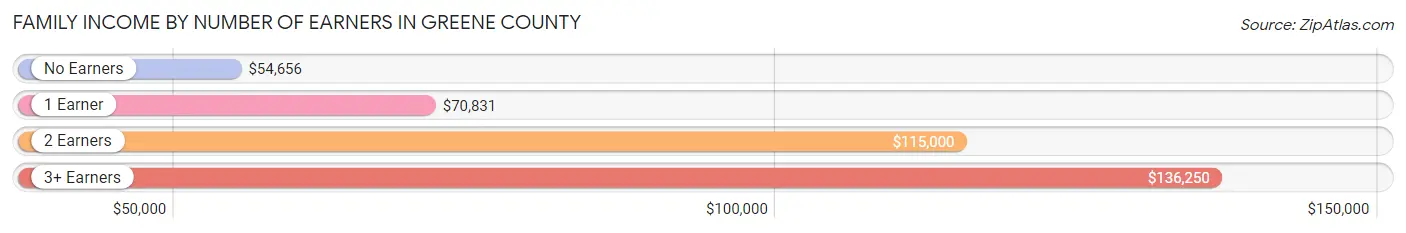
| Number of Earners | # Families | Median Income |
| No Earners | 2,145 (19.6%) | $54,656 |
| 1 Earner | 3,489 (31.8%) | $70,831 |
| 2 Earners | 4,274 (39.0%) | $115,000 |
| 3+ Earners | 1,053 (9.6%) | $136,250 |
| Total | 10,961 (100.0%) | $90,989 |
Household Income in Greene County
Household Income Brackets in Greene County
With 2,864 households falling in the category, the $50,000 to $74,999 income range is the most frequent in Greene County, accounting for 16.0% of all households. In contrast, only 734 households (4.1%) fall into the $10,000 to $14,999 income bracket, making it the least populous group.
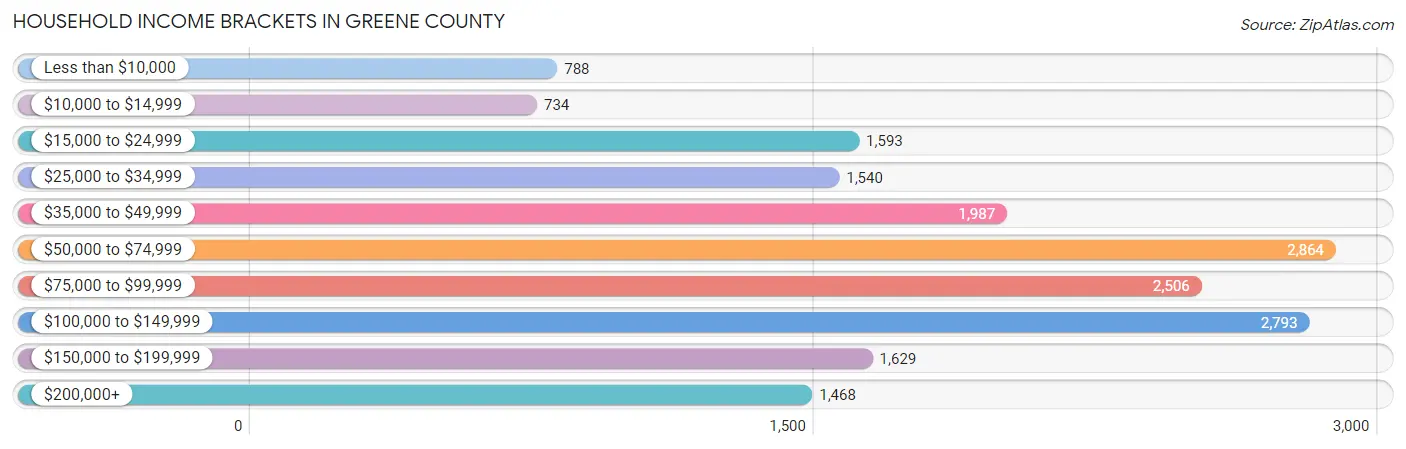
| Income Bracket | # Households | % Households |
| Less than $10,000 | 788 | 4.4% |
| $10,000 to $14,999 | 734 | 4.1% |
| $15,000 to $24,999 | 1,593 | 8.9% |
| $25,000 to $34,999 | 1,540 | 8.6% |
| $35,000 to $49,999 | 1,987 | 11.1% |
| $50,000 to $74,999 | 2,864 | 16.0% |
| $75,000 to $99,999 | 2,506 | 14.0% |
| $100,000 to $149,999 | 2,793 | 15.6% |
| $150,000 to $199,999 | 1,629 | 9.1% |
| $200,000+ | 1,468 | 8.2% |
Household Income by Householder Age in Greene County
The median household income in Greene County is $70,294, with the highest median household income of $87,014 found in the 25 to 44 years age bracket for the primary householder. A total of 3,836 households (21.4%) fall into this category. Meanwhile, the 65+ years age bracket for the primary householder has the lowest median household income of $47,390, with 6,720 households (37.5%) in this group.
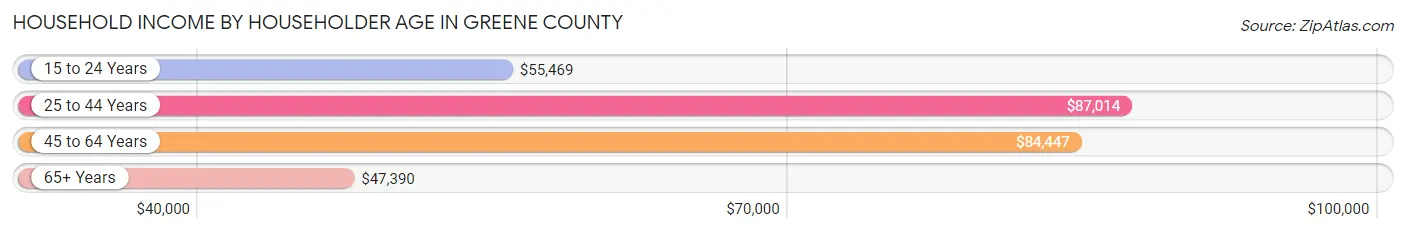
| Income Bracket | # Households | Median Income |
| 15 to 24 Years | 232 (1.3%) | $55,469 |
| 25 to 44 Years | 3,836 (21.4%) | $87,014 |
| 45 to 64 Years | 7,115 (39.7%) | $84,447 |
| 65+ Years | 6,720 (37.5%) | $47,390 |
| Total | 17,903 (100.0%) | $70,294 |
Poverty in Greene County
Income Below Poverty by Sex and Age in Greene County
With 8.8% poverty level for males and 12.0% for females among the residents of Greene County, 16 and 17 year old males and 5 year old females are the most vulnerable to poverty, with 102 males (22.9%) and 67 females (35.6%) in their respective age groups living below the poverty level.
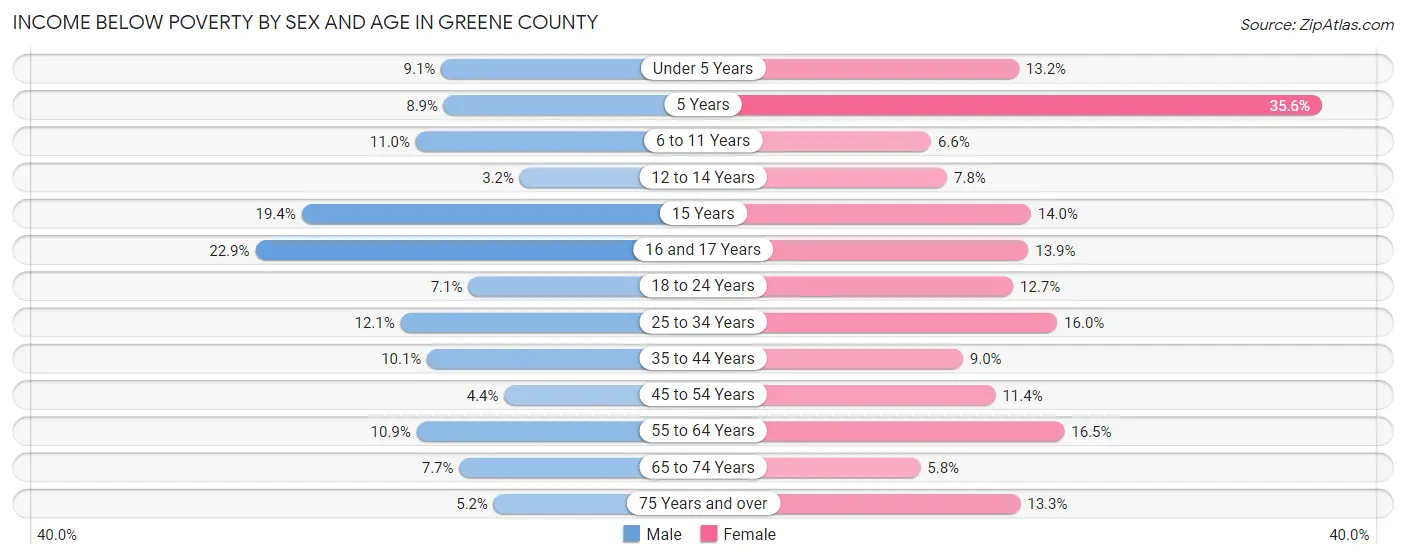
| Age Bracket | Male | Female |
| Under 5 Years | 90 (9.1%) | 129 (13.2%) |
| 5 Years | 11 (8.9%) | 67 (35.6%) |
| 6 to 11 Years | 108 (11.0%) | 67 (6.6%) |
| 12 to 14 Years | 27 (3.2%) | 55 (7.8%) |
| 15 Years | 62 (19.4%) | 39 (14.0%) |
| 16 and 17 Years | 102 (22.9%) | 55 (13.9%) |
| 18 to 24 Years | 141 (7.1%) | 183 (12.7%) |
| 25 to 34 Years | 324 (12.1%) | 416 (16.0%) |
| 35 to 44 Years | 235 (10.1%) | 236 (9.0%) |
| 45 to 54 Years | 129 (4.4%) | 334 (11.4%) |
| 55 to 64 Years | 401 (10.9%) | 632 (16.5%) |
| 65 to 74 Years | 245 (7.7%) | 191 (5.8%) |
| 75 Years and over | 104 (5.2%) | 330 (13.3%) |
| Total | 1,979 (8.8%) | 2,734 (12.0%) |
Income Above Poverty by Sex and Age in Greene County
According to the poverty statistics in Greene County, males aged 12 to 14 years and females aged 65 to 74 years are the age groups that are most secure financially, with 96.8% of males and 94.2% of females in these age groups living above the poverty line.
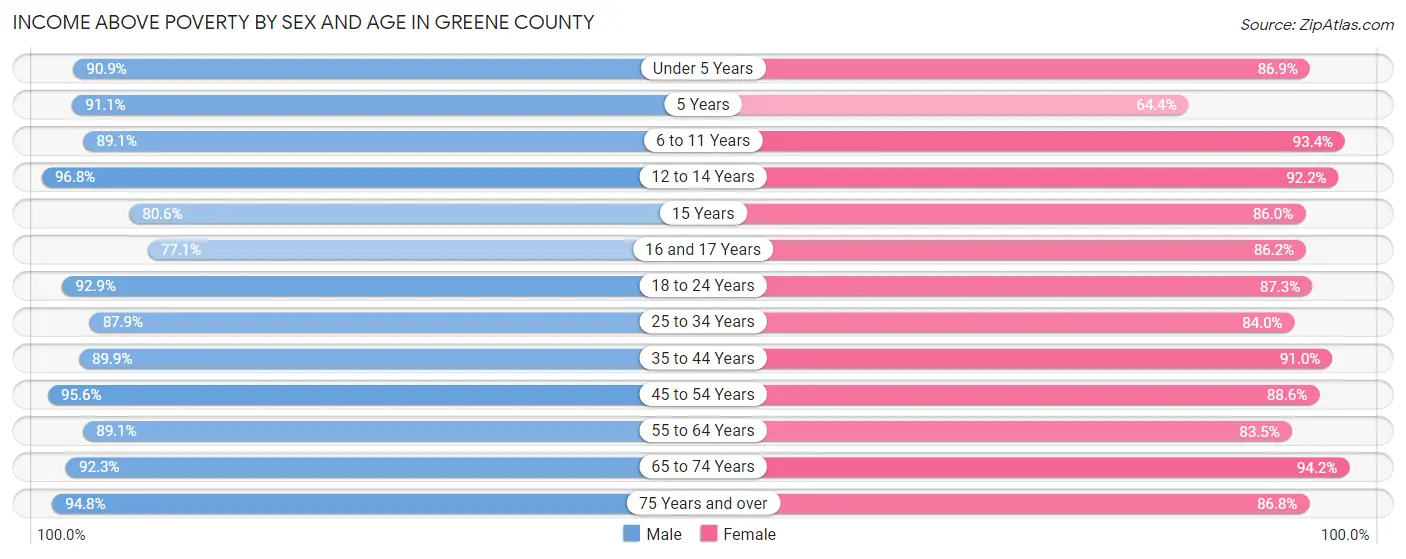
| Age Bracket | Male | Female |
| Under 5 Years | 902 (90.9%) | 852 (86.9%) |
| 5 Years | 113 (91.1%) | 121 (64.4%) |
| 6 to 11 Years | 878 (89.0%) | 945 (93.4%) |
| 12 to 14 Years | 810 (96.8%) | 648 (92.2%) |
| 15 Years | 257 (80.6%) | 239 (86.0%) |
| 16 and 17 Years | 344 (77.1%) | 342 (86.2%) |
| 18 to 24 Years | 1,856 (92.9%) | 1,256 (87.3%) |
| 25 to 34 Years | 2,355 (87.9%) | 2,185 (84.0%) |
| 35 to 44 Years | 2,090 (89.9%) | 2,389 (91.0%) |
| 45 to 54 Years | 2,817 (95.6%) | 2,593 (88.6%) |
| 55 to 64 Years | 3,277 (89.1%) | 3,194 (83.5%) |
| 65 to 74 Years | 2,928 (92.3%) | 3,083 (94.2%) |
| 75 Years and over | 1,912 (94.8%) | 2,161 (86.8%) |
| Total | 20,539 (91.2%) | 20,008 (88.0%) |
Income Below Poverty Among Married-Couple Families in Greene County
The poverty statistics for married-couple families in Greene County show that 2.9% or 247 of the total 8,650 families live below the poverty line. Families with 3 or 4 children have the highest poverty rate of 4.8%, comprising of 21 families. On the other hand, families with 5 or more children have the lowest poverty rate of 0.0%, which includes 0 families.
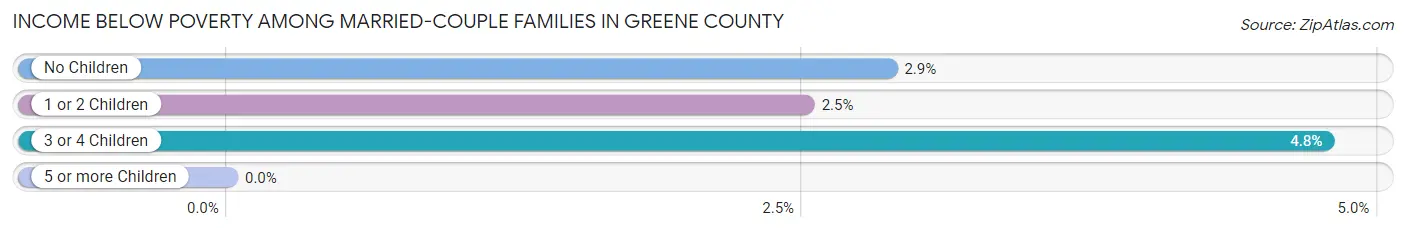
| Children | Above Poverty | Below Poverty |
| No Children | 5,794 (97.1%) | 171 (2.9%) |
| 1 or 2 Children | 2,139 (97.5%) | 55 (2.5%) |
| 3 or 4 Children | 419 (95.2%) | 21 (4.8%) |
| 5 or more Children | 51 (100.0%) | 0 (0.0%) |
| Total | 8,403 (97.1%) | 247 (2.9%) |
Income Below Poverty Among Single-Parent Households in Greene County
According to the poverty data in Greene County, 18.2% or 154 single-father households and 22.9% or 336 single-mother households are living below the poverty line. Among single-father households, those with 3 or 4 children have the highest poverty rate, with 33 households (68.8%) experiencing poverty. Likewise, among single-mother households, those with 1 or 2 children have the highest poverty rate, with 230 households (35.5%) falling below the poverty line.
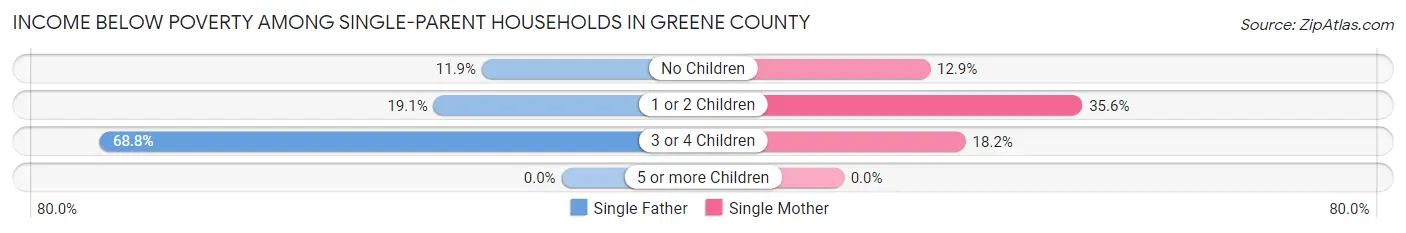
| Children | Single Father | Single Mother |
| No Children | 51 (11.9%) | 104 (12.9%) |
| 1 or 2 Children | 70 (19.1%) | 230 (35.5%) |
| 3 or 4 Children | 33 (68.8%) | 2 (18.2%) |
| 5 or more Children | 0 (0.0%) | 0 (0.0%) |
| Total | 154 (18.2%) | 336 (22.9%) |
Income Below Poverty Among Married-Couple vs Single-Parent Households in Greene County
The poverty data for Greene County shows that 247 of the married-couple family households (2.9%) and 490 of the single-parent households (21.2%) are living below the poverty level. Within the married-couple family households, those with 3 or 4 children have the highest poverty rate, with 21 households (4.8%) falling below the poverty line. Among the single-parent households, those with 3 or 4 children have the highest poverty rate, with 35 household (59.3%) living below poverty.
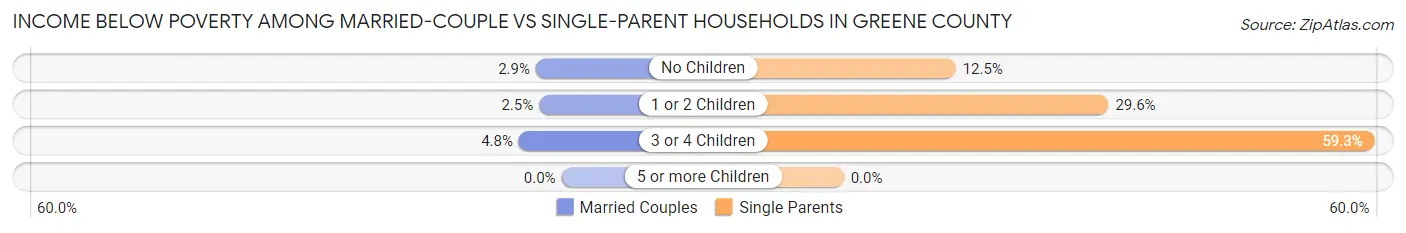
| Children | Married-Couple Families | Single-Parent Households |
| No Children | 171 (2.9%) | 155 (12.5%) |
| 1 or 2 Children | 55 (2.5%) | 300 (29.6%) |
| 3 or 4 Children | 21 (4.8%) | 35 (59.3%) |
| 5 or more Children | 0 (0.0%) | 0 (0.0%) |
| Total | 247 (2.9%) | 490 (21.2%) |
Race in Greene County
The most populous races in Greene County are White / Caucasian (41,433 | 86.2%), Hispanic or Latino (3,137 | 6.5%), and Black / African American (2,515 | 5.2%).
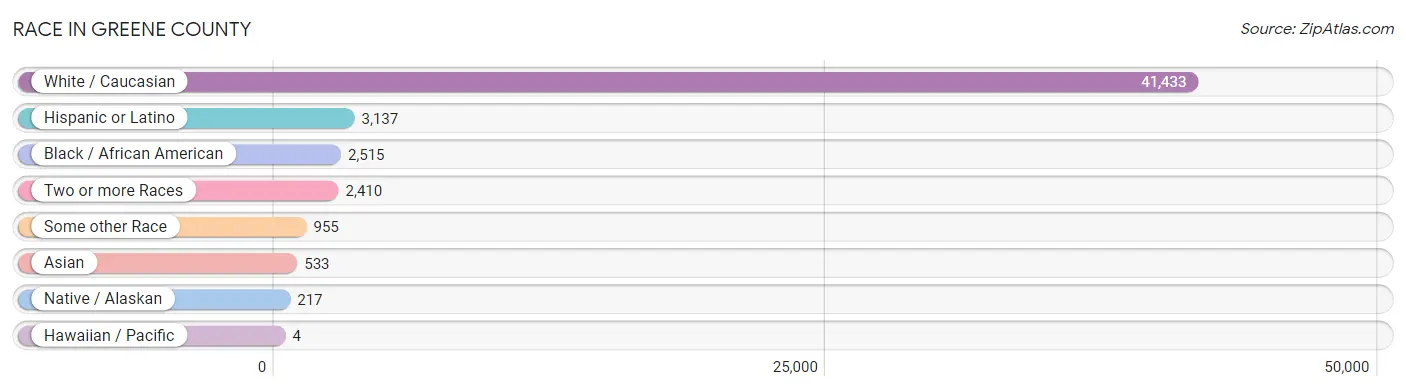
| Race | # Population | % Population |
| Asian | 533 | 1.1% |
| Black / African American | 2,515 | 5.2% |
| Hawaiian / Pacific | 4 | 0.0% |
| Hispanic or Latino | 3,137 | 6.5% |
| Native / Alaskan | 217 | 0.4% |
| White / Caucasian | 41,433 | 86.2% |
| Two or more Races | 2,410 | 5.0% |
| Some other Race | 955 | 2.0% |
| Total | 48,067 | 100.0% |
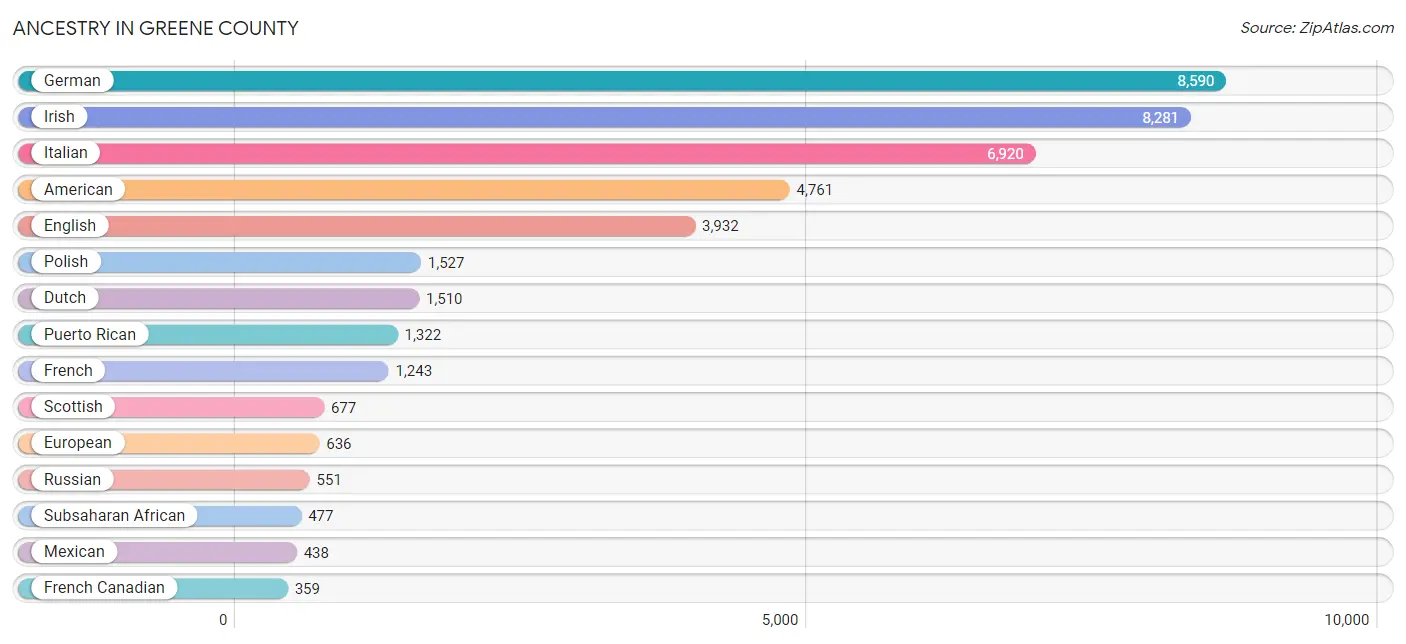
Ancestry in Greene County
The most populous ancestries reported in Greene County are German (8,590 | 17.9%), Irish (8,281 | 17.2%), Italian (6,920 | 14.4%), American (4,761 | 9.9%), and English (3,932 | 8.2%), together accounting for 67.6% of all Greene County residents.
| Ancestry | # Population | % Population |
| African | 242 | 0.5% |
| Albanian | 44 | 0.1% |
| American | 4,761 | 9.9% |
| Arab | 51 | 0.1% |
| Argentinean | 18 | 0.0% |
| Armenian | 110 | 0.2% |
| Austrian | 152 | 0.3% |
| Basque | 25 | 0.1% |
| Belgian | 22 | 0.1% |
| Bhutanese | 115 | 0.2% |
| Blackfeet | 24 | 0.1% |
| Bolivian | 29 | 0.1% |
| British | 208 | 0.4% |
| British West Indian | 2 | 0.0% |
| Burmese | 35 | 0.1% |
| Cajun | 35 | 0.1% |
| Canadian | 100 | 0.2% |
| Celtic | 11 | 0.0% |
| Central American | 295 | 0.6% |
| Cherokee | 83 | 0.2% |
| Chilean | 22 | 0.1% |
| Choctaw | 18 | 0.0% |
| Colombian | 76 | 0.2% |
| Croatian | 160 | 0.3% |
| Cuban | 145 | 0.3% |
| Czech | 221 | 0.5% |
| Czechoslovakian | 55 | 0.1% |
| Danish | 235 | 0.5% |
| Dominican | 210 | 0.4% |
| Dutch | 1,510 | 3.1% |
| Eastern European | 238 | 0.5% |
| Ecuadorian | 86 | 0.2% |
| Egyptian | 3 | 0.0% |
| English | 3,932 | 8.2% |
| Estonian | 3 | 0.0% |
| Ethiopian | 10 | 0.0% |
| European | 636 | 1.3% |
| Finnish | 46 | 0.1% |
| French | 1,243 | 2.6% |
| French American Indian | 60 | 0.1% |
| French Canadian | 359 | 0.7% |
| German | 8,590 | 17.9% |
| Ghanaian | 19 | 0.0% |
| Greek | 206 | 0.4% |
| Guamanian / Chamorro | 4 | 0.0% |
| Guyanese | 62 | 0.1% |
| Haitian | 61 | 0.1% |
| Honduran | 62 | 0.1% |
| Hungarian | 111 | 0.2% |
| Indian (Asian) | 166 | 0.4% |
| Iranian | 10 | 0.0% |
| Irish | 8,281 | 17.2% |
| Iroquois | 19 | 0.0% |
| Israeli | 4 | 0.0% |
| Italian | 6,920 | 14.4% |
| Jamaican | 20 | 0.0% |
| Japanese | 13 | 0.0% |
| Korean | 9 | 0.0% |
| Latvian | 106 | 0.2% |
| Lebanese | 29 | 0.1% |
| Lithuanian | 196 | 0.4% |
| Lumbee | 1 | 0.0% |
| Mexican | 438 | 0.9% |
| Nicaraguan | 10 | 0.0% |
| Nigerian | 206 | 0.4% |
| Northern European | 38 | 0.1% |
| Norwegian | 305 | 0.6% |
| Pakistani | 16 | 0.0% |
| Panamanian | 4 | 0.0% |
| Pennsylvania German | 4 | 0.0% |
| Peruvian | 40 | 0.1% |
| Polish | 1,527 | 3.2% |
| Portuguese | 37 | 0.1% |
| Puerto Rican | 1,322 | 2.8% |
| Romanian | 139 | 0.3% |
| Russian | 551 | 1.1% |
| Salvadoran | 219 | 0.5% |
| Scandinavian | 41 | 0.1% |
| Scotch-Irish | 235 | 0.5% |
| Scottish | 677 | 1.4% |
| Serbian | 13 | 0.0% |
| Slavic | 24 | 0.1% |
| Slovak | 247 | 0.5% |
| South American | 294 | 0.6% |
| South American Indian | 4 | 0.0% |
| Spaniard | 124 | 0.3% |
| Spanish | 189 | 0.4% |
| Sri Lankan | 3 | 0.0% |
| Subsaharan African | 477 | 1.0% |
| Swedish | 247 | 0.5% |
| Swiss | 43 | 0.1% |
| Syrian | 17 | 0.0% |
| Thai | 297 | 0.6% |
| Trinidadian and Tobagonian | 7 | 0.0% |
| Ukrainian | 258 | 0.5% |
| Uruguayan | 15 | 0.0% |
| Venezuelan | 8 | 0.0% |
| Welsh | 134 | 0.3% |
| Yaqui | 83 | 0.2% | View All 99 Rows |
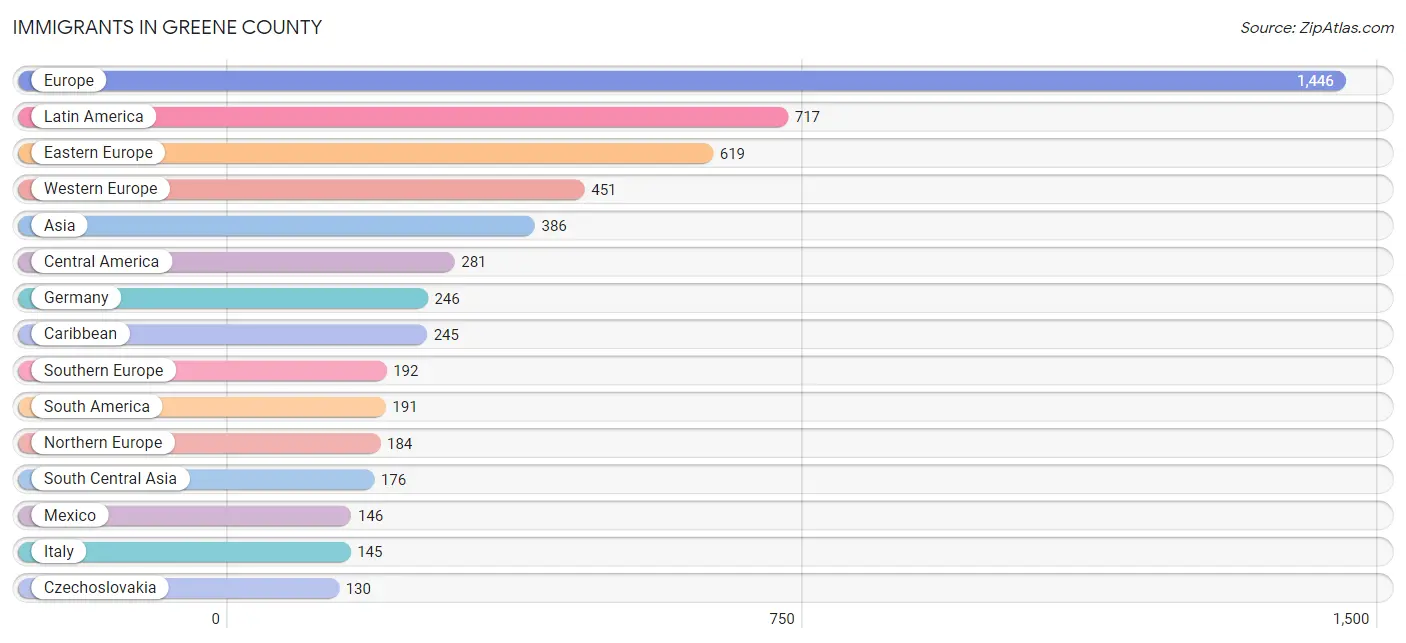
Immigrants in Greene County
The most numerous immigrant groups reported in Greene County came from Europe (1,446 | 3.0%), Latin America (717 | 1.5%), Eastern Europe (619 | 1.3%), Western Europe (451 | 0.9%), and Asia (386 | 0.8%), together accounting for 7.5% of all Greene County residents.
| Immigration Origin | # Population | % Population |
| Africa | 39 | 0.1% |
| Albania | 44 | 0.1% |
| Argentina | 3 | 0.0% |
| Asia | 386 | 0.8% |
| Australia | 5 | 0.0% |
| Austria | 49 | 0.1% |
| Belarus | 15 | 0.0% |
| Belgium | 17 | 0.0% |
| Bolivia | 29 | 0.1% |
| Brazil | 11 | 0.0% |
| Cambodia | 13 | 0.0% |
| Canada | 89 | 0.2% |
| Caribbean | 245 | 0.5% |
| Central America | 281 | 0.6% |
| Chile | 22 | 0.1% |
| China | 45 | 0.1% |
| Colombia | 2 | 0.0% |
| Cuba | 18 | 0.0% |
| Czechoslovakia | 130 | 0.3% |
| Dominica | 3 | 0.0% |
| Dominican Republic | 120 | 0.3% |
| Eastern Africa | 10 | 0.0% |
| Eastern Asia | 96 | 0.2% |
| Eastern Europe | 619 | 1.3% |
| Ecuador | 56 | 0.1% |
| Egypt | 2 | 0.0% |
| El Salvador | 80 | 0.2% |
| England | 45 | 0.1% |
| Ethiopia | 10 | 0.0% |
| Europe | 1,446 | 3.0% |
| France | 115 | 0.2% |
| Germany | 246 | 0.5% |
| Ghana | 19 | 0.0% |
| Greece | 38 | 0.1% |
| Guyana | 24 | 0.1% |
| Haiti | 64 | 0.1% |
| Honduras | 17 | 0.0% |
| Hong Kong | 29 | 0.1% |
| Hungary | 17 | 0.0% |
| India | 117 | 0.2% |
| Iran | 21 | 0.0% |
| Ireland | 57 | 0.1% |
| Israel | 8 | 0.0% |
| Italy | 145 | 0.3% |
| Jamaica | 5 | 0.0% |
| Japan | 44 | 0.1% |
| Korea | 7 | 0.0% |
| Latin America | 717 | 1.5% |
| Latvia | 1 | 0.0% |
| Lebanon | 9 | 0.0% |
| Lithuania | 5 | 0.0% |
| Mexico | 146 | 0.3% |
| Moldova | 64 | 0.1% |
| Netherlands | 16 | 0.0% |
| Northern Africa | 2 | 0.0% |
| Northern Europe | 184 | 0.4% |
| Norway | 22 | 0.1% |
| Oceania | 5 | 0.0% |
| Pakistan | 34 | 0.1% |
| Panama | 38 | 0.1% |
| Peru | 31 | 0.1% |
| Philippines | 4 | 0.0% |
| Poland | 98 | 0.2% |
| Romania | 15 | 0.0% |
| Russia | 102 | 0.2% |
| Scotland | 12 | 0.0% |
| Serbia | 13 | 0.0% |
| South America | 191 | 0.4% |
| South Central Asia | 176 | 0.4% |
| South Eastern Asia | 87 | 0.2% |
| Southern Europe | 192 | 0.4% |
| Spain | 9 | 0.0% |
| Sri Lanka | 4 | 0.0% |
| St. Vincent and the Grenadines | 28 | 0.1% |
| Sweden | 16 | 0.0% |
| Switzerland | 8 | 0.0% |
| Thailand | 16 | 0.0% |
| Trinidad and Tobago | 7 | 0.0% |
| Turkey | 10 | 0.0% |
| Ukraine | 97 | 0.2% |
| Venezuela | 5 | 0.0% |
| Vietnam | 54 | 0.1% |
| Western Africa | 27 | 0.1% |
| Western Asia | 27 | 0.1% |
| Western Europe | 451 | 0.9% | View All 85 Rows |
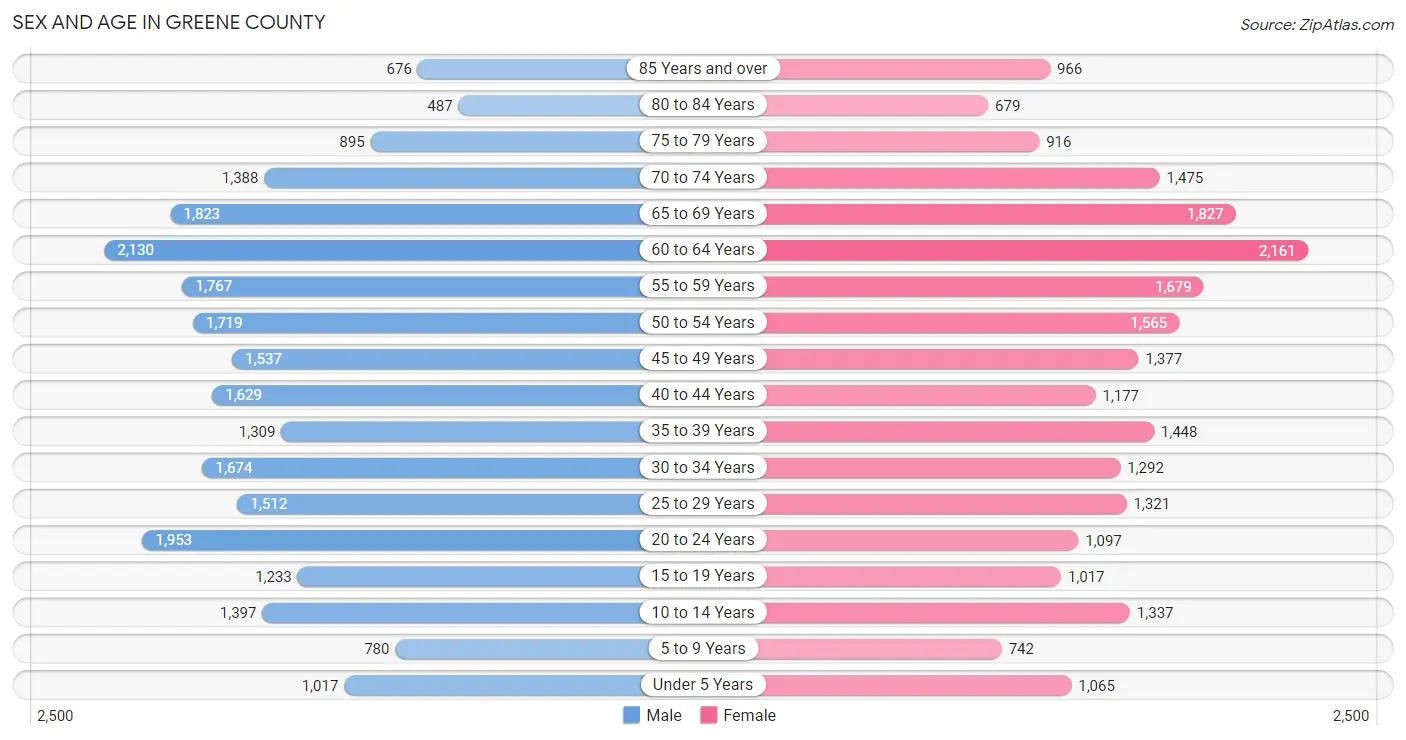
Sex and Age in Greene County
Sex and Age in Greene County
The most populous age groups in Greene County are 60 to 64 Years (2,130 | 8.6%) for men and 60 to 64 Years (2,161 | 9.3%) for women.
| Age Bracket | Male | Female |
| Under 5 Years | 1,017 (4.1%) | 1,065 (4.6%) |
| 5 to 9 Years | 780 (3.1%) | 742 (3.2%) |
| 10 to 14 Years | 1,397 (5.6%) | 1,337 (5.8%) |
| 15 to 19 Years | 1,233 (5.0%) | 1,017 (4.4%) |
| 20 to 24 Years | 1,953 (7.8%) | 1,097 (4.7%) |
| 25 to 29 Years | 1,512 (6.1%) | 1,321 (5.7%) |
| 30 to 34 Years | 1,674 (6.7%) | 1,292 (5.6%) |
| 35 to 39 Years | 1,309 (5.2%) | 1,448 (6.3%) |
| 40 to 44 Years | 1,629 (6.5%) | 1,177 (5.1%) |
| 45 to 49 Years | 1,537 (6.2%) | 1,377 (5.9%) |
| 50 to 54 Years | 1,719 (6.9%) | 1,565 (6.8%) |
| 55 to 59 Years | 1,767 (7.1%) | 1,679 (7.3%) |
| 60 to 64 Years | 2,130 (8.6%) | 2,161 (9.3%) |
| 65 to 69 Years | 1,823 (7.3%) | 1,827 (7.9%) |
| 70 to 74 Years | 1,388 (5.6%) | 1,475 (6.4%) |
| 75 to 79 Years | 895 (3.6%) | 916 (4.0%) |
| 80 to 84 Years | 487 (1.9%) | 679 (2.9%) |
| 85 Years and over | 676 (2.7%) | 966 (4.2%) |
| Total | 24,926 (100.0%) | 23,141 (100.0%) |
Families and Households in Greene County
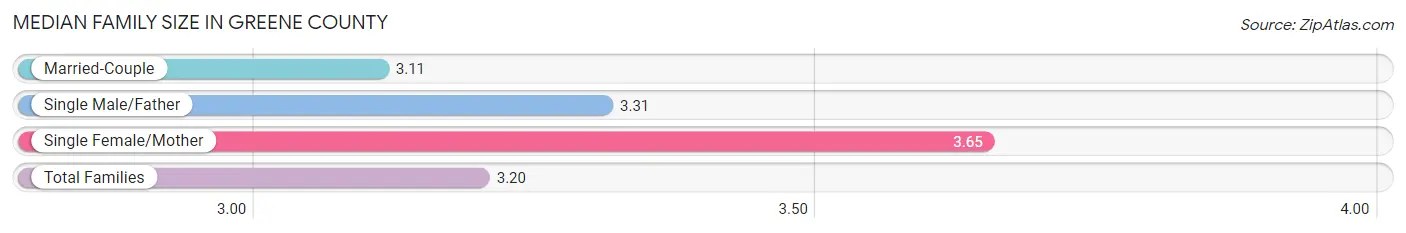
Median Family Size in Greene County
The median family size in Greene County is 3.20 persons per family, with single female/mother families (1,466 | 13.4%) accounting for the largest median family size of 3.65 persons per family. On the other hand, married-couple families (8,650 | 78.9%) represent the smallest median family size with 3.11 persons per family.
| Family Type | # Families | Family Size |
| Married-Couple | 8,650 (78.9%) | 3.11 |
| Single Male/Father | 845 (7.7%) | 3.31 |
| Single Female/Mother | 1,466 (13.4%) | 3.65 |
| Total Families | 10,961 (100.0%) | 3.20 |
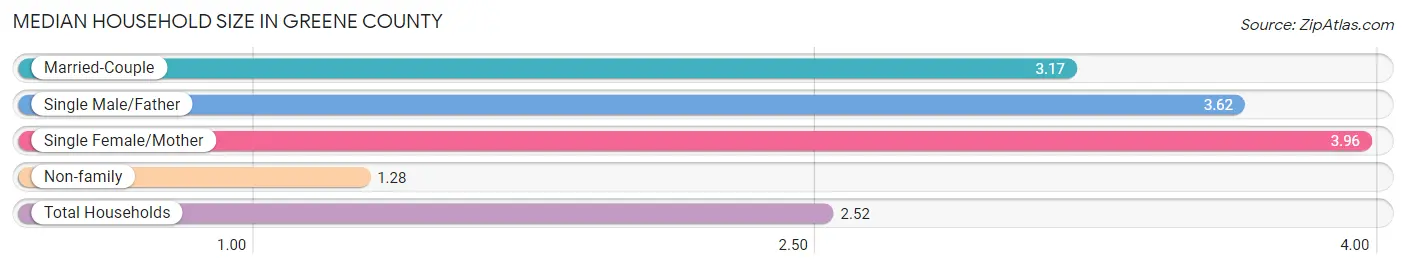
Median Household Size in Greene County
The median household size in Greene County is 2.52 persons per household, with single female/mother households (1,466 | 8.2%) accounting for the largest median household size of 3.96 persons per household. non-family households (6,942 | 38.8%) represent the smallest median household size with 1.28 persons per household.
| Household Type | # Households | Household Size |
| Married-Couple | 8,650 (48.3%) | 3.17 |
| Single Male/Father | 845 (4.7%) | 3.62 |
| Single Female/Mother | 1,466 (8.2%) | 3.96 |
| Non-family | 6,942 (38.8%) | 1.28 |
| Total Households | 17,903 (100.0%) | 2.52 |
Household Size by Marriage Status in Greene County
Out of a total of 17,903 households in Greene County, 10,961 (61.2%) are family households, while 6,942 (38.8%) are nonfamily households. The most numerous type of family households are 2-person households, comprising 5,966, and the most common type of nonfamily households are 1-person households, comprising 5,718.
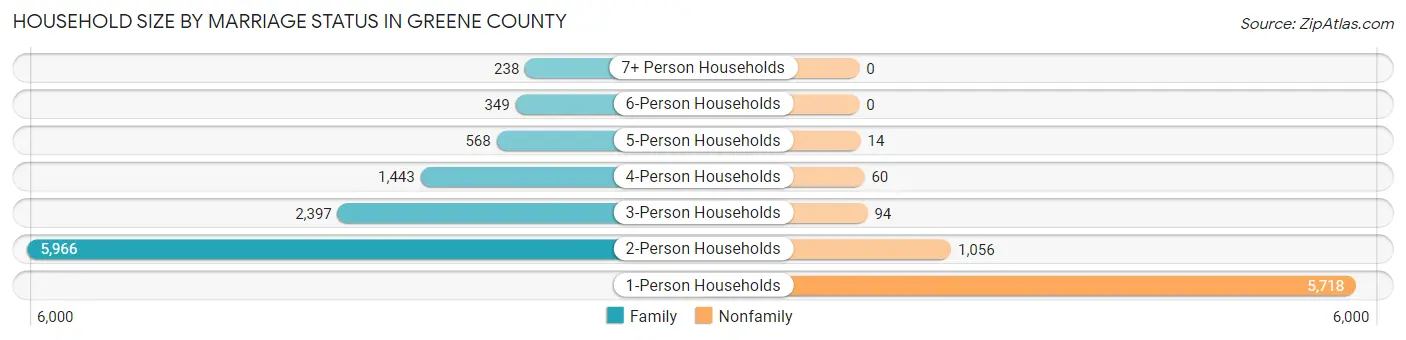
| Household Size | Family Households | Nonfamily Households |
| 1-Person Households | - | 5,718 (31.9%) |
| 2-Person Households | 5,966 (33.3%) | 1,056 (5.9%) |
| 3-Person Households | 2,397 (13.4%) | 94 (0.5%) |
| 4-Person Households | 1,443 (8.1%) | 60 (0.3%) |
| 5-Person Households | 568 (3.2%) | 14 (0.1%) |
| 6-Person Households | 349 (1.9%) | 0 (0.0%) |
| 7+ Person Households | 238 (1.3%) | 0 (0.0%) |
| Total | 10,961 (61.2%) | 6,942 (38.8%) |
Female Fertility in Greene County
Fertility by Age in Greene County
Average fertility rate in Greene County is 22.0 births per 1,000 women. Women in the age bracket of 20 to 34 years have the highest fertility rate with 37.0 births per 1,000 women. Women in the age bracket of 20 to 34 years acount for 66.8% of all women with births.
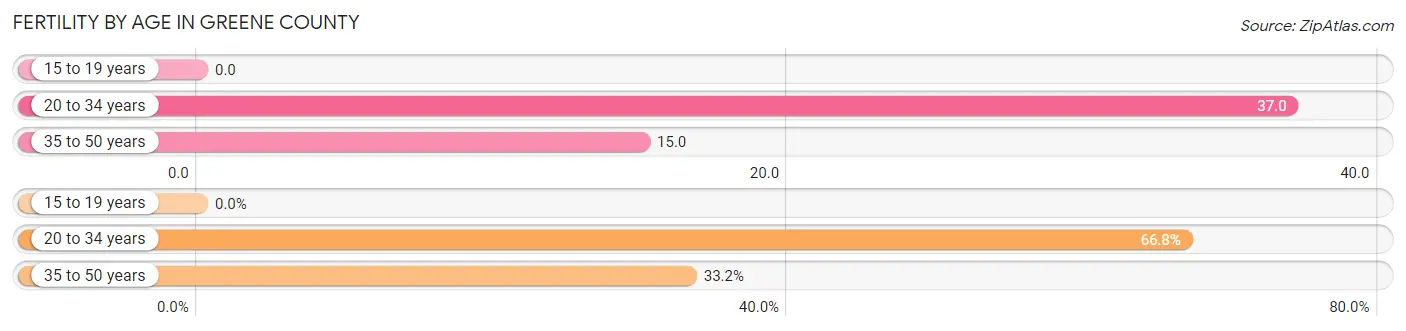
| Age Bracket | Women with Births | Births / 1,000 Women |
| 15 to 19 years | 0 (0.0%) | 0.0 |
| 20 to 34 years | 137 (66.8%) | 37.0 |
| 35 to 50 years | 68 (33.2%) | 15.0 |
| Total | 205 (100.0%) | 22.0 |
Fertility by Age by Marriage Status in Greene County
72.7% of women with births (205) in Greene County are married. The highest percentage of unmarried women with births falls into 35 to 50 years age bracket with 50.0% of them unmarried at the time of birth, while the lowest percentage of unmarried women with births belong to 20 to 34 years age bracket with 16.1% of them unmarried.
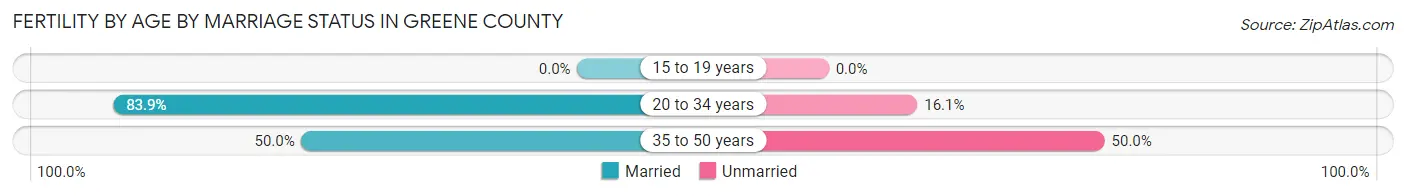
| Age Bracket | Married | Unmarried |
| 15 to 19 years | 0 (0.0%) | 0 (0.0%) |
| 20 to 34 years | 115 (83.9%) | 22 (16.1%) |
| 35 to 50 years | 34 (50.0%) | 34 (50.0%) |
| Total | 149 (72.7%) | 56 (27.3%) |
Fertility by Education in Greene County
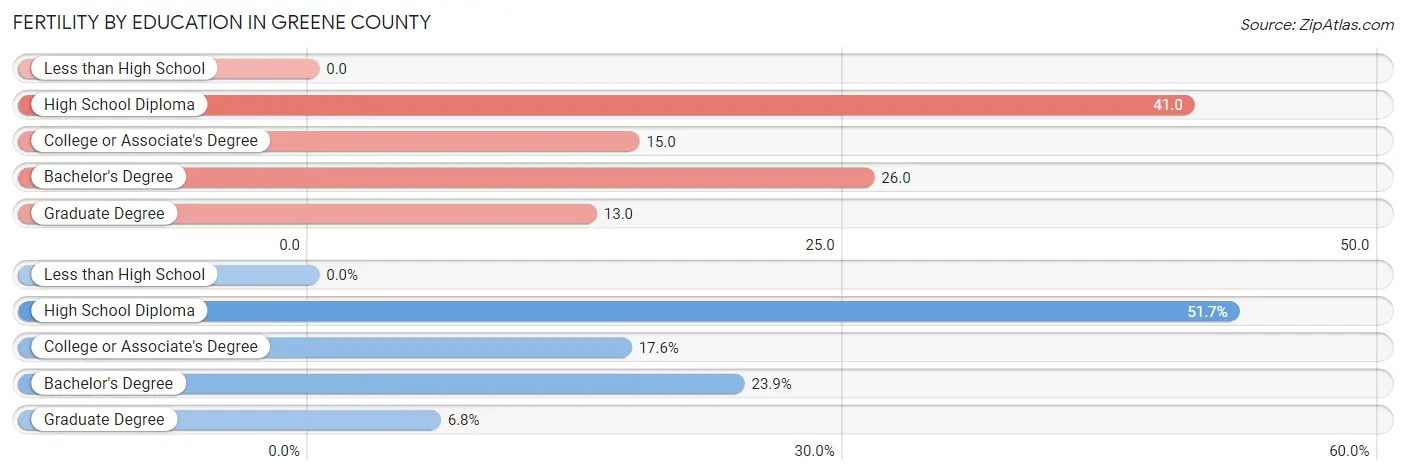
| Educational Attainment | Women with Births | Births / 1,000 Women |
| Less than High School | 0 (0.0%) | 0.0 |
| High School Diploma | 106 (51.7%) | 41.0 |
| College or Associate's Degree | 36 (17.6%) | 15.0 |
| Bachelor's Degree | 49 (23.9%) | 26.0 |
| Graduate Degree | 14 (6.8%) | 13.0 |
| Total | 205 (100.0%) | 22.0 |
Fertility by Education by Marriage Status in Greene County
27.3% of women with births in Greene County are unmarried. Women with the educational attainment of graduate degree are most likely to be married with 100.0% of them married at childbirth, while women with the educational attainment of college or associate's degree are least likely to be married with 36.1% of them unmarried at childbirth.
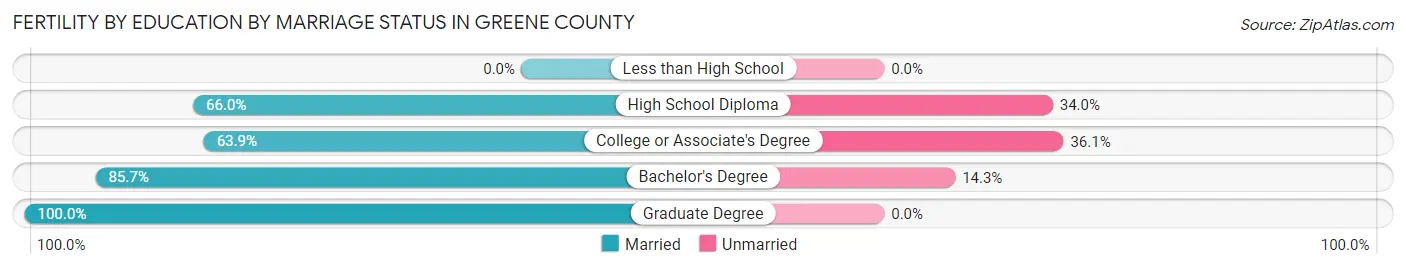
| Educational Attainment | Married | Unmarried |
| Less than High School | 0 (0.0%) | 0 (0.0%) |
| High School Diploma | 70 (66.0%) | 36 (34.0%) |
| College or Associate's Degree | 23 (63.9%) | 13 (36.1%) |
| Bachelor's Degree | 42 (85.7%) | 7 (14.3%) |
| Graduate Degree | 14 (100.0%) | 0 (0.0%) |
| Total | 149 (72.7%) | 56 (27.3%) |
Employment Characteristics in Greene County
Employment by Class of Employer in Greene County
Among the 21,390 employed individuals in Greene County, private company employees (12,526 | 58.6%), not-for-profit organizations (2,228 | 10.4%), and local government employees (2,000 | 9.3%) make up the most common classes of employment.
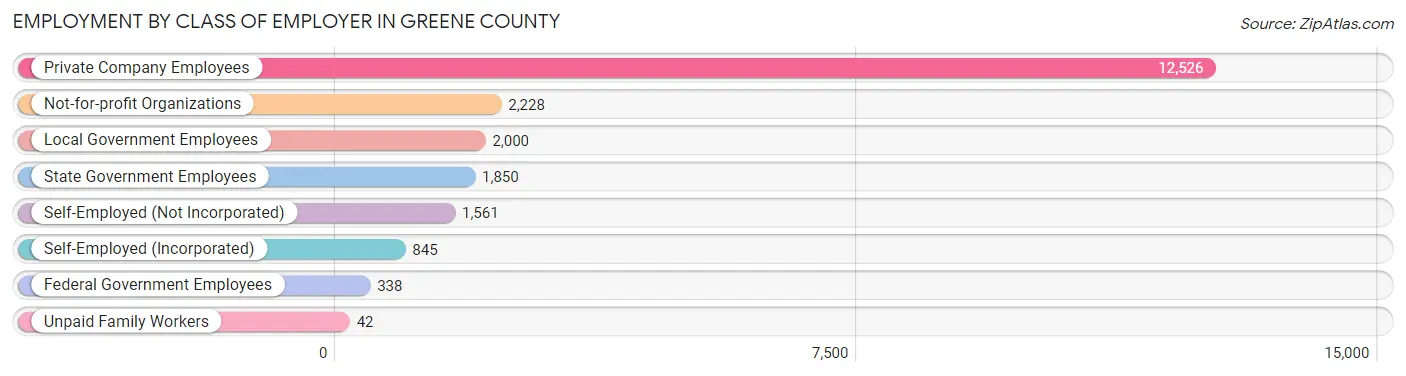
| Employer Class | # Employees | % Employees |
| Private Company Employees | 12,526 | 58.6% |
| Self-Employed (Incorporated) | 845 | 4.0% |
| Self-Employed (Not Incorporated) | 1,561 | 7.3% |
| Not-for-profit Organizations | 2,228 | 10.4% |
| Local Government Employees | 2,000 | 9.3% |
| State Government Employees | 1,850 | 8.6% |
| Federal Government Employees | 338 | 1.6% |
| Unpaid Family Workers | 42 | 0.2% |
| Total | 21,390 | 100.0% |
Employment Status by Age in Greene County
According to the labor force statistics for Greene County, out of the total population over 16 years of age (41,132), 54.9% or 22,581 individuals are in the labor force, with 2.8% or 632 of them unemployed. The age group with the highest labor force participation rate is 45 to 54 years, with 79.0% or 4,896 individuals in the labor force. Within the labor force, the 16 to 19 years age range has the highest percentage of unemployed individuals, with 8.5% or 56 of them being unemployed.
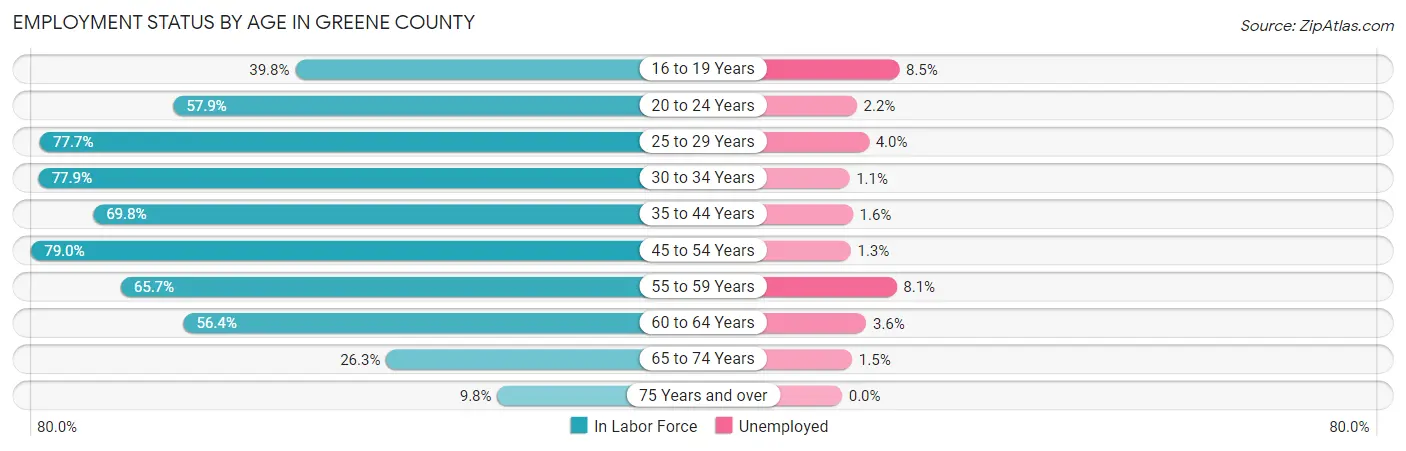
| Age Bracket | In Labor Force | Unemployed |
| 16 to 19 Years | 658 (39.8%) | 56 (8.5%) |
| 20 to 24 Years | 1,766 (57.9%) | 39 (2.2%) |
| 25 to 29 Years | 2,201 (77.7%) | 88 (4.0%) |
| 30 to 34 Years | 2,311 (77.9%) | 25 (1.1%) |
| 35 to 44 Years | 3,883 (69.8%) | 62 (1.6%) |
| 45 to 54 Years | 4,896 (79.0%) | 64 (1.3%) |
| 55 to 59 Years | 2,264 (65.7%) | 183 (8.1%) |
| 60 to 64 Years | 2,420 (56.4%) | 87 (3.6%) |
| 65 to 74 Years | 1,713 (26.3%) | 26 (1.5%) |
| 75 Years and over | 453 (9.8%) | 0 (0.0%) |
| Total | 22,581 (54.9%) | 632 (2.8%) |
Employment Status by Educational Attainment in Greene County
According to labor force statistics for Greene County, 71.1% of individuals (17,986) out of the total population between 25 and 64 years of age (25,297) are in the labor force, with 2.8% or 504 of them being unemployed. The group with the highest labor force participation rate are those with the educational attainment of bachelor's degree or higher, with 84.2% or 6,252 individuals in the labor force. Within the labor force, individuals with less than high school education have the highest percentage of unemployment, with 7.1% or 63 of them being unemployed.
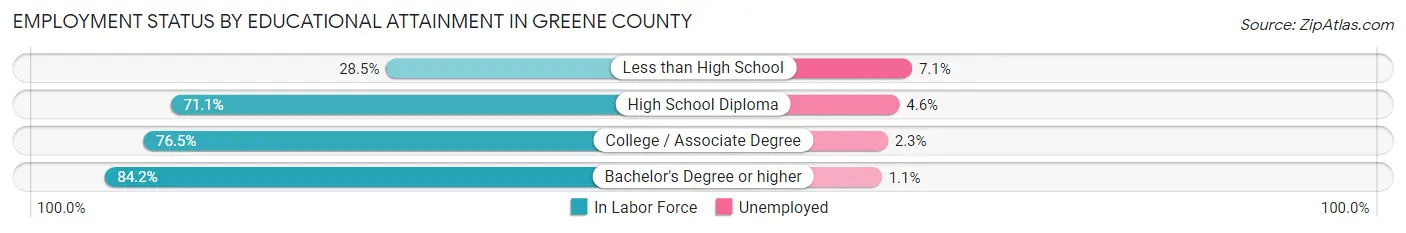
| Educational Attainment | In Labor Force | Unemployed |
| Less than High School | 891 (28.5%) | 222 (7.1%) |
| High School Diploma | 5,756 (71.1%) | 372 (4.6%) |
| College / Associate Degree | 5,089 (76.5%) | 153 (2.3%) |
| Bachelor's Degree or higher | 6,252 (84.2%) | 82 (1.1%) |
| Total | 17,986 (71.1%) | 708 (2.8%) |
Employment Occupations by Sex in Greene County
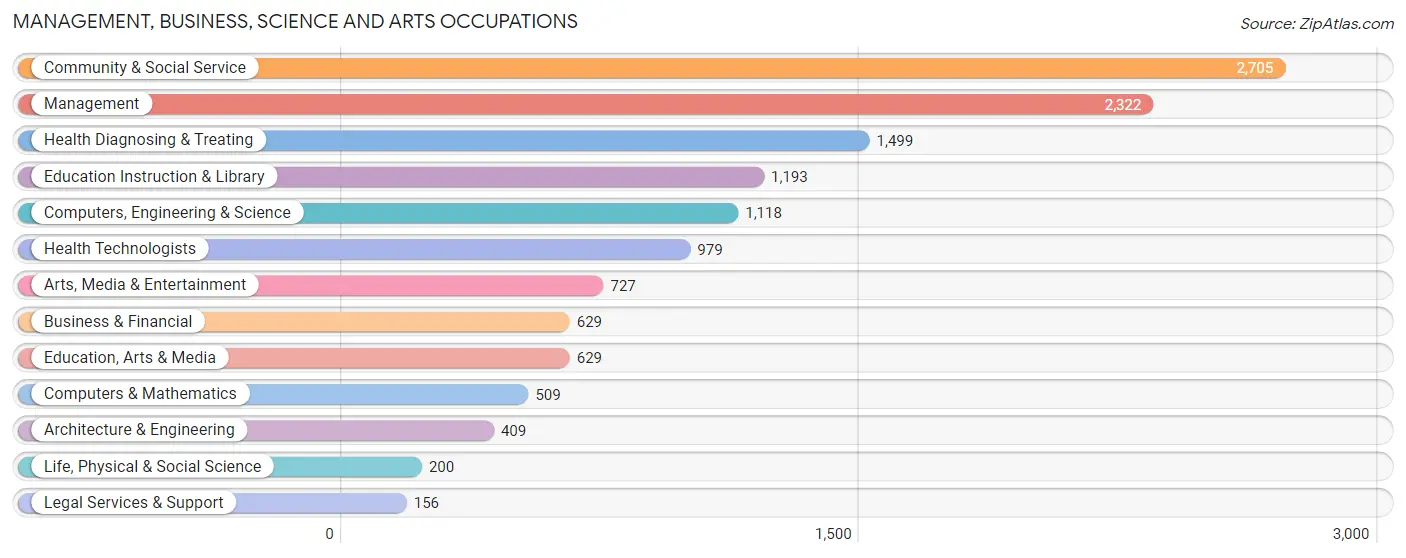
Management, Business, Science and Arts Occupations
The most common Management, Business, Science and Arts occupations in Greene County are Community & Social Service (2,705 | 12.3%), Management (2,322 | 10.6%), Health Diagnosing & Treating (1,499 | 6.8%), Education Instruction & Library (1,193 | 5.4%), and Computers, Engineering & Science (1,118 | 5.1%).
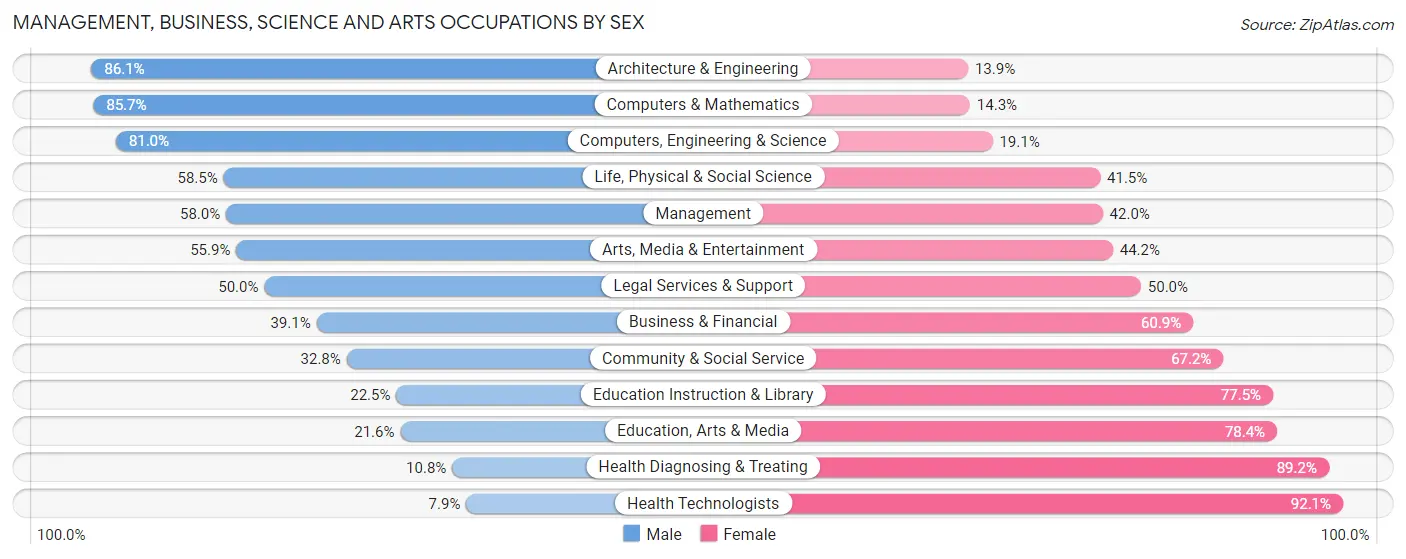
Management, Business, Science and Arts Occupations by Sex
Within the Management, Business, Science and Arts occupations in Greene County, the most male-oriented occupations are Architecture & Engineering (86.1%), Computers & Mathematics (85.7%), and Computers, Engineering & Science (80.9%), while the most female-oriented occupations are Health Technologists (92.1%), Health Diagnosing & Treating (89.2%), and Education, Arts & Media (78.4%).
| Occupation | Male | Female |
| Management | 1,346 (58.0%) | 976 (42.0%) |
| Business & Financial | 246 (39.1%) | 383 (60.9%) |
| Computers, Engineering & Science | 905 (80.9%) | 213 (19.1%) |
| Computers & Mathematics | 436 (85.7%) | 73 (14.3%) |
| Architecture & Engineering | 352 (86.1%) | 57 (13.9%) |
| Life, Physical & Social Science | 117 (58.5%) | 83 (41.5%) |
| Community & Social Service | 888 (32.8%) | 1,817 (67.2%) |
| Education, Arts & Media | 136 (21.6%) | 493 (78.4%) |
| Legal Services & Support | 78 (50.0%) | 78 (50.0%) |
| Education Instruction & Library | 268 (22.5%) | 925 (77.5%) |
| Arts, Media & Entertainment | 406 (55.8%) | 321 (44.2%) |
| Health Diagnosing & Treating | 162 (10.8%) | 1,337 (89.2%) |
| Health Technologists | 77 (7.9%) | 902 (92.1%) |
| Total (Category) | 3,547 (42.9%) | 4,726 (57.1%) |
| Total (Overall) | 11,317 (51.6%) | 10,592 (48.3%) |
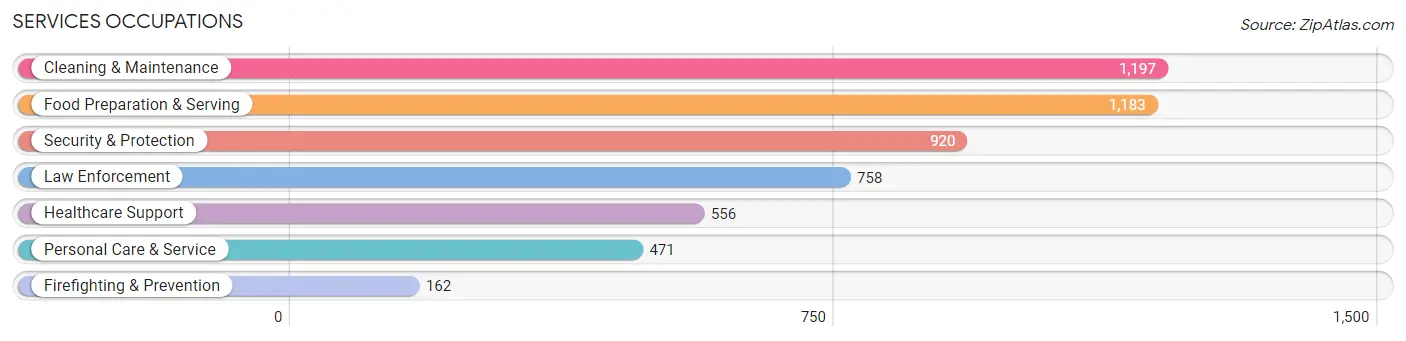
Services Occupations
The most common Services occupations in Greene County are Cleaning & Maintenance (1,197 | 5.5%), Food Preparation & Serving (1,183 | 5.4%), Security & Protection (920 | 4.2%), Law Enforcement (758 | 3.5%), and Healthcare Support (556 | 2.5%).
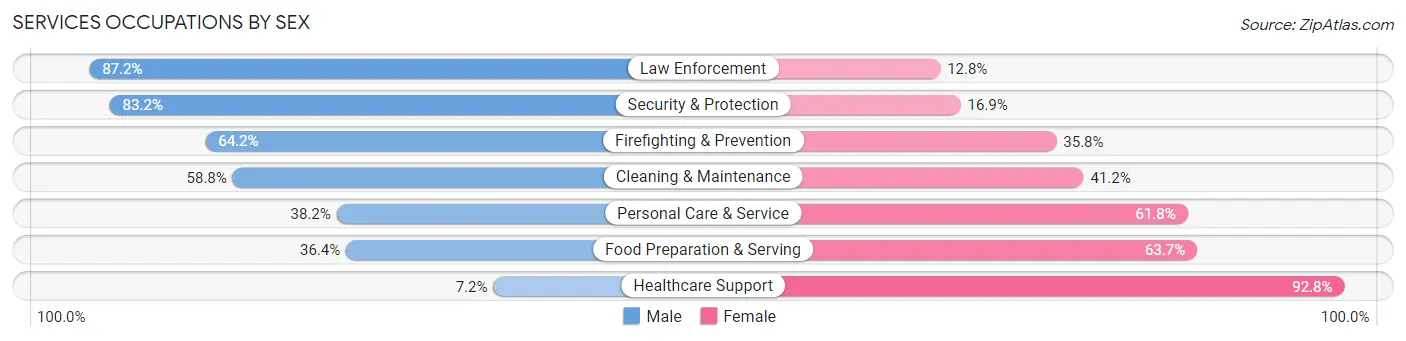
Services Occupations by Sex
Within the Services occupations in Greene County, the most male-oriented occupations are Law Enforcement (87.2%), Security & Protection (83.2%), and Firefighting & Prevention (64.2%), while the most female-oriented occupations are Healthcare Support (92.8%), Food Preparation & Serving (63.6%), and Personal Care & Service (61.8%).
| Occupation | Male | Female |
| Healthcare Support | 40 (7.2%) | 516 (92.8%) |
| Security & Protection | 765 (83.2%) | 155 (16.9%) |
| Firefighting & Prevention | 104 (64.2%) | 58 (35.8%) |
| Law Enforcement | 661 (87.2%) | 97 (12.8%) |
| Food Preparation & Serving | 430 (36.3%) | 753 (63.6%) |
| Cleaning & Maintenance | 704 (58.8%) | 493 (41.2%) |
| Personal Care & Service | 180 (38.2%) | 291 (61.8%) |
| Total (Category) | 2,119 (49.0%) | 2,208 (51.0%) |
| Total (Overall) | 11,317 (51.6%) | 10,592 (48.3%) |
Sales and Office Occupations
The most common Sales and Office occupations in Greene County are Office & Administration (2,595 | 11.8%), and Sales & Related (1,970 | 9.0%).
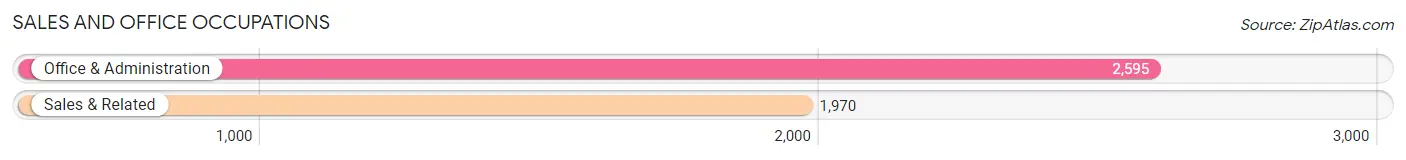
Sales and Office Occupations by Sex
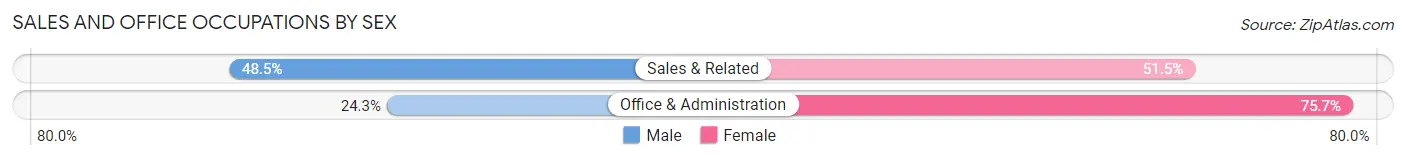
| Occupation | Male | Female |
| Sales & Related | 956 (48.5%) | 1,014 (51.5%) |
| Office & Administration | 630 (24.3%) | 1,965 (75.7%) |
| Total (Category) | 1,586 (34.7%) | 2,979 (65.3%) |
| Total (Overall) | 11,317 (51.6%) | 10,592 (48.3%) |
Natural Resources, Construction and Maintenance Occupations
The most common Natural Resources, Construction and Maintenance occupations in Greene County are Construction & Extraction (1,143 | 5.2%), Installation, Maintenance & Repair (703 | 3.2%), and Farming, Fishing & Forestry (144 | 0.7%).
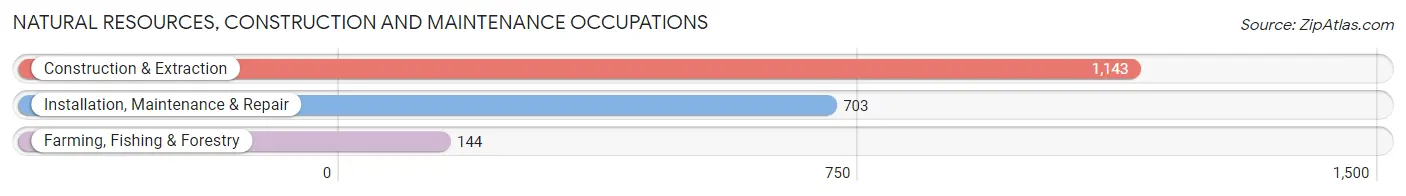
Natural Resources, Construction and Maintenance Occupations by Sex
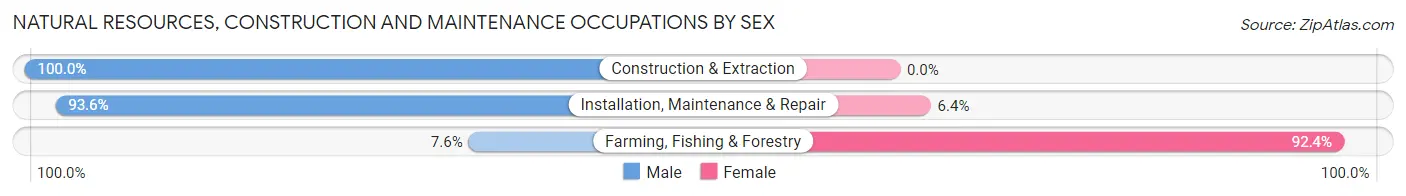
| Occupation | Male | Female |
| Farming, Fishing & Forestry | 11 (7.6%) | 133 (92.4%) |
| Construction & Extraction | 1,143 (100.0%) | 0 (0.0%) |
| Installation, Maintenance & Repair | 658 (93.6%) | 45 (6.4%) |
| Total (Category) | 1,812 (91.1%) | 178 (8.9%) |
| Total (Overall) | 11,317 (51.6%) | 10,592 (48.3%) |
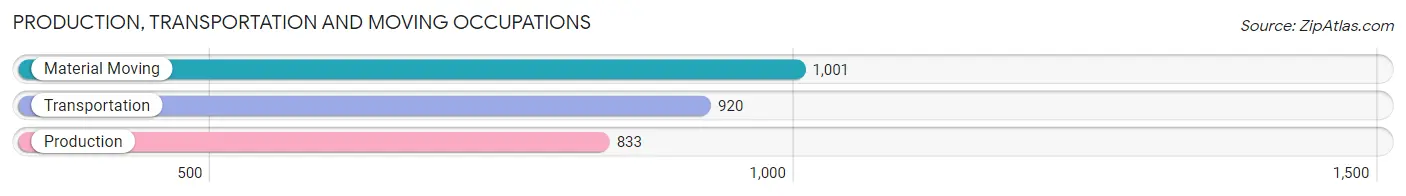
Production, Transportation and Moving Occupations
The most common Production, Transportation and Moving occupations in Greene County are Material Moving (1,001 | 4.6%), Transportation (920 | 4.2%), and Production (833 | 3.8%).
Production, Transportation and Moving Occupations by Sex
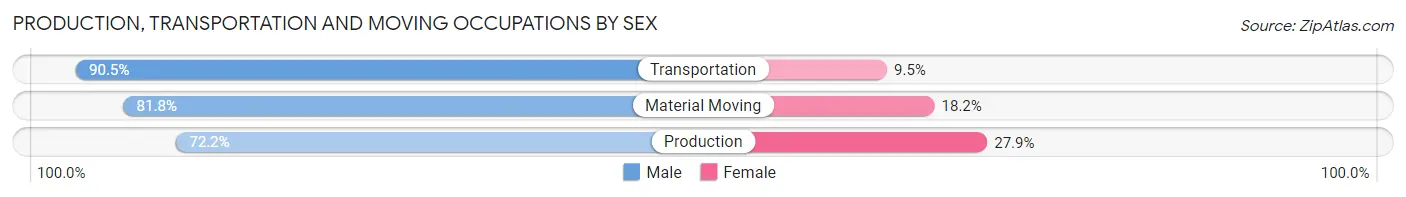
| Occupation | Male | Female |
| Production | 601 (72.2%) | 232 (27.9%) |
| Transportation | 833 (90.5%) | 87 (9.5%) |
| Material Moving | 819 (81.8%) | 182 (18.2%) |
| Total (Category) | 2,253 (81.8%) | 501 (18.2%) |
| Total (Overall) | 11,317 (51.6%) | 10,592 (48.3%) |
Employment Industries by Sex in Greene County
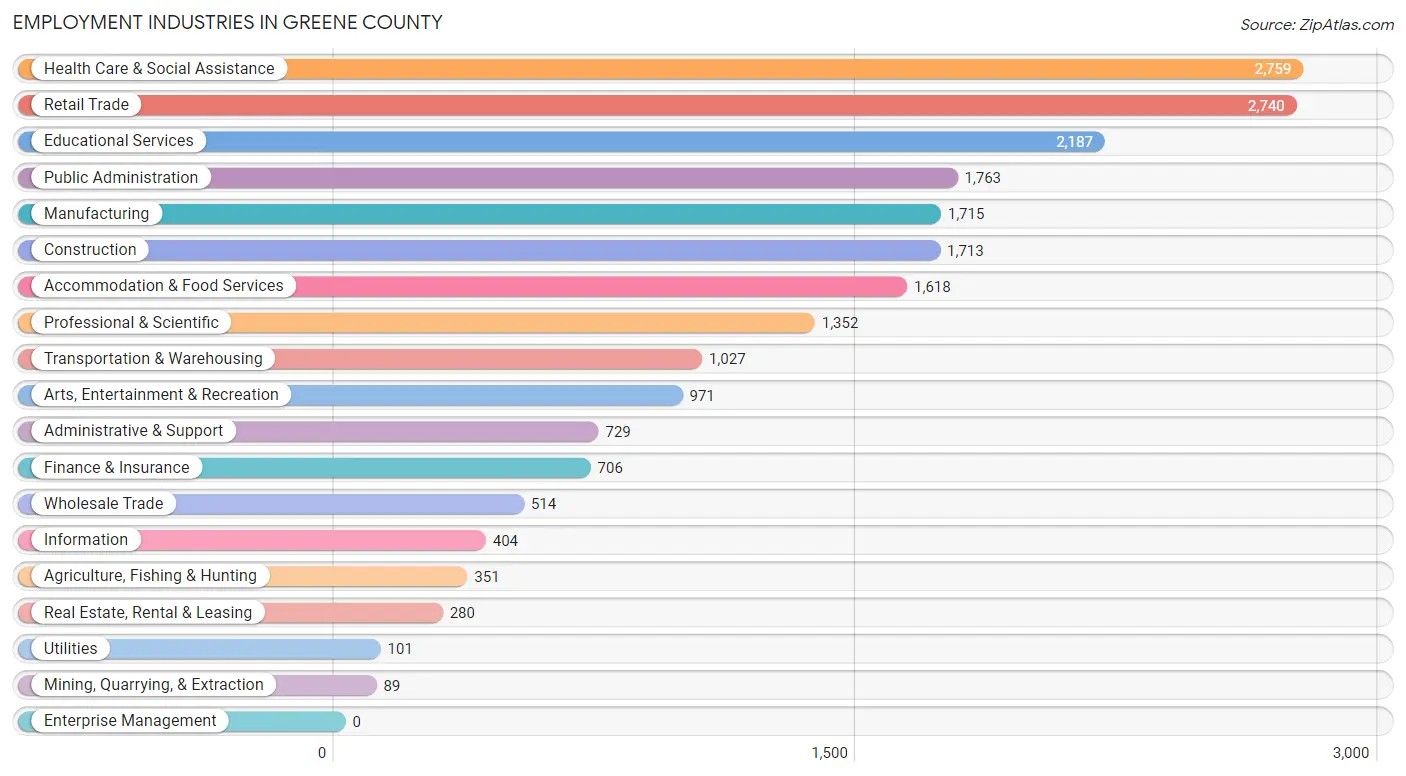
Employment Industries in Greene County
The major employment industries in Greene County include Health Care & Social Assistance (2,759 | 12.6%), Retail Trade (2,740 | 12.5%), Educational Services (2,187 | 10.0%), Public Administration (1,763 | 8.1%), and Manufacturing (1,715 | 7.8%).
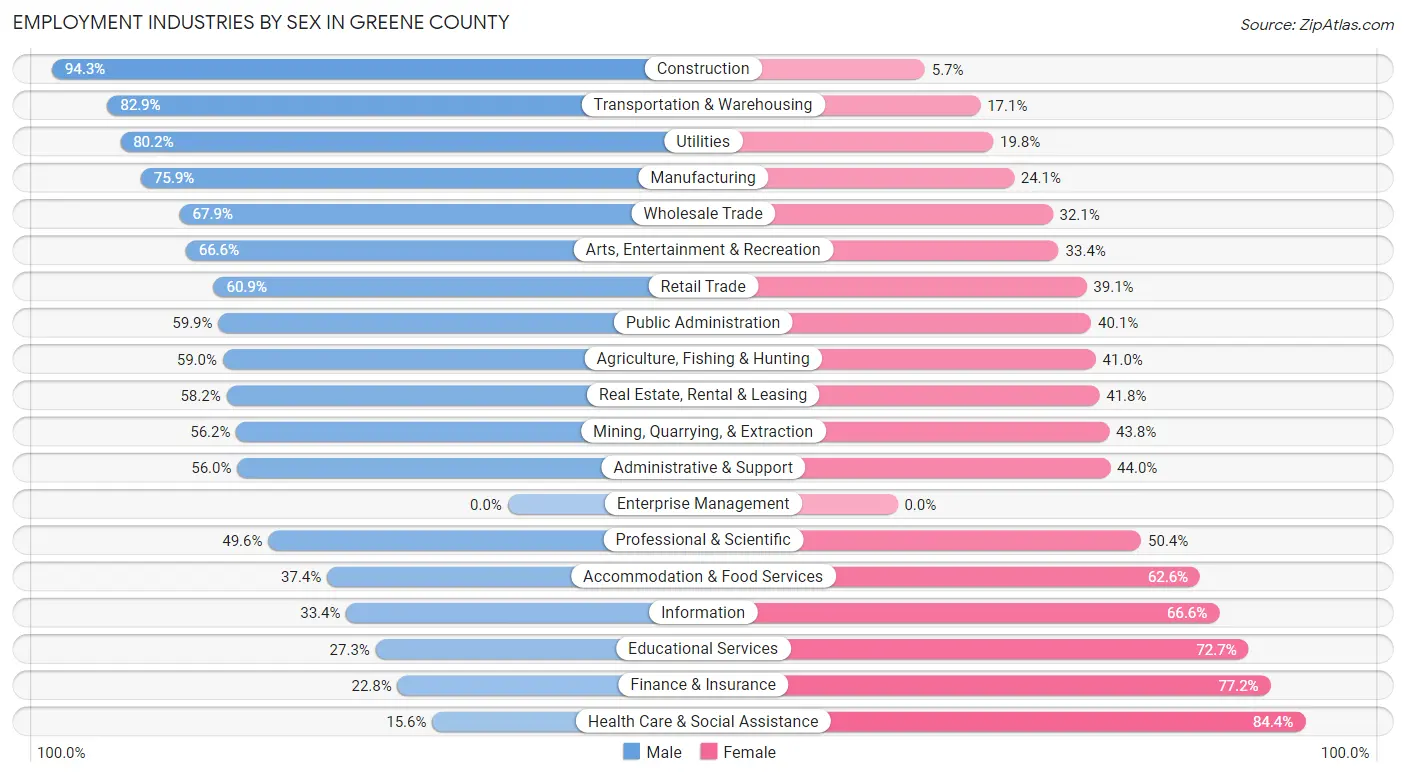
Employment Industries by Sex in Greene County
The Greene County industries that see more men than women are Construction (94.3%), Transportation & Warehousing (82.9%), and Utilities (80.2%), whereas the industries that tend to have a higher number of women are Health Care & Social Assistance (84.4%), Finance & Insurance (77.2%), and Educational Services (72.7%).
| Industry | Male | Female |
| Agriculture, Fishing & Hunting | 207 (59.0%) | 144 (41.0%) |
| Mining, Quarrying, & Extraction | 50 (56.2%) | 39 (43.8%) |
| Construction | 1,616 (94.3%) | 97 (5.7%) |
| Manufacturing | 1,302 (75.9%) | 413 (24.1%) |
| Wholesale Trade | 349 (67.9%) | 165 (32.1%) |
| Retail Trade | 1,668 (60.9%) | 1,072 (39.1%) |
| Transportation & Warehousing | 851 (82.9%) | 176 (17.1%) |
| Utilities | 81 (80.2%) | 20 (19.8%) |
| Information | 135 (33.4%) | 269 (66.6%) |
| Finance & Insurance | 161 (22.8%) | 545 (77.2%) |
| Real Estate, Rental & Leasing | 163 (58.2%) | 117 (41.8%) |
| Professional & Scientific | 670 (49.6%) | 682 (50.4%) |
| Enterprise Management | 0 (0.0%) | 0 (0.0%) |
| Administrative & Support | 408 (56.0%) | 321 (44.0%) |
| Educational Services | 598 (27.3%) | 1,589 (72.7%) |
| Health Care & Social Assistance | 431 (15.6%) | 2,328 (84.4%) |
| Arts, Entertainment & Recreation | 647 (66.6%) | 324 (33.4%) |
| Accommodation & Food Services | 605 (37.4%) | 1,013 (62.6%) |
| Public Administration | 1,056 (59.9%) | 707 (40.1%) |
| Total | 11,317 (51.6%) | 10,592 (48.3%) |
Education in Greene County
School Enrollment in Greene County
The most common levels of schooling among the 7,616 students in Greene County are middle school (2,084 | 27.4%), high school (1,890 | 24.8%), and college / undergraduate (1,333 | 17.5%).
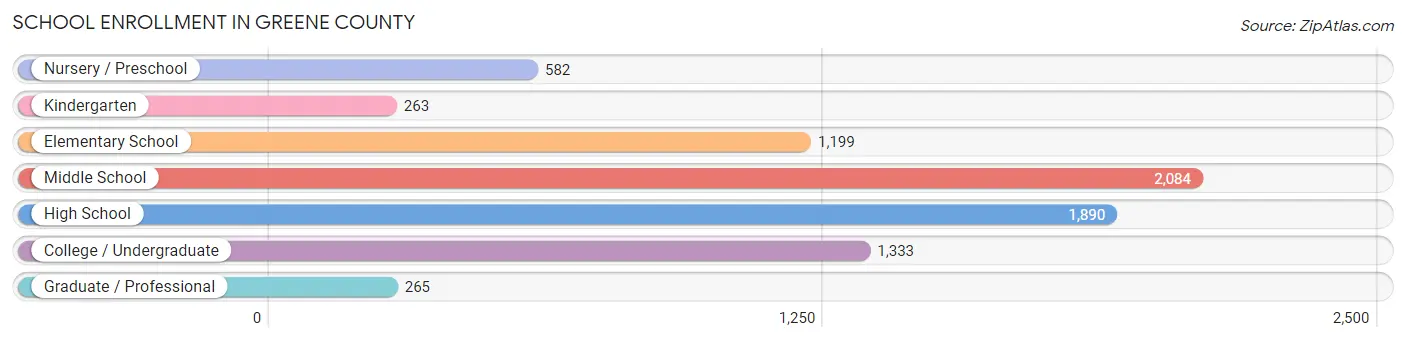
| School Level | # Students | % Students |
| Nursery / Preschool | 582 | 7.6% |
| Kindergarten | 263 | 3.5% |
| Elementary School | 1,199 | 15.7% |
| Middle School | 2,084 | 27.4% |
| High School | 1,890 | 24.8% |
| College / Undergraduate | 1,333 | 17.5% |
| Graduate / Professional | 265 | 3.5% |
| Total | 7,616 | 100.0% |
School Enrollment by Age by Funding Source in Greene County
Out of a total of 7,616 students who are enrolled in schools in Greene County, 1,120 (14.7%) attend a private institution, while the remaining 6,496 (85.3%) are enrolled in public schools. The age group of 25 to 34 year olds has the highest likelihood of being enrolled in private schools, with 168 (54.0% in the age bracket) enrolled. Conversely, the age group of 18 to 19 year olds has the lowest likelihood of being enrolled in a private school, with 321 (94.4% in the age bracket) attending a public institution.
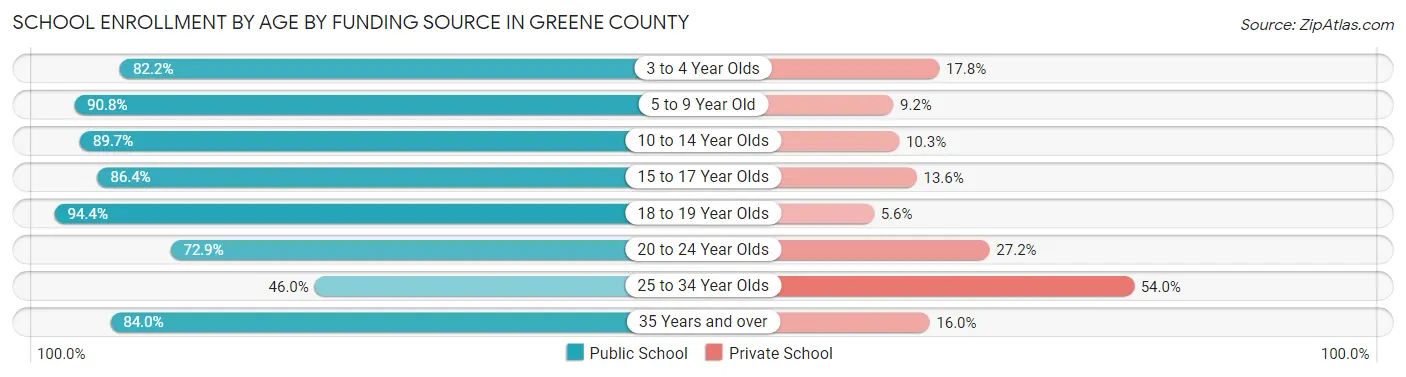
| Age Bracket | Public School | Private School |
| 3 to 4 Year Olds | 421 (82.2%) | 91 (17.8%) |
| 5 to 9 Year Old | 1,154 (90.8%) | 117 (9.2%) |
| 10 to 14 Year Olds | 2,403 (89.7%) | 276 (10.3%) |
| 15 to 17 Year Olds | 1,140 (86.4%) | 179 (13.6%) |
| 18 to 19 Year Olds | 321 (94.4%) | 19 (5.6%) |
| 20 to 24 Year Olds | 534 (72.9%) | 199 (27.2%) |
| 25 to 34 Year Olds | 143 (46.0%) | 168 (54.0%) |
| 35 Years and over | 379 (84.0%) | 72 (16.0%) |
| Total | 6,496 (85.3%) | 1,120 (14.7%) |
Educational Attainment by Field of Study in Greene County
Education (1,425 | 13.0%), business (1,285 | 11.7%), social sciences (1,072 | 9.8%), science & technology (960 | 8.8%), and visual & performing arts (828 | 7.5%) are the most common fields of study among 10,961 individuals in Greene County who have obtained a bachelor's degree or higher.
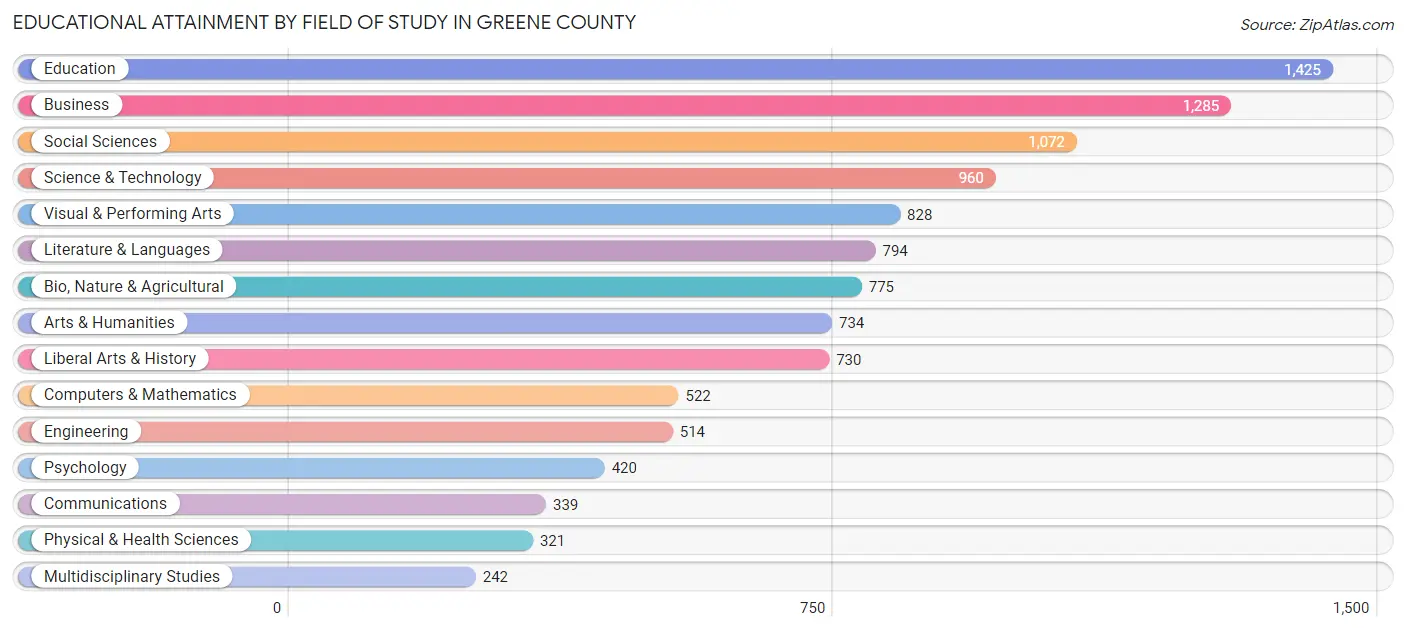
| Field of Study | # Graduates | % Graduates |
| Computers & Mathematics | 522 | 4.8% |
| Bio, Nature & Agricultural | 775 | 7.1% |
| Physical & Health Sciences | 321 | 2.9% |
| Psychology | 420 | 3.8% |
| Social Sciences | 1,072 | 9.8% |
| Engineering | 514 | 4.7% |
| Multidisciplinary Studies | 242 | 2.2% |
| Science & Technology | 960 | 8.8% |
| Business | 1,285 | 11.7% |
| Education | 1,425 | 13.0% |
| Literature & Languages | 794 | 7.2% |
| Liberal Arts & History | 730 | 6.7% |
| Visual & Performing Arts | 828 | 7.5% |
| Communications | 339 | 3.1% |
| Arts & Humanities | 734 | 6.7% |
| Total | 10,961 | 100.0% |
Transportation & Commute in Greene County
Vehicle Availability by Sex in Greene County
The most prevalent vehicle ownership categories in Greene County are males with 2 vehicles (4,536, accounting for 41.4%) and females with 2 vehicles (4,133, making up 44.4%).
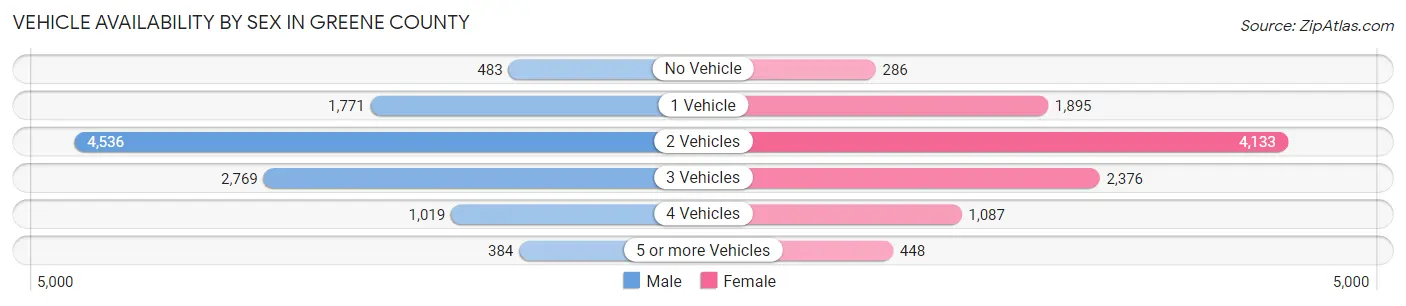
| Vehicles Available | Male | Female |
| No Vehicle | 483 (4.4%) | 286 (2.8%) |
| 1 Vehicle | 1,771 (16.2%) | 1,895 (18.5%) |
| 2 Vehicles | 4,536 (41.4%) | 4,133 (40.4%) |
| 3 Vehicles | 2,769 (25.3%) | 2,376 (23.2%) |
| 4 Vehicles | 1,019 (9.3%) | 1,087 (10.6%) |
| 5 or more Vehicles | 384 (3.5%) | 448 (4.4%) |
| Total | 10,962 (100.0%) | 10,225 (100.0%) |
Commute Time in Greene County
The most frequently occuring commute durations in Greene County are 10 to 14 minutes (2,651 commuters, 13.9%), 15 to 19 minutes (2,438 commuters, 12.8%), and 45 to 59 minutes (2,432 commuters, 12.7%).
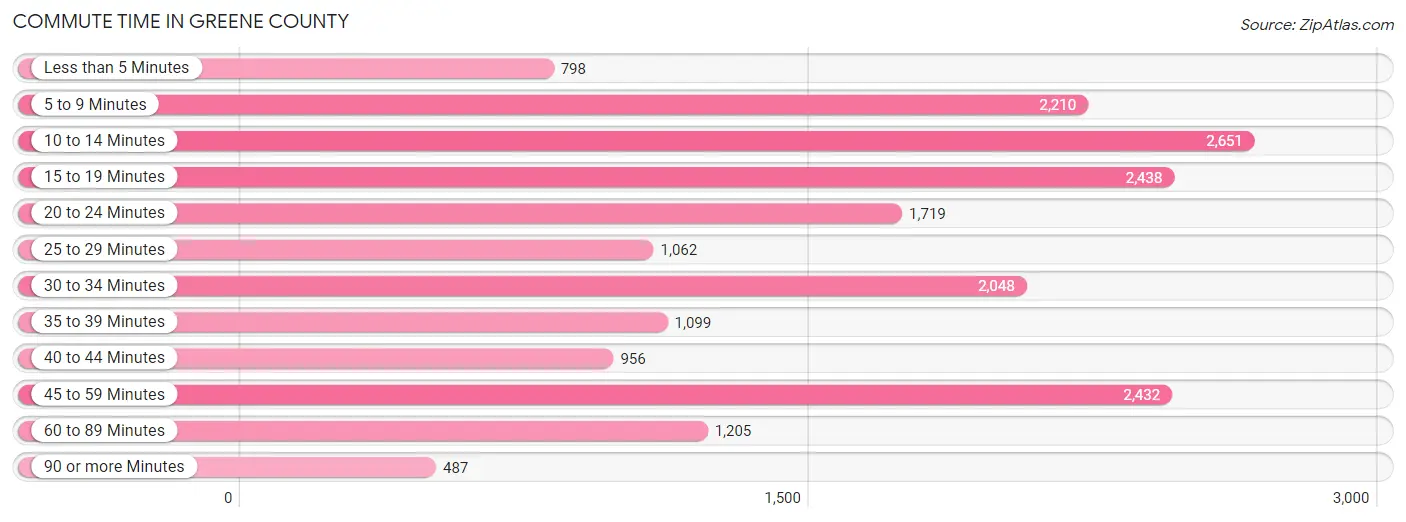
| Commute Time | # Commuters | % Commuters |
| Less than 5 Minutes | 798 | 4.2% |
| 5 to 9 Minutes | 2,210 | 11.6% |
| 10 to 14 Minutes | 2,651 | 13.9% |
| 15 to 19 Minutes | 2,438 | 12.8% |
| 20 to 24 Minutes | 1,719 | 9.0% |
| 25 to 29 Minutes | 1,062 | 5.6% |
| 30 to 34 Minutes | 2,048 | 10.7% |
| 35 to 39 Minutes | 1,099 | 5.8% |
| 40 to 44 Minutes | 956 | 5.0% |
| 45 to 59 Minutes | 2,432 | 12.7% |
| 60 to 89 Minutes | 1,205 | 6.3% |
| 90 or more Minutes | 487 | 2.5% |
Commute Time by Sex in Greene County
The most common commute times in Greene County are 15 to 19 minutes (1,353 commuters, 13.3%) for males and 10 to 14 minutes (1,352 commuters, 15.1%) for females.
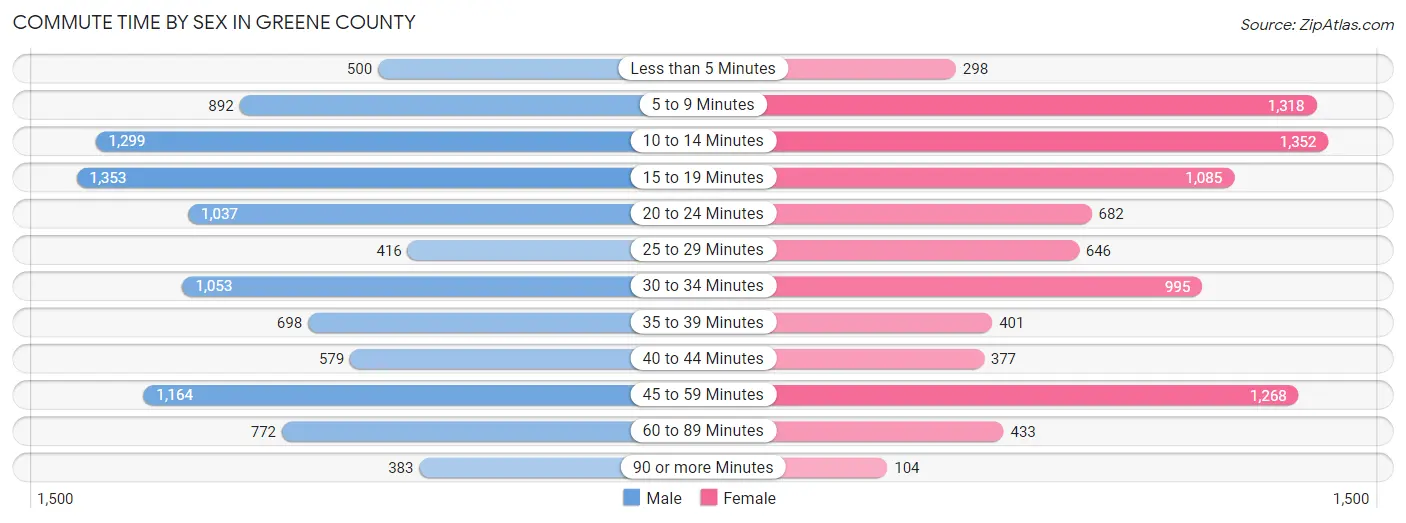
| Commute Time | Male | Female |
| Less than 5 Minutes | 500 (4.9%) | 298 (3.3%) |
| 5 to 9 Minutes | 892 (8.8%) | 1,318 (14.7%) |
| 10 to 14 Minutes | 1,299 (12.8%) | 1,352 (15.1%) |
| 15 to 19 Minutes | 1,353 (13.3%) | 1,085 (12.1%) |
| 20 to 24 Minutes | 1,037 (10.2%) | 682 (7.6%) |
| 25 to 29 Minutes | 416 (4.1%) | 646 (7.2%) |
| 30 to 34 Minutes | 1,053 (10.4%) | 995 (11.1%) |
| 35 to 39 Minutes | 698 (6.9%) | 401 (4.5%) |
| 40 to 44 Minutes | 579 (5.7%) | 377 (4.2%) |
| 45 to 59 Minutes | 1,164 (11.5%) | 1,268 (14.1%) |
| 60 to 89 Minutes | 772 (7.6%) | 433 (4.8%) |
| 90 or more Minutes | 383 (3.8%) | 104 (1.2%) |
Time of Departure to Work by Sex in Greene County
The most frequent times of departure to work in Greene County are 6:00 AM to 6:29 AM (1,673, 16.5%) for males and 7:00 AM to 7:29 AM (1,567, 17.5%) for females.
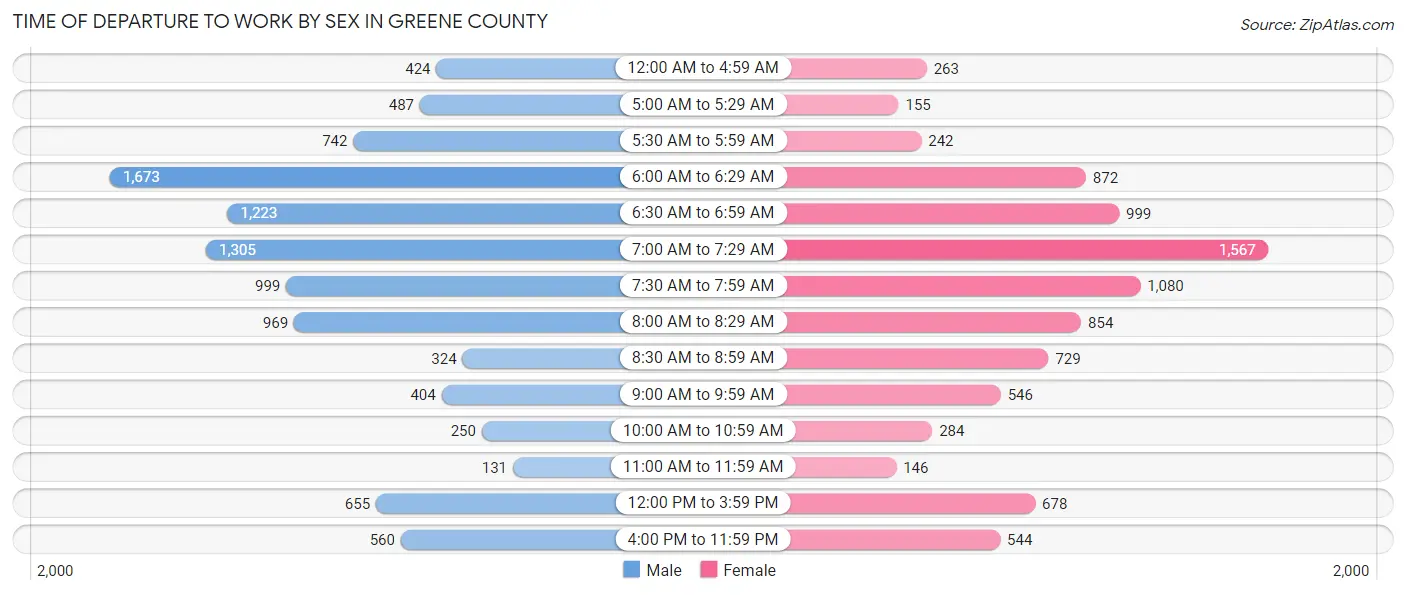
| Time of Departure | Male | Female |
| 12:00 AM to 4:59 AM | 424 (4.2%) | 263 (2.9%) |
| 5:00 AM to 5:29 AM | 487 (4.8%) | 155 (1.7%) |
| 5:30 AM to 5:59 AM | 742 (7.3%) | 242 (2.7%) |
| 6:00 AM to 6:29 AM | 1,673 (16.5%) | 872 (9.7%) |
| 6:30 AM to 6:59 AM | 1,223 (12.0%) | 999 (11.2%) |
| 7:00 AM to 7:29 AM | 1,305 (12.9%) | 1,567 (17.5%) |
| 7:30 AM to 7:59 AM | 999 (9.9%) | 1,080 (12.0%) |
| 8:00 AM to 8:29 AM | 969 (9.6%) | 854 (9.5%) |
| 8:30 AM to 8:59 AM | 324 (3.2%) | 729 (8.1%) |
| 9:00 AM to 9:59 AM | 404 (4.0%) | 546 (6.1%) |
| 10:00 AM to 10:59 AM | 250 (2.5%) | 284 (3.2%) |
| 11:00 AM to 11:59 AM | 131 (1.3%) | 146 (1.6%) |
| 12:00 PM to 3:59 PM | 655 (6.5%) | 678 (7.6%) |
| 4:00 PM to 11:59 PM | 560 (5.5%) | 544 (6.1%) |
| Total | 10,146 (100.0%) | 8,959 (100.0%) |
Housing Occupancy in Greene County
Occupancy by Ownership in Greene County
Of the total 17,903 dwellings in Greene County, owner-occupied units account for 13,589 (75.9%), while renter-occupied units make up 4,314 (24.1%).
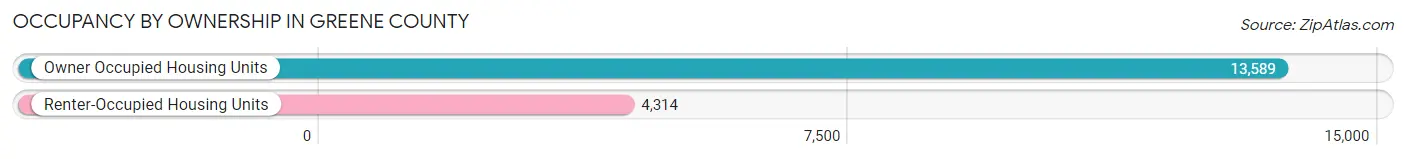
| Occupancy | # Housing Units | % Housing Units |
| Owner Occupied Housing Units | 13,589 | 75.9% |
| Renter-Occupied Housing Units | 4,314 | 24.1% |
| Total Occupied Housing Units | 17,903 | 100.0% |
Occupancy by Household Size in Greene County
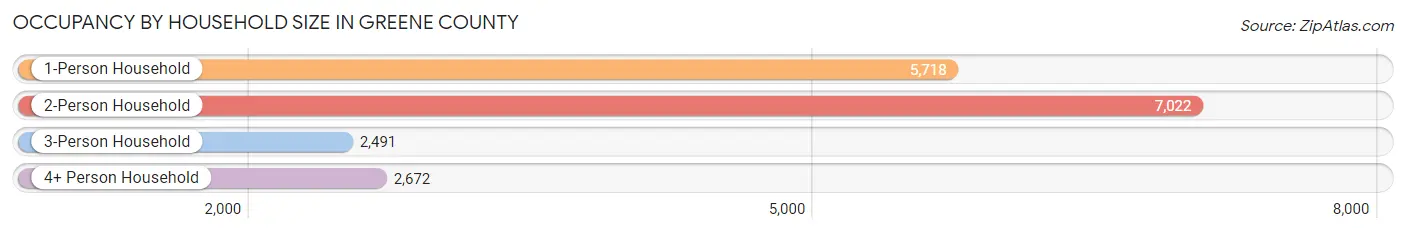
| Household Size | # Housing Units | % Housing Units |
| 1-Person Household | 5,718 | 31.9% |
| 2-Person Household | 7,022 | 39.2% |
| 3-Person Household | 2,491 | 13.9% |
| 4+ Person Household | 2,672 | 14.9% |
| Total Housing Units | 17,903 | 100.0% |
Occupancy by Ownership by Household Size in Greene County
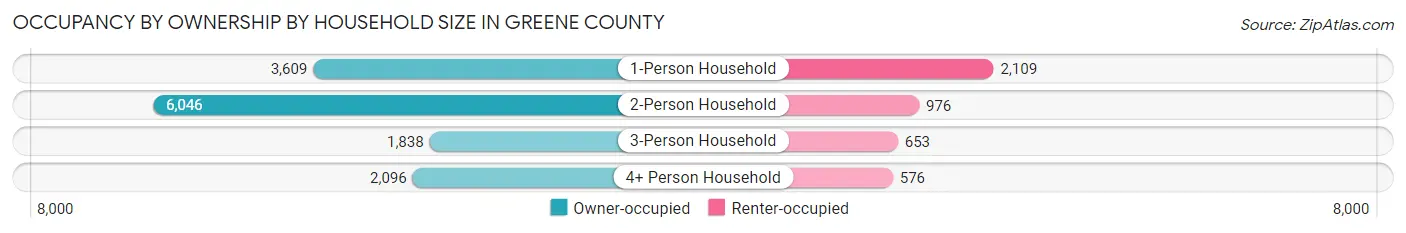
| Household Size | Owner-occupied | Renter-occupied |
| 1-Person Household | 3,609 (63.1%) | 2,109 (36.9%) |
| 2-Person Household | 6,046 (86.1%) | 976 (13.9%) |
| 3-Person Household | 1,838 (73.8%) | 653 (26.2%) |
| 4+ Person Household | 2,096 (78.4%) | 576 (21.6%) |
| Total Housing Units | 13,589 (75.9%) | 4,314 (24.1%) |
Occupancy by Educational Attainment in Greene County
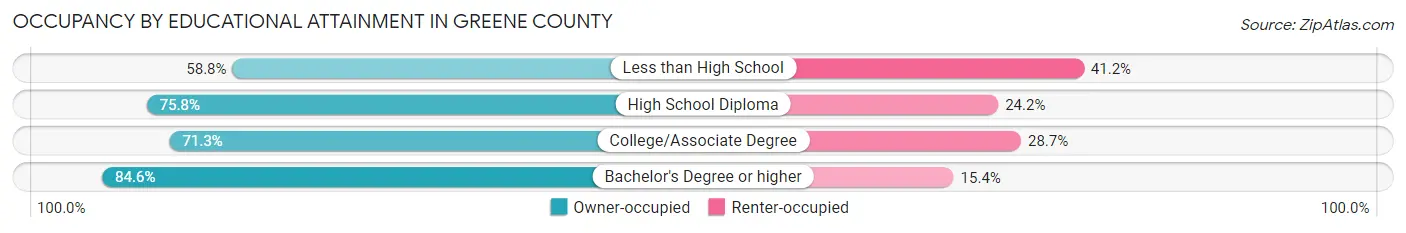
| Household Size | Owner-occupied | Renter-occupied |
| Less than High School | 758 (58.8%) | 531 (41.2%) |
| High School Diploma | 4,597 (75.8%) | 1,468 (24.2%) |
| College/Associate Degree | 3,706 (71.3%) | 1,493 (28.7%) |
| Bachelor's Degree or higher | 4,528 (84.6%) | 822 (15.4%) |
Occupancy by Age of Householder in Greene County
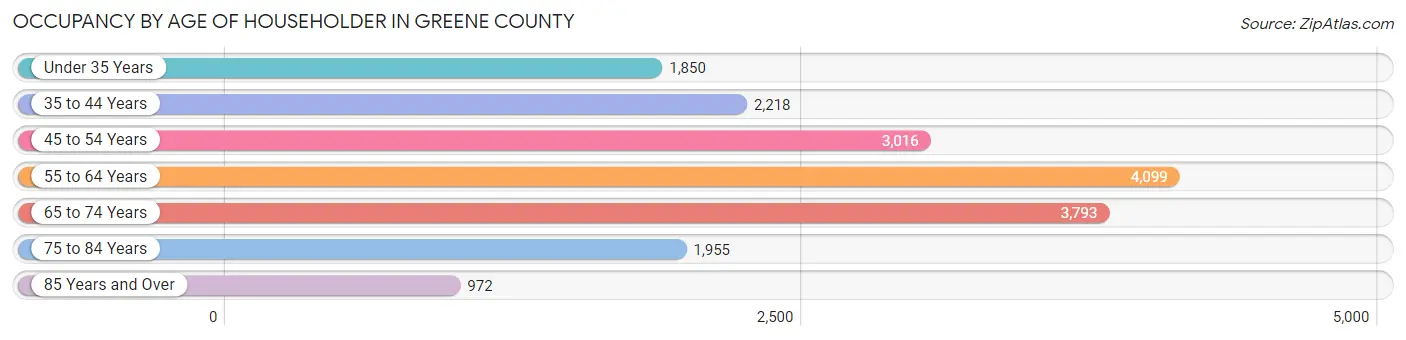
| Age Bracket | # Households | % Households |
| Under 35 Years | 1,850 | 10.3% |
| 35 to 44 Years | 2,218 | 12.4% |
| 45 to 54 Years | 3,016 | 16.9% |
| 55 to 64 Years | 4,099 | 22.9% |
| 65 to 74 Years | 3,793 | 21.2% |
| 75 to 84 Years | 1,955 | 10.9% |
| 85 Years and Over | 972 | 5.4% |
| Total | 17,903 | 100.0% |
Housing Finances in Greene County
Median Income by Occupancy in Greene County
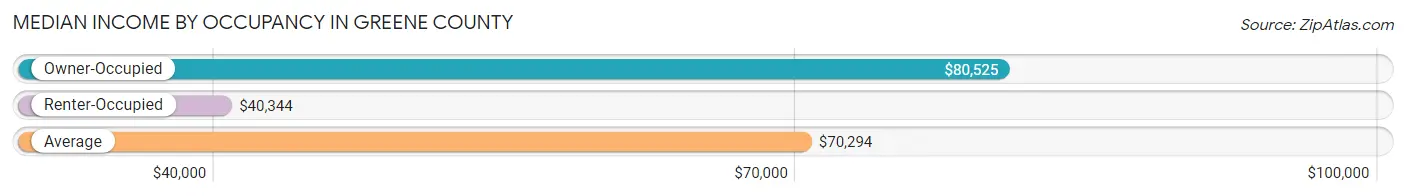
| Occupancy Type | # Households | Median Income |
| Owner-Occupied | 13,589 (75.9%) | $80,525 |
| Renter-Occupied | 4,314 (24.1%) | $40,344 |
| Average | 17,903 (100.0%) | $70,294 |
Occupancy by Householder Income Bracket in Greene County
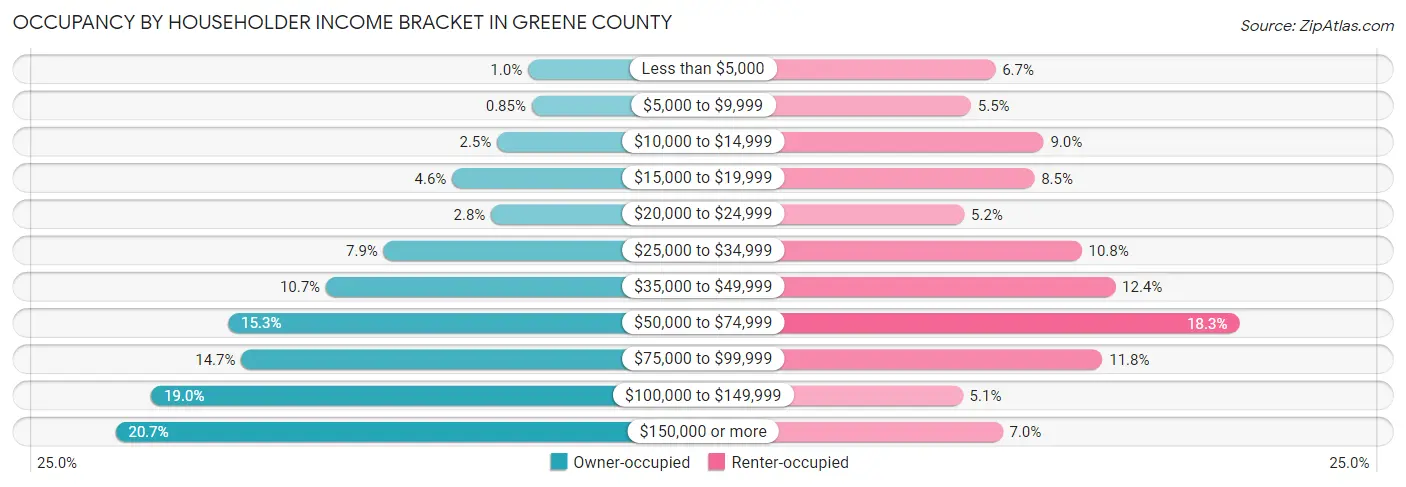
| Income Bracket | Owner-occupied | Renter-occupied |
| Less than $5,000 | 140 (1.0%) | 287 (6.7%) |
| $5,000 to $9,999 | 115 (0.9%) | 237 (5.5%) |
| $10,000 to $14,999 | 340 (2.5%) | 386 (8.9%) |
| $15,000 to $19,999 | 631 (4.6%) | 367 (8.5%) |
| $20,000 to $24,999 | 378 (2.8%) | 223 (5.2%) |
| $25,000 to $34,999 | 1,074 (7.9%) | 464 (10.8%) |
| $35,000 to $49,999 | 1,447 (10.6%) | 533 (12.4%) |
| $50,000 to $74,999 | 2,080 (15.3%) | 788 (18.3%) |
| $75,000 to $99,999 | 1,995 (14.7%) | 507 (11.7%) |
| $100,000 to $149,999 | 2,579 (19.0%) | 220 (5.1%) |
| $150,000 or more | 2,810 (20.7%) | 302 (7.0%) |
| Total | 13,589 (100.0%) | 4,314 (100.0%) |
Monthly Housing Cost Tiers in Greene County
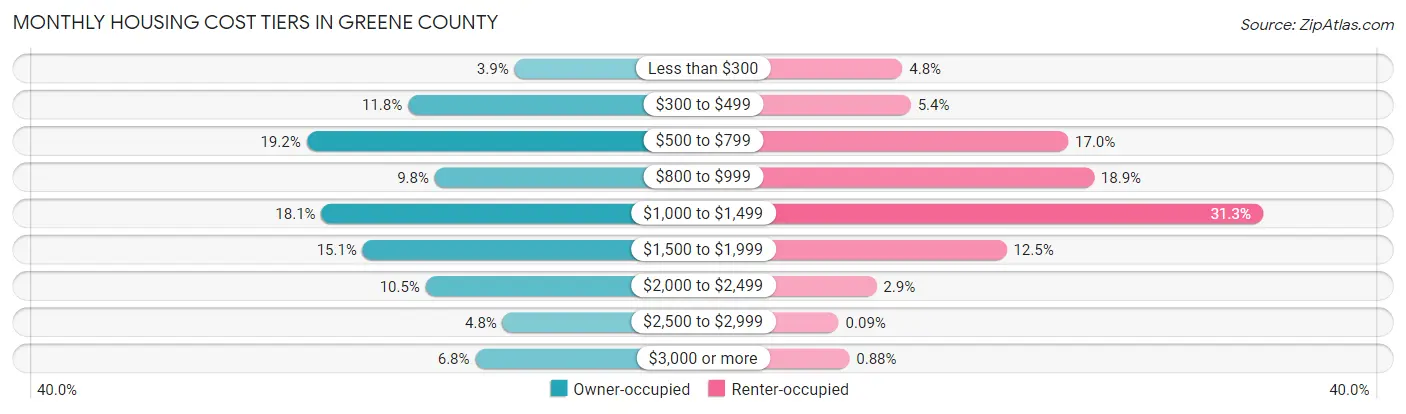
| Monthly Cost | Owner-occupied | Renter-occupied |
| Less than $300 | 533 (3.9%) | 206 (4.8%) |
| $300 to $499 | 1,598 (11.8%) | 233 (5.4%) |
| $500 to $799 | 2,615 (19.2%) | 733 (17.0%) |
| $800 to $999 | 1,330 (9.8%) | 815 (18.9%) |
| $1,000 to $1,499 | 2,465 (18.1%) | 1,351 (31.3%) |
| $1,500 to $1,999 | 2,052 (15.1%) | 537 (12.4%) |
| $2,000 to $2,499 | 1,421 (10.5%) | 124 (2.9%) |
| $2,500 to $2,999 | 651 (4.8%) | 4 (0.1%) |
| $3,000 or more | 924 (6.8%) | 38 (0.9%) |
| Total | 13,589 (100.0%) | 4,314 (100.0%) |
Physical Housing Characteristics in Greene County
Housing Structures in Greene County
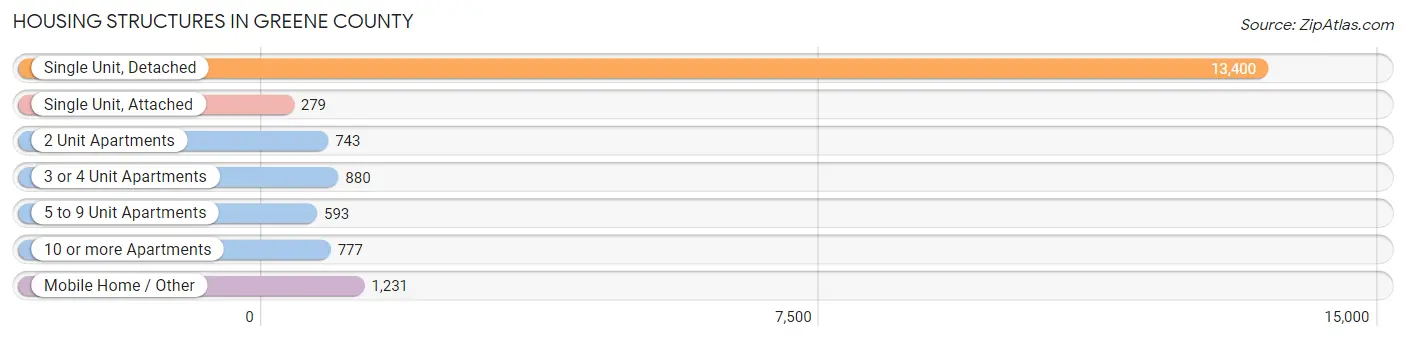
| Structure Type | # Housing Units | % Housing Units |
| Single Unit, Detached | 13,400 | 74.9% |
| Single Unit, Attached | 279 | 1.6% |
| 2 Unit Apartments | 743 | 4.2% |
| 3 or 4 Unit Apartments | 880 | 4.9% |
| 5 to 9 Unit Apartments | 593 | 3.3% |
| 10 or more Apartments | 777 | 4.3% |
| Mobile Home / Other | 1,231 | 6.9% |
| Total | 17,903 | 100.0% |
Housing Structures by Occupancy in Greene County
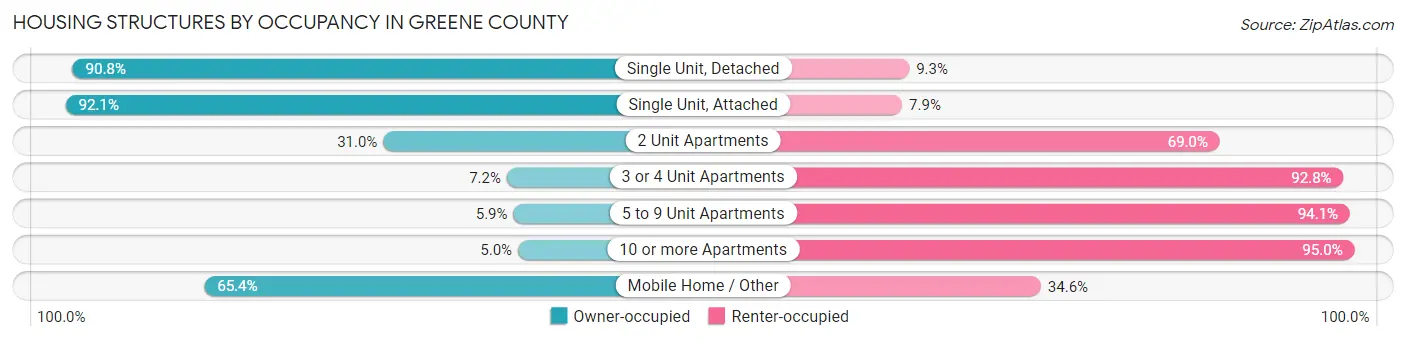
| Structure Type | Owner-occupied | Renter-occupied |
| Single Unit, Detached | 12,160 (90.7%) | 1,240 (9.2%) |
| Single Unit, Attached | 257 (92.1%) | 22 (7.9%) |
| 2 Unit Apartments | 230 (31.0%) | 513 (69.0%) |
| 3 or 4 Unit Apartments | 63 (7.2%) | 817 (92.8%) |
| 5 to 9 Unit Apartments | 35 (5.9%) | 558 (94.1%) |
| 10 or more Apartments | 39 (5.0%) | 738 (95.0%) |
| Mobile Home / Other | 805 (65.4%) | 426 (34.6%) |
| Total | 13,589 (75.9%) | 4,314 (24.1%) |
Housing Structures by Number of Rooms in Greene County
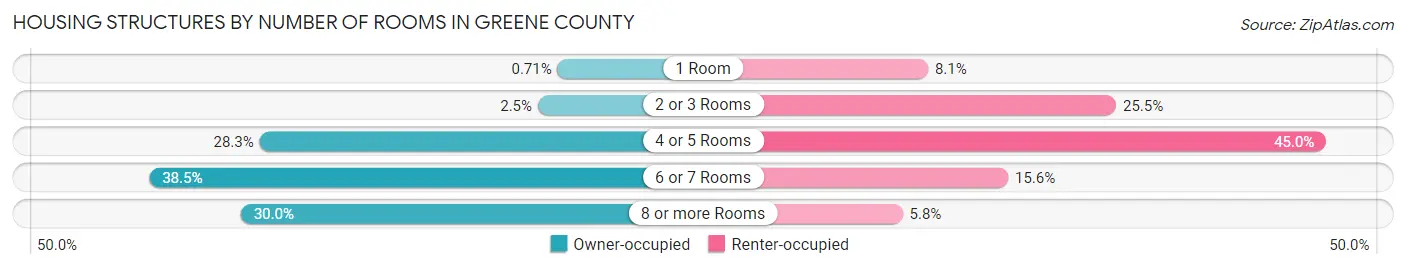
| Number of Rooms | Owner-occupied | Renter-occupied |
| 1 Room | 97 (0.7%) | 351 (8.1%) |
| 2 or 3 Rooms | 344 (2.5%) | 1,102 (25.5%) |
| 4 or 5 Rooms | 3,842 (28.3%) | 1,940 (45.0%) |
| 6 or 7 Rooms | 5,228 (38.5%) | 671 (15.5%) |
| 8 or more Rooms | 4,078 (30.0%) | 250 (5.8%) |
| Total | 13,589 (100.0%) | 4,314 (100.0%) |
Housing Structure by Heating Type in Greene County
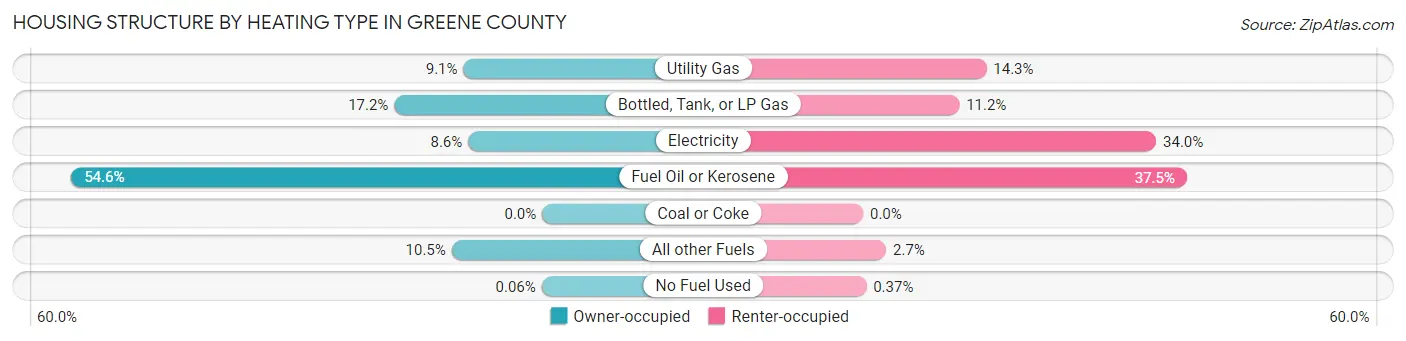
| Heating Type | Owner-occupied | Renter-occupied |
| Utility Gas | 1,240 (9.1%) | 617 (14.3%) |
| Bottled, Tank, or LP Gas | 2,331 (17.2%) | 481 (11.2%) |
| Electricity | 1,166 (8.6%) | 1,466 (34.0%) |
| Fuel Oil or Kerosene | 7,418 (54.6%) | 1,619 (37.5%) |
| Coal or Coke | 0 (0.0%) | 0 (0.0%) |
| All other Fuels | 1,426 (10.5%) | 115 (2.7%) |
| No Fuel Used | 8 (0.1%) | 16 (0.4%) |
| Total | 13,589 (100.0%) | 4,314 (100.0%) |
Household Vehicle Usage in Greene County
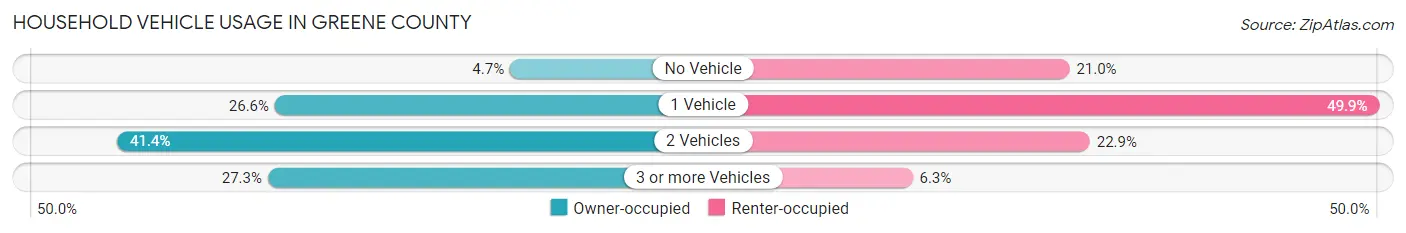
| Vehicles per Household | Owner-occupied | Renter-occupied |
| No Vehicle | 637 (4.7%) | 904 (21.0%) |
| 1 Vehicle | 3,620 (26.6%) | 2,152 (49.9%) |
| 2 Vehicles | 5,622 (41.4%) | 986 (22.9%) |
| 3 or more Vehicles | 3,710 (27.3%) | 272 (6.3%) |
| Total | 13,589 (100.0%) | 4,314 (100.0%) |
Real Estate & Mortgages in Greene County
Real Estate and Mortgage Overview in Greene County
| Characteristic | Without Mortgage | With Mortgage |
| Housing Units | 6,518 | 7,071 |
| Median Property Value | $212,800 | $250,900 |
| Median Household Income | $62,188 | $1,890 |
| Monthly Housing Costs | $635 | $825 |
| Real Estate Taxes | $3,321 | $165 |
Property Value by Mortgage Status in Greene County
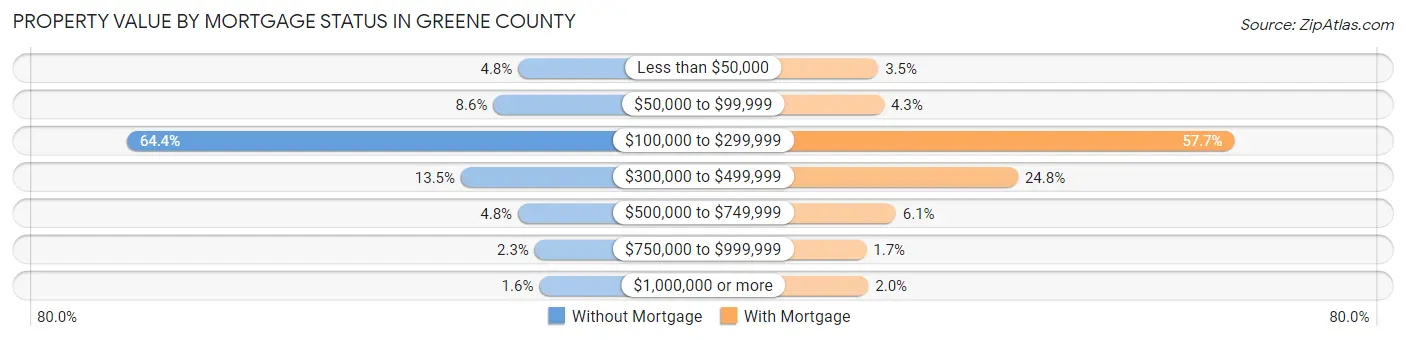
| Property Value | Without Mortgage | With Mortgage |
| Less than $50,000 | 313 (4.8%) | 244 (3.5%) |
| $50,000 to $99,999 | 560 (8.6%) | 306 (4.3%) |
| $100,000 to $299,999 | 4,198 (64.4%) | 4,082 (57.7%) |
| $300,000 to $499,999 | 881 (13.5%) | 1,750 (24.7%) |
| $500,000 to $749,999 | 315 (4.8%) | 434 (6.1%) |
| $750,000 to $999,999 | 148 (2.3%) | 117 (1.7%) |
| $1,000,000 or more | 103 (1.6%) | 138 (1.9%) |
| Total | 6,518 (100.0%) | 7,071 (100.0%) |
Household Income by Mortgage Status in Greene County
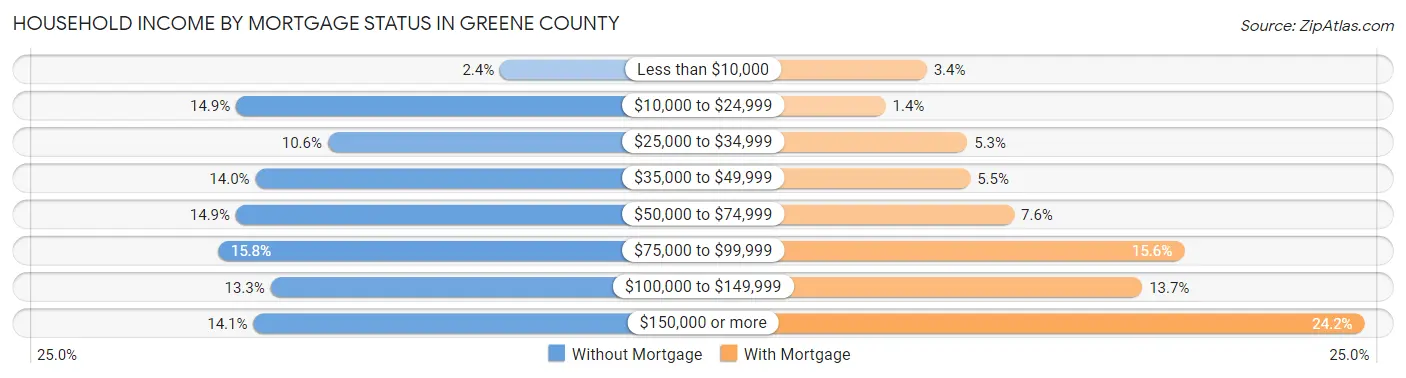
| Household Income | Without Mortgage | With Mortgage |
| Less than $10,000 | 154 (2.4%) | 240 (3.4%) |
| $10,000 to $24,999 | 973 (14.9%) | 101 (1.4%) |
| $25,000 to $34,999 | 688 (10.6%) | 376 (5.3%) |
| $35,000 to $49,999 | 913 (14.0%) | 386 (5.5%) |
| $50,000 to $74,999 | 974 (14.9%) | 534 (7.5%) |
| $75,000 to $99,999 | 1,030 (15.8%) | 1,106 (15.6%) |
| $100,000 to $149,999 | 866 (13.3%) | 965 (13.7%) |
| $150,000 or more | 920 (14.1%) | 1,713 (24.2%) |
| Total | 6,518 (100.0%) | 7,071 (100.0%) |
Property Value to Household Income Ratio in Greene County
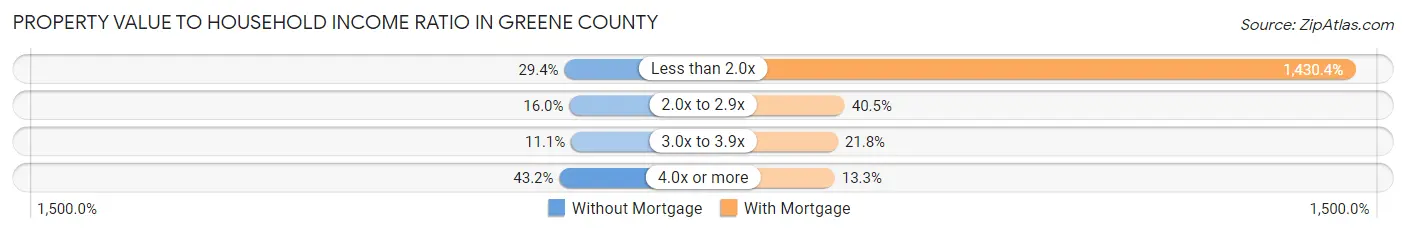
| Value-to-Income Ratio | Without Mortgage | With Mortgage |
| Less than 2.0x | 1,917 (29.4%) | 101,140 (1,430.3%) |
| 2.0x to 2.9x | 1,043 (16.0%) | 2,863 (40.5%) |
| 3.0x to 3.9x | 726 (11.1%) | 1,543 (21.8%) |
| 4.0x or more | 2,817 (43.2%) | 943 (13.3%) |
| Total | 6,518 (100.0%) | 7,071 (100.0%) |
Real Estate Taxes by Mortgage Status in Greene County
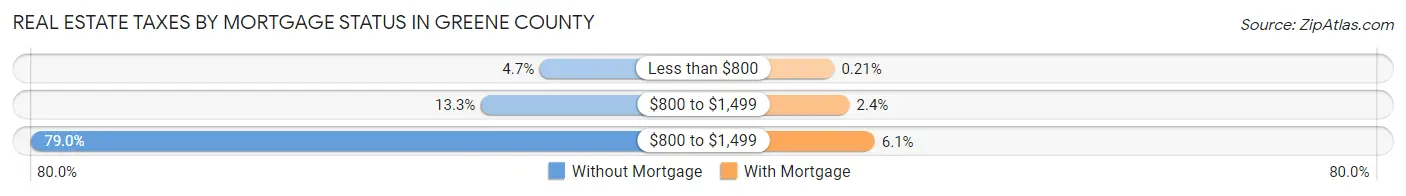
| Property Taxes | Without Mortgage | With Mortgage |
| Less than $800 | 306 (4.7%) | 15 (0.2%) |
| $800 to $1,499 | 866 (13.3%) | 171 (2.4%) |
| $800 to $1,499 | 5,150 (79.0%) | 432 (6.1%) |
| Total | 6,518 (100.0%) | 7,071 (100.0%) |
Health & Disability in Greene County
Health Insurance Coverage by Age in Greene County
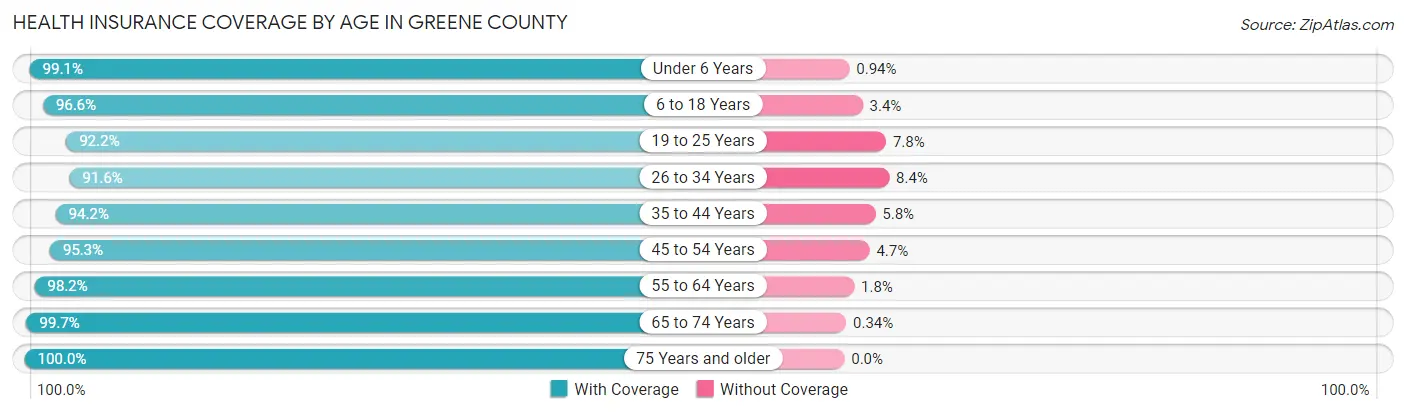
| Age Bracket | With Coverage | Without Coverage |
| Under 6 Years | 2,412 (99.1%) | 23 (0.9%) |
| 6 to 18 Years | 5,552 (96.6%) | 196 (3.4%) |
| 19 to 25 Years | 3,218 (92.2%) | 271 (7.8%) |
| 26 to 34 Years | 4,407 (91.6%) | 402 (8.4%) |
| 35 to 44 Years | 4,654 (94.2%) | 286 (5.8%) |
| 45 to 54 Years | 5,574 (95.3%) | 275 (4.7%) |
| 55 to 64 Years | 7,367 (98.2%) | 137 (1.8%) |
| 65 to 74 Years | 6,425 (99.7%) | 22 (0.3%) |
| 75 Years and older | 4,507 (100.0%) | 0 (0.0%) |
| Total | 44,116 (96.5%) | 1,612 (3.5%) |
Health Insurance Coverage by Citizenship Status in Greene County
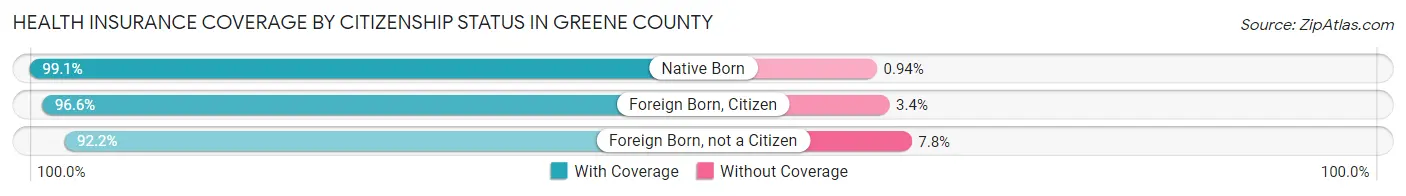
| Citizenship Status | With Coverage | Without Coverage |
| Native Born | 2,412 (99.1%) | 23 (0.9%) |
| Foreign Born, Citizen | 5,552 (96.6%) | 196 (3.4%) |
| Foreign Born, not a Citizen | 3,218 (92.2%) | 271 (7.8%) |
Health Insurance Coverage by Household Income in Greene County
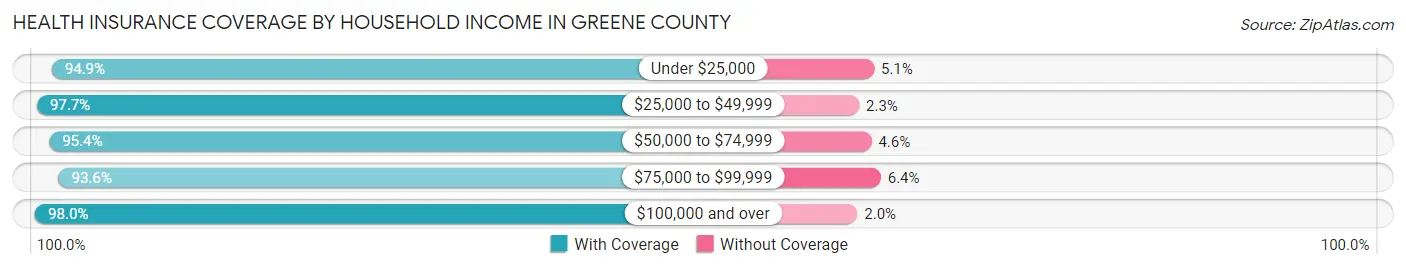
| Household Income | With Coverage | Without Coverage |
| Under $25,000 | 4,858 (94.9%) | 261 (5.1%) |
| $25,000 to $49,999 | 6,647 (97.7%) | 157 (2.3%) |
| $50,000 to $74,999 | 7,044 (95.4%) | 341 (4.6%) |
| $75,000 to $99,999 | 6,396 (93.6%) | 435 (6.4%) |
| $100,000 and over | 18,587 (98.0%) | 375 (2.0%) |
Public vs Private Health Insurance Coverage by Age in Greene County
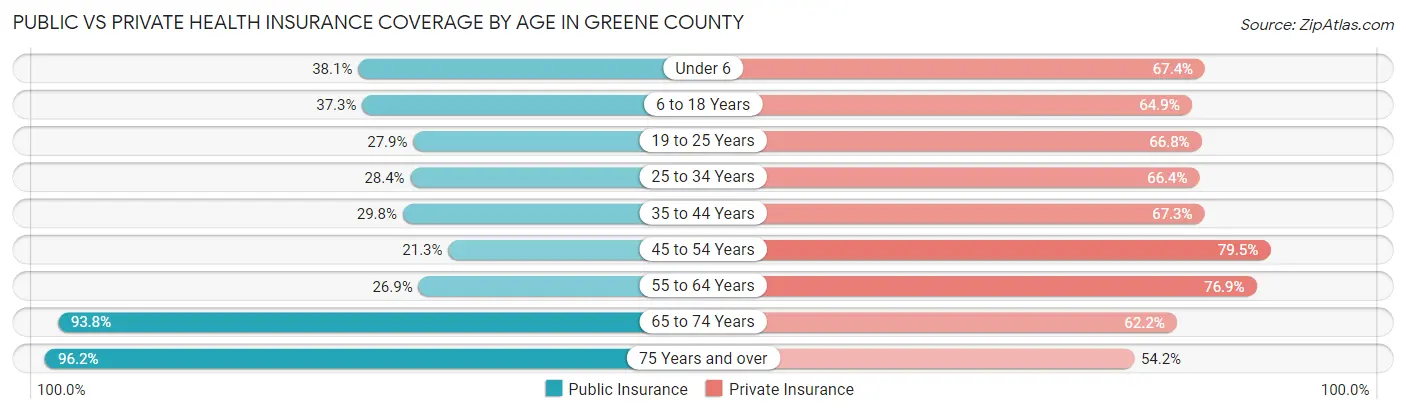
| Age Bracket | Public Insurance | Private Insurance |
| Under 6 | 927 (38.1%) | 1,641 (67.4%) |
| 6 to 18 Years | 2,145 (37.3%) | 3,731 (64.9%) |
| 19 to 25 Years | 972 (27.9%) | 2,329 (66.7%) |
| 25 to 34 Years | 1,365 (28.4%) | 3,191 (66.3%) |
| 35 to 44 Years | 1,472 (29.8%) | 3,324 (67.3%) |
| 45 to 54 Years | 1,248 (21.3%) | 4,648 (79.5%) |
| 55 to 64 Years | 2,018 (26.9%) | 5,773 (76.9%) |
| 65 to 74 Years | 6,050 (93.8%) | 4,007 (62.2%) |
| 75 Years and over | 4,335 (96.2%) | 2,444 (54.2%) |
| Total | 20,532 (44.9%) | 31,088 (68.0%) |
Disability Status by Sex by Age in Greene County
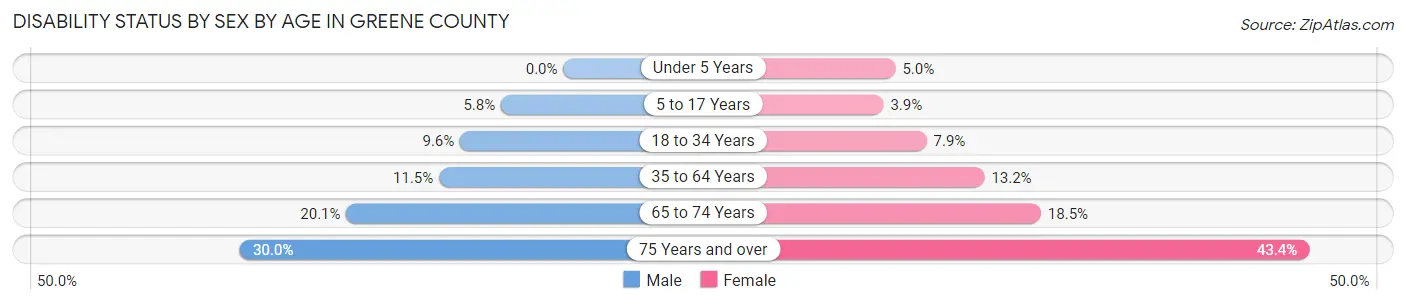
| Age Bracket | Male | Female |
| Under 5 Years | 0 (0.0%) | 53 (5.0%) |
| 5 to 17 Years | 170 (5.8%) | 106 (3.9%) |
| 18 to 34 Years | 448 (9.6%) | 318 (7.9%) |
| 35 to 64 Years | 1,028 (11.5%) | 1,242 (13.2%) |
| 65 to 74 Years | 639 (20.1%) | 605 (18.5%) |
| 75 Years and over | 605 (30.0%) | 1,080 (43.4%) |
Disability Class by Sex by Age in Greene County
Disability Class: Hearing Difficulty
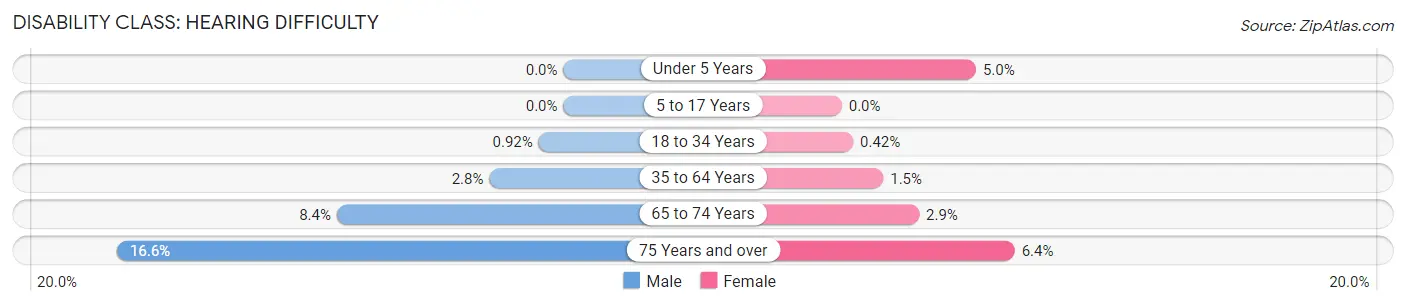
| Age Bracket | Male | Female |
| Under 5 Years | 0 (0.0%) | 53 (5.0%) |
| 5 to 17 Years | 0 (0.0%) | 0 (0.0%) |
| 18 to 34 Years | 43 (0.9%) | 17 (0.4%) |
| 35 to 64 Years | 245 (2.8%) | 144 (1.5%) |
| 65 to 74 Years | 267 (8.4%) | 94 (2.9%) |
| 75 Years and over | 334 (16.6%) | 160 (6.4%) |
Disability Class: Vision Difficulty
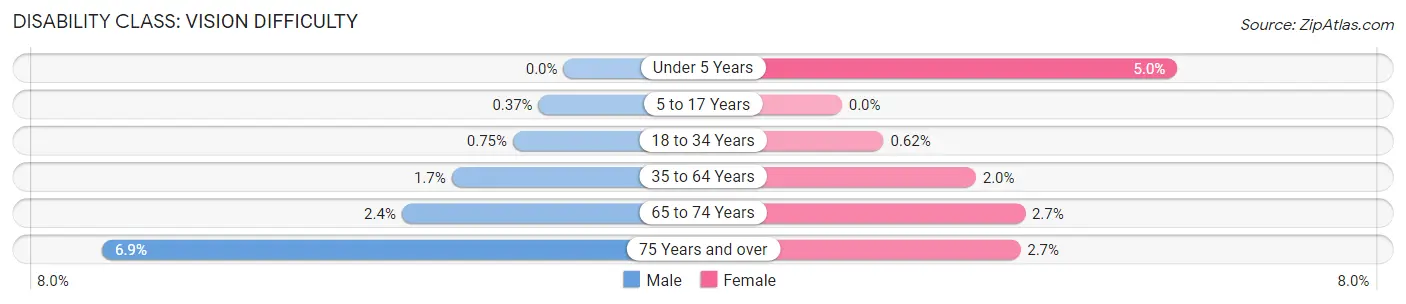
| Age Bracket | Male | Female |
| Under 5 Years | 0 (0.0%) | 53 (5.0%) |
| 5 to 17 Years | 11 (0.4%) | 0 (0.0%) |
| 18 to 34 Years | 35 (0.7%) | 25 (0.6%) |
| 35 to 64 Years | 148 (1.7%) | 187 (2.0%) |
| 65 to 74 Years | 76 (2.4%) | 89 (2.7%) |
| 75 Years and over | 138 (6.9%) | 66 (2.6%) |
Disability Class: Cognitive Difficulty
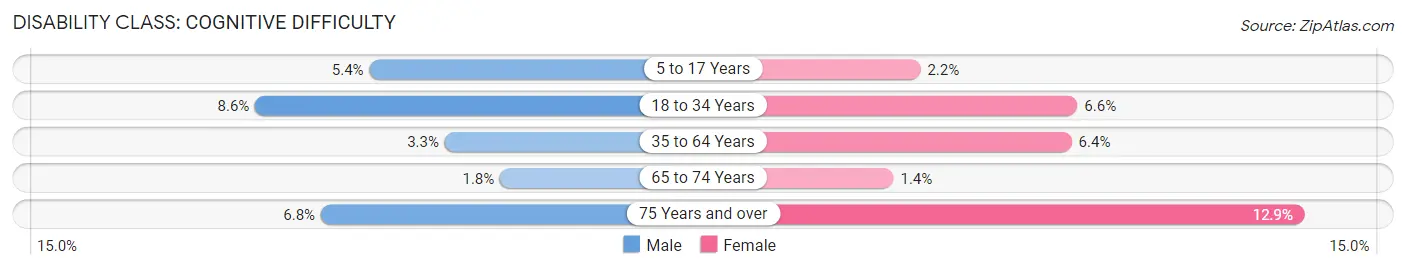
| Age Bracket | Male | Female |
| 5 to 17 Years | 159 (5.4%) | 60 (2.2%) |
| 18 to 34 Years | 401 (8.6%) | 265 (6.6%) |
| 35 to 64 Years | 294 (3.3%) | 600 (6.4%) |
| 65 to 74 Years | 56 (1.8%) | 47 (1.4%) |
| 75 Years and over | 136 (6.8%) | 321 (12.9%) |
Disability Class: Ambulatory Difficulty
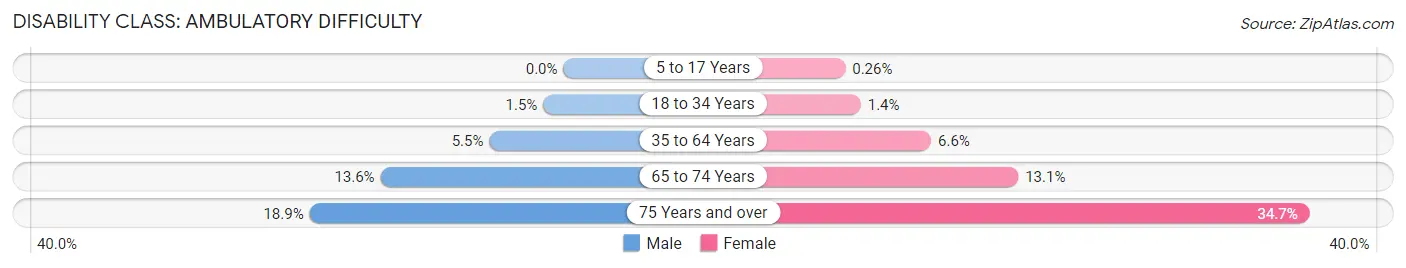
| Age Bracket | Male | Female |
| 5 to 17 Years | 0 (0.0%) | 7 (0.3%) |
| 18 to 34 Years | 70 (1.5%) | 57 (1.4%) |
| 35 to 64 Years | 490 (5.5%) | 622 (6.6%) |
| 65 to 74 Years | 431 (13.6%) | 429 (13.1%) |
| 75 Years and over | 380 (18.9%) | 865 (34.7%) |
Disability Class: Self-Care Difficulty
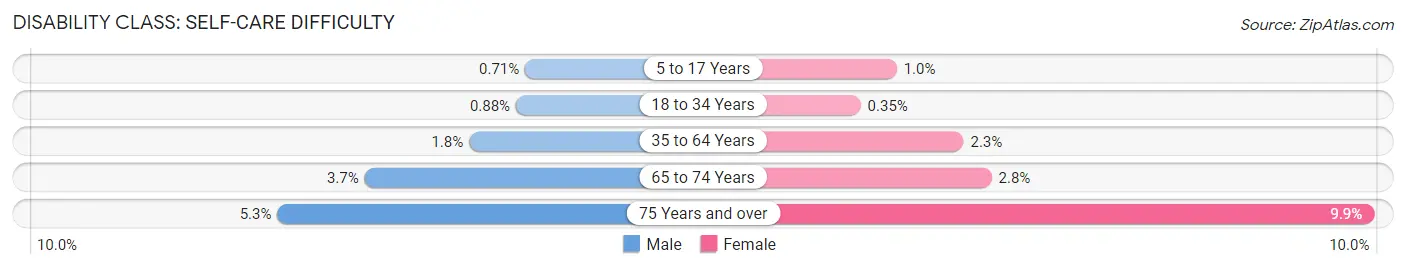
| Age Bracket | Male | Female |
| 5 to 17 Years | 21 (0.7%) | 28 (1.0%) |
| 18 to 34 Years | 41 (0.9%) | 14 (0.4%) |
| 35 to 64 Years | 156 (1.8%) | 212 (2.3%) |
| 65 to 74 Years | 117 (3.7%) | 91 (2.8%) |
| 75 Years and over | 107 (5.3%) | 246 (9.9%) |
Technology Access in Greene County
Computing Device Access in Greene County
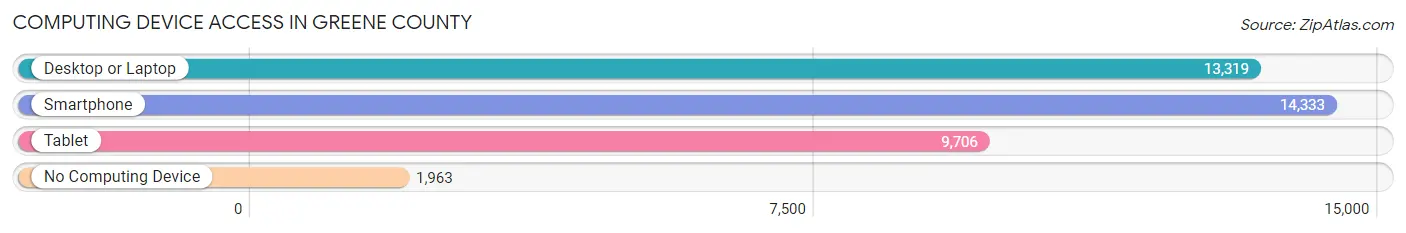
| Device Type | # Households | % Households |
| Desktop or Laptop | 13,319 | 74.4% |
| Smartphone | 14,333 | 80.1% |
| Tablet | 9,706 | 54.2% |
| No Computing Device | 1,963 | 11.0% |
| Total | 17,903 | 100.0% |
Internet Access in Greene County
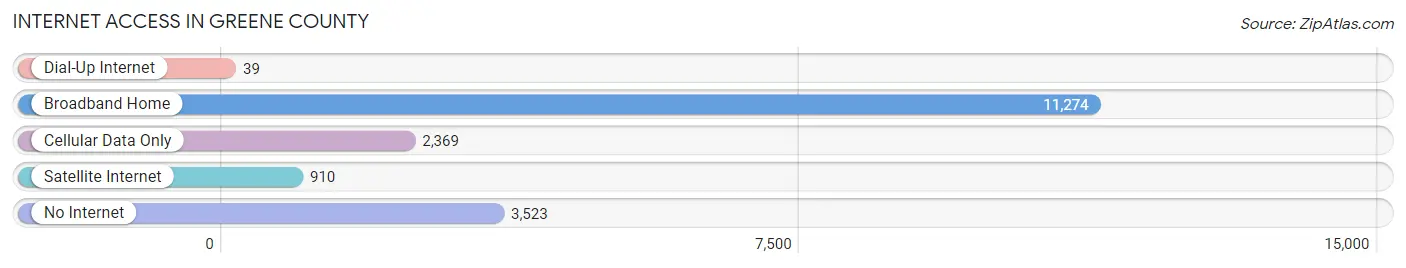
| Internet Type | # Households | % Households |
| Dial-Up Internet | 39 | 0.2% |
| Broadband Home | 11,274 | 63.0% |
| Cellular Data Only | 2,369 | 13.2% |
| Satellite Internet | 910 | 5.1% |
| No Internet | 3,523 | 19.7% |
| Total | 17,903 | 100.0% |
Greene County Summary
Greene County is located in the southeastern corner of New York State, and is part of the Catskill Mountains region. It is bordered by Albany County to the north, Schoharie County to the west, Ulster County to the south, and Columbia County to the east. The county seat is Catskill, and the largest city is Coxsackie. The county has a total area of 632 square miles, and a population of 49,221 as of the 2010 census.
Geography
Greene County is located in the southeastern corner of New York State, and is part of the Catskill Mountains region. It is bordered by Albany County to the north, Schoharie County to the west, Ulster County to the south, and Columbia County to the east. The county has a total area of 632 square miles, and is mostly rural and mountainous. The highest point in the county is Hunter Mountain, at an elevation of 4,040 feet. The county is home to several state parks, including Catskill Park, Kaaterskill Wild Forest, and North-South Lake State Park.
History
Greene County was established in 1800, and was named after General Nathanael Greene, a hero of the American Revolution. The county was originally part of Albany County, and was later divided into Ulster and Columbia counties. The county seat is Catskill, which was established in 1788. The county was largely rural until the mid-19th century, when the Delaware and Hudson Canal was built, connecting the Hudson River to the Delaware River. This led to an influx of industry and population to the area, and the county’s population grew rapidly.
Economy
Greene County’s economy is largely based on tourism, agriculture, and manufacturing. The county is home to several ski resorts, including Hunter Mountain and Windham Mountain, which attract visitors from all over the world. Agriculture is also an important part of the county’s economy, with dairy farming being the most common type of farming. Manufacturing is also an important part of the county’s economy, with companies such as General Electric and IBM having plants in the county.
Demographics
As of the 2010 census, Greene County had a population of 49,221. The racial makeup of the county was 90.2% White, 4.3% African American, 0.7% Native American, 1.2% Asian, 0.1% Pacific Islander, 1.7% from other races, and 1.8% from two or more races. Hispanic or Latino of any race were 5.2% of the population. The median income for a household in the county was $45,945, and the median income for a family was $54,945. The per capita income for the county was $22,945.
Greene County is a rural county with a diverse population and economy. It is home to several ski resorts, and is a popular tourist destination. Agriculture and manufacturing are also important parts of the county’s economy, and the county has a median income that is slightly higher than the state average.
Common Questions
What is Per Capita Income in Greene County?
Per Capita income in Greene County is $38,587.
What is the Median Family Income in Greene County?
Median Family Income in Greene County is $90,989.
What is the Median Household income in Greene County?
Median Household Income in Greene County is $70,294.
What is Income or Wage Gap in Greene County?
Income or Wage Gap in Greene County is 27.3%.
Women in Greene County earn 72.7 cents for every dollar earned by a man.
What is Family Income Deficit in Greene County?
Family Income Deficit in Greene County is $9,789.
Families that are below poverty line in Greene County earn $9,789 less on average than the poverty threshold level.
What is Inequality or Gini Index in Greene County?
Inequality or Gini Index in Greene County is 0.46.
What is the Total Population of Greene County?
Total Population of Greene County is 48,067.
What is the Total Male Population of Greene County?
Total Male Population of Greene County is 24,926.
What is the Total Female Population of Greene County?
Total Female Population of Greene County is 23,141.
What is the Ratio of Males per 100 Females in Greene County?
There are 107.71 Males per 100 Females in Greene County.
What is the Ratio of Females per 100 Males in Greene County?
There are 92.84 Females per 100 Males in Greene County.
What is the Median Population Age in Greene County?
Median Population Age in Greene County is 47.0 Years.
What is the Average Family Size in Greene County
Average Family Size in Greene County is 3.2 People.
What is the Average Household Size in Greene County
Average Household Size in Greene County is 2.5 People.
How Large is the Labor Force in Greene County?
There are 22,581 People in the Labor Forcein in Greene County.
What is the Percentage of People in the Labor Force in Greene County?
54.9% of People are in the Labor Force in Greene County.
What is the Unemployment Rate in Greene County?
Unemployment Rate in Greene County is 2.8%.