Franklin County, NY Map & Demographics
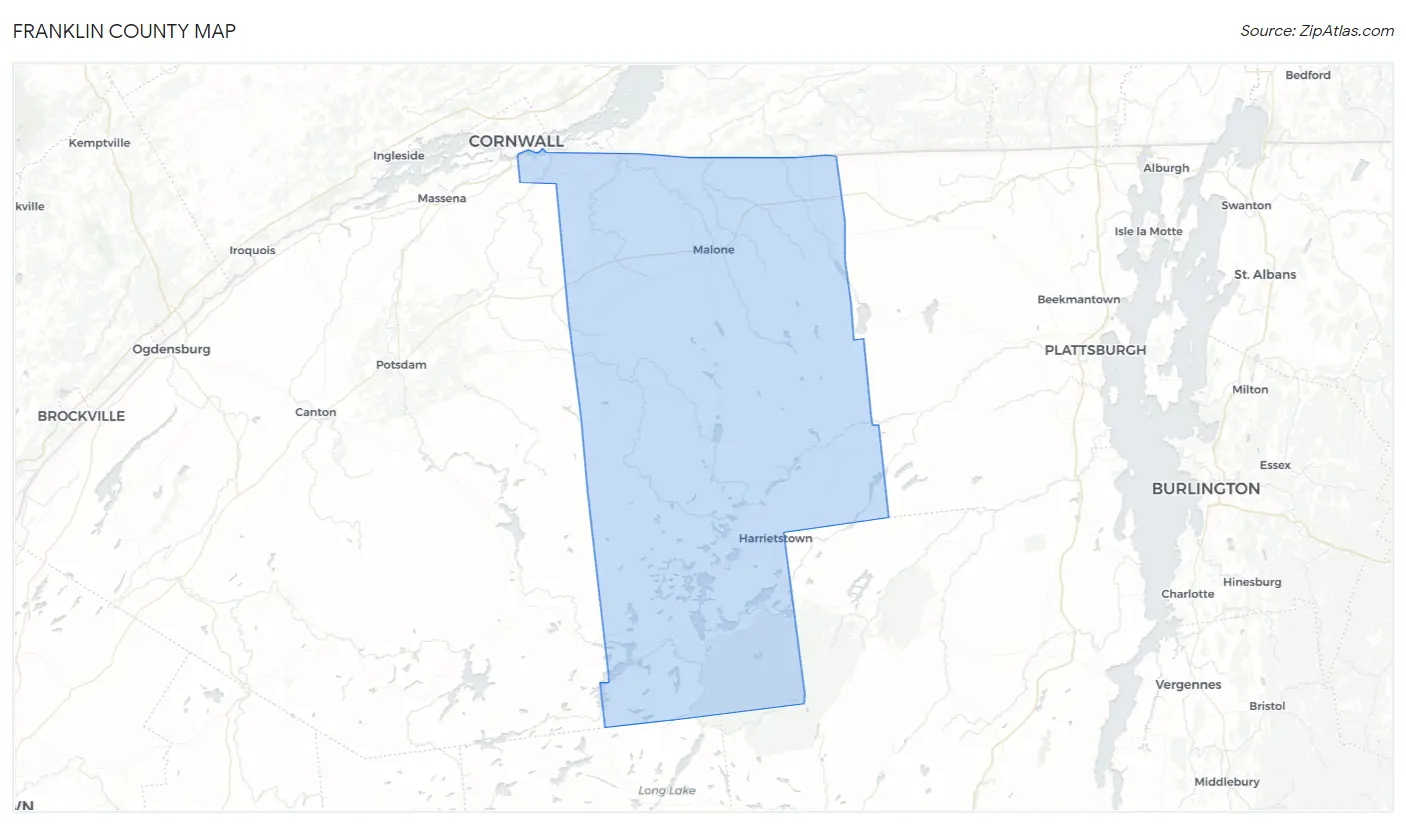
Franklin County Map
Franklin County Overview
$30,411
PER CAPITA INCOME
$73,285
AVG FAMILY INCOME
$60,270
AVG HOUSEHOLD INCOME
13.3%
WAGE / INCOME GAP [ % ]
86.7¢/ $1
WAGE / INCOME GAP [ $ ]
$11,319
FAMILY INCOME DEFICIT
0.44
INEQUALITY / GINI INDEX
47,459
TOTAL POPULATION
25,027
MALE POPULATION
22,432
FEMALE POPULATION
111.57
MALES / 100 FEMALES
89.63
FEMALES / 100 MALES
41.9
MEDIAN AGE
2.8
AVG FAMILY SIZE
2.3
AVG HOUSEHOLD SIZE
20,373
LABOR FORCE [ PEOPLE ]
52.2%
PERCENT IN LABOR FORCE
5.1%
UNEMPLOYMENT RATE
Franklin County Area Codes
Income in Franklin County
Income Overview in Franklin County
Per Capita Income in Franklin County is $30,411, while median incomes of families and households are $73,285 and $60,270 respectively.
| Characteristic | Number | Measure |
| Per Capita Income | 47,459 | $30,411 |
| Median Family Income | 11,724 | $73,285 |
| Mean Family Income | 11,724 | $91,234 |
| Median Household Income | 18,933 | $60,270 |
| Mean Household Income | 18,933 | $76,986 |
| Income Deficit | 11,724 | $11,319 |
| Wage / Income Gap (%) | 47,459 | 13.27% |
| Wage / Income Gap ($) | 47,459 | 86.73¢ per $1 |
| Gini / Inequality Index | 47,459 | 0.44 |
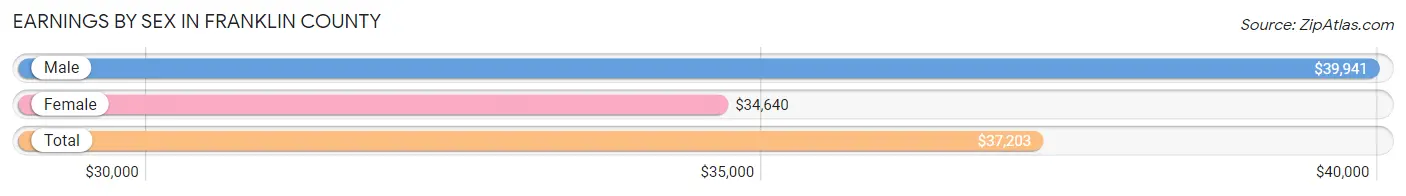
Earnings by Sex in Franklin County
Average Earnings in Franklin County are $37,203, $39,941 for men and $34,640 for women, a difference of 13.3%.
| Sex | Number | Average Earnings |
| Male | 11,646 (53.5%) | $39,941 |
| Female | 10,125 (46.5%) | $34,640 |
| Total | 21,771 (100.0%) | $37,203 |
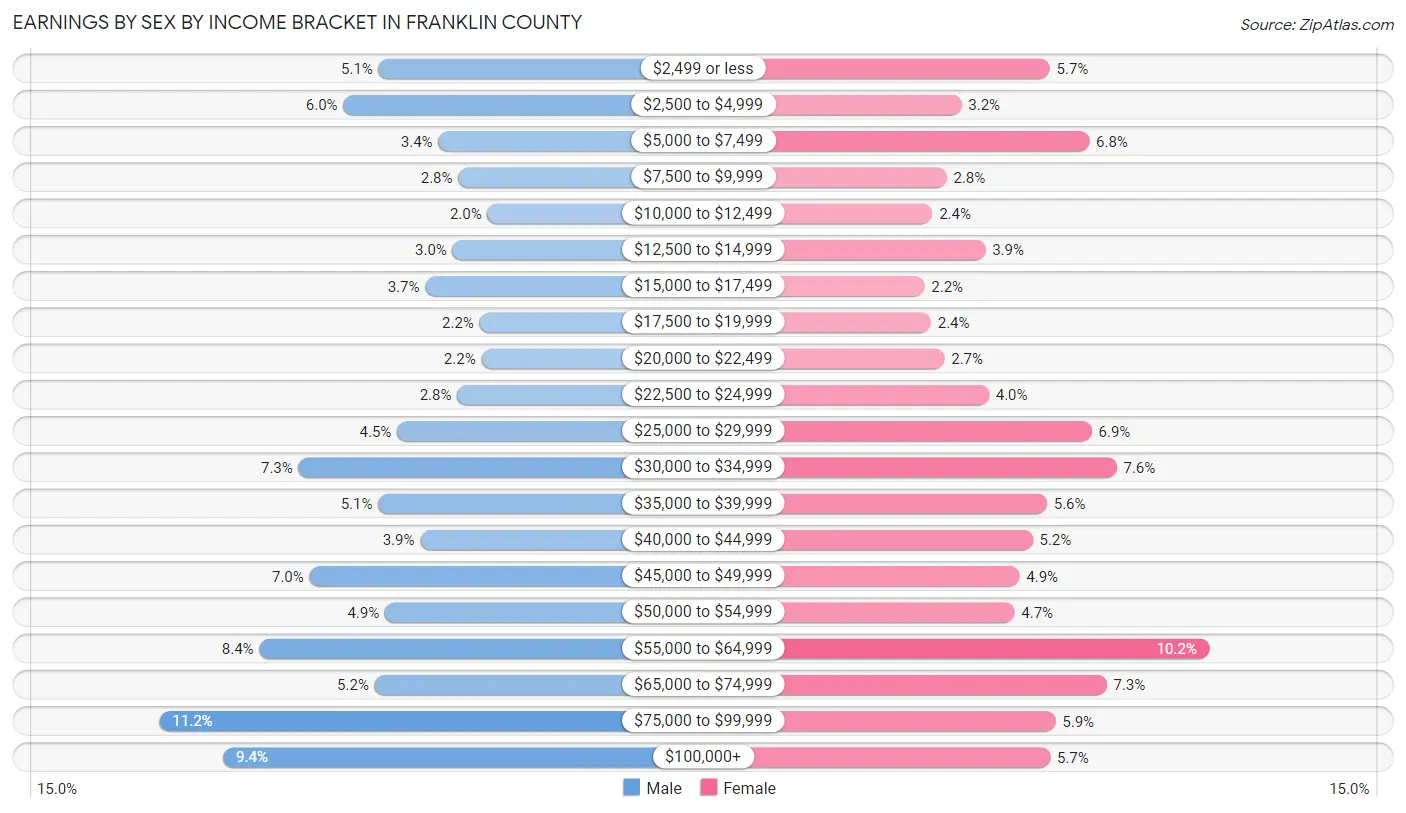
Earnings by Sex by Income Bracket in Franklin County
The most common earnings brackets in Franklin County are $75,000 to $99,999 for men (1,305 | 11.2%) and $55,000 to $64,999 for women (1,030 | 10.2%).
| Income | Male | Female |
| $2,499 or less | 588 (5.1%) | 577 (5.7%) |
| $2,500 to $4,999 | 704 (6.0%) | 326 (3.2%) |
| $5,000 to $7,499 | 393 (3.4%) | 690 (6.8%) |
| $7,500 to $9,999 | 327 (2.8%) | 284 (2.8%) |
| $10,000 to $12,499 | 232 (2.0%) | 243 (2.4%) |
| $12,500 to $14,999 | 346 (3.0%) | 394 (3.9%) |
| $15,000 to $17,499 | 436 (3.7%) | 221 (2.2%) |
| $17,500 to $19,999 | 257 (2.2%) | 239 (2.4%) |
| $20,000 to $22,499 | 251 (2.2%) | 277 (2.7%) |
| $22,500 to $24,999 | 331 (2.8%) | 404 (4.0%) |
| $25,000 to $29,999 | 528 (4.5%) | 697 (6.9%) |
| $30,000 to $34,999 | 850 (7.3%) | 767 (7.6%) |
| $35,000 to $39,999 | 589 (5.1%) | 569 (5.6%) |
| $40,000 to $44,999 | 452 (3.9%) | 529 (5.2%) |
| $45,000 to $49,999 | 814 (7.0%) | 491 (4.9%) |
| $50,000 to $54,999 | 567 (4.9%) | 477 (4.7%) |
| $55,000 to $64,999 | 978 (8.4%) | 1,030 (10.2%) |
| $65,000 to $74,999 | 601 (5.2%) | 739 (7.3%) |
| $75,000 to $99,999 | 1,305 (11.2%) | 593 (5.9%) |
| $100,000+ | 1,097 (9.4%) | 578 (5.7%) |
| Total | 11,646 (100.0%) | 10,125 (100.0%) |
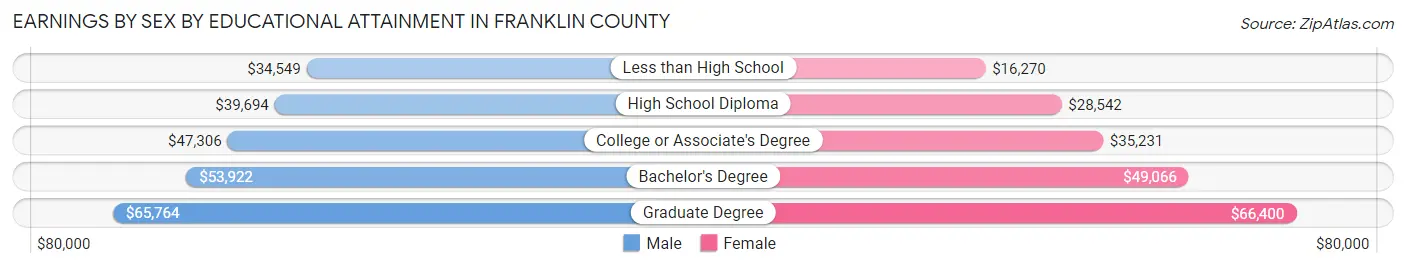
Earnings by Sex by Educational Attainment in Franklin County
Average earnings in Franklin County are $46,600 for men and $38,962 for women, a difference of 16.4%. Men with an educational attainment of graduate degree enjoy the highest average annual earnings of $65,764, while those with less than high school education earn the least with $34,549. Women with an educational attainment of graduate degree earn the most with the average annual earnings of $66,400, while those with less than high school education have the smallest earnings of $16,270.
| Educational Attainment | Male Income | Female Income |
| Less than High School | $34,549 | $16,270 |
| High School Diploma | $39,694 | $28,542 |
| College or Associate's Degree | $47,306 | $35,231 |
| Bachelor's Degree | $53,922 | $49,066 |
| Graduate Degree | $65,764 | $66,400 |
| Total | $46,600 | $38,962 |
Family Income in Franklin County
Family Income Brackets in Franklin County
According to the Franklin County family income data, there are 2,485 families falling into the $50,000 to $74,999 income range, which is the most common income bracket and makes up 21.2% of all families. Conversely, the $10,000 to $14,999 income bracket is the least frequent group with only 352 families (3.0%) belonging to this category.
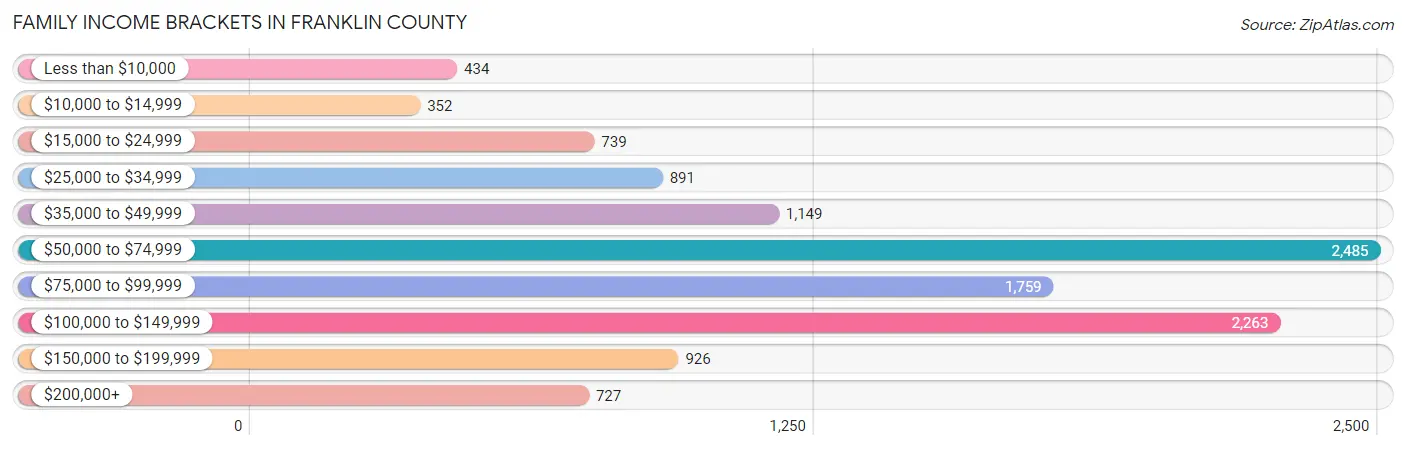
| Income Bracket | # Families | % Families |
| Less than $10,000 | 434 | 3.7% |
| $10,000 to $14,999 | 352 | 3.0% |
| $15,000 to $24,999 | 739 | 6.3% |
| $25,000 to $34,999 | 891 | 7.6% |
| $35,000 to $49,999 | 1,149 | 9.8% |
| $50,000 to $74,999 | 2,485 | 21.2% |
| $75,000 to $99,999 | 1,759 | 15.0% |
| $100,000 to $149,999 | 2,263 | 19.3% |
| $150,000 to $199,999 | 926 | 7.9% |
| $200,000+ | 727 | 6.2% |
Family Income by Famaliy Size in Franklin County
4-person families (1,797 | 15.3%) account for the highest median family income in Franklin County with $87,473 per family, while 2-person families (6,237 | 53.2%) have the highest median income of $34,749 per family member.
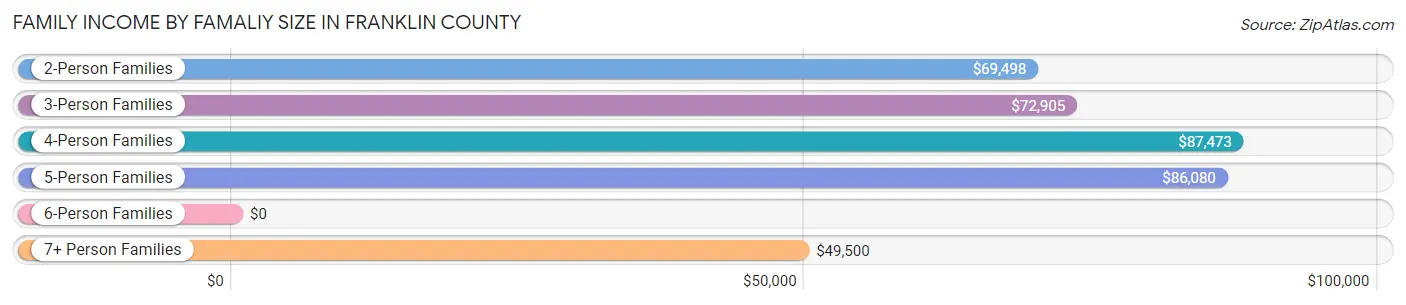
| Income Bracket | # Families | Median Income |
| 2-Person Families | 6,237 (53.2%) | $69,498 |
| 3-Person Families | 2,528 (21.6%) | $72,905 |
| 4-Person Families | 1,797 (15.3%) | $87,473 |
| 5-Person Families | 791 (6.8%) | $86,080 |
| 6-Person Families | 235 (2.0%) | $0 |
| 7+ Person Families | 136 (1.2%) | $49,500 |
| Total | 11,724 (100.0%) | $73,285 |
Family Income by Number of Earners in Franklin County
The median family income in Franklin County is $73,285, with families comprising 3+ earners (931) having the highest median family income of $140,655, while families with no earners (2,644) have the lowest median family income of $48,371, accounting for 7.9% and 22.6% of families, respectively.
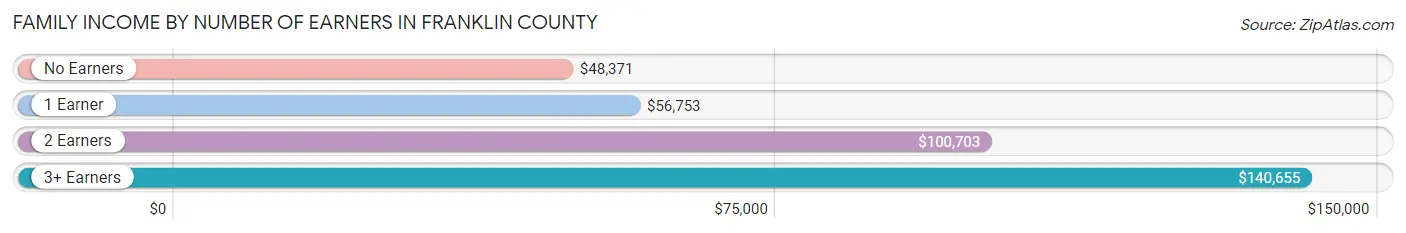
| Number of Earners | # Families | Median Income |
| No Earners | 2,644 (22.6%) | $48,371 |
| 1 Earner | 3,715 (31.7%) | $56,753 |
| 2 Earners | 4,434 (37.8%) | $100,703 |
| 3+ Earners | 931 (7.9%) | $140,655 |
| Total | 11,724 (100.0%) | $73,285 |
Household Income in Franklin County
Household Income Brackets in Franklin County
With 3,862 households falling in the category, the $50,000 to $74,999 income range is the most frequent in Franklin County, accounting for 20.4% of all households. In contrast, only 833 households (4.4%) fall into the $200,000+ income bracket, making it the least populous group.
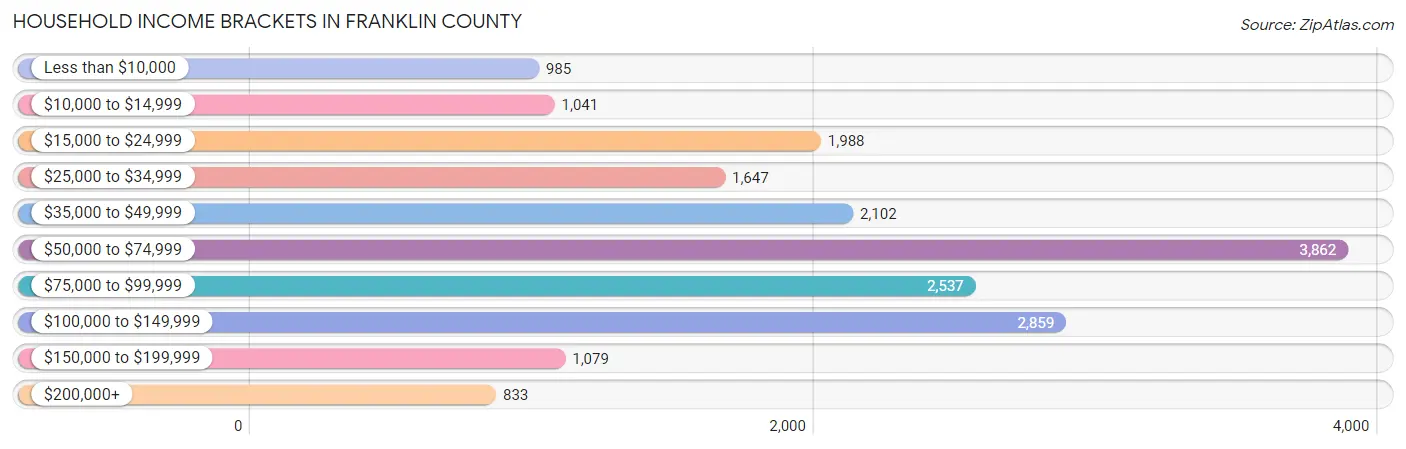
| Income Bracket | # Households | % Households |
| Less than $10,000 | 985 | 5.2% |
| $10,000 to $14,999 | 1,041 | 5.5% |
| $15,000 to $24,999 | 1,988 | 10.5% |
| $25,000 to $34,999 | 1,647 | 8.7% |
| $35,000 to $49,999 | 2,102 | 11.1% |
| $50,000 to $74,999 | 3,862 | 20.4% |
| $75,000 to $99,999 | 2,537 | 13.4% |
| $100,000 to $149,999 | 2,859 | 15.1% |
| $150,000 to $199,999 | 1,079 | 5.7% |
| $200,000+ | 833 | 4.4% |
Household Income by Householder Age in Franklin County
The median household income in Franklin County is $60,270, with the highest median household income of $75,746 found in the 45 to 64 years age bracket for the primary householder. A total of 7,373 households (38.9%) fall into this category. Meanwhile, the 65+ years age bracket for the primary householder has the lowest median household income of $42,370, with 5,892 households (31.1%) in this group.
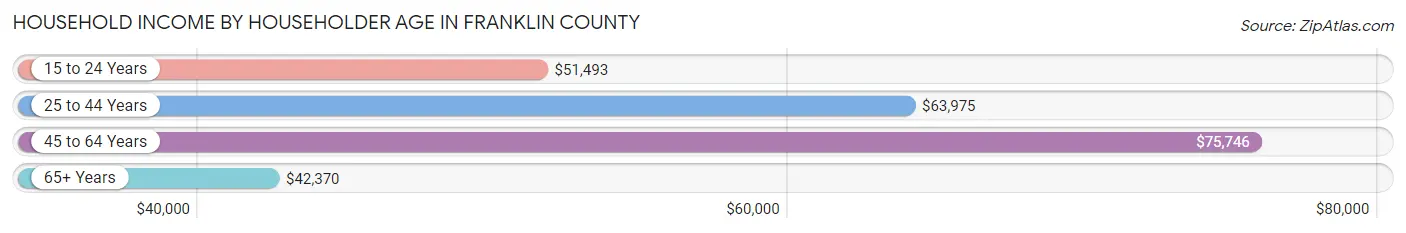
| Income Bracket | # Households | Median Income |
| 15 to 24 Years | 646 (3.4%) | $51,493 |
| 25 to 44 Years | 5,022 (26.5%) | $63,975 |
| 45 to 64 Years | 7,373 (38.9%) | $75,746 |
| 65+ Years | 5,892 (31.1%) | $42,370 |
| Total | 18,933 (100.0%) | $60,270 |
Poverty in Franklin County
Income Below Poverty by Sex and Age in Franklin County
With 16.4% poverty level for males and 19.3% for females among the residents of Franklin County, 6 to 11 year old males and under 5 year old females are the most vulnerable to poverty, with 487 males (33.1%) and 515 females (40.0%) in their respective age groups living below the poverty level.
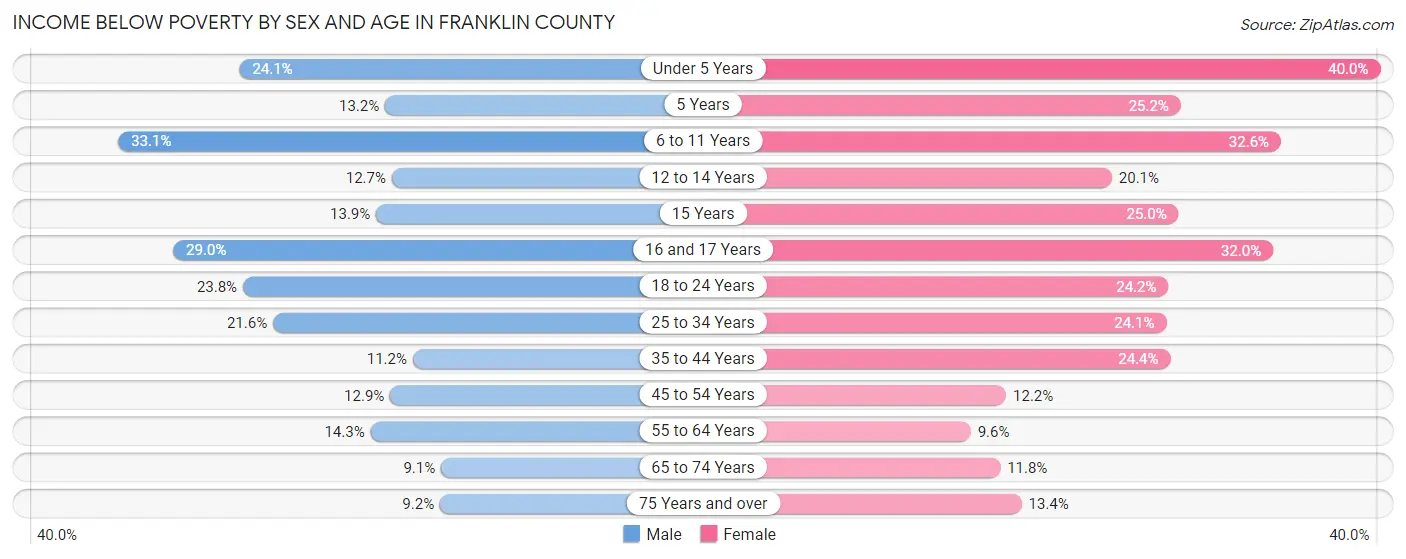
| Age Bracket | Male | Female |
| Under 5 Years | 253 (24.0%) | 515 (40.0%) |
| 5 Years | 38 (13.2%) | 39 (25.2%) |
| 6 to 11 Years | 487 (33.1%) | 432 (32.6%) |
| 12 to 14 Years | 101 (12.7%) | 165 (20.1%) |
| 15 Years | 36 (13.9%) | 86 (25.0%) |
| 16 and 17 Years | 186 (29.0%) | 177 (32.0%) |
| 18 to 24 Years | 309 (23.8%) | 381 (24.2%) |
| 25 to 34 Years | 584 (21.6%) | 581 (24.1%) |
| 35 to 44 Years | 271 (11.2%) | 580 (24.4%) |
| 45 to 54 Years | 372 (12.9%) | 367 (12.2%) |
| 55 to 64 Years | 495 (14.3%) | 328 (9.6%) |
| 65 to 74 Years | 238 (9.1%) | 303 (11.8%) |
| 75 Years and over | 132 (9.2%) | 263 (13.4%) |
| Total | 3,502 (16.4%) | 4,217 (19.3%) |
Income Above Poverty by Sex and Age in Franklin County
According to the poverty statistics in Franklin County, males aged 65 to 74 years and females aged 55 to 64 years are the age groups that are most secure financially, with 90.9% of males and 90.4% of females in these age groups living above the poverty line.
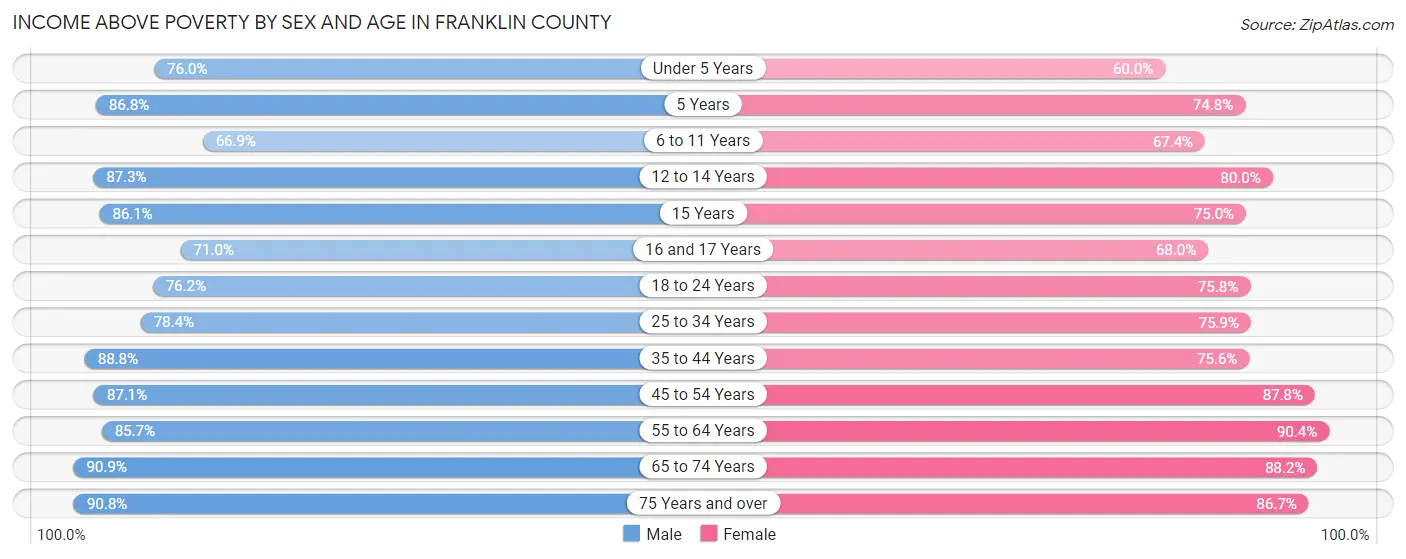
| Age Bracket | Male | Female |
| Under 5 Years | 799 (75.9%) | 773 (60.0%) |
| 5 Years | 249 (86.8%) | 116 (74.8%) |
| 6 to 11 Years | 986 (66.9%) | 893 (67.4%) |
| 12 to 14 Years | 692 (87.3%) | 658 (79.9%) |
| 15 Years | 223 (86.1%) | 258 (75.0%) |
| 16 and 17 Years | 456 (71.0%) | 376 (68.0%) |
| 18 to 24 Years | 990 (76.2%) | 1,191 (75.8%) |
| 25 to 34 Years | 2,125 (78.4%) | 1,831 (75.9%) |
| 35 to 44 Years | 2,154 (88.8%) | 1,798 (75.6%) |
| 45 to 54 Years | 2,520 (87.1%) | 2,642 (87.8%) |
| 55 to 64 Years | 2,962 (85.7%) | 3,098 (90.4%) |
| 65 to 74 Years | 2,384 (90.9%) | 2,273 (88.2%) |
| 75 Years and over | 1,309 (90.8%) | 1,707 (86.7%) |
| Total | 17,849 (83.6%) | 17,614 (80.7%) |
Income Below Poverty Among Married-Couple Families in Franklin County
The poverty statistics for married-couple families in Franklin County show that 5.8% or 521 of the total 8,939 families live below the poverty line. Families with 5 or more children have the highest poverty rate of 58.1%, comprising of 61 families. On the other hand, families with no children have the lowest poverty rate of 3.4%, which includes 209 families.
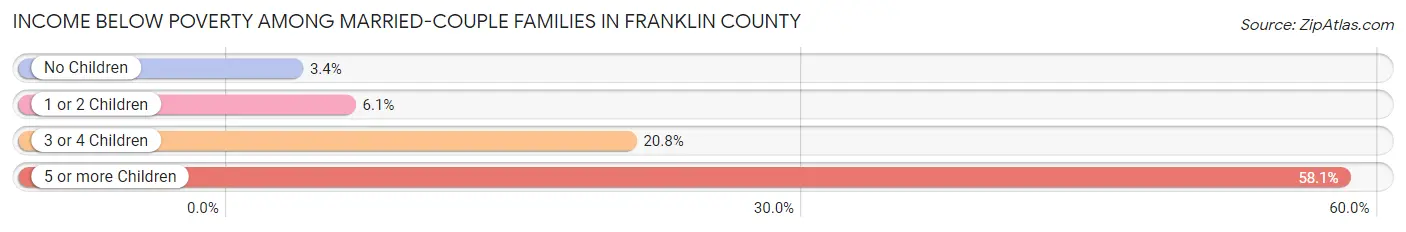
| Children | Above Poverty | Below Poverty |
| No Children | 5,949 (96.6%) | 209 (3.4%) |
| 1 or 2 Children | 1,957 (93.9%) | 128 (6.1%) |
| 3 or 4 Children | 468 (79.2%) | 123 (20.8%) |
| 5 or more Children | 44 (41.9%) | 61 (58.1%) |
| Total | 8,418 (94.2%) | 521 (5.8%) |
Income Below Poverty Among Single-Parent Households in Franklin County
According to the poverty data in Franklin County, 14.7% or 130 single-father households and 41.7% or 793 single-mother households are living below the poverty line. Among single-father households, those with 5 or more children have the highest poverty rate, with 3 households (100.0%) experiencing poverty. Likewise, among single-mother households, those with 3 or 4 children have the highest poverty rate, with 338 households (70.1%) falling below the poverty line.
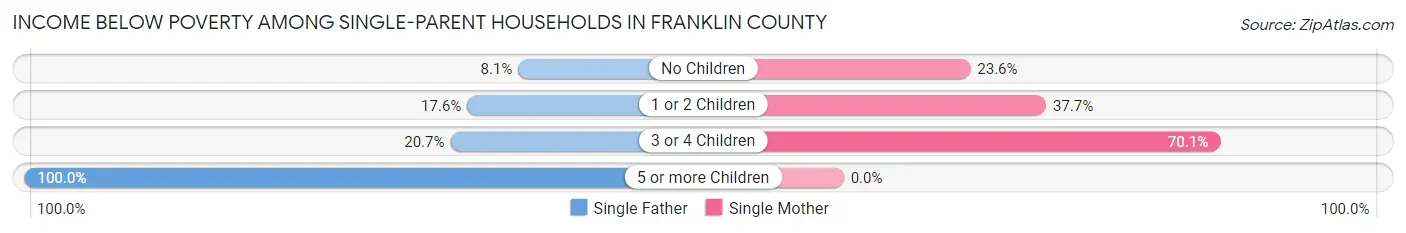
| Children | Single Father | Single Mother |
| No Children | 27 (8.1%) | 135 (23.6%) |
| 1 or 2 Children | 71 (17.6%) | 320 (37.7%) |
| 3 or 4 Children | 29 (20.7%) | 338 (70.1%) |
| 5 or more Children | 3 (100.0%) | 0 (0.0%) |
| Total | 130 (14.7%) | 793 (41.7%) |
Income Below Poverty Among Married-Couple vs Single-Parent Households in Franklin County
The poverty data for Franklin County shows that 521 of the married-couple family households (5.8%) and 923 of the single-parent households (33.1%) are living below the poverty level. Within the married-couple family households, those with 5 or more children have the highest poverty rate, with 61 households (58.1%) falling below the poverty line. Among the single-parent households, those with 5 or more children have the highest poverty rate, with 3 household (100.0%) living below poverty.
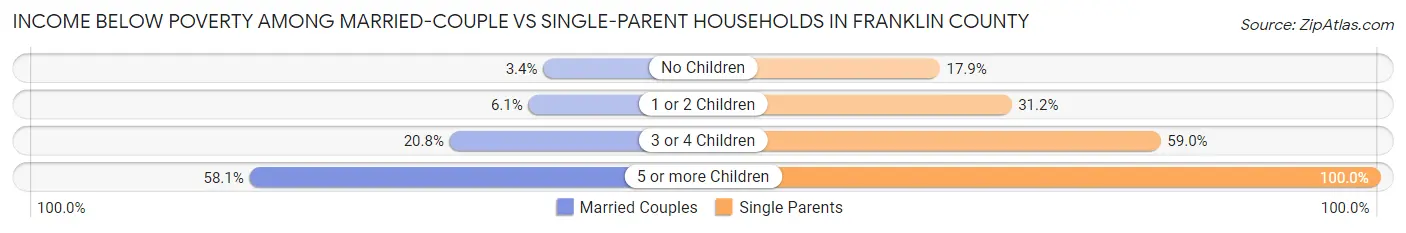
| Children | Married-Couple Families | Single-Parent Households |
| No Children | 209 (3.4%) | 162 (17.9%) |
| 1 or 2 Children | 128 (6.1%) | 391 (31.2%) |
| 3 or 4 Children | 123 (20.8%) | 367 (59.0%) |
| 5 or more Children | 61 (58.1%) | 3 (100.0%) |
| Total | 521 (5.8%) | 923 (33.1%) |
Race in Franklin County
The most populous races in Franklin County are White / Caucasian (39,855 | 84.0%), Native / Alaskan (3,415 | 7.2%), and Black / African American (1,656 | 3.5%).
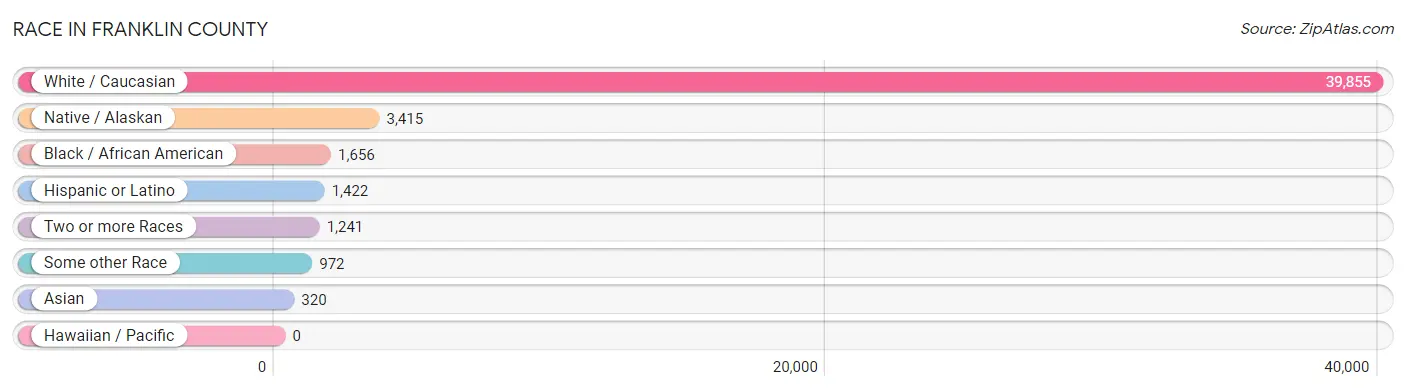
| Race | # Population | % Population |
| Asian | 320 | 0.7% |
| Black / African American | 1,656 | 3.5% |
| Hawaiian / Pacific | 0 | 0.0% |
| Hispanic or Latino | 1,422 | 3.0% |
| Native / Alaskan | 3,415 | 7.2% |
| White / Caucasian | 39,855 | 84.0% |
| Two or more Races | 1,241 | 2.6% |
| Some other Race | 972 | 2.1% |
| Total | 47,459 | 100.0% |
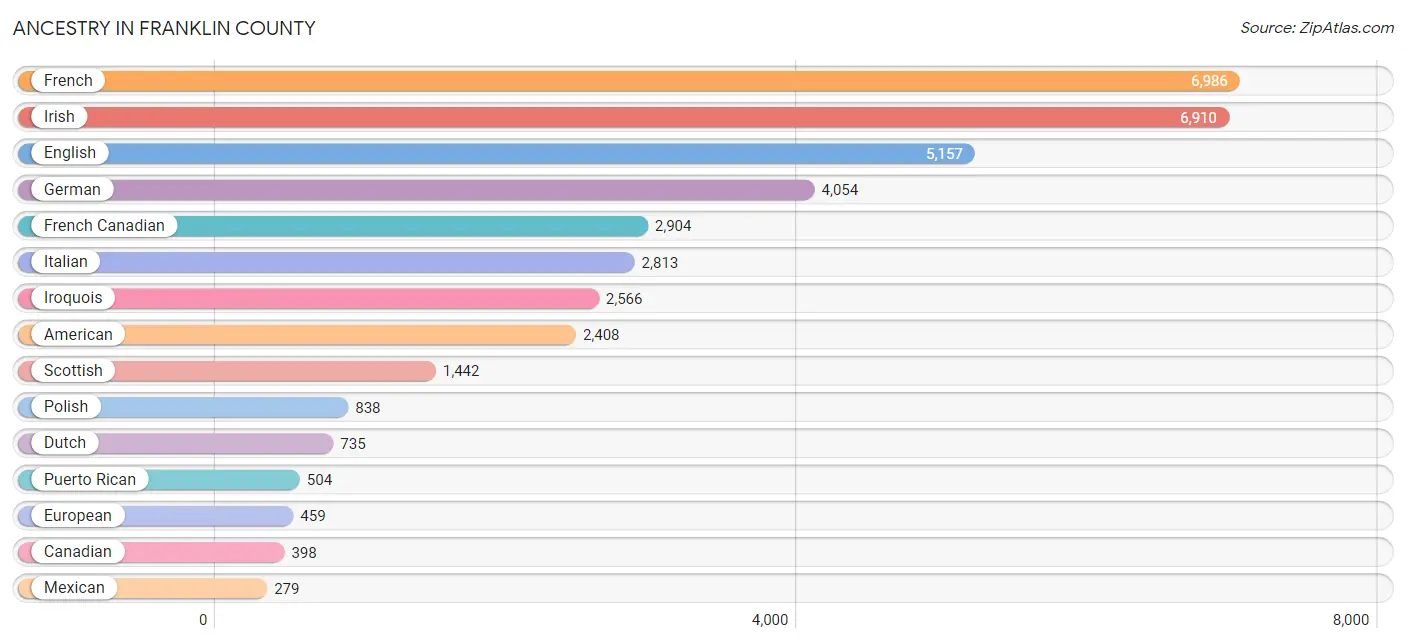
Ancestry in Franklin County
The most populous ancestries reported in Franklin County are French (6,986 | 14.7%), Irish (6,910 | 14.6%), English (5,157 | 10.9%), German (4,054 | 8.5%), and French Canadian (2,904 | 6.1%), together accounting for 54.8% of all Franklin County residents.
| Ancestry | # Population | % Population |
| African | 73 | 0.2% |
| Alaskan Athabascan | 1 | 0.0% |
| Albanian | 7 | 0.0% |
| American | 2,408 | 5.1% |
| Arab | 250 | 0.5% |
| Armenian | 33 | 0.1% |
| Austrian | 62 | 0.1% |
| Belgian | 79 | 0.2% |
| Bhutanese | 4 | 0.0% |
| Blackfeet | 3 | 0.0% |
| Brazilian | 78 | 0.2% |
| British | 163 | 0.3% |
| British West Indian | 59 | 0.1% |
| Burmese | 62 | 0.1% |
| Canadian | 398 | 0.8% |
| Celtic | 29 | 0.1% |
| Central American | 85 | 0.2% |
| Central American Indian | 10 | 0.0% |
| Cherokee | 18 | 0.0% |
| Chickasaw | 6 | 0.0% |
| Chilean | 1 | 0.0% |
| Colombian | 14 | 0.0% |
| Cree | 3 | 0.0% |
| Croatian | 4 | 0.0% |
| Cuban | 3 | 0.0% |
| Czech | 87 | 0.2% |
| Czechoslovakian | 7 | 0.0% |
| Danish | 94 | 0.2% |
| Dominican | 71 | 0.2% |
| Dutch | 735 | 1.5% |
| Eastern European | 92 | 0.2% |
| Ecuadorian | 48 | 0.1% |
| Egyptian | 6 | 0.0% |
| English | 5,157 | 10.9% |
| Ethiopian | 1 | 0.0% |
| European | 459 | 1.0% |
| Finnish | 2 | 0.0% |
| French | 6,986 | 14.7% |
| French American Indian | 47 | 0.1% |
| French Canadian | 2,904 | 6.1% |
| German | 4,054 | 8.5% |
| Greek | 90 | 0.2% |
| Guatemalan | 61 | 0.1% |
| Guyanese | 12 | 0.0% |
| Haitian | 12 | 0.0% |
| Honduran | 6 | 0.0% |
| Hungarian | 168 | 0.4% |
| Indian (Asian) | 157 | 0.3% |
| Indonesian | 6 | 0.0% |
| Irish | 6,910 | 14.6% |
| Iroquois | 2,566 | 5.4% |
| Italian | 2,813 | 5.9% |
| Jamaican | 51 | 0.1% |
| Korean | 53 | 0.1% |
| Lebanese | 222 | 0.5% |
| Lithuanian | 25 | 0.1% |
| Luxembourger | 2 | 0.0% |
| Macedonian | 2 | 0.0% |
| Maltese | 2 | 0.0% |
| Mexican | 279 | 0.6% |
| Native Hawaiian | 1 | 0.0% |
| Navajo | 13 | 0.0% |
| Northern European | 75 | 0.2% |
| Norwegian | 158 | 0.3% |
| Pennsylvania German | 28 | 0.1% |
| Peruvian | 13 | 0.0% |
| Polish | 838 | 1.8% |
| Portuguese | 22 | 0.1% |
| Puerto Rican | 504 | 1.1% |
| Russian | 137 | 0.3% |
| Salvadoran | 18 | 0.0% |
| Scandinavian | 88 | 0.2% |
| Scotch-Irish | 164 | 0.4% |
| Scottish | 1,442 | 3.0% |
| Serbian | 25 | 0.1% |
| Slovak | 17 | 0.0% |
| Slovene | 3 | 0.0% |
| South American | 76 | 0.2% |
| Spaniard | 45 | 0.1% |
| Spanish | 20 | 0.0% |
| Sri Lankan | 2 | 0.0% |
| Subsaharan African | 74 | 0.2% |
| Swedish | 199 | 0.4% |
| Swiss | 219 | 0.5% |
| Syrian | 4 | 0.0% |
| Thai | 158 | 0.3% |
| Trinidadian and Tobagonian | 56 | 0.1% |
| Turkish | 14 | 0.0% |
| Ukrainian | 21 | 0.0% |
| Welsh | 232 | 0.5% | View All 90 Rows |
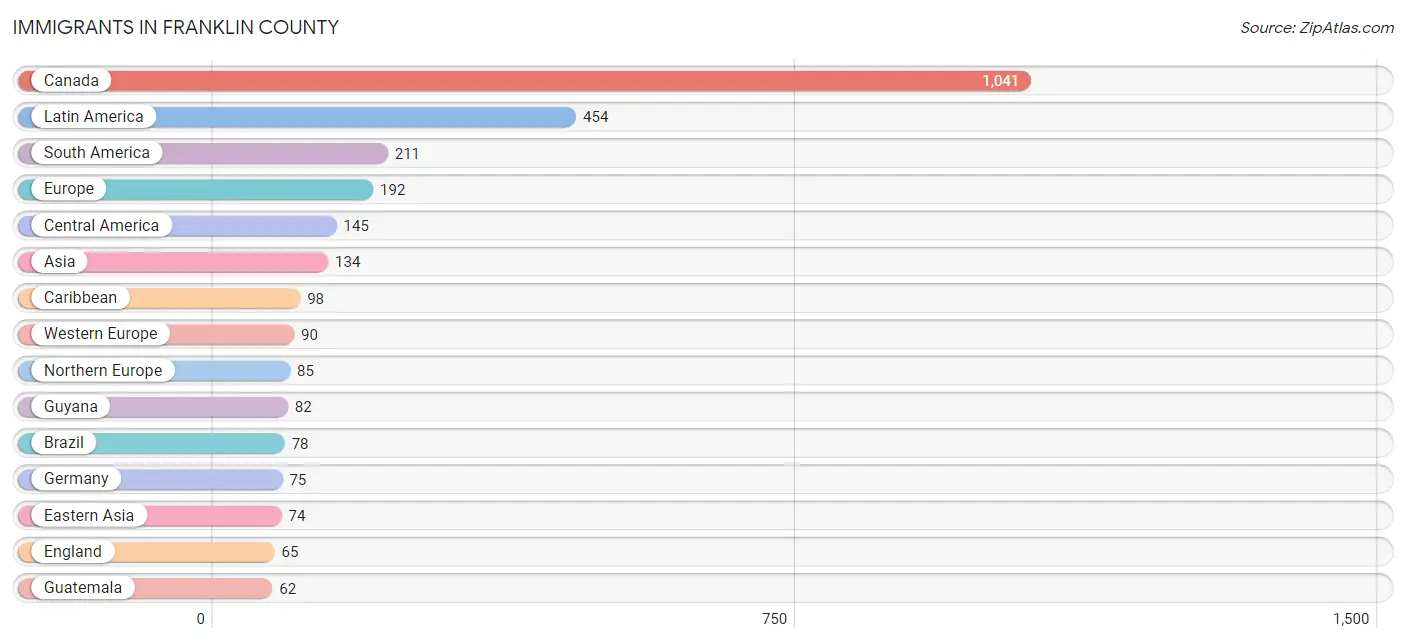
Immigrants in Franklin County
The most numerous immigrant groups reported in Franklin County came from Canada (1,041 | 2.2%), Latin America (454 | 1.0%), South America (211 | 0.4%), Europe (192 | 0.4%), and Central America (145 | 0.3%), together accounting for 4.3% of all Franklin County residents.
| Immigration Origin | # Population | % Population |
| Africa | 24 | 0.1% |
| Asia | 134 | 0.3% |
| Australia | 3 | 0.0% |
| Bangladesh | 12 | 0.0% |
| Bosnia and Herzegovina | 4 | 0.0% |
| Brazil | 78 | 0.2% |
| Canada | 1,041 | 2.2% |
| Caribbean | 98 | 0.2% |
| Central America | 145 | 0.3% |
| China | 37 | 0.1% |
| Cuba | 11 | 0.0% |
| Dominican Republic | 38 | 0.1% |
| Eastern Asia | 74 | 0.2% |
| Eastern Europe | 7 | 0.0% |
| Ecuador | 51 | 0.1% |
| Egypt | 17 | 0.0% |
| El Salvador | 15 | 0.0% |
| England | 65 | 0.1% |
| Europe | 192 | 0.4% |
| France | 2 | 0.0% |
| Germany | 75 | 0.2% |
| Greece | 4 | 0.0% |
| Guatemala | 62 | 0.1% |
| Guyana | 82 | 0.2% |
| Haiti | 10 | 0.0% |
| Honduras | 6 | 0.0% |
| India | 8 | 0.0% |
| Italy | 3 | 0.0% |
| Jamaica | 30 | 0.1% |
| Japan | 2 | 0.0% |
| Korea | 35 | 0.1% |
| Latin America | 454 | 1.0% |
| Mexico | 62 | 0.1% |
| Middle Africa | 5 | 0.0% |
| Northern Africa | 17 | 0.0% |
| Northern Europe | 85 | 0.2% |
| Oceania | 3 | 0.0% |
| Pakistan | 13 | 0.0% |
| Philippines | 21 | 0.0% |
| Scotland | 7 | 0.0% |
| Serbia | 3 | 0.0% |
| South Africa | 2 | 0.0% |
| South America | 211 | 0.4% |
| South Central Asia | 33 | 0.1% |
| South Eastern Asia | 27 | 0.1% |
| Southern Europe | 10 | 0.0% |
| Spain | 3 | 0.0% |
| Sweden | 13 | 0.0% |
| Switzerland | 13 | 0.0% |
| Taiwan | 16 | 0.0% |
| Trinidad and Tobago | 9 | 0.0% |
| Western Europe | 90 | 0.2% | View All 52 Rows |
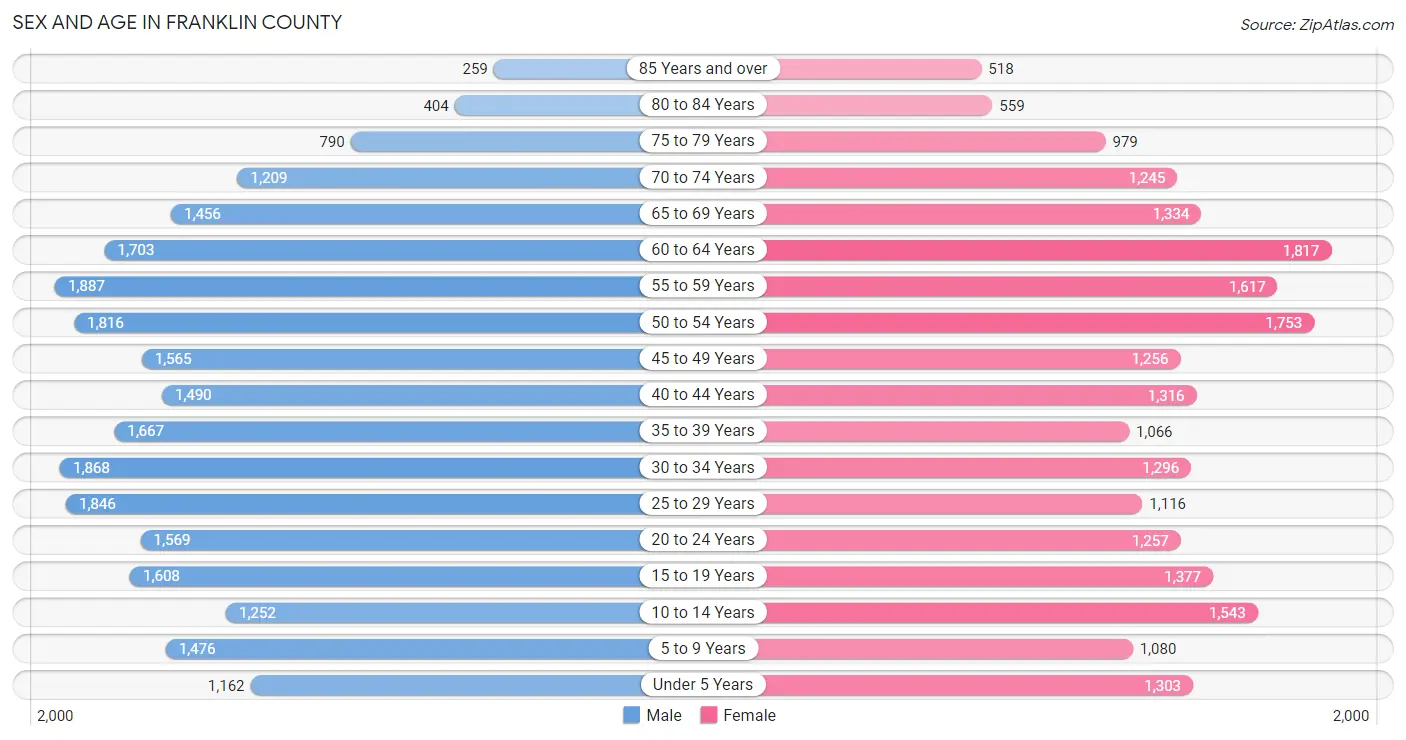
Sex and Age in Franklin County
Sex and Age in Franklin County
The most populous age groups in Franklin County are 55 to 59 Years (1,887 | 7.5%) for men and 60 to 64 Years (1,817 | 8.1%) for women.
| Age Bracket | Male | Female |
| Under 5 Years | 1,162 (4.6%) | 1,303 (5.8%) |
| 5 to 9 Years | 1,476 (5.9%) | 1,080 (4.8%) |
| 10 to 14 Years | 1,252 (5.0%) | 1,543 (6.9%) |
| 15 to 19 Years | 1,608 (6.4%) | 1,377 (6.1%) |
| 20 to 24 Years | 1,569 (6.3%) | 1,257 (5.6%) |
| 25 to 29 Years | 1,846 (7.4%) | 1,116 (5.0%) |
| 30 to 34 Years | 1,868 (7.5%) | 1,296 (5.8%) |
| 35 to 39 Years | 1,667 (6.7%) | 1,066 (4.8%) |
| 40 to 44 Years | 1,490 (5.9%) | 1,316 (5.9%) |
| 45 to 49 Years | 1,565 (6.2%) | 1,256 (5.6%) |
| 50 to 54 Years | 1,816 (7.3%) | 1,753 (7.8%) |
| 55 to 59 Years | 1,887 (7.5%) | 1,617 (7.2%) |
| 60 to 64 Years | 1,703 (6.8%) | 1,817 (8.1%) |
| 65 to 69 Years | 1,456 (5.8%) | 1,334 (5.9%) |
| 70 to 74 Years | 1,209 (4.8%) | 1,245 (5.6%) |
| 75 to 79 Years | 790 (3.2%) | 979 (4.4%) |
| 80 to 84 Years | 404 (1.6%) | 559 (2.5%) |
| 85 Years and over | 259 (1.0%) | 518 (2.3%) |
| Total | 25,027 (100.0%) | 22,432 (100.0%) |
Families and Households in Franklin County
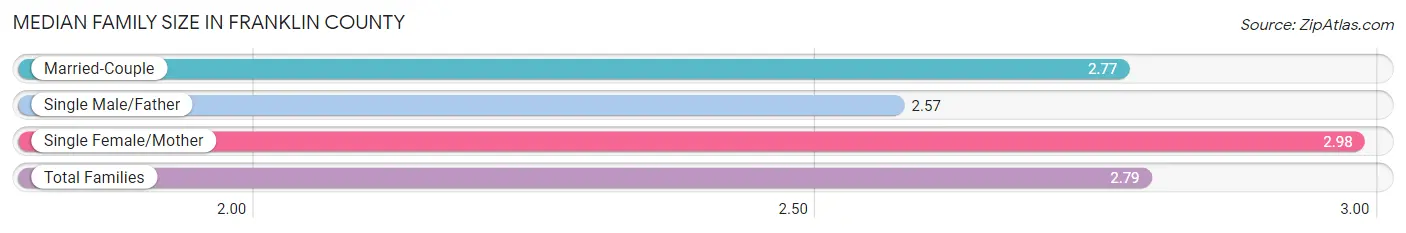
Median Family Size in Franklin County
The median family size in Franklin County is 2.79 persons per family, with single female/mother families (1,903 | 16.2%) accounting for the largest median family size of 2.98 persons per family. On the other hand, single male/father families (882 | 7.5%) represent the smallest median family size with 2.57 persons per family.
| Family Type | # Families | Family Size |
| Married-Couple | 8,939 (76.2%) | 2.77 |
| Single Male/Father | 882 (7.5%) | 2.57 |
| Single Female/Mother | 1,903 (16.2%) | 2.98 |
| Total Families | 11,724 (100.0%) | 2.79 |
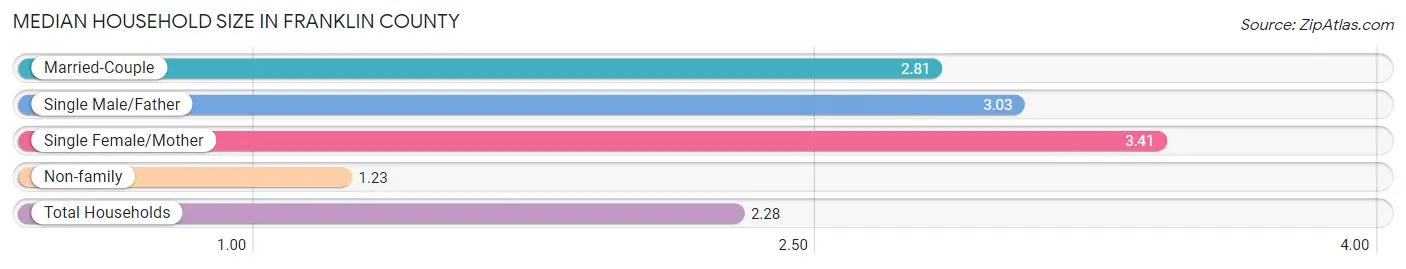
Median Household Size in Franklin County
The median household size in Franklin County is 2.28 persons per household, with single female/mother households (1,903 | 10.1%) accounting for the largest median household size of 3.41 persons per household. non-family households (7,209 | 38.1%) represent the smallest median household size with 1.23 persons per household.
| Household Type | # Households | Household Size |
| Married-Couple | 8,939 (47.2%) | 2.81 |
| Single Male/Father | 882 (4.7%) | 3.03 |
| Single Female/Mother | 1,903 (10.1%) | 3.41 |
| Non-family | 7,209 (38.1%) | 1.23 |
| Total Households | 18,933 (100.0%) | 2.28 |
Household Size by Marriage Status in Franklin County
Out of a total of 18,933 households in Franklin County, 11,724 (61.9%) are family households, while 7,209 (38.1%) are nonfamily households. The most numerous type of family households are 2-person households, comprising 5,838, and the most common type of nonfamily households are 1-person households, comprising 5,863.
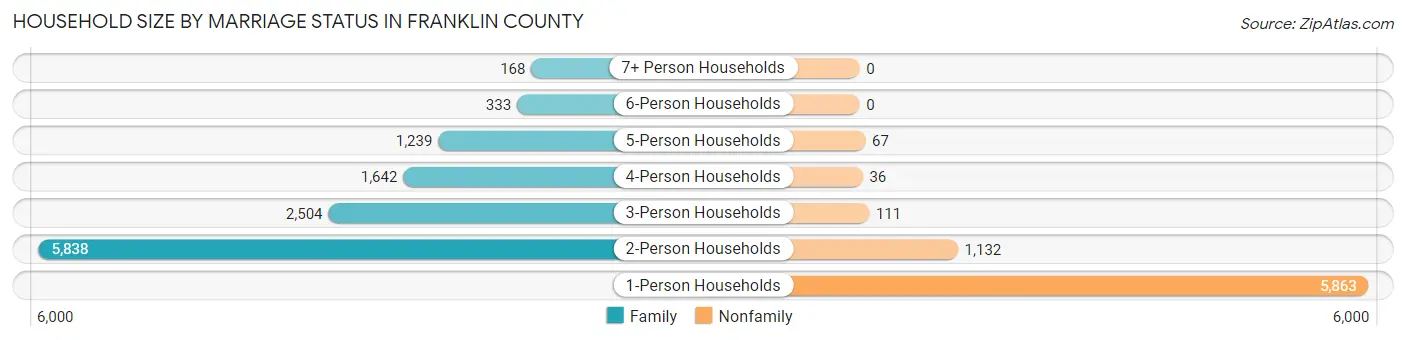
| Household Size | Family Households | Nonfamily Households |
| 1-Person Households | - | 5,863 (31.0%) |
| 2-Person Households | 5,838 (30.8%) | 1,132 (6.0%) |
| 3-Person Households | 2,504 (13.2%) | 111 (0.6%) |
| 4-Person Households | 1,642 (8.7%) | 36 (0.2%) |
| 5-Person Households | 1,239 (6.5%) | 67 (0.4%) |
| 6-Person Households | 333 (1.8%) | 0 (0.0%) |
| 7+ Person Households | 168 (0.9%) | 0 (0.0%) |
| Total | 11,724 (61.9%) | 7,209 (38.1%) |
Female Fertility in Franklin County
Fertility by Age in Franklin County
Average fertility rate in Franklin County is 72.0 births per 1,000 women. Women in the age bracket of 20 to 34 years have the highest fertility rate with 133.0 births per 1,000 women. Women in the age bracket of 20 to 34 years acount for 76.0% of all women with births.
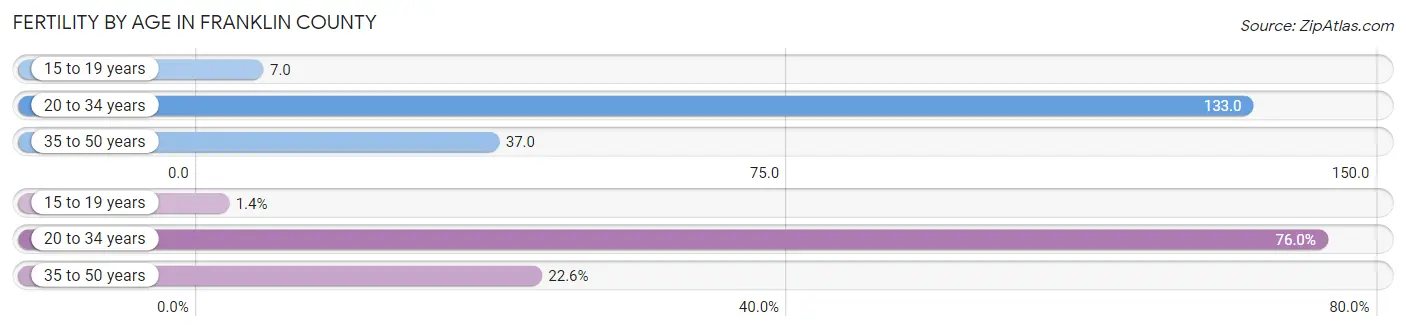
| Age Bracket | Women with Births | Births / 1,000 Women |
| 15 to 19 years | 9 (1.4%) | 7.0 |
| 20 to 34 years | 487 (76.0%) | 133.0 |
| 35 to 50 years | 145 (22.6%) | 37.0 |
| Total | 641 (100.0%) | 72.0 |
Fertility by Age by Marriage Status in Franklin County
53.8% of women with births (641) in Franklin County are married. The highest percentage of unmarried women with births falls into 15 to 19 years age bracket with 100.0% of them unmarried at the time of birth, while the lowest percentage of unmarried women with births belong to 35 to 50 years age bracket with 34.5% of them unmarried.
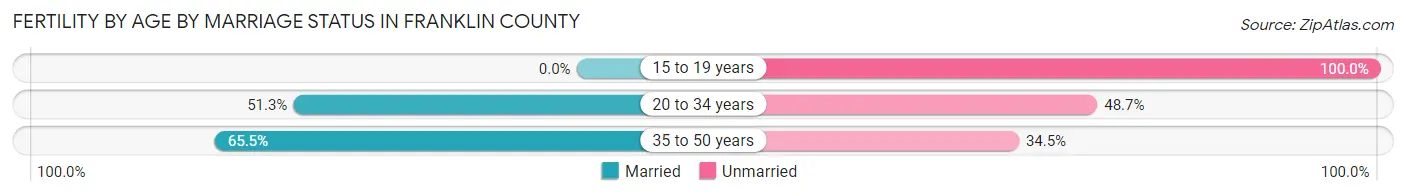
| Age Bracket | Married | Unmarried |
| 15 to 19 years | 0 (0.0%) | 9 (100.0%) |
| 20 to 34 years | 250 (51.3%) | 237 (48.7%) |
| 35 to 50 years | 95 (65.5%) | 50 (34.5%) |
| Total | 345 (53.8%) | 296 (46.2%) |
Fertility by Education in Franklin County
Average fertility rate in Franklin County is 72.0 births per 1,000 women. Women with the education attainment of bachelor's degree have the highest fertility rate of 112.0 births per 1,000 women, while women with the education attainment of less than high school have the lowest fertility at 27.0 births per 1,000 women. Women with the education attainment of college or associate's degree represent 36.3% of all women with births.
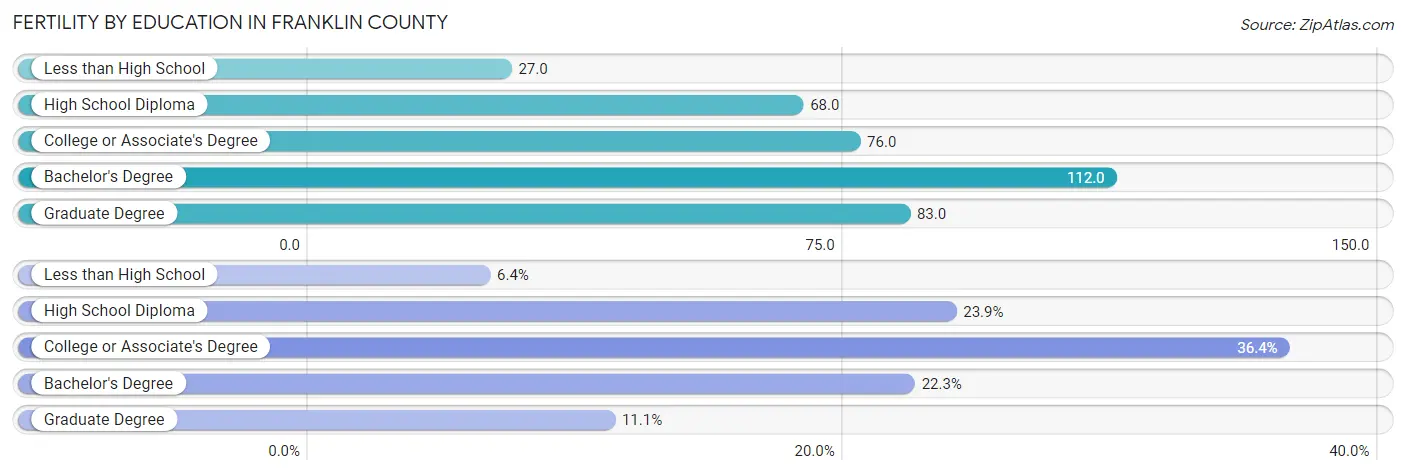
| Educational Attainment | Women with Births | Births / 1,000 Women |
| Less than High School | 41 (6.4%) | 27.0 |
| High School Diploma | 153 (23.9%) | 68.0 |
| College or Associate's Degree | 233 (36.3%) | 76.0 |
| Bachelor's Degree | 143 (22.3%) | 112.0 |
| Graduate Degree | 71 (11.1%) | 83.0 |
| Total | 641 (100.0%) | 72.0 |
Fertility by Education by Marriage Status in Franklin County
46.2% of women with births in Franklin County are unmarried. Women with the educational attainment of graduate degree are most likely to be married with 100.0% of them married at childbirth, while women with the educational attainment of high school diploma are least likely to be married with 64.7% of them unmarried at childbirth.
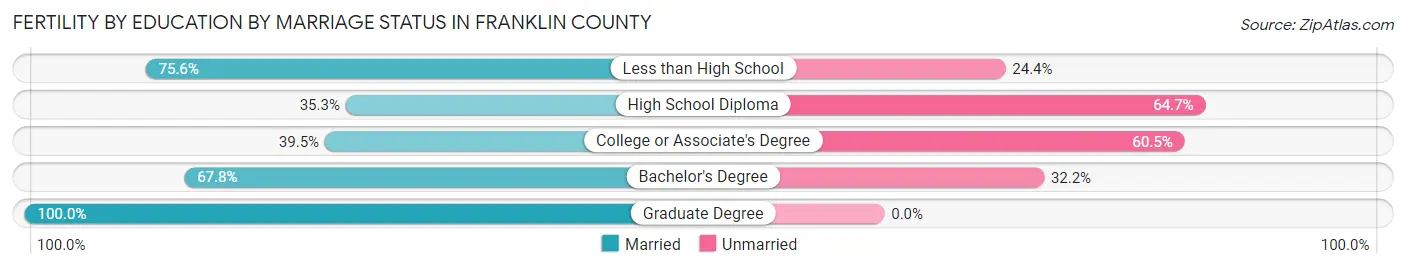
| Educational Attainment | Married | Unmarried |
| Less than High School | 31 (75.6%) | 10 (24.4%) |
| High School Diploma | 54 (35.3%) | 99 (64.7%) |
| College or Associate's Degree | 92 (39.5%) | 141 (60.5%) |
| Bachelor's Degree | 97 (67.8%) | 46 (32.2%) |
| Graduate Degree | 71 (100.0%) | 0 (0.0%) |
| Total | 345 (53.8%) | 296 (46.2%) |
Employment Characteristics in Franklin County
Employment by Class of Employer in Franklin County
Among the 18,873 employed individuals in Franklin County, private company employees (8,652 | 45.8%), not-for-profit organizations (2,937 | 15.6%), and state government employees (2,380 | 12.6%) make up the most common classes of employment.
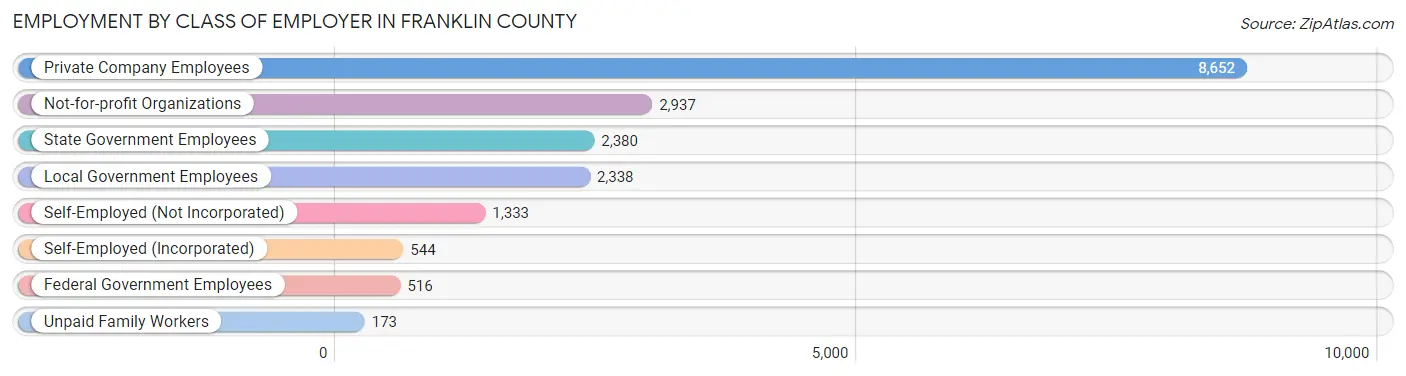
| Employer Class | # Employees | % Employees |
| Private Company Employees | 8,652 | 45.8% |
| Self-Employed (Incorporated) | 544 | 2.9% |
| Self-Employed (Not Incorporated) | 1,333 | 7.1% |
| Not-for-profit Organizations | 2,937 | 15.6% |
| Local Government Employees | 2,338 | 12.4% |
| State Government Employees | 2,380 | 12.6% |
| Federal Government Employees | 516 | 2.7% |
| Unpaid Family Workers | 173 | 0.9% |
| Total | 18,873 | 100.0% |
Employment Status by Age in Franklin County
According to the labor force statistics for Franklin County, out of the total population over 16 years of age (39,028), 52.2% or 20,373 individuals are in the labor force, with 5.1% or 1,039 of them unemployed. The age group with the highest labor force participation rate is 35 to 44 years, with 73.1% or 4,049 individuals in the labor force. Within the labor force, the 30 to 34 years age range has the highest percentage of unemployed individuals, with 11.6% or 234 of them being unemployed.
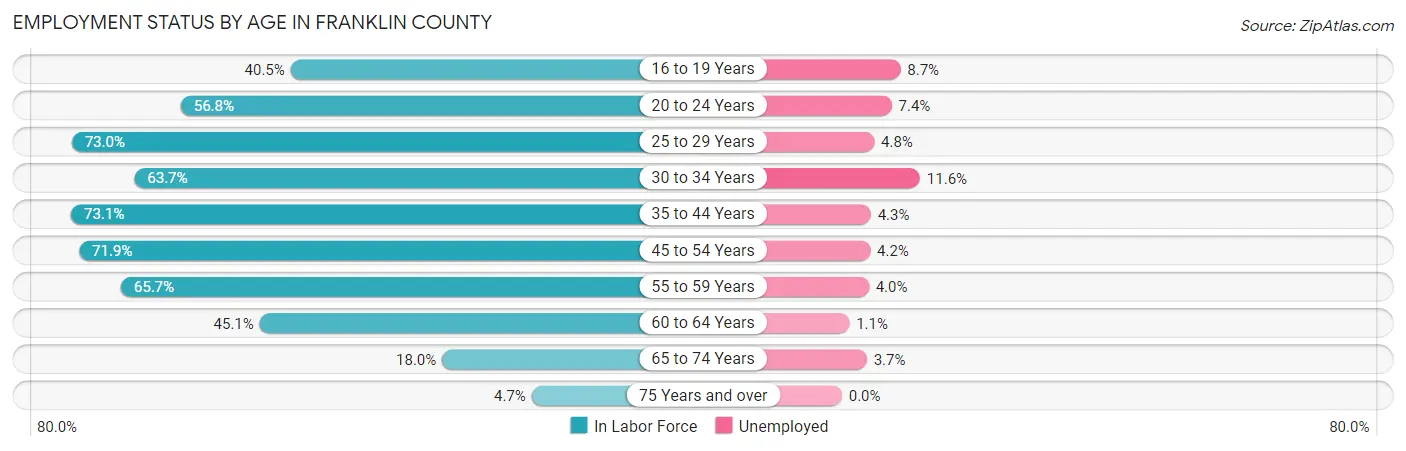
| Age Bracket | In Labor Force | Unemployed |
| 16 to 19 Years | 960 (40.5%) | 84 (8.7%) |
| 20 to 24 Years | 1,605 (56.8%) | 119 (7.4%) |
| 25 to 29 Years | 2,162 (73.0%) | 104 (4.8%) |
| 30 to 34 Years | 2,015 (63.7%) | 234 (11.6%) |
| 35 to 44 Years | 4,049 (73.1%) | 174 (4.3%) |
| 45 to 54 Years | 4,594 (71.9%) | 193 (4.2%) |
| 55 to 59 Years | 2,302 (65.7%) | 92 (4.0%) |
| 60 to 64 Years | 1,588 (45.1%) | 17 (1.1%) |
| 65 to 74 Years | 944 (18.0%) | 35 (3.7%) |
| 75 Years and over | 165 (4.7%) | 0 (0.0%) |
| Total | 20,373 (52.2%) | 1,039 (5.1%) |
Employment Status by Educational Attainment in Franklin County
According to labor force statistics for Franklin County, 66.6% of individuals (16,703) out of the total population between 25 and 64 years of age (25,079) are in the labor force, with 4.9% or 818 of them being unemployed. The group with the highest labor force participation rate are those with the educational attainment of bachelor's degree or higher, with 84.9% or 4,605 individuals in the labor force. Within the labor force, individuals with high school diploma education have the highest percentage of unemployment, with 8.7% or 453 of them being unemployed.
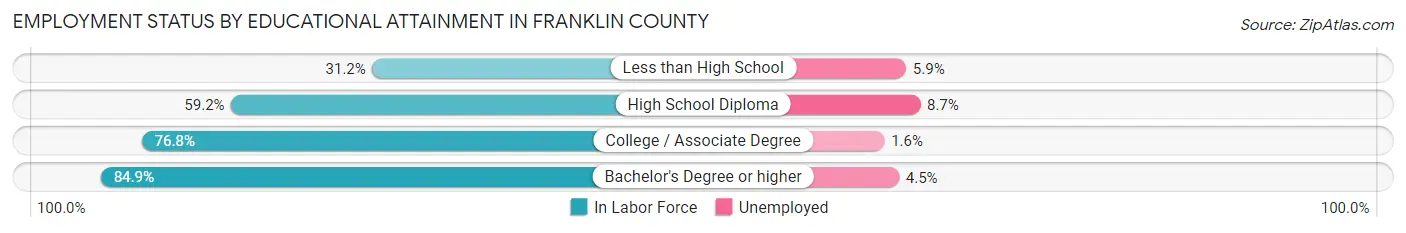
| Educational Attainment | In Labor Force | Unemployed |
| Less than High School | 983 (31.2%) | 186 (5.9%) |
| High School Diploma | 5,206 (59.2%) | 765 (8.7%) |
| College / Associate Degree | 5,921 (76.8%) | 123 (1.6%) |
| Bachelor's Degree or higher | 4,605 (84.9%) | 244 (4.5%) |
| Total | 16,703 (66.6%) | 1,229 (4.9%) |
Employment Occupations by Sex in Franklin County
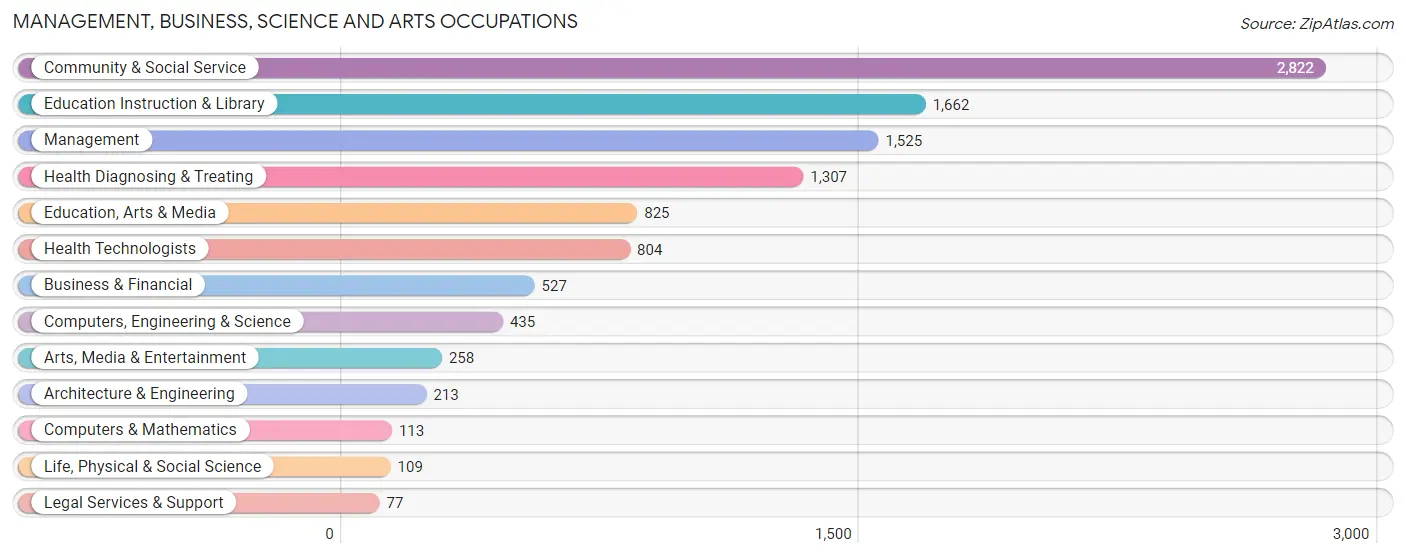
Management, Business, Science and Arts Occupations
The most common Management, Business, Science and Arts occupations in Franklin County are Community & Social Service (2,822 | 14.6%), Education Instruction & Library (1,662 | 8.6%), Management (1,525 | 7.9%), Health Diagnosing & Treating (1,307 | 6.8%), and Education, Arts & Media (825 | 4.3%).
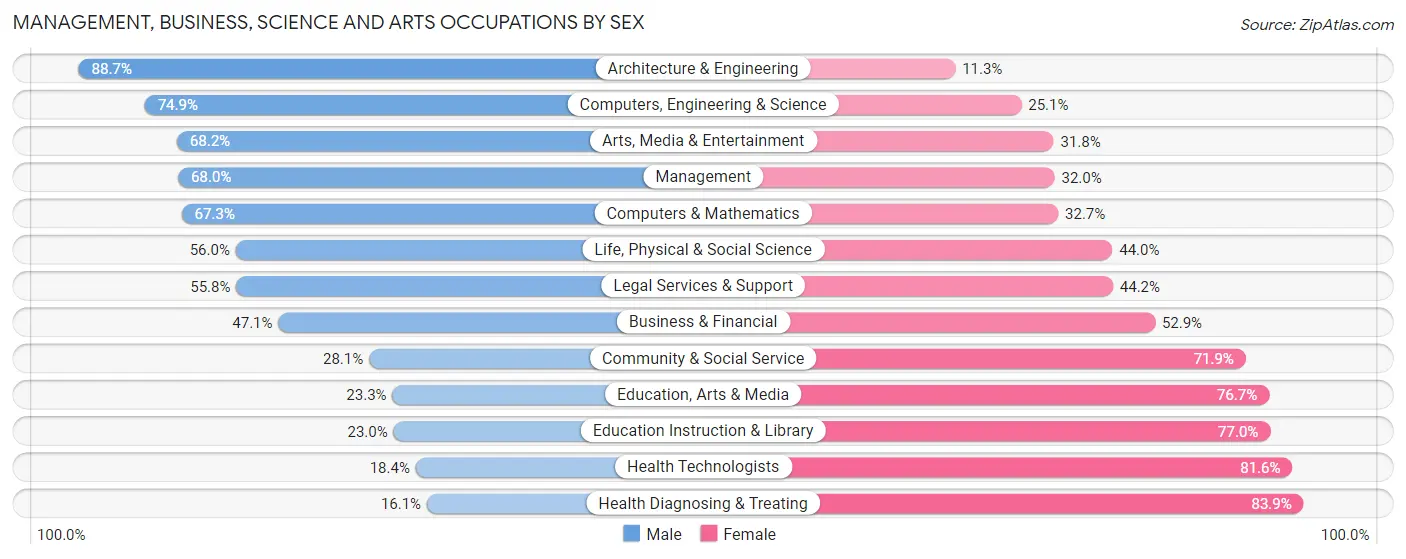
Management, Business, Science and Arts Occupations by Sex
Within the Management, Business, Science and Arts occupations in Franklin County, the most male-oriented occupations are Architecture & Engineering (88.7%), Computers, Engineering & Science (74.9%), and Arts, Media & Entertainment (68.2%), while the most female-oriented occupations are Health Diagnosing & Treating (83.9%), Health Technologists (81.6%), and Education Instruction & Library (77.0%).
| Occupation | Male | Female |
| Management | 1,037 (68.0%) | 488 (32.0%) |
| Business & Financial | 248 (47.1%) | 279 (52.9%) |
| Computers, Engineering & Science | 326 (74.9%) | 109 (25.1%) |
| Computers & Mathematics | 76 (67.3%) | 37 (32.7%) |
| Architecture & Engineering | 189 (88.7%) | 24 (11.3%) |
| Life, Physical & Social Science | 61 (56.0%) | 48 (44.0%) |
| Community & Social Service | 794 (28.1%) | 2,028 (71.9%) |
| Education, Arts & Media | 192 (23.3%) | 633 (76.7%) |
| Legal Services & Support | 43 (55.8%) | 34 (44.2%) |
| Education Instruction & Library | 383 (23.0%) | 1,279 (77.0%) |
| Arts, Media & Entertainment | 176 (68.2%) | 82 (31.8%) |
| Health Diagnosing & Treating | 210 (16.1%) | 1,097 (83.9%) |
| Health Technologists | 148 (18.4%) | 656 (81.6%) |
| Total (Category) | 2,615 (39.5%) | 4,001 (60.5%) |
| Total (Overall) | 10,317 (53.4%) | 9,004 (46.6%) |
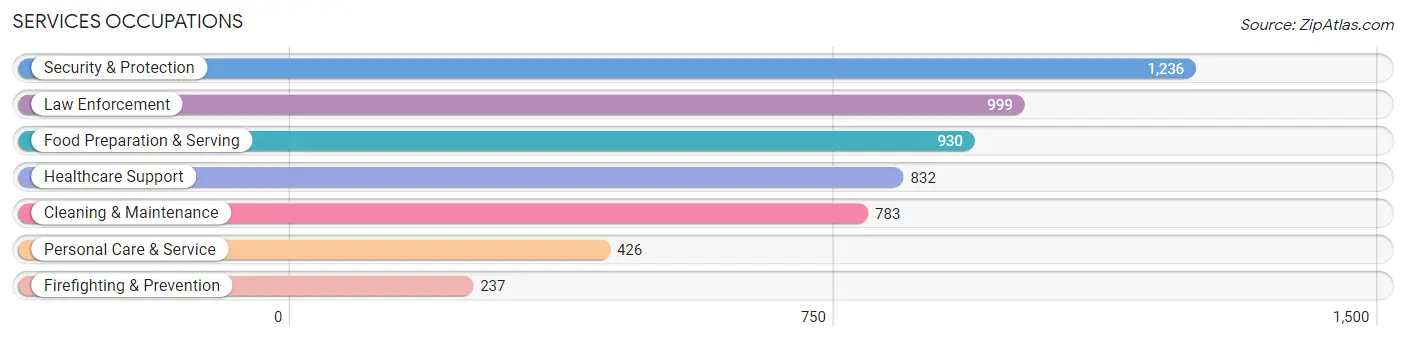
Services Occupations
The most common Services occupations in Franklin County are Security & Protection (1,236 | 6.4%), Law Enforcement (999 | 5.2%), Food Preparation & Serving (930 | 4.8%), Healthcare Support (832 | 4.3%), and Cleaning & Maintenance (783 | 4.1%).
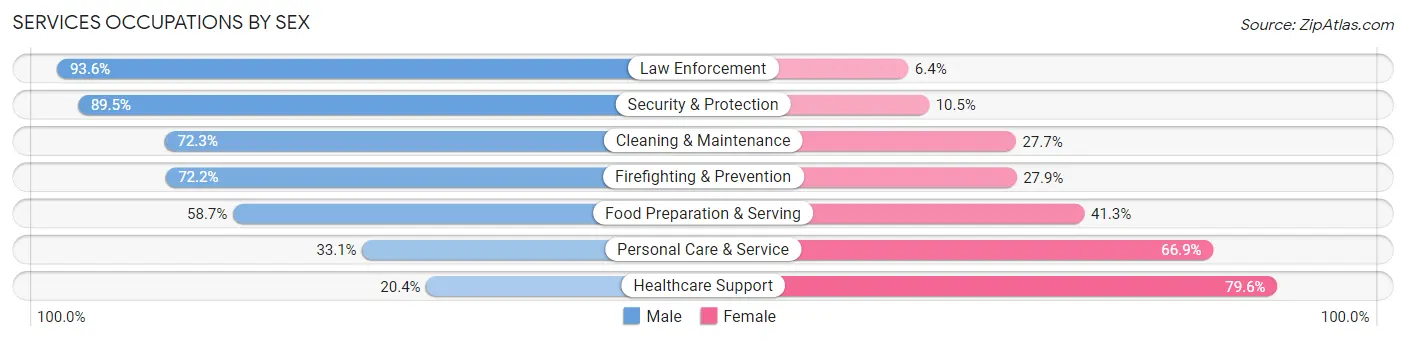
Services Occupations by Sex
Within the Services occupations in Franklin County, the most male-oriented occupations are Law Enforcement (93.6%), Security & Protection (89.5%), and Cleaning & Maintenance (72.3%), while the most female-oriented occupations are Healthcare Support (79.6%), Personal Care & Service (66.9%), and Food Preparation & Serving (41.3%).
| Occupation | Male | Female |
| Healthcare Support | 170 (20.4%) | 662 (79.6%) |
| Security & Protection | 1,106 (89.5%) | 130 (10.5%) |
| Firefighting & Prevention | 171 (72.2%) | 66 (27.9%) |
| Law Enforcement | 935 (93.6%) | 64 (6.4%) |
| Food Preparation & Serving | 546 (58.7%) | 384 (41.3%) |
| Cleaning & Maintenance | 566 (72.3%) | 217 (27.7%) |
| Personal Care & Service | 141 (33.1%) | 285 (66.9%) |
| Total (Category) | 2,529 (60.1%) | 1,678 (39.9%) |
| Total (Overall) | 10,317 (53.4%) | 9,004 (46.6%) |
Sales and Office Occupations
The most common Sales and Office occupations in Franklin County are Office & Administration (2,284 | 11.8%), and Sales & Related (2,128 | 11.0%).

Sales and Office Occupations by Sex
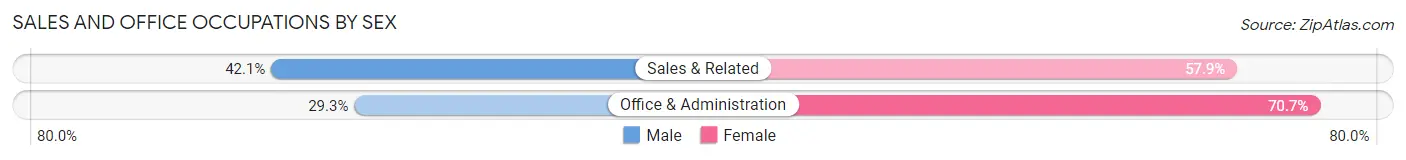
| Occupation | Male | Female |
| Sales & Related | 895 (42.1%) | 1,233 (57.9%) |
| Office & Administration | 669 (29.3%) | 1,615 (70.7%) |
| Total (Category) | 1,564 (35.4%) | 2,848 (64.5%) |
| Total (Overall) | 10,317 (53.4%) | 9,004 (46.6%) |
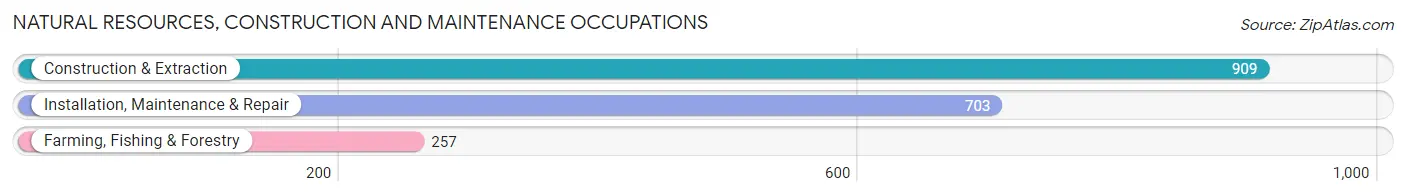
Natural Resources, Construction and Maintenance Occupations
The most common Natural Resources, Construction and Maintenance occupations in Franklin County are Construction & Extraction (909 | 4.7%), Installation, Maintenance & Repair (703 | 3.6%), and Farming, Fishing & Forestry (257 | 1.3%).
Natural Resources, Construction and Maintenance Occupations by Sex
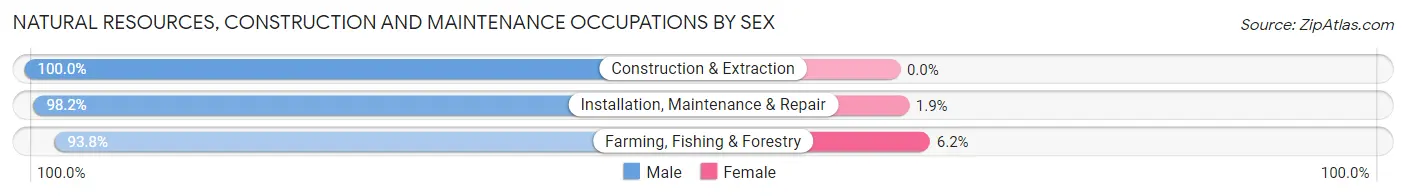
| Occupation | Male | Female |
| Farming, Fishing & Forestry | 241 (93.8%) | 16 (6.2%) |
| Construction & Extraction | 909 (100.0%) | 0 (0.0%) |
| Installation, Maintenance & Repair | 690 (98.2%) | 13 (1.8%) |
| Total (Category) | 1,840 (98.5%) | 29 (1.5%) |
| Total (Overall) | 10,317 (53.4%) | 9,004 (46.6%) |
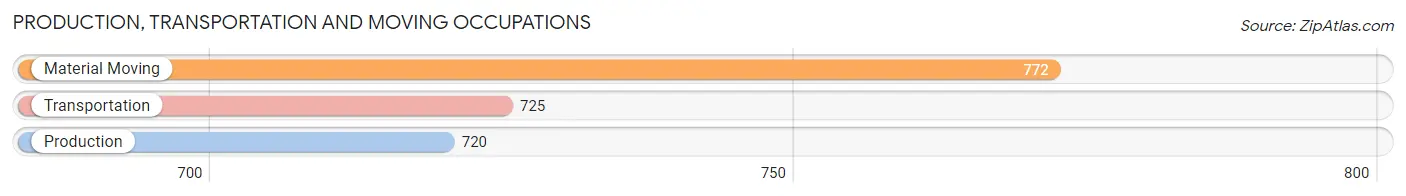
Production, Transportation and Moving Occupations
The most common Production, Transportation and Moving occupations in Franklin County are Material Moving (772 | 4.0%), Transportation (725 | 3.7%), and Production (720 | 3.7%).
Production, Transportation and Moving Occupations by Sex
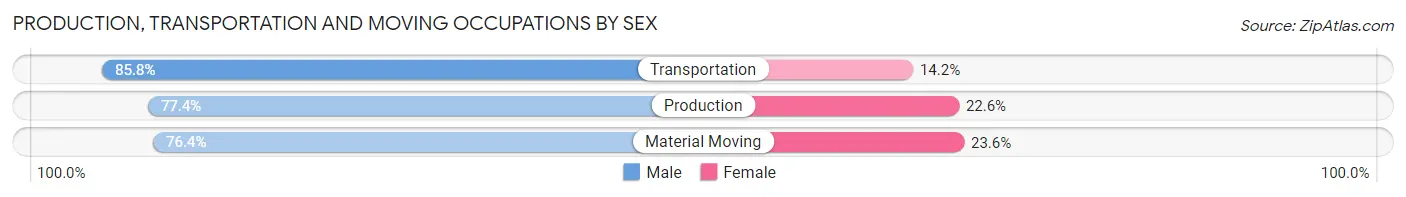
| Occupation | Male | Female |
| Production | 557 (77.4%) | 163 (22.6%) |
| Transportation | 622 (85.8%) | 103 (14.2%) |
| Material Moving | 590 (76.4%) | 182 (23.6%) |
| Total (Category) | 1,769 (79.8%) | 448 (20.2%) |
| Total (Overall) | 10,317 (53.4%) | 9,004 (46.6%) |
Employment Industries by Sex in Franklin County
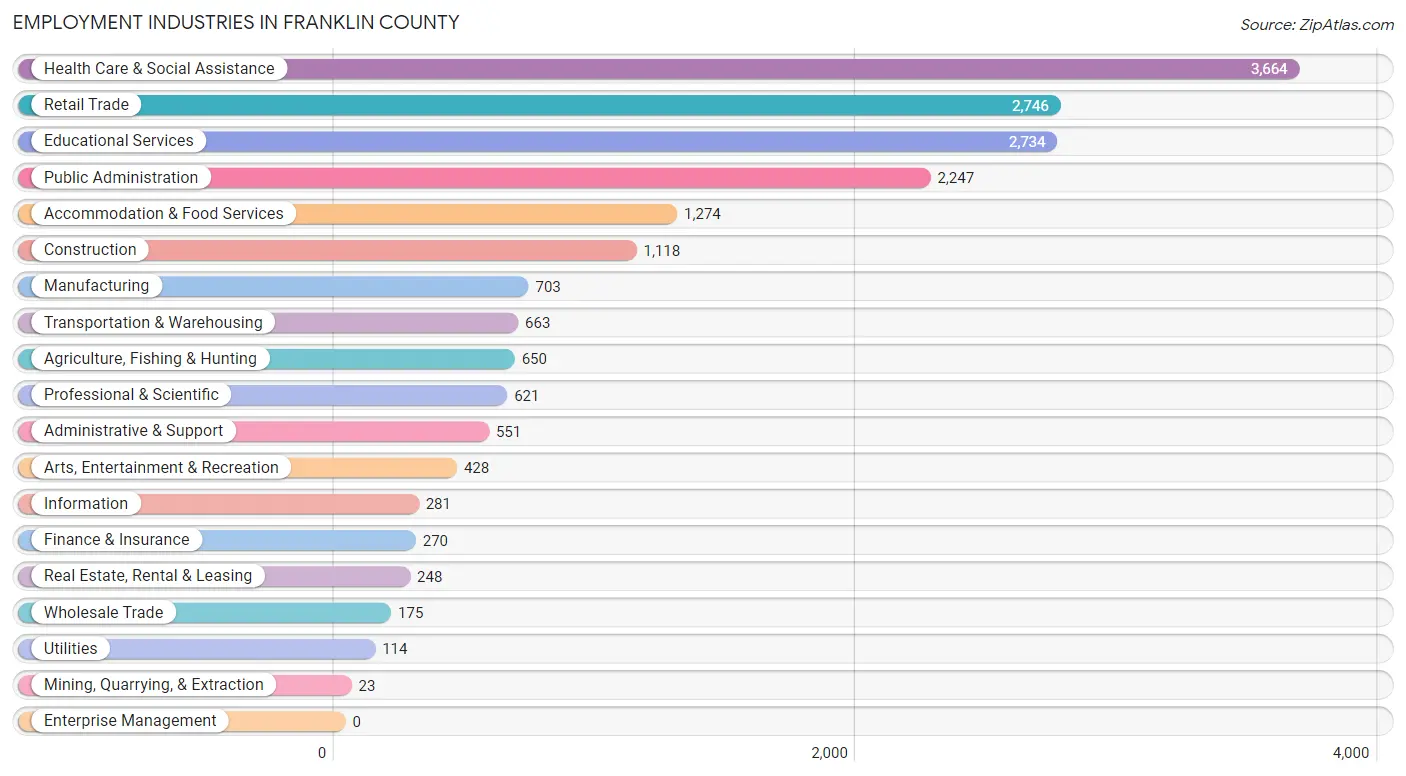
Employment Industries in Franklin County
The major employment industries in Franklin County include Health Care & Social Assistance (3,664 | 19.0%), Retail Trade (2,746 | 14.2%), Educational Services (2,734 | 14.1%), Public Administration (2,247 | 11.6%), and Accommodation & Food Services (1,274 | 6.6%).
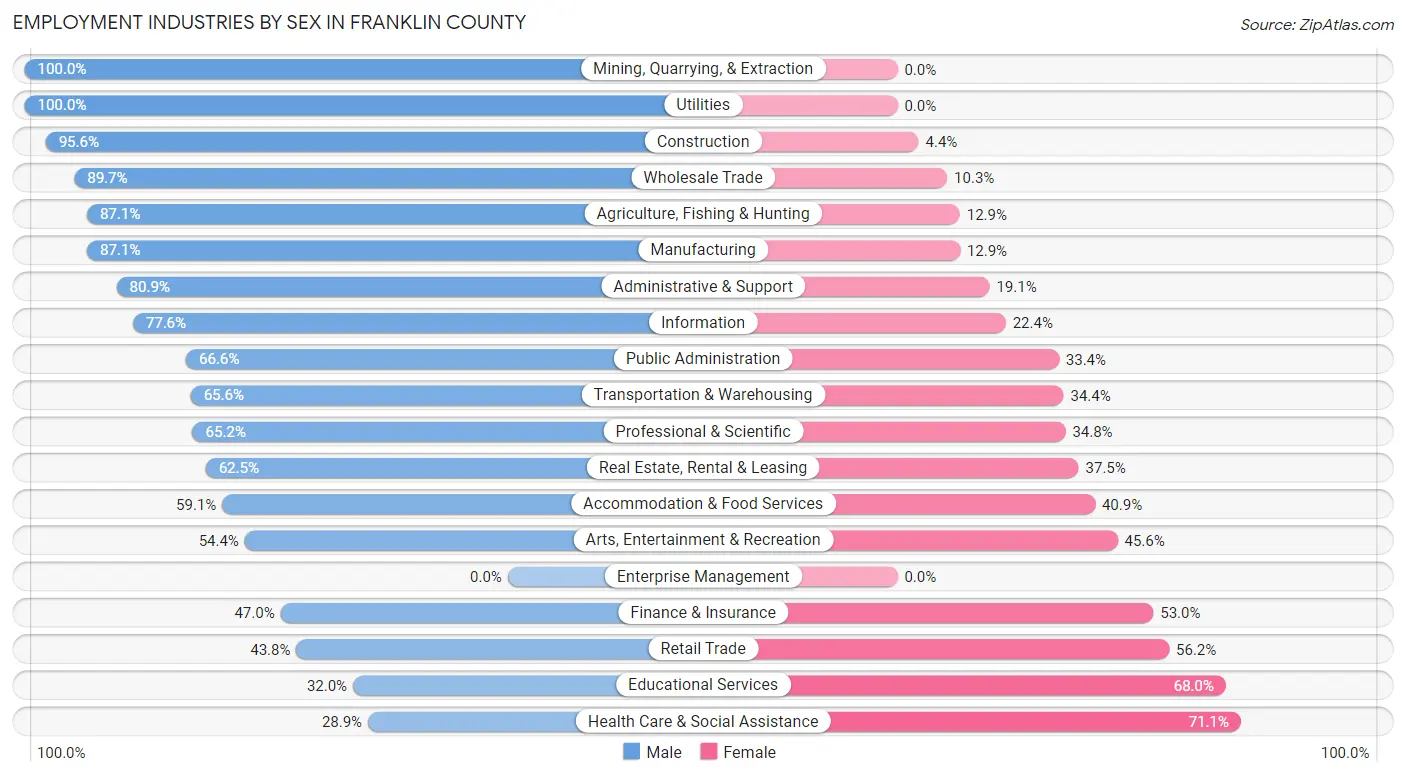
Employment Industries by Sex in Franklin County
The Franklin County industries that see more men than women are Mining, Quarrying, & Extraction (100.0%), Utilities (100.0%), and Construction (95.6%), whereas the industries that tend to have a higher number of women are Health Care & Social Assistance (71.1%), Educational Services (68.0%), and Retail Trade (56.2%).
| Industry | Male | Female |
| Agriculture, Fishing & Hunting | 566 (87.1%) | 84 (12.9%) |
| Mining, Quarrying, & Extraction | 23 (100.0%) | 0 (0.0%) |
| Construction | 1,069 (95.6%) | 49 (4.4%) |
| Manufacturing | 612 (87.1%) | 91 (12.9%) |
| Wholesale Trade | 157 (89.7%) | 18 (10.3%) |
| Retail Trade | 1,202 (43.8%) | 1,544 (56.2%) |
| Transportation & Warehousing | 435 (65.6%) | 228 (34.4%) |
| Utilities | 114 (100.0%) | 0 (0.0%) |
| Information | 218 (77.6%) | 63 (22.4%) |
| Finance & Insurance | 127 (47.0%) | 143 (53.0%) |
| Real Estate, Rental & Leasing | 155 (62.5%) | 93 (37.5%) |
| Professional & Scientific | 405 (65.2%) | 216 (34.8%) |
| Enterprise Management | 0 (0.0%) | 0 (0.0%) |
| Administrative & Support | 446 (80.9%) | 105 (19.1%) |
| Educational Services | 876 (32.0%) | 1,858 (68.0%) |
| Health Care & Social Assistance | 1,060 (28.9%) | 2,604 (71.1%) |
| Arts, Entertainment & Recreation | 233 (54.4%) | 195 (45.6%) |
| Accommodation & Food Services | 753 (59.1%) | 521 (40.9%) |
| Public Administration | 1,496 (66.6%) | 751 (33.4%) |
| Total | 10,317 (53.4%) | 9,004 (46.6%) |
Education in Franklin County
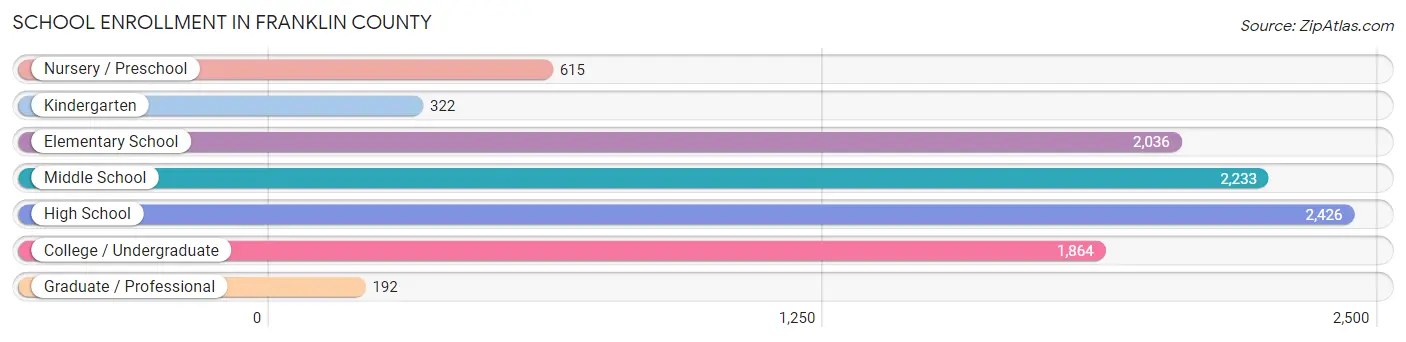
School Enrollment in Franklin County
The most common levels of schooling among the 9,688 students in Franklin County are high school (2,426 | 25.0%), middle school (2,233 | 23.1%), and elementary school (2,036 | 21.0%).
| School Level | # Students | % Students |
| Nursery / Preschool | 615 | 6.4% |
| Kindergarten | 322 | 3.3% |
| Elementary School | 2,036 | 21.0% |
| Middle School | 2,233 | 23.1% |
| High School | 2,426 | 25.0% |
| College / Undergraduate | 1,864 | 19.2% |
| Graduate / Professional | 192 | 2.0% |
| Total | 9,688 | 100.0% |
School Enrollment by Age by Funding Source in Franklin County
Out of a total of 9,688 students who are enrolled in schools in Franklin County, 1,744 (18.0%) attend a private institution, while the remaining 7,944 (82.0%) are enrolled in public schools. The age group of 20 to 24 year olds has the highest likelihood of being enrolled in private schools, with 437 (48.2% in the age bracket) enrolled. Conversely, the age group of 15 to 17 year olds has the lowest likelihood of being enrolled in a private school, with 1,700 (96.0% in the age bracket) attending a public institution.
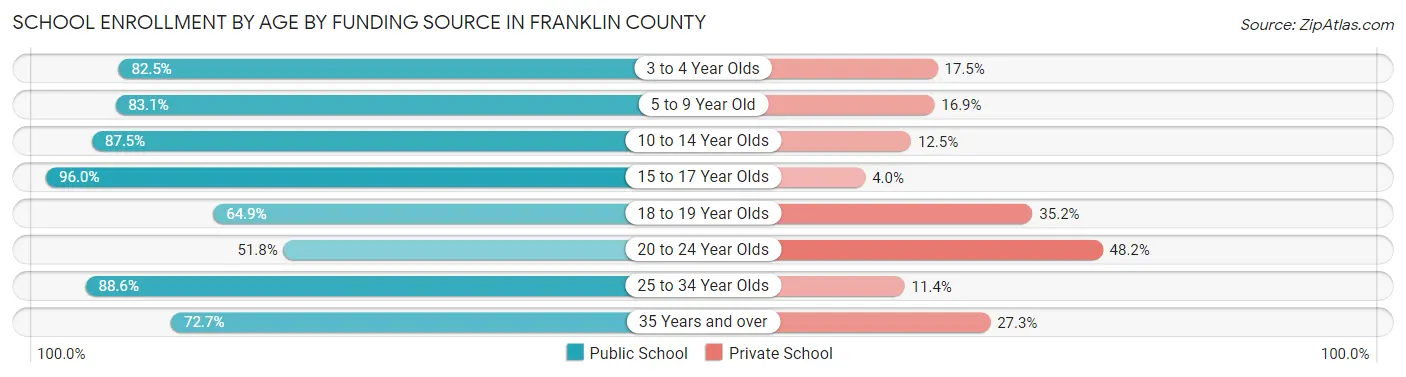
| Age Bracket | Public School | Private School |
| 3 to 4 Year Olds | 368 (82.5%) | 78 (17.5%) |
| 5 to 9 Year Old | 1,963 (83.1%) | 399 (16.9%) |
| 10 to 14 Year Olds | 2,386 (87.5%) | 342 (12.5%) |
| 15 to 17 Year Olds | 1,700 (96.0%) | 71 (4.0%) |
| 18 to 19 Year Olds | 511 (64.8%) | 277 (35.1%) |
| 20 to 24 Year Olds | 469 (51.8%) | 437 (48.2%) |
| 25 to 34 Year Olds | 242 (88.6%) | 31 (11.4%) |
| 35 Years and over | 301 (72.7%) | 113 (27.3%) |
| Total | 7,944 (82.0%) | 1,744 (18.0%) |
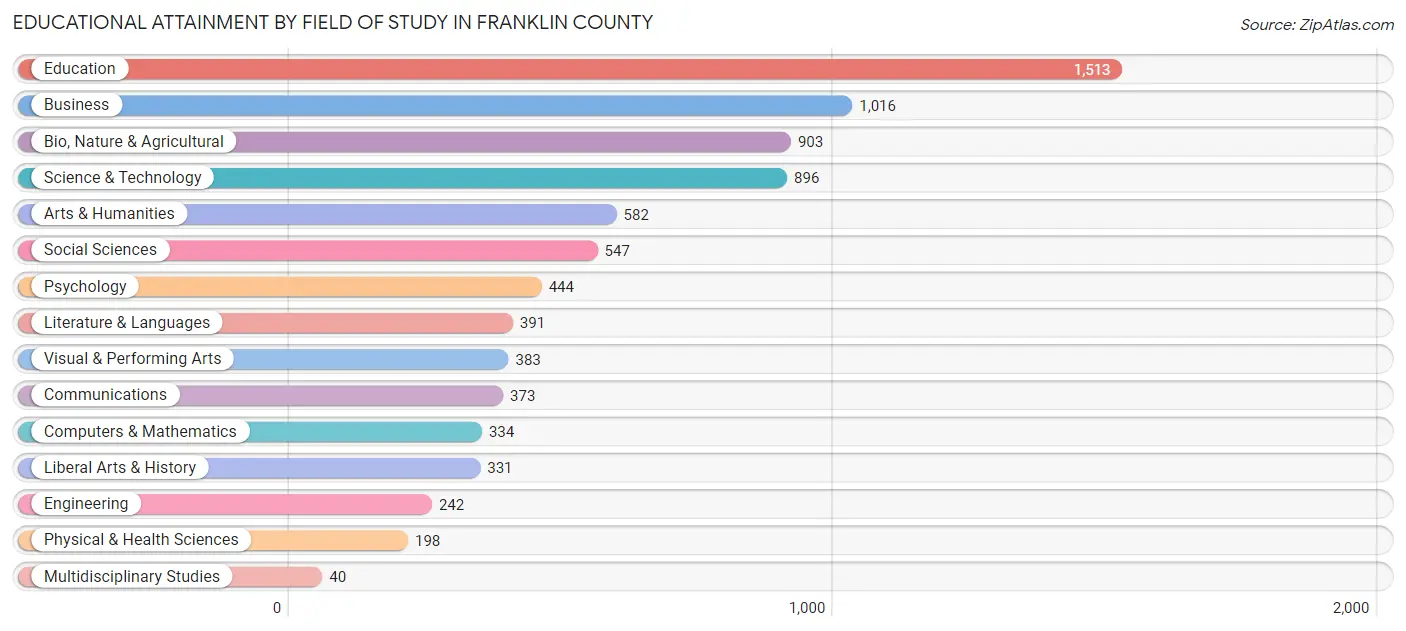
Educational Attainment by Field of Study in Franklin County
Education (1,513 | 18.5%), business (1,016 | 12.4%), bio, nature & agricultural (903 | 11.0%), science & technology (896 | 10.9%), and arts & humanities (582 | 7.1%) are the most common fields of study among 8,193 individuals in Franklin County who have obtained a bachelor's degree or higher.
| Field of Study | # Graduates | % Graduates |
| Computers & Mathematics | 334 | 4.1% |
| Bio, Nature & Agricultural | 903 | 11.0% |
| Physical & Health Sciences | 198 | 2.4% |
| Psychology | 444 | 5.4% |
| Social Sciences | 547 | 6.7% |
| Engineering | 242 | 2.9% |
| Multidisciplinary Studies | 40 | 0.5% |
| Science & Technology | 896 | 10.9% |
| Business | 1,016 | 12.4% |
| Education | 1,513 | 18.5% |
| Literature & Languages | 391 | 4.8% |
| Liberal Arts & History | 331 | 4.0% |
| Visual & Performing Arts | 383 | 4.7% |
| Communications | 373 | 4.5% |
| Arts & Humanities | 582 | 7.1% |
| Total | 8,193 | 100.0% |
Transportation & Commute in Franklin County
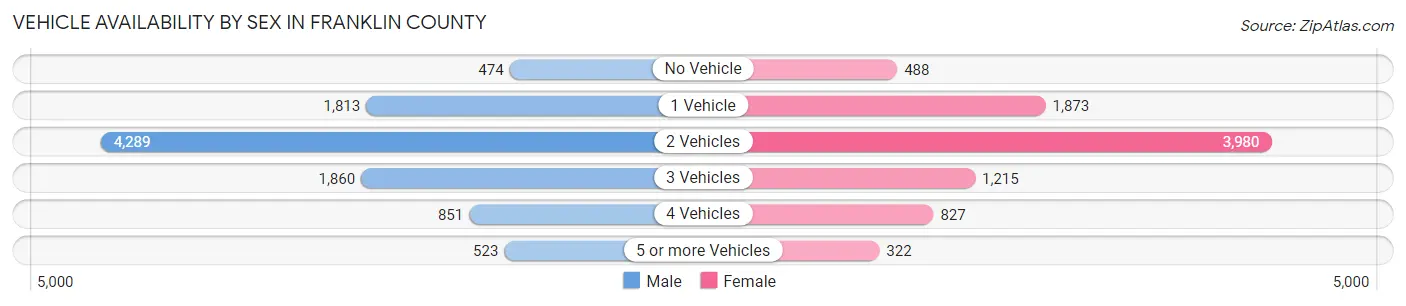
Vehicle Availability by Sex in Franklin County
The most prevalent vehicle ownership categories in Franklin County are males with 2 vehicles (4,289, accounting for 43.7%) and females with 2 vehicles (3,980, making up 49.3%).
| Vehicles Available | Male | Female |
| No Vehicle | 474 (4.8%) | 488 (5.6%) |
| 1 Vehicle | 1,813 (18.5%) | 1,873 (21.5%) |
| 2 Vehicles | 4,289 (43.7%) | 3,980 (45.7%) |
| 3 Vehicles | 1,860 (19.0%) | 1,215 (14.0%) |
| 4 Vehicles | 851 (8.7%) | 827 (9.5%) |
| 5 or more Vehicles | 523 (5.3%) | 322 (3.7%) |
| Total | 9,810 (100.0%) | 8,705 (100.0%) |
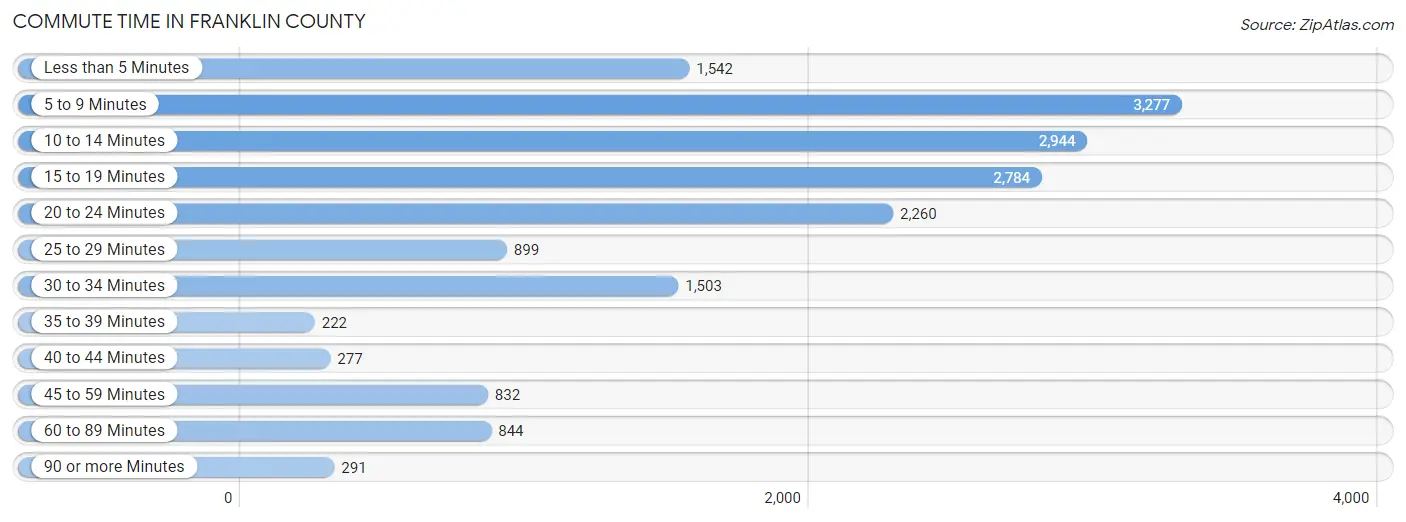
Commute Time in Franklin County
The most frequently occuring commute durations in Franklin County are 5 to 9 minutes (3,277 commuters, 18.5%), 10 to 14 minutes (2,944 commuters, 16.7%), and 15 to 19 minutes (2,784 commuters, 15.8%).
| Commute Time | # Commuters | % Commuters |
| Less than 5 Minutes | 1,542 | 8.7% |
| 5 to 9 Minutes | 3,277 | 18.5% |
| 10 to 14 Minutes | 2,944 | 16.7% |
| 15 to 19 Minutes | 2,784 | 15.8% |
| 20 to 24 Minutes | 2,260 | 12.8% |
| 25 to 29 Minutes | 899 | 5.1% |
| 30 to 34 Minutes | 1,503 | 8.5% |
| 35 to 39 Minutes | 222 | 1.3% |
| 40 to 44 Minutes | 277 | 1.6% |
| 45 to 59 Minutes | 832 | 4.7% |
| 60 to 89 Minutes | 844 | 4.8% |
| 90 or more Minutes | 291 | 1.7% |
Commute Time by Sex in Franklin County
The most common commute times in Franklin County are 5 to 9 minutes (1,712 commuters, 18.0%) for males and 10 to 14 minutes (1,618 commuters, 19.8%) for females.
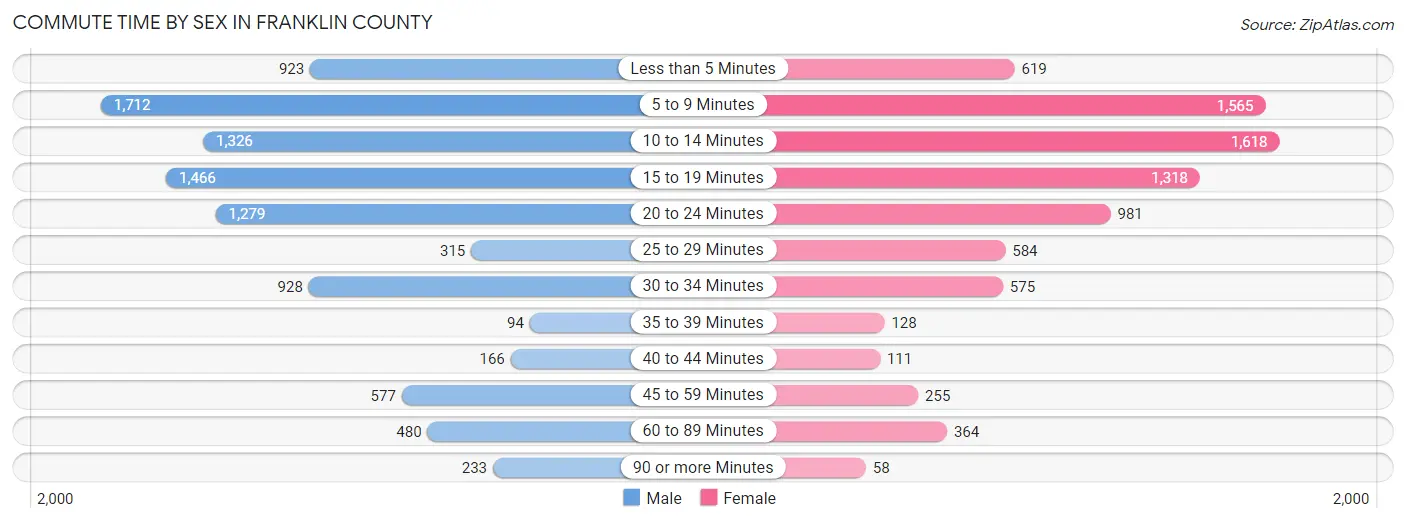
| Commute Time | Male | Female |
| Less than 5 Minutes | 923 (9.7%) | 619 (7.6%) |
| 5 to 9 Minutes | 1,712 (18.0%) | 1,565 (19.1%) |
| 10 to 14 Minutes | 1,326 (14.0%) | 1,618 (19.8%) |
| 15 to 19 Minutes | 1,466 (15.4%) | 1,318 (16.1%) |
| 20 to 24 Minutes | 1,279 (13.5%) | 981 (12.0%) |
| 25 to 29 Minutes | 315 (3.3%) | 584 (7.1%) |
| 30 to 34 Minutes | 928 (9.8%) | 575 (7.0%) |
| 35 to 39 Minutes | 94 (1.0%) | 128 (1.6%) |
| 40 to 44 Minutes | 166 (1.8%) | 111 (1.4%) |
| 45 to 59 Minutes | 577 (6.1%) | 255 (3.1%) |
| 60 to 89 Minutes | 480 (5.1%) | 364 (4.4%) |
| 90 or more Minutes | 233 (2.5%) | 58 (0.7%) |
Time of Departure to Work by Sex in Franklin County
The most frequent times of departure to work in Franklin County are 7:00 AM to 7:29 AM (1,323, 13.9%) for males and 7:30 AM to 7:59 AM (2,050, 25.1%) for females.
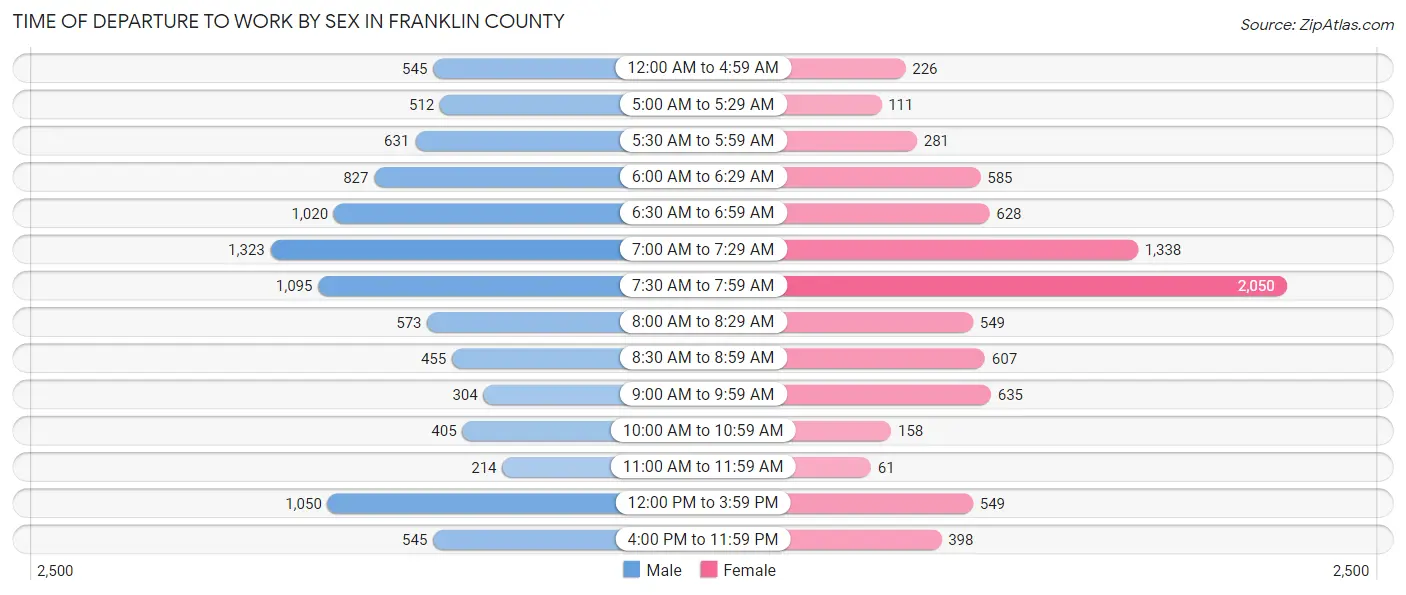
| Time of Departure | Male | Female |
| 12:00 AM to 4:59 AM | 545 (5.7%) | 226 (2.8%) |
| 5:00 AM to 5:29 AM | 512 (5.4%) | 111 (1.4%) |
| 5:30 AM to 5:59 AM | 631 (6.6%) | 281 (3.4%) |
| 6:00 AM to 6:29 AM | 827 (8.7%) | 585 (7.2%) |
| 6:30 AM to 6:59 AM | 1,020 (10.7%) | 628 (7.7%) |
| 7:00 AM to 7:29 AM | 1,323 (13.9%) | 1,338 (16.4%) |
| 7:30 AM to 7:59 AM | 1,095 (11.5%) | 2,050 (25.1%) |
| 8:00 AM to 8:29 AM | 573 (6.0%) | 549 (6.7%) |
| 8:30 AM to 8:59 AM | 455 (4.8%) | 607 (7.4%) |
| 9:00 AM to 9:59 AM | 304 (3.2%) | 635 (7.8%) |
| 10:00 AM to 10:59 AM | 405 (4.3%) | 158 (1.9%) |
| 11:00 AM to 11:59 AM | 214 (2.2%) | 61 (0.7%) |
| 12:00 PM to 3:59 PM | 1,050 (11.1%) | 549 (6.7%) |
| 4:00 PM to 11:59 PM | 545 (5.7%) | 398 (4.9%) |
| Total | 9,499 (100.0%) | 8,176 (100.0%) |
Housing Occupancy in Franklin County
Occupancy by Ownership in Franklin County
Of the total 18,933 dwellings in Franklin County, owner-occupied units account for 13,423 (70.9%), while renter-occupied units make up 5,510 (29.1%).
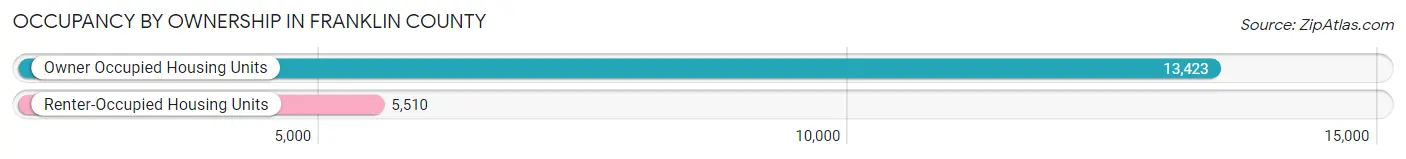
| Occupancy | # Housing Units | % Housing Units |
| Owner Occupied Housing Units | 13,423 | 70.9% |
| Renter-Occupied Housing Units | 5,510 | 29.1% |
| Total Occupied Housing Units | 18,933 | 100.0% |
Occupancy by Household Size in Franklin County
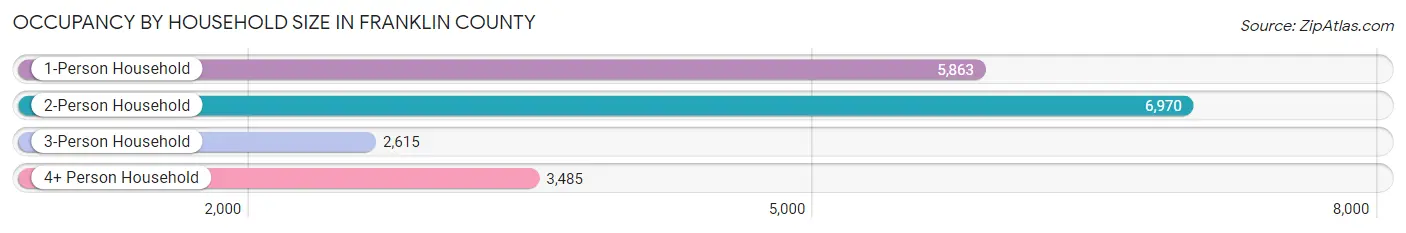
| Household Size | # Housing Units | % Housing Units |
| 1-Person Household | 5,863 | 31.0% |
| 2-Person Household | 6,970 | 36.8% |
| 3-Person Household | 2,615 | 13.8% |
| 4+ Person Household | 3,485 | 18.4% |
| Total Housing Units | 18,933 | 100.0% |
Occupancy by Ownership by Household Size in Franklin County
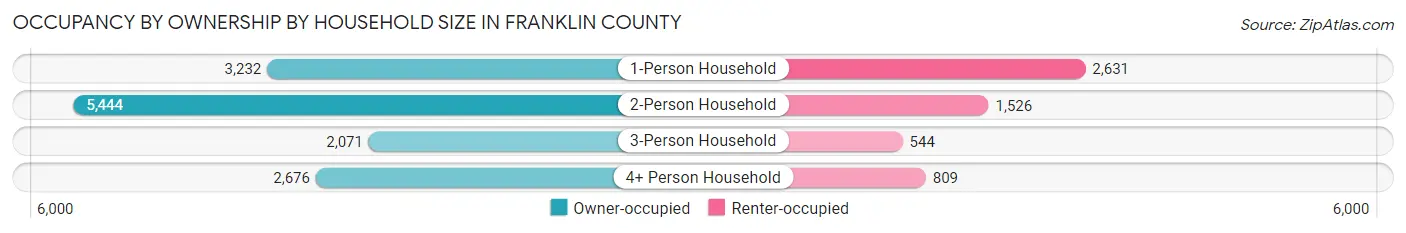
| Household Size | Owner-occupied | Renter-occupied |
| 1-Person Household | 3,232 (55.1%) | 2,631 (44.9%) |
| 2-Person Household | 5,444 (78.1%) | 1,526 (21.9%) |
| 3-Person Household | 2,071 (79.2%) | 544 (20.8%) |
| 4+ Person Household | 2,676 (76.8%) | 809 (23.2%) |
| Total Housing Units | 13,423 (70.9%) | 5,510 (29.1%) |
Occupancy by Educational Attainment in Franklin County
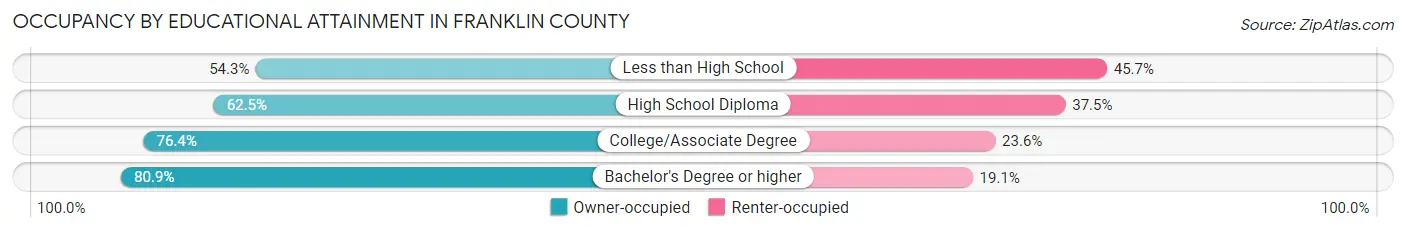
| Household Size | Owner-occupied | Renter-occupied |
| Less than High School | 1,036 (54.3%) | 873 (45.7%) |
| High School Diploma | 3,773 (62.5%) | 2,264 (37.5%) |
| College/Associate Degree | 4,644 (76.4%) | 1,434 (23.6%) |
| Bachelor's Degree or higher | 3,970 (80.9%) | 939 (19.1%) |
Occupancy by Age of Householder in Franklin County
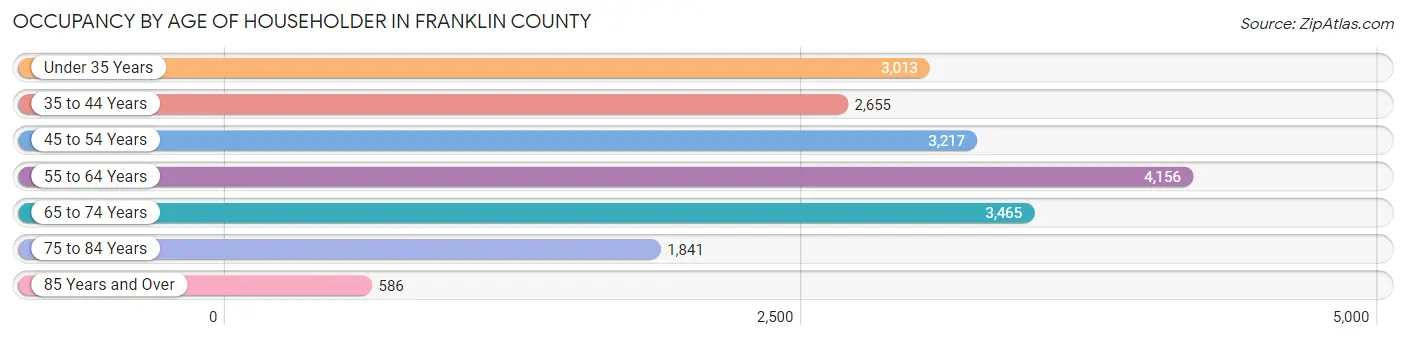
| Age Bracket | # Households | % Households |
| Under 35 Years | 3,013 | 15.9% |
| 35 to 44 Years | 2,655 | 14.0% |
| 45 to 54 Years | 3,217 | 17.0% |
| 55 to 64 Years | 4,156 | 22.0% |
| 65 to 74 Years | 3,465 | 18.3% |
| 75 to 84 Years | 1,841 | 9.7% |
| 85 Years and Over | 586 | 3.1% |
| Total | 18,933 | 100.0% |
Housing Finances in Franklin County
Median Income by Occupancy in Franklin County
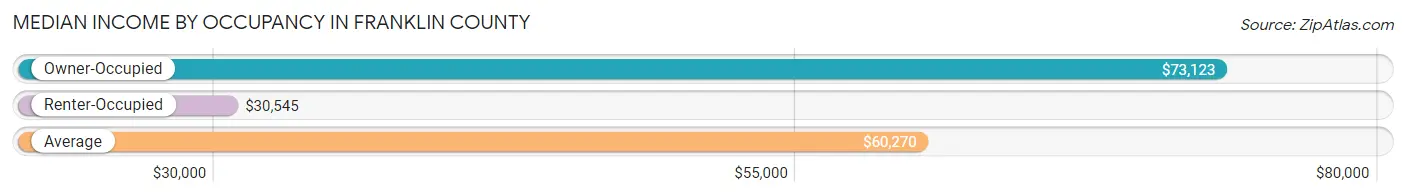
| Occupancy Type | # Households | Median Income |
| Owner-Occupied | 13,423 (70.9%) | $73,123 |
| Renter-Occupied | 5,510 (29.1%) | $30,545 |
| Average | 18,933 (100.0%) | $60,270 |
Occupancy by Householder Income Bracket in Franklin County
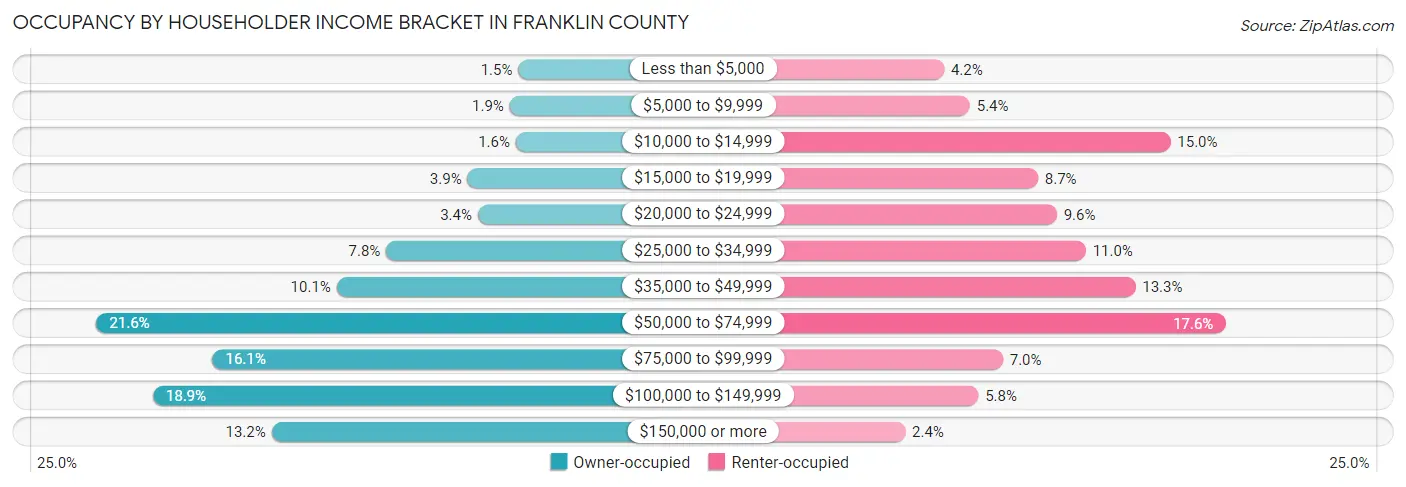
| Income Bracket | Owner-occupied | Renter-occupied |
| Less than $5,000 | 200 (1.5%) | 232 (4.2%) |
| $5,000 to $9,999 | 255 (1.9%) | 300 (5.4%) |
| $10,000 to $14,999 | 216 (1.6%) | 826 (15.0%) |
| $15,000 to $19,999 | 525 (3.9%) | 478 (8.7%) |
| $20,000 to $24,999 | 459 (3.4%) | 528 (9.6%) |
| $25,000 to $34,999 | 1,044 (7.8%) | 604 (11.0%) |
| $35,000 to $49,999 | 1,361 (10.1%) | 734 (13.3%) |
| $50,000 to $74,999 | 2,897 (21.6%) | 970 (17.6%) |
| $75,000 to $99,999 | 2,154 (16.1%) | 386 (7.0%) |
| $100,000 to $149,999 | 2,535 (18.9%) | 322 (5.8%) |
| $150,000 or more | 1,777 (13.2%) | 130 (2.4%) |
| Total | 13,423 (100.0%) | 5,510 (100.0%) |
Monthly Housing Cost Tiers in Franklin County
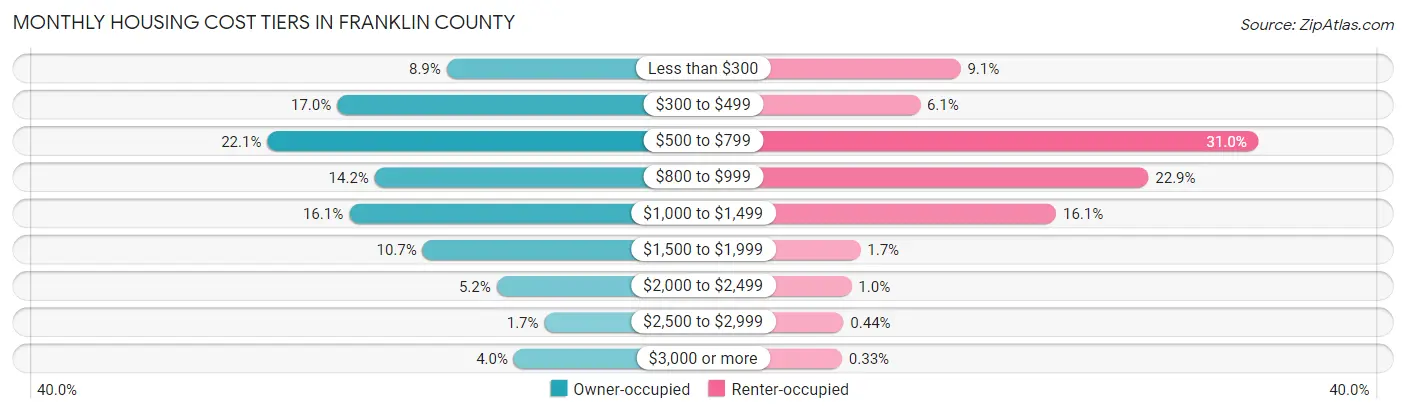
| Monthly Cost | Owner-occupied | Renter-occupied |
| Less than $300 | 1,197 (8.9%) | 499 (9.1%) |
| $300 to $499 | 2,281 (17.0%) | 335 (6.1%) |
| $500 to $799 | 2,971 (22.1%) | 1,709 (31.0%) |
| $800 to $999 | 1,909 (14.2%) | 1,262 (22.9%) |
| $1,000 to $1,499 | 2,163 (16.1%) | 887 (16.1%) |
| $1,500 to $1,999 | 1,435 (10.7%) | 93 (1.7%) |
| $2,000 to $2,499 | 703 (5.2%) | 57 (1.0%) |
| $2,500 to $2,999 | 231 (1.7%) | 24 (0.4%) |
| $3,000 or more | 533 (4.0%) | 18 (0.3%) |
| Total | 13,423 (100.0%) | 5,510 (100.0%) |
Physical Housing Characteristics in Franklin County
Housing Structures in Franklin County
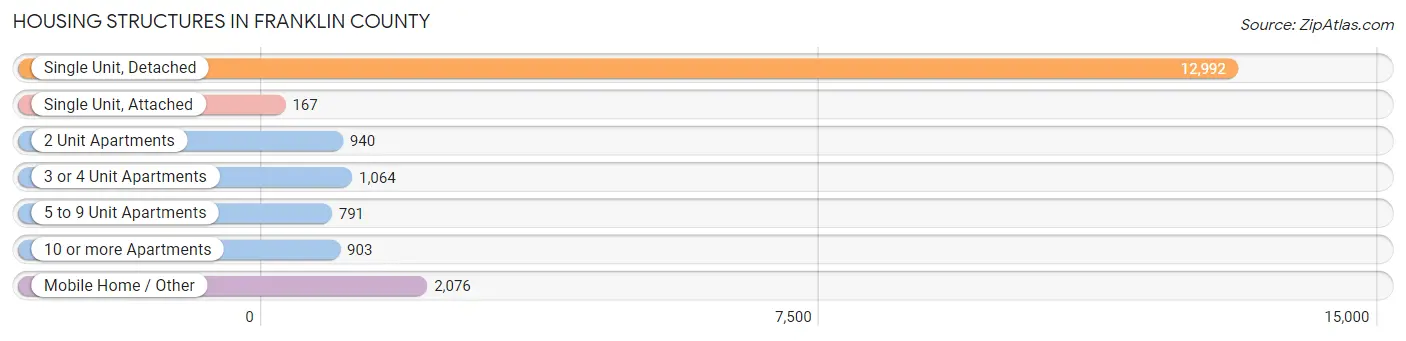
| Structure Type | # Housing Units | % Housing Units |
| Single Unit, Detached | 12,992 | 68.6% |
| Single Unit, Attached | 167 | 0.9% |
| 2 Unit Apartments | 940 | 5.0% |
| 3 or 4 Unit Apartments | 1,064 | 5.6% |
| 5 to 9 Unit Apartments | 791 | 4.2% |
| 10 or more Apartments | 903 | 4.8% |
| Mobile Home / Other | 2,076 | 11.0% |
| Total | 18,933 | 100.0% |
Housing Structures by Occupancy in Franklin County
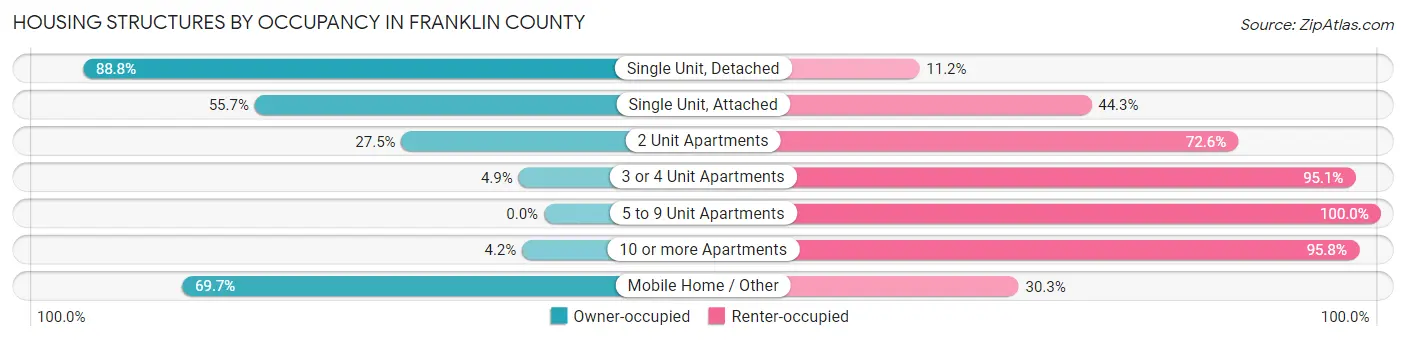
| Structure Type | Owner-occupied | Renter-occupied |
| Single Unit, Detached | 11,535 (88.8%) | 1,457 (11.2%) |
| Single Unit, Attached | 93 (55.7%) | 74 (44.3%) |
| 2 Unit Apartments | 258 (27.5%) | 682 (72.6%) |
| 3 or 4 Unit Apartments | 52 (4.9%) | 1,012 (95.1%) |
| 5 to 9 Unit Apartments | 0 (0.0%) | 791 (100.0%) |
| 10 or more Apartments | 38 (4.2%) | 865 (95.8%) |
| Mobile Home / Other | 1,447 (69.7%) | 629 (30.3%) |
| Total | 13,423 (70.9%) | 5,510 (29.1%) |
Housing Structures by Number of Rooms in Franklin County
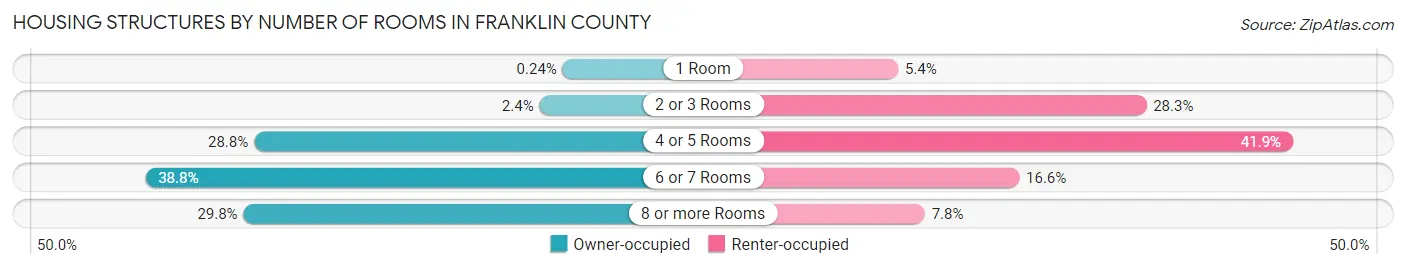
| Number of Rooms | Owner-occupied | Renter-occupied |
| 1 Room | 32 (0.2%) | 296 (5.4%) |
| 2 or 3 Rooms | 319 (2.4%) | 1,561 (28.3%) |
| 4 or 5 Rooms | 3,863 (28.8%) | 2,308 (41.9%) |
| 6 or 7 Rooms | 5,214 (38.8%) | 913 (16.6%) |
| 8 or more Rooms | 3,995 (29.8%) | 432 (7.8%) |
| Total | 13,423 (100.0%) | 5,510 (100.0%) |
Housing Structure by Heating Type in Franklin County
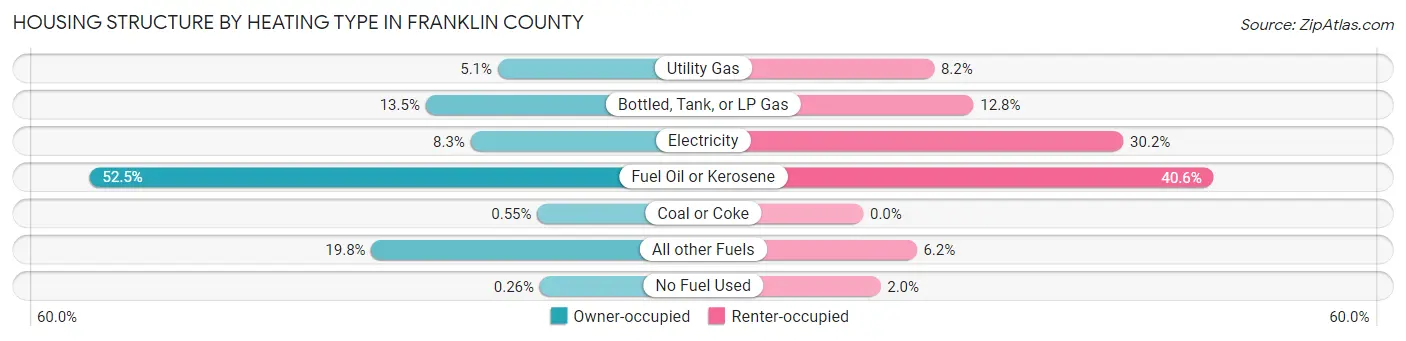
| Heating Type | Owner-occupied | Renter-occupied |
| Utility Gas | 689 (5.1%) | 453 (8.2%) |
| Bottled, Tank, or LP Gas | 1,811 (13.5%) | 705 (12.8%) |
| Electricity | 1,112 (8.3%) | 1,662 (30.2%) |
| Fuel Oil or Kerosene | 7,045 (52.5%) | 2,239 (40.6%) |
| Coal or Coke | 74 (0.5%) | 0 (0.0%) |
| All other Fuels | 2,657 (19.8%) | 341 (6.2%) |
| No Fuel Used | 35 (0.3%) | 110 (2.0%) |
| Total | 13,423 (100.0%) | 5,510 (100.0%) |
Household Vehicle Usage in Franklin County
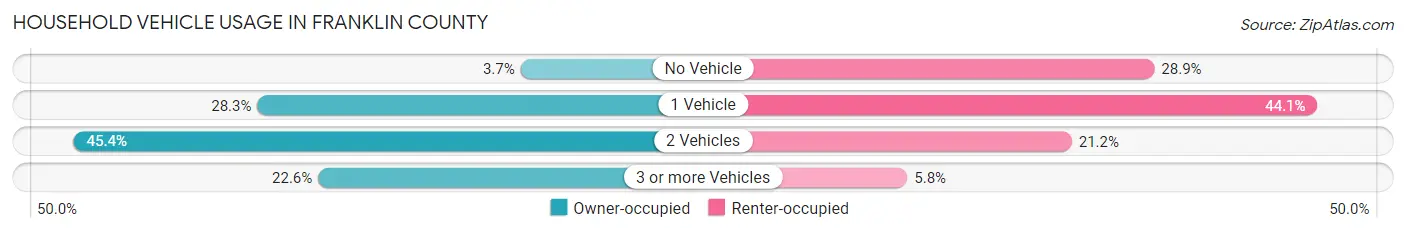
| Vehicles per Household | Owner-occupied | Renter-occupied |
| No Vehicle | 496 (3.7%) | 1,592 (28.9%) |
| 1 Vehicle | 3,796 (28.3%) | 2,430 (44.1%) |
| 2 Vehicles | 6,097 (45.4%) | 1,167 (21.2%) |
| 3 or more Vehicles | 3,034 (22.6%) | 321 (5.8%) |
| Total | 13,423 (100.0%) | 5,510 (100.0%) |
Real Estate & Mortgages in Franklin County
Real Estate and Mortgage Overview in Franklin County
| Characteristic | Without Mortgage | With Mortgage |
| Housing Units | 6,916 | 6,507 |
| Median Property Value | $110,900 | $154,300 |
| Median Household Income | $61,144 | $1,152 |
| Monthly Housing Costs | $502 | $420 |
| Real Estate Taxes | $2,097 | $233 |
Property Value by Mortgage Status in Franklin County
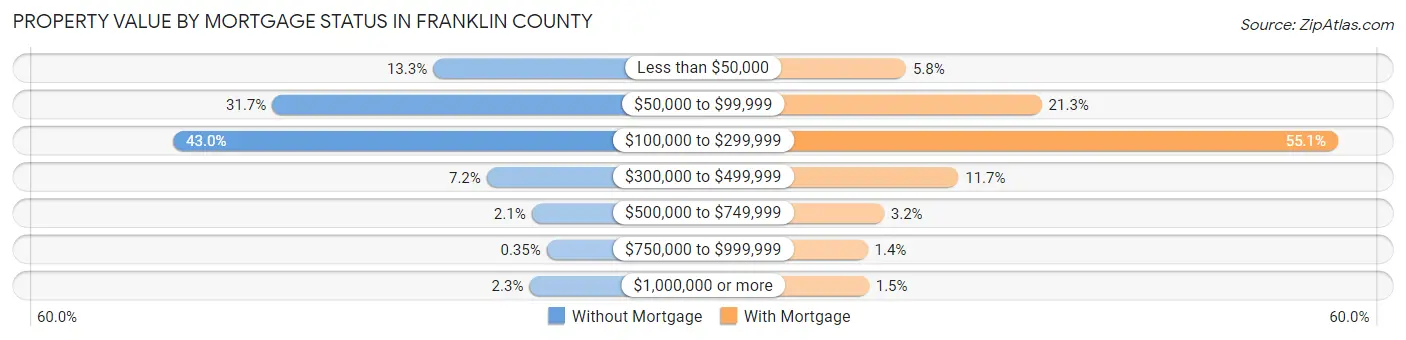
| Property Value | Without Mortgage | With Mortgage |
| Less than $50,000 | 922 (13.3%) | 375 (5.8%) |
| $50,000 to $99,999 | 2,193 (31.7%) | 1,384 (21.3%) |
| $100,000 to $299,999 | 2,975 (43.0%) | 3,586 (55.1%) |
| $300,000 to $499,999 | 498 (7.2%) | 764 (11.7%) |
| $500,000 to $749,999 | 143 (2.1%) | 210 (3.2%) |
| $750,000 to $999,999 | 24 (0.4%) | 90 (1.4%) |
| $1,000,000 or more | 161 (2.3%) | 98 (1.5%) |
| Total | 6,916 (100.0%) | 6,507 (100.0%) |
Household Income by Mortgage Status in Franklin County
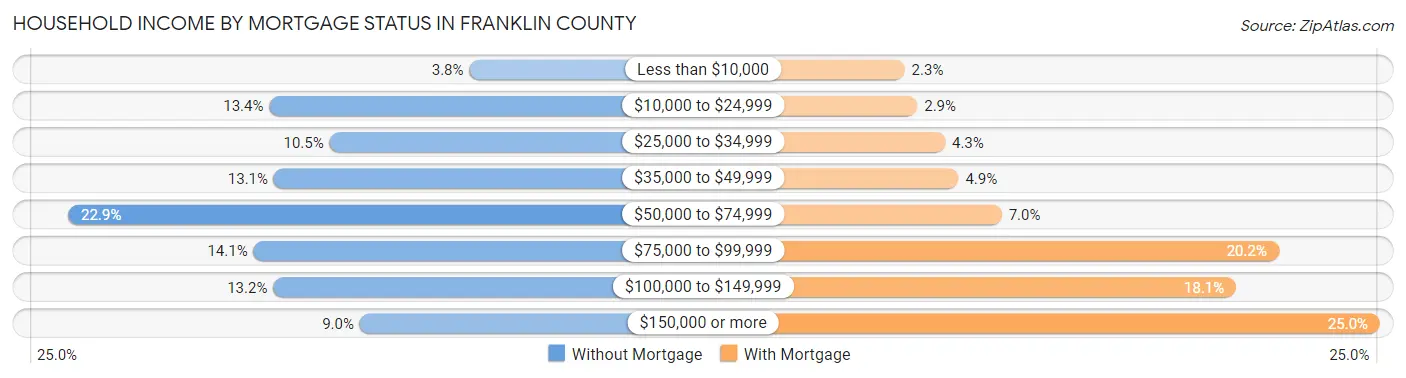
| Household Income | Without Mortgage | With Mortgage |
| Less than $10,000 | 264 (3.8%) | 152 (2.3%) |
| $10,000 to $24,999 | 923 (13.4%) | 191 (2.9%) |
| $25,000 to $34,999 | 725 (10.5%) | 277 (4.3%) |
| $35,000 to $49,999 | 908 (13.1%) | 319 (4.9%) |
| $50,000 to $74,999 | 1,586 (22.9%) | 453 (7.0%) |
| $75,000 to $99,999 | 975 (14.1%) | 1,311 (20.2%) |
| $100,000 to $149,999 | 910 (13.2%) | 1,179 (18.1%) |
| $150,000 or more | 625 (9.0%) | 1,625 (25.0%) |
| Total | 6,916 (100.0%) | 6,507 (100.0%) |
Property Value to Household Income Ratio in Franklin County
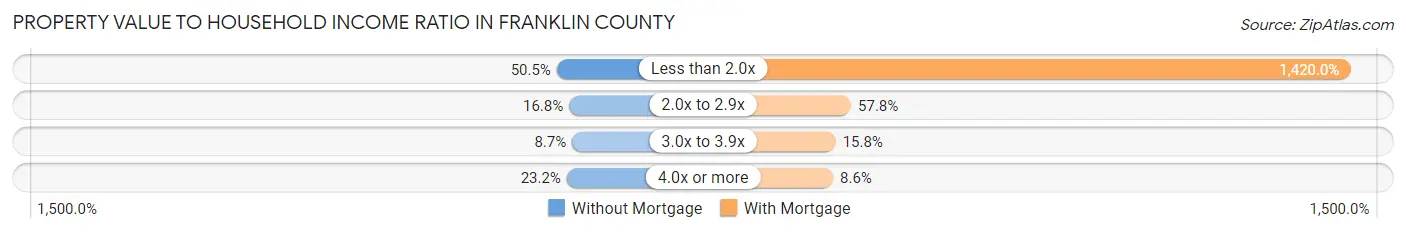
| Value-to-Income Ratio | Without Mortgage | With Mortgage |
| Less than 2.0x | 3,489 (50.4%) | 92,396 (1,420.0%) |
| 2.0x to 2.9x | 1,159 (16.8%) | 3,759 (57.8%) |
| 3.0x to 3.9x | 602 (8.7%) | 1,027 (15.8%) |
| 4.0x or more | 1,605 (23.2%) | 562 (8.6%) |
| Total | 6,916 (100.0%) | 6,507 (100.0%) |
Real Estate Taxes by Mortgage Status in Franklin County
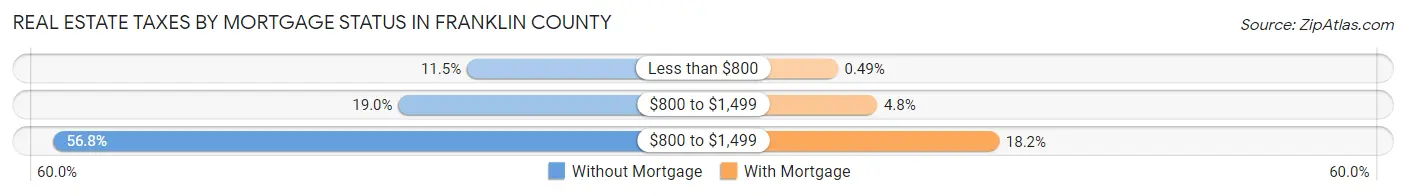
| Property Taxes | Without Mortgage | With Mortgage |
| Less than $800 | 797 (11.5%) | 32 (0.5%) |
| $800 to $1,499 | 1,317 (19.0%) | 313 (4.8%) |
| $800 to $1,499 | 3,930 (56.8%) | 1,182 (18.2%) |
| Total | 6,916 (100.0%) | 6,507 (100.0%) |
Health & Disability in Franklin County
Health Insurance Coverage by Age in Franklin County
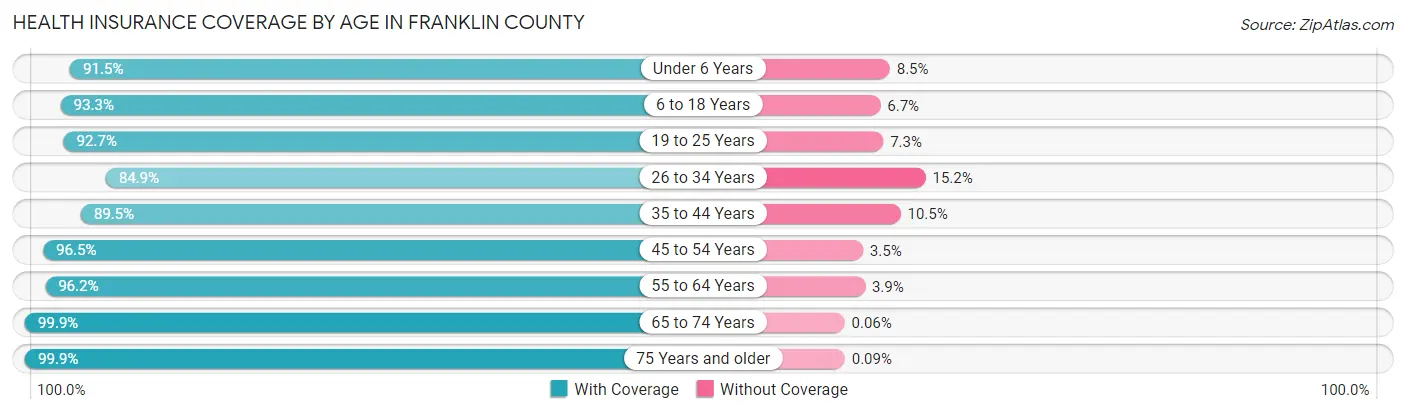
| Age Bracket | With Coverage | Without Coverage |
| Under 6 Years | 2,665 (91.5%) | 247 (8.5%) |
| 6 to 18 Years | 6,665 (93.3%) | 480 (6.7%) |
| 19 to 25 Years | 3,118 (92.7%) | 244 (7.3%) |
| 26 to 34 Years | 4,082 (84.9%) | 729 (15.1%) |
| 35 to 44 Years | 4,290 (89.5%) | 503 (10.5%) |
| 45 to 54 Years | 5,696 (96.5%) | 205 (3.5%) |
| 55 to 64 Years | 6,618 (96.2%) | 265 (3.8%) |
| 65 to 74 Years | 5,195 (99.9%) | 3 (0.1%) |
| 75 Years and older | 3,408 (99.9%) | 3 (0.1%) |
| Total | 41,737 (94.0%) | 2,679 (6.0%) |
Health Insurance Coverage by Citizenship Status in Franklin County
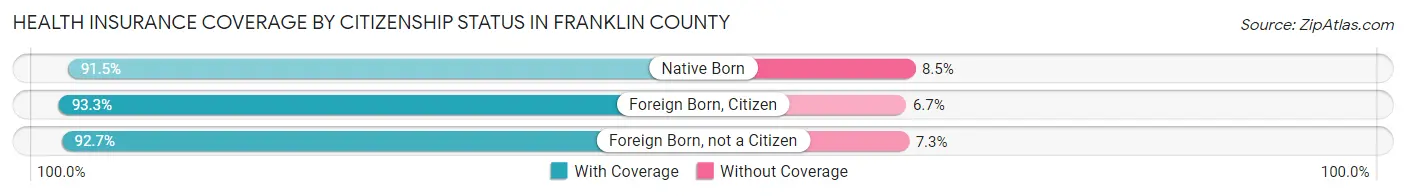
| Citizenship Status | With Coverage | Without Coverage |
| Native Born | 2,665 (91.5%) | 247 (8.5%) |
| Foreign Born, Citizen | 6,665 (93.3%) | 480 (6.7%) |
| Foreign Born, not a Citizen | 3,118 (92.7%) | 244 (7.3%) |
Health Insurance Coverage by Household Income in Franklin County
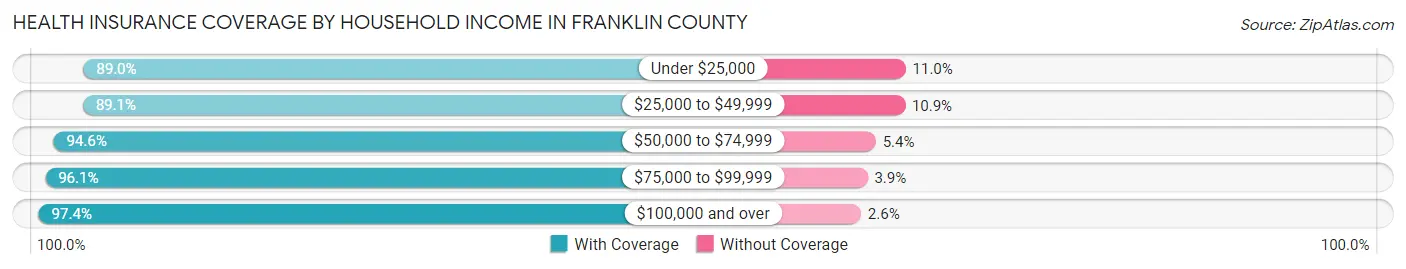
| Household Income | With Coverage | Without Coverage |
| Under $25,000 | 6,395 (89.0%) | 792 (11.0%) |
| $25,000 to $49,999 | 6,399 (89.1%) | 782 (10.9%) |
| $50,000 to $74,999 | 8,520 (94.6%) | 488 (5.4%) |
| $75,000 to $99,999 | 6,401 (96.1%) | 258 (3.9%) |
| $100,000 and over | 12,742 (97.4%) | 346 (2.6%) |
Public vs Private Health Insurance Coverage by Age in Franklin County
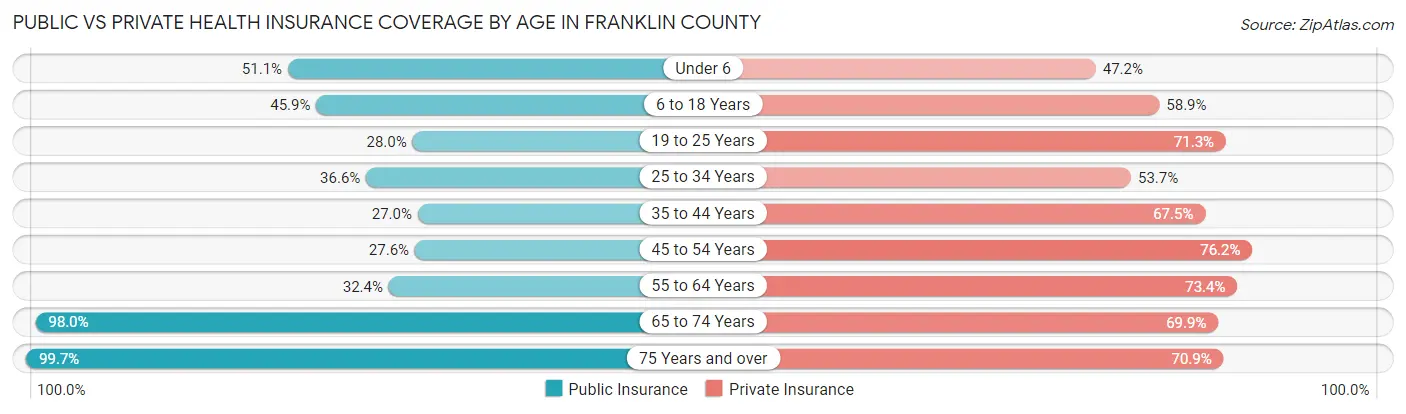
| Age Bracket | Public Insurance | Private Insurance |
| Under 6 | 1,489 (51.1%) | 1,373 (47.1%) |
| 6 to 18 Years | 3,277 (45.9%) | 4,211 (58.9%) |
| 19 to 25 Years | 941 (28.0%) | 2,397 (71.3%) |
| 25 to 34 Years | 1,761 (36.6%) | 2,583 (53.7%) |
| 35 to 44 Years | 1,295 (27.0%) | 3,233 (67.4%) |
| 45 to 54 Years | 1,626 (27.6%) | 4,496 (76.2%) |
| 55 to 64 Years | 2,230 (32.4%) | 5,052 (73.4%) |
| 65 to 74 Years | 5,094 (98.0%) | 3,632 (69.9%) |
| 75 Years and over | 3,402 (99.7%) | 2,417 (70.9%) |
| Total | 21,115 (47.5%) | 29,394 (66.2%) |
Disability Status by Sex by Age in Franklin County
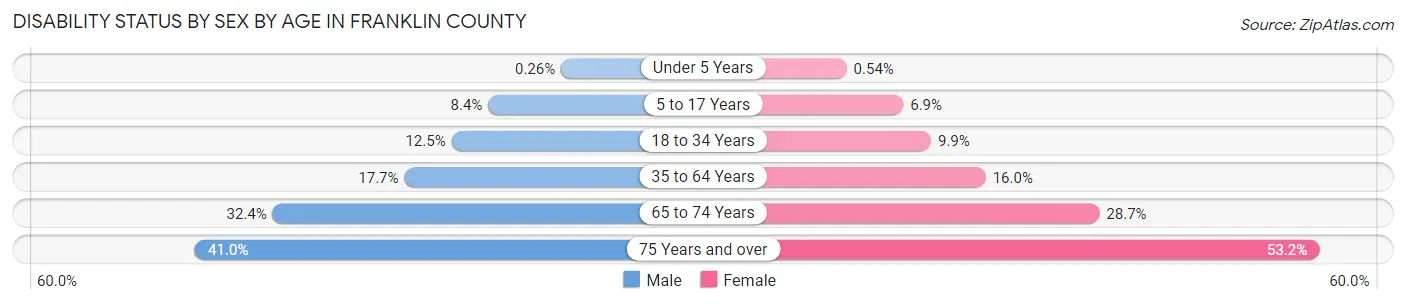
| Age Bracket | Male | Female |
| Under 5 Years | 3 (0.3%) | 7 (0.5%) |
| 5 to 17 Years | 302 (8.4%) | 241 (6.9%) |
| 18 to 34 Years | 560 (12.5%) | 412 (9.9%) |
| 35 to 64 Years | 1,552 (17.7%) | 1,413 (16.0%) |
| 65 to 74 Years | 849 (32.4%) | 739 (28.7%) |
| 75 Years and over | 591 (41.0%) | 1,047 (53.1%) |
Disability Class by Sex by Age in Franklin County
Disability Class: Hearing Difficulty
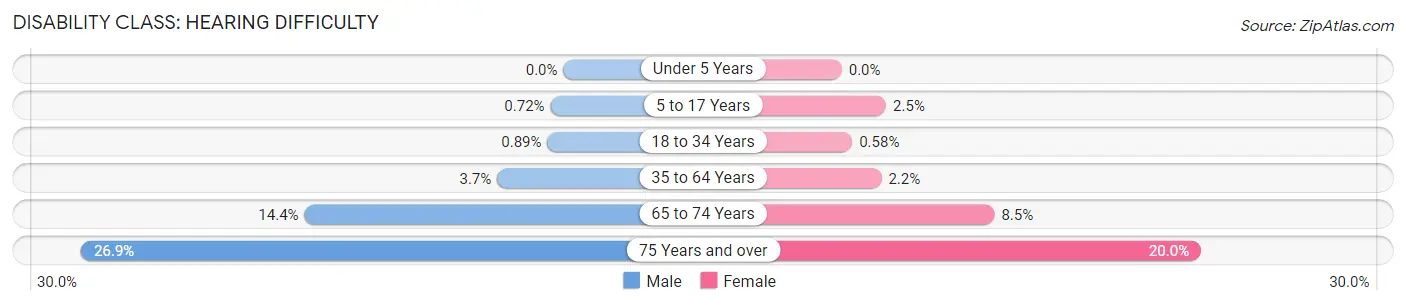
| Age Bracket | Male | Female |
| Under 5 Years | 0 (0.0%) | 0 (0.0%) |
| 5 to 17 Years | 26 (0.7%) | 87 (2.5%) |
| 18 to 34 Years | 40 (0.9%) | 24 (0.6%) |
| 35 to 64 Years | 323 (3.7%) | 195 (2.2%) |
| 65 to 74 Years | 378 (14.4%) | 219 (8.5%) |
| 75 Years and over | 387 (26.9%) | 394 (20.0%) |
Disability Class: Vision Difficulty
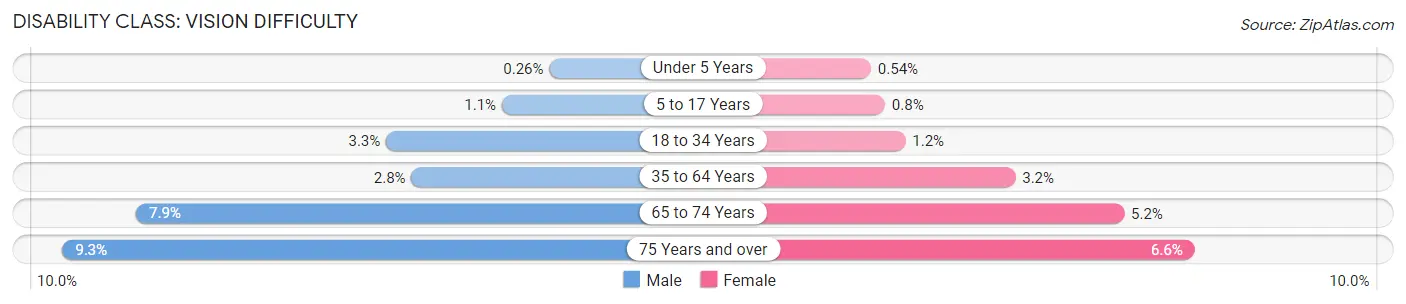
| Age Bracket | Male | Female |
| Under 5 Years | 3 (0.3%) | 7 (0.5%) |
| 5 to 17 Years | 41 (1.1%) | 28 (0.8%) |
| 18 to 34 Years | 148 (3.3%) | 49 (1.2%) |
| 35 to 64 Years | 247 (2.8%) | 284 (3.2%) |
| 65 to 74 Years | 208 (7.9%) | 135 (5.2%) |
| 75 Years and over | 134 (9.3%) | 129 (6.6%) |
Disability Class: Cognitive Difficulty
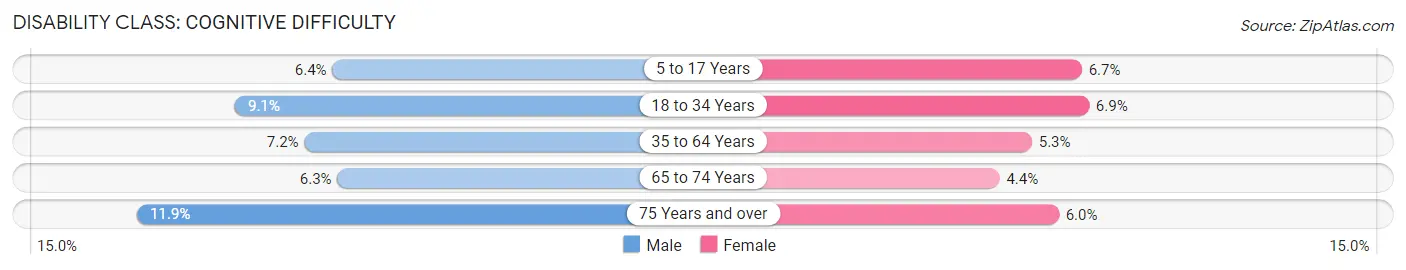
| Age Bracket | Male | Female |
| 5 to 17 Years | 232 (6.4%) | 235 (6.7%) |
| 18 to 34 Years | 411 (9.1%) | 285 (6.9%) |
| 35 to 64 Years | 632 (7.2%) | 466 (5.3%) |
| 65 to 74 Years | 165 (6.3%) | 113 (4.4%) |
| 75 Years and over | 171 (11.9%) | 119 (6.0%) |
Disability Class: Ambulatory Difficulty
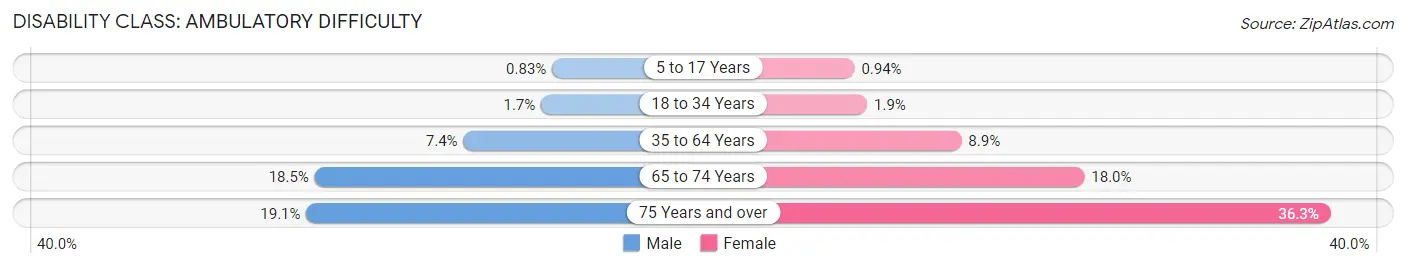
| Age Bracket | Male | Female |
| 5 to 17 Years | 30 (0.8%) | 33 (0.9%) |
| 18 to 34 Years | 74 (1.7%) | 78 (1.9%) |
| 35 to 64 Years | 650 (7.4%) | 783 (8.9%) |
| 65 to 74 Years | 484 (18.5%) | 464 (18.0%) |
| 75 Years and over | 275 (19.1%) | 715 (36.3%) |
Disability Class: Self-Care Difficulty
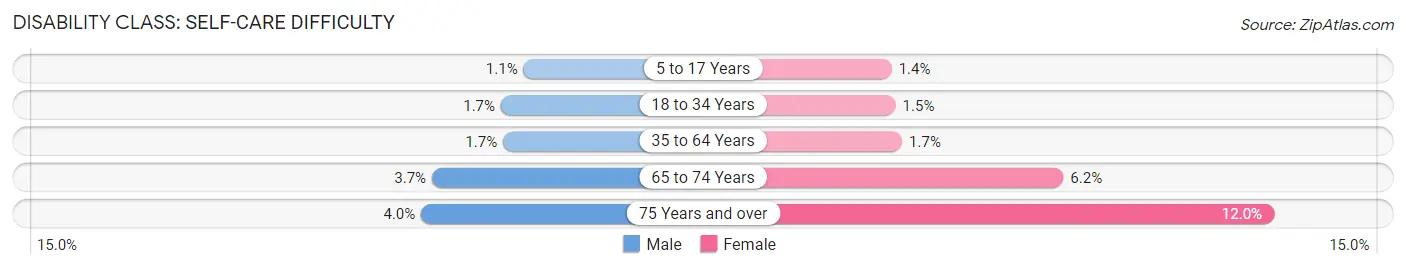
| Age Bracket | Male | Female |
| 5 to 17 Years | 40 (1.1%) | 49 (1.4%) |
| 18 to 34 Years | 78 (1.7%) | 62 (1.5%) |
| 35 to 64 Years | 147 (1.7%) | 148 (1.7%) |
| 65 to 74 Years | 96 (3.7%) | 159 (6.2%) |
| 75 Years and over | 57 (4.0%) | 237 (12.0%) |
Technology Access in Franklin County
Computing Device Access in Franklin County
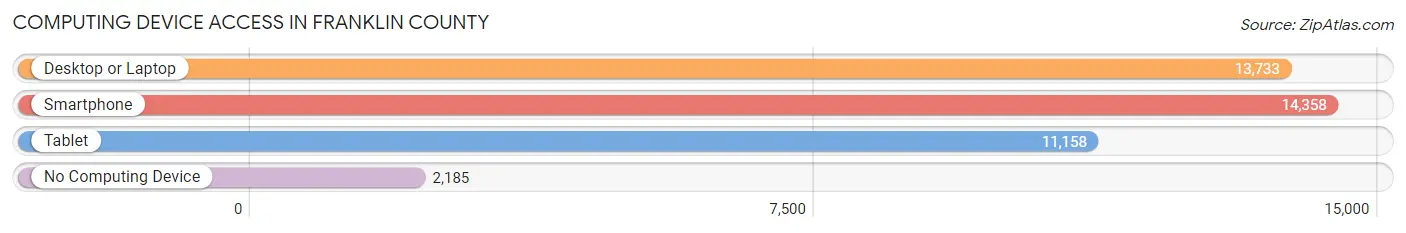
| Device Type | # Households | % Households |
| Desktop or Laptop | 13,733 | 72.5% |
| Smartphone | 14,358 | 75.8% |
| Tablet | 11,158 | 58.9% |
| No Computing Device | 2,185 | 11.5% |
| Total | 18,933 | 100.0% |
Internet Access in Franklin County
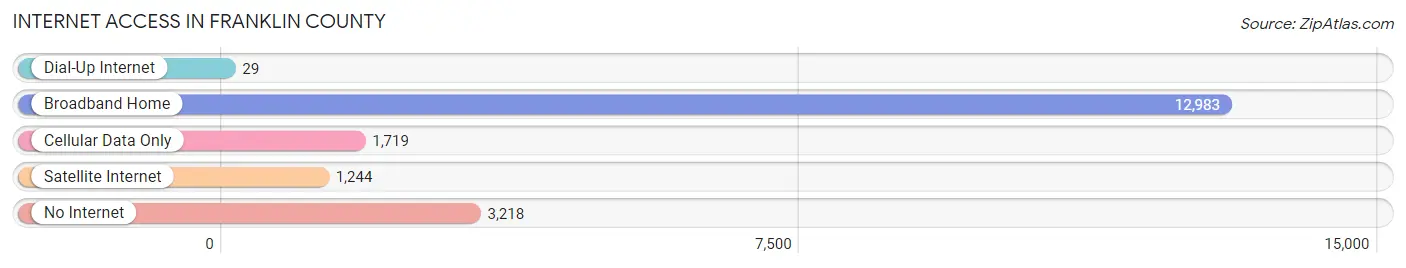
| Internet Type | # Households | % Households |
| Dial-Up Internet | 29 | 0.2% |
| Broadband Home | 12,983 | 68.6% |
| Cellular Data Only | 1,719 | 9.1% |
| Satellite Internet | 1,244 | 6.6% |
| No Internet | 3,218 | 17.0% |
| Total | 18,933 | 100.0% |
Franklin County Summary
Franklin County is located in the northern part of the state of New York, and is bordered by St. Lawrence County to the north, Clinton County to the east, Essex County to the south, and the Canadian province of Quebec to the west. The county seat is Malone, and the largest city is Saranac Lake. The county was established in 1808 and named after Benjamin Franklin.
Geography
Franklin County covers an area of 1,697 square miles, making it the fourth largest county in New York. The terrain is mostly mountainous, with the Adirondack Mountains occupying the western part of the county. The highest point in the county is Mount Marcy, which has an elevation of 5,344 feet. The county is home to numerous rivers and lakes, including the Saranac River, the St. Regis River, and Lake Placid.
The climate of Franklin County is classified as humid continental, with cold, snowy winters and warm, humid summers. The average annual temperature is around 40°F, and the average annual precipitation is around 40 inches.
Economy
The economy of Franklin County is largely based on tourism, with the Adirondack Mountains providing a popular destination for outdoor recreation. The county is also home to several ski resorts, including Whiteface Mountain and Gore Mountain. Other major industries in the county include manufacturing, healthcare, and education.
Demographics
As of the 2010 census, the population of Franklin County was 51,599, making it the least populous county in New York. The population density was 30.7 people per square mile. The racial makeup of the county was 94.3% White, 1.7% Black or African American, 0.7% Native American, 0.5% Asian, 0.1% Pacific Islander, and 2.7% from other races. The median household income was $41,945, and the median family income was $50,945.
The largest ancestry groups in Franklin County are Irish (25.2%), French (19.2%), German (14.2%), English (13.2%), and Italian (7.2%). The largest religious denominations are Catholic (41.2%), Protestant (25.2%), and Other (33.4%). The county is home to several colleges and universities, including Paul Smith's College, North Country Community College, and SUNY Plattsburgh.
Conclusion
Franklin County is a rural county located in the northern part of New York. The county is home to the Adirondack Mountains, providing a popular destination for outdoor recreation. The economy of the county is largely based on tourism, and other major industries include manufacturing, healthcare, and education. The population of the county is 51,599, and the largest ancestry groups are Irish, French, German, English, and Italian.
Common Questions
What is Per Capita Income in Franklin County?
Per Capita income in Franklin County is $30,411.
What is the Median Family Income in Franklin County?
Median Family Income in Franklin County is $73,285.
What is the Median Household income in Franklin County?
Median Household Income in Franklin County is $60,270.
What is Income or Wage Gap in Franklin County?
Income or Wage Gap in Franklin County is 13.3%.
Women in Franklin County earn 86.7 cents for every dollar earned by a man.
What is Family Income Deficit in Franklin County?
Family Income Deficit in Franklin County is $11,319.
Families that are below poverty line in Franklin County earn $11,319 less on average than the poverty threshold level.
What is Inequality or Gini Index in Franklin County?
Inequality or Gini Index in Franklin County is 0.44.
What is the Total Population of Franklin County?
Total Population of Franklin County is 47,459.
What is the Total Male Population of Franklin County?
Total Male Population of Franklin County is 25,027.
What is the Total Female Population of Franklin County?
Total Female Population of Franklin County is 22,432.
What is the Ratio of Males per 100 Females in Franklin County?
There are 111.57 Males per 100 Females in Franklin County.
What is the Ratio of Females per 100 Males in Franklin County?
There are 89.63 Females per 100 Males in Franklin County.
What is the Median Population Age in Franklin County?
Median Population Age in Franklin County is 41.9 Years.
What is the Average Family Size in Franklin County
Average Family Size in Franklin County is 2.8 People.
What is the Average Household Size in Franklin County
Average Household Size in Franklin County is 2.3 People.
How Large is the Labor Force in Franklin County?
There are 20,373 People in the Labor Forcein in Franklin County.
What is the Percentage of People in the Labor Force in Franklin County?
52.2% of People are in the Labor Force in Franklin County.
What is the Unemployment Rate in Franklin County?
Unemployment Rate in Franklin County is 5.1%.