Essex County, NY Map & Demographics
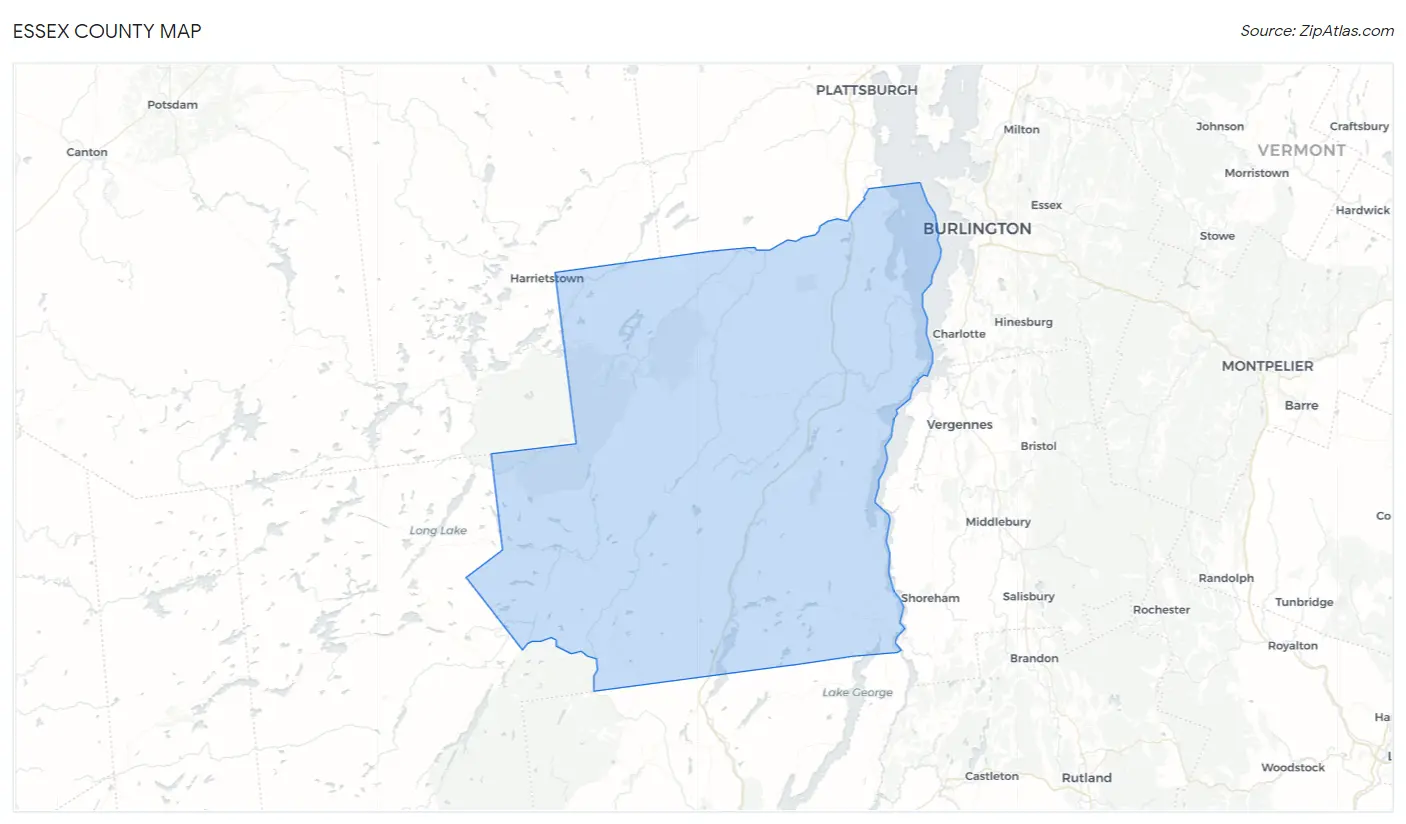
Essex County Map
Essex County Overview
$39,049
PER CAPITA INCOME
$81,271
AVG FAMILY INCOME
$68,090
AVG HOUSEHOLD INCOME
20.0%
WAGE / INCOME GAP [ % ]
80.0¢/ $1
WAGE / INCOME GAP [ $ ]
$10,213
FAMILY INCOME DEFICIT
0.45
INEQUALITY / GINI INDEX
37,314
TOTAL POPULATION
19,297
MALE POPULATION
18,017
FEMALE POPULATION
107.10
MALES / 100 FEMALES
93.37
FEMALES / 100 MALES
49.2
MEDIAN AGE
2.7
AVG FAMILY SIZE
2.2
AVG HOUSEHOLD SIZE
18,229
LABOR FORCE [ PEOPLE ]
56.5%
PERCENT IN LABOR FORCE
5.1%
UNEMPLOYMENT RATE
Essex County Area Codes
Income in Essex County
Income Overview in Essex County
Per Capita Income in Essex County is $39,049, while median incomes of families and households are $81,271 and $68,090 respectively.
| Characteristic | Number | Measure |
| Per Capita Income | 37,314 | $39,049 |
| Median Family Income | 9,538 | $81,271 |
| Mean Family Income | 9,538 | $103,375 |
| Median Household Income | 15,750 | $68,090 |
| Mean Household Income | 15,750 | $90,052 |
| Income Deficit | 9,538 | $10,213 |
| Wage / Income Gap (%) | 37,314 | 20.00% |
| Wage / Income Gap ($) | 37,314 | 80.00¢ per $1 |
| Gini / Inequality Index | 37,314 | 0.45 |
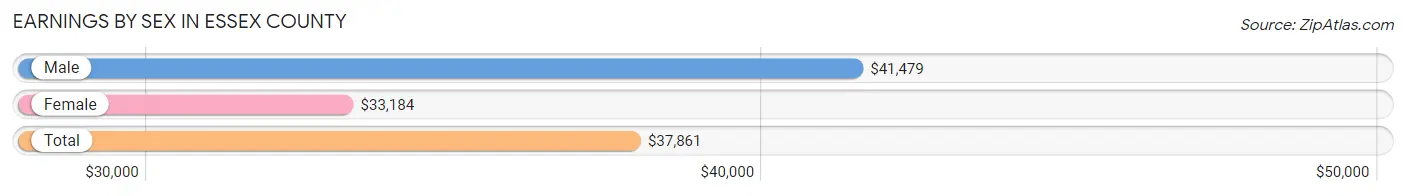
Earnings by Sex in Essex County
Average Earnings in Essex County are $37,861, $41,479 for men and $33,184 for women, a difference of 20.0%.
| Sex | Number | Average Earnings |
| Male | 10,309 (52.5%) | $41,479 |
| Female | 9,314 (47.5%) | $33,184 |
| Total | 19,623 (100.0%) | $37,861 |
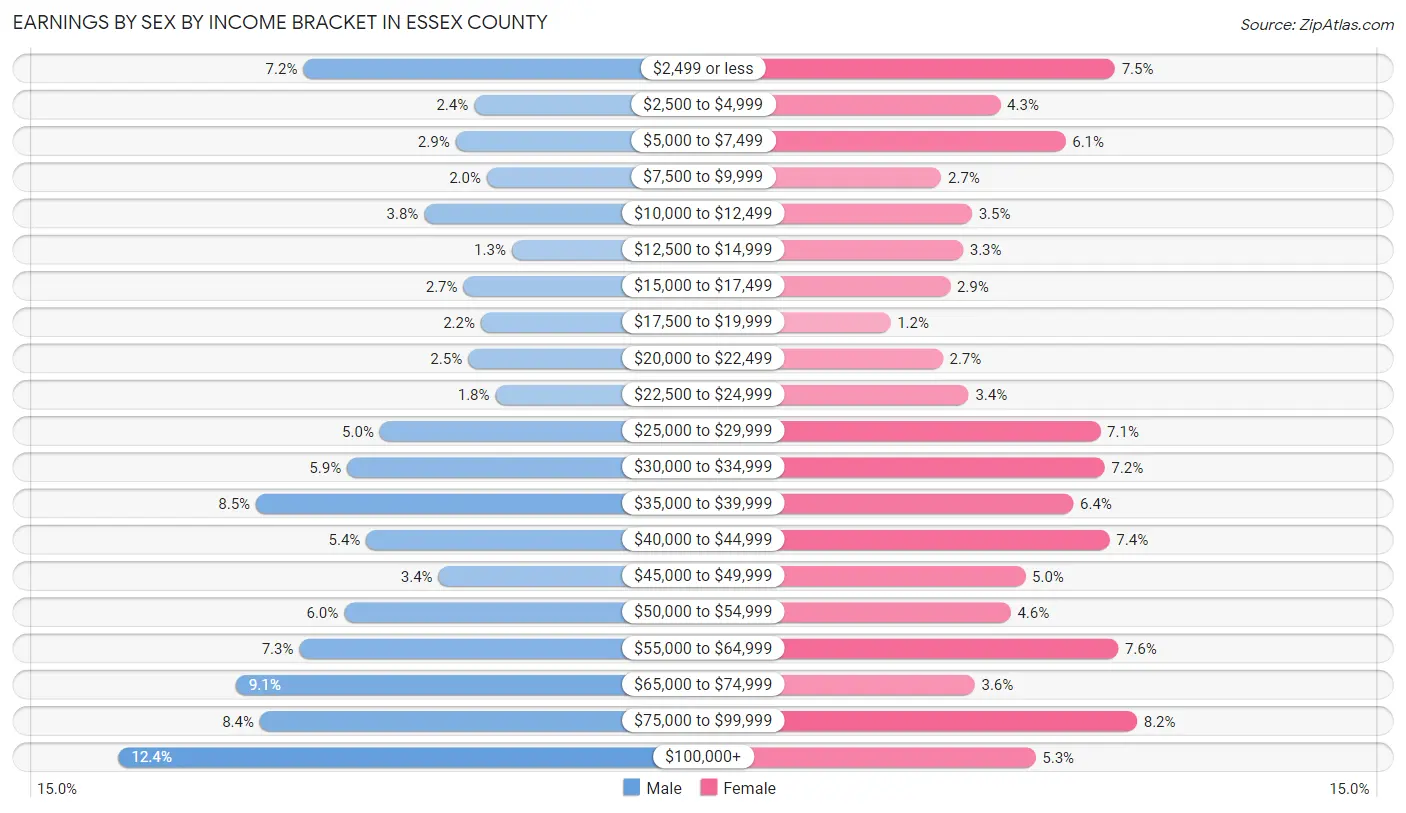
Earnings by Sex by Income Bracket in Essex County
The most common earnings brackets in Essex County are $100,000+ for men (1,274 | 12.4%) and $75,000 to $99,999 for women (759 | 8.2%).
| Income | Male | Female |
| $2,499 or less | 739 (7.2%) | 701 (7.5%) |
| $2,500 to $4,999 | 244 (2.4%) | 401 (4.3%) |
| $5,000 to $7,499 | 298 (2.9%) | 572 (6.1%) |
| $7,500 to $9,999 | 207 (2.0%) | 247 (2.6%) |
| $10,000 to $12,499 | 389 (3.8%) | 327 (3.5%) |
| $12,500 to $14,999 | 135 (1.3%) | 304 (3.3%) |
| $15,000 to $17,499 | 275 (2.7%) | 270 (2.9%) |
| $17,500 to $19,999 | 225 (2.2%) | 114 (1.2%) |
| $20,000 to $22,499 | 262 (2.5%) | 251 (2.7%) |
| $22,500 to $24,999 | 182 (1.8%) | 319 (3.4%) |
| $25,000 to $29,999 | 517 (5.0%) | 663 (7.1%) |
| $30,000 to $34,999 | 612 (5.9%) | 674 (7.2%) |
| $35,000 to $39,999 | 876 (8.5%) | 592 (6.4%) |
| $40,000 to $44,999 | 557 (5.4%) | 687 (7.4%) |
| $45,000 to $49,999 | 347 (3.4%) | 467 (5.0%) |
| $50,000 to $54,999 | 621 (6.0%) | 428 (4.6%) |
| $55,000 to $64,999 | 750 (7.3%) | 710 (7.6%) |
| $65,000 to $74,999 | 934 (9.1%) | 334 (3.6%) |
| $75,000 to $99,999 | 865 (8.4%) | 759 (8.2%) |
| $100,000+ | 1,274 (12.4%) | 494 (5.3%) |
| Total | 10,309 (100.0%) | 9,314 (100.0%) |
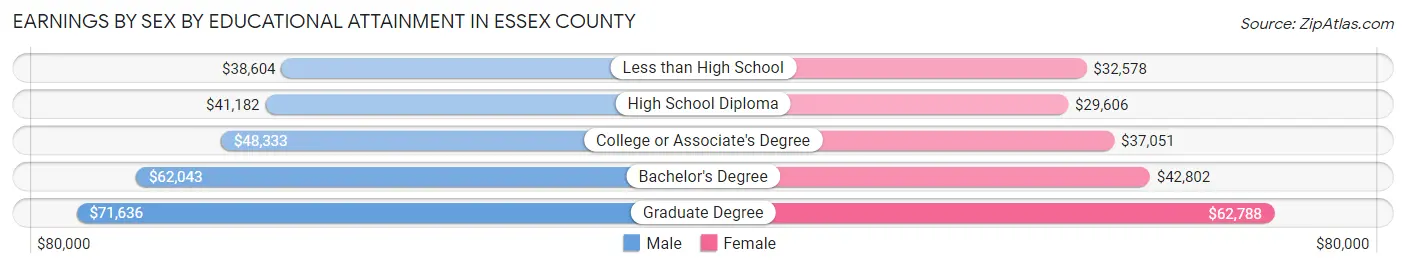
Earnings by Sex by Educational Attainment in Essex County
Average earnings in Essex County are $48,014 for men and $37,735 for women, a difference of 21.4%. Men with an educational attainment of graduate degree enjoy the highest average annual earnings of $71,636, while those with less than high school education earn the least with $38,604. Women with an educational attainment of graduate degree earn the most with the average annual earnings of $62,788, while those with high school diploma education have the smallest earnings of $29,606.
| Educational Attainment | Male Income | Female Income |
| Less than High School | $38,604 | $32,578 |
| High School Diploma | $41,182 | $29,606 |
| College or Associate's Degree | $48,333 | $37,051 |
| Bachelor's Degree | $62,043 | $42,802 |
| Graduate Degree | $71,636 | $62,788 |
| Total | $48,014 | $37,735 |
Family Income in Essex County
Family Income Brackets in Essex County
According to the Essex County family income data, there are 2,146 families falling into the $100,000 to $149,999 income range, which is the most common income bracket and makes up 22.5% of all families. Conversely, the $10,000 to $14,999 income bracket is the least frequent group with only 95 families (1.0%) belonging to this category.
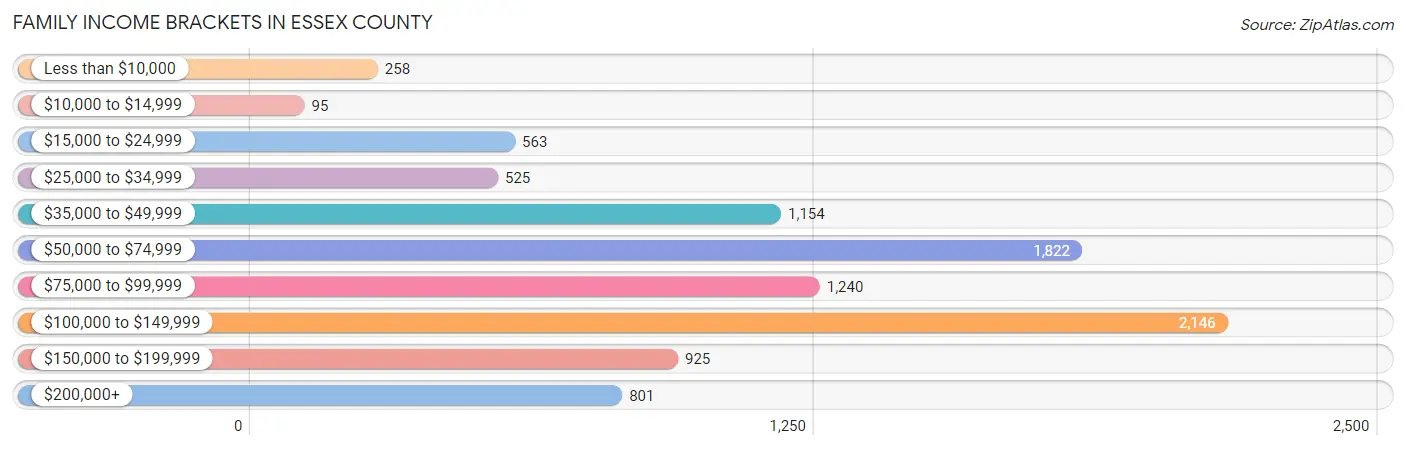
| Income Bracket | # Families | % Families |
| Less than $10,000 | 258 | 2.7% |
| $10,000 to $14,999 | 95 | 1.0% |
| $15,000 to $24,999 | 563 | 5.9% |
| $25,000 to $34,999 | 525 | 5.5% |
| $35,000 to $49,999 | 1,154 | 12.1% |
| $50,000 to $74,999 | 1,822 | 19.1% |
| $75,000 to $99,999 | 1,240 | 13.0% |
| $100,000 to $149,999 | 2,146 | 22.5% |
| $150,000 to $199,999 | 925 | 9.7% |
| $200,000+ | 801 | 8.4% |
Family Income by Famaliy Size in Essex County
4-person families (1,221 | 12.8%) account for the highest median family income in Essex County with $109,338 per family, while 2-person families (5,486 | 57.5%) have the highest median income of $35,393 per family member.
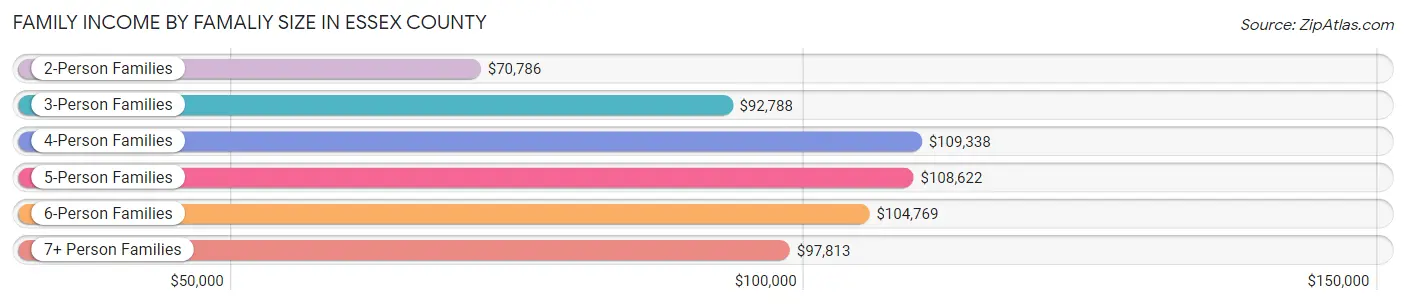
| Income Bracket | # Families | Median Income |
| 2-Person Families | 5,486 (57.5%) | $70,786 |
| 3-Person Families | 2,057 (21.6%) | $92,788 |
| 4-Person Families | 1,221 (12.8%) | $109,338 |
| 5-Person Families | 569 (6.0%) | $108,622 |
| 6-Person Families | 145 (1.5%) | $104,769 |
| 7+ Person Families | 60 (0.6%) | $97,813 |
| Total | 9,538 (100.0%) | $81,271 |
Family Income by Number of Earners in Essex County
The median family income in Essex County is $81,271, with families comprising 3+ earners (1,011) having the highest median family income of $135,341, while families with 1 earner (2,774) have the lowest median family income of $50,929, accounting for 10.6% and 29.1% of families, respectively.
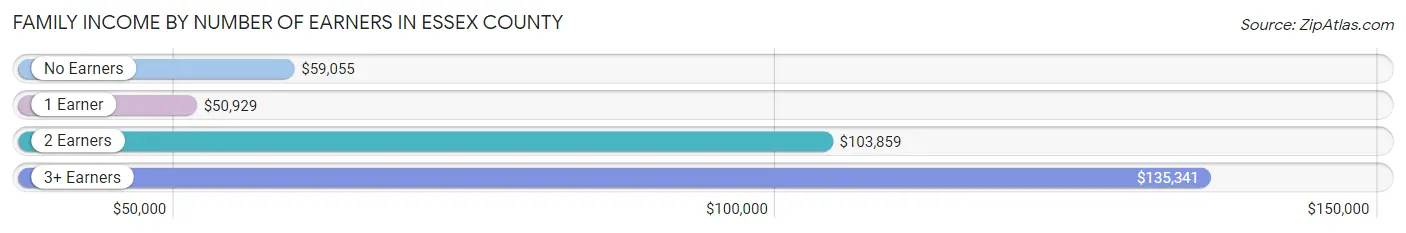
| Number of Earners | # Families | Median Income |
| No Earners | 2,047 (21.5%) | $59,055 |
| 1 Earner | 2,774 (29.1%) | $50,929 |
| 2 Earners | 3,706 (38.9%) | $103,859 |
| 3+ Earners | 1,011 (10.6%) | $135,341 |
| Total | 9,538 (100.0%) | $81,271 |
Household Income in Essex County
Household Income Brackets in Essex County
With 3,024 households falling in the category, the $100,000 to $149,999 income range is the most frequent in Essex County, accounting for 19.2% of all households. In contrast, only 583 households (3.7%) fall into the less than $10,000 income bracket, making it the least populous group.
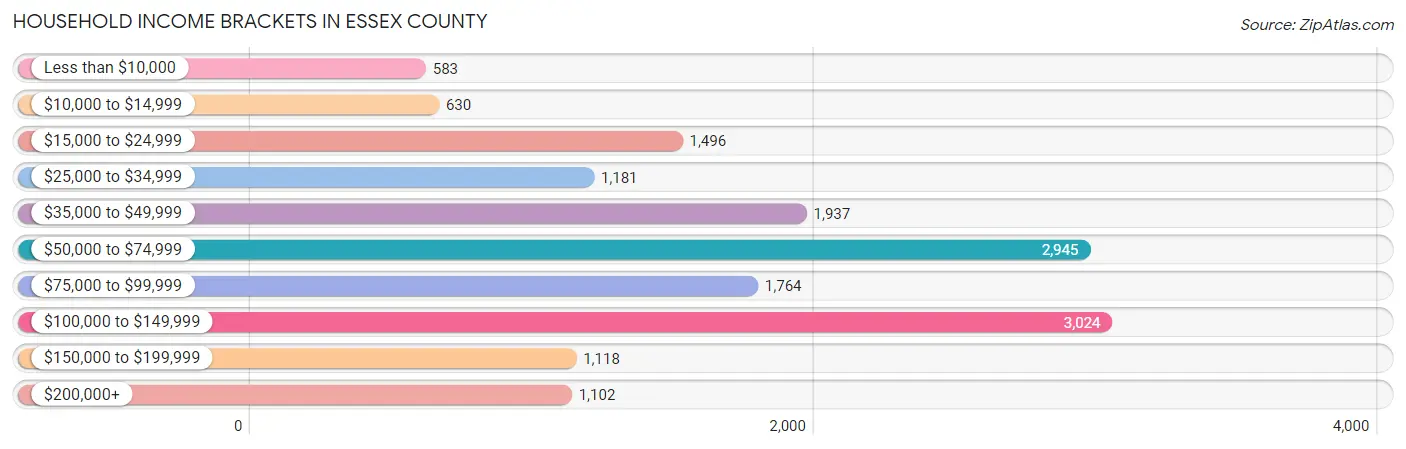
| Income Bracket | # Households | % Households |
| Less than $10,000 | 583 | 3.7% |
| $10,000 to $14,999 | 630 | 4.0% |
| $15,000 to $24,999 | 1,496 | 9.5% |
| $25,000 to $34,999 | 1,181 | 7.5% |
| $35,000 to $49,999 | 1,937 | 12.3% |
| $50,000 to $74,999 | 2,945 | 18.7% |
| $75,000 to $99,999 | 1,764 | 11.2% |
| $100,000 to $149,999 | 3,024 | 19.2% |
| $150,000 to $199,999 | 1,118 | 7.1% |
| $200,000+ | 1,102 | 7.0% |
Household Income by Householder Age in Essex County
The median household income in Essex County is $68,090, with the highest median household income of $80,613 found in the 45 to 64 years age bracket for the primary householder. A total of 6,297 households (40.0%) fall into this category. Meanwhile, the 15 to 24 years age bracket for the primary householder has the lowest median household income of $0, with 197 households (1.3%) in this group.
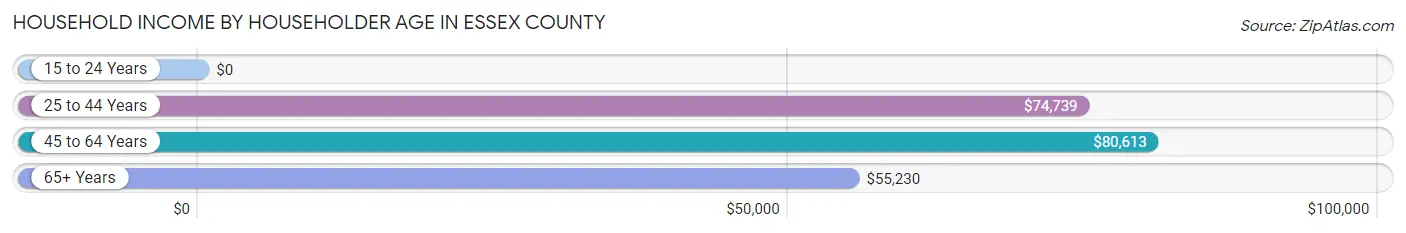
| Income Bracket | # Households | Median Income |
| 15 to 24 Years | 197 (1.3%) | $0 |
| 25 to 44 Years | 3,474 (22.1%) | $74,739 |
| 45 to 64 Years | 6,297 (40.0%) | $80,613 |
| 65+ Years | 5,782 (36.7%) | $55,230 |
| Total | 15,750 (100.0%) | $68,090 |
Poverty in Essex County
Income Below Poverty by Sex and Age in Essex County
With 9.6% poverty level for males and 11.3% for females among the residents of Essex County, 25 to 34 year old males and under 5 year old females are the most vulnerable to poverty, with 253 males (13.6%) and 171 females (23.7%) in their respective age groups living below the poverty level.
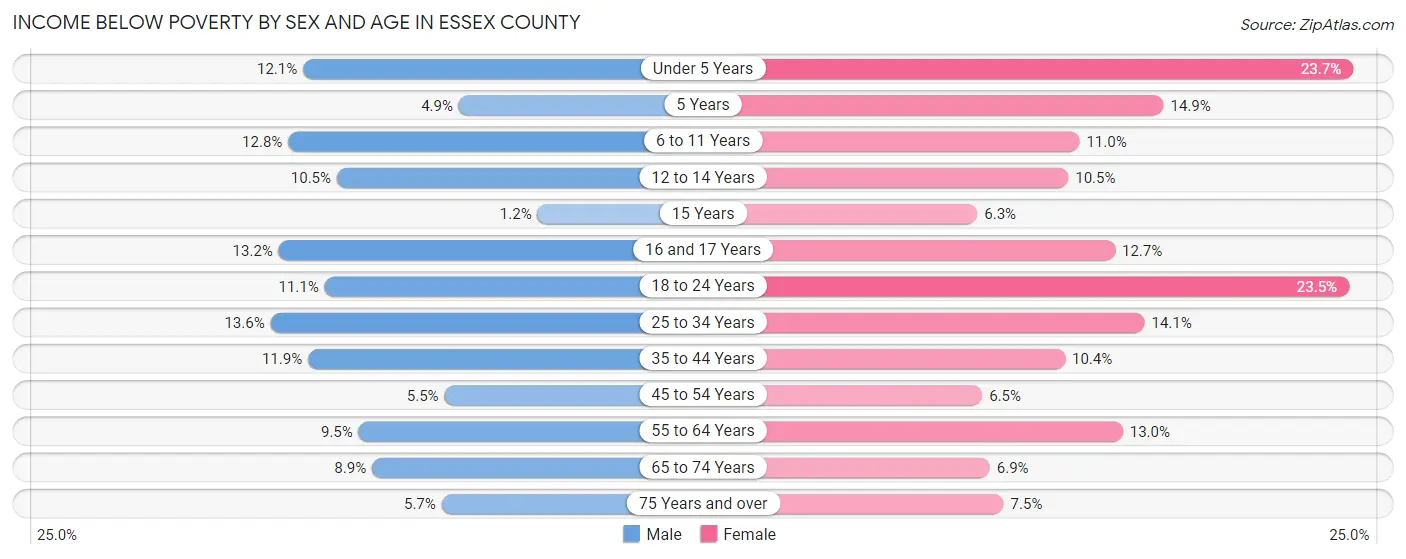
| Age Bracket | Male | Female |
| Under 5 Years | 80 (12.1%) | 171 (23.7%) |
| 5 Years | 5 (4.9%) | 10 (14.9%) |
| 6 to 11 Years | 100 (12.8%) | 101 (11.0%) |
| 12 to 14 Years | 74 (10.5%) | 58 (10.5%) |
| 15 Years | 2 (1.2%) | 10 (6.3%) |
| 16 and 17 Years | 65 (13.2%) | 44 (12.7%) |
| 18 to 24 Years | 129 (11.1%) | 248 (23.5%) |
| 25 to 34 Years | 253 (13.6%) | 261 (14.1%) |
| 35 to 44 Years | 214 (11.8%) | 200 (10.4%) |
| 45 to 54 Years | 128 (5.5%) | 150 (6.5%) |
| 55 to 64 Years | 297 (9.5%) | 404 (13.0%) |
| 65 to 74 Years | 241 (8.9%) | 182 (6.9%) |
| 75 Years and over | 93 (5.7%) | 150 (7.5%) |
| Total | 1,681 (9.6%) | 1,989 (11.3%) |
Income Above Poverty by Sex and Age in Essex County
According to the poverty statistics in Essex County, males aged 15 years and females aged 15 years are the age groups that are most secure financially, with 98.8% of males and 93.7% of females in these age groups living above the poverty line.
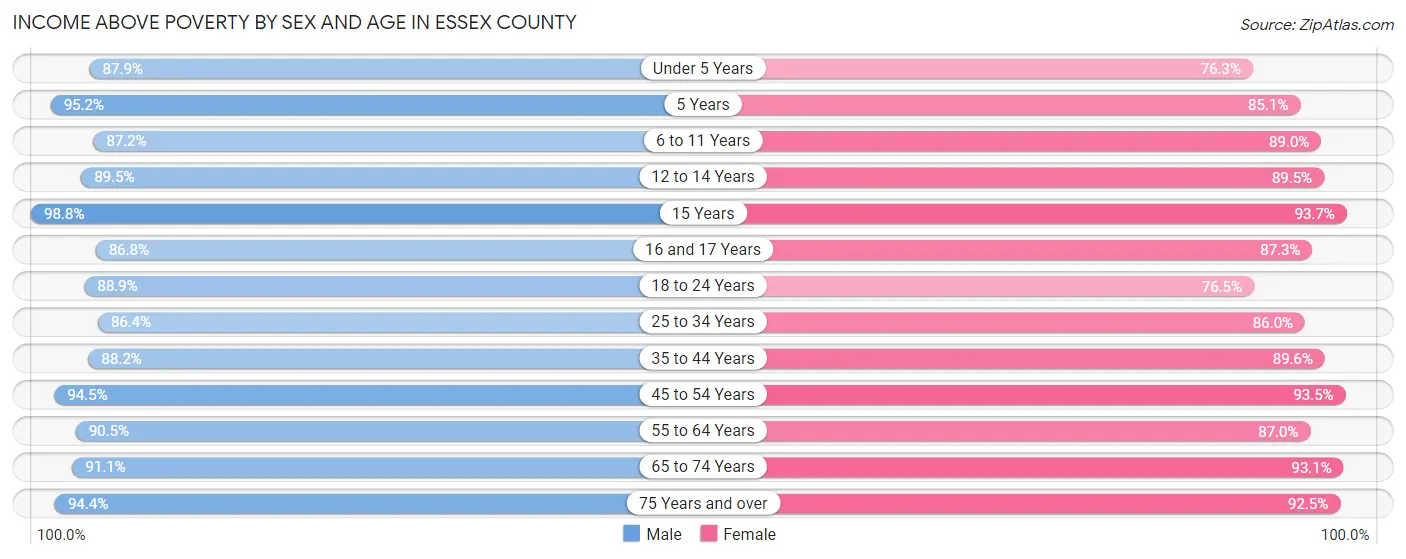
| Age Bracket | Male | Female |
| Under 5 Years | 582 (87.9%) | 550 (76.3%) |
| 5 Years | 98 (95.2%) | 57 (85.1%) |
| 6 to 11 Years | 683 (87.2%) | 815 (89.0%) |
| 12 to 14 Years | 630 (89.5%) | 494 (89.5%) |
| 15 Years | 165 (98.8%) | 149 (93.7%) |
| 16 and 17 Years | 427 (86.8%) | 303 (87.3%) |
| 18 to 24 Years | 1,035 (88.9%) | 806 (76.5%) |
| 25 to 34 Years | 1,608 (86.4%) | 1,597 (86.0%) |
| 35 to 44 Years | 1,592 (88.1%) | 1,731 (89.6%) |
| 45 to 54 Years | 2,189 (94.5%) | 2,152 (93.5%) |
| 55 to 64 Years | 2,830 (90.5%) | 2,695 (87.0%) |
| 65 to 74 Years | 2,473 (91.1%) | 2,468 (93.1%) |
| 75 Years and over | 1,553 (94.4%) | 1,848 (92.5%) |
| Total | 15,865 (90.4%) | 15,665 (88.7%) |
Income Below Poverty Among Married-Couple Families in Essex County
The poverty statistics for married-couple families in Essex County show that 3.7% or 267 of the total 7,118 families live below the poverty line. Families with 5 or more children have the highest poverty rate of 7.9%, comprising of 3 families. On the other hand, families with 3 or 4 children have the lowest poverty rate of 0.9%, which includes 3 families.
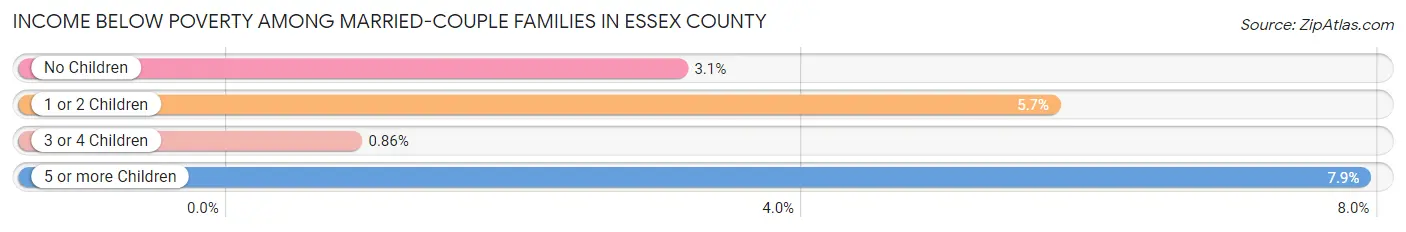
| Children | Above Poverty | Below Poverty |
| No Children | 4,646 (96.9%) | 150 (3.1%) |
| 1 or 2 Children | 1,825 (94.3%) | 111 (5.7%) |
| 3 or 4 Children | 345 (99.1%) | 3 (0.9%) |
| 5 or more Children | 35 (92.1%) | 3 (7.9%) |
| Total | 6,851 (96.3%) | 267 (3.7%) |
Income Below Poverty Among Single-Parent Households in Essex County
According to the poverty data in Essex County, 23.4% or 207 single-father households and 12.8% or 196 single-mother households are living below the poverty line. Among single-father households, those with 1 or 2 children have the highest poverty rate, with 207 households (33.8%) experiencing poverty. Likewise, among single-mother households, those with 3 or 4 children have the highest poverty rate, with 33 households (40.7%) falling below the poverty line.
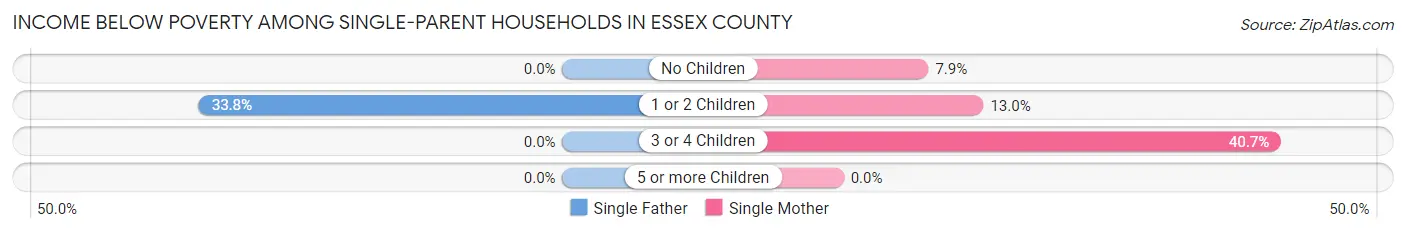
| Children | Single Father | Single Mother |
| No Children | 0 (0.0%) | 41 (7.9%) |
| 1 or 2 Children | 207 (33.8%) | 122 (13.0%) |
| 3 or 4 Children | 0 (0.0%) | 33 (40.7%) |
| 5 or more Children | 0 (0.0%) | 0 (0.0%) |
| Total | 207 (23.4%) | 196 (12.8%) |
Income Below Poverty Among Married-Couple vs Single-Parent Households in Essex County
The poverty data for Essex County shows that 267 of the married-couple family households (3.7%) and 403 of the single-parent households (16.7%) are living below the poverty level. Within the married-couple family households, those with 5 or more children have the highest poverty rate, with 3 households (7.9%) falling below the poverty line. Among the single-parent households, those with 3 or 4 children have the highest poverty rate, with 33 household (29.7%) living below poverty.
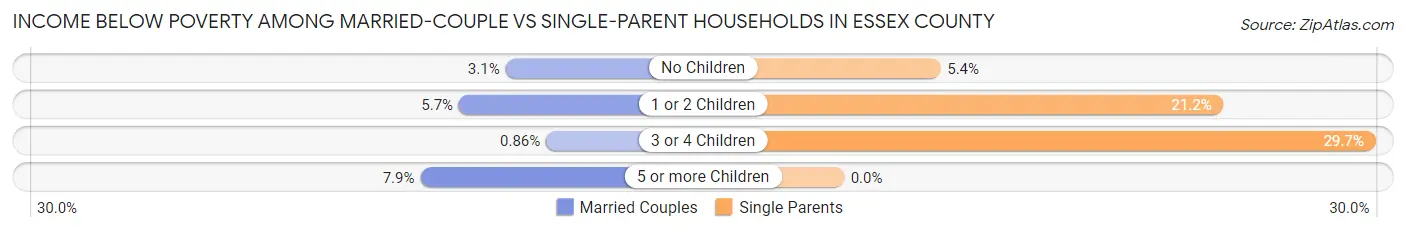
| Children | Married-Couple Families | Single-Parent Households |
| No Children | 150 (3.1%) | 41 (5.4%) |
| 1 or 2 Children | 111 (5.7%) | 329 (21.2%) |
| 3 or 4 Children | 3 (0.9%) | 33 (29.7%) |
| 5 or more Children | 3 (7.9%) | 0 (0.0%) |
| Total | 267 (3.7%) | 403 (16.7%) |
Race in Essex County
The most populous races in Essex County are White / Caucasian (34,753 | 93.1%), Hispanic or Latino (1,066 | 2.9%), and Black / African American (977 | 2.6%).
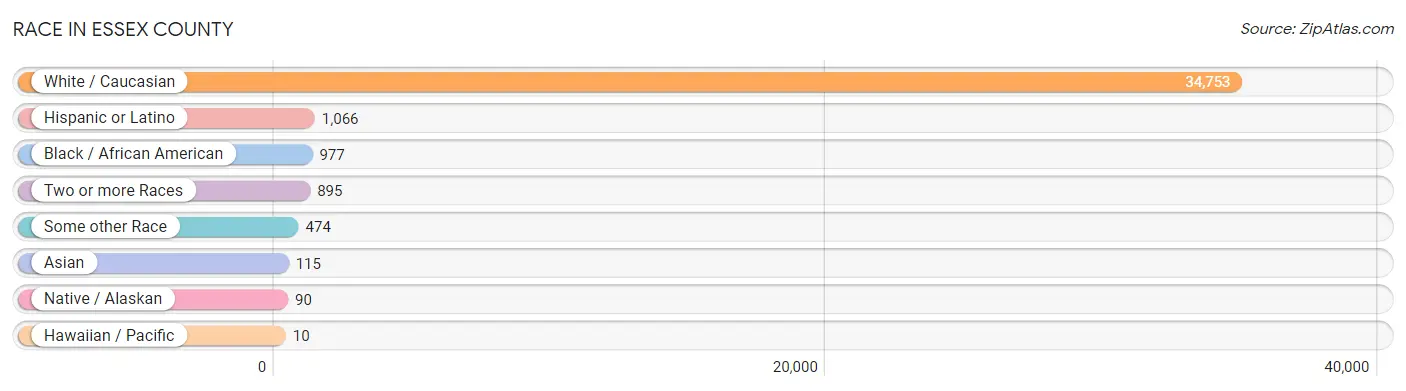
| Race | # Population | % Population |
| Asian | 115 | 0.3% |
| Black / African American | 977 | 2.6% |
| Hawaiian / Pacific | 10 | 0.0% |
| Hispanic or Latino | 1,066 | 2.9% |
| Native / Alaskan | 90 | 0.2% |
| White / Caucasian | 34,753 | 93.1% |
| Two or more Races | 895 | 2.4% |
| Some other Race | 474 | 1.3% |
| Total | 37,314 | 100.0% |
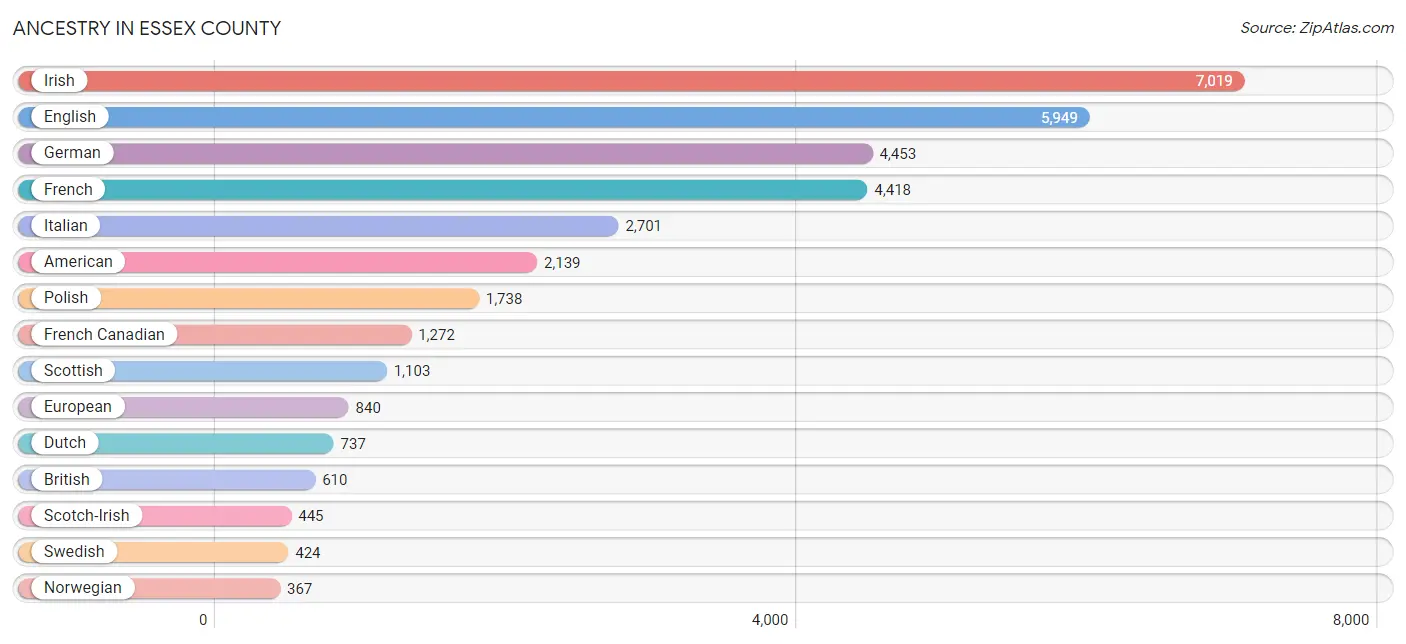
Ancestry in Essex County
The most populous ancestries reported in Essex County are Irish (7,019 | 18.8%), English (5,949 | 15.9%), German (4,453 | 11.9%), French (4,418 | 11.8%), and Italian (2,701 | 7.2%), together accounting for 65.8% of all Essex County residents.
| Ancestry | # Population | % Population |
| Afghan | 1 | 0.0% |
| African | 17 | 0.1% |
| Albanian | 12 | 0.0% |
| Alsatian | 4 | 0.0% |
| American | 2,139 | 5.7% |
| Arab | 20 | 0.1% |
| Armenian | 25 | 0.1% |
| Australian | 10 | 0.0% |
| Austrian | 147 | 0.4% |
| Belgian | 50 | 0.1% |
| Bhutanese | 24 | 0.1% |
| Blackfeet | 9 | 0.0% |
| Brazilian | 27 | 0.1% |
| British | 610 | 1.6% |
| Bulgarian | 7 | 0.0% |
| Burmese | 8 | 0.0% |
| Cajun | 7 | 0.0% |
| Canadian | 183 | 0.5% |
| Celtic | 10 | 0.0% |
| Central American | 61 | 0.2% |
| Cherokee | 68 | 0.2% |
| Chilean | 34 | 0.1% |
| Chippewa | 3 | 0.0% |
| Colombian | 6 | 0.0% |
| Cuban | 32 | 0.1% |
| Cypriot | 17 | 0.1% |
| Czech | 89 | 0.2% |
| Czechoslovakian | 18 | 0.1% |
| Danish | 88 | 0.2% |
| Dominican | 146 | 0.4% |
| Dutch | 737 | 2.0% |
| Eastern European | 158 | 0.4% |
| English | 5,949 | 15.9% |
| Estonian | 2 | 0.0% |
| Ethiopian | 46 | 0.1% |
| European | 840 | 2.2% |
| Finnish | 6 | 0.0% |
| French | 4,418 | 11.8% |
| French American Indian | 25 | 0.1% |
| French Canadian | 1,272 | 3.4% |
| German | 4,453 | 11.9% |
| Greek | 144 | 0.4% |
| Guamanian / Chamorro | 8 | 0.0% |
| Guyanese | 4 | 0.0% |
| Haitian | 16 | 0.0% |
| Honduran | 12 | 0.0% |
| Hungarian | 136 | 0.4% |
| Indian (Asian) | 20 | 0.1% |
| Irish | 7,019 | 18.8% |
| Iroquois | 72 | 0.2% |
| Israeli | 3 | 0.0% |
| Italian | 2,701 | 7.2% |
| Jamaican | 49 | 0.1% |
| Kenyan | 1 | 0.0% |
| Korean | 50 | 0.1% |
| Latvian | 23 | 0.1% |
| Lebanese | 9 | 0.0% |
| Lithuanian | 156 | 0.4% |
| Macedonian | 10 | 0.0% |
| Mexican | 105 | 0.3% |
| Northern European | 71 | 0.2% |
| Norwegian | 367 | 1.0% |
| Pakistani | 9 | 0.0% |
| Palestinian | 1 | 0.0% |
| Panamanian | 12 | 0.0% |
| Pennsylvania German | 62 | 0.2% |
| Peruvian | 17 | 0.1% |
| Polish | 1,738 | 4.7% |
| Portuguese | 34 | 0.1% |
| Puerto Rican | 259 | 0.7% |
| Romanian | 76 | 0.2% |
| Russian | 147 | 0.4% |
| Salvadoran | 37 | 0.1% |
| Scandinavian | 213 | 0.6% |
| Scotch-Irish | 445 | 1.2% |
| Scottish | 1,103 | 3.0% |
| Serbian | 118 | 0.3% |
| Sioux | 1 | 0.0% |
| Slavic | 5 | 0.0% |
| Slovak | 24 | 0.1% |
| Slovene | 8 | 0.0% |
| South African | 1 | 0.0% |
| South American | 65 | 0.2% |
| Spaniard | 11 | 0.0% |
| Spanish | 56 | 0.2% |
| Sri Lankan | 20 | 0.1% |
| Subsaharan African | 122 | 0.3% |
| Swedish | 424 | 1.1% |
| Swiss | 138 | 0.4% |
| Thai | 29 | 0.1% |
| Turkish | 29 | 0.1% |
| Ukrainian | 169 | 0.4% |
| Venezuelan | 8 | 0.0% |
| Welsh | 366 | 1.0% |
| West Indian | 8 | 0.0% |
| Yugoslavian | 214 | 0.6% | View All 96 Rows |
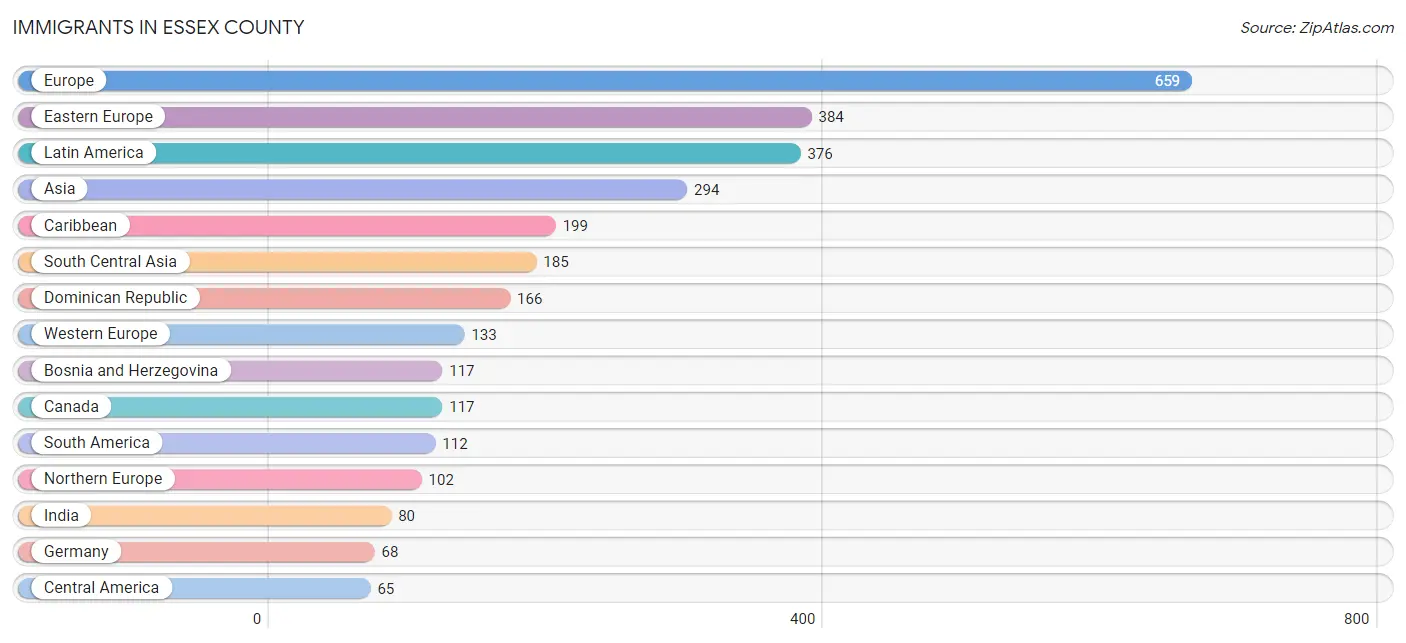
Immigrants in Essex County
The most numerous immigrant groups reported in Essex County came from Europe (659 | 1.8%), Eastern Europe (384 | 1.0%), Latin America (376 | 1.0%), Asia (294 | 0.8%), and Caribbean (199 | 0.5%), together accounting for 5.1% of all Essex County residents.
| Immigration Origin | # Population | % Population |
| Afghanistan | 1 | 0.0% |
| Africa | 45 | 0.1% |
| Albania | 22 | 0.1% |
| Asia | 294 | 0.8% |
| Australia | 26 | 0.1% |
| Bangladesh | 28 | 0.1% |
| Bosnia and Herzegovina | 117 | 0.3% |
| Brazil | 60 | 0.2% |
| Bulgaria | 7 | 0.0% |
| Canada | 117 | 0.3% |
| Caribbean | 199 | 0.5% |
| Central America | 65 | 0.2% |
| Chile | 6 | 0.0% |
| China | 8 | 0.0% |
| Colombia | 3 | 0.0% |
| Cuba | 21 | 0.1% |
| Czechoslovakia | 3 | 0.0% |
| Dominican Republic | 166 | 0.4% |
| Eastern Africa | 21 | 0.1% |
| Eastern Asia | 13 | 0.0% |
| Eastern Europe | 384 | 1.0% |
| Ecuador | 14 | 0.0% |
| El Salvador | 4 | 0.0% |
| England | 53 | 0.1% |
| Ethiopia | 17 | 0.1% |
| Europe | 659 | 1.8% |
| France | 26 | 0.1% |
| Germany | 68 | 0.2% |
| Greece | 5 | 0.0% |
| Guyana | 4 | 0.0% |
| Haiti | 9 | 0.0% |
| Honduras | 12 | 0.0% |
| India | 80 | 0.2% |
| Iran | 9 | 0.0% |
| Ireland | 6 | 0.0% |
| Israel | 3 | 0.0% |
| Italy | 29 | 0.1% |
| Jamaica | 3 | 0.0% |
| Japan | 3 | 0.0% |
| Kazakhstan | 49 | 0.1% |
| Kenya | 1 | 0.0% |
| Korea | 2 | 0.0% |
| Kuwait | 2 | 0.0% |
| Latin America | 376 | 1.0% |
| Mexico | 42 | 0.1% |
| Moldova | 64 | 0.2% |
| Netherlands | 34 | 0.1% |
| Northern Europe | 102 | 0.3% |
| Norway | 2 | 0.0% |
| Oceania | 26 | 0.1% |
| Pakistan | 17 | 0.1% |
| Panama | 7 | 0.0% |
| Peru | 17 | 0.1% |
| Philippines | 37 | 0.1% |
| Poland | 10 | 0.0% |
| Russia | 9 | 0.0% |
| Scotland | 2 | 0.0% |
| Serbia | 47 | 0.1% |
| South Africa | 24 | 0.1% |
| South America | 112 | 0.3% |
| South Central Asia | 185 | 0.5% |
| South Eastern Asia | 54 | 0.1% |
| Southern Europe | 40 | 0.1% |
| Spain | 1 | 0.0% |
| Sweden | 6 | 0.0% |
| Switzerland | 5 | 0.0% |
| Thailand | 9 | 0.0% |
| Turkey | 20 | 0.1% |
| Ukraine | 47 | 0.1% |
| Uzbekistan | 1 | 0.0% |
| Venezuela | 8 | 0.0% |
| Vietnam | 8 | 0.0% |
| Western Asia | 42 | 0.1% |
| Western Europe | 133 | 0.4% | View All 74 Rows |
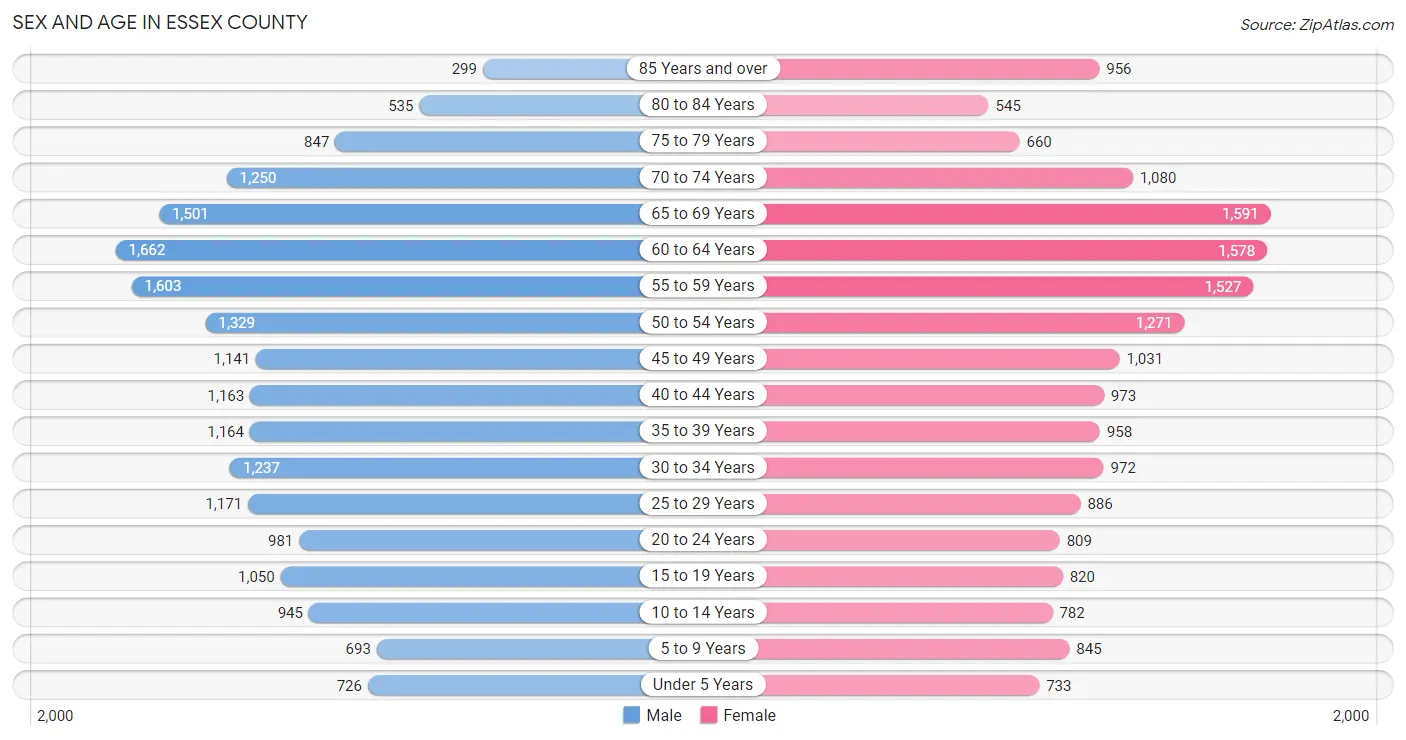
Sex and Age in Essex County
Sex and Age in Essex County
The most populous age groups in Essex County are 60 to 64 Years (1,662 | 8.6%) for men and 65 to 69 Years (1,591 | 8.8%) for women.
| Age Bracket | Male | Female |
| Under 5 Years | 726 (3.8%) | 733 (4.1%) |
| 5 to 9 Years | 693 (3.6%) | 845 (4.7%) |
| 10 to 14 Years | 945 (4.9%) | 782 (4.3%) |
| 15 to 19 Years | 1,050 (5.4%) | 820 (4.5%) |
| 20 to 24 Years | 981 (5.1%) | 809 (4.5%) |
| 25 to 29 Years | 1,171 (6.1%) | 886 (4.9%) |
| 30 to 34 Years | 1,237 (6.4%) | 972 (5.4%) |
| 35 to 39 Years | 1,164 (6.0%) | 958 (5.3%) |
| 40 to 44 Years | 1,163 (6.0%) | 973 (5.4%) |
| 45 to 49 Years | 1,141 (5.9%) | 1,031 (5.7%) |
| 50 to 54 Years | 1,329 (6.9%) | 1,271 (7.0%) |
| 55 to 59 Years | 1,603 (8.3%) | 1,527 (8.5%) |
| 60 to 64 Years | 1,662 (8.6%) | 1,578 (8.8%) |
| 65 to 69 Years | 1,501 (7.8%) | 1,591 (8.8%) |
| 70 to 74 Years | 1,250 (6.5%) | 1,080 (6.0%) |
| 75 to 79 Years | 847 (4.4%) | 660 (3.7%) |
| 80 to 84 Years | 535 (2.8%) | 545 (3.0%) |
| 85 Years and over | 299 (1.5%) | 956 (5.3%) |
| Total | 19,297 (100.0%) | 18,017 (100.0%) |
Families and Households in Essex County
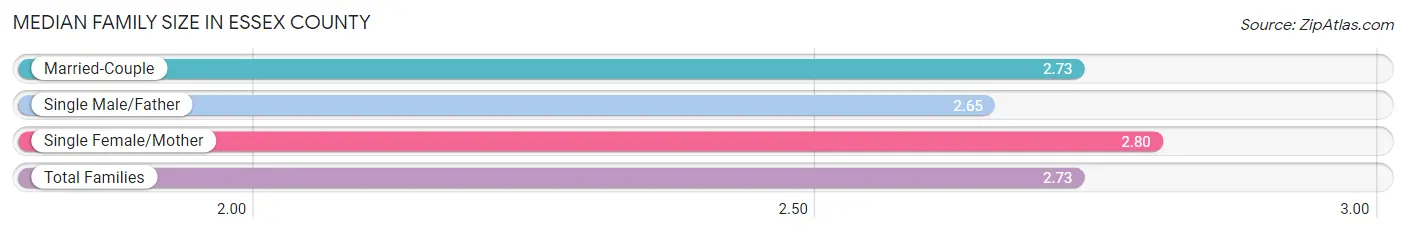
Median Family Size in Essex County
The median family size in Essex County is 2.73 persons per family, with single female/mother families (1,537 | 16.1%) accounting for the largest median family size of 2.8 persons per family. On the other hand, single male/father families (883 | 9.3%) represent the smallest median family size with 2.65 persons per family.
| Family Type | # Families | Family Size |
| Married-Couple | 7,118 (74.6%) | 2.73 |
| Single Male/Father | 883 (9.3%) | 2.65 |
| Single Female/Mother | 1,537 (16.1%) | 2.80 |
| Total Families | 9,538 (100.0%) | 2.73 |
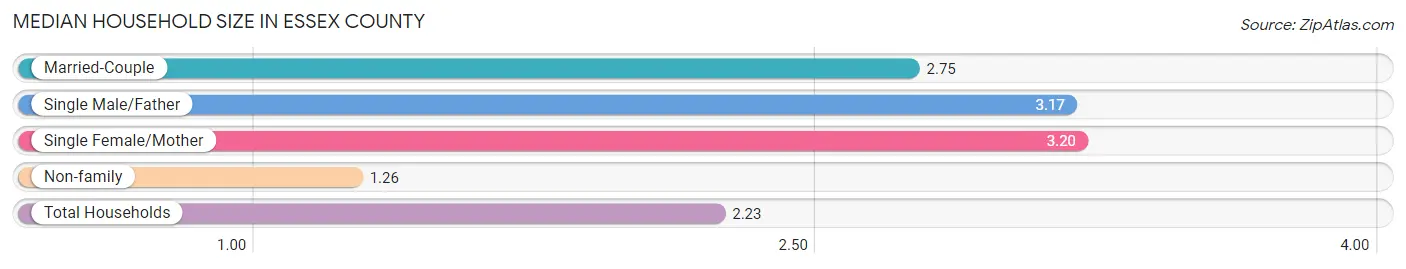
Median Household Size in Essex County
The median household size in Essex County is 2.23 persons per household, with single female/mother households (1,537 | 9.8%) accounting for the largest median household size of 3.2 persons per household. non-family households (6,212 | 39.4%) represent the smallest median household size with 1.26 persons per household.
| Household Type | # Households | Household Size |
| Married-Couple | 7,118 (45.2%) | 2.75 |
| Single Male/Father | 883 (5.6%) | 3.17 |
| Single Female/Mother | 1,537 (9.8%) | 3.20 |
| Non-family | 6,212 (39.4%) | 1.26 |
| Total Households | 15,750 (100.0%) | 2.23 |
Household Size by Marriage Status in Essex County
Out of a total of 15,750 households in Essex County, 9,538 (60.6%) are family households, while 6,212 (39.4%) are nonfamily households. The most numerous type of family households are 2-person households, comprising 5,037, and the most common type of nonfamily households are 1-person households, comprising 5,069.
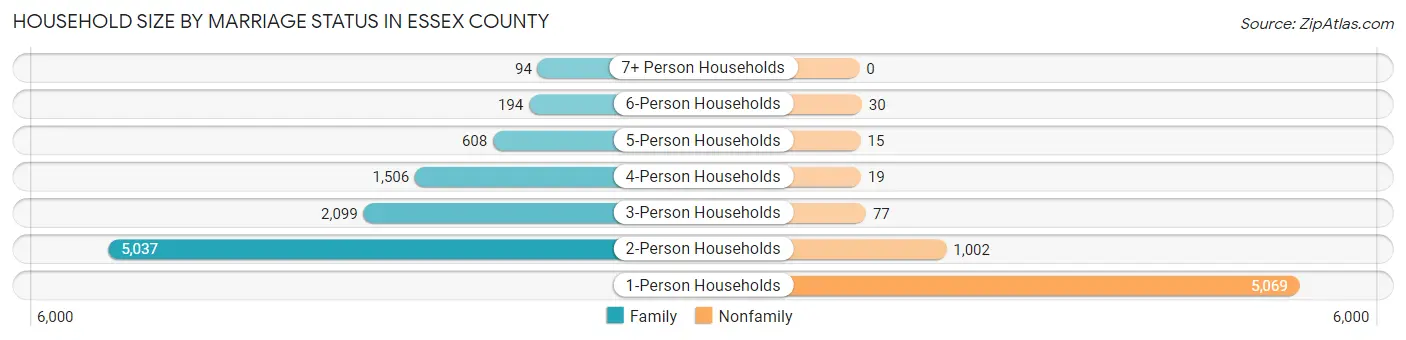
| Household Size | Family Households | Nonfamily Households |
| 1-Person Households | - | 5,069 (32.2%) |
| 2-Person Households | 5,037 (32.0%) | 1,002 (6.4%) |
| 3-Person Households | 2,099 (13.3%) | 77 (0.5%) |
| 4-Person Households | 1,506 (9.6%) | 19 (0.1%) |
| 5-Person Households | 608 (3.9%) | 15 (0.1%) |
| 6-Person Households | 194 (1.2%) | 30 (0.2%) |
| 7+ Person Households | 94 (0.6%) | 0 (0.0%) |
| Total | 9,538 (60.6%) | 6,212 (39.4%) |
Female Fertility in Essex County
Fertility by Age in Essex County
Average fertility rate in Essex County is 62.0 births per 1,000 women. Women in the age bracket of 20 to 34 years have the highest fertility rate with 81.0 births per 1,000 women. Women in the age bracket of 20 to 34 years acount for 52.6% of all women with births.
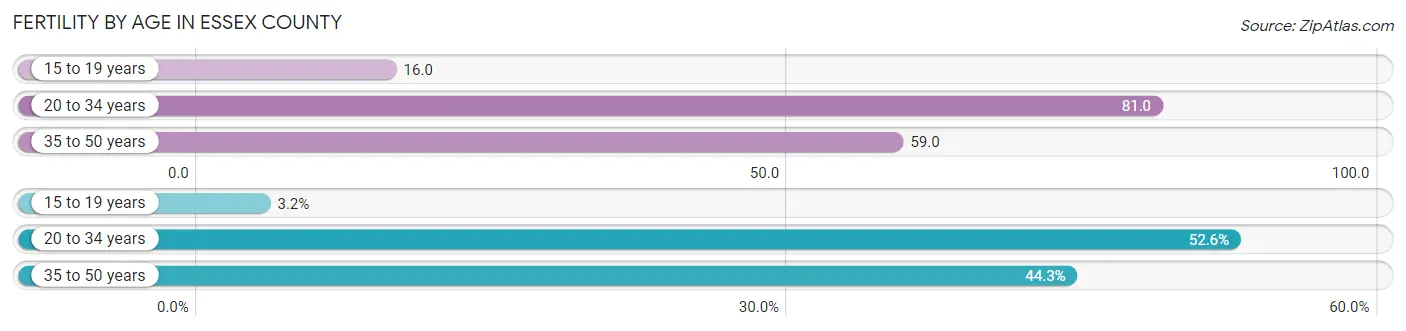
| Age Bracket | Women with Births | Births / 1,000 Women |
| 15 to 19 years | 13 (3.2%) | 16.0 |
| 20 to 34 years | 215 (52.6%) | 81.0 |
| 35 to 50 years | 181 (44.3%) | 59.0 |
| Total | 409 (100.0%) | 62.0 |
Fertility by Age by Marriage Status in Essex County
75.6% of women with births (409) in Essex County are married. The highest percentage of unmarried women with births falls into 15 to 19 years age bracket with 100.0% of them unmarried at the time of birth, while the lowest percentage of unmarried women with births belong to 35 to 50 years age bracket with 5.0% of them unmarried.
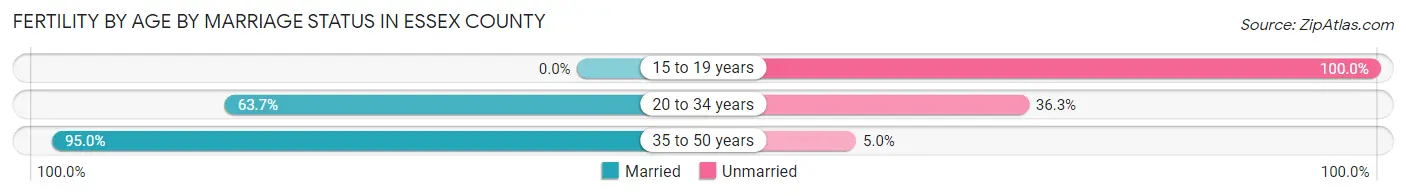
| Age Bracket | Married | Unmarried |
| 15 to 19 years | 0 (0.0%) | 13 (100.0%) |
| 20 to 34 years | 137 (63.7%) | 78 (36.3%) |
| 35 to 50 years | 172 (95.0%) | 9 (5.0%) |
| Total | 309 (75.5%) | 100 (24.4%) |
Fertility by Education in Essex County
Average fertility rate in Essex County is 62.0 births per 1,000 women. Women with the education attainment of college or associate's degree have the highest fertility rate of 112.0 births per 1,000 women, while women with the education attainment of graduate degree have the lowest fertility at 5.0 births per 1,000 women. Women with the education attainment of college or associate's degree represent 60.2% of all women with births.
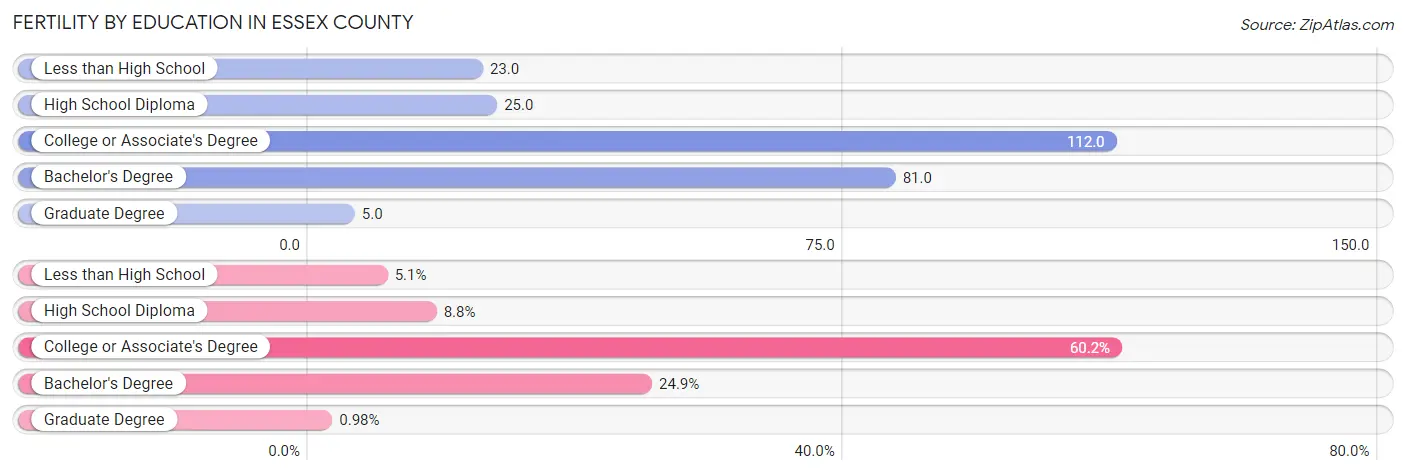
| Educational Attainment | Women with Births | Births / 1,000 Women |
| Less than High School | 21 (5.1%) | 23.0 |
| High School Diploma | 36 (8.8%) | 25.0 |
| College or Associate's Degree | 246 (60.2%) | 112.0 |
| Bachelor's Degree | 102 (24.9%) | 81.0 |
| Graduate Degree | 4 (1.0%) | 5.0 |
| Total | 409 (100.0%) | 62.0 |
Fertility by Education by Marriage Status in Essex County
24.4% of women with births in Essex County are unmarried. Women with the educational attainment of graduate degree are most likely to be married with 100.0% of them married at childbirth, while women with the educational attainment of less than high school are least likely to be married with 100.0% of them unmarried at childbirth.
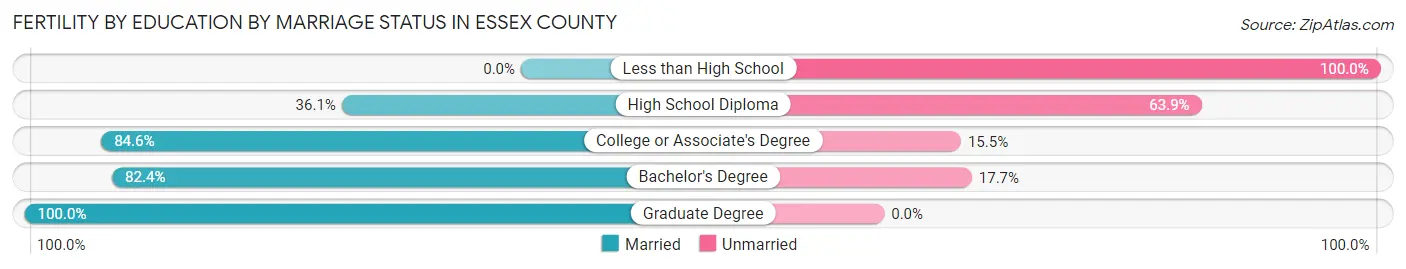
| Educational Attainment | Married | Unmarried |
| Less than High School | 0 (0.0%) | 21 (100.0%) |
| High School Diploma | 13 (36.1%) | 23 (63.9%) |
| College or Associate's Degree | 208 (84.6%) | 38 (15.4%) |
| Bachelor's Degree | 84 (82.4%) | 18 (17.6%) |
| Graduate Degree | 4 (100.0%) | 0 (0.0%) |
| Total | 309 (75.5%) | 100 (24.4%) |
Employment Characteristics in Essex County
Employment by Class of Employer in Essex County
Among the 16,875 employed individuals in Essex County, private company employees (8,316 | 49.3%), not-for-profit organizations (2,988 | 17.7%), and self-employed (not incorporated) (1,558 | 9.2%) make up the most common classes of employment.
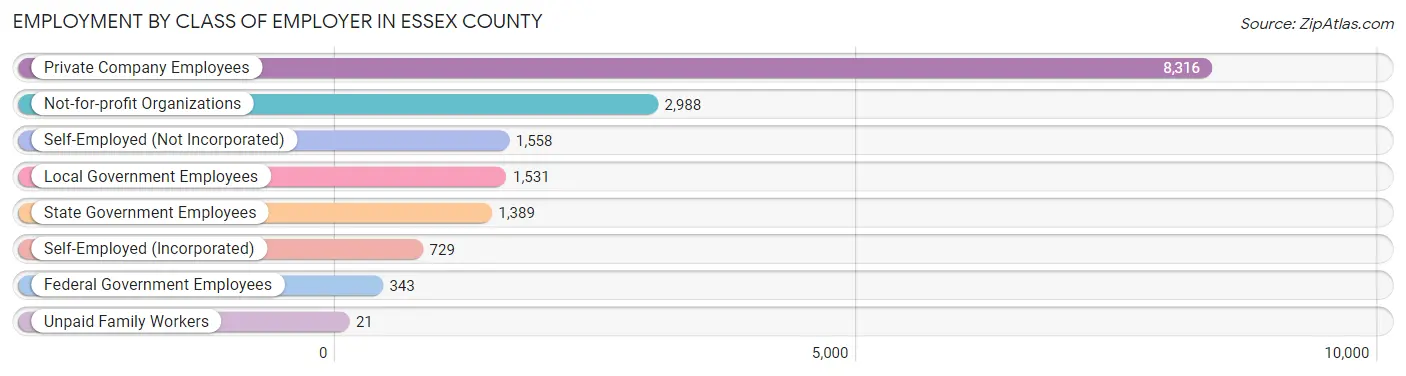
| Employer Class | # Employees | % Employees |
| Private Company Employees | 8,316 | 49.3% |
| Self-Employed (Incorporated) | 729 | 4.3% |
| Self-Employed (Not Incorporated) | 1,558 | 9.2% |
| Not-for-profit Organizations | 2,988 | 17.7% |
| Local Government Employees | 1,531 | 9.1% |
| State Government Employees | 1,389 | 8.2% |
| Federal Government Employees | 343 | 2.0% |
| Unpaid Family Workers | 21 | 0.1% |
| Total | 16,875 | 100.0% |
Employment Status by Age in Essex County
According to the labor force statistics for Essex County, out of the total population over 16 years of age (32,264), 56.5% or 18,229 individuals are in the labor force, with 5.1% or 930 of them unemployed. The age group with the highest labor force participation rate is 45 to 54 years, with 87.3% or 4,166 individuals in the labor force. Within the labor force, the 16 to 19 years age range has the highest percentage of unemployed individuals, with 19.6% or 125 of them being unemployed.
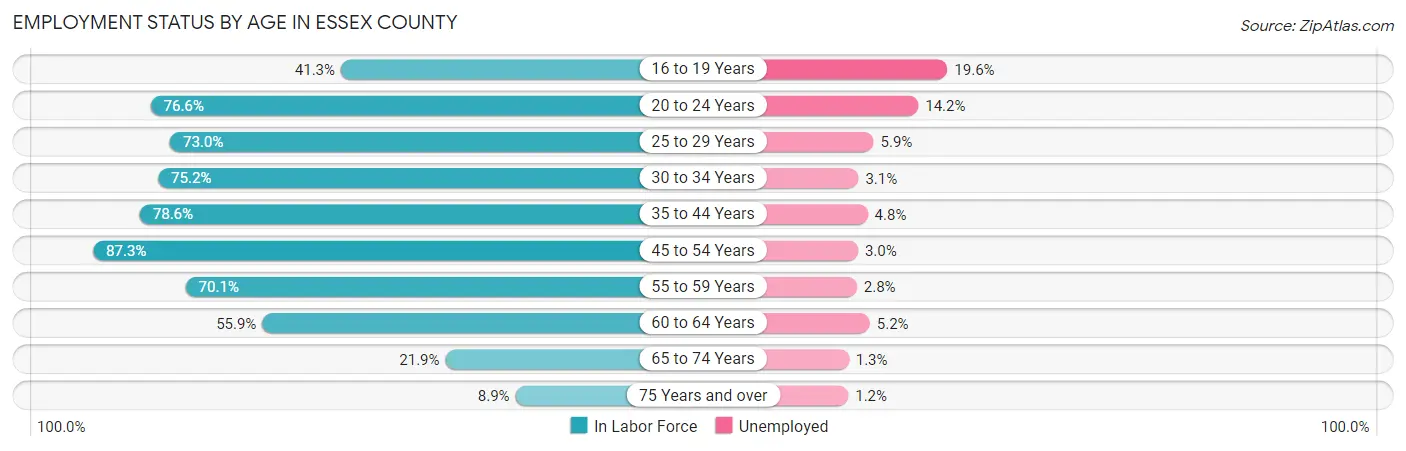
| Age Bracket | In Labor Force | Unemployed |
| 16 to 19 Years | 638 (41.3%) | 125 (19.6%) |
| 20 to 24 Years | 1,371 (76.6%) | 195 (14.2%) |
| 25 to 29 Years | 1,502 (73.0%) | 89 (5.9%) |
| 30 to 34 Years | 1,661 (75.2%) | 51 (3.1%) |
| 35 to 44 Years | 3,347 (78.6%) | 161 (4.8%) |
| 45 to 54 Years | 4,166 (87.3%) | 125 (3.0%) |
| 55 to 59 Years | 2,194 (70.1%) | 61 (2.8%) |
| 60 to 64 Years | 1,811 (55.9%) | 94 (5.2%) |
| 65 to 74 Years | 1,187 (21.9%) | 15 (1.3%) |
| 75 Years and over | 342 (8.9%) | 4 (1.2%) |
| Total | 18,229 (56.5%) | 930 (5.1%) |
Employment Status by Educational Attainment in Essex County
According to labor force statistics for Essex County, 74.7% of individuals (14,691) out of the total population between 25 and 64 years of age (19,666) are in the labor force, with 4.0% or 588 of them being unemployed. The group with the highest labor force participation rate are those with the educational attainment of bachelor's degree or higher, with 83.6% or 4,997 individuals in the labor force. Within the labor force, individuals with less than high school education have the highest percentage of unemployment, with 13.9% or 75 of them being unemployed.
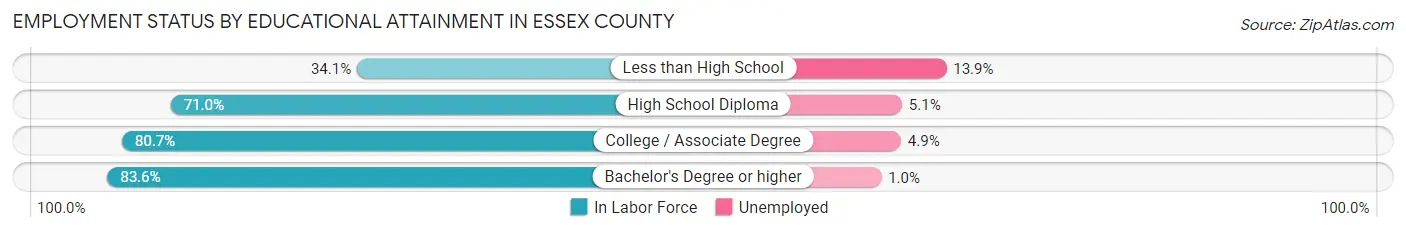
| Educational Attainment | In Labor Force | Unemployed |
| Less than High School | 538 (34.1%) | 219 (13.9%) |
| High School Diploma | 4,545 (71.0%) | 326 (5.1%) |
| College / Associate Degree | 4,607 (80.7%) | 280 (4.9%) |
| Bachelor's Degree or higher | 4,997 (83.6%) | 60 (1.0%) |
| Total | 14,691 (74.7%) | 787 (4.0%) |
Employment Occupations by Sex in Essex County
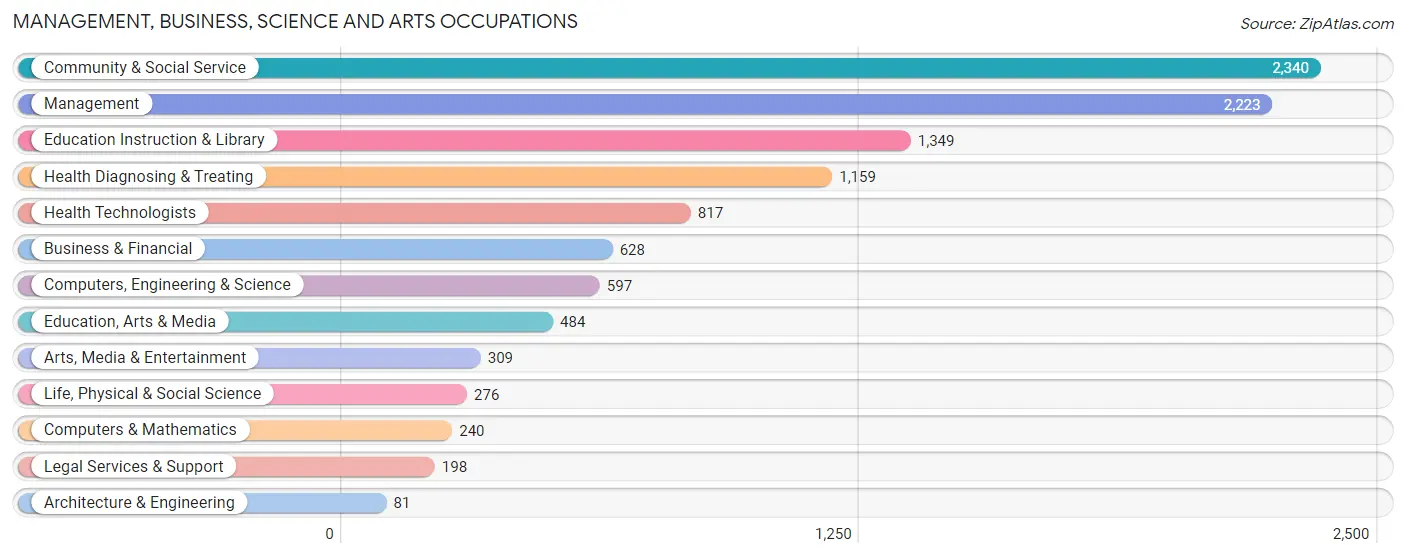
Management, Business, Science and Arts Occupations
The most common Management, Business, Science and Arts occupations in Essex County are Community & Social Service (2,340 | 13.5%), Management (2,223 | 12.9%), Education Instruction & Library (1,349 | 7.8%), Health Diagnosing & Treating (1,159 | 6.7%), and Health Technologists (817 | 4.7%).
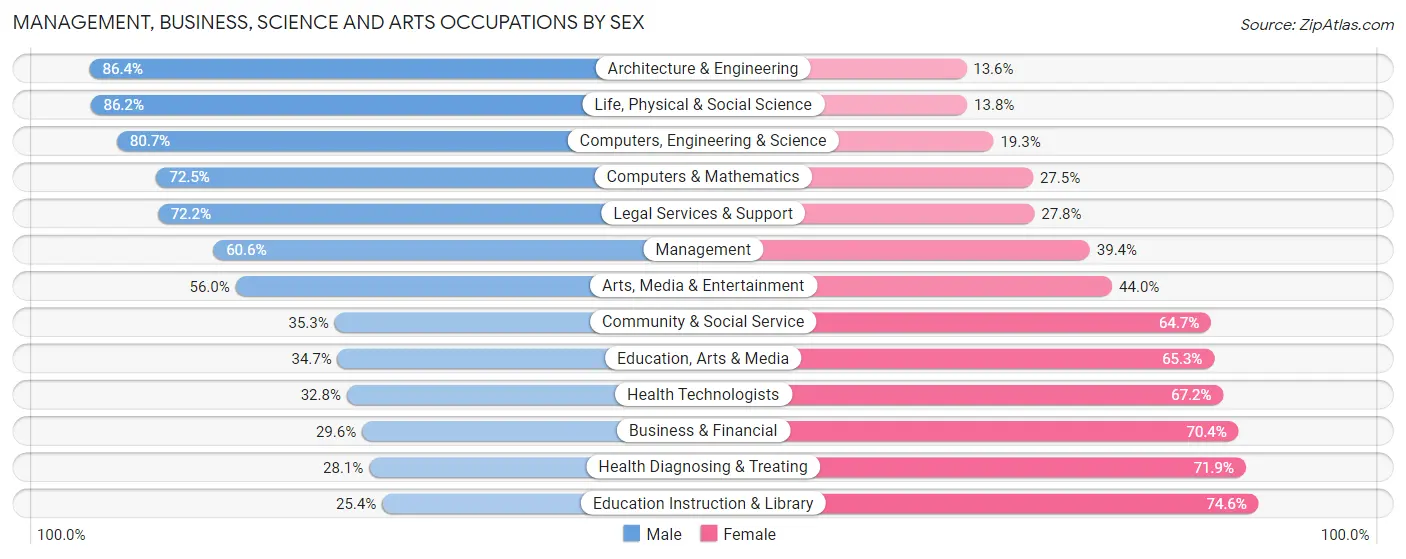
Management, Business, Science and Arts Occupations by Sex
Within the Management, Business, Science and Arts occupations in Essex County, the most male-oriented occupations are Architecture & Engineering (86.4%), Life, Physical & Social Science (86.2%), and Computers, Engineering & Science (80.7%), while the most female-oriented occupations are Education Instruction & Library (74.6%), Health Diagnosing & Treating (71.9%), and Business & Financial (70.4%).
| Occupation | Male | Female |
| Management | 1,348 (60.6%) | 875 (39.4%) |
| Business & Financial | 186 (29.6%) | 442 (70.4%) |
| Computers, Engineering & Science | 482 (80.7%) | 115 (19.3%) |
| Computers & Mathematics | 174 (72.5%) | 66 (27.5%) |
| Architecture & Engineering | 70 (86.4%) | 11 (13.6%) |
| Life, Physical & Social Science | 238 (86.2%) | 38 (13.8%) |
| Community & Social Service | 827 (35.3%) | 1,513 (64.7%) |
| Education, Arts & Media | 168 (34.7%) | 316 (65.3%) |
| Legal Services & Support | 143 (72.2%) | 55 (27.8%) |
| Education Instruction & Library | 343 (25.4%) | 1,006 (74.6%) |
| Arts, Media & Entertainment | 173 (56.0%) | 136 (44.0%) |
| Health Diagnosing & Treating | 326 (28.1%) | 833 (71.9%) |
| Health Technologists | 268 (32.8%) | 549 (67.2%) |
| Total (Category) | 3,169 (45.6%) | 3,778 (54.4%) |
| Total (Overall) | 9,055 (52.4%) | 8,239 (47.6%) |
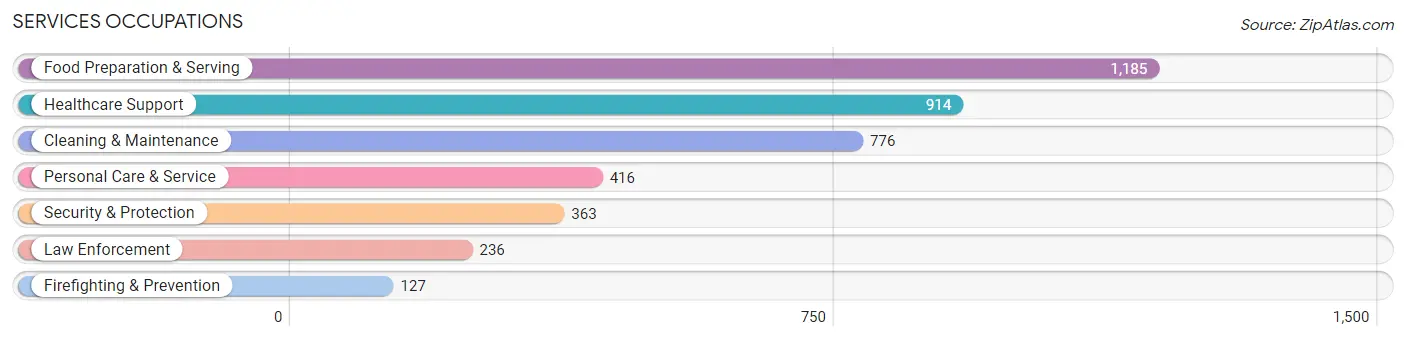
Services Occupations
The most common Services occupations in Essex County are Food Preparation & Serving (1,185 | 6.9%), Healthcare Support (914 | 5.3%), Cleaning & Maintenance (776 | 4.5%), Personal Care & Service (416 | 2.4%), and Security & Protection (363 | 2.1%).
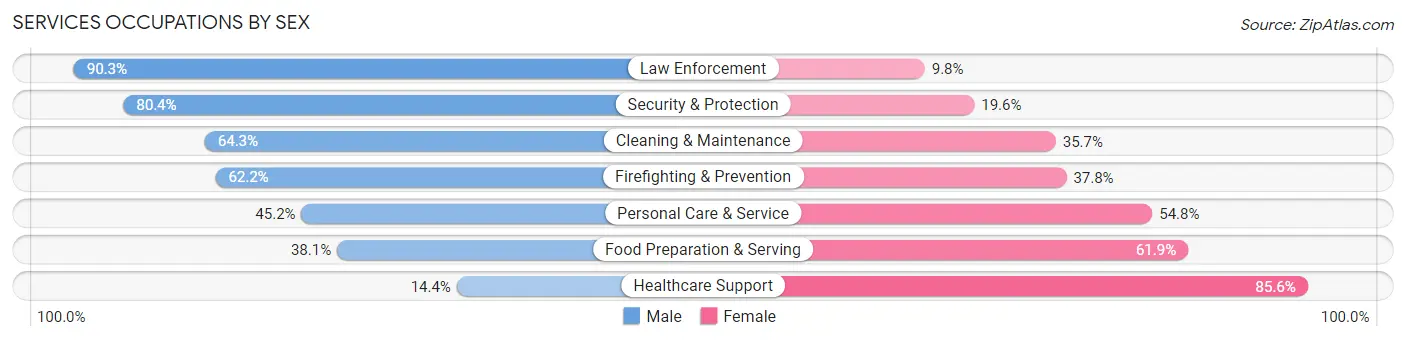
Services Occupations by Sex
Within the Services occupations in Essex County, the most male-oriented occupations are Law Enforcement (90.2%), Security & Protection (80.4%), and Cleaning & Maintenance (64.3%), while the most female-oriented occupations are Healthcare Support (85.6%), Food Preparation & Serving (61.9%), and Personal Care & Service (54.8%).
| Occupation | Male | Female |
| Healthcare Support | 132 (14.4%) | 782 (85.6%) |
| Security & Protection | 292 (80.4%) | 71 (19.6%) |
| Firefighting & Prevention | 79 (62.2%) | 48 (37.8%) |
| Law Enforcement | 213 (90.2%) | 23 (9.8%) |
| Food Preparation & Serving | 452 (38.1%) | 733 (61.9%) |
| Cleaning & Maintenance | 499 (64.3%) | 277 (35.7%) |
| Personal Care & Service | 188 (45.2%) | 228 (54.8%) |
| Total (Category) | 1,563 (42.8%) | 2,091 (57.2%) |
| Total (Overall) | 9,055 (52.4%) | 8,239 (47.6%) |
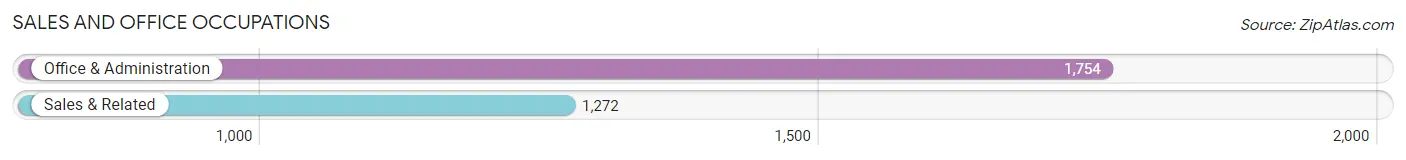
Sales and Office Occupations
The most common Sales and Office occupations in Essex County are Office & Administration (1,754 | 10.1%), and Sales & Related (1,272 | 7.4%).
Sales and Office Occupations by Sex
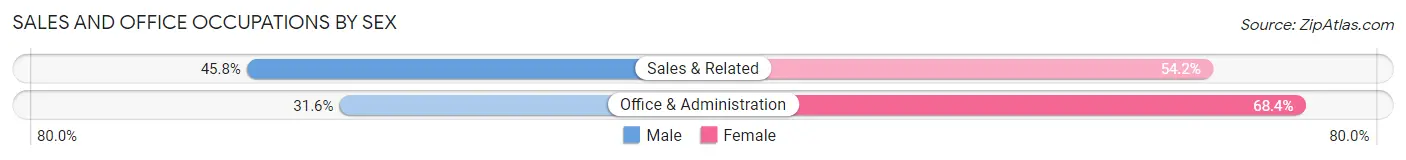
| Occupation | Male | Female |
| Sales & Related | 583 (45.8%) | 689 (54.2%) |
| Office & Administration | 554 (31.6%) | 1,200 (68.4%) |
| Total (Category) | 1,137 (37.6%) | 1,889 (62.4%) |
| Total (Overall) | 9,055 (52.4%) | 8,239 (47.6%) |
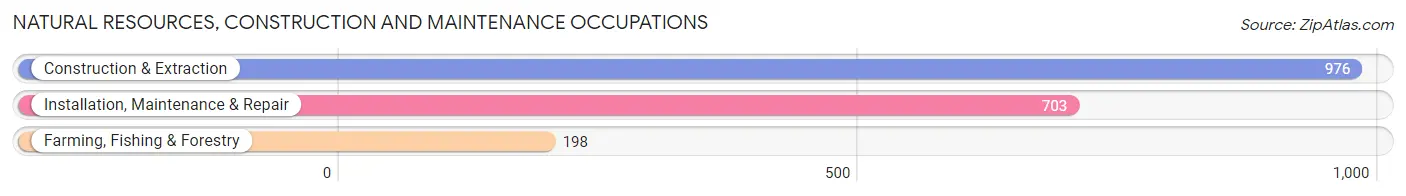
Natural Resources, Construction and Maintenance Occupations
The most common Natural Resources, Construction and Maintenance occupations in Essex County are Construction & Extraction (976 | 5.6%), Installation, Maintenance & Repair (703 | 4.1%), and Farming, Fishing & Forestry (198 | 1.1%).
Natural Resources, Construction and Maintenance Occupations by Sex
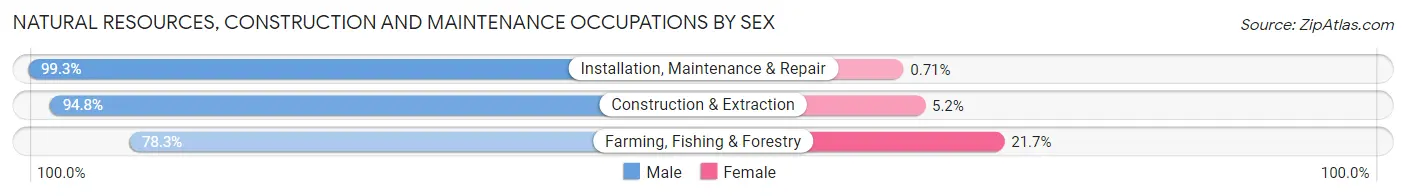
| Occupation | Male | Female |
| Farming, Fishing & Forestry | 155 (78.3%) | 43 (21.7%) |
| Construction & Extraction | 925 (94.8%) | 51 (5.2%) |
| Installation, Maintenance & Repair | 698 (99.3%) | 5 (0.7%) |
| Total (Category) | 1,778 (94.7%) | 99 (5.3%) |
| Total (Overall) | 9,055 (52.4%) | 8,239 (47.6%) |
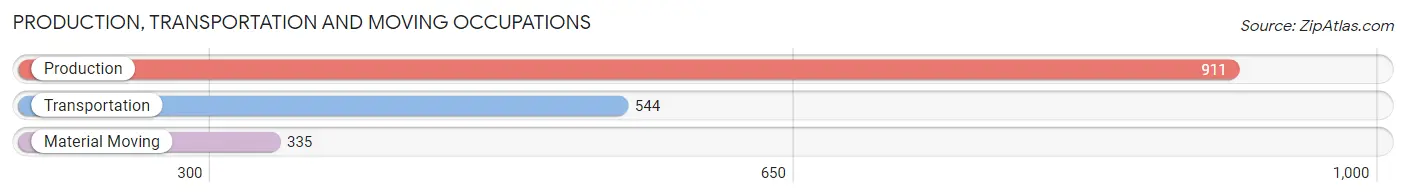
Production, Transportation and Moving Occupations
The most common Production, Transportation and Moving occupations in Essex County are Production (911 | 5.3%), Transportation (544 | 3.2%), and Material Moving (335 | 1.9%).
Production, Transportation and Moving Occupations by Sex
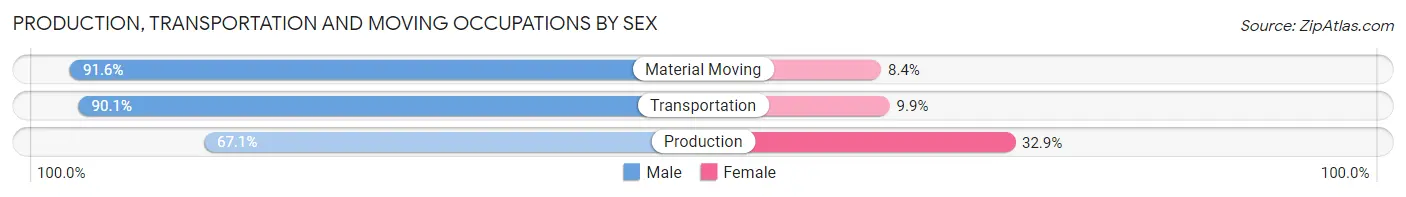
| Occupation | Male | Female |
| Production | 611 (67.1%) | 300 (32.9%) |
| Transportation | 490 (90.1%) | 54 (9.9%) |
| Material Moving | 307 (91.6%) | 28 (8.4%) |
| Total (Category) | 1,408 (78.7%) | 382 (21.3%) |
| Total (Overall) | 9,055 (52.4%) | 8,239 (47.6%) |
Employment Industries by Sex in Essex County
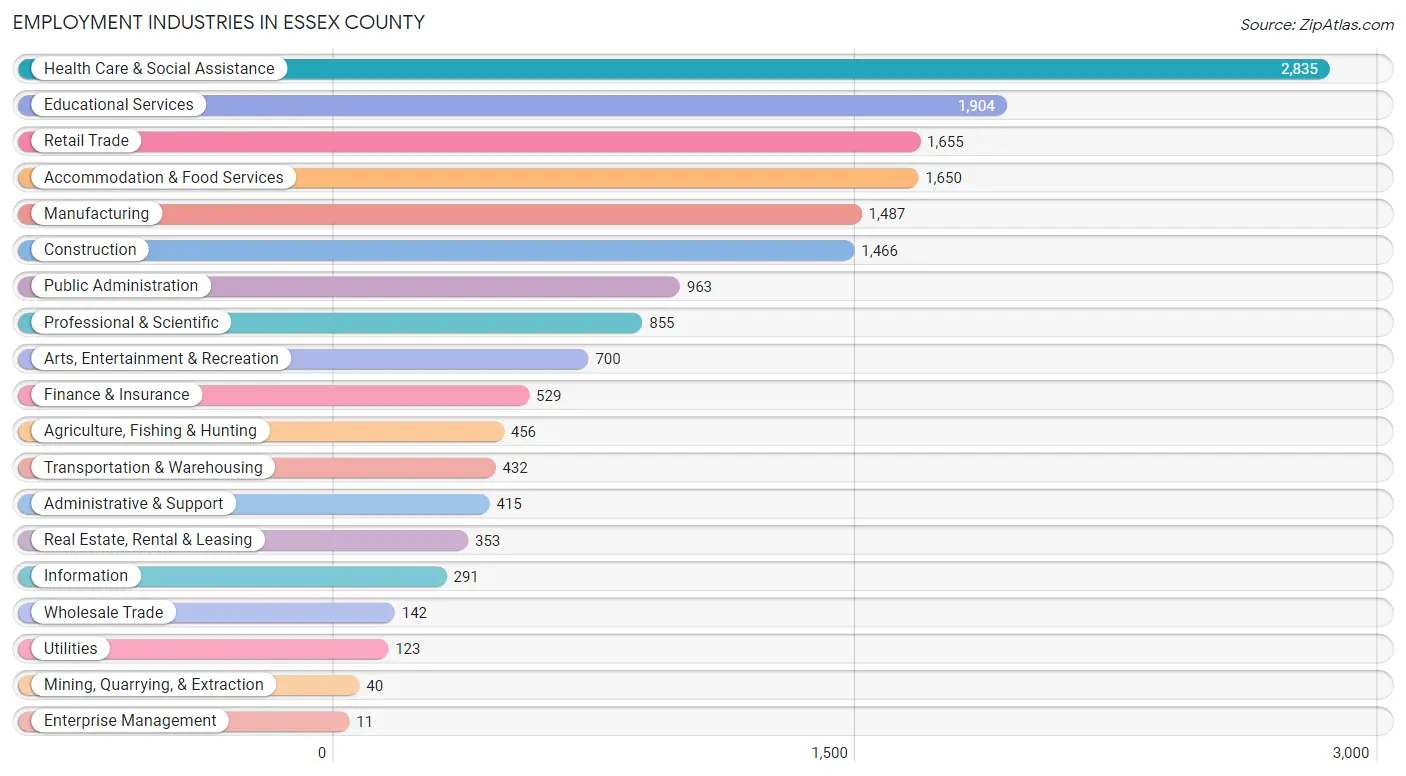
Employment Industries in Essex County
The major employment industries in Essex County include Health Care & Social Assistance (2,835 | 16.4%), Educational Services (1,904 | 11.0%), Retail Trade (1,655 | 9.6%), Accommodation & Food Services (1,650 | 9.5%), and Manufacturing (1,487 | 8.6%).
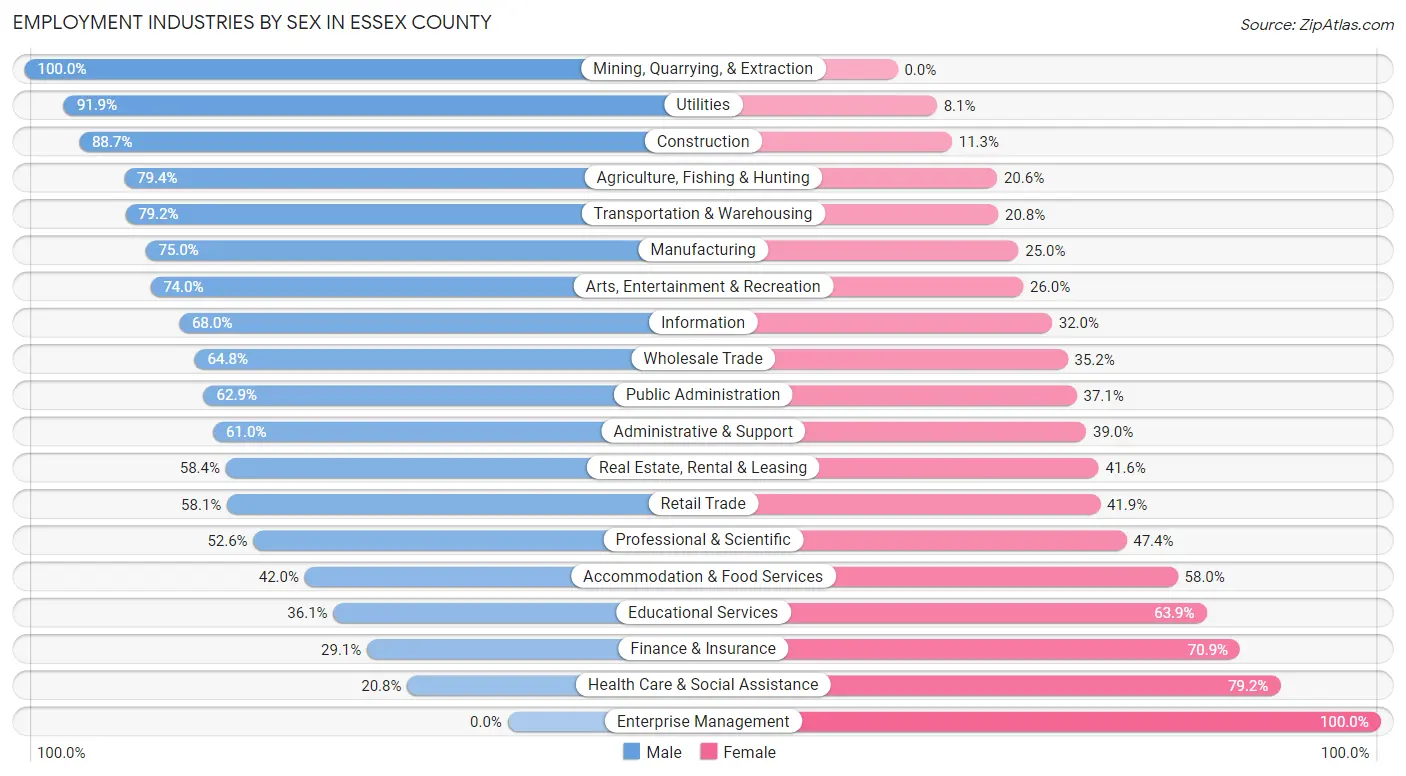
Employment Industries by Sex in Essex County
The Essex County industries that see more men than women are Mining, Quarrying, & Extraction (100.0%), Utilities (91.9%), and Construction (88.7%), whereas the industries that tend to have a higher number of women are Enterprise Management (100.0%), Health Care & Social Assistance (79.2%), and Finance & Insurance (70.9%).
| Industry | Male | Female |
| Agriculture, Fishing & Hunting | 362 (79.4%) | 94 (20.6%) |
| Mining, Quarrying, & Extraction | 40 (100.0%) | 0 (0.0%) |
| Construction | 1,301 (88.7%) | 165 (11.3%) |
| Manufacturing | 1,115 (75.0%) | 372 (25.0%) |
| Wholesale Trade | 92 (64.8%) | 50 (35.2%) |
| Retail Trade | 961 (58.1%) | 694 (41.9%) |
| Transportation & Warehousing | 342 (79.2%) | 90 (20.8%) |
| Utilities | 113 (91.9%) | 10 (8.1%) |
| Information | 198 (68.0%) | 93 (32.0%) |
| Finance & Insurance | 154 (29.1%) | 375 (70.9%) |
| Real Estate, Rental & Leasing | 206 (58.4%) | 147 (41.6%) |
| Professional & Scientific | 450 (52.6%) | 405 (47.4%) |
| Enterprise Management | 0 (0.0%) | 11 (100.0%) |
| Administrative & Support | 253 (61.0%) | 162 (39.0%) |
| Educational Services | 687 (36.1%) | 1,217 (63.9%) |
| Health Care & Social Assistance | 589 (20.8%) | 2,246 (79.2%) |
| Arts, Entertainment & Recreation | 518 (74.0%) | 182 (26.0%) |
| Accommodation & Food Services | 693 (42.0%) | 957 (58.0%) |
| Public Administration | 606 (62.9%) | 357 (37.1%) |
| Total | 9,055 (52.4%) | 8,239 (47.6%) |
Education in Essex County
School Enrollment in Essex County
The most common levels of schooling among the 6,542 students in Essex County are high school (1,617 | 24.7%), middle school (1,497 | 22.9%), and college / undergraduate (1,326 | 20.3%).
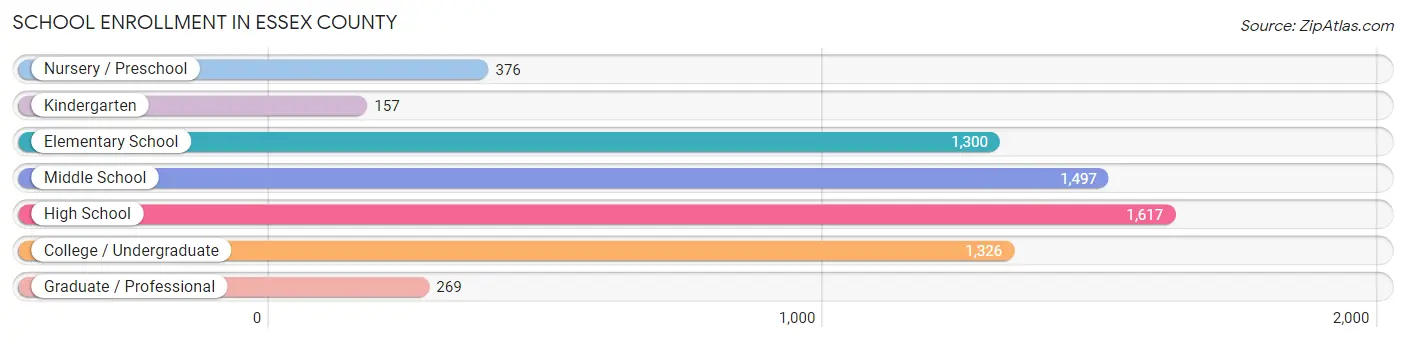
| School Level | # Students | % Students |
| Nursery / Preschool | 376 | 5.8% |
| Kindergarten | 157 | 2.4% |
| Elementary School | 1,300 | 19.9% |
| Middle School | 1,497 | 22.9% |
| High School | 1,617 | 24.7% |
| College / Undergraduate | 1,326 | 20.3% |
| Graduate / Professional | 269 | 4.1% |
| Total | 6,542 | 100.0% |
School Enrollment by Age by Funding Source in Essex County
Out of a total of 6,542 students who are enrolled in schools in Essex County, 1,106 (16.9%) attend a private institution, while the remaining 5,436 (83.1%) are enrolled in public schools. The age group of 35 years and over has the highest likelihood of being enrolled in private schools, with 188 (41.3% in the age bracket) enrolled. Conversely, the age group of 15 to 17 year olds has the lowest likelihood of being enrolled in a private school, with 1,088 (94.3% in the age bracket) attending a public institution.
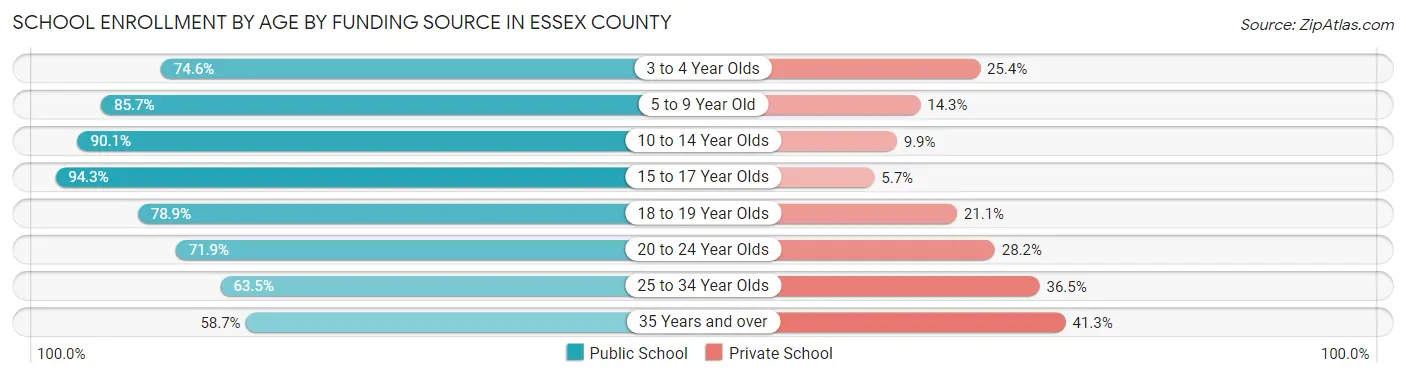
| Age Bracket | Public School | Private School |
| 3 to 4 Year Olds | 232 (74.6%) | 79 (25.4%) |
| 5 to 9 Year Old | 1,292 (85.7%) | 215 (14.3%) |
| 10 to 14 Year Olds | 1,539 (90.1%) | 169 (9.9%) |
| 15 to 17 Year Olds | 1,088 (94.3%) | 66 (5.7%) |
| 18 to 19 Year Olds | 378 (78.9%) | 101 (21.1%) |
| 20 to 24 Year Olds | 462 (71.9%) | 181 (28.1%) |
| 25 to 34 Year Olds | 181 (63.5%) | 104 (36.5%) |
| 35 Years and over | 267 (58.7%) | 188 (41.3%) |
| Total | 5,436 (83.1%) | 1,106 (16.9%) |
Educational Attainment by Field of Study in Essex County
Education (1,355 | 13.8%), business (1,155 | 11.7%), science & technology (1,146 | 11.6%), social sciences (1,056 | 10.7%), and liberal arts & history (715 | 7.3%) are the most common fields of study among 9,851 individuals in Essex County who have obtained a bachelor's degree or higher.
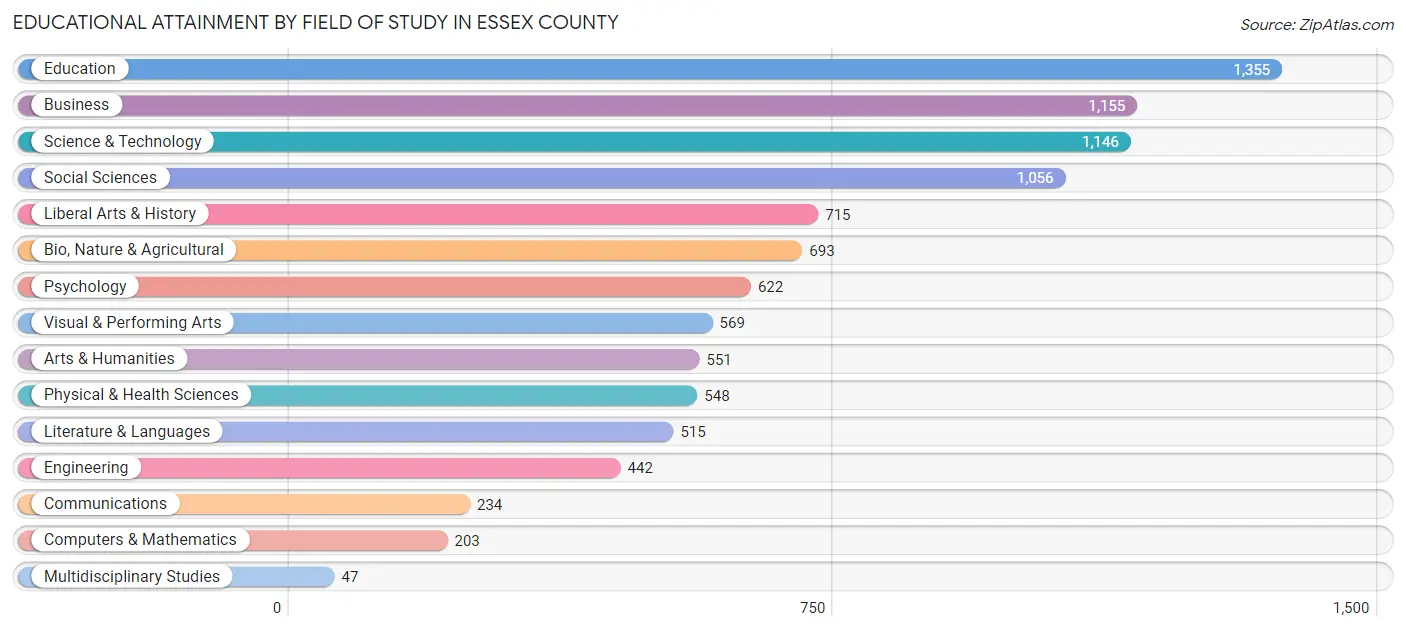
| Field of Study | # Graduates | % Graduates |
| Computers & Mathematics | 203 | 2.1% |
| Bio, Nature & Agricultural | 693 | 7.0% |
| Physical & Health Sciences | 548 | 5.6% |
| Psychology | 622 | 6.3% |
| Social Sciences | 1,056 | 10.7% |
| Engineering | 442 | 4.5% |
| Multidisciplinary Studies | 47 | 0.5% |
| Science & Technology | 1,146 | 11.6% |
| Business | 1,155 | 11.7% |
| Education | 1,355 | 13.8% |
| Literature & Languages | 515 | 5.2% |
| Liberal Arts & History | 715 | 7.3% |
| Visual & Performing Arts | 569 | 5.8% |
| Communications | 234 | 2.4% |
| Arts & Humanities | 551 | 5.6% |
| Total | 9,851 | 100.0% |
Transportation & Commute in Essex County
Vehicle Availability by Sex in Essex County
The most prevalent vehicle ownership categories in Essex County are males with 2 vehicles (4,423, accounting for 49.7%) and females with 2 vehicles (3,548, making up 55.9%).
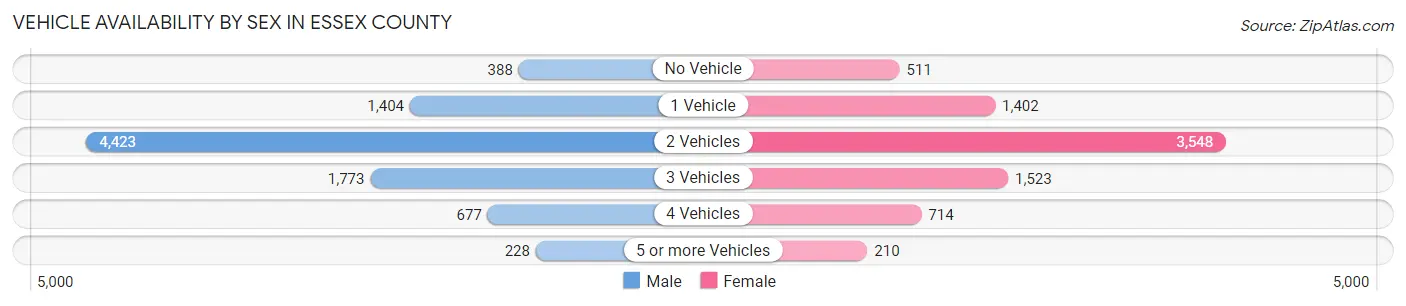
| Vehicles Available | Male | Female |
| No Vehicle | 388 (4.4%) | 511 (6.5%) |
| 1 Vehicle | 1,404 (15.8%) | 1,402 (17.7%) |
| 2 Vehicles | 4,423 (49.7%) | 3,548 (44.9%) |
| 3 Vehicles | 1,773 (19.9%) | 1,523 (19.3%) |
| 4 Vehicles | 677 (7.6%) | 714 (9.0%) |
| 5 or more Vehicles | 228 (2.6%) | 210 (2.7%) |
| Total | 8,893 (100.0%) | 7,908 (100.0%) |
Commute Time in Essex County
The most frequently occuring commute durations in Essex County are 5 to 9 minutes (3,089 commuters, 20.3%), 10 to 14 minutes (2,536 commuters, 16.7%), and 30 to 34 minutes (1,647 commuters, 10.8%).
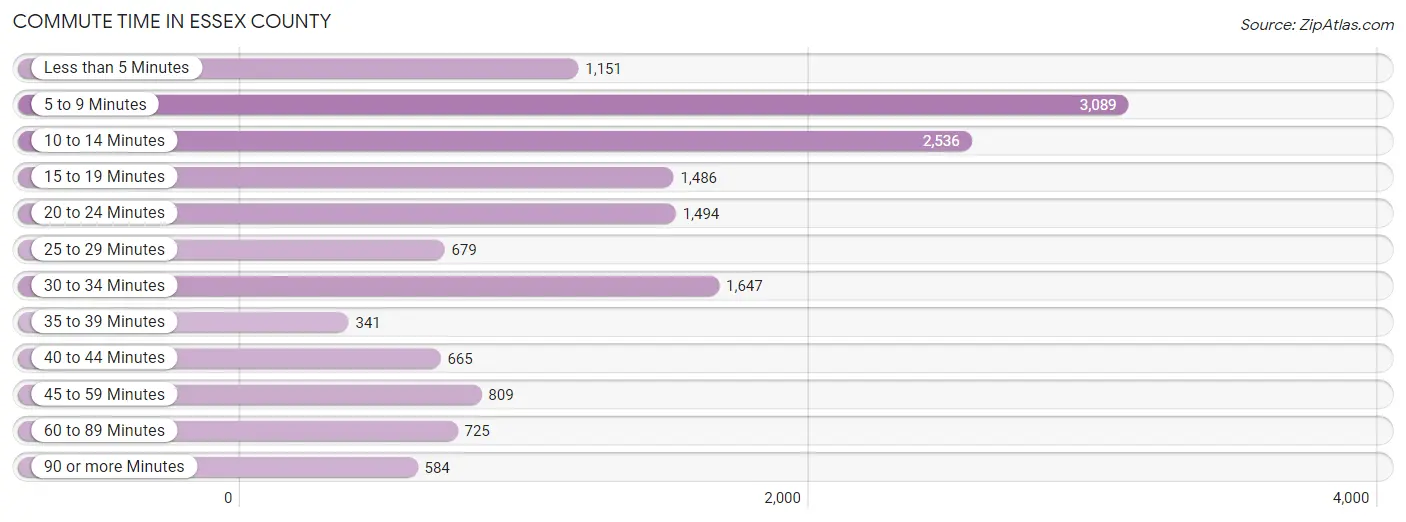
| Commute Time | # Commuters | % Commuters |
| Less than 5 Minutes | 1,151 | 7.6% |
| 5 to 9 Minutes | 3,089 | 20.3% |
| 10 to 14 Minutes | 2,536 | 16.7% |
| 15 to 19 Minutes | 1,486 | 9.8% |
| 20 to 24 Minutes | 1,494 | 9.8% |
| 25 to 29 Minutes | 679 | 4.5% |
| 30 to 34 Minutes | 1,647 | 10.8% |
| 35 to 39 Minutes | 341 | 2.2% |
| 40 to 44 Minutes | 665 | 4.4% |
| 45 to 59 Minutes | 809 | 5.3% |
| 60 to 89 Minutes | 725 | 4.8% |
| 90 or more Minutes | 584 | 3.8% |
Commute Time by Sex in Essex County
The most common commute times in Essex County are 5 to 9 minutes (1,648 commuters, 20.5%) for males and 5 to 9 minutes (1,441 commuters, 20.1%) for females.
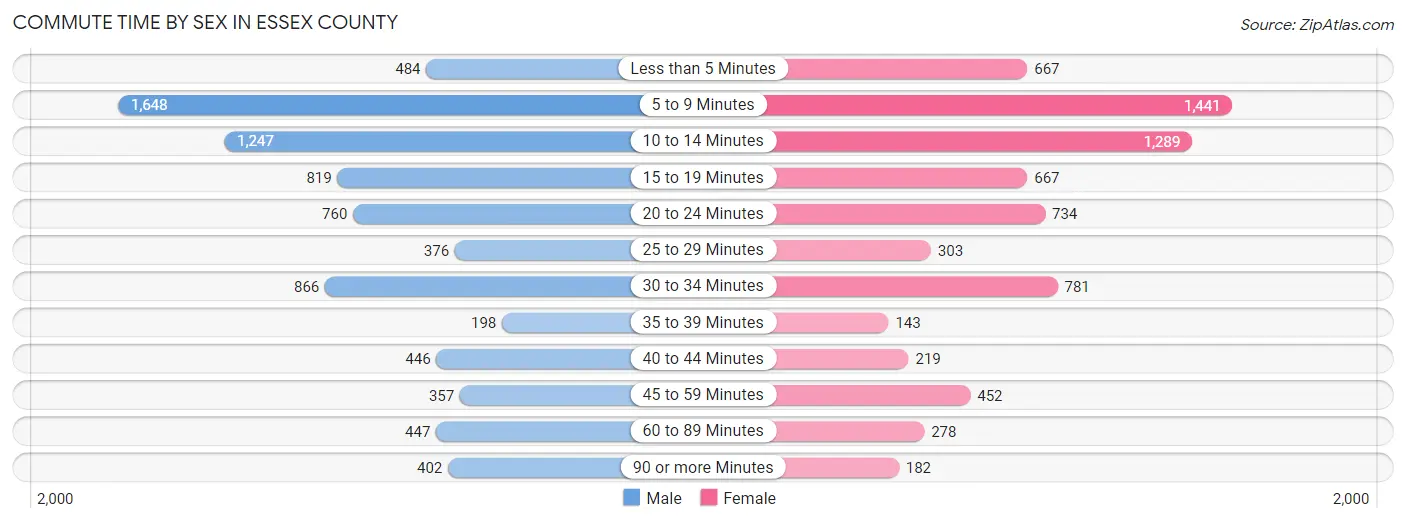
| Commute Time | Male | Female |
| Less than 5 Minutes | 484 (6.0%) | 667 (9.3%) |
| 5 to 9 Minutes | 1,648 (20.5%) | 1,441 (20.1%) |
| 10 to 14 Minutes | 1,247 (15.5%) | 1,289 (18.0%) |
| 15 to 19 Minutes | 819 (10.2%) | 667 (9.3%) |
| 20 to 24 Minutes | 760 (9.4%) | 734 (10.3%) |
| 25 to 29 Minutes | 376 (4.7%) | 303 (4.2%) |
| 30 to 34 Minutes | 866 (10.8%) | 781 (10.9%) |
| 35 to 39 Minutes | 198 (2.5%) | 143 (2.0%) |
| 40 to 44 Minutes | 446 (5.5%) | 219 (3.1%) |
| 45 to 59 Minutes | 357 (4.4%) | 452 (6.3%) |
| 60 to 89 Minutes | 447 (5.6%) | 278 (3.9%) |
| 90 or more Minutes | 402 (5.0%) | 182 (2.5%) |
Time of Departure to Work by Sex in Essex County
The most frequent times of departure to work in Essex County are 7:30 AM to 7:59 AM (1,230, 15.3%) for males and 7:30 AM to 7:59 AM (1,522, 21.3%) for females.
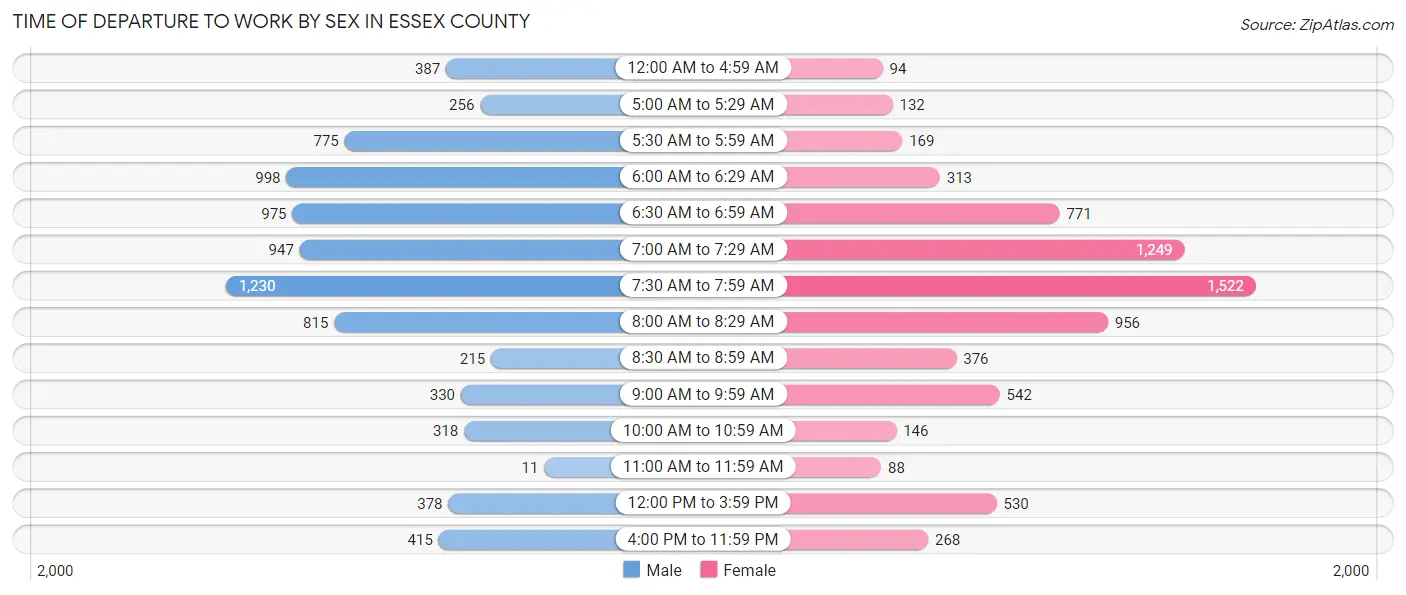
| Time of Departure | Male | Female |
| 12:00 AM to 4:59 AM | 387 (4.8%) | 94 (1.3%) |
| 5:00 AM to 5:29 AM | 256 (3.2%) | 132 (1.8%) |
| 5:30 AM to 5:59 AM | 775 (9.6%) | 169 (2.4%) |
| 6:00 AM to 6:29 AM | 998 (12.4%) | 313 (4.4%) |
| 6:30 AM to 6:59 AM | 975 (12.1%) | 771 (10.8%) |
| 7:00 AM to 7:29 AM | 947 (11.8%) | 1,249 (17.4%) |
| 7:30 AM to 7:59 AM | 1,230 (15.3%) | 1,522 (21.3%) |
| 8:00 AM to 8:29 AM | 815 (10.1%) | 956 (13.4%) |
| 8:30 AM to 8:59 AM | 215 (2.7%) | 376 (5.2%) |
| 9:00 AM to 9:59 AM | 330 (4.1%) | 542 (7.6%) |
| 10:00 AM to 10:59 AM | 318 (4.0%) | 146 (2.0%) |
| 11:00 AM to 11:59 AM | 11 (0.1%) | 88 (1.2%) |
| 12:00 PM to 3:59 PM | 378 (4.7%) | 530 (7.4%) |
| 4:00 PM to 11:59 PM | 415 (5.2%) | 268 (3.7%) |
| Total | 8,050 (100.0%) | 7,156 (100.0%) |
Housing Occupancy in Essex County
Occupancy by Ownership in Essex County
Of the total 15,750 dwellings in Essex County, owner-occupied units account for 12,129 (77.0%), while renter-occupied units make up 3,621 (23.0%).
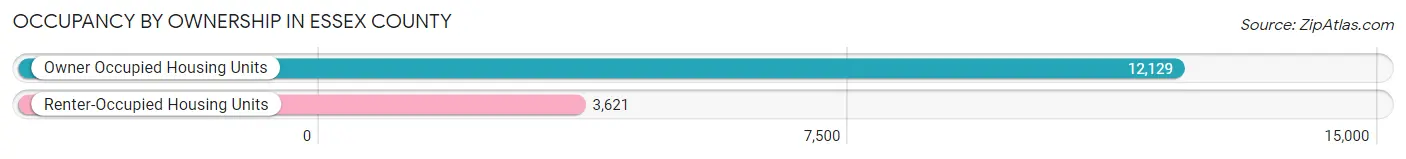
| Occupancy | # Housing Units | % Housing Units |
| Owner Occupied Housing Units | 12,129 | 77.0% |
| Renter-Occupied Housing Units | 3,621 | 23.0% |
| Total Occupied Housing Units | 15,750 | 100.0% |
Occupancy by Household Size in Essex County
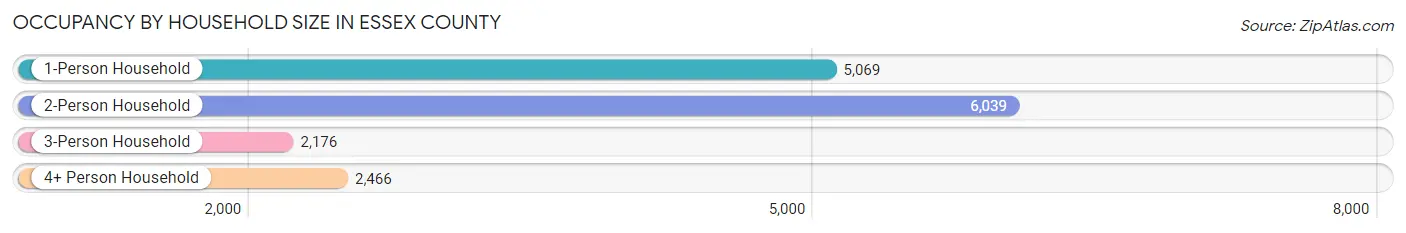
| Household Size | # Housing Units | % Housing Units |
| 1-Person Household | 5,069 | 32.2% |
| 2-Person Household | 6,039 | 38.3% |
| 3-Person Household | 2,176 | 13.8% |
| 4+ Person Household | 2,466 | 15.7% |
| Total Housing Units | 15,750 | 100.0% |
Occupancy by Ownership by Household Size in Essex County
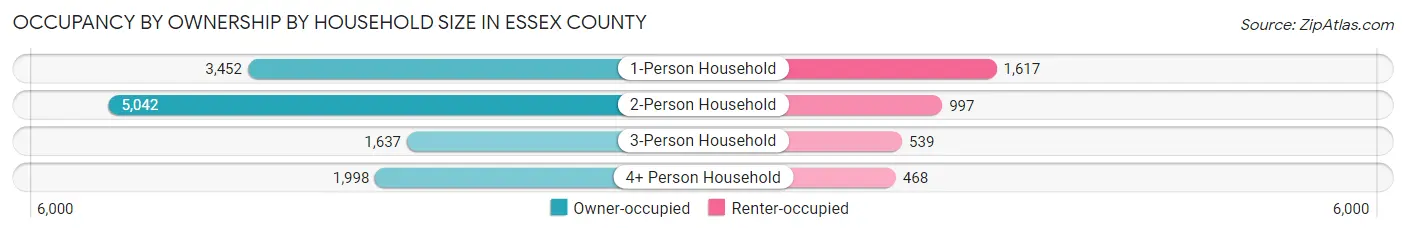
| Household Size | Owner-occupied | Renter-occupied |
| 1-Person Household | 3,452 (68.1%) | 1,617 (31.9%) |
| 2-Person Household | 5,042 (83.5%) | 997 (16.5%) |
| 3-Person Household | 1,637 (75.2%) | 539 (24.8%) |
| 4+ Person Household | 1,998 (81.0%) | 468 (19.0%) |
| Total Housing Units | 12,129 (77.0%) | 3,621 (23.0%) |
Occupancy by Educational Attainment in Essex County
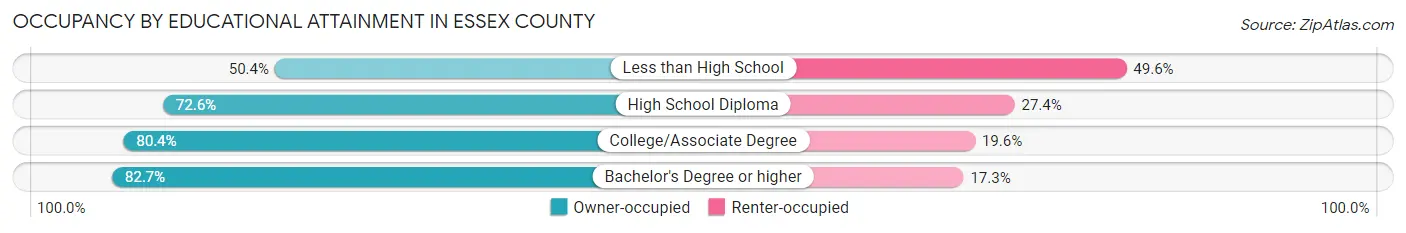
| Household Size | Owner-occupied | Renter-occupied |
| Less than High School | 521 (50.4%) | 513 (49.6%) |
| High School Diploma | 3,220 (72.6%) | 1,217 (27.4%) |
| College/Associate Degree | 3,941 (80.4%) | 960 (19.6%) |
| Bachelor's Degree or higher | 4,447 (82.7%) | 931 (17.3%) |
Occupancy by Age of Householder in Essex County
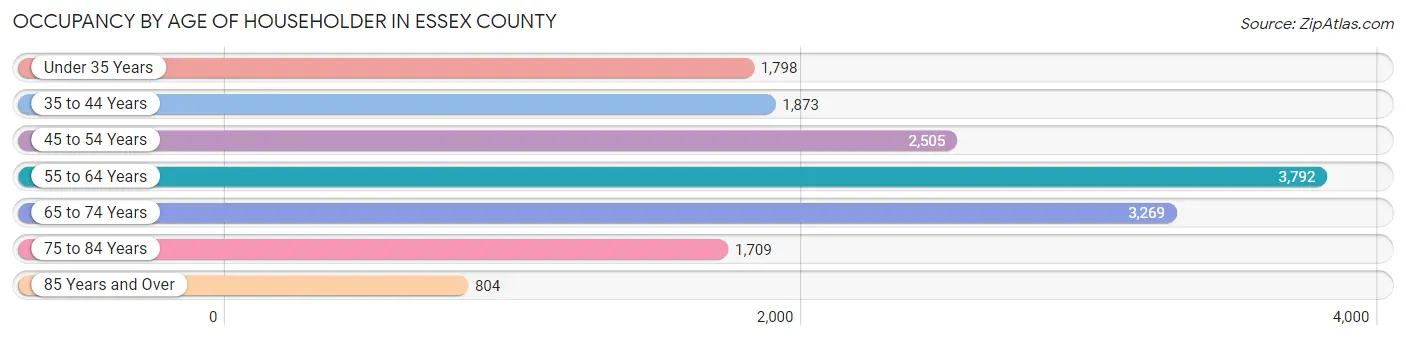
| Age Bracket | # Households | % Households |
| Under 35 Years | 1,798 | 11.4% |
| 35 to 44 Years | 1,873 | 11.9% |
| 45 to 54 Years | 2,505 | 15.9% |
| 55 to 64 Years | 3,792 | 24.1% |
| 65 to 74 Years | 3,269 | 20.8% |
| 75 to 84 Years | 1,709 | 10.8% |
| 85 Years and Over | 804 | 5.1% |
| Total | 15,750 | 100.0% |
Housing Finances in Essex County
Median Income by Occupancy in Essex County
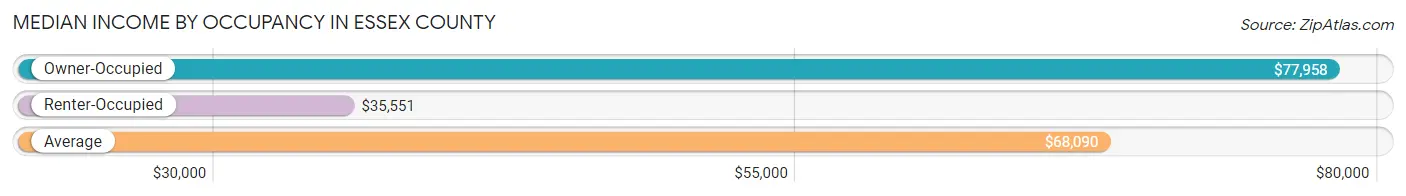
| Occupancy Type | # Households | Median Income |
| Owner-Occupied | 12,129 (77.0%) | $77,958 |
| Renter-Occupied | 3,621 (23.0%) | $35,551 |
| Average | 15,750 (100.0%) | $68,090 |
Occupancy by Householder Income Bracket in Essex County
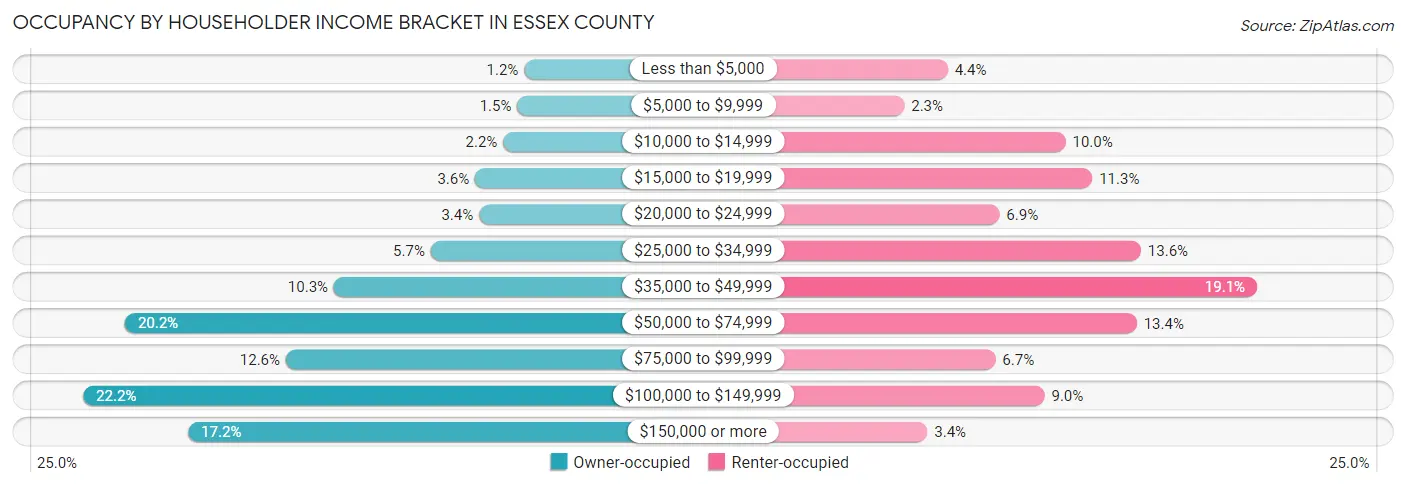
| Income Bracket | Owner-occupied | Renter-occupied |
| Less than $5,000 | 147 (1.2%) | 159 (4.4%) |
| $5,000 to $9,999 | 187 (1.5%) | 84 (2.3%) |
| $10,000 to $14,999 | 268 (2.2%) | 362 (10.0%) |
| $15,000 to $19,999 | 431 (3.5%) | 408 (11.3%) |
| $20,000 to $24,999 | 407 (3.4%) | 248 (6.9%) |
| $25,000 to $34,999 | 686 (5.7%) | 492 (13.6%) |
| $35,000 to $49,999 | 1,246 (10.3%) | 692 (19.1%) |
| $50,000 to $74,999 | 2,453 (20.2%) | 485 (13.4%) |
| $75,000 to $99,999 | 1,523 (12.6%) | 241 (6.7%) |
| $100,000 to $149,999 | 2,694 (22.2%) | 326 (9.0%) |
| $150,000 or more | 2,087 (17.2%) | 124 (3.4%) |
| Total | 12,129 (100.0%) | 3,621 (100.0%) |
Monthly Housing Cost Tiers in Essex County
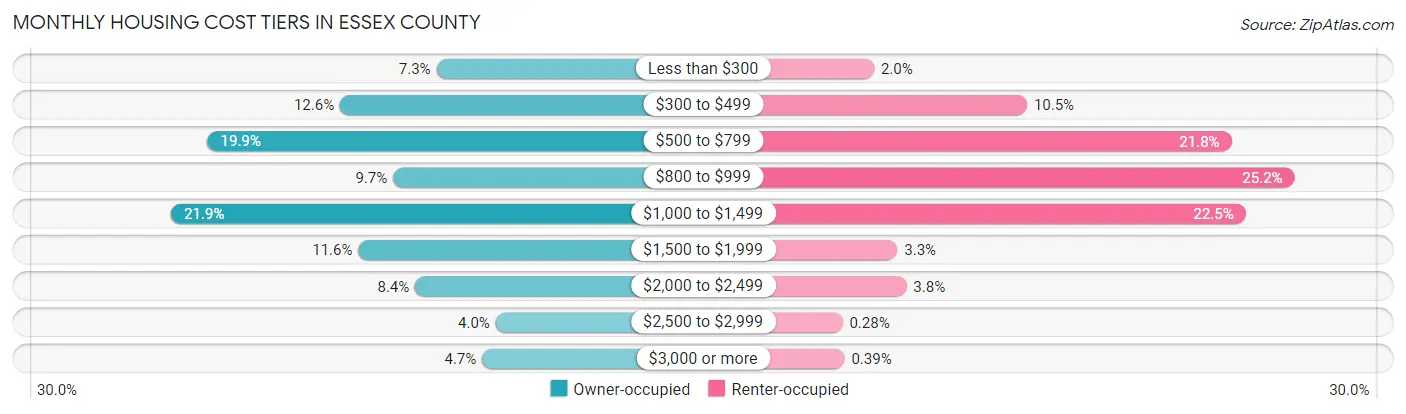
| Monthly Cost | Owner-occupied | Renter-occupied |
| Less than $300 | 879 (7.2%) | 73 (2.0%) |
| $300 to $499 | 1,526 (12.6%) | 379 (10.5%) |
| $500 to $799 | 2,413 (19.9%) | 788 (21.8%) |
| $800 to $999 | 1,170 (9.7%) | 914 (25.2%) |
| $1,000 to $1,499 | 2,658 (21.9%) | 816 (22.5%) |
| $1,500 to $1,999 | 1,403 (11.6%) | 120 (3.3%) |
| $2,000 to $2,499 | 1,023 (8.4%) | 138 (3.8%) |
| $2,500 to $2,999 | 483 (4.0%) | 10 (0.3%) |
| $3,000 or more | 574 (4.7%) | 14 (0.4%) |
| Total | 12,129 (100.0%) | 3,621 (100.0%) |
Physical Housing Characteristics in Essex County
Housing Structures in Essex County
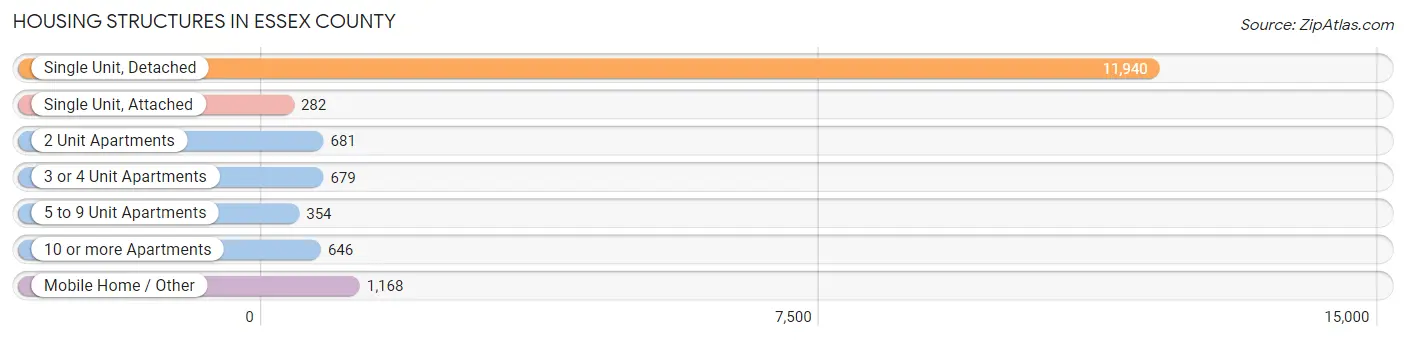
| Structure Type | # Housing Units | % Housing Units |
| Single Unit, Detached | 11,940 | 75.8% |
| Single Unit, Attached | 282 | 1.8% |
| 2 Unit Apartments | 681 | 4.3% |
| 3 or 4 Unit Apartments | 679 | 4.3% |
| 5 to 9 Unit Apartments | 354 | 2.2% |
| 10 or more Apartments | 646 | 4.1% |
| Mobile Home / Other | 1,168 | 7.4% |
| Total | 15,750 | 100.0% |
Housing Structures by Occupancy in Essex County
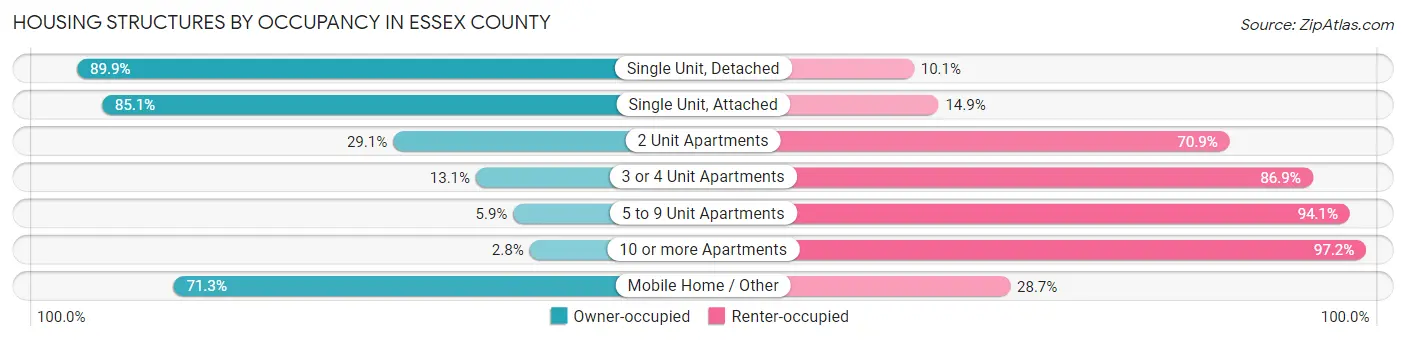
| Structure Type | Owner-occupied | Renter-occupied |
| Single Unit, Detached | 10,730 (89.9%) | 1,210 (10.1%) |
| Single Unit, Attached | 240 (85.1%) | 42 (14.9%) |
| 2 Unit Apartments | 198 (29.1%) | 483 (70.9%) |
| 3 or 4 Unit Apartments | 89 (13.1%) | 590 (86.9%) |
| 5 to 9 Unit Apartments | 21 (5.9%) | 333 (94.1%) |
| 10 or more Apartments | 18 (2.8%) | 628 (97.2%) |
| Mobile Home / Other | 833 (71.3%) | 335 (28.7%) |
| Total | 12,129 (77.0%) | 3,621 (23.0%) |
Housing Structures by Number of Rooms in Essex County
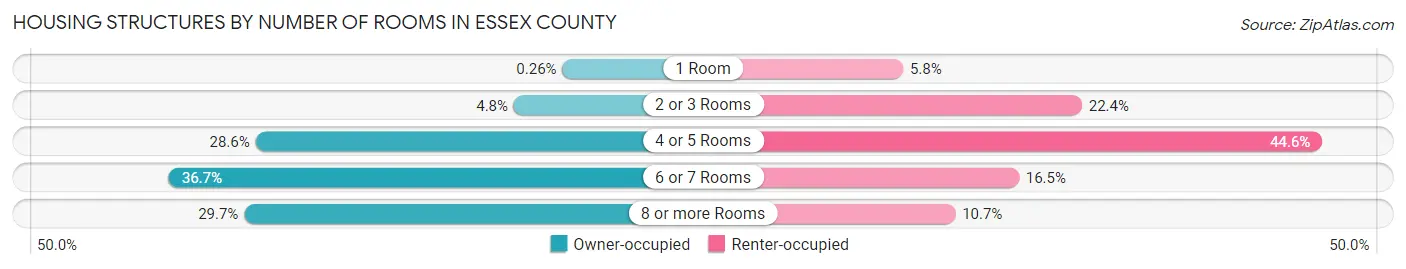
| Number of Rooms | Owner-occupied | Renter-occupied |
| 1 Room | 32 (0.3%) | 211 (5.8%) |
| 2 or 3 Rooms | 576 (4.8%) | 810 (22.4%) |
| 4 or 5 Rooms | 3,474 (28.6%) | 1,615 (44.6%) |
| 6 or 7 Rooms | 4,446 (36.7%) | 599 (16.5%) |
| 8 or more Rooms | 3,601 (29.7%) | 386 (10.7%) |
| Total | 12,129 (100.0%) | 3,621 (100.0%) |
Housing Structure by Heating Type in Essex County
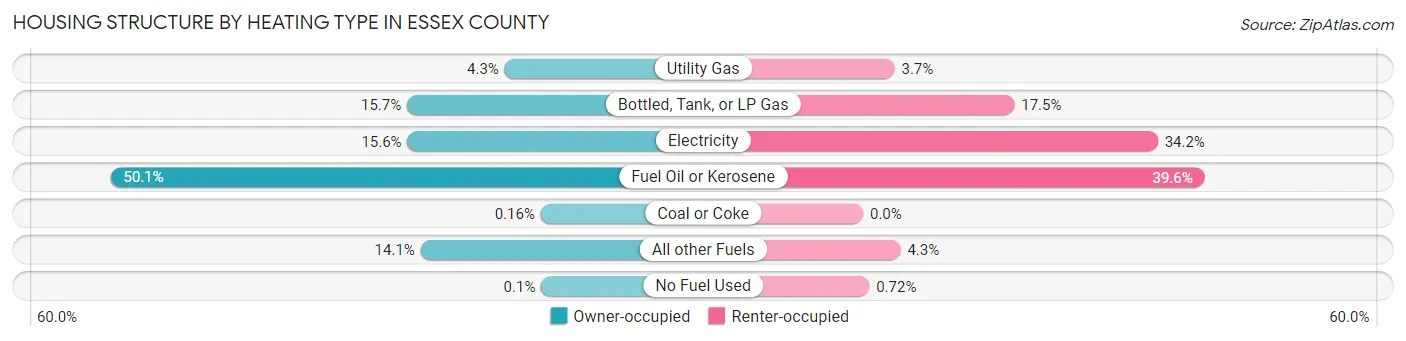
| Heating Type | Owner-occupied | Renter-occupied |
| Utility Gas | 526 (4.3%) | 132 (3.6%) |
| Bottled, Tank, or LP Gas | 1,900 (15.7%) | 635 (17.5%) |
| Electricity | 1,893 (15.6%) | 1,237 (34.2%) |
| Fuel Oil or Kerosene | 6,070 (50.0%) | 1,434 (39.6%) |
| Coal or Coke | 20 (0.2%) | 0 (0.0%) |
| All other Fuels | 1,708 (14.1%) | 157 (4.3%) |
| No Fuel Used | 12 (0.1%) | 26 (0.7%) |
| Total | 12,129 (100.0%) | 3,621 (100.0%) |
Household Vehicle Usage in Essex County
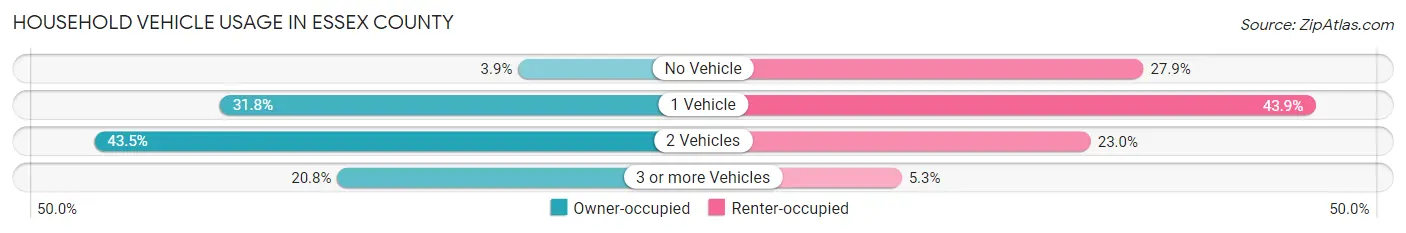
| Vehicles per Household | Owner-occupied | Renter-occupied |
| No Vehicle | 476 (3.9%) | 1,009 (27.9%) |
| 1 Vehicle | 3,855 (31.8%) | 1,589 (43.9%) |
| 2 Vehicles | 5,274 (43.5%) | 831 (23.0%) |
| 3 or more Vehicles | 2,524 (20.8%) | 192 (5.3%) |
| Total | 12,129 (100.0%) | 3,621 (100.0%) |
Real Estate & Mortgages in Essex County
Real Estate and Mortgage Overview in Essex County
| Characteristic | Without Mortgage | With Mortgage |
| Housing Units | 6,031 | 6,098 |
| Median Property Value | $173,100 | $203,500 |
| Median Household Income | $65,554 | $1,431 |
| Monthly Housing Costs | $610 | $546 |
| Real Estate Taxes | $2,682 | $160 |
Property Value by Mortgage Status in Essex County
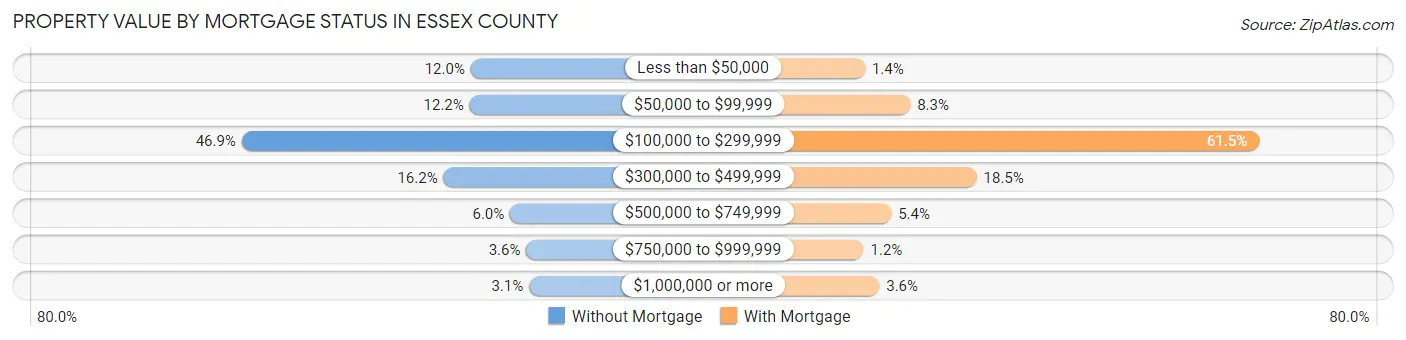
| Property Value | Without Mortgage | With Mortgage |
| Less than $50,000 | 725 (12.0%) | 88 (1.4%) |
| $50,000 to $99,999 | 735 (12.2%) | 508 (8.3%) |
| $100,000 to $299,999 | 2,830 (46.9%) | 3,749 (61.5%) |
| $300,000 to $499,999 | 975 (16.2%) | 1,125 (18.4%) |
| $500,000 to $749,999 | 363 (6.0%) | 332 (5.4%) |
| $750,000 to $999,999 | 214 (3.5%) | 75 (1.2%) |
| $1,000,000 or more | 189 (3.1%) | 221 (3.6%) |
| Total | 6,031 (100.0%) | 6,098 (100.0%) |
Household Income by Mortgage Status in Essex County
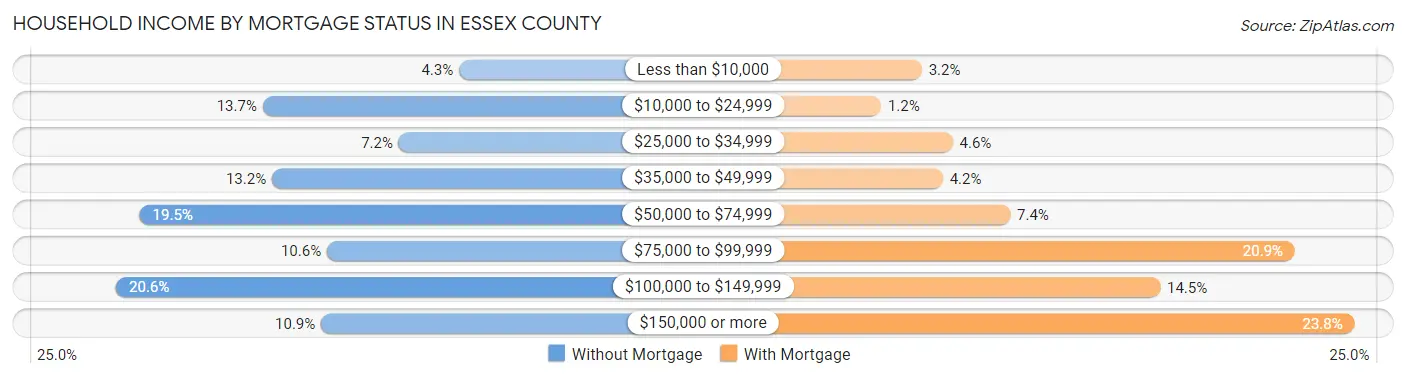
| Household Income | Without Mortgage | With Mortgage |
| Less than $10,000 | 260 (4.3%) | 192 (3.2%) |
| $10,000 to $24,999 | 824 (13.7%) | 74 (1.2%) |
| $25,000 to $34,999 | 433 (7.2%) | 282 (4.6%) |
| $35,000 to $49,999 | 797 (13.2%) | 253 (4.2%) |
| $50,000 to $74,999 | 1,177 (19.5%) | 449 (7.4%) |
| $75,000 to $99,999 | 639 (10.6%) | 1,276 (20.9%) |
| $100,000 to $149,999 | 1,245 (20.6%) | 884 (14.5%) |
| $150,000 or more | 656 (10.9%) | 1,449 (23.8%) |
| Total | 6,031 (100.0%) | 6,098 (100.0%) |
Property Value to Household Income Ratio in Essex County
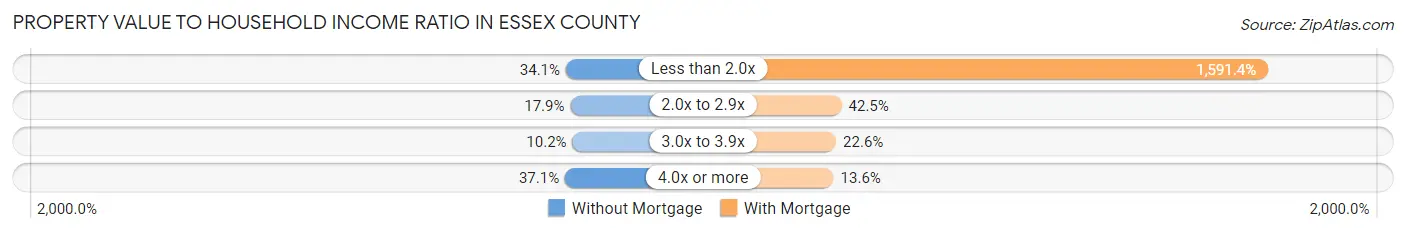
| Value-to-Income Ratio | Without Mortgage | With Mortgage |
| Less than 2.0x | 2,057 (34.1%) | 97,045 (1,591.4%) |
| 2.0x to 2.9x | 1,079 (17.9%) | 2,592 (42.5%) |
| 3.0x to 3.9x | 615 (10.2%) | 1,380 (22.6%) |
| 4.0x or more | 2,239 (37.1%) | 827 (13.6%) |
| Total | 6,031 (100.0%) | 6,098 (100.0%) |
Real Estate Taxes by Mortgage Status in Essex County
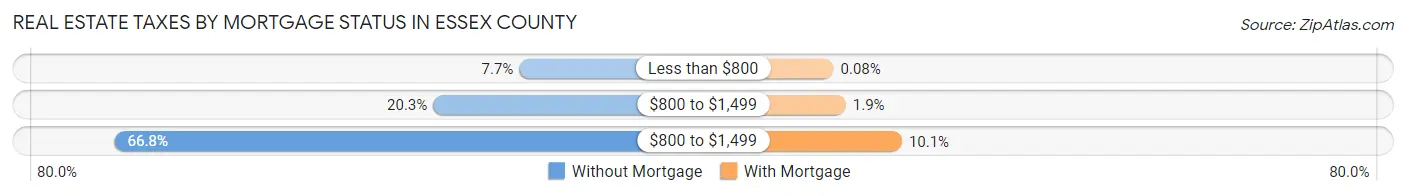
| Property Taxes | Without Mortgage | With Mortgage |
| Less than $800 | 466 (7.7%) | 5 (0.1%) |
| $800 to $1,499 | 1,225 (20.3%) | 114 (1.9%) |
| $800 to $1,499 | 4,031 (66.8%) | 614 (10.1%) |
| Total | 6,031 (100.0%) | 6,098 (100.0%) |
Health & Disability in Essex County
Health Insurance Coverage by Age in Essex County
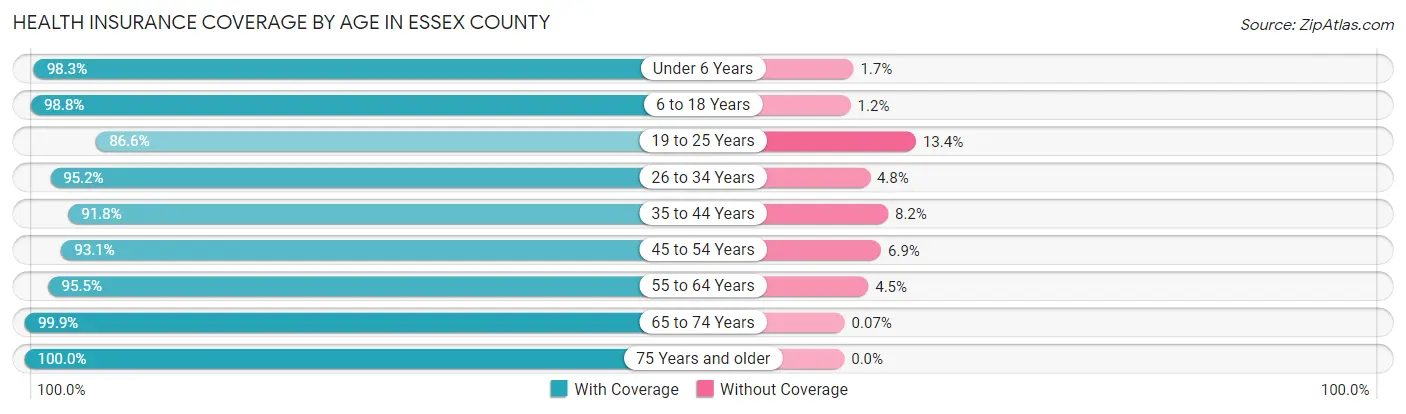
| Age Bracket | With Coverage | Without Coverage |
| Under 6 Years | 1,607 (98.3%) | 28 (1.7%) |
| 6 to 18 Years | 4,493 (98.8%) | 54 (1.2%) |
| 19 to 25 Years | 1,976 (86.6%) | 305 (13.4%) |
| 26 to 34 Years | 3,326 (95.2%) | 167 (4.8%) |
| 35 to 44 Years | 3,431 (91.8%) | 305 (8.2%) |
| 45 to 54 Years | 4,302 (93.1%) | 317 (6.9%) |
| 55 to 64 Years | 5,948 (95.5%) | 278 (4.5%) |
| 65 to 74 Years | 5,360 (99.9%) | 4 (0.1%) |
| 75 Years and older | 3,644 (100.0%) | 0 (0.0%) |
| Total | 34,087 (95.9%) | 1,458 (4.1%) |
Health Insurance Coverage by Citizenship Status in Essex County
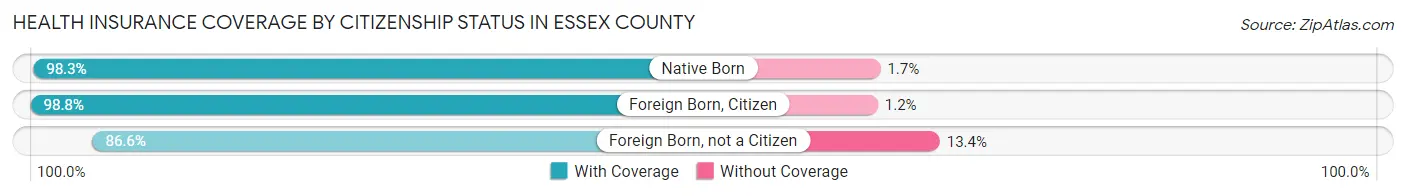
| Citizenship Status | With Coverage | Without Coverage |
| Native Born | 1,607 (98.3%) | 28 (1.7%) |
| Foreign Born, Citizen | 4,493 (98.8%) | 54 (1.2%) |
| Foreign Born, not a Citizen | 1,976 (86.6%) | 305 (13.4%) |
Health Insurance Coverage by Household Income in Essex County
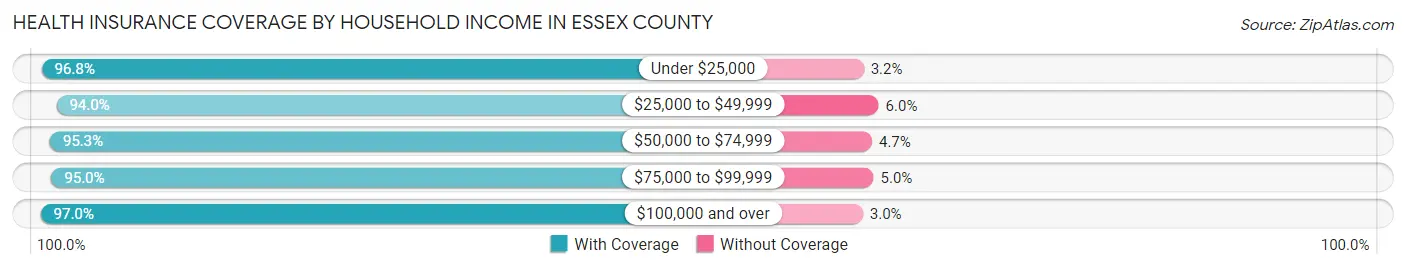
| Household Income | With Coverage | Without Coverage |
| Under $25,000 | 3,883 (96.8%) | 127 (3.2%) |
| $25,000 to $49,999 | 5,372 (94.0%) | 341 (6.0%) |
| $50,000 to $74,999 | 5,655 (95.3%) | 281 (4.7%) |
| $75,000 to $99,999 | 4,312 (95.0%) | 228 (5.0%) |
| $100,000 and over | 14,430 (97.0%) | 448 (3.0%) |
Public vs Private Health Insurance Coverage by Age in Essex County
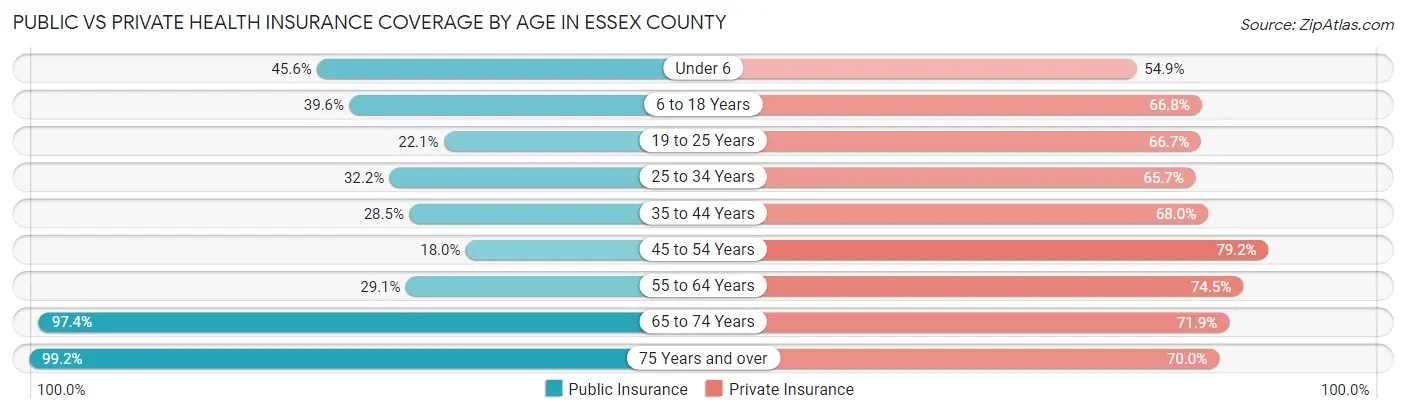
| Age Bracket | Public Insurance | Private Insurance |
| Under 6 | 746 (45.6%) | 897 (54.9%) |
| 6 to 18 Years | 1,802 (39.6%) | 3,037 (66.8%) |
| 19 to 25 Years | 504 (22.1%) | 1,521 (66.7%) |
| 25 to 34 Years | 1,124 (32.2%) | 2,294 (65.7%) |
| 35 to 44 Years | 1,065 (28.5%) | 2,539 (68.0%) |
| 45 to 54 Years | 832 (18.0%) | 3,658 (79.2%) |
| 55 to 64 Years | 1,814 (29.1%) | 4,637 (74.5%) |
| 65 to 74 Years | 5,222 (97.4%) | 3,856 (71.9%) |
| 75 Years and over | 3,613 (99.2%) | 2,552 (70.0%) |
| Total | 16,722 (47.0%) | 24,991 (70.3%) |
Disability Status by Sex by Age in Essex County
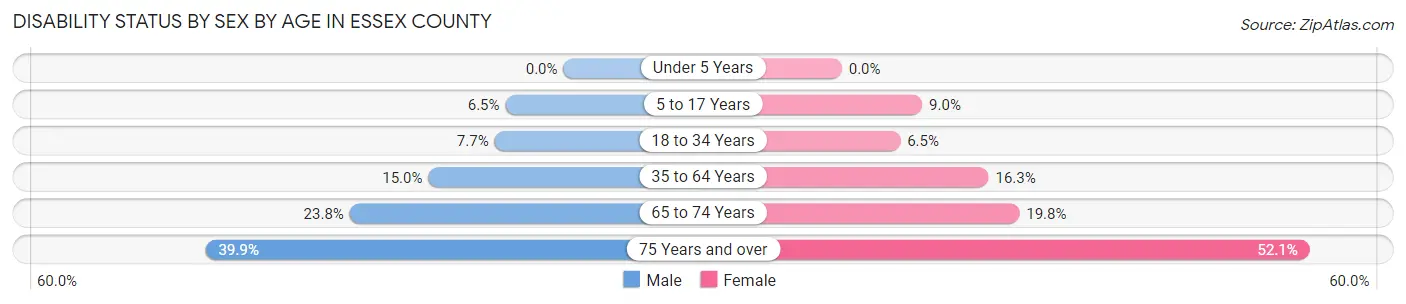
| Age Bracket | Male | Female |
| Under 5 Years | 0 (0.0%) | 0 (0.0%) |
| 5 to 17 Years | 148 (6.5%) | 191 (8.9%) |
| 18 to 34 Years | 237 (7.7%) | 194 (6.5%) |
| 35 to 64 Years | 1,090 (15.0%) | 1,198 (16.3%) |
| 65 to 74 Years | 646 (23.8%) | 524 (19.8%) |
| 75 Years and over | 656 (39.9%) | 1,041 (52.1%) |
Disability Class by Sex by Age in Essex County
Disability Class: Hearing Difficulty
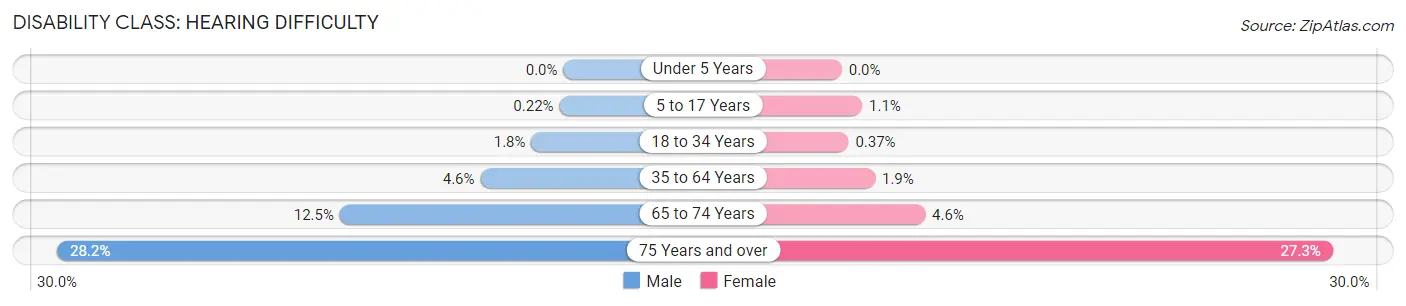
| Age Bracket | Male | Female |
| Under 5 Years | 0 (0.0%) | 0 (0.0%) |
| 5 to 17 Years | 5 (0.2%) | 24 (1.1%) |
| 18 to 34 Years | 55 (1.8%) | 11 (0.4%) |
| 35 to 64 Years | 335 (4.6%) | 136 (1.8%) |
| 65 to 74 Years | 338 (12.4%) | 123 (4.6%) |
| 75 Years and over | 464 (28.2%) | 546 (27.3%) |
Disability Class: Vision Difficulty
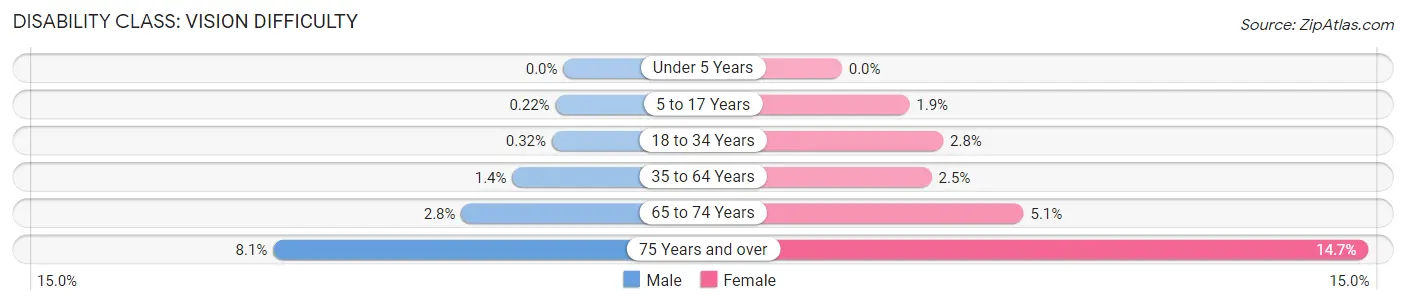
| Age Bracket | Male | Female |
| Under 5 Years | 0 (0.0%) | 0 (0.0%) |
| 5 to 17 Years | 5 (0.2%) | 40 (1.9%) |
| 18 to 34 Years | 10 (0.3%) | 84 (2.8%) |
| 35 to 64 Years | 103 (1.4%) | 183 (2.5%) |
| 65 to 74 Years | 77 (2.8%) | 134 (5.1%) |
| 75 Years and over | 133 (8.1%) | 293 (14.7%) |
Disability Class: Cognitive Difficulty
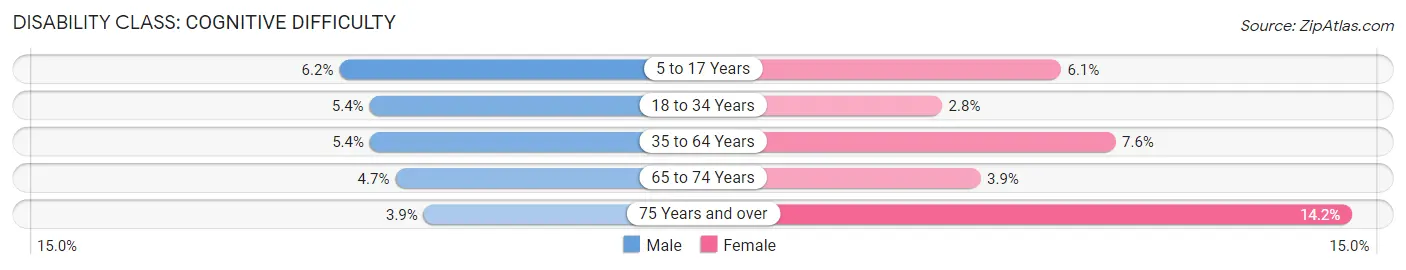
| Age Bracket | Male | Female |
| 5 to 17 Years | 143 (6.2%) | 130 (6.1%) |
| 18 to 34 Years | 167 (5.4%) | 83 (2.8%) |
| 35 to 64 Years | 391 (5.4%) | 558 (7.6%) |
| 65 to 74 Years | 127 (4.7%) | 102 (3.8%) |
| 75 Years and over | 64 (3.9%) | 284 (14.2%) |
Disability Class: Ambulatory Difficulty
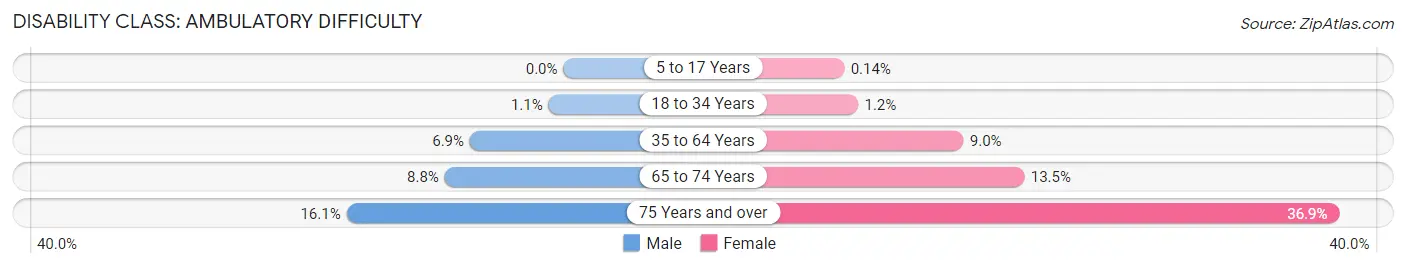
| Age Bracket | Male | Female |
| 5 to 17 Years | 0 (0.0%) | 3 (0.1%) |
| 18 to 34 Years | 34 (1.1%) | 35 (1.2%) |
| 35 to 64 Years | 503 (6.9%) | 659 (9.0%) |
| 65 to 74 Years | 239 (8.8%) | 358 (13.5%) |
| 75 Years and over | 265 (16.1%) | 738 (36.9%) |
Disability Class: Self-Care Difficulty
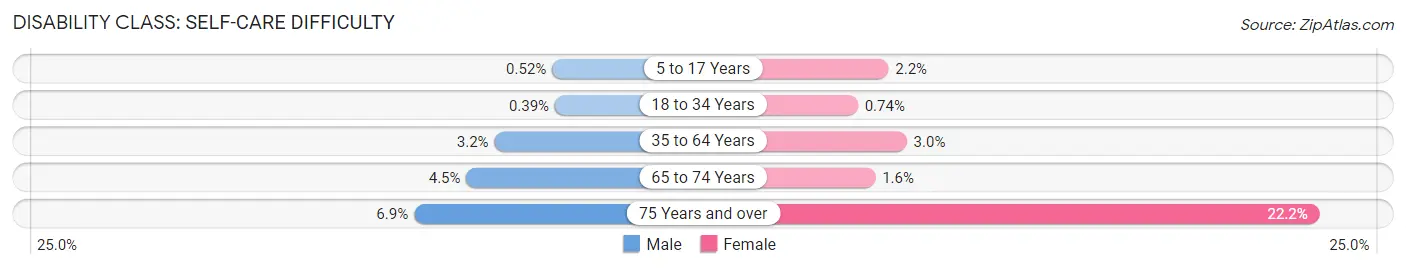
| Age Bracket | Male | Female |
| 5 to 17 Years | 12 (0.5%) | 46 (2.2%) |
| 18 to 34 Years | 12 (0.4%) | 22 (0.7%) |
| 35 to 64 Years | 232 (3.2%) | 221 (3.0%) |
| 65 to 74 Years | 122 (4.5%) | 41 (1.5%) |
| 75 Years and over | 114 (6.9%) | 443 (22.2%) |
Technology Access in Essex County
Computing Device Access in Essex County
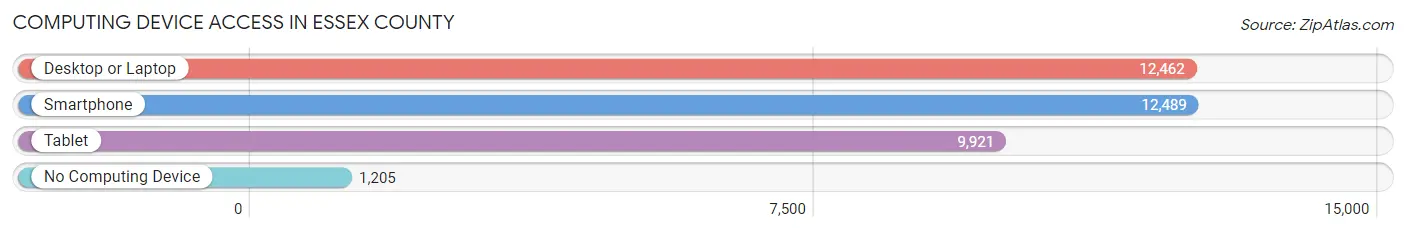
| Device Type | # Households | % Households |
| Desktop or Laptop | 12,462 | 79.1% |
| Smartphone | 12,489 | 79.3% |
| Tablet | 9,921 | 63.0% |
| No Computing Device | 1,205 | 7.6% |
| Total | 15,750 | 100.0% |
Internet Access in Essex County
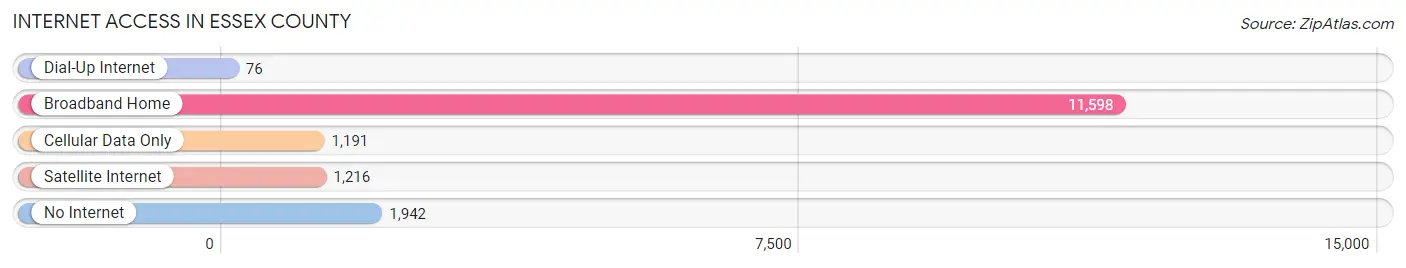
| Internet Type | # Households | % Households |
| Dial-Up Internet | 76 | 0.5% |
| Broadband Home | 11,598 | 73.6% |
| Cellular Data Only | 1,191 | 7.6% |
| Satellite Internet | 1,216 | 7.7% |
| No Internet | 1,942 | 12.3% |
| Total | 15,750 | 100.0% |
Essex County Summary
Essex County is located in the northeastern corner of New York State, and is part of the Adirondack Park. It is bordered by Clinton County to the north, Franklin County to the east, Warren County to the south, and Hamilton County to the west. The county seat is the village of Elizabethtown.
History
Essex County was established in 1799, and was named after the county of Essex in England. The county was originally part of Clinton County, and was split off in 1799. The county was further divided in 1808, when the northern part of the county became Franklin County.
The county was originally inhabited by the Mohawk and Iroquois Native American tribes. The first European settlers arrived in the area in the late 17th century, and the county was officially established in 1799.
The county was an important center of the iron industry in the 19th century, and the county seat of Elizabethtown was an important port on Lake Champlain. The county was also an important center of the lumber industry, and the county seat of Elizabethtown was an important center of the paper industry.
Geography
Essex County covers an area of 1,919 square miles, making it the largest county in New York State. The county is located in the Adirondack Mountains, and is home to several mountain peaks, including Mount Marcy, the highest peak in the state. The county is also home to several rivers, including the Ausable River, the Boquet River, and the Saranac River.
The county is divided into two distinct regions: the Adirondack Mountains in the north, and the Champlain Valley in the south. The county is home to several state parks, including the Adirondack Park, the Ausable Chasm, and the Saranac Lake Islands.
Economy
Essex County has a diverse economy, with a mix of agriculture, manufacturing, and tourism. The county is home to several large dairy farms, and is an important producer of milk, cheese, and other dairy products. The county is also home to several large paper mills, and is an important producer of paper products.
The county is also home to several tourist attractions, including the Ausable Chasm, the Adirondack Park, and the Saranac Lake Islands. Tourism is an important part of the county's economy, and the county is home to several resorts and hotels.
Demographics
As of the 2010 census, Essex County had a population of 39,370. The population is spread out over an area of 1,919 square miles, giving the county a population density of 20.5 people per square mile.
The racial makeup of the county is 95.3% White, 1.2% African American, 0.7% Native American, 0.4% Asian, 0.1% Pacific Islander, 0.7% from other races, and 1.6% from two or more races. The median income for a household in the county is $41,945, and the median income for a family is $50,945.
Conclusion
Essex County is a large and diverse county located in the northeastern corner of New York State. The county is home to several mountain peaks, rivers, and state parks, and is an important center of the iron, lumber, and paper industries. The county is also home to several tourist attractions, and tourism is an important part of the county's economy. The county has a population of 39,370, and the median income for a household is $41,945.
Common Questions
What is Per Capita Income in Essex County?
Per Capita income in Essex County is $39,049.
What is the Median Family Income in Essex County?
Median Family Income in Essex County is $81,271.
What is the Median Household income in Essex County?
Median Household Income in Essex County is $68,090.
What is Income or Wage Gap in Essex County?
Income or Wage Gap in Essex County is 20.0%.
Women in Essex County earn 80.0 cents for every dollar earned by a man.
What is Family Income Deficit in Essex County?
Family Income Deficit in Essex County is $10,213.
Families that are below poverty line in Essex County earn $10,213 less on average than the poverty threshold level.
What is Inequality or Gini Index in Essex County?
Inequality or Gini Index in Essex County is 0.45.
What is the Total Population of Essex County?
Total Population of Essex County is 37,314.
What is the Total Male Population of Essex County?
Total Male Population of Essex County is 19,297.
What is the Total Female Population of Essex County?
Total Female Population of Essex County is 18,017.
What is the Ratio of Males per 100 Females in Essex County?
There are 107.10 Males per 100 Females in Essex County.
What is the Ratio of Females per 100 Males in Essex County?
There are 93.37 Females per 100 Males in Essex County.
What is the Median Population Age in Essex County?
Median Population Age in Essex County is 49.2 Years.
What is the Average Family Size in Essex County
Average Family Size in Essex County is 2.7 People.
What is the Average Household Size in Essex County
Average Household Size in Essex County is 2.2 People.
How Large is the Labor Force in Essex County?
There are 18,229 People in the Labor Forcein in Essex County.
What is the Percentage of People in the Labor Force in Essex County?
56.5% of People are in the Labor Force in Essex County.
What is the Unemployment Rate in Essex County?
Unemployment Rate in Essex County is 5.1%.