Dutchess County, NY Map & Demographics
Dutchess County Map
Dutchess County Overview
$49,379
PER CAPITA INCOME
$118,875
AVG FAMILY INCOME
$94,578
AVG HOUSEHOLD INCOME
31.6%
WAGE / INCOME GAP [ % ]
68.4¢/ $1
WAGE / INCOME GAP [ $ ]
$10,949
FAMILY INCOME DEFICIT
0.46
INEQUALITY / GINI INDEX
296,467
TOTAL POPULATION
148,112
MALE POPULATION
148,355
FEMALE POPULATION
99.84
MALES / 100 FEMALES
100.16
FEMALES / 100 MALES
42.9
MEDIAN AGE
3.0
AVG FAMILY SIZE
2.5
AVG HOUSEHOLD SIZE
156,113
LABOR FORCE [ PEOPLE ]
62.8%
PERCENT IN LABOR FORCE
5.0%
UNEMPLOYMENT RATE
Income in Dutchess County
Income Overview in Dutchess County
Per Capita Income in Dutchess County is $49,379, while median incomes of families and households are $118,875 and $94,578 respectively.
| Characteristic | Number | Measure |
| Per Capita Income | 296,467 | $49,379 |
| Median Family Income | 73,835 | $118,875 |
| Mean Family Income | 73,835 | $147,505 |
| Median Household Income | 113,972 | $94,578 |
| Mean Household Income | 113,972 | $125,512 |
| Income Deficit | 73,835 | $10,949 |
| Wage / Income Gap (%) | 296,467 | 31.61% |
| Wage / Income Gap ($) | 296,467 | 68.39¢ per $1 |
| Gini / Inequality Index | 296,467 | 0.46 |
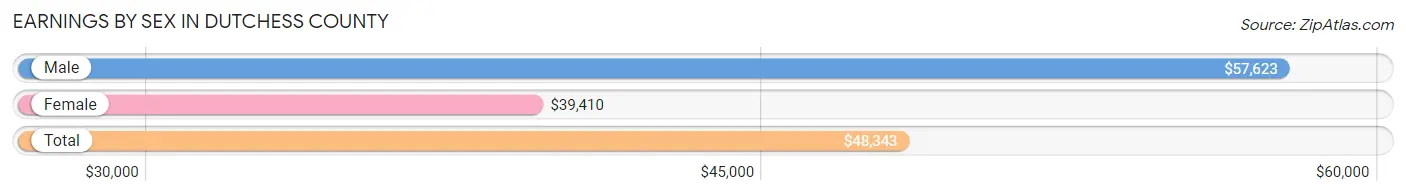
Earnings by Sex in Dutchess County
Average Earnings in Dutchess County are $48,343, $57,623 for men and $39,410 for women, a difference of 31.6%.
| Sex | Number | Average Earnings |
| Male | 86,167 (52.4%) | $57,623 |
| Female | 78,120 (47.5%) | $39,410 |
| Total | 164,287 (100.0%) | $48,343 |
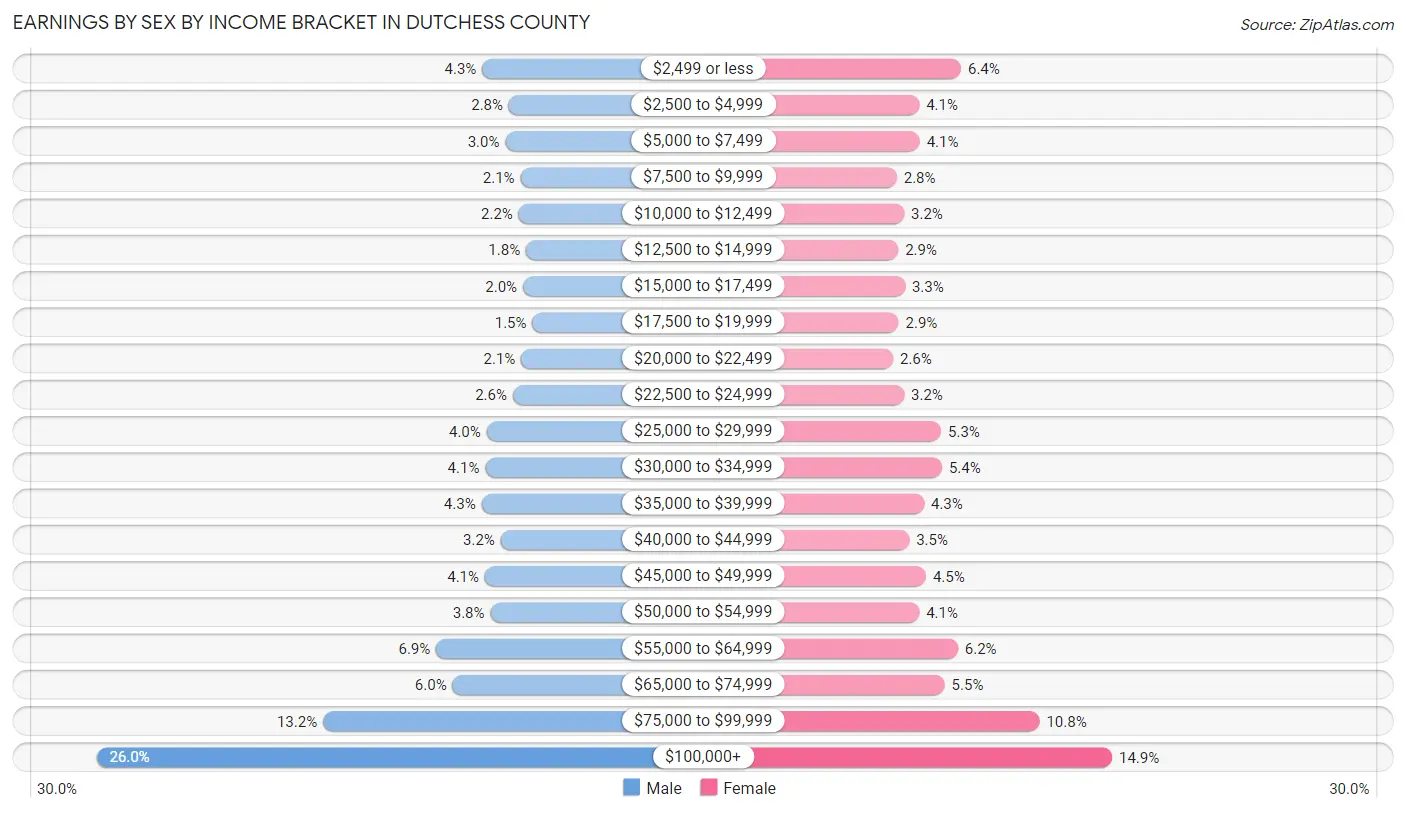
Earnings by Sex by Income Bracket in Dutchess County
The most common earnings brackets in Dutchess County are $100,000+ for men (22,372 | 26.0%) and $100,000+ for women (11,646 | 14.9%).
| Income | Male | Female |
| $2,499 or less | 3,691 (4.3%) | 5,017 (6.4%) |
| $2,500 to $4,999 | 2,399 (2.8%) | 3,178 (4.1%) |
| $5,000 to $7,499 | 2,569 (3.0%) | 3,205 (4.1%) |
| $7,500 to $9,999 | 1,836 (2.1%) | 2,193 (2.8%) |
| $10,000 to $12,499 | 1,920 (2.2%) | 2,515 (3.2%) |
| $12,500 to $14,999 | 1,572 (1.8%) | 2,256 (2.9%) |
| $15,000 to $17,499 | 1,718 (2.0%) | 2,551 (3.3%) |
| $17,500 to $19,999 | 1,256 (1.5%) | 2,273 (2.9%) |
| $20,000 to $22,499 | 1,799 (2.1%) | 2,032 (2.6%) |
| $22,500 to $24,999 | 2,208 (2.6%) | 2,513 (3.2%) |
| $25,000 to $29,999 | 3,476 (4.0%) | 4,143 (5.3%) |
| $30,000 to $34,999 | 3,540 (4.1%) | 4,179 (5.3%) |
| $35,000 to $39,999 | 3,726 (4.3%) | 3,389 (4.3%) |
| $40,000 to $44,999 | 2,794 (3.2%) | 2,742 (3.5%) |
| $45,000 to $49,999 | 3,558 (4.1%) | 3,474 (4.4%) |
| $50,000 to $54,999 | 3,289 (3.8%) | 3,183 (4.1%) |
| $55,000 to $64,999 | 5,918 (6.9%) | 4,871 (6.2%) |
| $65,000 to $74,999 | 5,125 (5.9%) | 4,298 (5.5%) |
| $75,000 to $99,999 | 11,401 (13.2%) | 8,462 (10.8%) |
| $100,000+ | 22,372 (26.0%) | 11,646 (14.9%) |
| Total | 86,167 (100.0%) | 78,120 (100.0%) |
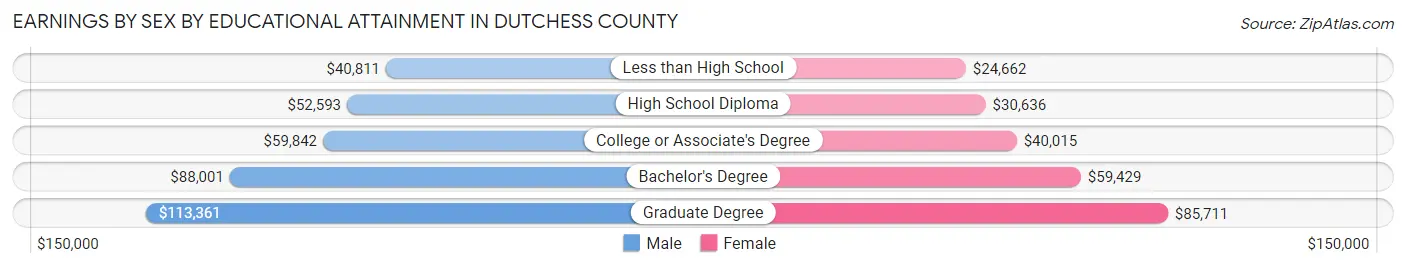
Earnings by Sex by Educational Attainment in Dutchess County
Average earnings in Dutchess County are $68,091 for men and $48,658 for women, a difference of 28.5%. Men with an educational attainment of graduate degree enjoy the highest average annual earnings of $113,361, while those with less than high school education earn the least with $40,811. Women with an educational attainment of graduate degree earn the most with the average annual earnings of $85,711, while those with less than high school education have the smallest earnings of $24,662.
| Educational Attainment | Male Income | Female Income |
| Less than High School | $40,811 | $24,662 |
| High School Diploma | $52,593 | $30,636 |
| College or Associate's Degree | $59,842 | $40,015 |
| Bachelor's Degree | $88,001 | $59,429 |
| Graduate Degree | $113,361 | $85,711 |
| Total | $68,091 | $48,658 |
Family Income in Dutchess County
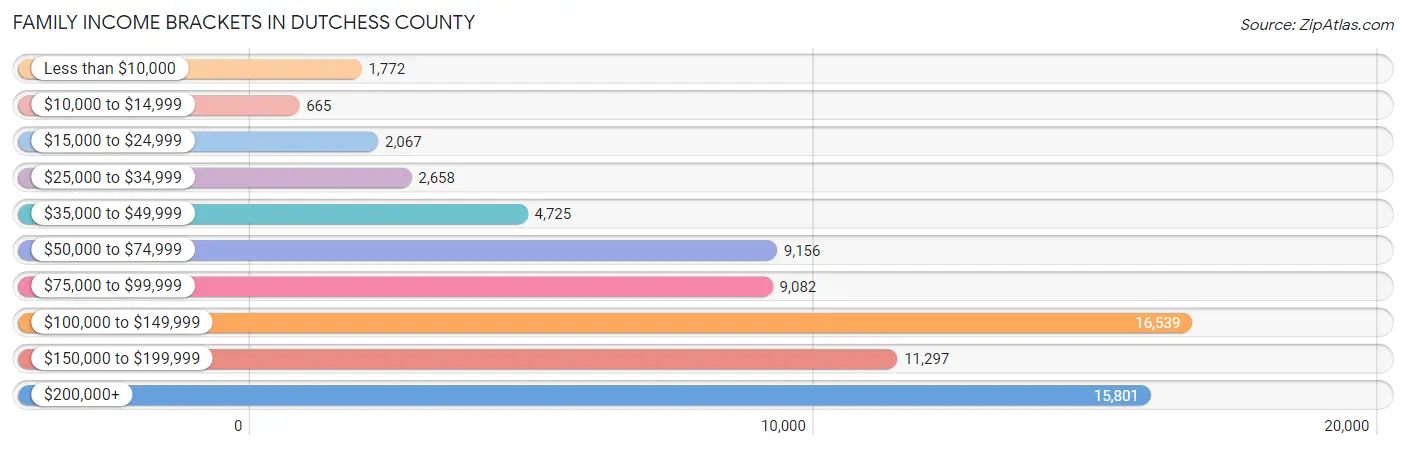
Family Income Brackets in Dutchess County
According to the Dutchess County family income data, there are 16,539 families falling into the $100,000 to $149,999 income range, which is the most common income bracket and makes up 22.4% of all families. Conversely, the $10,000 to $14,999 income bracket is the least frequent group with only 665 families (0.9%) belonging to this category.
| Income Bracket | # Families | % Families |
| Less than $10,000 | 1,772 | 2.4% |
| $10,000 to $14,999 | 665 | 0.9% |
| $15,000 to $24,999 | 2,067 | 2.8% |
| $25,000 to $34,999 | 2,658 | 3.6% |
| $35,000 to $49,999 | 4,725 | 6.4% |
| $50,000 to $74,999 | 9,156 | 12.4% |
| $75,000 to $99,999 | 9,082 | 12.3% |
| $100,000 to $149,999 | 16,539 | 22.4% |
| $150,000 to $199,999 | 11,297 | 15.3% |
| $200,000+ | 15,801 | 21.4% |
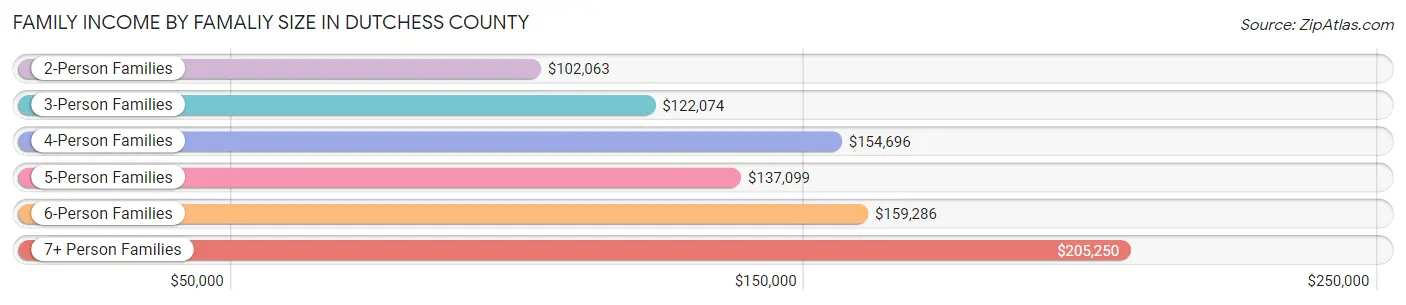
Family Income by Famaliy Size in Dutchess County
7+ person families (613 | 0.8%) account for the highest median family income in Dutchess County with $205,250 per family, while 2-person families (34,460 | 46.7%) have the highest median income of $51,032 per family member.
| Income Bracket | # Families | Median Income |
| 2-Person Families | 34,460 (46.7%) | $102,063 |
| 3-Person Families | 18,148 (24.6%) | $122,074 |
| 4-Person Families | 13,615 (18.4%) | $154,696 |
| 5-Person Families | 5,363 (7.3%) | $137,099 |
| 6-Person Families | 1,636 (2.2%) | $159,286 |
| 7+ Person Families | 613 (0.8%) | $205,250 |
| Total | 73,835 (100.0%) | $118,875 |
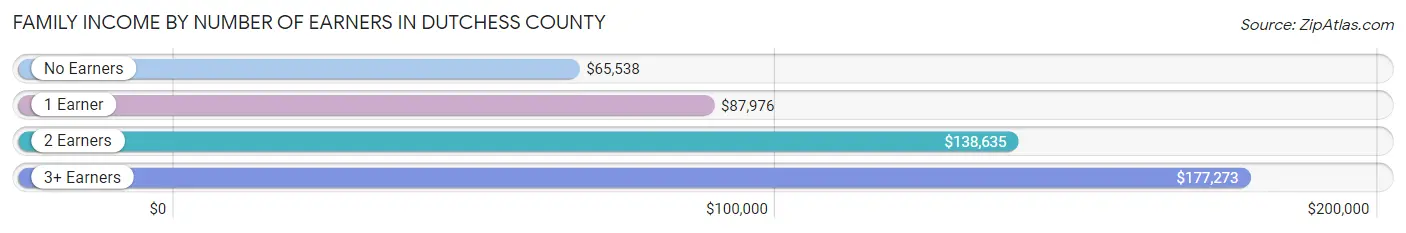
Family Income by Number of Earners in Dutchess County
The median family income in Dutchess County is $118,875, with families comprising 3+ earners (10,598) having the highest median family income of $177,273, while families with no earners (10,002) have the lowest median family income of $65,538, accounting for 14.3% and 13.6% of families, respectively.
| Number of Earners | # Families | Median Income |
| No Earners | 10,002 (13.6%) | $65,538 |
| 1 Earner | 20,881 (28.3%) | $87,976 |
| 2 Earners | 32,354 (43.8%) | $138,635 |
| 3+ Earners | 10,598 (14.3%) | $177,273 |
| Total | 73,835 (100.0%) | $118,875 |
Household Income in Dutchess County
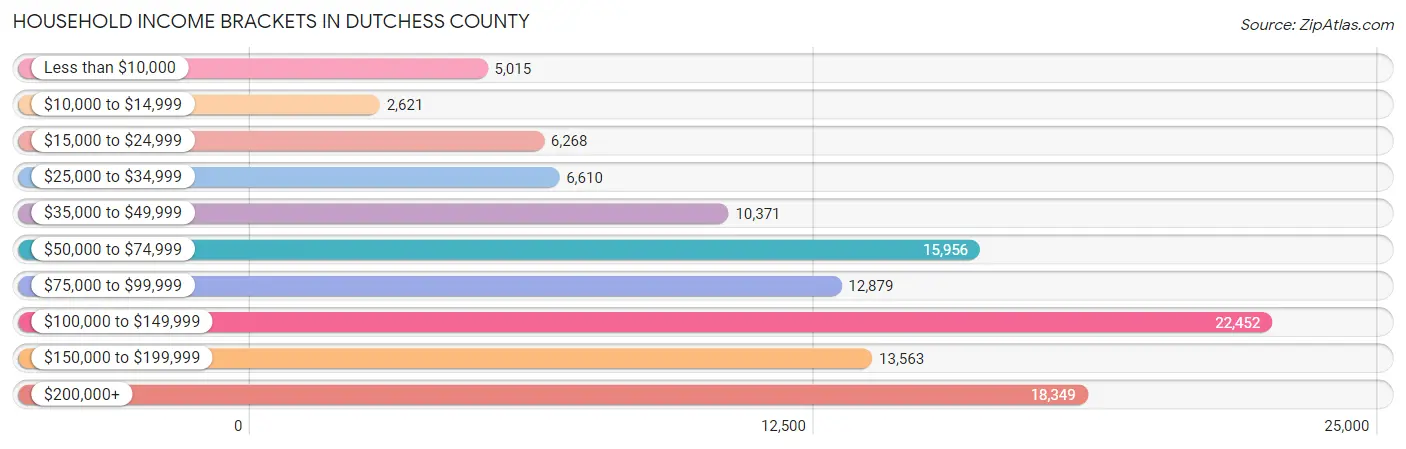
Household Income Brackets in Dutchess County
With 22,452 households falling in the category, the $100,000 to $149,999 income range is the most frequent in Dutchess County, accounting for 19.7% of all households. In contrast, only 2,621 households (2.3%) fall into the $10,000 to $14,999 income bracket, making it the least populous group.
| Income Bracket | # Households | % Households |
| Less than $10,000 | 5,015 | 4.4% |
| $10,000 to $14,999 | 2,621 | 2.3% |
| $15,000 to $24,999 | 6,268 | 5.5% |
| $25,000 to $34,999 | 6,610 | 5.8% |
| $35,000 to $49,999 | 10,371 | 9.1% |
| $50,000 to $74,999 | 15,956 | 14.0% |
| $75,000 to $99,999 | 12,879 | 11.3% |
| $100,000 to $149,999 | 22,452 | 19.7% |
| $150,000 to $199,999 | 13,563 | 11.9% |
| $200,000+ | 18,349 | 16.1% |
Household Income by Householder Age in Dutchess County
The median household income in Dutchess County is $94,578, with the highest median household income of $118,725 found in the 45 to 64 years age bracket for the primary householder. A total of 47,102 households (41.3%) fall into this category. Meanwhile, the 15 to 24 years age bracket for the primary householder has the lowest median household income of $48,851, with 1,913 households (1.7%) in this group.
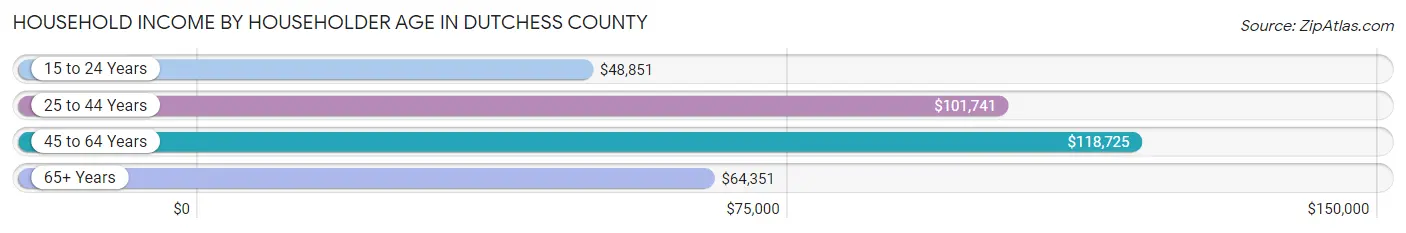
| Income Bracket | # Households | Median Income |
| 15 to 24 Years | 1,913 (1.7%) | $48,851 |
| 25 to 44 Years | 30,515 (26.8%) | $101,741 |
| 45 to 64 Years | 47,102 (41.3%) | $118,725 |
| 65+ Years | 34,442 (30.2%) | $64,351 |
| Total | 113,972 (100.0%) | $94,578 |
Poverty in Dutchess County
Income Below Poverty by Sex and Age in Dutchess County
With 7.9% poverty level for males and 9.2% for females among the residents of Dutchess County, 18 to 24 year old males and 18 to 24 year old females are the most vulnerable to poverty, with 1,626 males (13.5%) and 1,679 females (15.5%) in their respective age groups living below the poverty level.
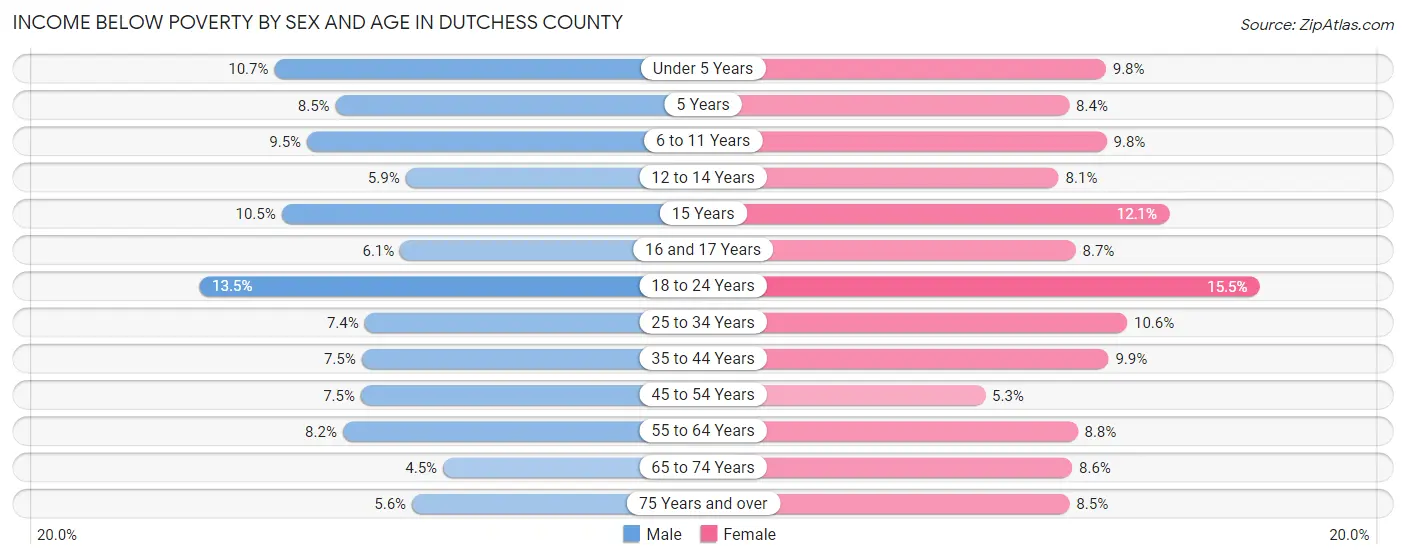
| Age Bracket | Male | Female |
| Under 5 Years | 719 (10.7%) | 634 (9.8%) |
| 5 Years | 132 (8.5%) | 122 (8.4%) |
| 6 to 11 Years | 842 (9.5%) | 873 (9.8%) |
| 12 to 14 Years | 297 (5.9%) | 350 (8.1%) |
| 15 Years | 210 (10.5%) | 224 (12.1%) |
| 16 and 17 Years | 212 (6.1%) | 295 (8.7%) |
| 18 to 24 Years | 1,626 (13.5%) | 1,679 (15.5%) |
| 25 to 34 Years | 1,283 (7.4%) | 1,775 (10.6%) |
| 35 to 44 Years | 1,284 (7.5%) | 1,693 (9.9%) |
| 45 to 54 Years | 1,454 (7.5%) | 1,049 (5.3%) |
| 55 to 64 Years | 1,805 (8.2%) | 1,967 (8.7%) |
| 65 to 74 Years | 661 (4.5%) | 1,378 (8.6%) |
| 75 Years and over | 518 (5.6%) | 1,083 (8.5%) |
| Total | 11,043 (7.9%) | 13,122 (9.2%) |
Income Above Poverty by Sex and Age in Dutchess County
According to the poverty statistics in Dutchess County, males aged 65 to 74 years and females aged 45 to 54 years are the age groups that are most secure financially, with 95.5% of males and 94.7% of females in these age groups living above the poverty line.
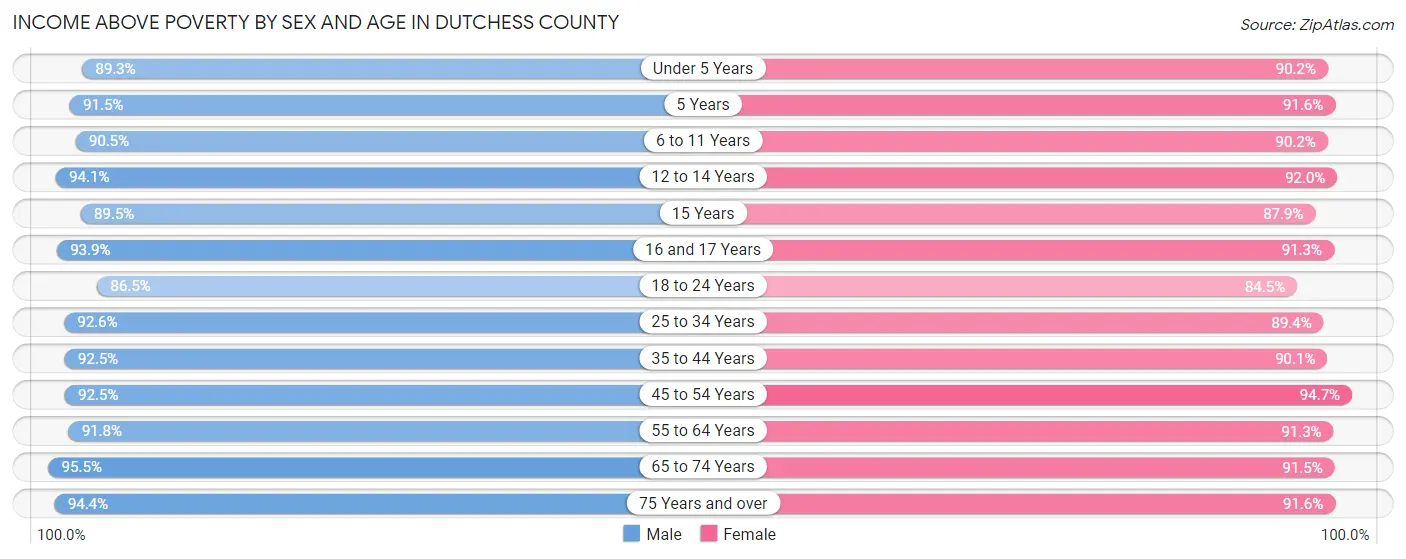
| Age Bracket | Male | Female |
| Under 5 Years | 5,981 (89.3%) | 5,838 (90.2%) |
| 5 Years | 1,428 (91.5%) | 1,324 (91.6%) |
| 6 to 11 Years | 8,005 (90.5%) | 8,012 (90.2%) |
| 12 to 14 Years | 4,773 (94.1%) | 4,000 (91.9%) |
| 15 Years | 1,798 (89.5%) | 1,621 (87.9%) |
| 16 and 17 Years | 3,289 (93.9%) | 3,105 (91.3%) |
| 18 to 24 Years | 10,405 (86.5%) | 9,155 (84.5%) |
| 25 to 34 Years | 16,104 (92.6%) | 14,984 (89.4%) |
| 35 to 44 Years | 15,851 (92.5%) | 15,415 (90.1%) |
| 45 to 54 Years | 17,875 (92.5%) | 18,669 (94.7%) |
| 55 to 64 Years | 20,235 (91.8%) | 20,510 (91.2%) |
| 65 to 74 Years | 14,113 (95.5%) | 14,744 (91.4%) |
| 75 Years and over | 8,694 (94.4%) | 11,741 (91.5%) |
| Total | 128,551 (92.1%) | 129,118 (90.8%) |
Income Below Poverty Among Married-Couple Families in Dutchess County
The poverty statistics for married-couple families in Dutchess County show that 2.5% or 1,422 of the total 56,960 families live below the poverty line. Families with 3 or 4 children have the highest poverty rate of 3.7%, comprising of 126 families. On the other hand, families with 5 or more children have the lowest poverty rate of 0.0%, which includes 0 families.
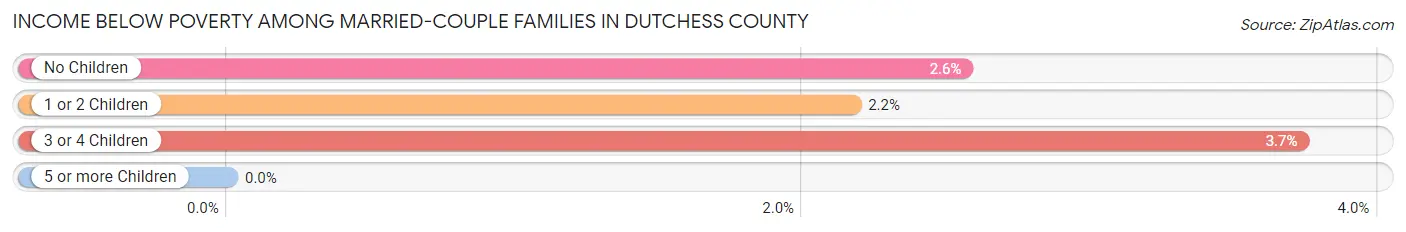
| Children | Above Poverty | Below Poverty |
| No Children | 34,171 (97.4%) | 897 (2.6%) |
| 1 or 2 Children | 17,994 (97.8%) | 399 (2.2%) |
| 3 or 4 Children | 3,255 (96.3%) | 126 (3.7%) |
| 5 or more Children | 118 (100.0%) | 0 (0.0%) |
| Total | 55,538 (97.5%) | 1,422 (2.5%) |
Income Below Poverty Among Single-Parent Households in Dutchess County
According to the poverty data in Dutchess County, 8.5% or 382 single-father households and 17.3% or 2,143 single-mother households are living below the poverty line. Among single-father households, those with 3 or 4 children have the highest poverty rate, with 23 households (12.6%) experiencing poverty. Likewise, among single-mother households, those with 5 or more children have the highest poverty rate, with 4 households (100.0%) falling below the poverty line.
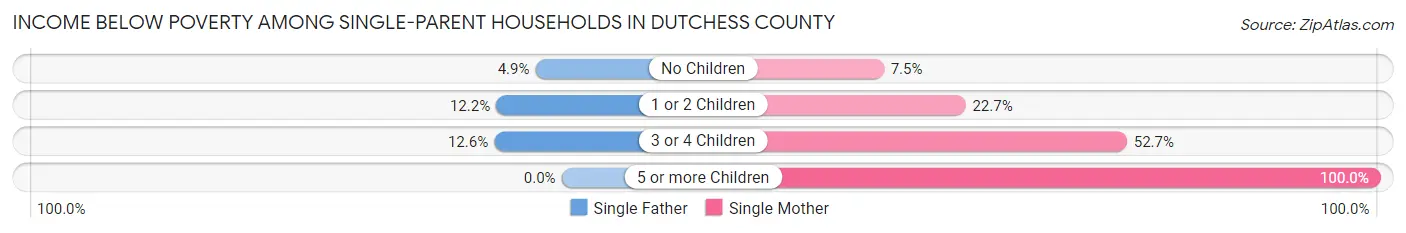
| Children | Single Father | Single Mother |
| No Children | 110 (4.9%) | 425 (7.5%) |
| 1 or 2 Children | 249 (12.2%) | 1,366 (22.7%) |
| 3 or 4 Children | 23 (12.6%) | 348 (52.7%) |
| 5 or more Children | 0 (0.0%) | 4 (100.0%) |
| Total | 382 (8.5%) | 2,143 (17.3%) |
Income Below Poverty Among Married-Couple vs Single-Parent Households in Dutchess County
The poverty data for Dutchess County shows that 1,422 of the married-couple family households (2.5%) and 2,525 of the single-parent households (15.0%) are living below the poverty level. Within the married-couple family households, those with 3 or 4 children have the highest poverty rate, with 126 households (3.7%) falling below the poverty line. Among the single-parent households, those with 3 or 4 children have the highest poverty rate, with 371 household (44.0%) living below poverty.
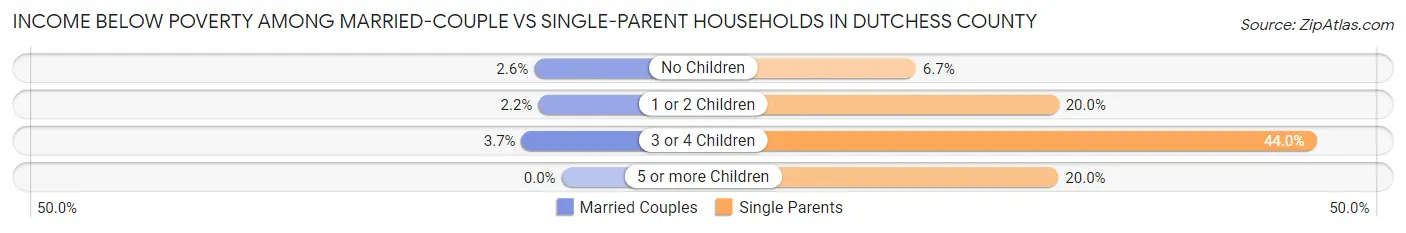
| Children | Married-Couple Families | Single-Parent Households |
| No Children | 897 (2.6%) | 535 (6.7%) |
| 1 or 2 Children | 399 (2.2%) | 1,615 (20.0%) |
| 3 or 4 Children | 126 (3.7%) | 371 (44.0%) |
| 5 or more Children | 0 (0.0%) | 4 (20.0%) |
| Total | 1,422 (2.5%) | 2,525 (15.0%) |
Race in Dutchess County
The most populous races in Dutchess County are White / Caucasian (217,242 | 73.3%), Hispanic or Latino (40,137 | 13.5%), and Black / African American (31,418 | 10.6%).
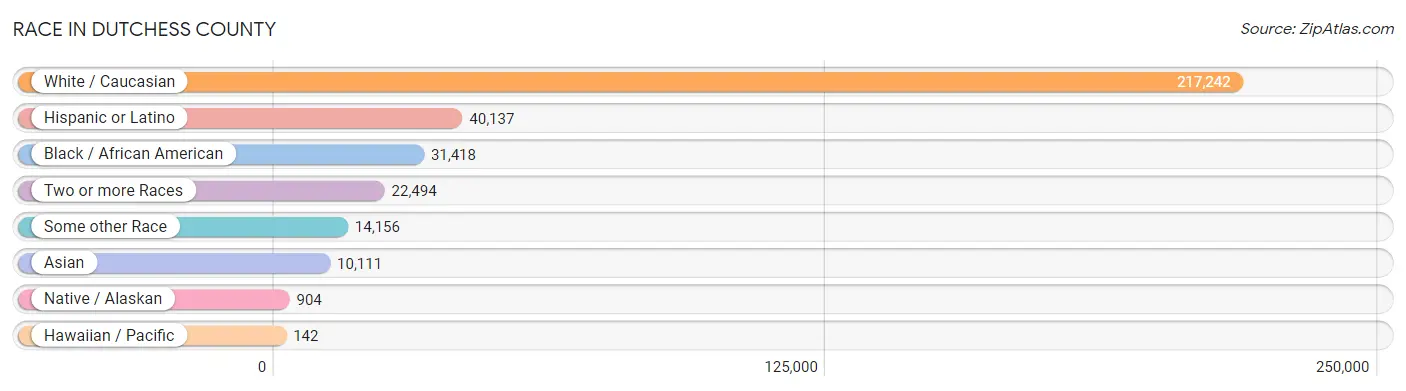
| Race | # Population | % Population |
| Asian | 10,111 | 3.4% |
| Black / African American | 31,418 | 10.6% |
| Hawaiian / Pacific | 142 | 0.1% |
| Hispanic or Latino | 40,137 | 13.5% |
| Native / Alaskan | 904 | 0.3% |
| White / Caucasian | 217,242 | 73.3% |
| Two or more Races | 22,494 | 7.6% |
| Some other Race | 14,156 | 4.8% |
| Total | 296,467 | 100.0% |
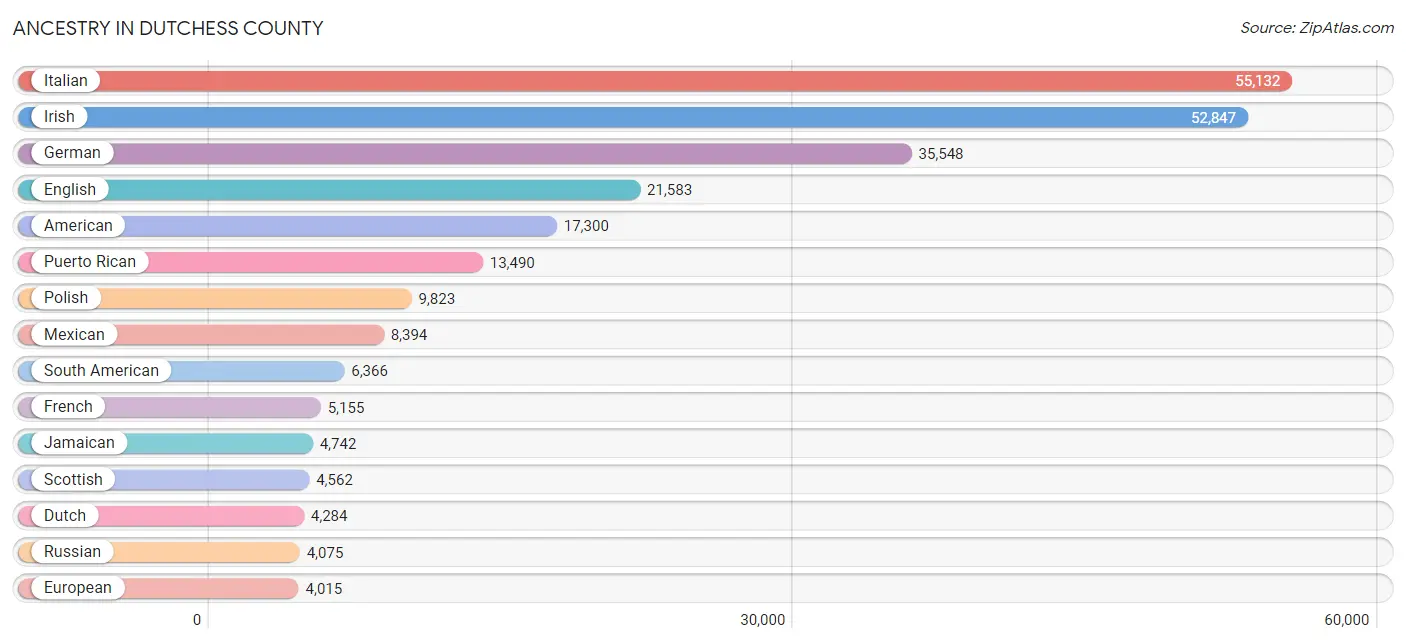
Ancestry in Dutchess County
The most populous ancestries reported in Dutchess County are Italian (55,132 | 18.6%), Irish (52,847 | 17.8%), German (35,548 | 12.0%), English (21,583 | 7.3%), and American (17,300 | 5.8%), together accounting for 61.5% of all Dutchess County residents.
| Ancestry | # Population | % Population |
| Afghan | 70 | 0.0% |
| African | 586 | 0.2% |
| Albanian | 745 | 0.3% |
| Alsatian | 21 | 0.0% |
| American | 17,300 | 5.8% |
| Apache | 9 | 0.0% |
| Arab | 1,748 | 0.6% |
| Argentinean | 562 | 0.2% |
| Armenian | 472 | 0.2% |
| Australian | 59 | 0.0% |
| Austrian | 757 | 0.3% |
| Bahamian | 1 | 0.0% |
| Barbadian | 183 | 0.1% |
| Basque | 87 | 0.0% |
| Belgian | 201 | 0.1% |
| Belizean | 41 | 0.0% |
| Bhutanese | 794 | 0.3% |
| Blackfeet | 163 | 0.1% |
| Bolivian | 90 | 0.0% |
| Brazilian | 580 | 0.2% |
| British | 1,464 | 0.5% |
| British West Indian | 867 | 0.3% |
| Bulgarian | 9 | 0.0% |
| Burmese | 1,593 | 0.5% |
| Cajun | 14 | 0.0% |
| Canadian | 773 | 0.3% |
| Carpatho Rusyn | 8 | 0.0% |
| Celtic | 39 | 0.0% |
| Central American | 3,260 | 1.1% |
| Central American Indian | 704 | 0.2% |
| Cherokee | 747 | 0.3% |
| Cheyenne | 197 | 0.1% |
| Chilean | 291 | 0.1% |
| Choctaw | 24 | 0.0% |
| Colombian | 1,534 | 0.5% |
| Costa Rican | 109 | 0.0% |
| Creek | 35 | 0.0% |
| Croatian | 369 | 0.1% |
| Cuban | 1,349 | 0.5% |
| Czech | 1,109 | 0.4% |
| Czechoslovakian | 314 | 0.1% |
| Danish | 889 | 0.3% |
| Delaware | 48 | 0.0% |
| Dominican | 3,954 | 1.3% |
| Dutch | 4,284 | 1.5% |
| Eastern European | 2,042 | 0.7% |
| Ecuadorian | 2,028 | 0.7% |
| Egyptian | 349 | 0.1% |
| English | 21,583 | 7.3% |
| Estonian | 133 | 0.0% |
| European | 4,015 | 1.3% |
| Filipino | 185 | 0.1% |
| Finnish | 274 | 0.1% |
| French | 5,155 | 1.7% |
| French American Indian | 38 | 0.0% |
| French Canadian | 1,905 | 0.6% |
| German | 35,548 | 12.0% |
| Ghanaian | 180 | 0.1% |
| Greek | 2,298 | 0.8% |
| Guamanian / Chamorro | 18 | 0.0% |
| Guatemalan | 1,551 | 0.5% |
| Guyanese | 808 | 0.3% |
| Haitian | 752 | 0.3% |
| Honduran | 414 | 0.1% |
| Hungarian | 2,450 | 0.8% |
| Icelander | 20 | 0.0% |
| Indian (Asian) | 3,751 | 1.3% |
| Indonesian | 57 | 0.0% |
| Inupiat | 103 | 0.0% |
| Iranian | 255 | 0.1% |
| Iraqi | 54 | 0.0% |
| Irish | 52,847 | 17.8% |
| Iroquois | 38 | 0.0% |
| Israeli | 345 | 0.1% |
| Italian | 55,132 | 18.6% |
| Jamaican | 4,742 | 1.6% |
| Japanese | 54 | 0.0% |
| Jordanian | 479 | 0.2% |
| Kenyan | 95 | 0.0% |
| Korean | 1,050 | 0.4% |
| Laotian | 112 | 0.0% |
| Latvian | 135 | 0.1% |
| Lebanese | 306 | 0.1% |
| Liberian | 34 | 0.0% |
| Lithuanian | 601 | 0.2% |
| Luxembourger | 46 | 0.0% |
| Macedonian | 47 | 0.0% |
| Maltese | 27 | 0.0% |
| Mexican | 8,394 | 2.8% |
| Mexican American Indian | 324 | 0.1% |
| Mongolian | 2 | 0.0% |
| Moroccan | 293 | 0.1% |
| Native Hawaiian | 50 | 0.0% |
| Navajo | 60 | 0.0% |
| Nicaraguan | 103 | 0.0% |
| Nigerian | 484 | 0.2% |
| Northern European | 314 | 0.1% |
| Norwegian | 2,093 | 0.7% |
| Pakistani | 30 | 0.0% |
| Palestinian | 41 | 0.0% |
| Panamanian | 756 | 0.3% |
| Paraguayan | 138 | 0.1% |
| Pennsylvania German | 51 | 0.0% |
| Peruvian | 1,334 | 0.4% |
| Polish | 9,823 | 3.3% |
| Portuguese | 1,501 | 0.5% |
| Puerto Rican | 13,490 | 4.5% |
| Romanian | 436 | 0.2% |
| Russian | 4,075 | 1.4% |
| Salvadoran | 327 | 0.1% |
| Samoan | 14 | 0.0% |
| Scandinavian | 568 | 0.2% |
| Scotch-Irish | 1,849 | 0.6% |
| Scottish | 4,562 | 1.5% |
| Serbian | 40 | 0.0% |
| Shoshone | 18 | 0.0% |
| Sioux | 29 | 0.0% |
| Slavic | 140 | 0.1% |
| Slovak | 898 | 0.3% |
| Slovene | 101 | 0.0% |
| Somali | 17 | 0.0% |
| South African | 155 | 0.1% |
| South American | 6,366 | 2.1% |
| South American Indian | 229 | 0.1% |
| Spaniard | 886 | 0.3% |
| Spanish | 551 | 0.2% |
| Sri Lankan | 518 | 0.2% |
| Subsaharan African | 1,653 | 0.6% |
| Swedish | 2,105 | 0.7% |
| Swiss | 935 | 0.3% |
| Syrian | 146 | 0.1% |
| Thai | 3,612 | 1.2% |
| Tongan | 26 | 0.0% |
| Trinidadian and Tobagonian | 224 | 0.1% |
| Turkish | 185 | 0.1% |
| U.S. Virgin Islander | 229 | 0.1% |
| Ugandan | 20 | 0.0% |
| Ukrainian | 1,519 | 0.5% |
| Uruguayan | 257 | 0.1% |
| Venezuelan | 89 | 0.0% |
| Vietnamese | 18 | 0.0% |
| Welsh | 1,133 | 0.4% |
| West Indian | 576 | 0.2% |
| Yugoslavian | 216 | 0.1% | View All 144 Rows |
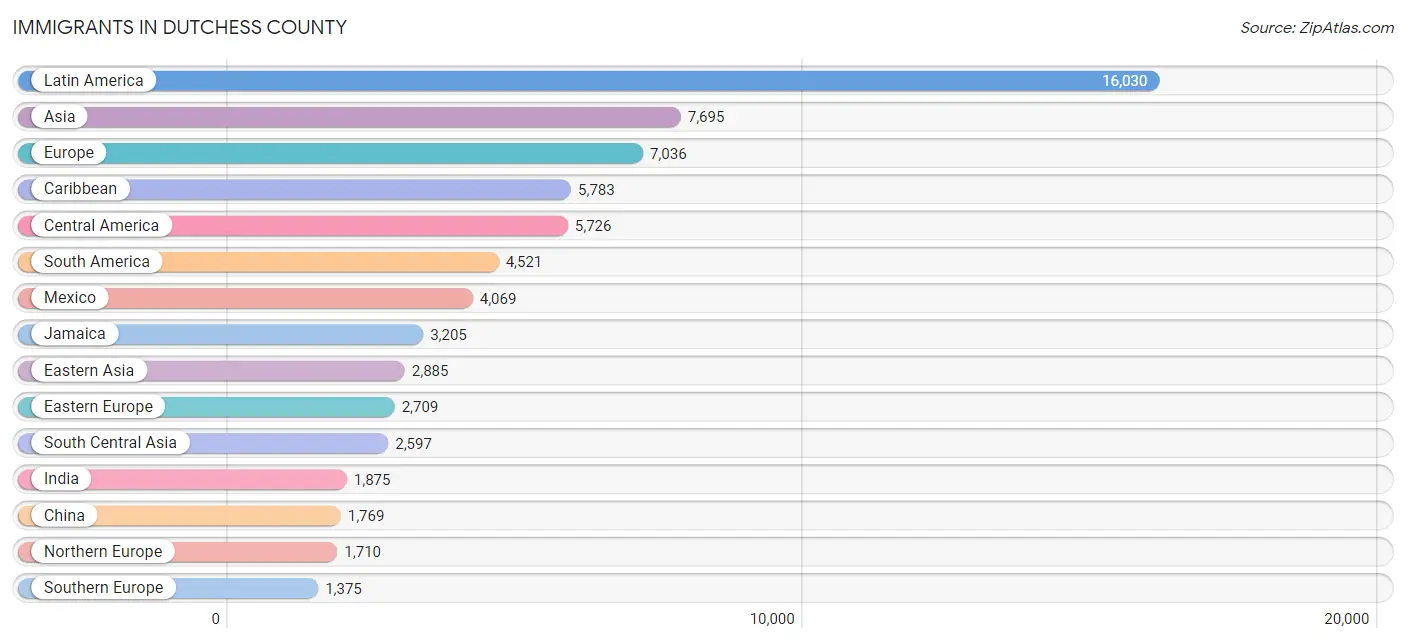
Immigrants in Dutchess County
The most numerous immigrant groups reported in Dutchess County came from Latin America (16,030 | 5.4%), Asia (7,695 | 2.6%), Europe (7,036 | 2.4%), Caribbean (5,783 | 1.9%), and Central America (5,726 | 1.9%), together accounting for 14.3% of all Dutchess County residents.
| Immigration Origin | # Population | % Population |
| Afghanistan | 85 | 0.0% |
| Africa | 1,224 | 0.4% |
| Albania | 117 | 0.0% |
| Argentina | 199 | 0.1% |
| Armenia | 25 | 0.0% |
| Asia | 7,695 | 2.6% |
| Australia | 127 | 0.0% |
| Austria | 75 | 0.0% |
| Bahamas | 115 | 0.0% |
| Bangladesh | 65 | 0.0% |
| Barbados | 175 | 0.1% |
| Belarus | 56 | 0.0% |
| Belgium | 26 | 0.0% |
| Belize | 5 | 0.0% |
| Bolivia | 91 | 0.0% |
| Bosnia and Herzegovina | 38 | 0.0% |
| Brazil | 221 | 0.1% |
| Cambodia | 25 | 0.0% |
| Cameroon | 10 | 0.0% |
| Canada | 904 | 0.3% |
| Caribbean | 5,783 | 1.9% |
| Central America | 5,726 | 1.9% |
| Chile | 43 | 0.0% |
| China | 1,769 | 0.6% |
| Colombia | 791 | 0.3% |
| Costa Rica | 67 | 0.0% |
| Croatia | 105 | 0.0% |
| Cuba | 62 | 0.0% |
| Czechoslovakia | 95 | 0.0% |
| Denmark | 48 | 0.0% |
| Dominica | 27 | 0.0% |
| Dominican Republic | 1,116 | 0.4% |
| Eastern Africa | 252 | 0.1% |
| Eastern Asia | 2,885 | 1.0% |
| Eastern Europe | 2,709 | 0.9% |
| Ecuador | 1,235 | 0.4% |
| Egypt | 225 | 0.1% |
| El Salvador | 220 | 0.1% |
| England | 482 | 0.2% |
| Europe | 7,036 | 2.4% |
| France | 169 | 0.1% |
| Germany | 835 | 0.3% |
| Ghana | 60 | 0.0% |
| Greece | 203 | 0.1% |
| Grenada | 76 | 0.0% |
| Guatemala | 779 | 0.3% |
| Guyana | 600 | 0.2% |
| Haiti | 398 | 0.1% |
| Honduras | 317 | 0.1% |
| Hong Kong | 280 | 0.1% |
| Hungary | 155 | 0.1% |
| India | 1,875 | 0.6% |
| Indonesia | 65 | 0.0% |
| Iran | 210 | 0.1% |
| Iraq | 42 | 0.0% |
| Ireland | 338 | 0.1% |
| Israel | 276 | 0.1% |
| Italy | 755 | 0.3% |
| Jamaica | 3,205 | 1.1% |
| Japan | 333 | 0.1% |
| Jordan | 407 | 0.1% |
| Kazakhstan | 8 | 0.0% |
| Kenya | 95 | 0.0% |
| Korea | 783 | 0.3% |
| Kuwait | 21 | 0.0% |
| Latin America | 16,030 | 5.4% |
| Latvia | 33 | 0.0% |
| Lebanon | 81 | 0.0% |
| Liberia | 12 | 0.0% |
| Lithuania | 13 | 0.0% |
| Malaysia | 63 | 0.0% |
| Mexico | 4,069 | 1.4% |
| Middle Africa | 15 | 0.0% |
| Moldova | 34 | 0.0% |
| Morocco | 158 | 0.1% |
| Nepal | 53 | 0.0% |
| Netherlands | 79 | 0.0% |
| Nicaragua | 26 | 0.0% |
| Nigeria | 222 | 0.1% |
| Northern Africa | 383 | 0.1% |
| Northern Europe | 1,710 | 0.6% |
| Norway | 14 | 0.0% |
| Oceania | 127 | 0.0% |
| Pakistan | 227 | 0.1% |
| Panama | 243 | 0.1% |
| Peru | 823 | 0.3% |
| Philippines | 587 | 0.2% |
| Poland | 704 | 0.2% |
| Portugal | 252 | 0.1% |
| Romania | 149 | 0.1% |
| Russia | 463 | 0.2% |
| Scotland | 119 | 0.0% |
| Serbia | 82 | 0.0% |
| Singapore | 8 | 0.0% |
| Somalia | 42 | 0.0% |
| South Africa | 177 | 0.1% |
| South America | 4,521 | 1.5% |
| South Central Asia | 2,597 | 0.9% |
| South Eastern Asia | 1,096 | 0.4% |
| Southern Europe | 1,375 | 0.5% |
| Spain | 165 | 0.1% |
| Sri Lanka | 46 | 0.0% |
| Sweden | 31 | 0.0% |
| Switzerland | 50 | 0.0% |
| Syria | 71 | 0.0% |
| Taiwan | 308 | 0.1% |
| Thailand | 30 | 0.0% |
| Trinidad and Tobago | 276 | 0.1% |
| Turkey | 87 | 0.0% |
| Uganda | 90 | 0.0% |
| Ukraine | 140 | 0.1% |
| Uruguay | 200 | 0.1% |
| Uzbekistan | 16 | 0.0% |
| Venezuela | 132 | 0.0% |
| Vietnam | 274 | 0.1% |
| Western Africa | 383 | 0.1% |
| Western Asia | 1,089 | 0.4% |
| Western Europe | 1,234 | 0.4% |
| Zaire | 5 | 0.0% | View All 119 Rows |
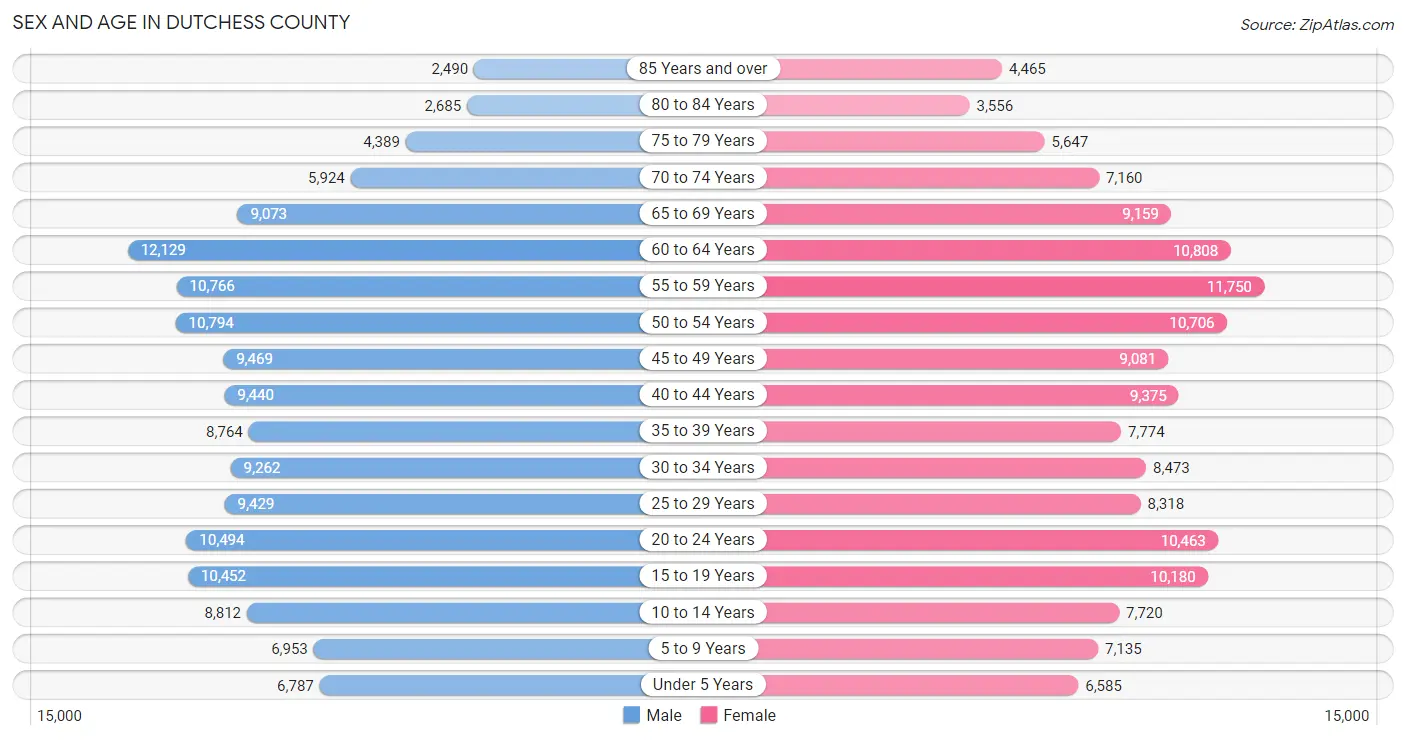
Sex and Age in Dutchess County
Sex and Age in Dutchess County
The most populous age groups in Dutchess County are 60 to 64 Years (12,129 | 8.2%) for men and 55 to 59 Years (11,750 | 7.9%) for women.
| Age Bracket | Male | Female |
| Under 5 Years | 6,787 (4.6%) | 6,585 (4.4%) |
| 5 to 9 Years | 6,953 (4.7%) | 7,135 (4.8%) |
| 10 to 14 Years | 8,812 (5.9%) | 7,720 (5.2%) |
| 15 to 19 Years | 10,452 (7.1%) | 10,180 (6.9%) |
| 20 to 24 Years | 10,494 (7.1%) | 10,463 (7.0%) |
| 25 to 29 Years | 9,429 (6.4%) | 8,318 (5.6%) |
| 30 to 34 Years | 9,262 (6.2%) | 8,473 (5.7%) |
| 35 to 39 Years | 8,764 (5.9%) | 7,774 (5.2%) |
| 40 to 44 Years | 9,440 (6.4%) | 9,375 (6.3%) |
| 45 to 49 Years | 9,469 (6.4%) | 9,081 (6.1%) |
| 50 to 54 Years | 10,794 (7.3%) | 10,706 (7.2%) |
| 55 to 59 Years | 10,766 (7.3%) | 11,750 (7.9%) |
| 60 to 64 Years | 12,129 (8.2%) | 10,808 (7.3%) |
| 65 to 69 Years | 9,073 (6.1%) | 9,159 (6.2%) |
| 70 to 74 Years | 5,924 (4.0%) | 7,160 (4.8%) |
| 75 to 79 Years | 4,389 (3.0%) | 5,647 (3.8%) |
| 80 to 84 Years | 2,685 (1.8%) | 3,556 (2.4%) |
| 85 Years and over | 2,490 (1.7%) | 4,465 (3.0%) |
| Total | 148,112 (100.0%) | 148,355 (100.0%) |
Families and Households in Dutchess County
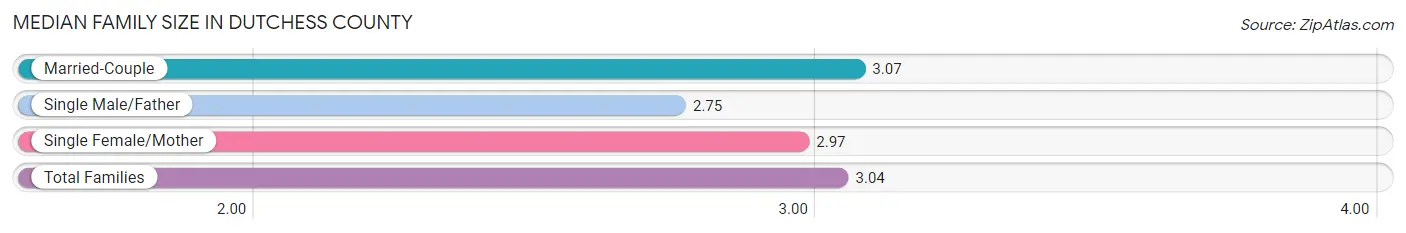
Median Family Size in Dutchess County
The median family size in Dutchess County is 3.04 persons per family, with married-couple families (56,960 | 77.1%) accounting for the largest median family size of 3.07 persons per family. On the other hand, single male/father families (4,497 | 6.1%) represent the smallest median family size with 2.75 persons per family.
| Family Type | # Families | Family Size |
| Married-Couple | 56,960 (77.1%) | 3.07 |
| Single Male/Father | 4,497 (6.1%) | 2.75 |
| Single Female/Mother | 12,378 (16.8%) | 2.97 |
| Total Families | 73,835 (100.0%) | 3.04 |
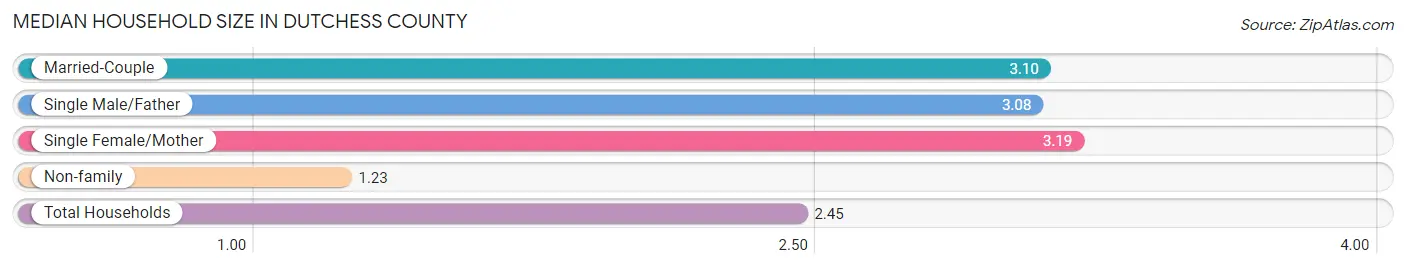
Median Household Size in Dutchess County
The median household size in Dutchess County is 2.45 persons per household, with single female/mother households (12,378 | 10.9%) accounting for the largest median household size of 3.19 persons per household. non-family households (40,137 | 35.2%) represent the smallest median household size with 1.23 persons per household.
| Household Type | # Households | Household Size |
| Married-Couple | 56,960 (50.0%) | 3.10 |
| Single Male/Father | 4,497 (4.0%) | 3.08 |
| Single Female/Mother | 12,378 (10.9%) | 3.19 |
| Non-family | 40,137 (35.2%) | 1.23 |
| Total Households | 113,972 (100.0%) | 2.45 |
Household Size by Marriage Status in Dutchess County
Out of a total of 113,972 households in Dutchess County, 73,835 (64.8%) are family households, while 40,137 (35.2%) are nonfamily households. The most numerous type of family households are 2-person households, comprising 32,512, and the most common type of nonfamily households are 1-person households, comprising 33,018.
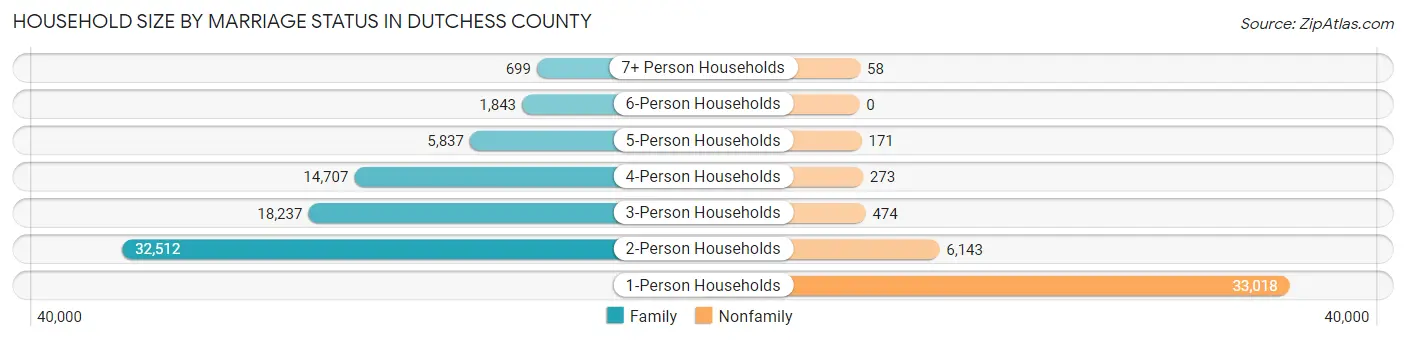
| Household Size | Family Households | Nonfamily Households |
| 1-Person Households | - | 33,018 (29.0%) |
| 2-Person Households | 32,512 (28.5%) | 6,143 (5.4%) |
| 3-Person Households | 18,237 (16.0%) | 474 (0.4%) |
| 4-Person Households | 14,707 (12.9%) | 273 (0.2%) |
| 5-Person Households | 5,837 (5.1%) | 171 (0.2%) |
| 6-Person Households | 1,843 (1.6%) | 0 (0.0%) |
| 7+ Person Households | 699 (0.6%) | 58 (0.1%) |
| Total | 73,835 (64.8%) | 40,137 (35.2%) |
Female Fertility in Dutchess County
Fertility by Age in Dutchess County
Average fertility rate in Dutchess County is 52.0 births per 1,000 women. Women in the age bracket of 20 to 34 years have the highest fertility rate with 76.0 births per 1,000 women. Women in the age bracket of 20 to 34 years acount for 60.8% of all women with births.
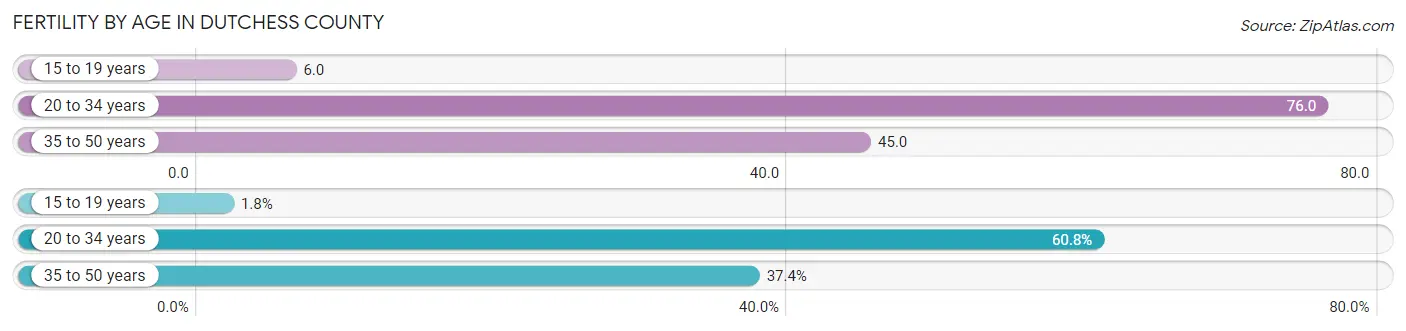
| Age Bracket | Women with Births | Births / 1,000 Women |
| 15 to 19 years | 60 (1.8%) | 6.0 |
| 20 to 34 years | 2,069 (60.8%) | 76.0 |
| 35 to 50 years | 1,274 (37.4%) | 45.0 |
| Total | 3,403 (100.0%) | 52.0 |
Fertility by Age by Marriage Status in Dutchess County
75.8% of women with births (3,403) in Dutchess County are married. The highest percentage of unmarried women with births falls into 15 to 19 years age bracket with 100.0% of them unmarried at the time of birth, while the lowest percentage of unmarried women with births belong to 35 to 50 years age bracket with 19.0% of them unmarried.
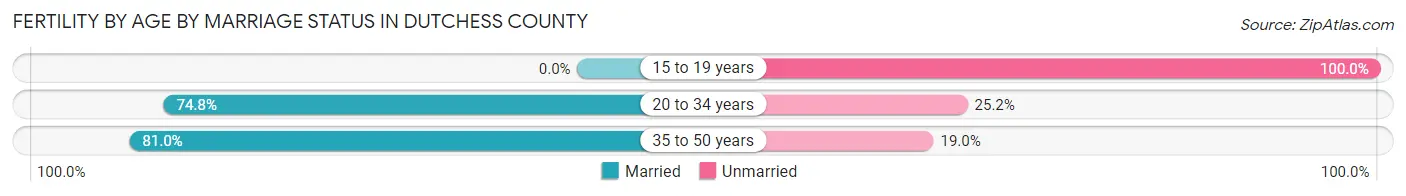
| Age Bracket | Married | Unmarried |
| 15 to 19 years | 0 (0.0%) | 60 (100.0%) |
| 20 to 34 years | 1,548 (74.8%) | 521 (25.2%) |
| 35 to 50 years | 1,032 (81.0%) | 242 (19.0%) |
| Total | 2,579 (75.8%) | 824 (24.2%) |
Fertility by Education in Dutchess County
Average fertility rate in Dutchess County is 52.0 births per 1,000 women. Women with the education attainment of graduate degree have the highest fertility rate of 72.0 births per 1,000 women, while women with the education attainment of less than high school have the lowest fertility at 18.0 births per 1,000 women. Women with the education attainment of bachelor's degree represent 27.2% of all women with births.
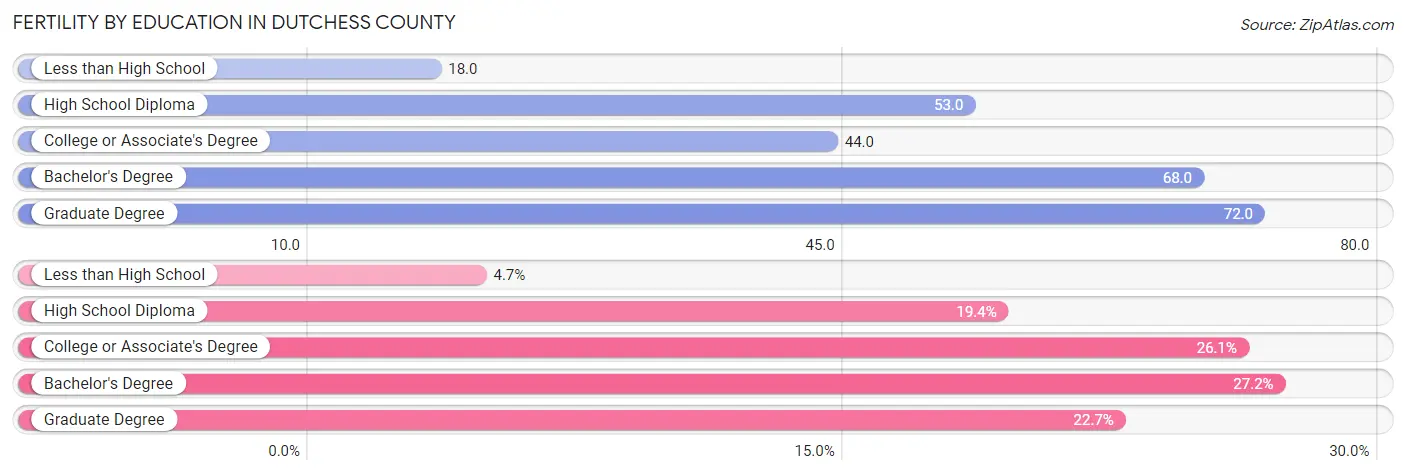
| Educational Attainment | Women with Births | Births / 1,000 Women |
| Less than High School | 160 (4.7%) | 18.0 |
| High School Diploma | 659 (19.4%) | 53.0 |
| College or Associate's Degree | 889 (26.1%) | 44.0 |
| Bachelor's Degree | 924 (27.2%) | 68.0 |
| Graduate Degree | 771 (22.7%) | 72.0 |
| Total | 3,403 (100.0%) | 52.0 |
Fertility by Education by Marriage Status in Dutchess County
24.2% of women with births in Dutchess County are unmarried. Women with the educational attainment of bachelor's degree are most likely to be married with 93.2% of them married at childbirth, while women with the educational attainment of less than high school are least likely to be married with 80.6% of them unmarried at childbirth.
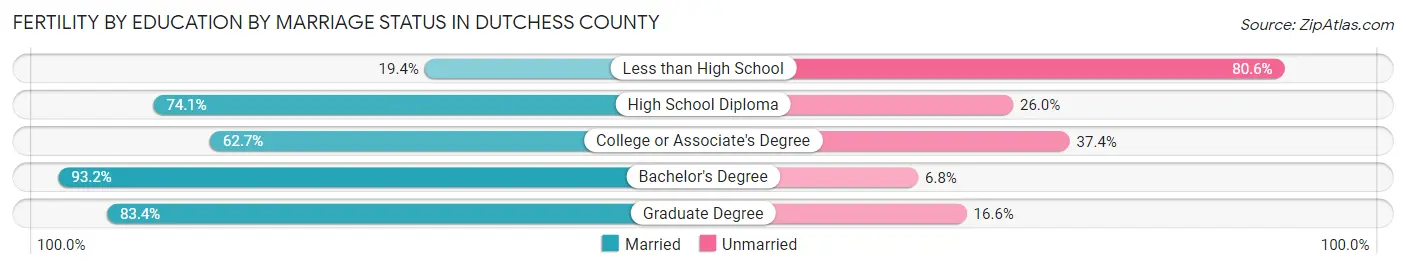
| Educational Attainment | Married | Unmarried |
| Less than High School | 31 (19.4%) | 129 (80.6%) |
| High School Diploma | 488 (74.1%) | 171 (26.0%) |
| College or Associate's Degree | 557 (62.6%) | 332 (37.3%) |
| Bachelor's Degree | 861 (93.2%) | 63 (6.8%) |
| Graduate Degree | 643 (83.4%) | 128 (16.6%) |
| Total | 2,579 (75.8%) | 824 (24.2%) |
Employment Characteristics in Dutchess County
Employment by Class of Employer in Dutchess County
Among the 145,279 employed individuals in Dutchess County, private company employees (88,272 | 60.8%), not-for-profit organizations (17,974 | 12.4%), and local government employees (14,640 | 10.1%) make up the most common classes of employment.
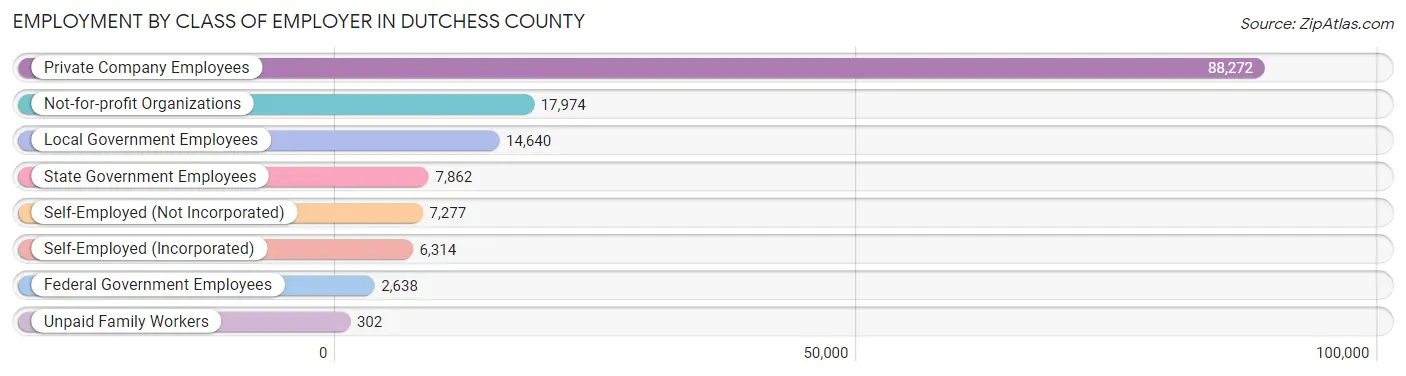
| Employer Class | # Employees | % Employees |
| Private Company Employees | 88,272 | 60.8% |
| Self-Employed (Incorporated) | 6,314 | 4.3% |
| Self-Employed (Not Incorporated) | 7,277 | 5.0% |
| Not-for-profit Organizations | 17,974 | 12.4% |
| Local Government Employees | 14,640 | 10.1% |
| State Government Employees | 7,862 | 5.4% |
| Federal Government Employees | 2,638 | 1.8% |
| Unpaid Family Workers | 302 | 0.2% |
| Total | 145,279 | 100.0% |
Employment Status by Age in Dutchess County
According to the labor force statistics for Dutchess County, out of the total population over 16 years of age (248,587), 62.8% or 156,113 individuals are in the labor force, with 5.0% or 7,806 of them unemployed. The age group with the highest labor force participation rate is 25 to 29 years, with 86.6% or 15,369 individuals in the labor force. Within the labor force, the 16 to 19 years age range has the highest percentage of unemployed individuals, with 11.4% or 649 of them being unemployed.
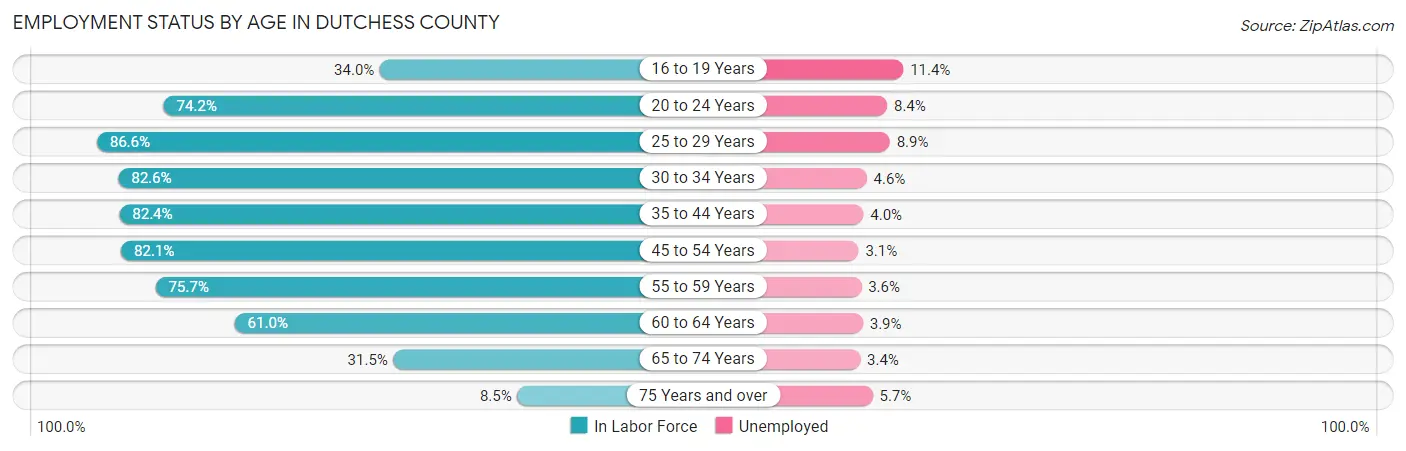
| Age Bracket | In Labor Force | Unemployed |
| 16 to 19 Years | 5,693 (34.0%) | 649 (11.4%) |
| 20 to 24 Years | 15,550 (74.2%) | 1,306 (8.4%) |
| 25 to 29 Years | 15,369 (86.6%) | 1,368 (8.9%) |
| 30 to 34 Years | 14,649 (82.6%) | 674 (4.6%) |
| 35 to 44 Years | 29,131 (82.4%) | 1,165 (4.0%) |
| 45 to 54 Years | 32,881 (82.1%) | 1,019 (3.1%) |
| 55 to 59 Years | 17,045 (75.7%) | 614 (3.6%) |
| 60 to 64 Years | 13,992 (61.0%) | 546 (3.9%) |
| 65 to 74 Years | 9,865 (31.5%) | 335 (3.4%) |
| 75 Years and over | 1,975 (8.5%) | 113 (5.7%) |
| Total | 156,113 (62.8%) | 7,806 (5.0%) |
Employment Status by Educational Attainment in Dutchess County
According to labor force statistics for Dutchess County, 78.7% of individuals (123,038) out of the total population between 25 and 64 years of age (156,338) are in the labor force, with 4.4% or 5,414 of them being unemployed. The group with the highest labor force participation rate are those with the educational attainment of bachelor's degree or higher, with 85.9% or 54,105 individuals in the labor force. Within the labor force, individuals with high school diploma education have the highest percentage of unemployment, with 6.1% or 1,740 of them being unemployed.
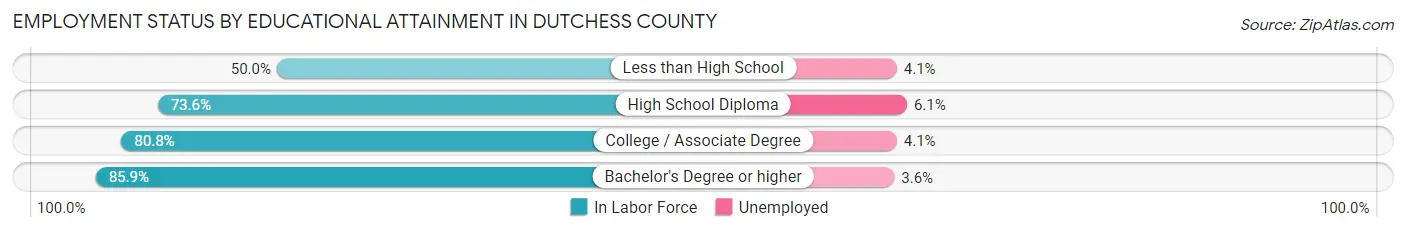
| Educational Attainment | In Labor Force | Unemployed |
| Less than High School | 5,992 (50.0%) | 491 (4.1%) |
| High School Diploma | 28,524 (73.6%) | 2,364 (6.1%) |
| College / Associate Degree | 34,431 (80.8%) | 1,747 (4.1%) |
| Bachelor's Degree or higher | 54,105 (85.9%) | 2,267 (3.6%) |
| Total | 123,038 (78.7%) | 6,879 (4.4%) |
Employment Occupations by Sex in Dutchess County
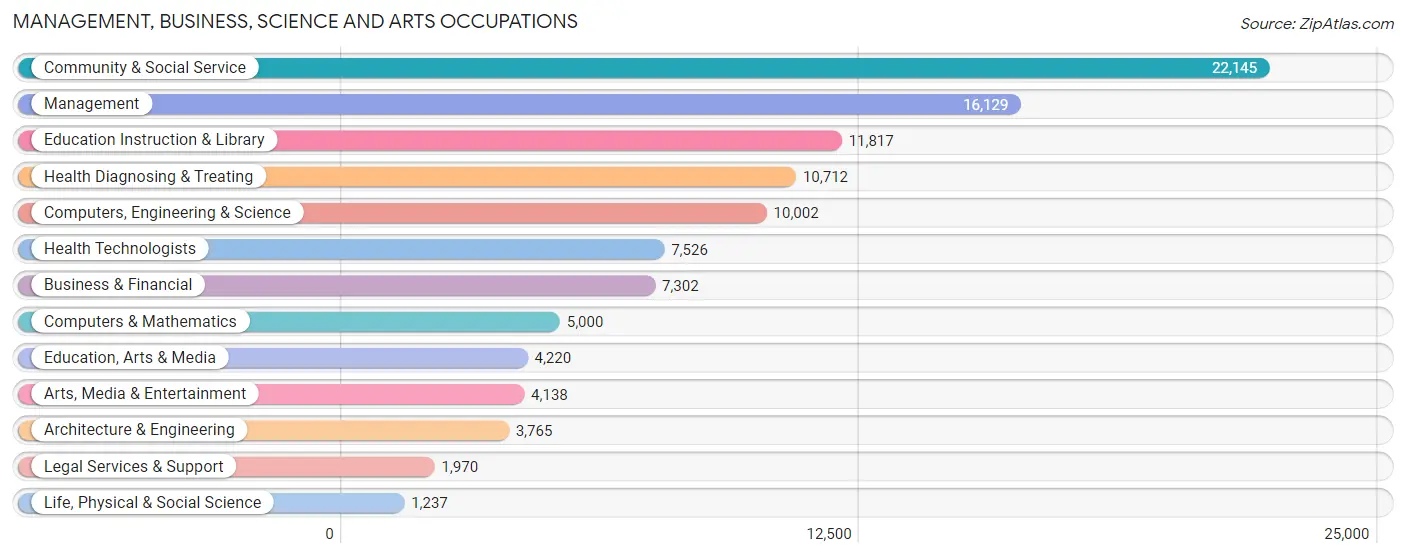
Management, Business, Science and Arts Occupations
The most common Management, Business, Science and Arts occupations in Dutchess County are Community & Social Service (22,145 | 14.9%), Management (16,129 | 10.9%), Education Instruction & Library (11,817 | 8.0%), Health Diagnosing & Treating (10,712 | 7.2%), and Computers, Engineering & Science (10,002 | 6.8%).
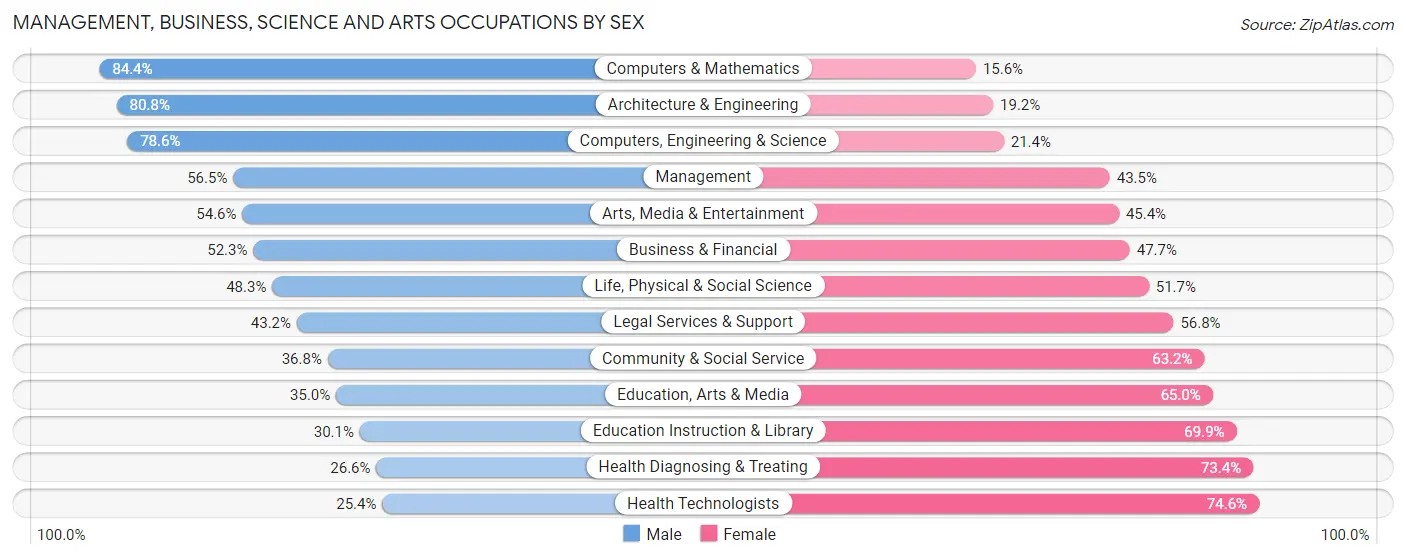
Management, Business, Science and Arts Occupations by Sex
Within the Management, Business, Science and Arts occupations in Dutchess County, the most male-oriented occupations are Computers & Mathematics (84.4%), Architecture & Engineering (80.8%), and Computers, Engineering & Science (78.6%), while the most female-oriented occupations are Health Technologists (74.6%), Health Diagnosing & Treating (73.4%), and Education Instruction & Library (69.9%).
| Occupation | Male | Female |
| Management | 9,109 (56.5%) | 7,020 (43.5%) |
| Business & Financial | 3,819 (52.3%) | 3,483 (47.7%) |
| Computers, Engineering & Science | 7,861 (78.6%) | 2,141 (21.4%) |
| Computers & Mathematics | 4,220 (84.4%) | 780 (15.6%) |
| Architecture & Engineering | 3,043 (80.8%) | 722 (19.2%) |
| Life, Physical & Social Science | 598 (48.3%) | 639 (51.7%) |
| Community & Social Service | 8,141 (36.8%) | 14,004 (63.2%) |
| Education, Arts & Media | 1,478 (35.0%) | 2,742 (65.0%) |
| Legal Services & Support | 851 (43.2%) | 1,119 (56.8%) |
| Education Instruction & Library | 3,554 (30.1%) | 8,263 (69.9%) |
| Arts, Media & Entertainment | 2,258 (54.6%) | 1,880 (45.4%) |
| Health Diagnosing & Treating | 2,852 (26.6%) | 7,860 (73.4%) |
| Health Technologists | 1,910 (25.4%) | 5,616 (74.6%) |
| Total (Category) | 31,782 (47.9%) | 34,508 (52.1%) |
| Total (Overall) | 77,444 (52.3%) | 70,665 (47.7%) |
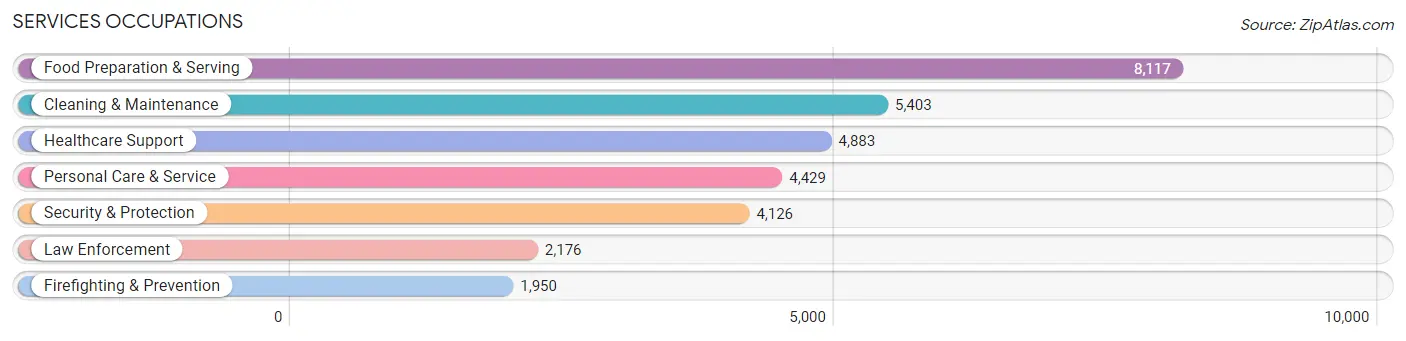
Services Occupations
The most common Services occupations in Dutchess County are Food Preparation & Serving (8,117 | 5.5%), Cleaning & Maintenance (5,403 | 3.6%), Healthcare Support (4,883 | 3.3%), Personal Care & Service (4,429 | 3.0%), and Security & Protection (4,126 | 2.8%).
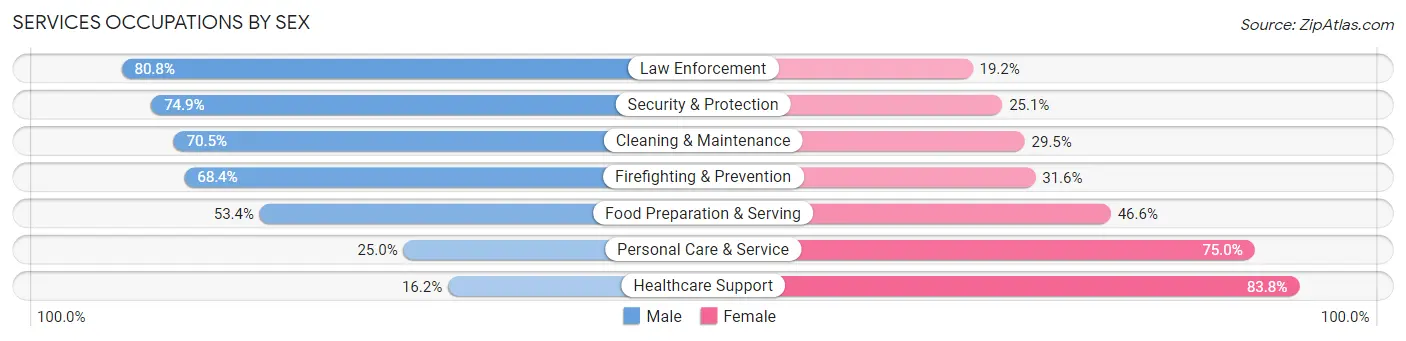
Services Occupations by Sex
Within the Services occupations in Dutchess County, the most male-oriented occupations are Law Enforcement (80.8%), Security & Protection (74.9%), and Cleaning & Maintenance (70.5%), while the most female-oriented occupations are Healthcare Support (83.8%), Personal Care & Service (75.0%), and Food Preparation & Serving (46.6%).
| Occupation | Male | Female |
| Healthcare Support | 789 (16.2%) | 4,094 (83.8%) |
| Security & Protection | 3,091 (74.9%) | 1,035 (25.1%) |
| Firefighting & Prevention | 1,333 (68.4%) | 617 (31.6%) |
| Law Enforcement | 1,758 (80.8%) | 418 (19.2%) |
| Food Preparation & Serving | 4,337 (53.4%) | 3,780 (46.6%) |
| Cleaning & Maintenance | 3,808 (70.5%) | 1,595 (29.5%) |
| Personal Care & Service | 1,106 (25.0%) | 3,323 (75.0%) |
| Total (Category) | 13,131 (48.7%) | 13,827 (51.3%) |
| Total (Overall) | 77,444 (52.3%) | 70,665 (47.7%) |
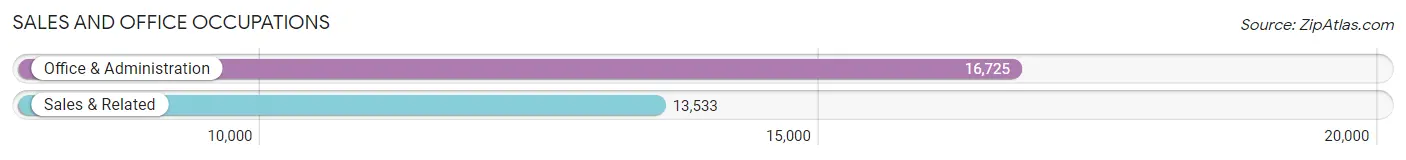
Sales and Office Occupations
The most common Sales and Office occupations in Dutchess County are Office & Administration (16,725 | 11.3%), and Sales & Related (13,533 | 9.1%).
Sales and Office Occupations by Sex
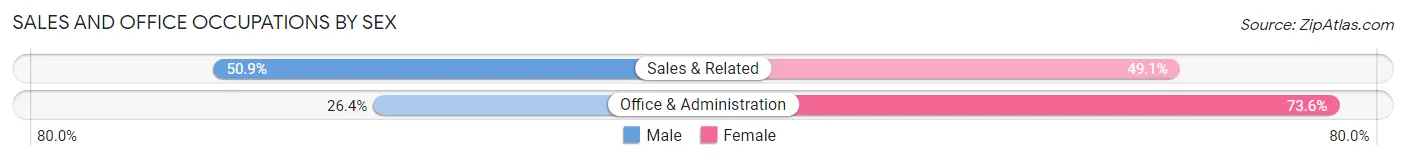
| Occupation | Male | Female |
| Sales & Related | 6,893 (50.9%) | 6,640 (49.1%) |
| Office & Administration | 4,414 (26.4%) | 12,311 (73.6%) |
| Total (Category) | 11,307 (37.4%) | 18,951 (62.6%) |
| Total (Overall) | 77,444 (52.3%) | 70,665 (47.7%) |
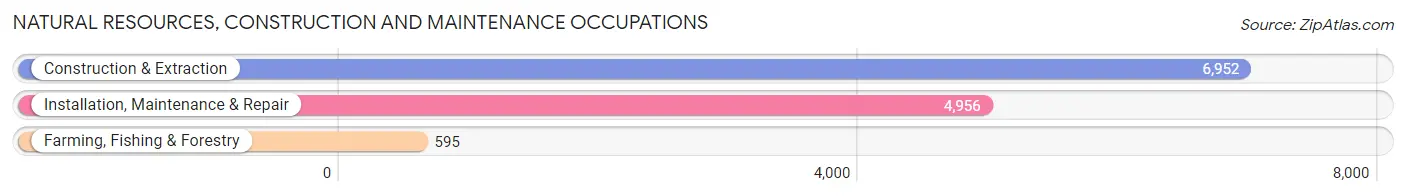
Natural Resources, Construction and Maintenance Occupations
The most common Natural Resources, Construction and Maintenance occupations in Dutchess County are Construction & Extraction (6,952 | 4.7%), Installation, Maintenance & Repair (4,956 | 3.4%), and Farming, Fishing & Forestry (595 | 0.4%).
Natural Resources, Construction and Maintenance Occupations by Sex
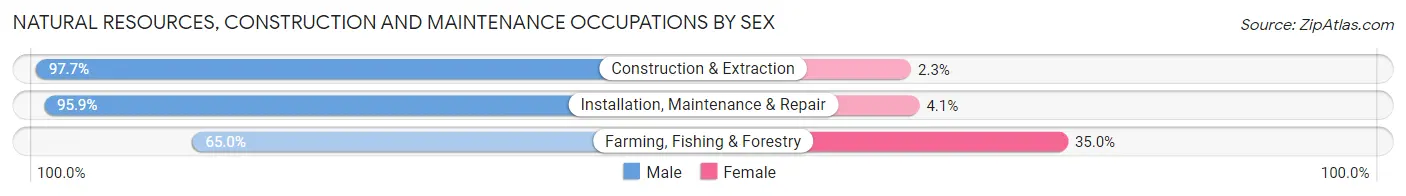
| Occupation | Male | Female |
| Farming, Fishing & Forestry | 387 (65.0%) | 208 (35.0%) |
| Construction & Extraction | 6,790 (97.7%) | 162 (2.3%) |
| Installation, Maintenance & Repair | 4,755 (95.9%) | 201 (4.1%) |
| Total (Category) | 11,932 (95.4%) | 571 (4.6%) |
| Total (Overall) | 77,444 (52.3%) | 70,665 (47.7%) |
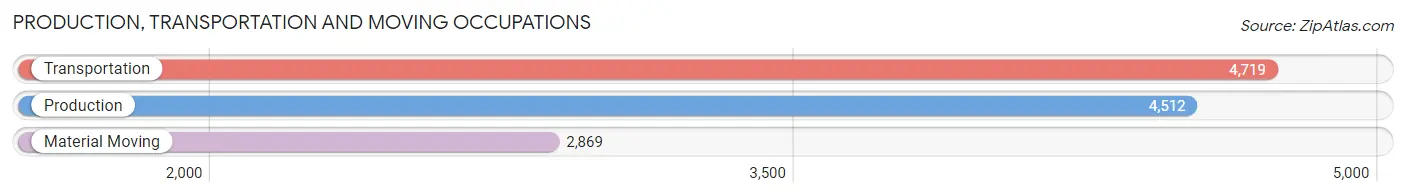
Production, Transportation and Moving Occupations
The most common Production, Transportation and Moving occupations in Dutchess County are Transportation (4,719 | 3.2%), Production (4,512 | 3.0%), and Material Moving (2,869 | 1.9%).
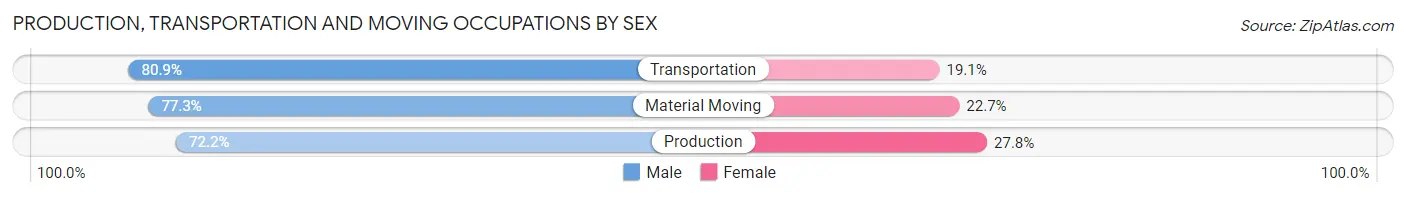
Production, Transportation and Moving Occupations by Sex
| Occupation | Male | Female |
| Production | 3,257 (72.2%) | 1,255 (27.8%) |
| Transportation | 3,818 (80.9%) | 901 (19.1%) |
| Material Moving | 2,217 (77.3%) | 652 (22.7%) |
| Total (Category) | 9,292 (76.8%) | 2,808 (23.2%) |
| Total (Overall) | 77,444 (52.3%) | 70,665 (47.7%) |
Employment Industries by Sex in Dutchess County
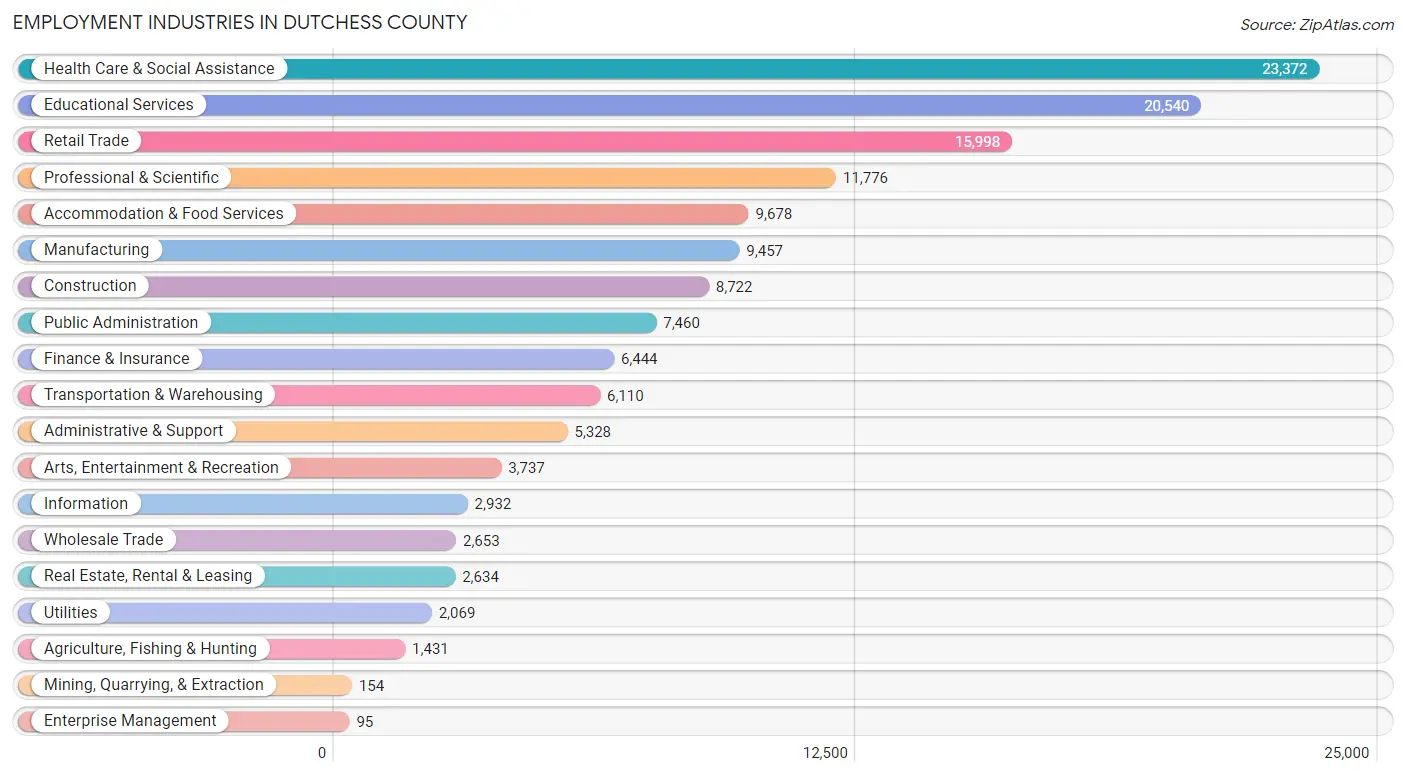
Employment Industries in Dutchess County
The major employment industries in Dutchess County include Health Care & Social Assistance (23,372 | 15.8%), Educational Services (20,540 | 13.9%), Retail Trade (15,998 | 10.8%), Professional & Scientific (11,776 | 8.0%), and Accommodation & Food Services (9,678 | 6.5%).
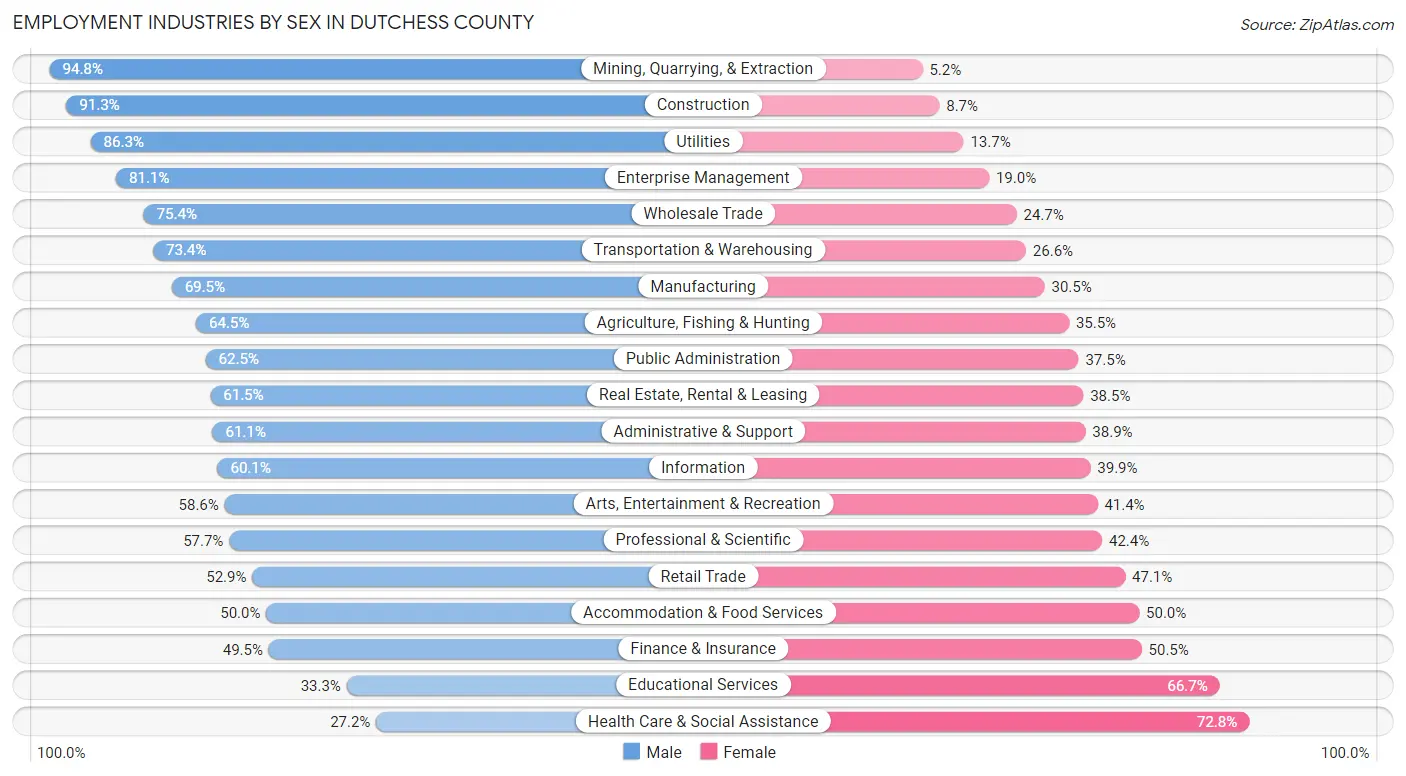
Employment Industries by Sex in Dutchess County
The Dutchess County industries that see more men than women are Mining, Quarrying, & Extraction (94.8%), Construction (91.3%), and Utilities (86.3%), whereas the industries that tend to have a higher number of women are Health Care & Social Assistance (72.8%), Educational Services (66.7%), and Finance & Insurance (50.5%).
| Industry | Male | Female |
| Agriculture, Fishing & Hunting | 923 (64.5%) | 508 (35.5%) |
| Mining, Quarrying, & Extraction | 146 (94.8%) | 8 (5.2%) |
| Construction | 7,967 (91.3%) | 755 (8.7%) |
| Manufacturing | 6,576 (69.5%) | 2,881 (30.5%) |
| Wholesale Trade | 1,999 (75.3%) | 654 (24.6%) |
| Retail Trade | 8,458 (52.9%) | 7,540 (47.1%) |
| Transportation & Warehousing | 4,485 (73.4%) | 1,625 (26.6%) |
| Utilities | 1,786 (86.3%) | 283 (13.7%) |
| Information | 1,761 (60.1%) | 1,171 (39.9%) |
| Finance & Insurance | 3,187 (49.5%) | 3,257 (50.5%) |
| Real Estate, Rental & Leasing | 1,621 (61.5%) | 1,013 (38.5%) |
| Professional & Scientific | 6,789 (57.7%) | 4,987 (42.3%) |
| Enterprise Management | 77 (81.0%) | 18 (19.0%) |
| Administrative & Support | 3,255 (61.1%) | 2,073 (38.9%) |
| Educational Services | 6,846 (33.3%) | 13,694 (66.7%) |
| Health Care & Social Assistance | 6,362 (27.2%) | 17,010 (72.8%) |
| Arts, Entertainment & Recreation | 2,190 (58.6%) | 1,547 (41.4%) |
| Accommodation & Food Services | 4,836 (50.0%) | 4,842 (50.0%) |
| Public Administration | 4,664 (62.5%) | 2,796 (37.5%) |
| Total | 77,444 (52.3%) | 70,665 (47.7%) |
Education in Dutchess County
School Enrollment in Dutchess County
The most common levels of schooling among the 68,574 students in Dutchess County are college / undergraduate (20,119 | 29.3%), high school (15,022 | 21.9%), and middle school (12,920 | 18.8%).
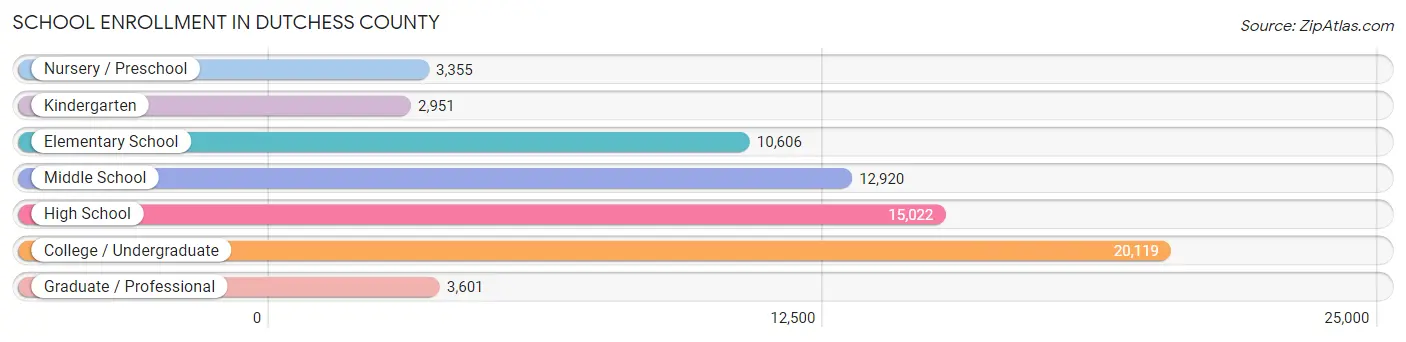
| School Level | # Students | % Students |
| Nursery / Preschool | 3,355 | 4.9% |
| Kindergarten | 2,951 | 4.3% |
| Elementary School | 10,606 | 15.5% |
| Middle School | 12,920 | 18.8% |
| High School | 15,022 | 21.9% |
| College / Undergraduate | 20,119 | 29.3% |
| Graduate / Professional | 3,601 | 5.2% |
| Total | 68,574 | 100.0% |
School Enrollment by Age by Funding Source in Dutchess County
Out of a total of 68,574 students who are enrolled in schools in Dutchess County, 20,024 (29.2%) attend a private institution, while the remaining 48,550 (70.8%) are enrolled in public schools. The age group of 18 to 19 year olds has the highest likelihood of being enrolled in private schools, with 4,569 (56.6% in the age bracket) enrolled. Conversely, the age group of 10 to 14 year olds has the lowest likelihood of being enrolled in a private school, with 14,581 (89.5% in the age bracket) attending a public institution.
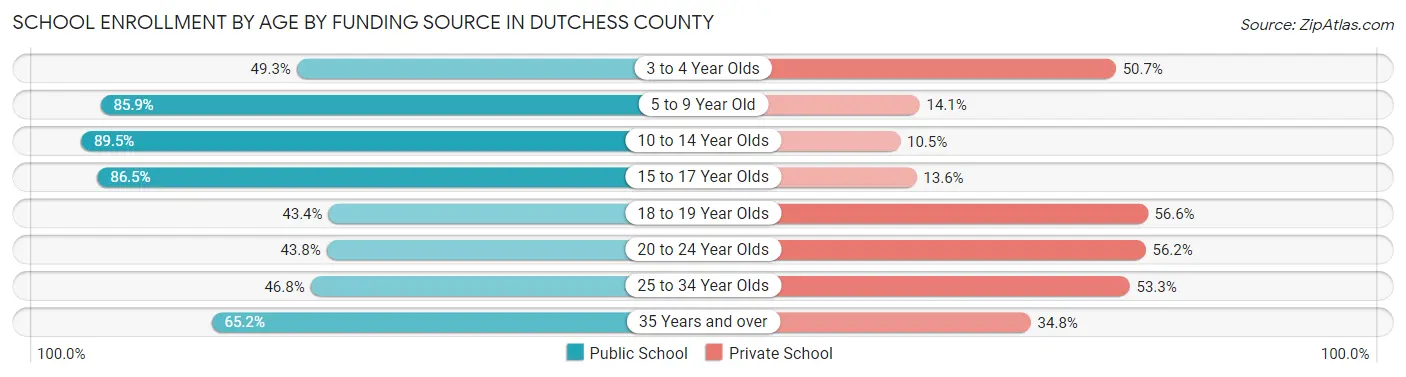
| Age Bracket | Public School | Private School |
| 3 to 4 Year Olds | 1,439 (49.3%) | 1,478 (50.7%) |
| 5 to 9 Year Old | 11,265 (85.9%) | 1,854 (14.1%) |
| 10 to 14 Year Olds | 14,581 (89.5%) | 1,710 (10.5%) |
| 15 to 17 Year Olds | 9,362 (86.5%) | 1,468 (13.6%) |
| 18 to 19 Year Olds | 3,506 (43.4%) | 4,569 (56.6%) |
| 20 to 24 Year Olds | 4,517 (43.8%) | 5,803 (56.2%) |
| 25 to 34 Year Olds | 1,742 (46.8%) | 1,984 (53.2%) |
| 35 Years and over | 2,148 (65.2%) | 1,148 (34.8%) |
| Total | 48,550 (70.8%) | 20,024 (29.2%) |
Educational Attainment by Field of Study in Dutchess County
Business (13,567 | 15.2%), education (10,087 | 11.3%), science & technology (7,716 | 8.7%), social sciences (6,980 | 7.8%), and visual & performing arts (6,749 | 7.6%) are the most common fields of study among 89,059 individuals in Dutchess County who have obtained a bachelor's degree or higher.
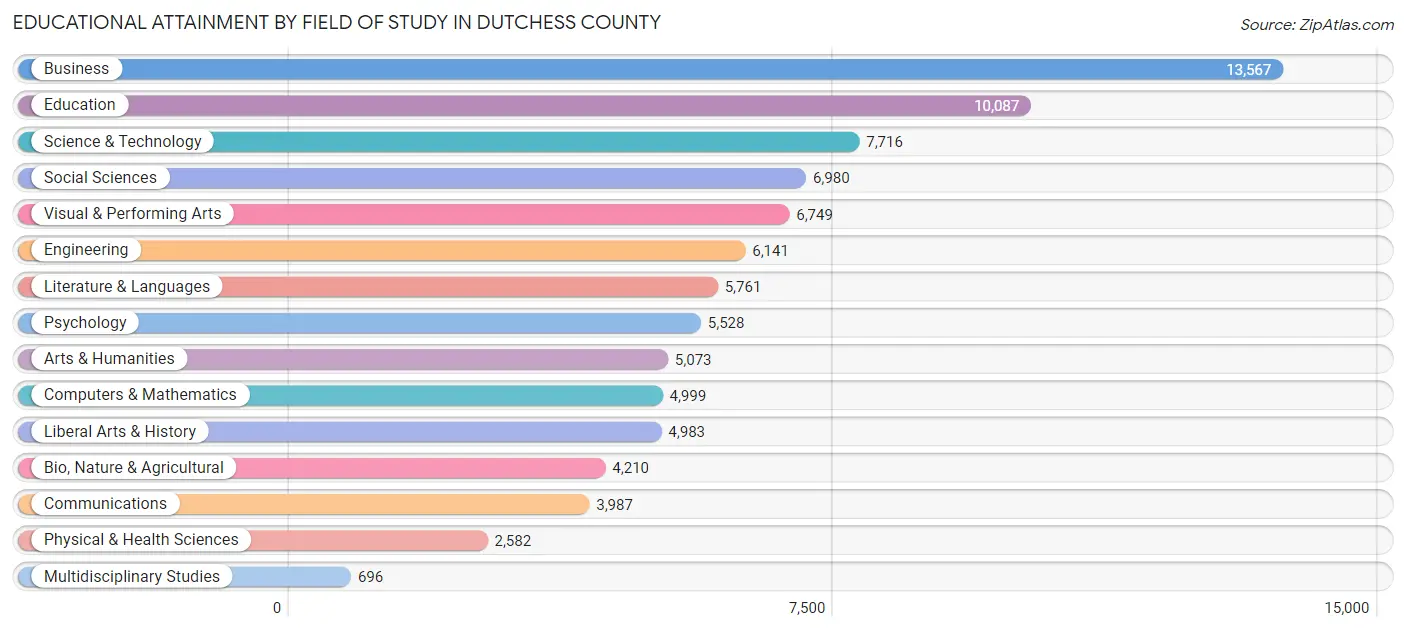
| Field of Study | # Graduates | % Graduates |
| Computers & Mathematics | 4,999 | 5.6% |
| Bio, Nature & Agricultural | 4,210 | 4.7% |
| Physical & Health Sciences | 2,582 | 2.9% |
| Psychology | 5,528 | 6.2% |
| Social Sciences | 6,980 | 7.8% |
| Engineering | 6,141 | 6.9% |
| Multidisciplinary Studies | 696 | 0.8% |
| Science & Technology | 7,716 | 8.7% |
| Business | 13,567 | 15.2% |
| Education | 10,087 | 11.3% |
| Literature & Languages | 5,761 | 6.5% |
| Liberal Arts & History | 4,983 | 5.6% |
| Visual & Performing Arts | 6,749 | 7.6% |
| Communications | 3,987 | 4.5% |
| Arts & Humanities | 5,073 | 5.7% |
| Total | 89,059 | 100.0% |
Transportation & Commute in Dutchess County
Vehicle Availability by Sex in Dutchess County
The most prevalent vehicle ownership categories in Dutchess County are males with 2 vehicles (32,126, accounting for 42.9%) and females with 2 vehicles (26,679, making up 47.8%).
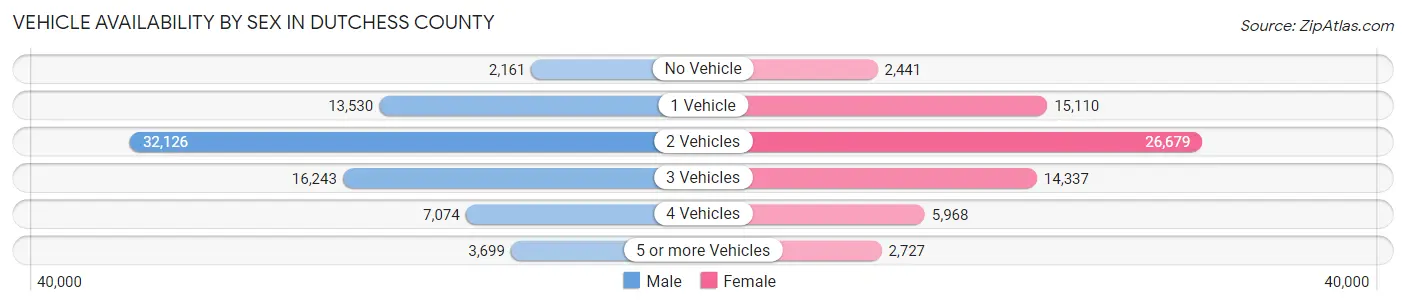
| Vehicles Available | Male | Female |
| No Vehicle | 2,161 (2.9%) | 2,441 (3.6%) |
| 1 Vehicle | 13,530 (18.1%) | 15,110 (22.5%) |
| 2 Vehicles | 32,126 (42.9%) | 26,679 (39.7%) |
| 3 Vehicles | 16,243 (21.7%) | 14,337 (21.3%) |
| 4 Vehicles | 7,074 (9.5%) | 5,968 (8.9%) |
| 5 or more Vehicles | 3,699 (4.9%) | 2,727 (4.1%) |
| Total | 74,833 (100.0%) | 67,262 (100.0%) |
Commute Time in Dutchess County
The most frequently occuring commute durations in Dutchess County are 15 to 19 minutes (17,739 commuters, 13.9%), 20 to 24 minutes (15,444 commuters, 12.1%), and 10 to 14 minutes (15,313 commuters, 12.0%).
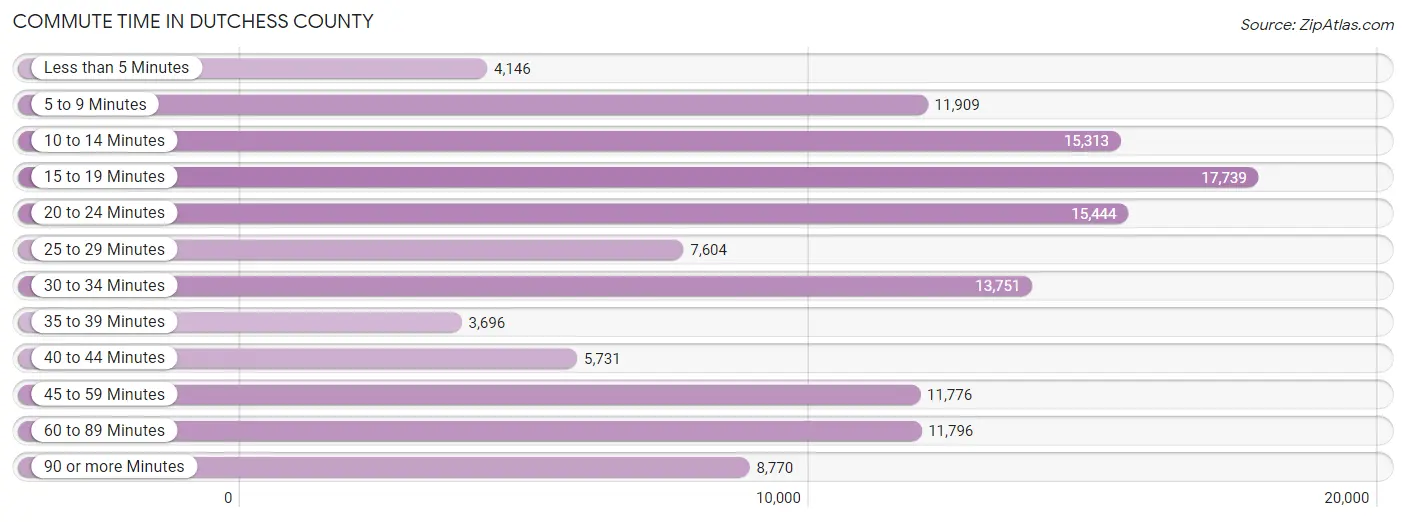
| Commute Time | # Commuters | % Commuters |
| Less than 5 Minutes | 4,146 | 3.3% |
| 5 to 9 Minutes | 11,909 | 9.3% |
| 10 to 14 Minutes | 15,313 | 12.0% |
| 15 to 19 Minutes | 17,739 | 13.9% |
| 20 to 24 Minutes | 15,444 | 12.1% |
| 25 to 29 Minutes | 7,604 | 6.0% |
| 30 to 34 Minutes | 13,751 | 10.8% |
| 35 to 39 Minutes | 3,696 | 2.9% |
| 40 to 44 Minutes | 5,731 | 4.5% |
| 45 to 59 Minutes | 11,776 | 9.2% |
| 60 to 89 Minutes | 11,796 | 9.2% |
| 90 or more Minutes | 8,770 | 6.9% |
Commute Time by Sex in Dutchess County
The most common commute times in Dutchess County are 15 to 19 minutes (8,192 commuters, 12.1%) for males and 15 to 19 minutes (9,547 commuters, 15.9%) for females.
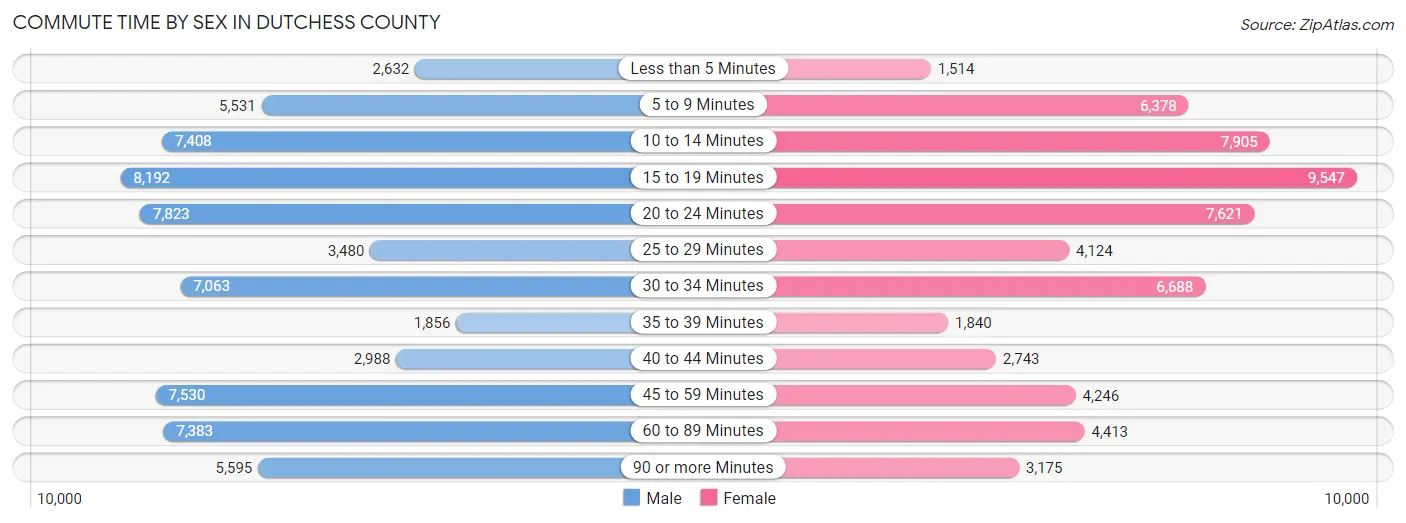
| Commute Time | Male | Female |
| Less than 5 Minutes | 2,632 (3.9%) | 1,514 (2.5%) |
| 5 to 9 Minutes | 5,531 (8.2%) | 6,378 (10.6%) |
| 10 to 14 Minutes | 7,408 (11.0%) | 7,905 (13.1%) |
| 15 to 19 Minutes | 8,192 (12.1%) | 9,547 (15.9%) |
| 20 to 24 Minutes | 7,823 (11.6%) | 7,621 (12.7%) |
| 25 to 29 Minutes | 3,480 (5.2%) | 4,124 (6.9%) |
| 30 to 34 Minutes | 7,063 (10.5%) | 6,688 (11.1%) |
| 35 to 39 Minutes | 1,856 (2.8%) | 1,840 (3.1%) |
| 40 to 44 Minutes | 2,988 (4.4%) | 2,743 (4.6%) |
| 45 to 59 Minutes | 7,530 (11.2%) | 4,246 (7.0%) |
| 60 to 89 Minutes | 7,383 (10.9%) | 4,413 (7.3%) |
| 90 or more Minutes | 5,595 (8.3%) | 3,175 (5.3%) |
Time of Departure to Work by Sex in Dutchess County
The most frequent times of departure to work in Dutchess County are 7:00 AM to 7:29 AM (8,895, 13.2%) for males and 8:00 AM to 8:29 AM (10,368, 17.2%) for females.
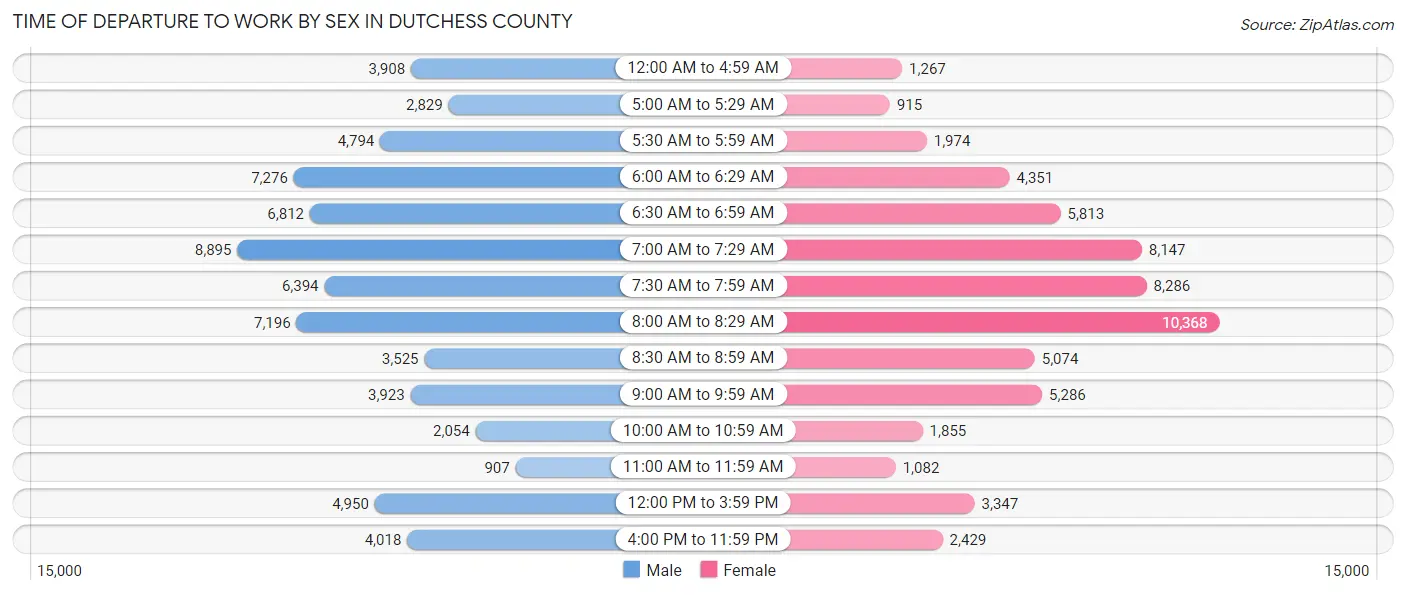
| Time of Departure | Male | Female |
| 12:00 AM to 4:59 AM | 3,908 (5.8%) | 1,267 (2.1%) |
| 5:00 AM to 5:29 AM | 2,829 (4.2%) | 915 (1.5%) |
| 5:30 AM to 5:59 AM | 4,794 (7.1%) | 1,974 (3.3%) |
| 6:00 AM to 6:29 AM | 7,276 (10.8%) | 4,351 (7.2%) |
| 6:30 AM to 6:59 AM | 6,812 (10.1%) | 5,813 (9.7%) |
| 7:00 AM to 7:29 AM | 8,895 (13.2%) | 8,147 (13.5%) |
| 7:30 AM to 7:59 AM | 6,394 (9.5%) | 8,286 (13.8%) |
| 8:00 AM to 8:29 AM | 7,196 (10.7%) | 10,368 (17.2%) |
| 8:30 AM to 8:59 AM | 3,525 (5.2%) | 5,074 (8.4%) |
| 9:00 AM to 9:59 AM | 3,923 (5.8%) | 5,286 (8.8%) |
| 10:00 AM to 10:59 AM | 2,054 (3.0%) | 1,855 (3.1%) |
| 11:00 AM to 11:59 AM | 907 (1.3%) | 1,082 (1.8%) |
| 12:00 PM to 3:59 PM | 4,950 (7.3%) | 3,347 (5.6%) |
| 4:00 PM to 11:59 PM | 4,018 (5.9%) | 2,429 (4.0%) |
| Total | 67,481 (100.0%) | 60,194 (100.0%) |
Housing Occupancy in Dutchess County
Occupancy by Ownership in Dutchess County
Of the total 113,972 dwellings in Dutchess County, owner-occupied units account for 78,430 (68.8%), while renter-occupied units make up 35,542 (31.2%).
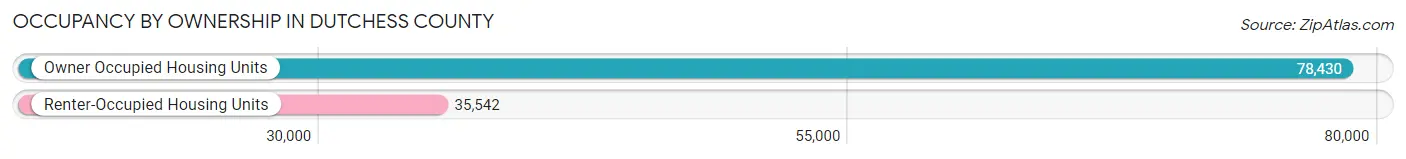
| Occupancy | # Housing Units | % Housing Units |
| Owner Occupied Housing Units | 78,430 | 68.8% |
| Renter-Occupied Housing Units | 35,542 | 31.2% |
| Total Occupied Housing Units | 113,972 | 100.0% |
Occupancy by Household Size in Dutchess County
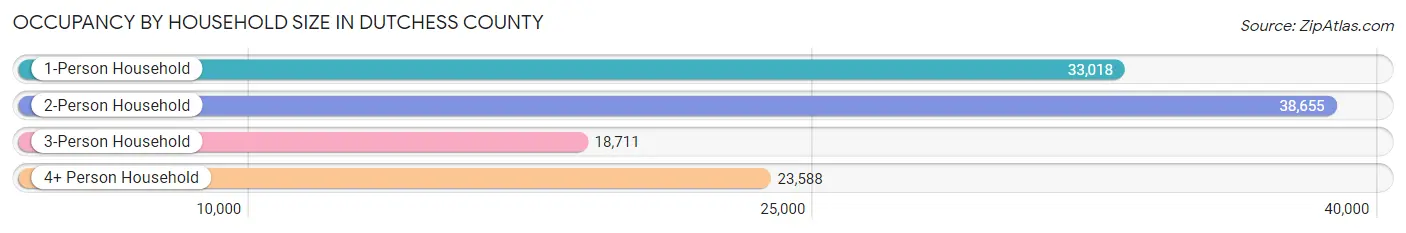
| Household Size | # Housing Units | % Housing Units |
| 1-Person Household | 33,018 | 29.0% |
| 2-Person Household | 38,655 | 33.9% |
| 3-Person Household | 18,711 | 16.4% |
| 4+ Person Household | 23,588 | 20.7% |
| Total Housing Units | 113,972 | 100.0% |
Occupancy by Ownership by Household Size in Dutchess County
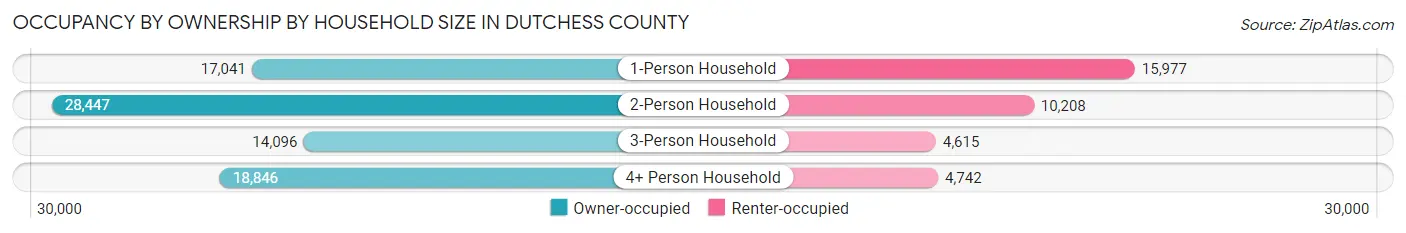
| Household Size | Owner-occupied | Renter-occupied |
| 1-Person Household | 17,041 (51.6%) | 15,977 (48.4%) |
| 2-Person Household | 28,447 (73.6%) | 10,208 (26.4%) |
| 3-Person Household | 14,096 (75.3%) | 4,615 (24.7%) |
| 4+ Person Household | 18,846 (79.9%) | 4,742 (20.1%) |
| Total Housing Units | 78,430 (68.8%) | 35,542 (31.2%) |
Occupancy by Educational Attainment in Dutchess County
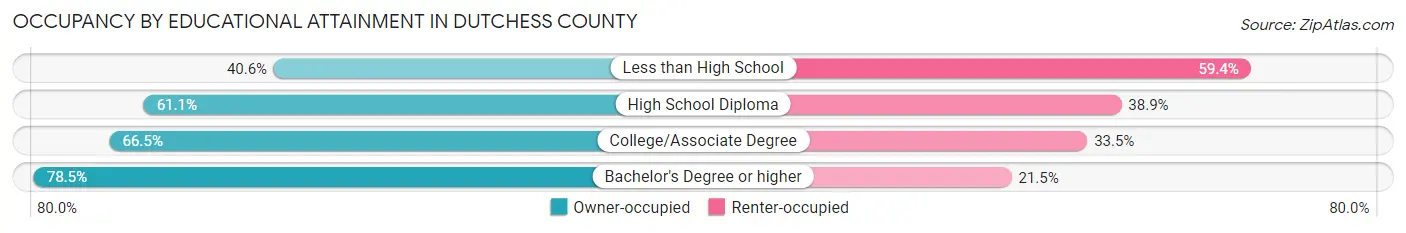
| Household Size | Owner-occupied | Renter-occupied |
| Less than High School | 2,715 (40.6%) | 3,970 (59.4%) |
| High School Diploma | 16,076 (61.1%) | 10,235 (38.9%) |
| College/Associate Degree | 21,914 (66.5%) | 11,026 (33.5%) |
| Bachelor's Degree or higher | 37,725 (78.5%) | 10,311 (21.5%) |
Occupancy by Age of Householder in Dutchess County
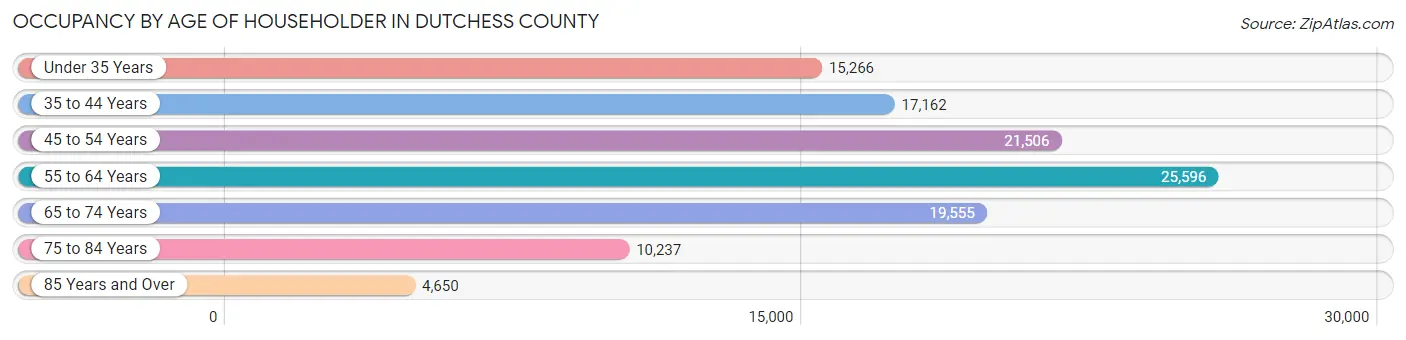
| Age Bracket | # Households | % Households |
| Under 35 Years | 15,266 | 13.4% |
| 35 to 44 Years | 17,162 | 15.1% |
| 45 to 54 Years | 21,506 | 18.9% |
| 55 to 64 Years | 25,596 | 22.5% |
| 65 to 74 Years | 19,555 | 17.2% |
| 75 to 84 Years | 10,237 | 9.0% |
| 85 Years and Over | 4,650 | 4.1% |
| Total | 113,972 | 100.0% |
Housing Finances in Dutchess County
Median Income by Occupancy in Dutchess County
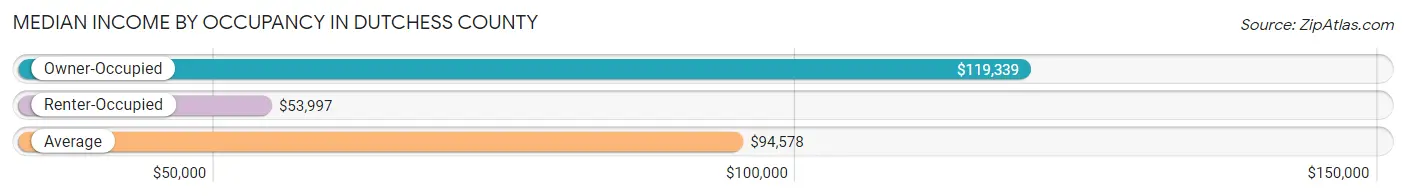
| Occupancy Type | # Households | Median Income |
| Owner-Occupied | 78,430 (68.8%) | $119,339 |
| Renter-Occupied | 35,542 (31.2%) | $53,997 |
| Average | 113,972 (100.0%) | $94,578 |
Occupancy by Householder Income Bracket in Dutchess County
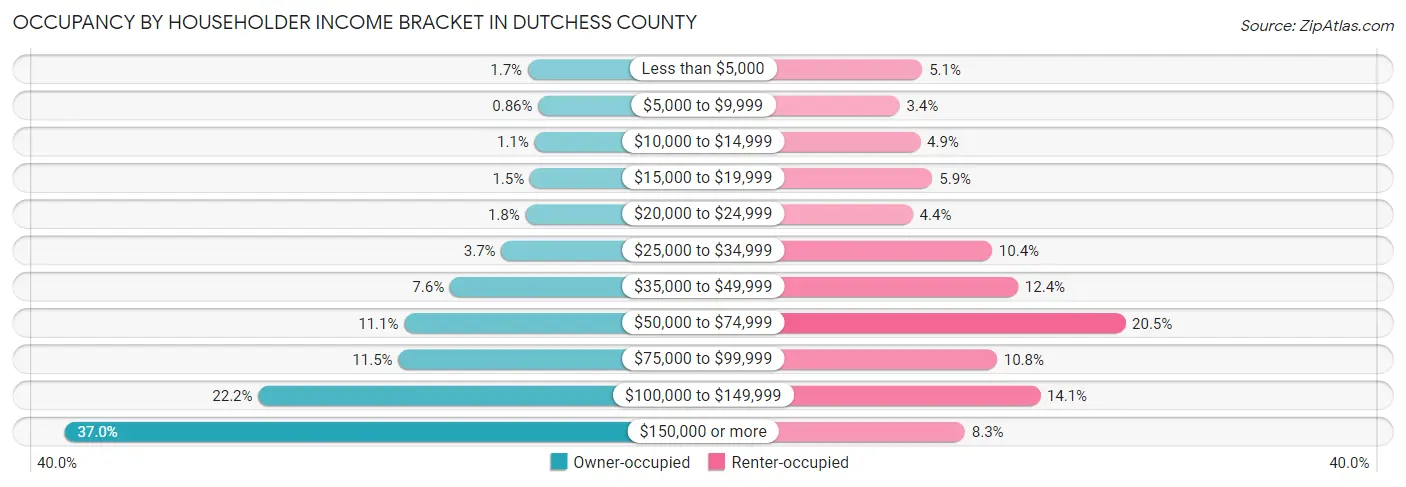
| Income Bracket | Owner-occupied | Renter-occupied |
| Less than $5,000 | 1,296 (1.7%) | 1,805 (5.1%) |
| $5,000 to $9,999 | 676 (0.9%) | 1,191 (3.4%) |
| $10,000 to $14,999 | 897 (1.1%) | 1,749 (4.9%) |
| $15,000 to $19,999 | 1,171 (1.5%) | 2,080 (5.9%) |
| $20,000 to $24,999 | 1,439 (1.8%) | 1,545 (4.3%) |
| $25,000 to $34,999 | 2,880 (3.7%) | 3,694 (10.4%) |
| $35,000 to $49,999 | 5,951 (7.6%) | 4,397 (12.4%) |
| $50,000 to $74,999 | 8,685 (11.1%) | 7,302 (20.5%) |
| $75,000 to $99,999 | 9,037 (11.5%) | 3,824 (10.8%) |
| $100,000 to $149,999 | 17,407 (22.2%) | 4,994 (14.1%) |
| $150,000 or more | 28,991 (37.0%) | 2,961 (8.3%) |
| Total | 78,430 (100.0%) | 35,542 (100.0%) |
Monthly Housing Cost Tiers in Dutchess County
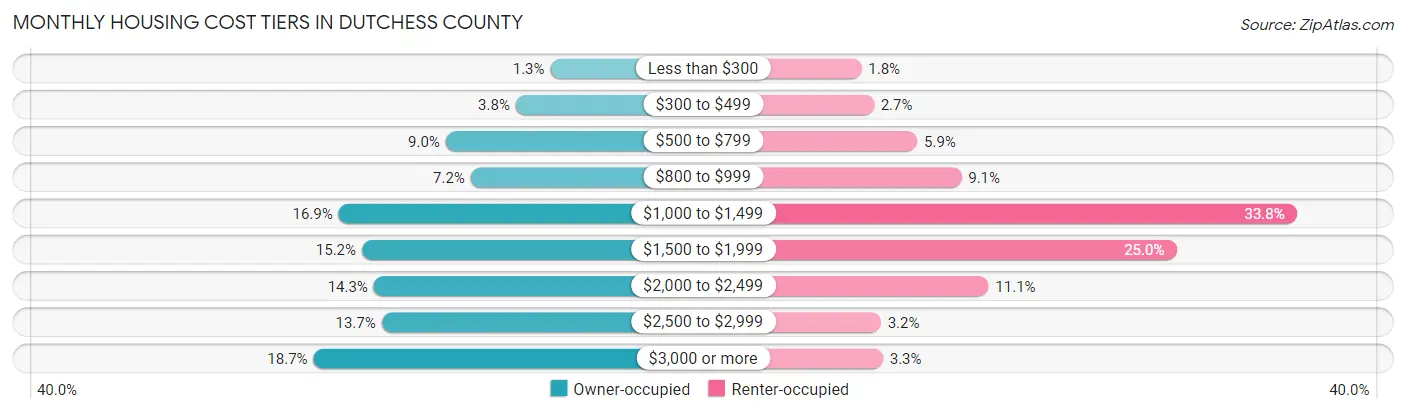
| Monthly Cost | Owner-occupied | Renter-occupied |
| Less than $300 | 1,000 (1.3%) | 625 (1.8%) |
| $300 to $499 | 3,004 (3.8%) | 948 (2.7%) |
| $500 to $799 | 7,051 (9.0%) | 2,085 (5.9%) |
| $800 to $999 | 5,606 (7.1%) | 3,242 (9.1%) |
| $1,000 to $1,499 | 13,242 (16.9%) | 12,015 (33.8%) |
| $1,500 to $1,999 | 11,887 (15.2%) | 8,867 (24.9%) |
| $2,000 to $2,499 | 11,204 (14.3%) | 3,953 (11.1%) |
| $2,500 to $2,999 | 10,749 (13.7%) | 1,135 (3.2%) |
| $3,000 or more | 14,687 (18.7%) | 1,187 (3.3%) |
| Total | 78,430 (100.0%) | 35,542 (100.0%) |
Physical Housing Characteristics in Dutchess County
Housing Structures in Dutchess County
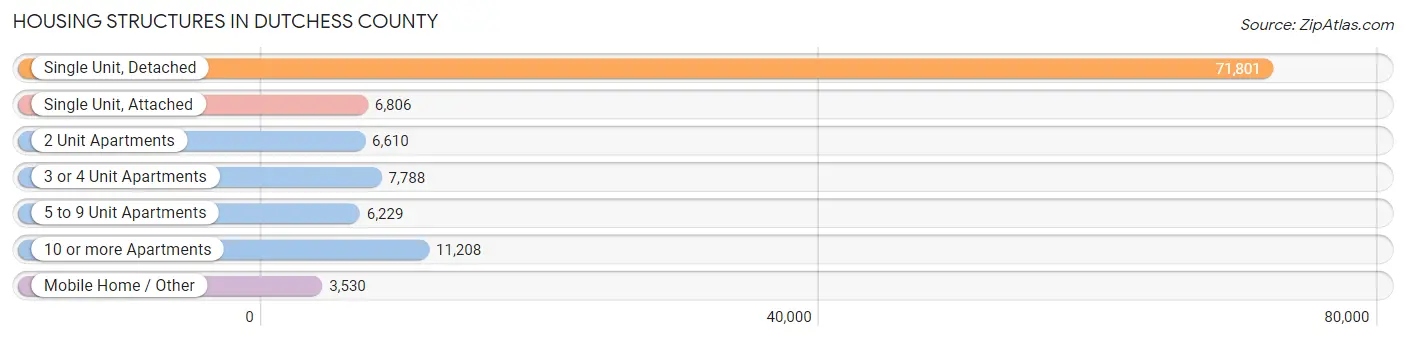
| Structure Type | # Housing Units | % Housing Units |
| Single Unit, Detached | 71,801 | 63.0% |
| Single Unit, Attached | 6,806 | 6.0% |
| 2 Unit Apartments | 6,610 | 5.8% |
| 3 or 4 Unit Apartments | 7,788 | 6.8% |
| 5 to 9 Unit Apartments | 6,229 | 5.5% |
| 10 or more Apartments | 11,208 | 9.8% |
| Mobile Home / Other | 3,530 | 3.1% |
| Total | 113,972 | 100.0% |
Housing Structures by Occupancy in Dutchess County
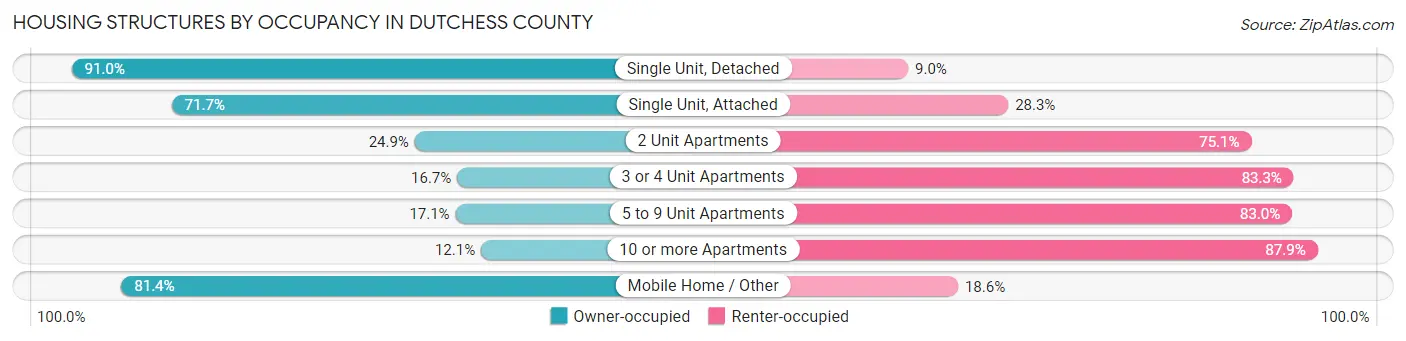
| Structure Type | Owner-occupied | Renter-occupied |
| Single Unit, Detached | 65,310 (91.0%) | 6,491 (9.0%) |
| Single Unit, Attached | 4,879 (71.7%) | 1,927 (28.3%) |
| 2 Unit Apartments | 1,645 (24.9%) | 4,965 (75.1%) |
| 3 or 4 Unit Apartments | 1,303 (16.7%) | 6,485 (83.3%) |
| 5 to 9 Unit Apartments | 1,062 (17.1%) | 5,167 (83.0%) |
| 10 or more Apartments | 1,359 (12.1%) | 9,849 (87.9%) |
| Mobile Home / Other | 2,872 (81.4%) | 658 (18.6%) |
| Total | 78,430 (68.8%) | 35,542 (31.2%) |
Housing Structures by Number of Rooms in Dutchess County
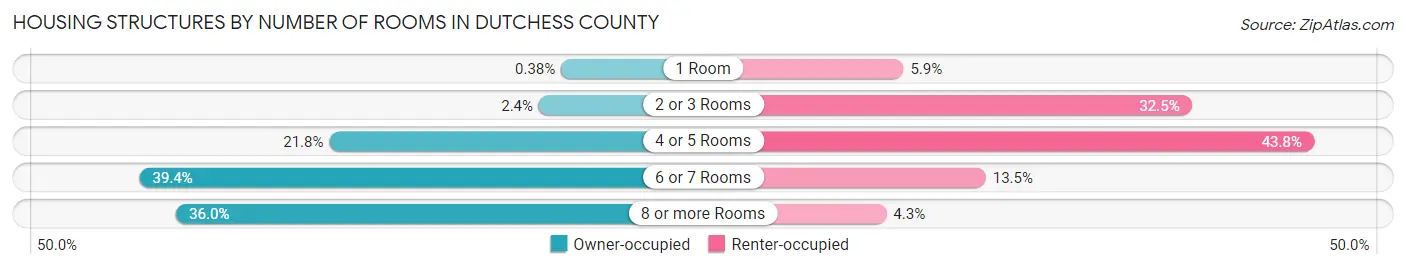
| Number of Rooms | Owner-occupied | Renter-occupied |
| 1 Room | 295 (0.4%) | 2,091 (5.9%) |
| 2 or 3 Rooms | 1,912 (2.4%) | 11,553 (32.5%) |
| 4 or 5 Rooms | 17,114 (21.8%) | 15,576 (43.8%) |
| 6 or 7 Rooms | 30,889 (39.4%) | 4,794 (13.5%) |
| 8 or more Rooms | 28,220 (36.0%) | 1,528 (4.3%) |
| Total | 78,430 (100.0%) | 35,542 (100.0%) |
Housing Structure by Heating Type in Dutchess County
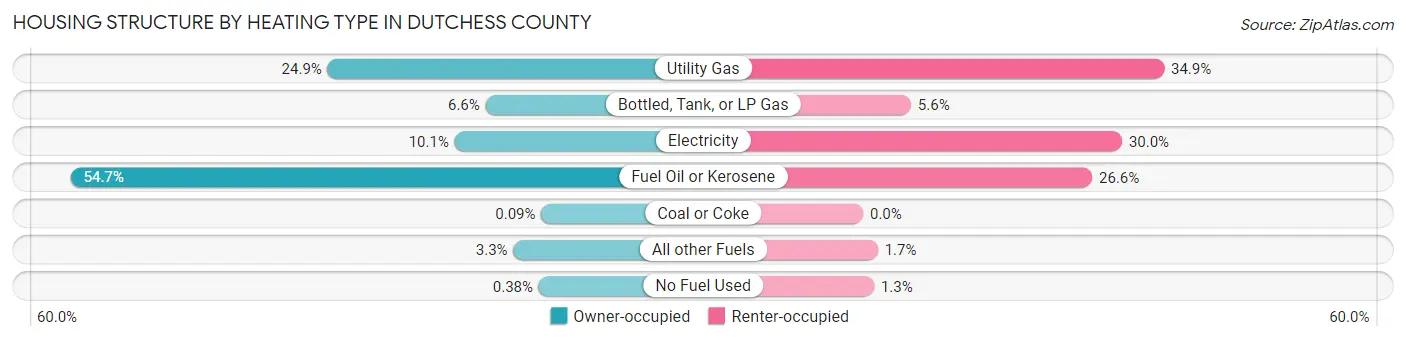
| Heating Type | Owner-occupied | Renter-occupied |
| Utility Gas | 19,501 (24.9%) | 12,404 (34.9%) |
| Bottled, Tank, or LP Gas | 5,141 (6.6%) | 1,972 (5.6%) |
| Electricity | 7,944 (10.1%) | 10,669 (30.0%) |
| Fuel Oil or Kerosene | 42,866 (54.7%) | 9,439 (26.6%) |
| Coal or Coke | 73 (0.1%) | 0 (0.0%) |
| All other Fuels | 2,607 (3.3%) | 605 (1.7%) |
| No Fuel Used | 298 (0.4%) | 453 (1.3%) |
| Total | 78,430 (100.0%) | 35,542 (100.0%) |
Household Vehicle Usage in Dutchess County
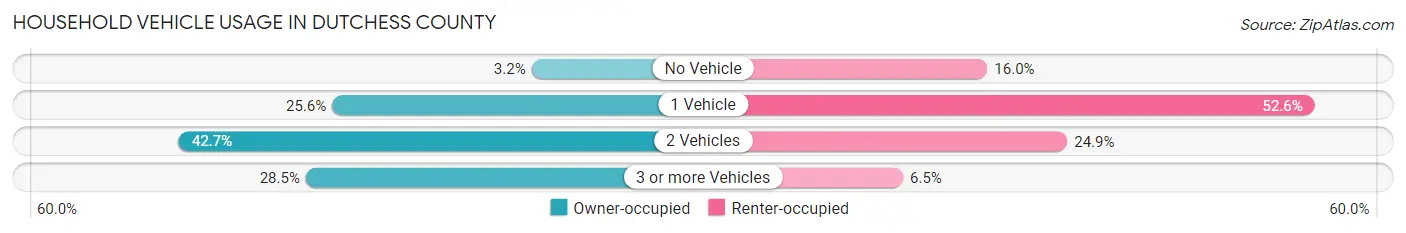
| Vehicles per Household | Owner-occupied | Renter-occupied |
| No Vehicle | 2,522 (3.2%) | 5,671 (16.0%) |
| 1 Vehicle | 20,043 (25.6%) | 18,699 (52.6%) |
| 2 Vehicles | 33,506 (42.7%) | 8,853 (24.9%) |
| 3 or more Vehicles | 22,359 (28.5%) | 2,319 (6.5%) |
| Total | 78,430 (100.0%) | 35,542 (100.0%) |
Real Estate & Mortgages in Dutchess County
Real Estate and Mortgage Overview in Dutchess County
| Characteristic | Without Mortgage | With Mortgage |
| Housing Units | 29,544 | 48,886 |
| Median Property Value | $323,600 | $361,600 |
| Median Household Income | $86,012 | $21,522 |
| Monthly Housing Costs | $974 | $14,310 |
| Real Estate Taxes | $6,537 | $1,263 |
Property Value by Mortgage Status in Dutchess County
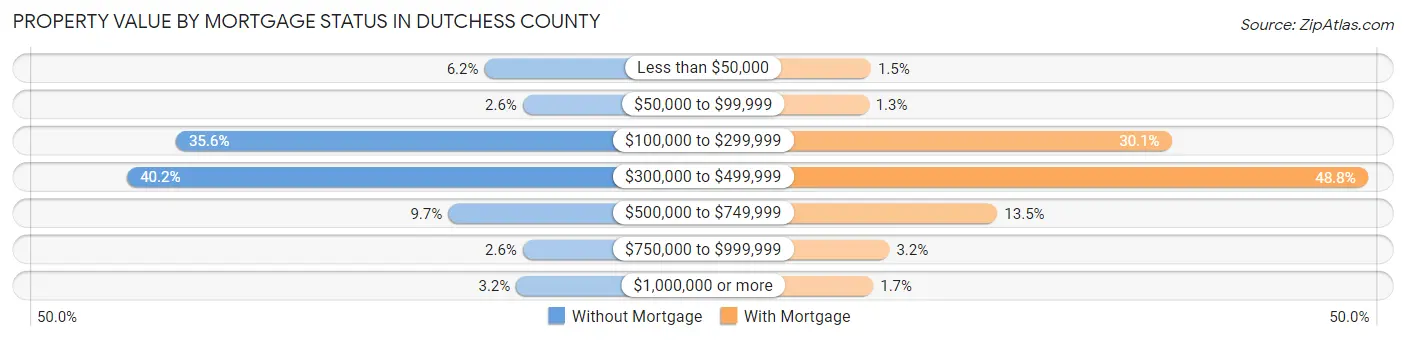
| Property Value | Without Mortgage | With Mortgage |
| Less than $50,000 | 1,838 (6.2%) | 721 (1.5%) |
| $50,000 to $99,999 | 757 (2.6%) | 613 (1.3%) |
| $100,000 to $299,999 | 10,511 (35.6%) | 14,704 (30.1%) |
| $300,000 to $499,999 | 11,882 (40.2%) | 23,839 (48.8%) |
| $500,000 to $749,999 | 2,857 (9.7%) | 6,606 (13.5%) |
| $750,000 to $999,999 | 756 (2.6%) | 1,579 (3.2%) |
| $1,000,000 or more | 943 (3.2%) | 824 (1.7%) |
| Total | 29,544 (100.0%) | 48,886 (100.0%) |
Household Income by Mortgage Status in Dutchess County
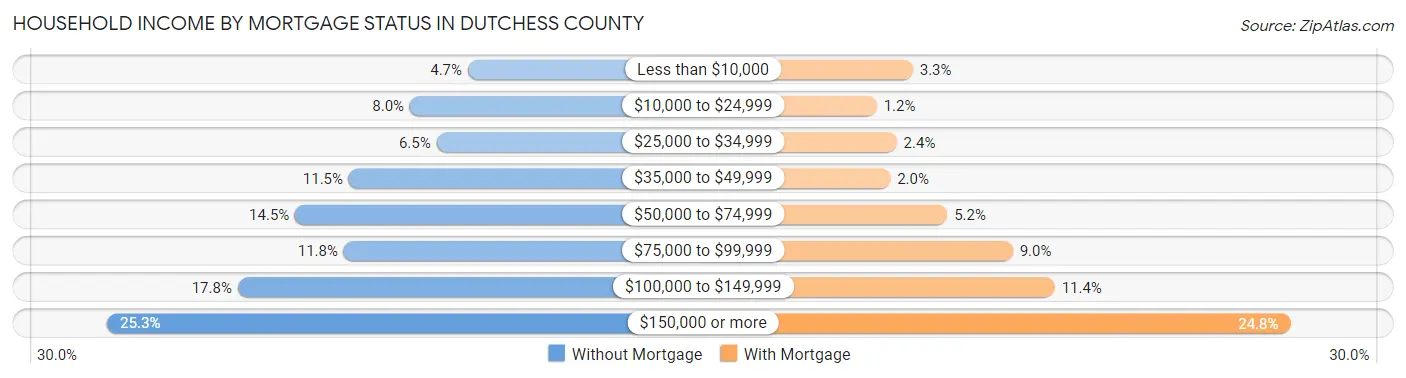
| Household Income | Without Mortgage | With Mortgage |
| Less than $10,000 | 1,381 (4.7%) | 1,597 (3.3%) |
| $10,000 to $24,999 | 2,358 (8.0%) | 591 (1.2%) |
| $25,000 to $34,999 | 1,910 (6.5%) | 1,149 (2.4%) |
| $35,000 to $49,999 | 3,390 (11.5%) | 970 (2.0%) |
| $50,000 to $74,999 | 4,297 (14.5%) | 2,561 (5.2%) |
| $75,000 to $99,999 | 3,473 (11.8%) | 4,388 (9.0%) |
| $100,000 to $149,999 | 5,266 (17.8%) | 5,564 (11.4%) |
| $150,000 or more | 7,469 (25.3%) | 12,141 (24.8%) |
| Total | 29,544 (100.0%) | 48,886 (100.0%) |
Property Value to Household Income Ratio in Dutchess County
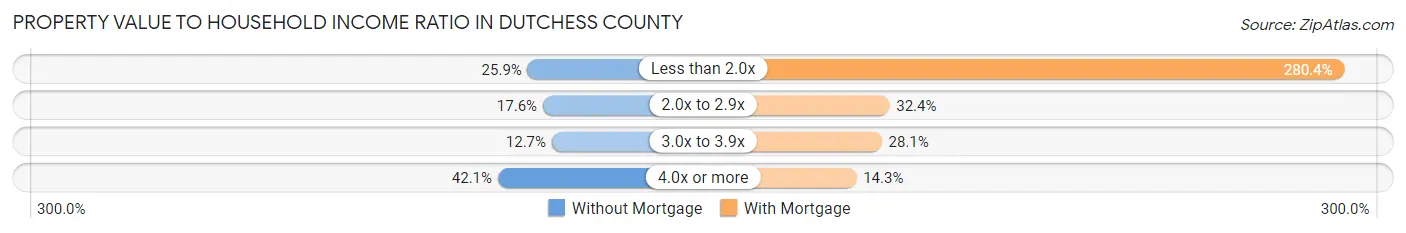
| Value-to-Income Ratio | Without Mortgage | With Mortgage |
| Less than 2.0x | 7,654 (25.9%) | 137,058 (280.4%) |
| 2.0x to 2.9x | 5,207 (17.6%) | 15,822 (32.4%) |
| 3.0x to 3.9x | 3,758 (12.7%) | 13,747 (28.1%) |
| 4.0x or more | 12,449 (42.1%) | 7,004 (14.3%) |
| Total | 29,544 (100.0%) | 48,886 (100.0%) |
Real Estate Taxes by Mortgage Status in Dutchess County
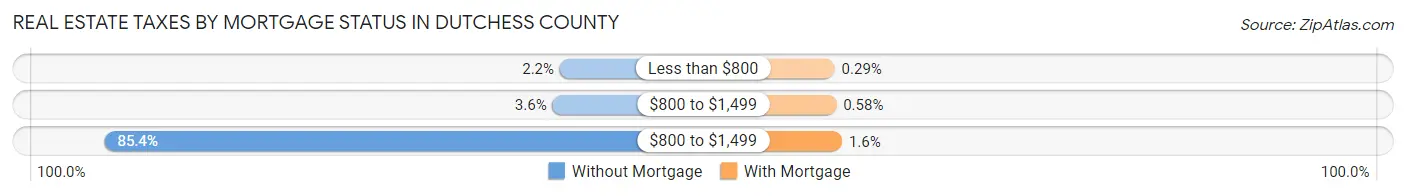
| Property Taxes | Without Mortgage | With Mortgage |
| Less than $800 | 659 (2.2%) | 140 (0.3%) |
| $800 to $1,499 | 1,057 (3.6%) | 285 (0.6%) |
| $800 to $1,499 | 25,227 (85.4%) | 795 (1.6%) |
| Total | 29,544 (100.0%) | 48,886 (100.0%) |
Health & Disability in Dutchess County
Health Insurance Coverage by Age in Dutchess County
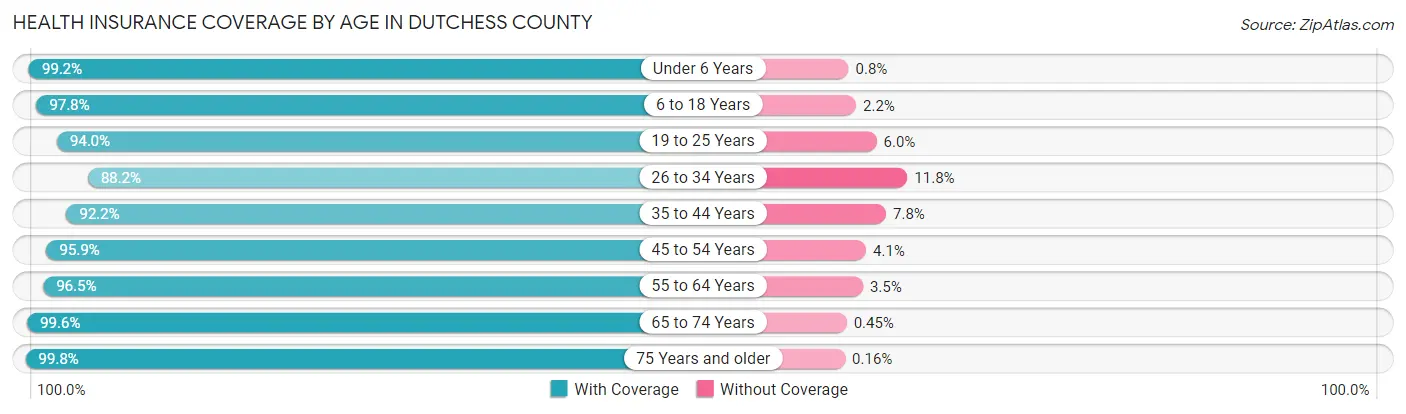
| Age Bracket | With Coverage | Without Coverage |
| Under 6 Years | 16,255 (99.2%) | 131 (0.8%) |
| 6 to 18 Years | 42,051 (97.8%) | 947 (2.2%) |
| 19 to 25 Years | 26,798 (94.0%) | 1,716 (6.0%) |
| 26 to 34 Years | 27,416 (88.2%) | 3,656 (11.8%) |
| 35 to 44 Years | 31,504 (92.2%) | 2,660 (7.8%) |
| 45 to 54 Years | 37,423 (95.9%) | 1,589 (4.1%) |
| 55 to 64 Years | 42,950 (96.5%) | 1,550 (3.5%) |
| 65 to 74 Years | 30,758 (99.6%) | 138 (0.4%) |
| 75 Years and older | 22,000 (99.8%) | 36 (0.2%) |
| Total | 277,155 (95.7%) | 12,423 (4.3%) |
Health Insurance Coverage by Citizenship Status in Dutchess County
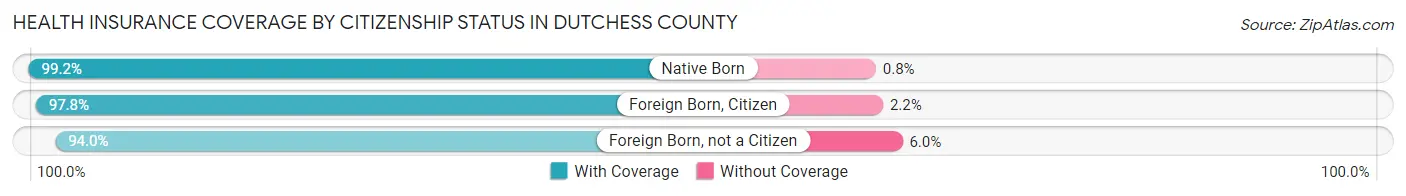
| Citizenship Status | With Coverage | Without Coverage |
| Native Born | 16,255 (99.2%) | 131 (0.8%) |
| Foreign Born, Citizen | 42,051 (97.8%) | 947 (2.2%) |
| Foreign Born, not a Citizen | 26,798 (94.0%) | 1,716 (6.0%) |
Health Insurance Coverage by Household Income in Dutchess County
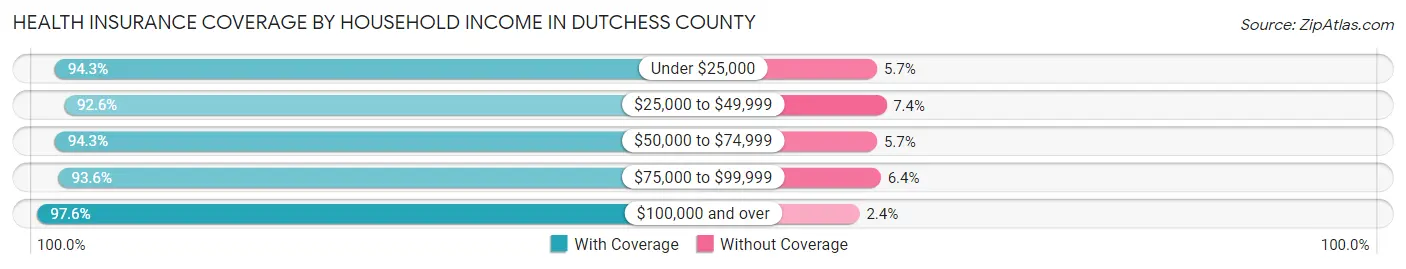
| Household Income | With Coverage | Without Coverage |
| Under $25,000 | 20,123 (94.3%) | 1,207 (5.7%) |
| $25,000 to $49,999 | 29,403 (92.6%) | 2,343 (7.4%) |
| $50,000 to $74,999 | 32,553 (94.3%) | 1,953 (5.7%) |
| $75,000 to $99,999 | 28,700 (93.6%) | 1,950 (6.4%) |
| $100,000 and over | 156,757 (97.6%) | 3,823 (2.4%) |
Public vs Private Health Insurance Coverage by Age in Dutchess County
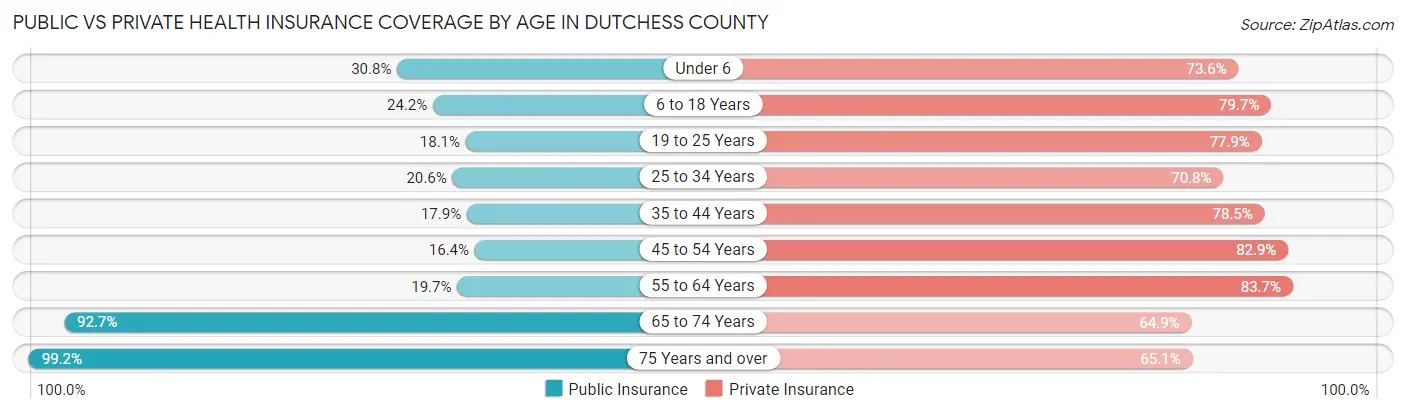
| Age Bracket | Public Insurance | Private Insurance |
| Under 6 | 5,051 (30.8%) | 12,066 (73.6%) |
| 6 to 18 Years | 10,396 (24.2%) | 34,257 (79.7%) |
| 19 to 25 Years | 5,161 (18.1%) | 22,222 (77.9%) |
| 25 to 34 Years | 6,395 (20.6%) | 22,000 (70.8%) |
| 35 to 44 Years | 6,111 (17.9%) | 26,809 (78.5%) |
| 45 to 54 Years | 6,407 (16.4%) | 32,321 (82.9%) |
| 55 to 64 Years | 8,758 (19.7%) | 37,251 (83.7%) |
| 65 to 74 Years | 28,634 (92.7%) | 20,048 (64.9%) |
| 75 Years and over | 21,862 (99.2%) | 14,343 (65.1%) |
| Total | 98,775 (34.1%) | 221,317 (76.4%) |
Disability Status by Sex by Age in Dutchess County
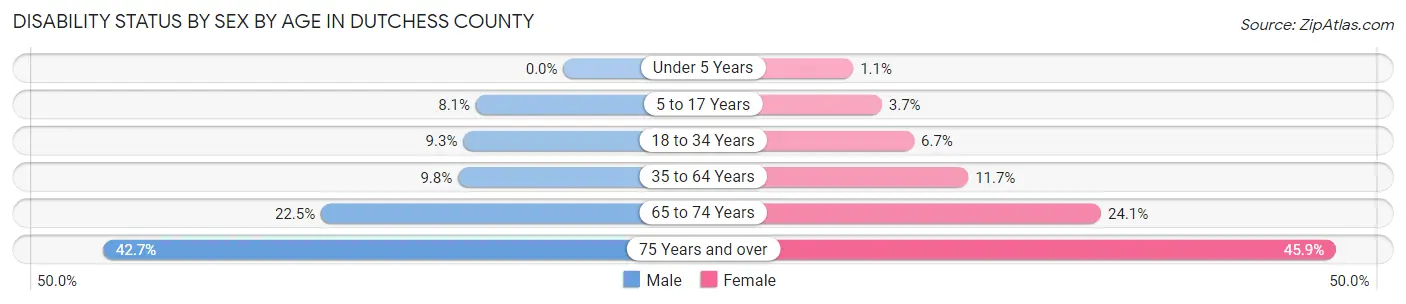
| Age Bracket | Male | Female |
| Under 5 Years | 0 (0.0%) | 70 (1.1%) |
| 5 to 17 Years | 1,725 (8.1%) | 748 (3.7%) |
| 18 to 34 Years | 2,990 (9.3%) | 2,150 (6.7%) |
| 35 to 64 Years | 5,702 (9.8%) | 6,958 (11.7%) |
| 65 to 74 Years | 3,322 (22.5%) | 3,879 (24.1%) |
| 75 Years and over | 3,936 (42.7%) | 5,883 (45.9%) |
Disability Class by Sex by Age in Dutchess County
Disability Class: Hearing Difficulty
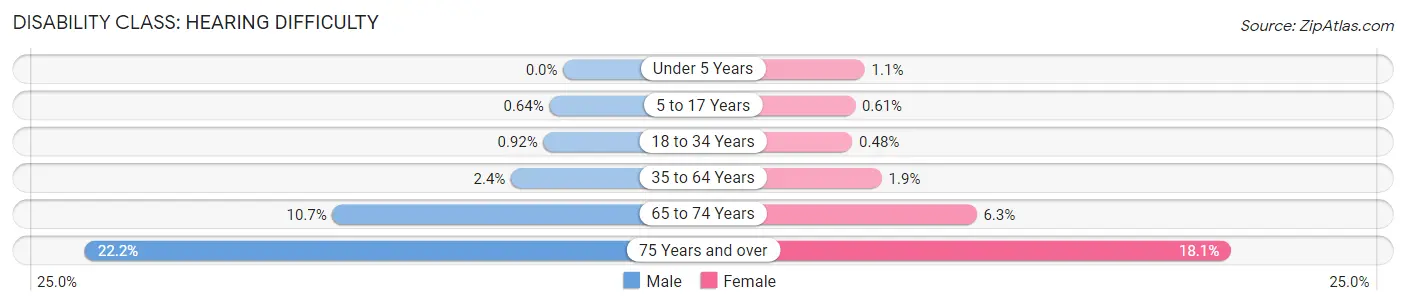
| Age Bracket | Male | Female |
| Under 5 Years | 0 (0.0%) | 70 (1.1%) |
| 5 to 17 Years | 137 (0.6%) | 123 (0.6%) |
| 18 to 34 Years | 297 (0.9%) | 154 (0.5%) |
| 35 to 64 Years | 1,410 (2.4%) | 1,100 (1.8%) |
| 65 to 74 Years | 1,582 (10.7%) | 1,008 (6.2%) |
| 75 Years and over | 2,045 (22.2%) | 2,316 (18.1%) |
Disability Class: Vision Difficulty
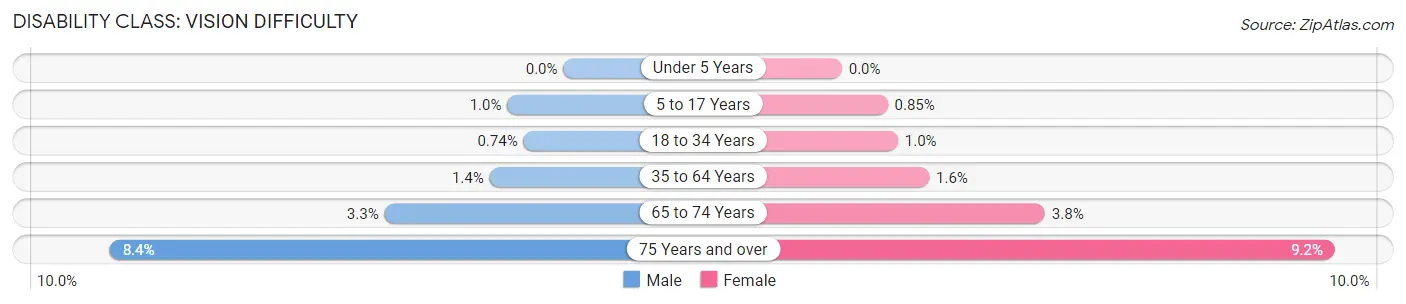
| Age Bracket | Male | Female |
| Under 5 Years | 0 (0.0%) | 0 (0.0%) |
| 5 to 17 Years | 221 (1.0%) | 171 (0.9%) |
| 18 to 34 Years | 237 (0.7%) | 332 (1.0%) |
| 35 to 64 Years | 802 (1.4%) | 960 (1.6%) |
| 65 to 74 Years | 490 (3.3%) | 608 (3.8%) |
| 75 Years and over | 776 (8.4%) | 1,173 (9.1%) |
Disability Class: Cognitive Difficulty
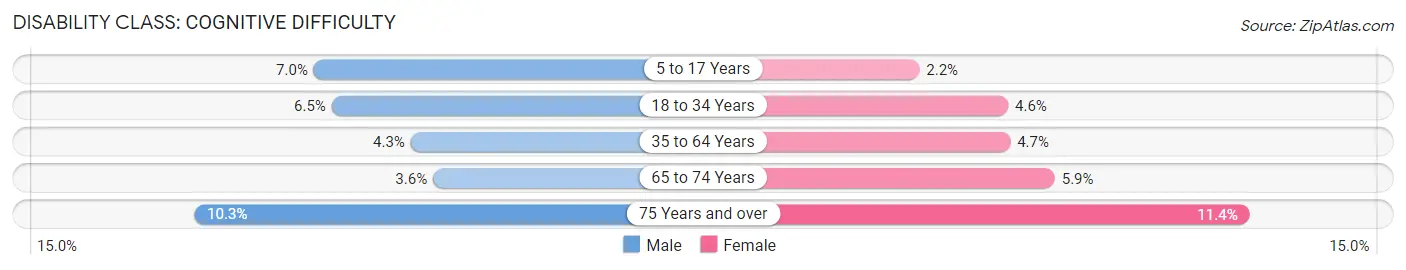
| Age Bracket | Male | Female |
| 5 to 17 Years | 1,477 (7.0%) | 434 (2.2%) |
| 18 to 34 Years | 2,076 (6.5%) | 1,483 (4.6%) |
| 35 to 64 Years | 2,482 (4.3%) | 2,780 (4.7%) |
| 65 to 74 Years | 537 (3.6%) | 956 (5.9%) |
| 75 Years and over | 947 (10.3%) | 1,456 (11.4%) |
Disability Class: Ambulatory Difficulty
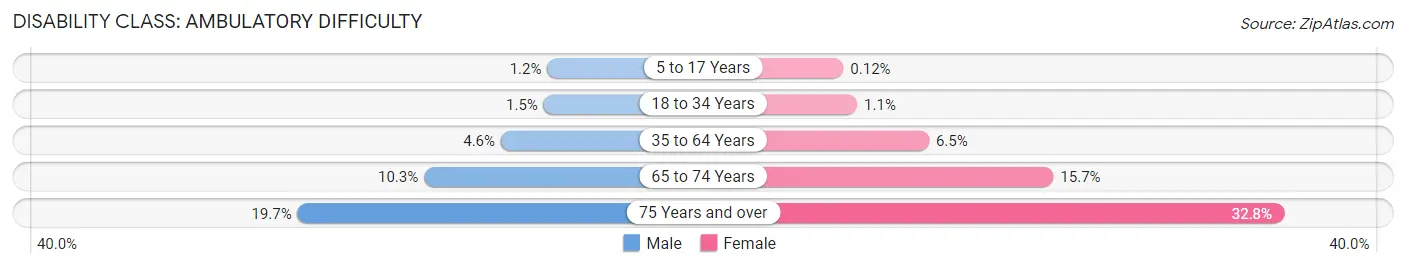
| Age Bracket | Male | Female |
| 5 to 17 Years | 252 (1.2%) | 25 (0.1%) |
| 18 to 34 Years | 470 (1.5%) | 365 (1.1%) |
| 35 to 64 Years | 2,709 (4.6%) | 3,839 (6.5%) |
| 65 to 74 Years | 1,528 (10.3%) | 2,533 (15.7%) |
| 75 Years and over | 1,818 (19.7%) | 4,209 (32.8%) |
Disability Class: Self-Care Difficulty
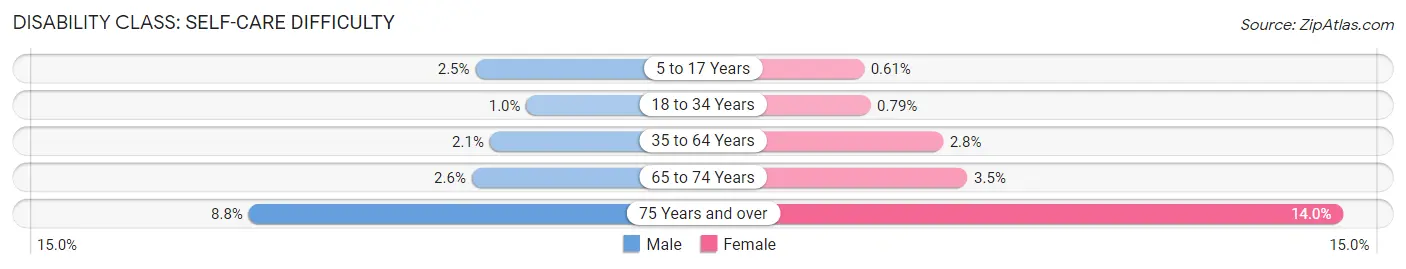
| Age Bracket | Male | Female |
| 5 to 17 Years | 520 (2.5%) | 122 (0.6%) |
| 18 to 34 Years | 333 (1.0%) | 252 (0.8%) |
| 35 to 64 Years | 1,198 (2.1%) | 1,666 (2.8%) |
| 65 to 74 Years | 376 (2.5%) | 562 (3.5%) |
| 75 Years and over | 807 (8.8%) | 1,790 (14.0%) |
Technology Access in Dutchess County
Computing Device Access in Dutchess County
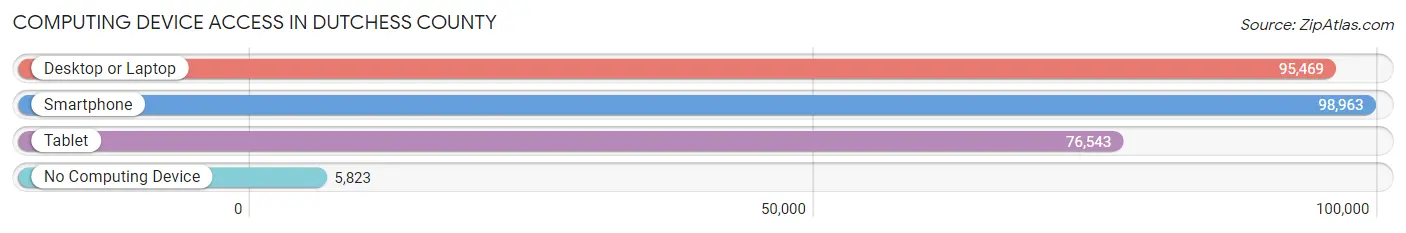
| Device Type | # Households | % Households |
| Desktop or Laptop | 95,469 | 83.8% |
| Smartphone | 98,963 | 86.8% |
| Tablet | 76,543 | 67.2% |
| No Computing Device | 5,823 | 5.1% |
| Total | 113,972 | 100.0% |
Internet Access in Dutchess County
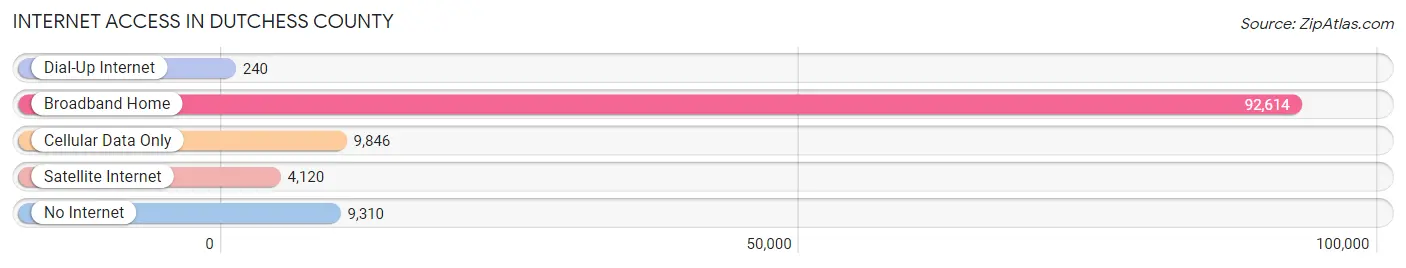
| Internet Type | # Households | % Households |
| Dial-Up Internet | 240 | 0.2% |
| Broadband Home | 92,614 | 81.3% |
| Cellular Data Only | 9,846 | 8.6% |
| Satellite Internet | 4,120 | 3.6% |
| No Internet | 9,310 | 8.2% |
| Total | 113,972 | 100.0% |
Dutchess County Summary
Dutchess County is located in the southeastern part of New York State, in the Hudson Valley region. It is bordered by the Hudson River to the east, Putnam County to the north, Columbia County to the east, and Ulster County to the west. The county seat is the city of Poughkeepsie.
History
Dutchess County was established in 1683, when it was created from the northern part of Ulster County. It was named after Mary of Modena, the Duchess of York. The county was originally part of the Province of New York, and was one of the original twelve counties of the state.
During the American Revolution, Dutchess County was a major center of activity. The county was home to many prominent figures of the Revolution, including General Philip Schuyler, General George Clinton, and General Alexander McDougall.
In the 19th century, Dutchess County was an important center of industry. The county was home to many factories, including the Dutchess County Iron Works, which produced iron products for the Union Army during the Civil War.
Geography
Dutchess County covers an area of 837 square miles, making it the second-largest county in New York State. The county is divided into two distinct regions: the Hudson Valley and the Taconic Mountains. The Hudson Valley is a flat, low-lying region, while the Taconic Mountains are a rugged, mountainous region.
The Hudson River forms the eastern border of the county, while the Taconic Mountains form the western border. The county is home to several rivers, including the Fishkill, Wappinger, and Roeliff Jansen Kill.
Economy
Dutchess County has a diverse economy, with a mix of manufacturing, agriculture, and tourism. The county is home to several large companies, including IBM, PepsiCo, and GlobalFoundries.
Agriculture is an important part of the county’s economy. The county is home to many farms, which produce a variety of crops, including apples, corn, and hay.
Tourism is also an important part of the county’s economy. The county is home to many attractions, including the Franklin D. Roosevelt Presidential Library and Museum, the Vanderbilt Mansion National Historic Site, and the Walkway Over the Hudson.
Demographics
As of the 2010 census, Dutchess County had a population of 297,488. The population is predominantly white (86.3%), with smaller percentages of African Americans (7.2%), Hispanics (4.7%), and Asians (1.7%).
The median household income in the county is $68,837, and the median home value is $269,400. The unemployment rate is 4.2%.
Conclusion
Dutchess County is a diverse and vibrant county in the Hudson Valley region of New York State. It has a rich history, a diverse economy, and a population that is predominantly white. The county is home to many attractions, including the Franklin D. Roosevelt Presidential Library and Museum, the Vanderbilt Mansion National Historic Site, and the Walkway Over the Hudson. Dutchess County is an important part of the state of New York, and its economy and population continue to grow.
Common Questions
What is Per Capita Income in Dutchess County?
Per Capita income in Dutchess County is $49,379.
What is the Median Family Income in Dutchess County?
Median Family Income in Dutchess County is $118,875.
What is the Median Household income in Dutchess County?
Median Household Income in Dutchess County is $94,578.
What is Income or Wage Gap in Dutchess County?
Income or Wage Gap in Dutchess County is 31.6%.
Women in Dutchess County earn 68.4 cents for every dollar earned by a man.
What is Family Income Deficit in Dutchess County?
Family Income Deficit in Dutchess County is $10,949.
Families that are below poverty line in Dutchess County earn $10,949 less on average than the poverty threshold level.
What is Inequality or Gini Index in Dutchess County?
Inequality or Gini Index in Dutchess County is 0.46.
What is the Total Population of Dutchess County?
Total Population of Dutchess County is 296,467.
What is the Total Male Population of Dutchess County?
Total Male Population of Dutchess County is 148,112.
What is the Total Female Population of Dutchess County?
Total Female Population of Dutchess County is 148,355.
What is the Ratio of Males per 100 Females in Dutchess County?
There are 99.84 Males per 100 Females in Dutchess County.
What is the Ratio of Females per 100 Males in Dutchess County?
There are 100.16 Females per 100 Males in Dutchess County.
What is the Median Population Age in Dutchess County?
Median Population Age in Dutchess County is 42.9 Years.
What is the Average Family Size in Dutchess County
Average Family Size in Dutchess County is 3.0 People.
What is the Average Household Size in Dutchess County
Average Household Size in Dutchess County is 2.5 People.
How Large is the Labor Force in Dutchess County?
There are 156,113 People in the Labor Forcein in Dutchess County.
What is the Percentage of People in the Labor Force in Dutchess County?
62.8% of People are in the Labor Force in Dutchess County.
What is the Unemployment Rate in Dutchess County?
Unemployment Rate in Dutchess County is 5.0%.