Cortland County, NY Map & Demographics
Cortland County Map
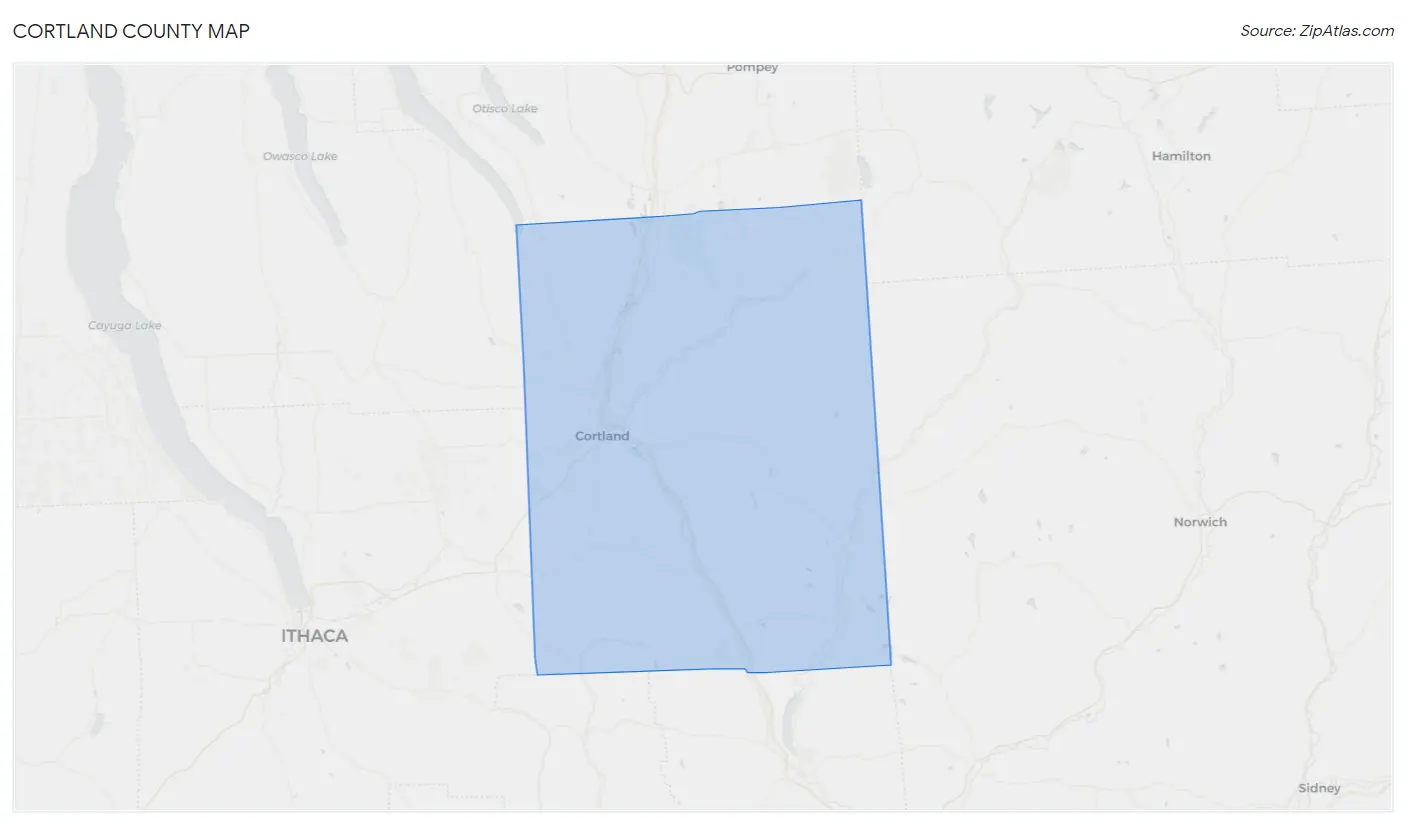
Cortland County Overview
$31,594
PER CAPITA INCOME
$80,814
AVG FAMILY INCOME
$65,029
AVG HOUSEHOLD INCOME
25.2%
WAGE / INCOME GAP [ % ]
74.8¢/ $1
WAGE / INCOME GAP [ $ ]
$9,410
FAMILY INCOME DEFICIT
0.41
INEQUALITY / GINI INDEX
46,755
TOTAL POPULATION
23,310
MALE POPULATION
23,445
FEMALE POPULATION
99.42
MALES / 100 FEMALES
100.58
FEMALES / 100 MALES
36.3
MEDIAN AGE
2.9
AVG FAMILY SIZE
2.3
AVG HOUSEHOLD SIZE
24,659
LABOR FORCE [ PEOPLE ]
62.9%
PERCENT IN LABOR FORCE
5.4%
UNEMPLOYMENT RATE
Cortland County Area Codes
Income in Cortland County
Income Overview in Cortland County
Per Capita Income in Cortland County is $31,594, while median incomes of families and households are $80,814 and $65,029 respectively.
| Characteristic | Number | Measure |
| Per Capita Income | 46,755 | $31,594 |
| Median Family Income | 11,320 | $80,814 |
| Mean Family Income | 11,320 | $95,936 |
| Median Household Income | 18,514 | $65,029 |
| Mean Household Income | 18,514 | $79,172 |
| Income Deficit | 11,320 | $9,410 |
| Wage / Income Gap (%) | 46,755 | 25.21% |
| Wage / Income Gap ($) | 46,755 | 74.79¢ per $1 |
| Gini / Inequality Index | 46,755 | 0.41 |
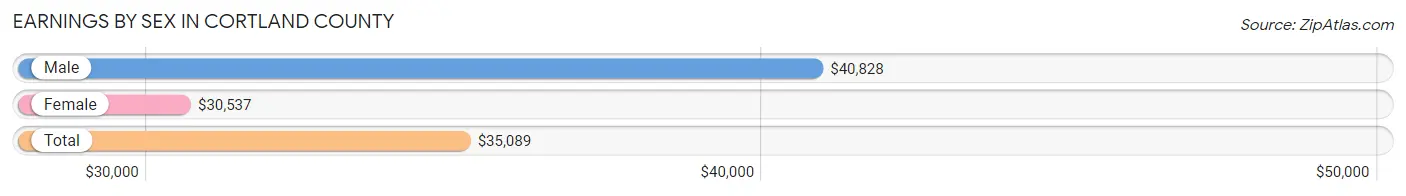
Earnings by Sex in Cortland County
Average Earnings in Cortland County are $35,089, $40,828 for men and $30,537 for women, a difference of 25.2%.
| Sex | Number | Average Earnings |
| Male | 13,546 (51.2%) | $40,828 |
| Female | 12,894 (48.8%) | $30,537 |
| Total | 26,440 (100.0%) | $35,089 |
Earnings by Sex by Income Bracket in Cortland County
The most common earnings brackets in Cortland County are $55,000 to $64,999 for men (1,483 | 11.0%) and $2,500 to $4,999 for women (1,120 | 8.7%).
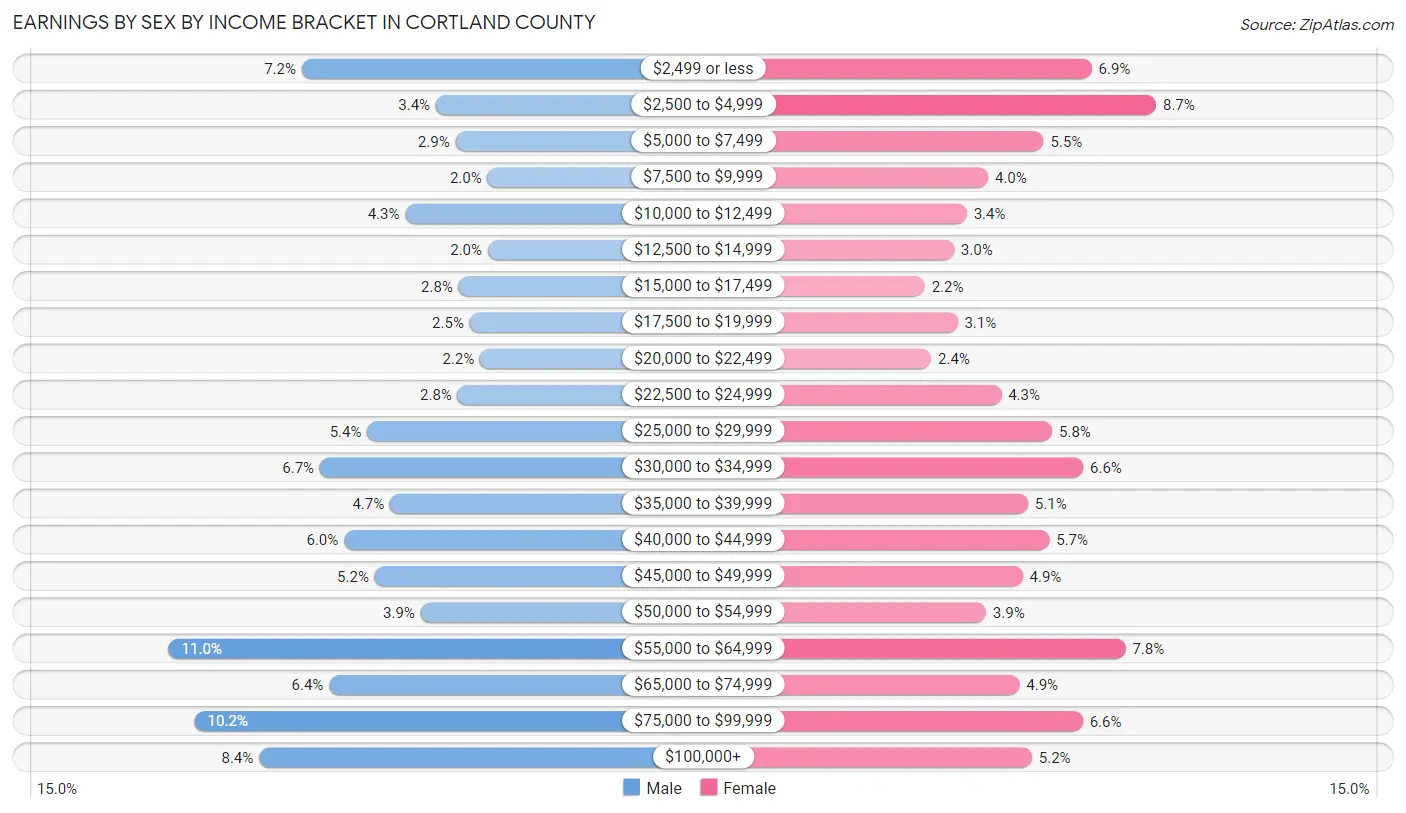
| Income | Male | Female |
| $2,499 or less | 976 (7.2%) | 887 (6.9%) |
| $2,500 to $4,999 | 466 (3.4%) | 1,120 (8.7%) |
| $5,000 to $7,499 | 392 (2.9%) | 713 (5.5%) |
| $7,500 to $9,999 | 270 (2.0%) | 512 (4.0%) |
| $10,000 to $12,499 | 583 (4.3%) | 435 (3.4%) |
| $12,500 to $14,999 | 268 (2.0%) | 388 (3.0%) |
| $15,000 to $17,499 | 379 (2.8%) | 283 (2.2%) |
| $17,500 to $19,999 | 337 (2.5%) | 401 (3.1%) |
| $20,000 to $22,499 | 298 (2.2%) | 305 (2.4%) |
| $22,500 to $24,999 | 383 (2.8%) | 560 (4.3%) |
| $25,000 to $29,999 | 728 (5.4%) | 744 (5.8%) |
| $30,000 to $34,999 | 907 (6.7%) | 856 (6.6%) |
| $35,000 to $39,999 | 641 (4.7%) | 656 (5.1%) |
| $40,000 to $44,999 | 816 (6.0%) | 734 (5.7%) |
| $45,000 to $49,999 | 699 (5.2%) | 637 (4.9%) |
| $50,000 to $54,999 | 524 (3.9%) | 504 (3.9%) |
| $55,000 to $64,999 | 1,483 (11.0%) | 1,009 (7.8%) |
| $65,000 to $74,999 | 872 (6.4%) | 625 (4.9%) |
| $75,000 to $99,999 | 1,385 (10.2%) | 855 (6.6%) |
| $100,000+ | 1,139 (8.4%) | 670 (5.2%) |
| Total | 13,546 (100.0%) | 12,894 (100.0%) |
Earnings by Sex by Educational Attainment in Cortland County
Average earnings in Cortland County are $49,007 for men and $41,439 for women, a difference of 15.4%. Men with an educational attainment of graduate degree enjoy the highest average annual earnings of $60,565, while those with less than high school education earn the least with $41,369. Women with an educational attainment of graduate degree earn the most with the average annual earnings of $63,647, while those with less than high school education have the smallest earnings of $21,089.
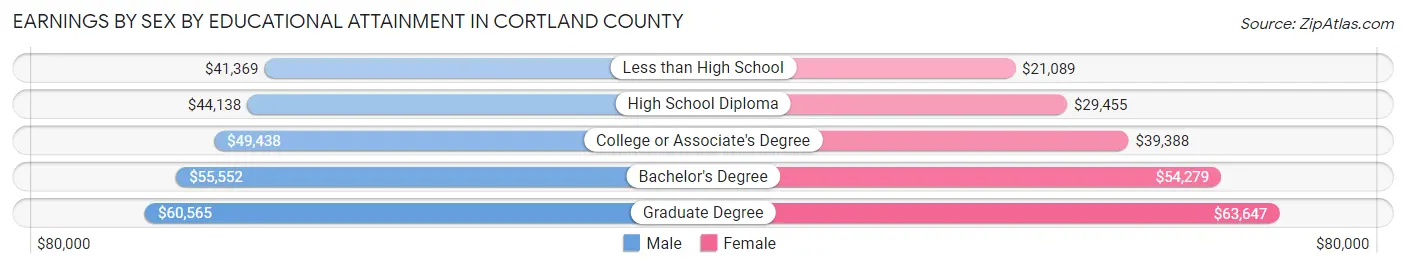
| Educational Attainment | Male Income | Female Income |
| Less than High School | $41,369 | $21,089 |
| High School Diploma | $44,138 | $29,455 |
| College or Associate's Degree | $49,438 | $39,388 |
| Bachelor's Degree | $55,552 | $54,279 |
| Graduate Degree | $60,565 | $63,647 |
| Total | $49,007 | $41,439 |
Family Income in Cortland County
Family Income Brackets in Cortland County
According to the Cortland County family income data, there are 2,377 families falling into the $50,000 to $74,999 income range, which is the most common income bracket and makes up 21.0% of all families. Conversely, the $10,000 to $14,999 income bracket is the least frequent group with only 170 families (1.5%) belonging to this category.
| Income Bracket | # Families | % Families |
| Less than $10,000 | 260 | 2.3% |
| $10,000 to $14,999 | 170 | 1.5% |
| $15,000 to $24,999 | 351 | 3.1% |
| $25,000 to $34,999 | 668 | 5.9% |
| $35,000 to $49,999 | 1,392 | 12.3% |
| $50,000 to $74,999 | 2,377 | 21.0% |
| $75,000 to $99,999 | 1,777 | 15.7% |
| $100,000 to $149,999 | 2,355 | 20.8% |
| $150,000 to $199,999 | 1,268 | 11.2% |
| $200,000+ | 702 | 6.2% |
Family Income by Famaliy Size in Cortland County
5-person families (958 | 8.5%) account for the highest median family income in Cortland County with $106,893 per family, while 2-person families (5,851 | 51.7%) have the highest median income of $35,544 per family member.
| Income Bracket | # Families | Median Income |
| 2-Person Families | 5,851 (51.7%) | $71,088 |
| 3-Person Families | 2,481 (21.9%) | $89,226 |
| 4-Person Families | 1,652 (14.6%) | $101,727 |
| 5-Person Families | 958 (8.5%) | $106,893 |
| 6-Person Families | 204 (1.8%) | $59,167 |
| 7+ Person Families | 174 (1.5%) | $94,750 |
| Total | 11,320 (100.0%) | $80,814 |
Family Income by Number of Earners in Cortland County
The median family income in Cortland County is $80,814, with families comprising 3+ earners (1,442) having the highest median family income of $136,773, while families with no earners (1,513) have the lowest median family income of $46,085, accounting for 12.7% and 13.4% of families, respectively.
| Number of Earners | # Families | Median Income |
| No Earners | 1,513 (13.4%) | $46,085 |
| 1 Earner | 3,695 (32.6%) | $60,763 |
| 2 Earners | 4,670 (41.2%) | $98,717 |
| 3+ Earners | 1,442 (12.7%) | $136,773 |
| Total | 11,320 (100.0%) | $80,814 |
Household Income in Cortland County
Household Income Brackets in Cortland County
With 3,814 households falling in the category, the $50,000 to $74,999 income range is the most frequent in Cortland County, accounting for 20.6% of all households. In contrast, only 685 households (3.7%) fall into the less than $10,000 income bracket, making it the least populous group.
| Income Bracket | # Households | % Households |
| Less than $10,000 | 685 | 3.7% |
| $10,000 to $14,999 | 963 | 5.2% |
| $15,000 to $24,999 | 1,463 | 7.9% |
| $25,000 to $34,999 | 1,555 | 8.4% |
| $35,000 to $49,999 | 2,351 | 12.7% |
| $50,000 to $74,999 | 3,814 | 20.6% |
| $75,000 to $99,999 | 2,425 | 13.1% |
| $100,000 to $149,999 | 3,055 | 16.5% |
| $150,000 to $199,999 | 1,407 | 7.6% |
| $200,000+ | 815 | 4.4% |
Household Income by Householder Age in Cortland County
The median household income in Cortland County is $65,029, with the highest median household income of $75,616 found in the 45 to 64 years age bracket for the primary householder. A total of 6,616 households (35.7%) fall into this category. Meanwhile, the 15 to 24 years age bracket for the primary householder has the lowest median household income of $48,852, with 1,605 households (8.7%) in this group.
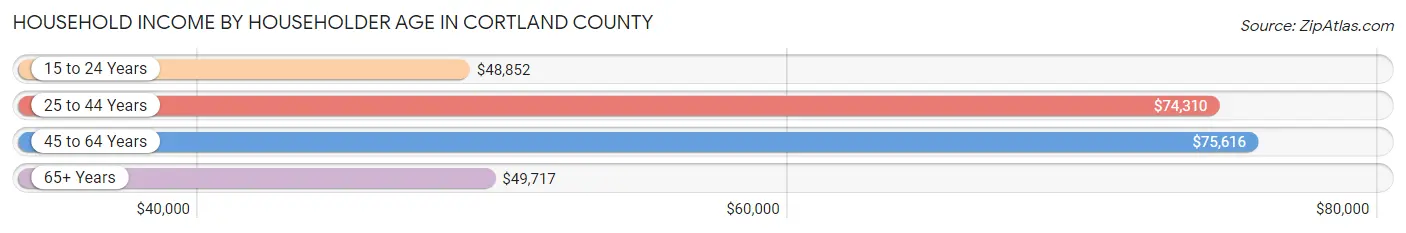
| Income Bracket | # Households | Median Income |
| 15 to 24 Years | 1,605 (8.7%) | $48,852 |
| 25 to 44 Years | 5,254 (28.4%) | $74,310 |
| 45 to 64 Years | 6,616 (35.7%) | $75,616 |
| 65+ Years | 5,039 (27.2%) | $49,717 |
| Total | 18,514 (100.0%) | $65,029 |
Poverty in Cortland County
Income Below Poverty by Sex and Age in Cortland County
With 11.8% poverty level for males and 14.0% for females among the residents of Cortland County, 18 to 24 year old males and 18 to 24 year old females are the most vulnerable to poverty, with 801 males (28.4%) and 799 females (27.3%) in their respective age groups living below the poverty level.
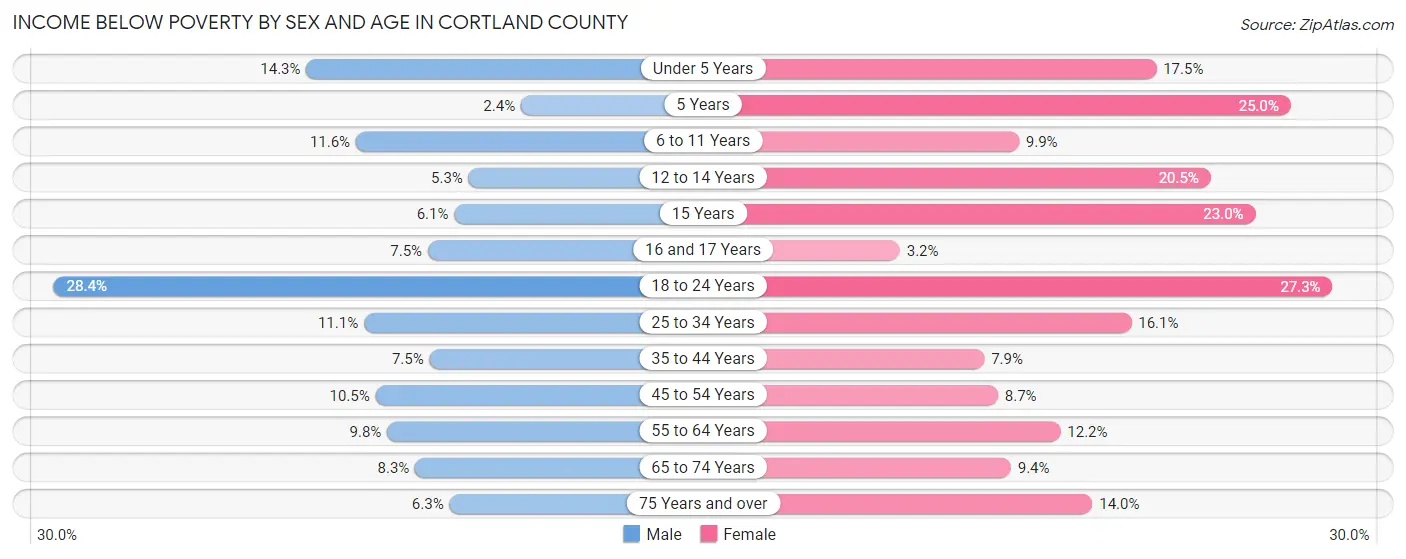
| Age Bracket | Male | Female |
| Under 5 Years | 168 (14.3%) | 180 (17.5%) |
| 5 Years | 7 (2.4%) | 54 (25.0%) |
| 6 to 11 Years | 177 (11.6%) | 131 (9.9%) |
| 12 to 14 Years | 38 (5.3%) | 130 (20.5%) |
| 15 Years | 13 (6.1%) | 35 (23.0%) |
| 16 and 17 Years | 50 (7.5%) | 19 (3.2%) |
| 18 to 24 Years | 801 (28.4%) | 799 (27.3%) |
| 25 to 34 Years | 286 (11.1%) | 415 (16.1%) |
| 35 to 44 Years | 189 (7.4%) | 183 (7.9%) |
| 45 to 54 Years | 286 (10.5%) | 219 (8.7%) |
| 55 to 64 Years | 307 (9.8%) | 367 (12.2%) |
| 65 to 74 Years | 177 (8.3%) | 219 (9.4%) |
| 75 Years and over | 78 (6.3%) | 247 (14.0%) |
| Total | 2,577 (11.8%) | 2,998 (14.0%) |
Income Above Poverty by Sex and Age in Cortland County
According to the poverty statistics in Cortland County, males aged 5 years and females aged 16 and 17 years are the age groups that are most secure financially, with 97.6% of males and 96.8% of females in these age groups living above the poverty line.
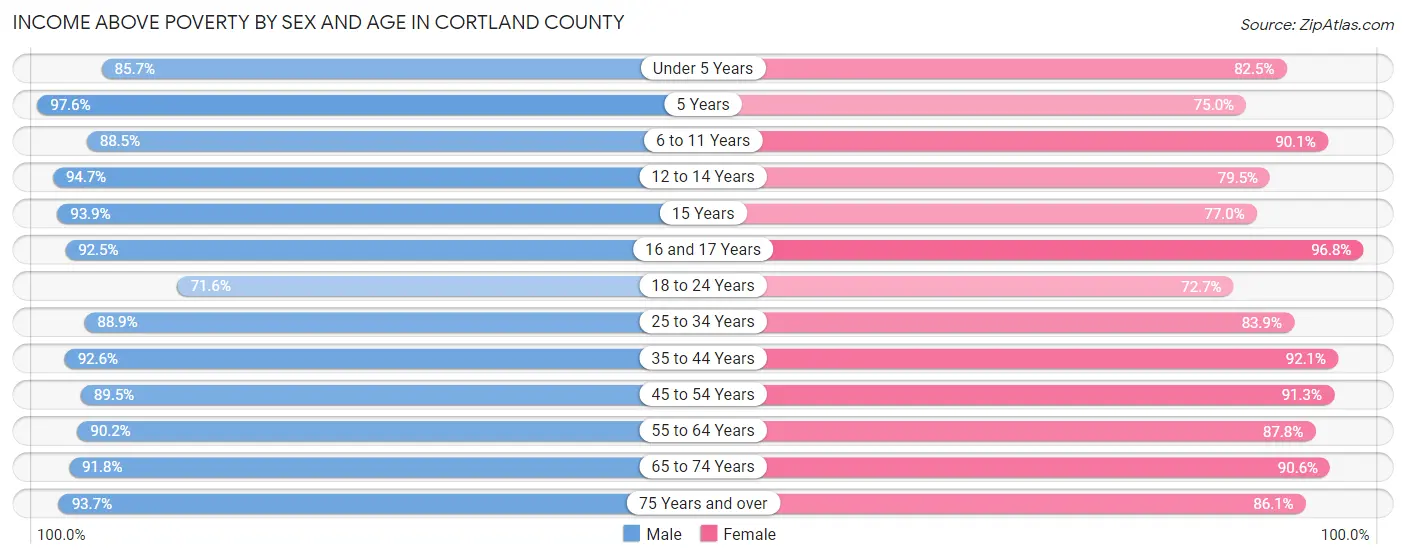
| Age Bracket | Male | Female |
| Under 5 Years | 1,006 (85.7%) | 848 (82.5%) |
| 5 Years | 290 (97.6%) | 162 (75.0%) |
| 6 to 11 Years | 1,356 (88.4%) | 1,197 (90.1%) |
| 12 to 14 Years | 683 (94.7%) | 503 (79.5%) |
| 15 Years | 201 (93.9%) | 117 (77.0%) |
| 16 and 17 Years | 613 (92.5%) | 569 (96.8%) |
| 18 to 24 Years | 2,021 (71.6%) | 2,126 (72.7%) |
| 25 to 34 Years | 2,290 (88.9%) | 2,159 (83.9%) |
| 35 to 44 Years | 2,349 (92.5%) | 2,126 (92.1%) |
| 45 to 54 Years | 2,447 (89.5%) | 2,301 (91.3%) |
| 55 to 64 Years | 2,823 (90.2%) | 2,648 (87.8%) |
| 65 to 74 Years | 1,969 (91.7%) | 2,109 (90.6%) |
| 75 Years and over | 1,152 (93.7%) | 1,524 (86.1%) |
| Total | 19,200 (88.2%) | 18,389 (86.0%) |
Income Below Poverty Among Married-Couple Families in Cortland County
The poverty statistics for married-couple families in Cortland County show that 3.5% or 294 of the total 8,370 families live below the poverty line. Families with 5 or more children have the highest poverty rate of 45.9%, comprising of 39 families. On the other hand, families with 1 or 2 children have the lowest poverty rate of 1.6%, which includes 44 families.
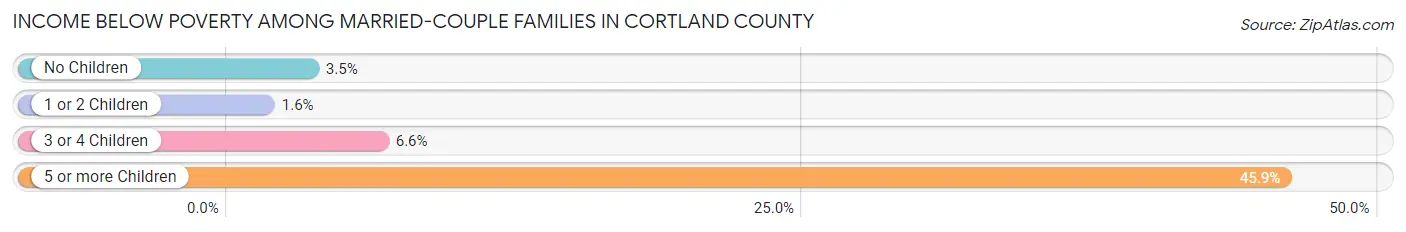
| Children | Above Poverty | Below Poverty |
| No Children | 4,848 (96.5%) | 177 (3.5%) |
| 1 or 2 Children | 2,698 (98.4%) | 44 (1.6%) |
| 3 or 4 Children | 484 (93.4%) | 34 (6.6%) |
| 5 or more Children | 46 (54.1%) | 39 (45.9%) |
| Total | 8,076 (96.5%) | 294 (3.5%) |
Income Below Poverty Among Single-Parent Households in Cortland County
According to the poverty data in Cortland County, 7.3% or 74 single-father households and 22.4% or 433 single-mother households are living below the poverty line. Among single-father households, those with 3 or 4 children have the highest poverty rate, with 15 households (12.1%) experiencing poverty. Likewise, among single-mother households, those with 5 or more children have the highest poverty rate, with 24 households (85.7%) falling below the poverty line.
| Children | Single Father | Single Mother |
| No Children | 19 (6.9%) | 71 (9.0%) |
| 1 or 2 Children | 38 (6.4%) | 272 (29.2%) |
| 3 or 4 Children | 15 (12.1%) | 66 (35.5%) |
| 5 or more Children | 2 (9.1%) | 24 (85.7%) |
| Total | 74 (7.3%) | 433 (22.4%) |
Income Below Poverty Among Married-Couple vs Single-Parent Households in Cortland County
The poverty data for Cortland County shows that 294 of the married-couple family households (3.5%) and 507 of the single-parent households (17.2%) are living below the poverty level. Within the married-couple family households, those with 5 or more children have the highest poverty rate, with 39 households (45.9%) falling below the poverty line. Among the single-parent households, those with 5 or more children have the highest poverty rate, with 26 household (52.0%) living below poverty.
| Children | Married-Couple Families | Single-Parent Households |
| No Children | 177 (3.5%) | 90 (8.4%) |
| 1 or 2 Children | 44 (1.6%) | 310 (20.3%) |
| 3 or 4 Children | 34 (6.6%) | 81 (26.1%) |
| 5 or more Children | 39 (45.9%) | 26 (52.0%) |
| Total | 294 (3.5%) | 507 (17.2%) |
Race in Cortland County
The most populous races in Cortland County are White / Caucasian (42,782 | 91.5%), Two or more Races (1,735 | 3.7%), and Hispanic or Latino (1,408 | 3.0%).
| Race | # Population | % Population |
| Asian | 596 | 1.3% |
| Black / African American | 998 | 2.1% |
| Hawaiian / Pacific | 0 | 0.0% |
| Hispanic or Latino | 1,408 | 3.0% |
| Native / Alaskan | 45 | 0.1% |
| White / Caucasian | 42,782 | 91.5% |
| Two or more Races | 1,735 | 3.7% |
| Some other Race | 599 | 1.3% |
| Total | 46,755 | 100.0% |
Ancestry in Cortland County
The most populous ancestries reported in Cortland County are Irish (7,545 | 16.1%), English (7,426 | 15.9%), German (6,475 | 13.9%), Italian (4,452 | 9.5%), and American (3,758 | 8.0%), together accounting for 63.4% of all Cortland County residents.
| Ancestry | # Population | % Population |
| African | 18 | 0.0% |
| American | 3,758 | 8.0% |
| Arab | 193 | 0.4% |
| Austrian | 66 | 0.1% |
| Barbadian | 29 | 0.1% |
| Belgian | 2 | 0.0% |
| Bhutanese | 184 | 0.4% |
| Blackfeet | 12 | 0.0% |
| Bolivian | 4 | 0.0% |
| Brazilian | 35 | 0.1% |
| British | 345 | 0.7% |
| Burmese | 39 | 0.1% |
| Canadian | 50 | 0.1% |
| Cape Verdean | 2 | 0.0% |
| Celtic | 8 | 0.0% |
| Central American | 42 | 0.1% |
| Central American Indian | 221 | 0.5% |
| Cherokee | 116 | 0.3% |
| Chilean | 53 | 0.1% |
| Colombian | 103 | 0.2% |
| Croatian | 33 | 0.1% |
| Crow | 1 | 0.0% |
| Cuban | 17 | 0.0% |
| Czech | 167 | 0.4% |
| Czechoslovakian | 52 | 0.1% |
| Danish | 68 | 0.2% |
| Dominican | 72 | 0.2% |
| Dutch | 837 | 1.8% |
| Eastern European | 136 | 0.3% |
| Ecuadorian | 4 | 0.0% |
| English | 7,426 | 15.9% |
| Ethiopian | 20 | 0.0% |
| European | 794 | 1.7% |
| Finnish | 20 | 0.0% |
| French | 897 | 1.9% |
| French Canadian | 442 | 0.9% |
| German | 6,475 | 13.9% |
| Ghanaian | 8 | 0.0% |
| Greek | 124 | 0.3% |
| Guatemalan | 14 | 0.0% |
| Haitian | 2 | 0.0% |
| Hungarian | 144 | 0.3% |
| Icelander | 2 | 0.0% |
| Indian (Asian) | 365 | 0.8% |
| Iranian | 13 | 0.0% |
| Irish | 7,545 | 16.1% |
| Iroquois | 31 | 0.1% |
| Italian | 4,452 | 9.5% |
| Jamaican | 8 | 0.0% |
| Jordanian | 5 | 0.0% |
| Korean | 49 | 0.1% |
| Lebanese | 76 | 0.2% |
| Lithuanian | 108 | 0.2% |
| Luxembourger | 7 | 0.0% |
| Macedonian | 77 | 0.2% |
| Malaysian | 15 | 0.0% |
| Maltese | 3 | 0.0% |
| Mexican | 165 | 0.4% |
| Nigerian | 30 | 0.1% |
| Northern European | 100 | 0.2% |
| Norwegian | 134 | 0.3% |
| Panamanian | 7 | 0.0% |
| Pennsylvania German | 329 | 0.7% |
| Peruvian | 23 | 0.1% |
| Polish | 1,374 | 2.9% |
| Portuguese | 27 | 0.1% |
| Puerto Rican | 545 | 1.2% |
| Romanian | 16 | 0.0% |
| Russian | 296 | 0.6% |
| Salvadoran | 14 | 0.0% |
| Scandinavian | 63 | 0.1% |
| Scotch-Irish | 341 | 0.7% |
| Scottish | 843 | 1.8% |
| Sioux | 3 | 0.0% |
| Slavic | 7 | 0.0% |
| Slovak | 27 | 0.1% |
| Slovene | 40 | 0.1% |
| South American | 187 | 0.4% |
| Spaniard | 198 | 0.4% |
| Spanish | 81 | 0.2% |
| Sri Lankan | 15 | 0.0% |
| Subsaharan African | 70 | 0.2% |
| Swedish | 393 | 0.8% |
| Swiss | 119 | 0.3% |
| Syrian | 112 | 0.2% |
| Thai | 76 | 0.2% |
| Turkish | 38 | 0.1% |
| Ukrainian | 282 | 0.6% |
| Welsh | 526 | 1.1% |
| West Indian | 56 | 0.1% |
| Yugoslavian | 18 | 0.0% | View All 91 Rows |
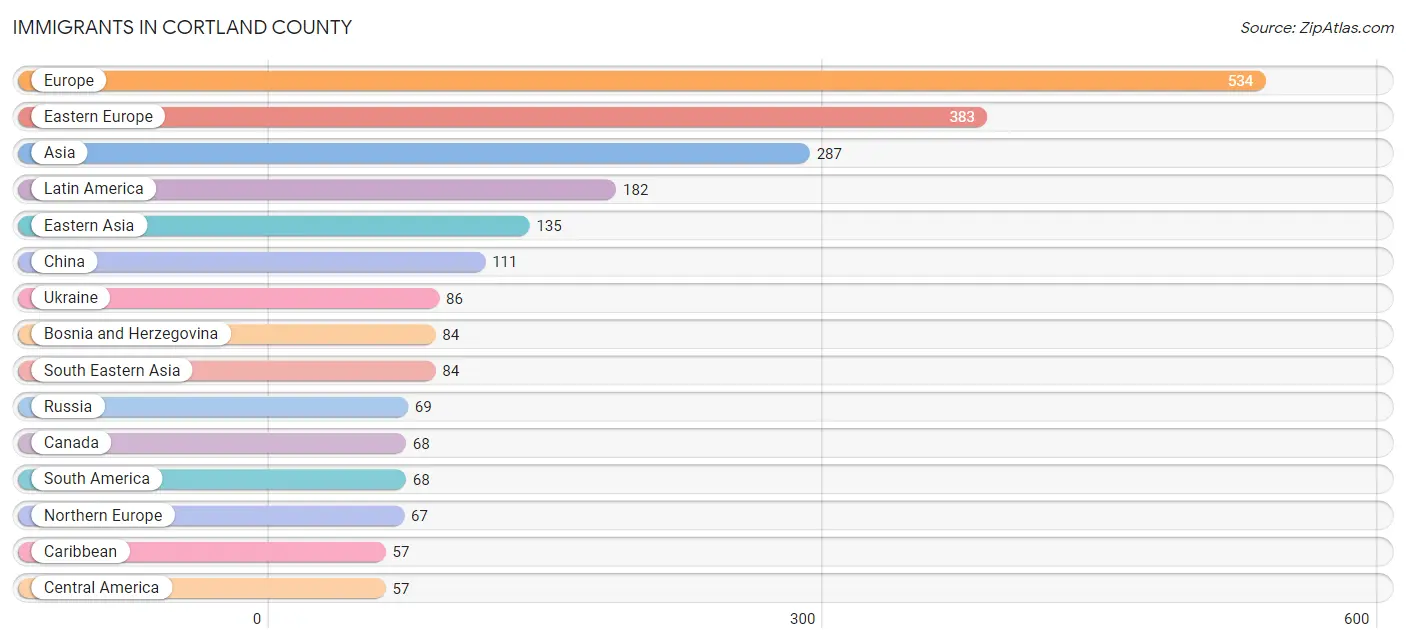
Immigrants in Cortland County
The most numerous immigrant groups reported in Cortland County came from Europe (534 | 1.1%), Eastern Europe (383 | 0.8%), Asia (287 | 0.6%), Latin America (182 | 0.4%), and Eastern Asia (135 | 0.3%), together accounting for 3.3% of all Cortland County residents.
| Immigration Origin | # Population | % Population |
| Africa | 56 | 0.1% |
| Asia | 287 | 0.6% |
| Australia | 6 | 0.0% |
| Bangladesh | 16 | 0.0% |
| Barbados | 29 | 0.1% |
| Bolivia | 4 | 0.0% |
| Bosnia and Herzegovina | 84 | 0.2% |
| Brazil | 38 | 0.1% |
| Cabo Verde | 2 | 0.0% |
| Canada | 68 | 0.2% |
| Caribbean | 57 | 0.1% |
| Central America | 57 | 0.1% |
| China | 111 | 0.2% |
| Colombia | 3 | 0.0% |
| Croatia | 7 | 0.0% |
| Czechoslovakia | 49 | 0.1% |
| Dominican Republic | 8 | 0.0% |
| Eastern Africa | 20 | 0.0% |
| Eastern Asia | 135 | 0.3% |
| Eastern Europe | 383 | 0.8% |
| Ecuador | 9 | 0.0% |
| England | 30 | 0.1% |
| Ethiopia | 20 | 0.0% |
| Europe | 534 | 1.1% |
| France | 5 | 0.0% |
| Germany | 27 | 0.1% |
| Ghana | 7 | 0.0% |
| Guyana | 7 | 0.0% |
| Haiti | 15 | 0.0% |
| Honduras | 3 | 0.0% |
| Hungary | 1 | 0.0% |
| India | 25 | 0.1% |
| Indonesia | 7 | 0.0% |
| Italy | 42 | 0.1% |
| Jamaica | 5 | 0.0% |
| Japan | 24 | 0.1% |
| Jordan | 5 | 0.0% |
| Laos | 15 | 0.0% |
| Latin America | 182 | 0.4% |
| Lebanon | 13 | 0.0% |
| Lithuania | 1 | 0.0% |
| Mexico | 52 | 0.1% |
| Nigeria | 27 | 0.1% |
| Northern Europe | 67 | 0.1% |
| Norway | 2 | 0.0% |
| Oceania | 14 | 0.0% |
| Panama | 2 | 0.0% |
| Peru | 7 | 0.0% |
| Philippines | 38 | 0.1% |
| Poland | 4 | 0.0% |
| Portugal | 3 | 0.0% |
| Russia | 69 | 0.2% |
| South America | 68 | 0.2% |
| South Central Asia | 41 | 0.1% |
| South Eastern Asia | 84 | 0.2% |
| Southern Europe | 52 | 0.1% |
| Spain | 4 | 0.0% |
| Sweden | 13 | 0.0% |
| Taiwan | 8 | 0.0% |
| Thailand | 15 | 0.0% |
| Turkey | 9 | 0.0% |
| Ukraine | 86 | 0.2% |
| Vietnam | 9 | 0.0% |
| Western Africa | 36 | 0.1% |
| Western Asia | 27 | 0.1% |
| Western Europe | 32 | 0.1% | View All 66 Rows |
Sex and Age in Cortland County
Sex and Age in Cortland County
The most populous age groups in Cortland County are 20 to 24 Years (2,633 | 11.3%) for men and 20 to 24 Years (3,007 | 12.8%) for women.
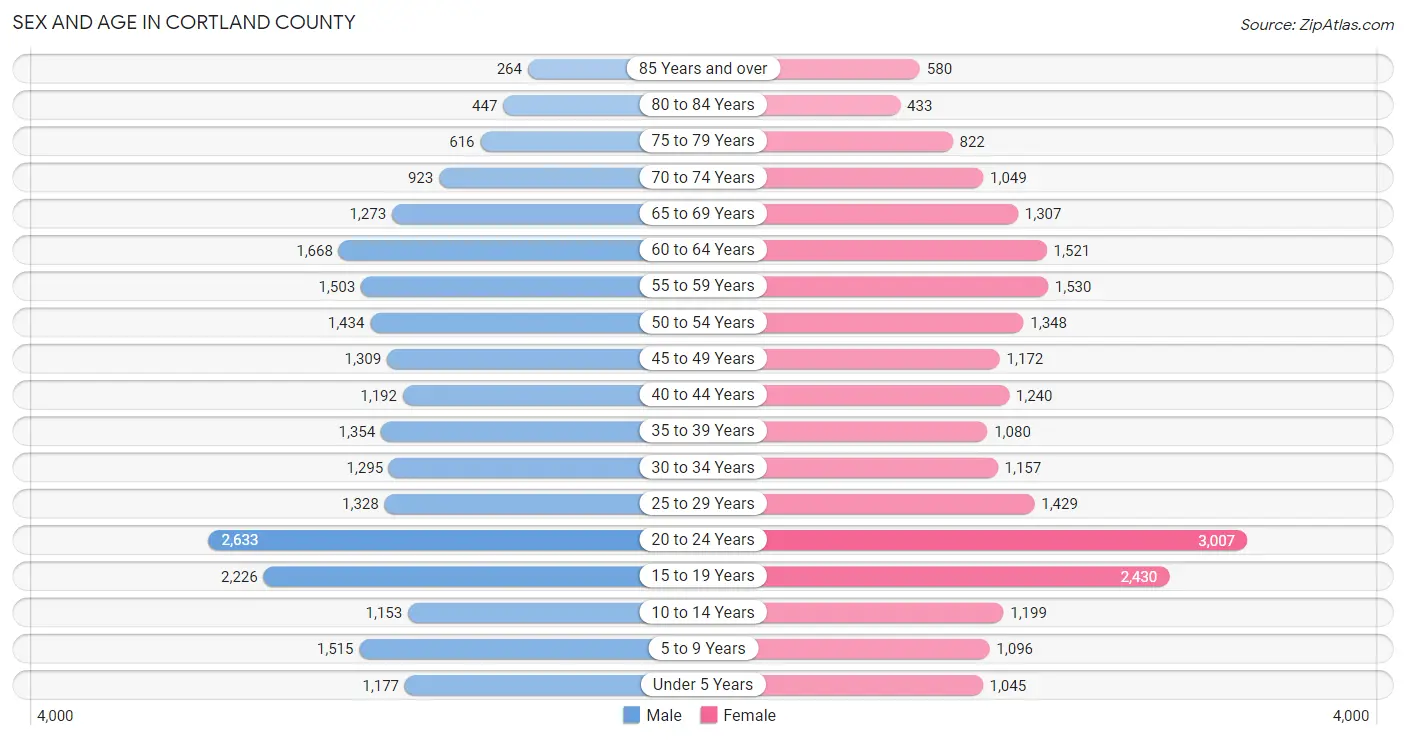
| Age Bracket | Male | Female |
| Under 5 Years | 1,177 (5.1%) | 1,045 (4.5%) |
| 5 to 9 Years | 1,515 (6.5%) | 1,096 (4.7%) |
| 10 to 14 Years | 1,153 (5.0%) | 1,199 (5.1%) |
| 15 to 19 Years | 2,226 (9.6%) | 2,430 (10.4%) |
| 20 to 24 Years | 2,633 (11.3%) | 3,007 (12.8%) |
| 25 to 29 Years | 1,328 (5.7%) | 1,429 (6.1%) |
| 30 to 34 Years | 1,295 (5.6%) | 1,157 (4.9%) |
| 35 to 39 Years | 1,354 (5.8%) | 1,080 (4.6%) |
| 40 to 44 Years | 1,192 (5.1%) | 1,240 (5.3%) |
| 45 to 49 Years | 1,309 (5.6%) | 1,172 (5.0%) |
| 50 to 54 Years | 1,434 (6.1%) | 1,348 (5.8%) |
| 55 to 59 Years | 1,503 (6.5%) | 1,530 (6.5%) |
| 60 to 64 Years | 1,668 (7.2%) | 1,521 (6.5%) |
| 65 to 69 Years | 1,273 (5.5%) | 1,307 (5.6%) |
| 70 to 74 Years | 923 (4.0%) | 1,049 (4.5%) |
| 75 to 79 Years | 616 (2.6%) | 822 (3.5%) |
| 80 to 84 Years | 447 (1.9%) | 433 (1.8%) |
| 85 Years and over | 264 (1.1%) | 580 (2.5%) |
| Total | 23,310 (100.0%) | 23,445 (100.0%) |
Families and Households in Cortland County
Median Family Size in Cortland County
The median family size in Cortland County is 2.85 persons per family, with married-couple families (8,370 | 73.9%) accounting for the largest median family size of 2.96 persons per family. On the other hand, single female/mother families (1,937 | 17.1%) represent the smallest median family size with 2.51 persons per family.
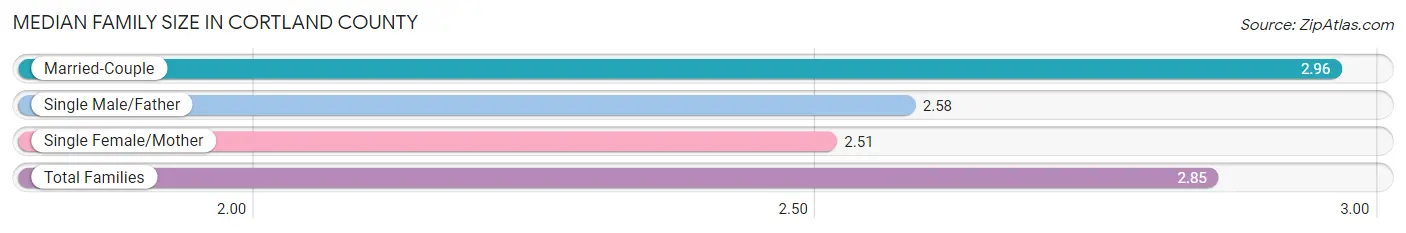
| Family Type | # Families | Family Size |
| Married-Couple | 8,370 (73.9%) | 2.96 |
| Single Male/Father | 1,013 (8.9%) | 2.58 |
| Single Female/Mother | 1,937 (17.1%) | 2.51 |
| Total Families | 11,320 (100.0%) | 2.85 |
Median Household Size in Cortland County
The median household size in Cortland County is 2.33 persons per household, with single male/father households (1,013 | 5.5%) accounting for the largest median household size of 3.22 persons per household. non-family households (7,194 | 38.9%) represent the smallest median household size with 1.32 persons per household.
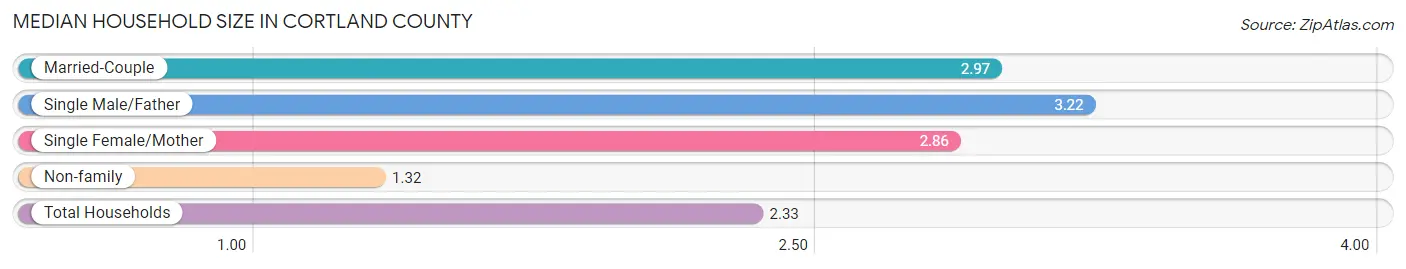
| Household Type | # Households | Household Size |
| Married-Couple | 8,370 (45.2%) | 2.97 |
| Single Male/Father | 1,013 (5.5%) | 3.22 |
| Single Female/Mother | 1,937 (10.5%) | 2.86 |
| Non-family | 7,194 (38.9%) | 1.32 |
| Total Households | 18,514 (100.0%) | 2.33 |
Household Size by Marriage Status in Cortland County
Out of a total of 18,514 households in Cortland County, 11,320 (61.1%) are family households, while 7,194 (38.9%) are nonfamily households. The most numerous type of family households are 2-person households, comprising 5,315, and the most common type of nonfamily households are 1-person households, comprising 5,299.
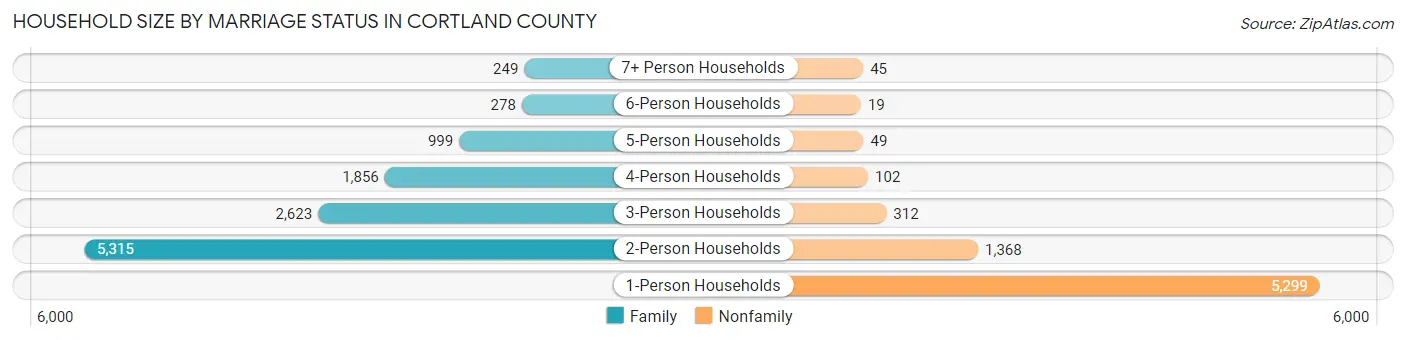
| Household Size | Family Households | Nonfamily Households |
| 1-Person Households | - | 5,299 (28.6%) |
| 2-Person Households | 5,315 (28.7%) | 1,368 (7.4%) |
| 3-Person Households | 2,623 (14.2%) | 312 (1.7%) |
| 4-Person Households | 1,856 (10.0%) | 102 (0.5%) |
| 5-Person Households | 999 (5.4%) | 49 (0.3%) |
| 6-Person Households | 278 (1.5%) | 19 (0.1%) |
| 7+ Person Households | 249 (1.3%) | 45 (0.2%) |
| Total | 11,320 (61.1%) | 7,194 (38.9%) |
Female Fertility in Cortland County
Fertility by Age in Cortland County
Average fertility rate in Cortland County is 49.0 births per 1,000 women. Women in the age bracket of 20 to 34 years have the highest fertility rate with 70.0 births per 1,000 women. Women in the age bracket of 20 to 34 years acount for 67.4% of all women with births.
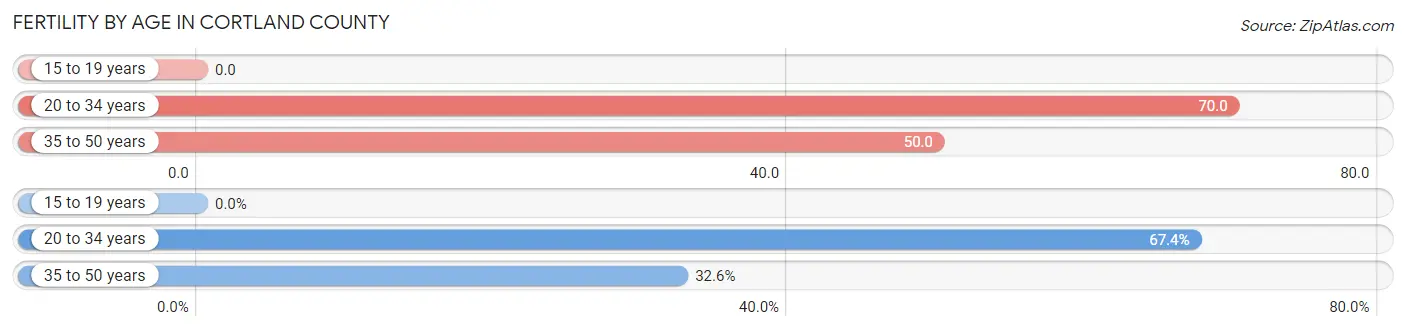
| Age Bracket | Women with Births | Births / 1,000 Women |
| 15 to 19 years | 0 (0.0%) | 0.0 |
| 20 to 34 years | 391 (67.4%) | 70.0 |
| 35 to 50 years | 189 (32.6%) | 50.0 |
| Total | 580 (100.0%) | 49.0 |
Fertility by Age by Marriage Status in Cortland County
68.1% of women with births (580) in Cortland County are married. The highest percentage of unmarried women with births falls into 20 to 34 years age bracket with 45.8% of them unmarried at the time of birth, while the lowest percentage of unmarried women with births belong to 35 to 50 years age bracket with 3.2% of them unmarried.
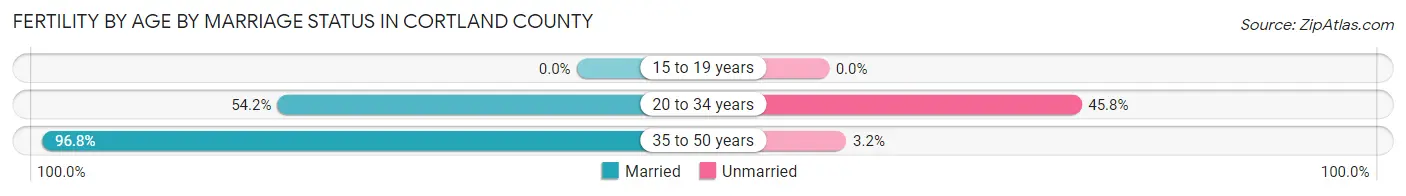
| Age Bracket | Married | Unmarried |
| 15 to 19 years | 0 (0.0%) | 0 (0.0%) |
| 20 to 34 years | 212 (54.2%) | 179 (45.8%) |
| 35 to 50 years | 183 (96.8%) | 6 (3.2%) |
| Total | 395 (68.1%) | 185 (31.9%) |
Fertility by Education in Cortland County
Average fertility rate in Cortland County is 49.0 births per 1,000 women. Women with the education attainment of high school diploma have the highest fertility rate of 91.0 births per 1,000 women, while women with the education attainment of bachelor's degree have the lowest fertility at 27.0 births per 1,000 women. Women with the education attainment of high school diploma represent 38.1% of all women with births.
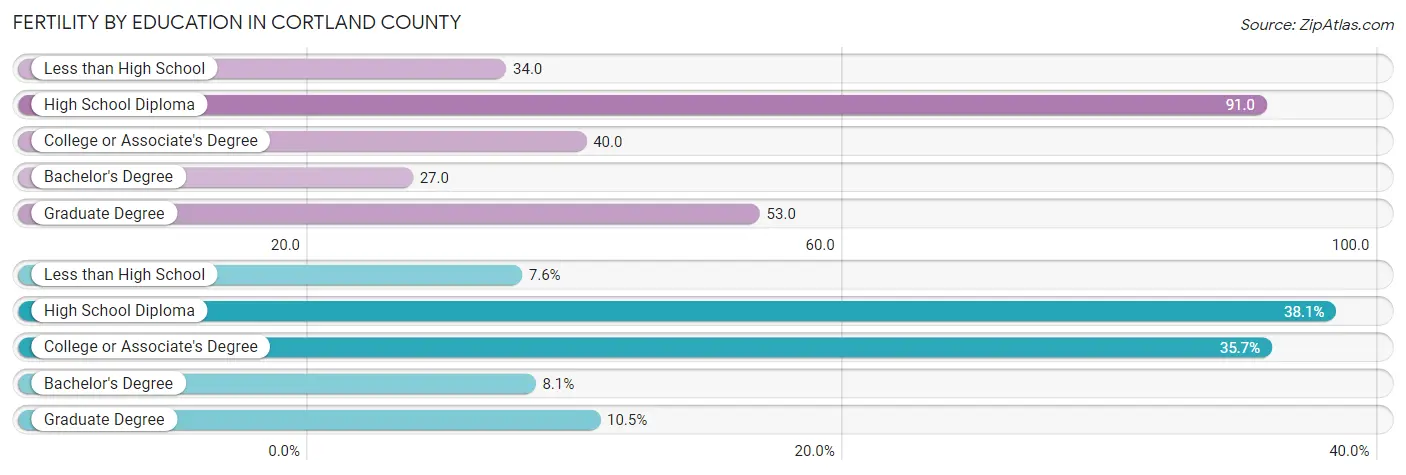
| Educational Attainment | Women with Births | Births / 1,000 Women |
| Less than High School | 44 (7.6%) | 34.0 |
| High School Diploma | 221 (38.1%) | 91.0 |
| College or Associate's Degree | 207 (35.7%) | 40.0 |
| Bachelor's Degree | 47 (8.1%) | 27.0 |
| Graduate Degree | 61 (10.5%) | 53.0 |
| Total | 580 (100.0%) | 49.0 |
Fertility by Education by Marriage Status in Cortland County
31.9% of women with births in Cortland County are unmarried. Women with the educational attainment of graduate degree are most likely to be married with 100.0% of them married at childbirth, while women with the educational attainment of high school diploma are least likely to be married with 47.5% of them unmarried at childbirth.
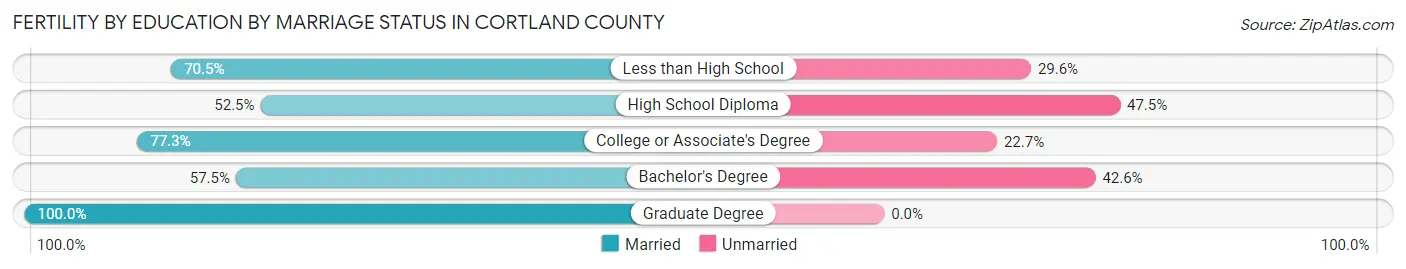
| Educational Attainment | Married | Unmarried |
| Less than High School | 31 (70.5%) | 13 (29.5%) |
| High School Diploma | 116 (52.5%) | 105 (47.5%) |
| College or Associate's Degree | 160 (77.3%) | 47 (22.7%) |
| Bachelor's Degree | 27 (57.5%) | 20 (42.5%) |
| Graduate Degree | 61 (100.0%) | 0 (0.0%) |
| Total | 395 (68.1%) | 185 (31.9%) |
Employment Characteristics in Cortland County
Employment by Class of Employer in Cortland County
Among the 22,643 employed individuals in Cortland County, private company employees (13,588 | 60.0%), not-for-profit organizations (2,720 | 12.0%), and local government employees (2,414 | 10.7%) make up the most common classes of employment.
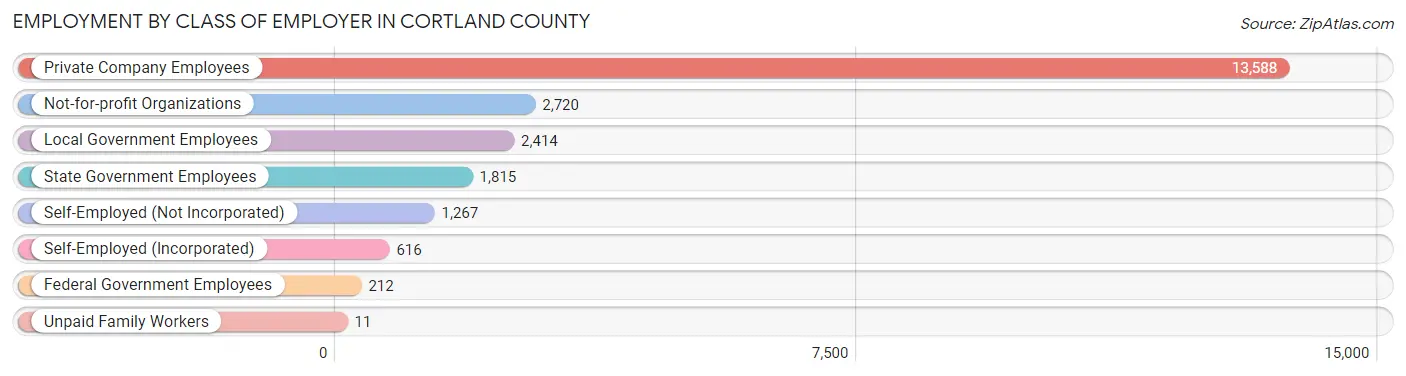
| Employer Class | # Employees | % Employees |
| Private Company Employees | 13,588 | 60.0% |
| Self-Employed (Incorporated) | 616 | 2.7% |
| Self-Employed (Not Incorporated) | 1,267 | 5.6% |
| Not-for-profit Organizations | 2,720 | 12.0% |
| Local Government Employees | 2,414 | 10.7% |
| State Government Employees | 1,815 | 8.0% |
| Federal Government Employees | 212 | 0.9% |
| Unpaid Family Workers | 11 | 0.1% |
| Total | 22,643 | 100.0% |
Employment Status by Age in Cortland County
According to the labor force statistics for Cortland County, out of the total population over 16 years of age (39,204), 62.9% or 24,659 individuals are in the labor force, with 5.4% or 1,332 of them unemployed. The age group with the highest labor force participation rate is 25 to 29 years, with 89.4% or 2,465 individuals in the labor force. Within the labor force, the 16 to 19 years age range has the highest percentage of unemployed individuals, with 13.2% or 193 of them being unemployed.
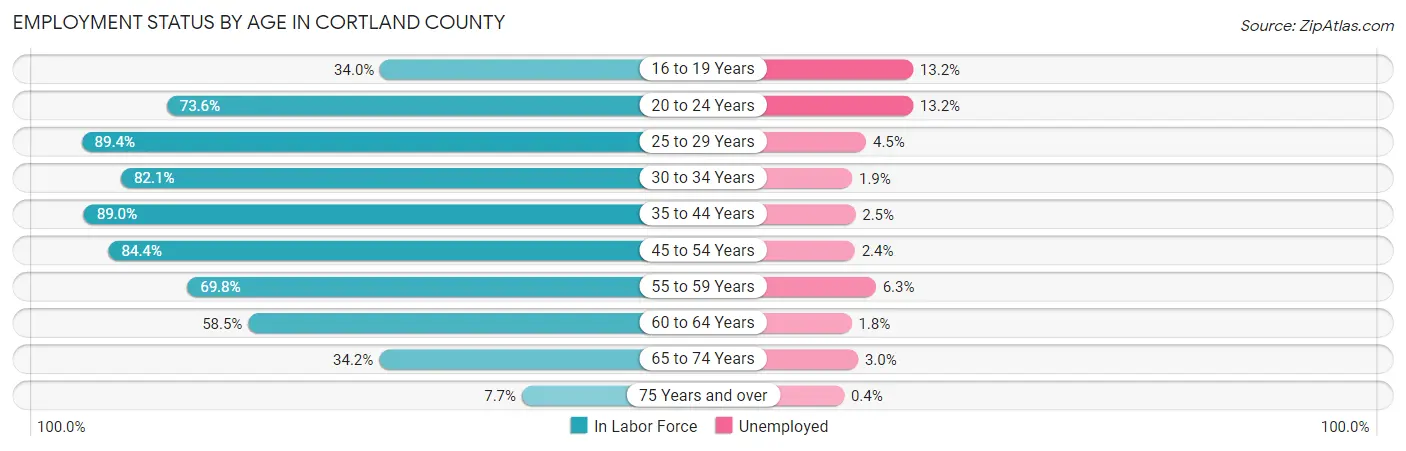
| Age Bracket | In Labor Force | Unemployed |
| 16 to 19 Years | 1,459 (34.0%) | 193 (13.2%) |
| 20 to 24 Years | 4,151 (73.6%) | 548 (13.2%) |
| 25 to 29 Years | 2,465 (89.4%) | 111 (4.5%) |
| 30 to 34 Years | 2,013 (82.1%) | 38 (1.9%) |
| 35 to 44 Years | 4,331 (89.0%) | 108 (2.5%) |
| 45 to 54 Years | 4,442 (84.4%) | 107 (2.4%) |
| 55 to 59 Years | 2,117 (69.8%) | 133 (6.3%) |
| 60 to 64 Years | 1,866 (58.5%) | 34 (1.8%) |
| 65 to 74 Years | 1,557 (34.2%) | 47 (3.0%) |
| 75 Years and over | 243 (7.7%) | 1 (0.4%) |
| Total | 24,659 (62.9%) | 1,332 (5.4%) |
Employment Status by Educational Attainment in Cortland County
According to labor force statistics for Cortland County, 79.9% of individuals (17,226) out of the total population between 25 and 64 years of age (21,560) are in the labor force, with 3.1% or 534 of them being unemployed. The group with the highest labor force participation rate are those with the educational attainment of bachelor's degree or higher, with 88.6% or 5,410 individuals in the labor force. Within the labor force, individuals with less than high school education have the highest percentage of unemployment, with 8.1% or 72 of them being unemployed.
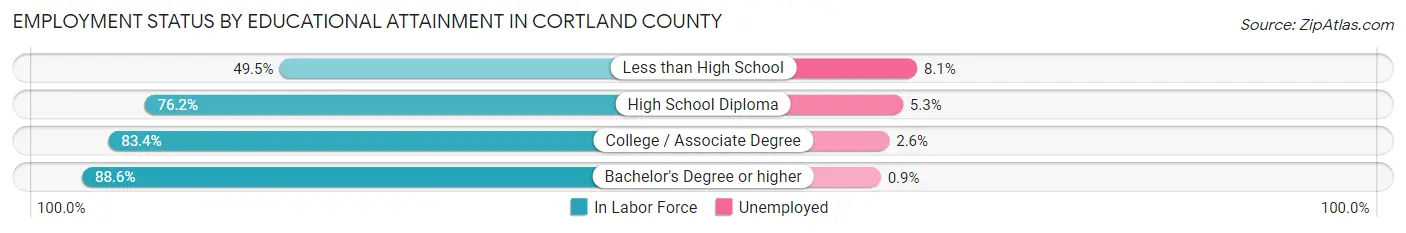
| Educational Attainment | In Labor Force | Unemployed |
| Less than High School | 890 (49.5%) | 146 (8.1%) |
| High School Diploma | 4,802 (76.2%) | 334 (5.3%) |
| College / Associate Degree | 6,134 (83.4%) | 191 (2.6%) |
| Bachelor's Degree or higher | 5,410 (88.6%) | 55 (0.9%) |
| Total | 17,226 (79.9%) | 668 (3.1%) |
Employment Occupations by Sex in Cortland County
Management, Business, Science and Arts Occupations
The most common Management, Business, Science and Arts occupations in Cortland County are Community & Social Service (3,012 | 12.9%), Management (2,181 | 9.4%), Education Instruction & Library (2,040 | 8.8%), Health Diagnosing & Treating (1,552 | 6.7%), and Computers, Engineering & Science (1,386 | 5.9%).
Management, Business, Science and Arts Occupations by Sex
Within the Management, Business, Science and Arts occupations in Cortland County, the most male-oriented occupations are Computers & Mathematics (81.1%), Architecture & Engineering (74.7%), and Computers, Engineering & Science (68.0%), while the most female-oriented occupations are Life, Physical & Social Science (82.6%), Health Diagnosing & Treating (81.1%), and Health Technologists (79.2%).
| Occupation | Male | Female |
| Management | 1,375 (63.0%) | 806 (37.0%) |
| Business & Financial | 298 (41.8%) | 414 (58.2%) |
| Computers, Engineering & Science | 943 (68.0%) | 443 (32.0%) |
| Computers & Mathematics | 335 (81.1%) | 78 (18.9%) |
| Architecture & Engineering | 572 (74.7%) | 194 (25.3%) |
| Life, Physical & Social Science | 36 (17.4%) | 171 (82.6%) |
| Community & Social Service | 841 (27.9%) | 2,171 (72.1%) |
| Education, Arts & Media | 186 (43.0%) | 247 (57.0%) |
| Legal Services & Support | 39 (21.3%) | 144 (78.7%) |
| Education Instruction & Library | 488 (23.9%) | 1,552 (76.1%) |
| Arts, Media & Entertainment | 128 (36.0%) | 228 (64.0%) |
| Health Diagnosing & Treating | 293 (18.9%) | 1,259 (81.1%) |
| Health Technologists | 181 (20.8%) | 691 (79.2%) |
| Total (Category) | 3,750 (42.4%) | 5,093 (57.6%) |
| Total (Overall) | 11,969 (51.4%) | 11,316 (48.6%) |
Services Occupations
The most common Services occupations in Cortland County are Food Preparation & Serving (2,082 | 8.9%), Cleaning & Maintenance (927 | 4.0%), Healthcare Support (898 | 3.9%), Security & Protection (668 | 2.9%), and Personal Care & Service (661 | 2.8%).
Services Occupations by Sex
Within the Services occupations in Cortland County, the most male-oriented occupations are Law Enforcement (83.5%), Security & Protection (73.7%), and Firefighting & Prevention (67.8%), while the most female-oriented occupations are Healthcare Support (88.7%), Personal Care & Service (65.5%), and Food Preparation & Serving (65.2%).
| Occupation | Male | Female |
| Healthcare Support | 101 (11.3%) | 797 (88.7%) |
| Security & Protection | 492 (73.7%) | 176 (26.4%) |
| Firefighting & Prevention | 284 (67.8%) | 135 (32.2%) |
| Law Enforcement | 208 (83.5%) | 41 (16.5%) |
| Food Preparation & Serving | 724 (34.8%) | 1,358 (65.2%) |
| Cleaning & Maintenance | 610 (65.8%) | 317 (34.2%) |
| Personal Care & Service | 228 (34.5%) | 433 (65.5%) |
| Total (Category) | 2,155 (41.2%) | 3,081 (58.8%) |
| Total (Overall) | 11,969 (51.4%) | 11,316 (48.6%) |
Sales and Office Occupations
The most common Sales and Office occupations in Cortland County are Sales & Related (2,203 | 9.5%), and Office & Administration (1,939 | 8.3%).
Sales and Office Occupations by Sex
| Occupation | Male | Female |
| Sales & Related | 1,016 (46.1%) | 1,187 (53.9%) |
| Office & Administration | 607 (31.3%) | 1,332 (68.7%) |
| Total (Category) | 1,623 (39.2%) | 2,519 (60.8%) |
| Total (Overall) | 11,969 (51.4%) | 11,316 (48.6%) |
Natural Resources, Construction and Maintenance Occupations
The most common Natural Resources, Construction and Maintenance occupations in Cortland County are Construction & Extraction (1,126 | 4.8%), Installation, Maintenance & Repair (927 | 4.0%), and Farming, Fishing & Forestry (99 | 0.4%).
Natural Resources, Construction and Maintenance Occupations by Sex
| Occupation | Male | Female |
| Farming, Fishing & Forestry | 67 (67.7%) | 32 (32.3%) |
| Construction & Extraction | 1,080 (95.9%) | 46 (4.1%) |
| Installation, Maintenance & Repair | 885 (95.5%) | 42 (4.5%) |
| Total (Category) | 2,032 (94.4%) | 120 (5.6%) |
| Total (Overall) | 11,969 (51.4%) | 11,316 (48.6%) |
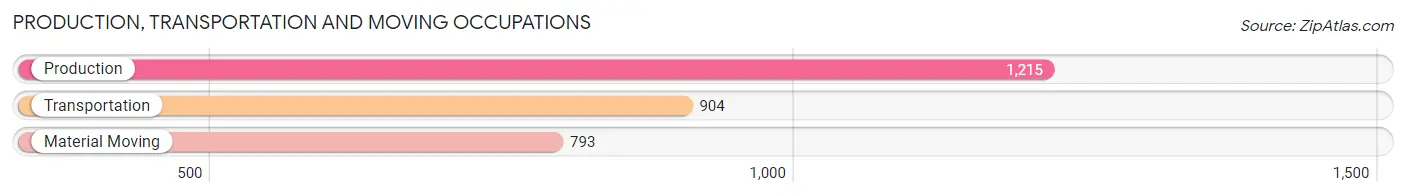
Production, Transportation and Moving Occupations
The most common Production, Transportation and Moving occupations in Cortland County are Production (1,215 | 5.2%), Transportation (904 | 3.9%), and Material Moving (793 | 3.4%).
Production, Transportation and Moving Occupations by Sex
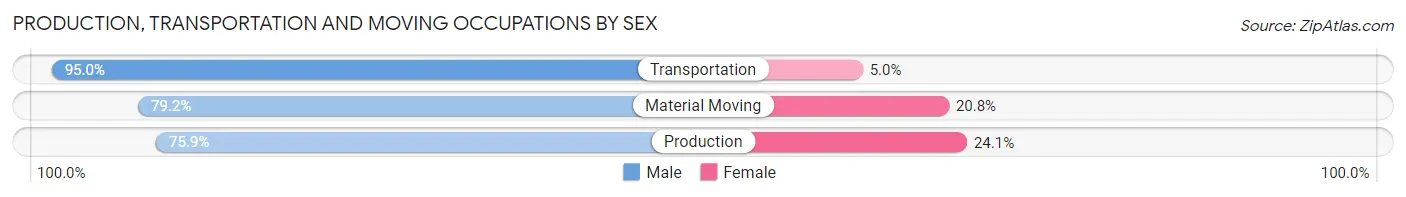
| Occupation | Male | Female |
| Production | 922 (75.9%) | 293 (24.1%) |
| Transportation | 859 (95.0%) | 45 (5.0%) |
| Material Moving | 628 (79.2%) | 165 (20.8%) |
| Total (Category) | 2,409 (82.7%) | 503 (17.3%) |
| Total (Overall) | 11,969 (51.4%) | 11,316 (48.6%) |
Employment Industries by Sex in Cortland County
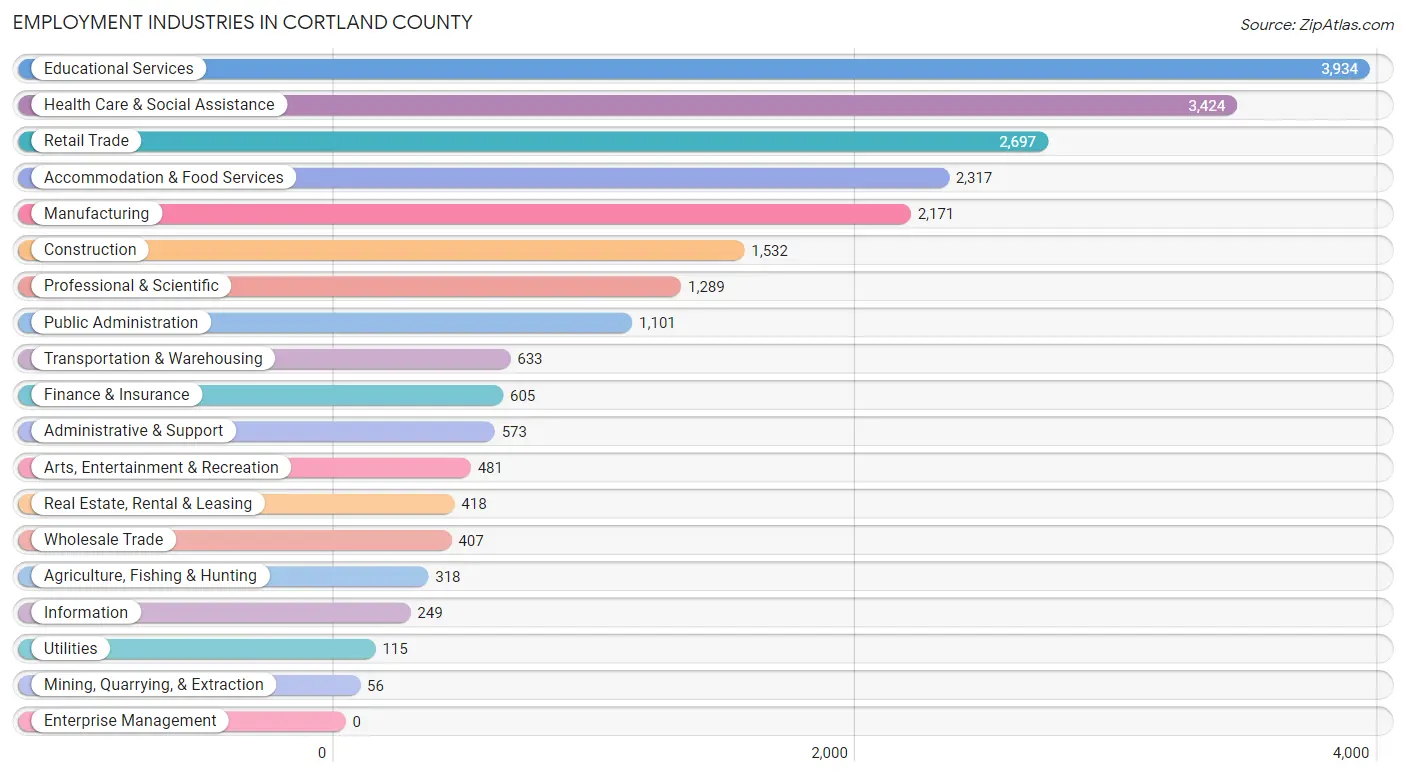
Employment Industries in Cortland County
The major employment industries in Cortland County include Educational Services (3,934 | 16.9%), Health Care & Social Assistance (3,424 | 14.7%), Retail Trade (2,697 | 11.6%), Accommodation & Food Services (2,317 | 10.0%), and Manufacturing (2,171 | 9.3%).
Employment Industries by Sex in Cortland County
The Cortland County industries that see more men than women are Mining, Quarrying, & Extraction (100.0%), Construction (95.5%), and Wholesale Trade (86.0%), whereas the industries that tend to have a higher number of women are Health Care & Social Assistance (77.3%), Finance & Insurance (64.6%), and Educational Services (61.9%).
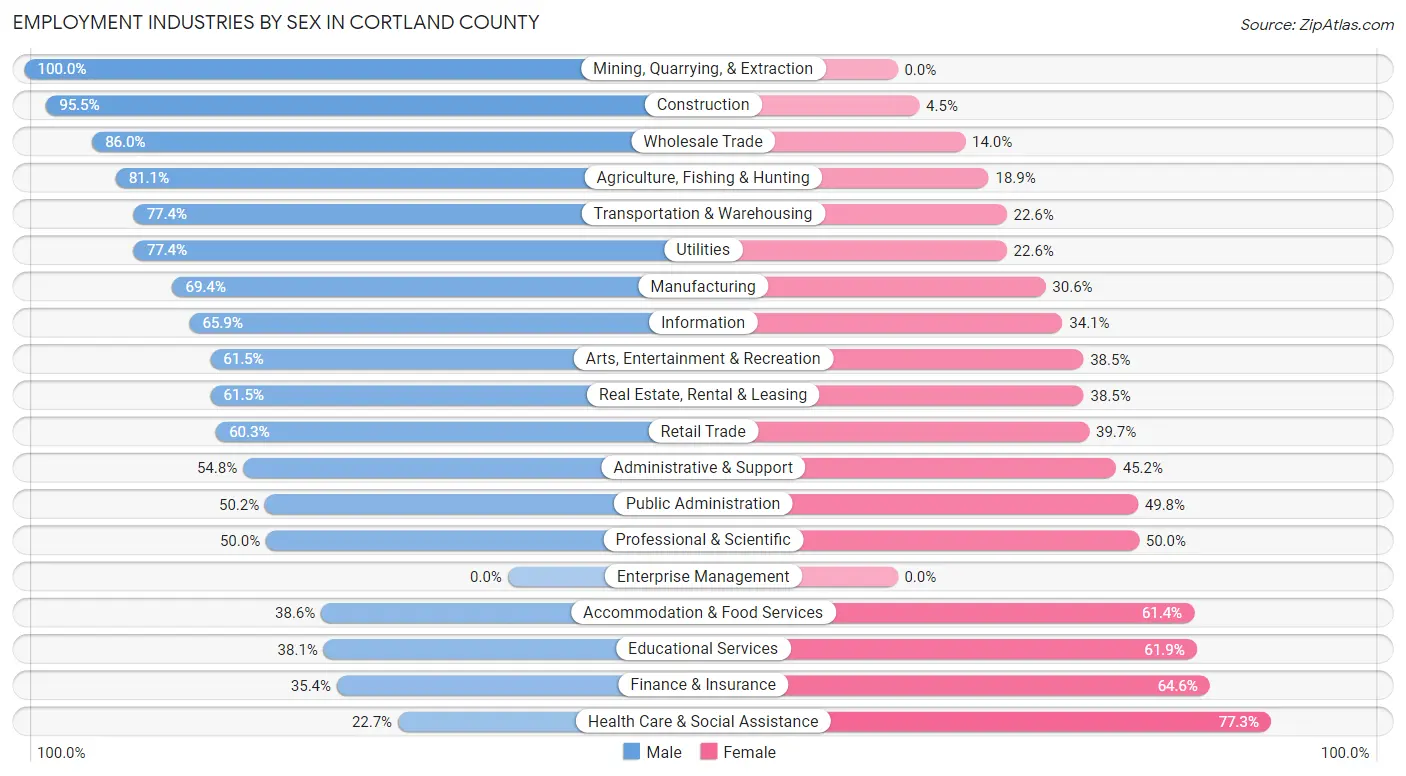
| Industry | Male | Female |
| Agriculture, Fishing & Hunting | 258 (81.1%) | 60 (18.9%) |
| Mining, Quarrying, & Extraction | 56 (100.0%) | 0 (0.0%) |
| Construction | 1,463 (95.5%) | 69 (4.5%) |
| Manufacturing | 1,506 (69.4%) | 665 (30.6%) |
| Wholesale Trade | 350 (86.0%) | 57 (14.0%) |
| Retail Trade | 1,627 (60.3%) | 1,070 (39.7%) |
| Transportation & Warehousing | 490 (77.4%) | 143 (22.6%) |
| Utilities | 89 (77.4%) | 26 (22.6%) |
| Information | 164 (65.9%) | 85 (34.1%) |
| Finance & Insurance | 214 (35.4%) | 391 (64.6%) |
| Real Estate, Rental & Leasing | 257 (61.5%) | 161 (38.5%) |
| Professional & Scientific | 645 (50.0%) | 644 (50.0%) |
| Enterprise Management | 0 (0.0%) | 0 (0.0%) |
| Administrative & Support | 314 (54.8%) | 259 (45.2%) |
| Educational Services | 1,499 (38.1%) | 2,435 (61.9%) |
| Health Care & Social Assistance | 778 (22.7%) | 2,646 (77.3%) |
| Arts, Entertainment & Recreation | 296 (61.5%) | 185 (38.5%) |
| Accommodation & Food Services | 895 (38.6%) | 1,422 (61.4%) |
| Public Administration | 553 (50.2%) | 548 (49.8%) |
| Total | 11,969 (51.4%) | 11,316 (48.6%) |
Education in Cortland County
School Enrollment in Cortland County
The most common levels of schooling among the 13,014 students in Cortland County are college / undergraduate (5,794 | 44.5%), high school (2,092 | 16.1%), and elementary school (1,853 | 14.2%).
| School Level | # Students | % Students |
| Nursery / Preschool | 412 | 3.2% |
| Kindergarten | 631 | 4.9% |
| Elementary School | 1,853 | 14.2% |
| Middle School | 1,746 | 13.4% |
| High School | 2,092 | 16.1% |
| College / Undergraduate | 5,794 | 44.5% |
| Graduate / Professional | 486 | 3.7% |
| Total | 13,014 | 100.0% |
School Enrollment by Age by Funding Source in Cortland County
Out of a total of 13,014 students who are enrolled in schools in Cortland County, 1,744 (13.4%) attend a private institution, while the remaining 11,270 (86.6%) are enrolled in public schools. The age group of 20 to 24 year olds has the highest likelihood of being enrolled in private schools, with 638 (22.8% in the age bracket) enrolled. Conversely, the age group of 15 to 17 year olds has the lowest likelihood of being enrolled in a private school, with 1,518 (94.4% in the age bracket) attending a public institution.
| Age Bracket | Public School | Private School |
| 3 to 4 Year Olds | 292 (85.9%) | 48 (14.1%) |
| 5 to 9 Year Old | 2,168 (89.7%) | 249 (10.3%) |
| 10 to 14 Year Olds | 1,982 (92.3%) | 166 (7.7%) |
| 15 to 17 Year Olds | 1,518 (94.4%) | 90 (5.6%) |
| 18 to 19 Year Olds | 2,434 (86.3%) | 386 (13.7%) |
| 20 to 24 Year Olds | 2,158 (77.2%) | 638 (22.8%) |
| 25 to 34 Year Olds | 459 (78.6%) | 125 (21.4%) |
| 35 Years and over | 255 (84.7%) | 46 (15.3%) |
| Total | 11,270 (86.6%) | 1,744 (13.4%) |
Educational Attainment by Field of Study in Cortland County
Education (2,013 | 22.8%), business (805 | 9.1%), science & technology (754 | 8.6%), arts & humanities (658 | 7.5%), and social sciences (636 | 7.2%) are the most common fields of study among 8,813 individuals in Cortland County who have obtained a bachelor's degree or higher.
| Field of Study | # Graduates | % Graduates |
| Computers & Mathematics | 298 | 3.4% |
| Bio, Nature & Agricultural | 577 | 6.6% |
| Physical & Health Sciences | 246 | 2.8% |
| Psychology | 624 | 7.1% |
| Social Sciences | 636 | 7.2% |
| Engineering | 458 | 5.2% |
| Multidisciplinary Studies | 70 | 0.8% |
| Science & Technology | 754 | 8.6% |
| Business | 805 | 9.1% |
| Education | 2,013 | 22.8% |
| Literature & Languages | 417 | 4.7% |
| Liberal Arts & History | 411 | 4.7% |
| Visual & Performing Arts | 491 | 5.6% |
| Communications | 355 | 4.0% |
| Arts & Humanities | 658 | 7.5% |
| Total | 8,813 | 100.0% |
Transportation & Commute in Cortland County
Vehicle Availability by Sex in Cortland County
The most prevalent vehicle ownership categories in Cortland County are males with 2 vehicles (5,127, accounting for 45.2%) and females with 2 vehicles (4,787, making up 49.1%).
| Vehicles Available | Male | Female |
| No Vehicle | 427 (3.8%) | 495 (4.7%) |
| 1 Vehicle | 2,141 (18.9%) | 2,242 (21.5%) |
| 2 Vehicles | 5,127 (45.2%) | 4,787 (45.8%) |
| 3 Vehicles | 2,311 (20.4%) | 1,744 (16.7%) |
| 4 Vehicles | 836 (7.4%) | 861 (8.2%) |
| 5 or more Vehicles | 498 (4.4%) | 314 (3.0%) |
| Total | 11,340 (100.0%) | 10,443 (100.0%) |
Commute Time in Cortland County
The most frequently occuring commute durations in Cortland County are 5 to 9 minutes (4,060 commuters, 19.1%), 10 to 14 minutes (3,632 commuters, 17.1%), and 15 to 19 minutes (2,574 commuters, 12.1%).
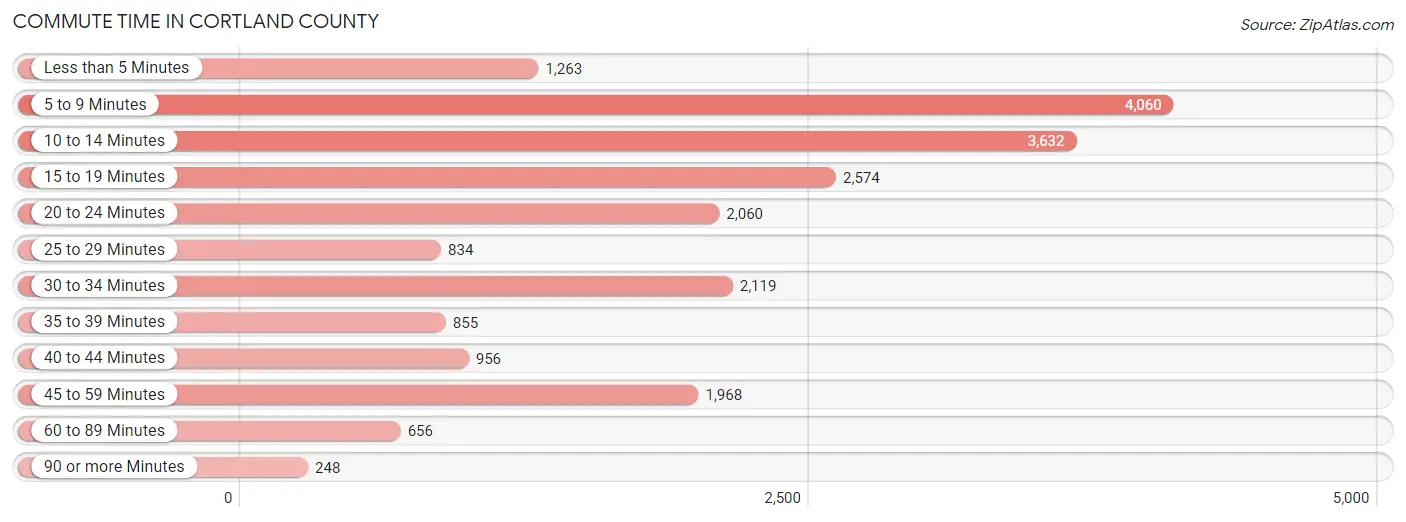
| Commute Time | # Commuters | % Commuters |
| Less than 5 Minutes | 1,263 | 5.9% |
| 5 to 9 Minutes | 4,060 | 19.1% |
| 10 to 14 Minutes | 3,632 | 17.1% |
| 15 to 19 Minutes | 2,574 | 12.1% |
| 20 to 24 Minutes | 2,060 | 9.7% |
| 25 to 29 Minutes | 834 | 3.9% |
| 30 to 34 Minutes | 2,119 | 10.0% |
| 35 to 39 Minutes | 855 | 4.0% |
| 40 to 44 Minutes | 956 | 4.5% |
| 45 to 59 Minutes | 1,968 | 9.3% |
| 60 to 89 Minutes | 656 | 3.1% |
| 90 or more Minutes | 248 | 1.2% |
Commute Time by Sex in Cortland County
The most common commute times in Cortland County are 5 to 9 minutes (1,655 commuters, 15.2%) for males and 5 to 9 minutes (2,405 commuters, 23.3%) for females.
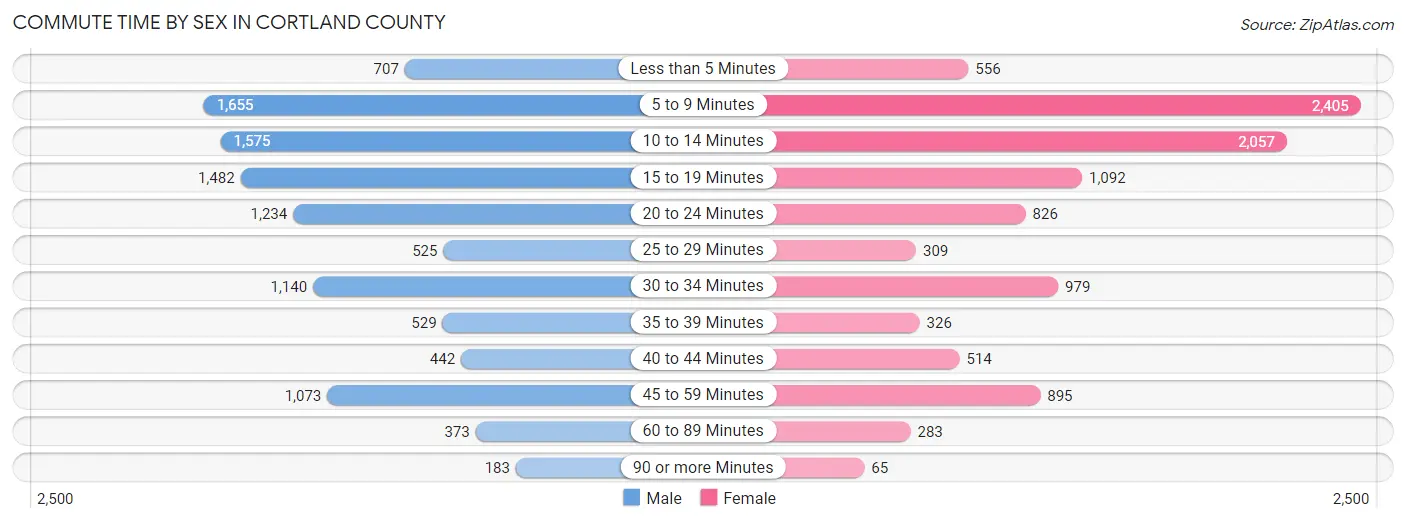
| Commute Time | Male | Female |
| Less than 5 Minutes | 707 (6.5%) | 556 (5.4%) |
| 5 to 9 Minutes | 1,655 (15.2%) | 2,405 (23.3%) |
| 10 to 14 Minutes | 1,575 (14.4%) | 2,057 (20.0%) |
| 15 to 19 Minutes | 1,482 (13.6%) | 1,092 (10.6%) |
| 20 to 24 Minutes | 1,234 (11.3%) | 826 (8.0%) |
| 25 to 29 Minutes | 525 (4.8%) | 309 (3.0%) |
| 30 to 34 Minutes | 1,140 (10.4%) | 979 (9.5%) |
| 35 to 39 Minutes | 529 (4.9%) | 326 (3.2%) |
| 40 to 44 Minutes | 442 (4.1%) | 514 (5.0%) |
| 45 to 59 Minutes | 1,073 (9.8%) | 895 (8.7%) |
| 60 to 89 Minutes | 373 (3.4%) | 283 (2.8%) |
| 90 or more Minutes | 183 (1.7%) | 65 (0.6%) |
Time of Departure to Work by Sex in Cortland County
The most frequent times of departure to work in Cortland County are 7:00 AM to 7:29 AM (1,567, 14.3%) for males and 7:30 AM to 7:59 AM (2,110, 20.5%) for females.
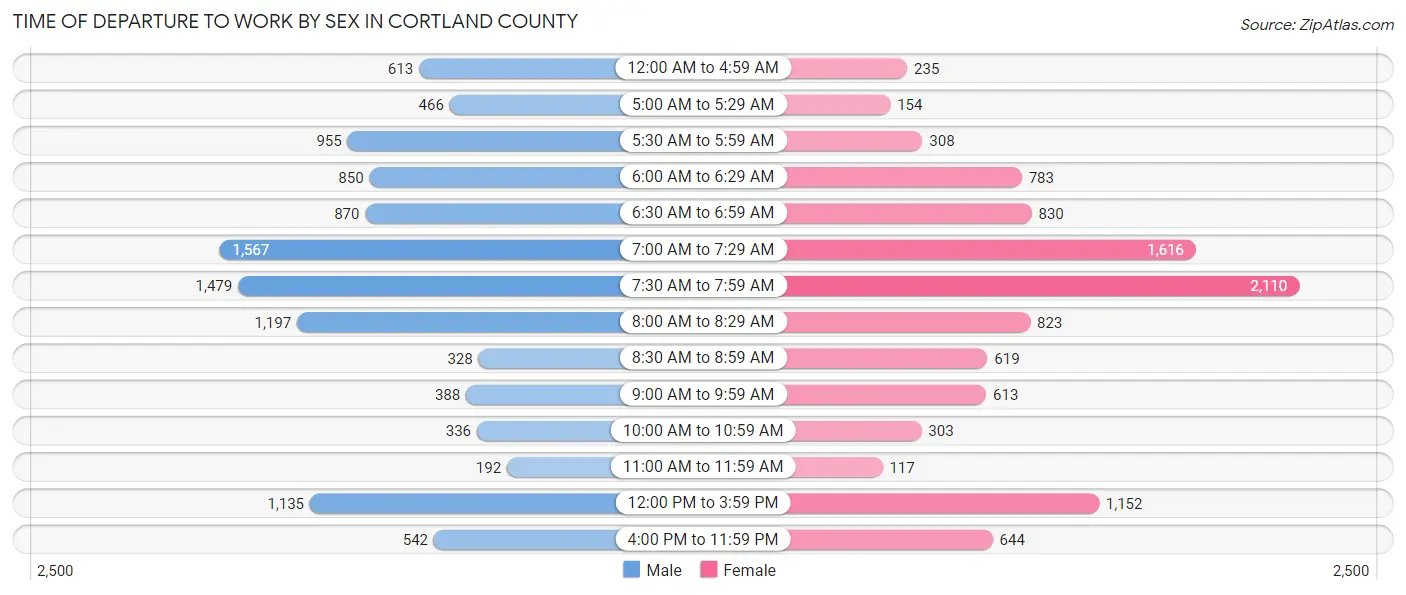
| Time of Departure | Male | Female |
| 12:00 AM to 4:59 AM | 613 (5.6%) | 235 (2.3%) |
| 5:00 AM to 5:29 AM | 466 (4.3%) | 154 (1.5%) |
| 5:30 AM to 5:59 AM | 955 (8.7%) | 308 (3.0%) |
| 6:00 AM to 6:29 AM | 850 (7.8%) | 783 (7.6%) |
| 6:30 AM to 6:59 AM | 870 (8.0%) | 830 (8.1%) |
| 7:00 AM to 7:29 AM | 1,567 (14.3%) | 1,616 (15.7%) |
| 7:30 AM to 7:59 AM | 1,479 (13.6%) | 2,110 (20.5%) |
| 8:00 AM to 8:29 AM | 1,197 (11.0%) | 823 (8.0%) |
| 8:30 AM to 8:59 AM | 328 (3.0%) | 619 (6.0%) |
| 9:00 AM to 9:59 AM | 388 (3.5%) | 613 (5.9%) |
| 10:00 AM to 10:59 AM | 336 (3.1%) | 303 (2.9%) |
| 11:00 AM to 11:59 AM | 192 (1.8%) | 117 (1.1%) |
| 12:00 PM to 3:59 PM | 1,135 (10.4%) | 1,152 (11.2%) |
| 4:00 PM to 11:59 PM | 542 (5.0%) | 644 (6.2%) |
| Total | 10,918 (100.0%) | 10,307 (100.0%) |
Housing Occupancy in Cortland County
Occupancy by Ownership in Cortland County
Of the total 18,514 dwellings in Cortland County, owner-occupied units account for 12,213 (66.0%), while renter-occupied units make up 6,301 (34.0%).
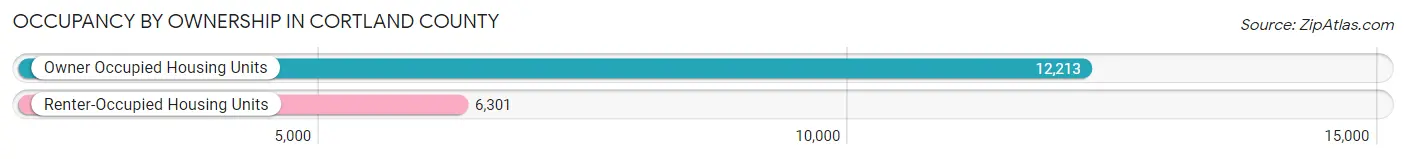
| Occupancy | # Housing Units | % Housing Units |
| Owner Occupied Housing Units | 12,213 | 66.0% |
| Renter-Occupied Housing Units | 6,301 | 34.0% |
| Total Occupied Housing Units | 18,514 | 100.0% |
Occupancy by Household Size in Cortland County
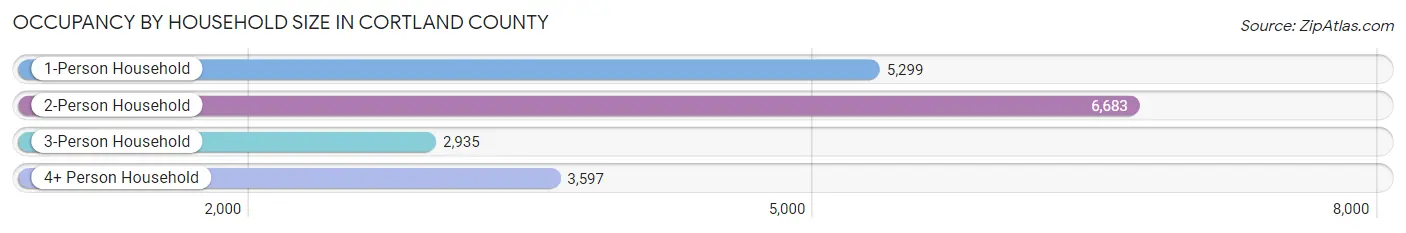
| Household Size | # Housing Units | % Housing Units |
| 1-Person Household | 5,299 | 28.6% |
| 2-Person Household | 6,683 | 36.1% |
| 3-Person Household | 2,935 | 15.9% |
| 4+ Person Household | 3,597 | 19.4% |
| Total Housing Units | 18,514 | 100.0% |
Occupancy by Ownership by Household Size in Cortland County
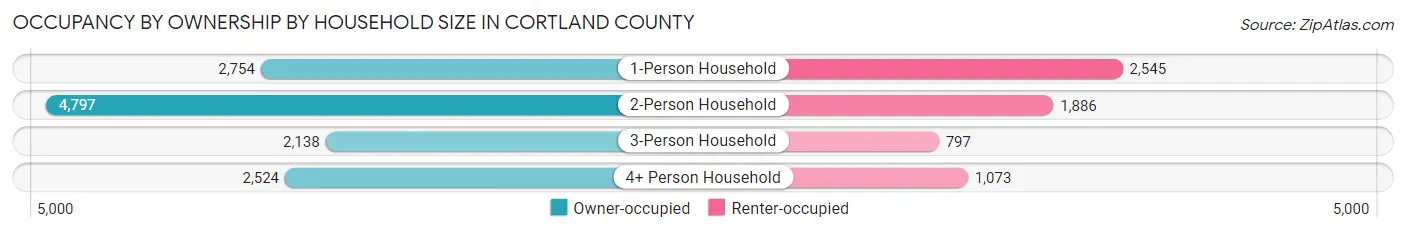
| Household Size | Owner-occupied | Renter-occupied |
| 1-Person Household | 2,754 (52.0%) | 2,545 (48.0%) |
| 2-Person Household | 4,797 (71.8%) | 1,886 (28.2%) |
| 3-Person Household | 2,138 (72.8%) | 797 (27.2%) |
| 4+ Person Household | 2,524 (70.2%) | 1,073 (29.8%) |
| Total Housing Units | 12,213 (66.0%) | 6,301 (34.0%) |
Occupancy by Educational Attainment in Cortland County
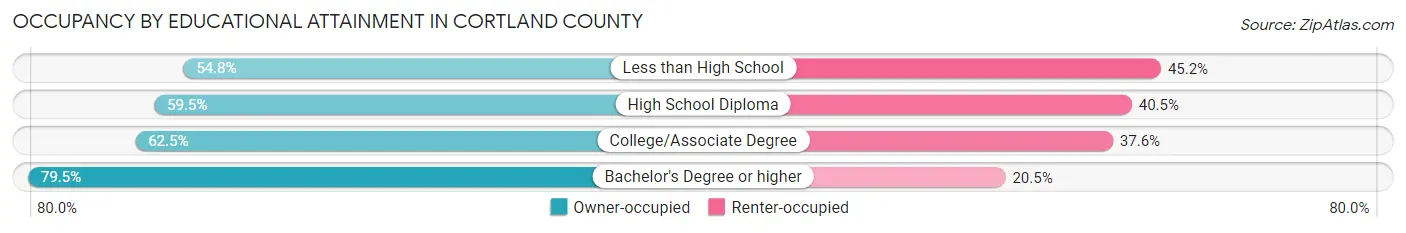
| Household Size | Owner-occupied | Renter-occupied |
| Less than High School | 817 (54.8%) | 673 (45.2%) |
| High School Diploma | 3,054 (59.5%) | 2,082 (40.5%) |
| College/Associate Degree | 4,059 (62.5%) | 2,441 (37.6%) |
| Bachelor's Degree or higher | 4,283 (79.5%) | 1,105 (20.5%) |
Occupancy by Age of Householder in Cortland County
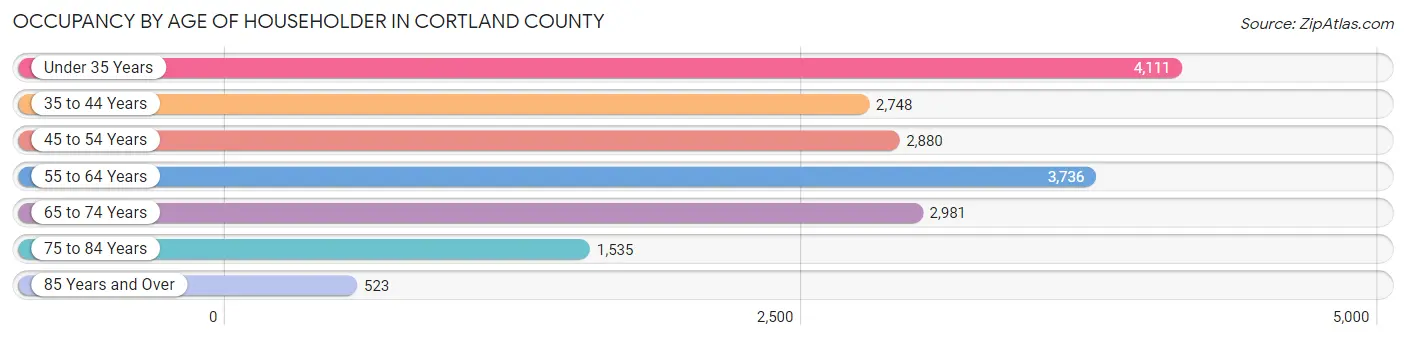
| Age Bracket | # Households | % Households |
| Under 35 Years | 4,111 | 22.2% |
| 35 to 44 Years | 2,748 | 14.8% |
| 45 to 54 Years | 2,880 | 15.6% |
| 55 to 64 Years | 3,736 | 20.2% |
| 65 to 74 Years | 2,981 | 16.1% |
| 75 to 84 Years | 1,535 | 8.3% |
| 85 Years and Over | 523 | 2.8% |
| Total | 18,514 | 100.0% |
Housing Finances in Cortland County
Median Income by Occupancy in Cortland County
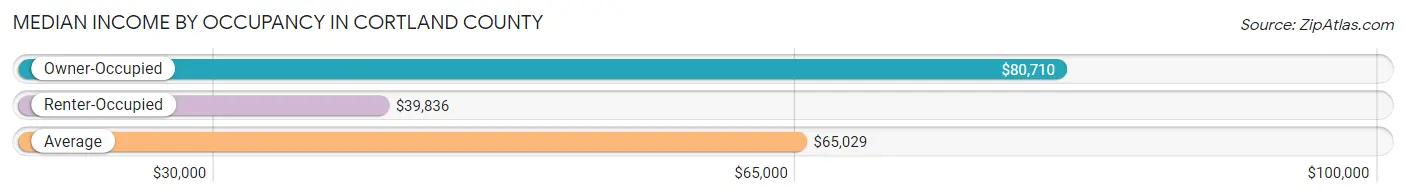
| Occupancy Type | # Households | Median Income |
| Owner-Occupied | 12,213 (66.0%) | $80,710 |
| Renter-Occupied | 6,301 (34.0%) | $39,836 |
| Average | 18,514 (100.0%) | $65,029 |
Occupancy by Householder Income Bracket in Cortland County
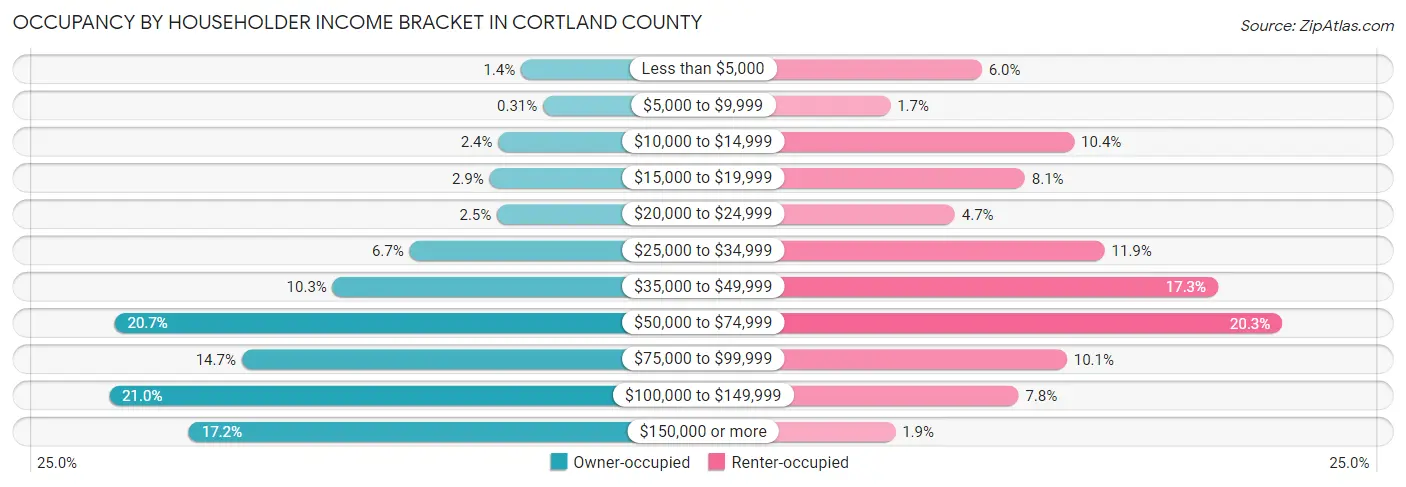
| Income Bracket | Owner-occupied | Renter-occupied |
| Less than $5,000 | 166 (1.4%) | 379 (6.0%) |
| $5,000 to $9,999 | 38 (0.3%) | 104 (1.7%) |
| $10,000 to $14,999 | 298 (2.4%) | 656 (10.4%) |
| $15,000 to $19,999 | 349 (2.9%) | 508 (8.1%) |
| $20,000 to $24,999 | 305 (2.5%) | 298 (4.7%) |
| $25,000 to $34,999 | 814 (6.7%) | 747 (11.9%) |
| $35,000 to $49,999 | 1,262 (10.3%) | 1,087 (17.2%) |
| $50,000 to $74,999 | 2,531 (20.7%) | 1,280 (20.3%) |
| $75,000 to $99,999 | 1,790 (14.7%) | 634 (10.1%) |
| $100,000 to $149,999 | 2,562 (21.0%) | 489 (7.8%) |
| $150,000 or more | 2,098 (17.2%) | 119 (1.9%) |
| Total | 12,213 (100.0%) | 6,301 (100.0%) |
Monthly Housing Cost Tiers in Cortland County
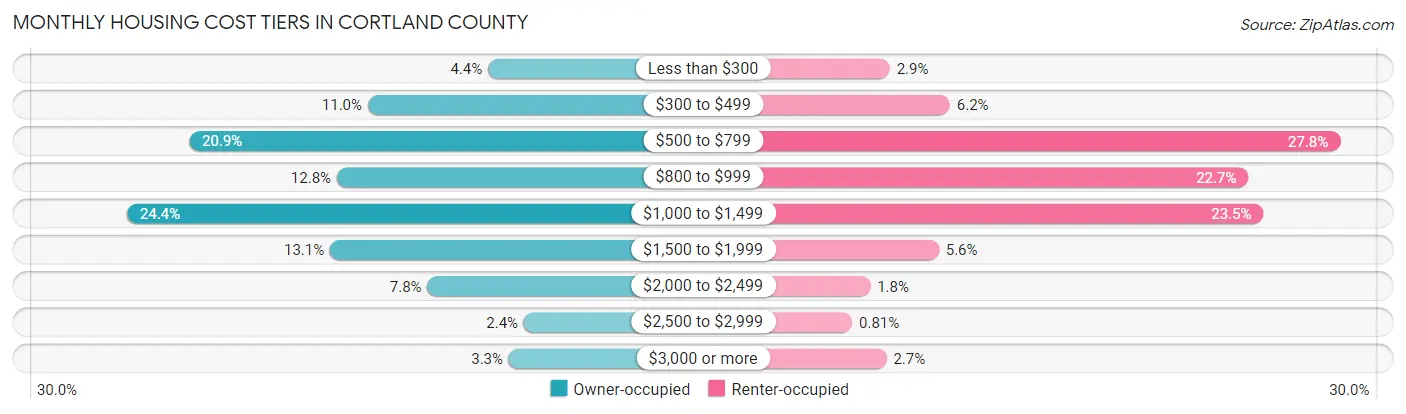
| Monthly Cost | Owner-occupied | Renter-occupied |
| Less than $300 | 537 (4.4%) | 182 (2.9%) |
| $300 to $499 | 1,348 (11.0%) | 391 (6.2%) |
| $500 to $799 | 2,555 (20.9%) | 1,749 (27.8%) |
| $800 to $999 | 1,557 (12.8%) | 1,430 (22.7%) |
| $1,000 to $1,499 | 2,974 (24.3%) | 1,482 (23.5%) |
| $1,500 to $1,999 | 1,603 (13.1%) | 353 (5.6%) |
| $2,000 to $2,499 | 946 (7.7%) | 114 (1.8%) |
| $2,500 to $2,999 | 296 (2.4%) | 51 (0.8%) |
| $3,000 or more | 397 (3.3%) | 171 (2.7%) |
| Total | 12,213 (100.0%) | 6,301 (100.0%) |
Physical Housing Characteristics in Cortland County
Housing Structures in Cortland County
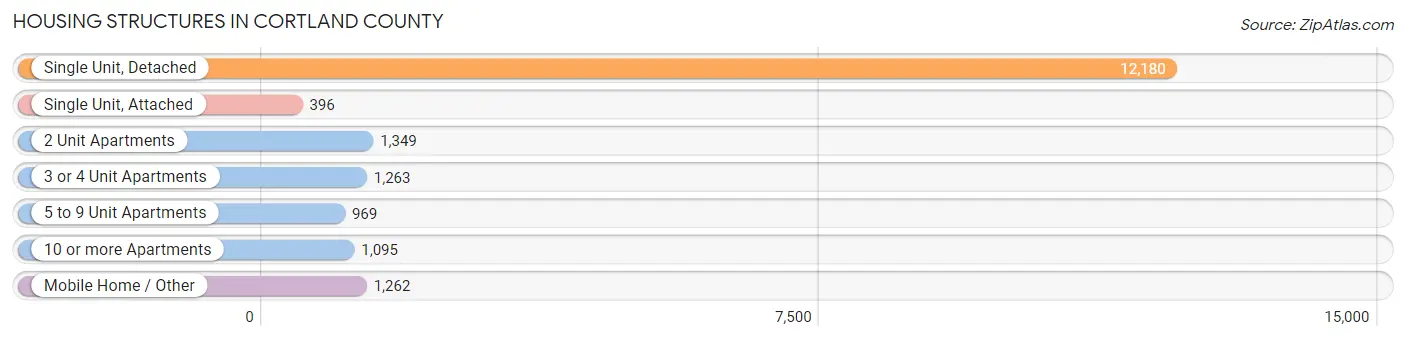
| Structure Type | # Housing Units | % Housing Units |
| Single Unit, Detached | 12,180 | 65.8% |
| Single Unit, Attached | 396 | 2.1% |
| 2 Unit Apartments | 1,349 | 7.3% |
| 3 or 4 Unit Apartments | 1,263 | 6.8% |
| 5 to 9 Unit Apartments | 969 | 5.2% |
| 10 or more Apartments | 1,095 | 5.9% |
| Mobile Home / Other | 1,262 | 6.8% |
| Total | 18,514 | 100.0% |
Housing Structures by Occupancy in Cortland County
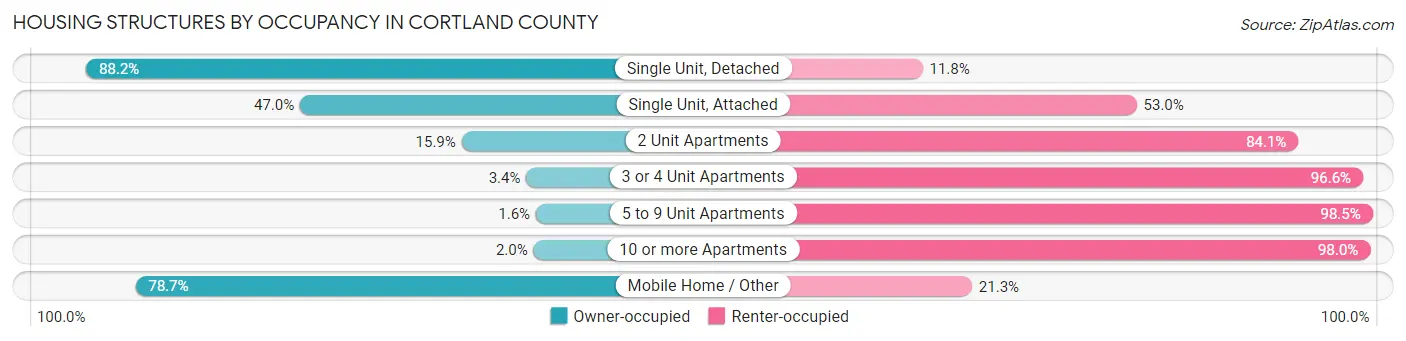
| Structure Type | Owner-occupied | Renter-occupied |
| Single Unit, Detached | 10,740 (88.2%) | 1,440 (11.8%) |
| Single Unit, Attached | 186 (47.0%) | 210 (53.0%) |
| 2 Unit Apartments | 214 (15.9%) | 1,135 (84.1%) |
| 3 or 4 Unit Apartments | 43 (3.4%) | 1,220 (96.6%) |
| 5 to 9 Unit Apartments | 15 (1.5%) | 954 (98.5%) |
| 10 or more Apartments | 22 (2.0%) | 1,073 (98.0%) |
| Mobile Home / Other | 993 (78.7%) | 269 (21.3%) |
| Total | 12,213 (66.0%) | 6,301 (34.0%) |
Housing Structures by Number of Rooms in Cortland County
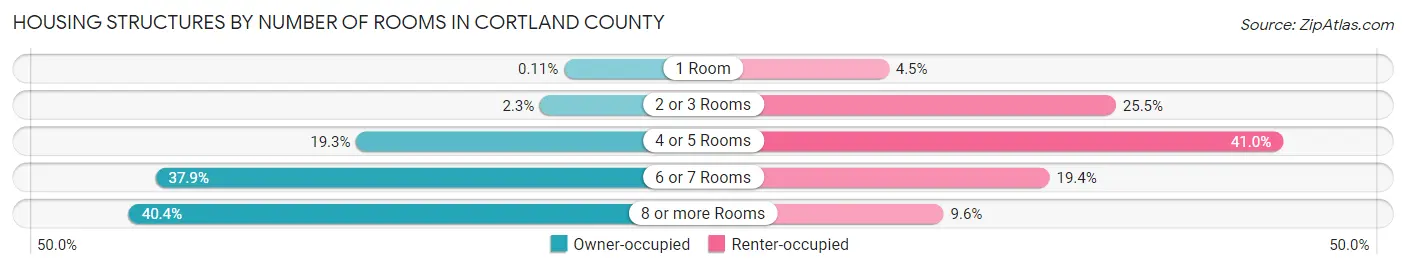
| Number of Rooms | Owner-occupied | Renter-occupied |
| 1 Room | 14 (0.1%) | 285 (4.5%) |
| 2 or 3 Rooms | 284 (2.3%) | 1,608 (25.5%) |
| 4 or 5 Rooms | 2,359 (19.3%) | 2,582 (41.0%) |
| 6 or 7 Rooms | 4,627 (37.9%) | 1,222 (19.4%) |
| 8 or more Rooms | 4,929 (40.4%) | 604 (9.6%) |
| Total | 12,213 (100.0%) | 6,301 (100.0%) |
Housing Structure by Heating Type in Cortland County
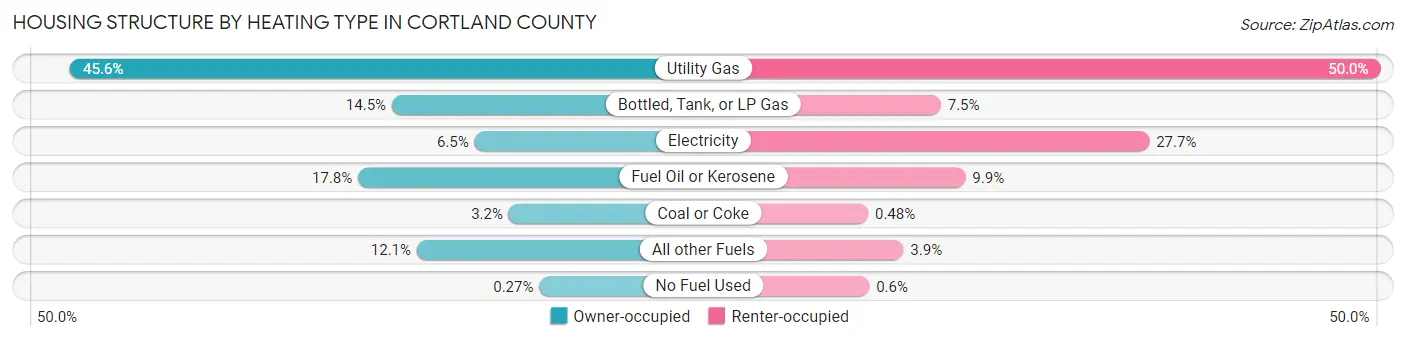
| Heating Type | Owner-occupied | Renter-occupied |
| Utility Gas | 5,569 (45.6%) | 3,149 (50.0%) |
| Bottled, Tank, or LP Gas | 1,772 (14.5%) | 473 (7.5%) |
| Electricity | 797 (6.5%) | 1,742 (27.7%) |
| Fuel Oil or Kerosene | 2,171 (17.8%) | 623 (9.9%) |
| Coal or Coke | 393 (3.2%) | 30 (0.5%) |
| All other Fuels | 1,478 (12.1%) | 246 (3.9%) |
| No Fuel Used | 33 (0.3%) | 38 (0.6%) |
| Total | 12,213 (100.0%) | 6,301 (100.0%) |
Household Vehicle Usage in Cortland County
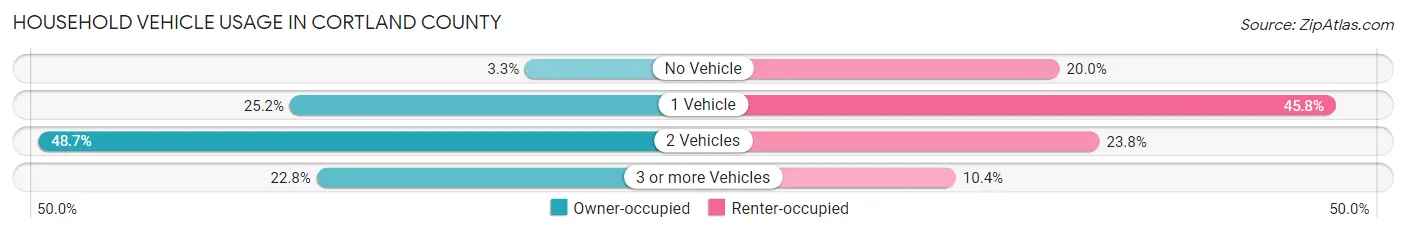
| Vehicles per Household | Owner-occupied | Renter-occupied |
| No Vehicle | 401 (3.3%) | 1,263 (20.0%) |
| 1 Vehicle | 3,083 (25.2%) | 2,887 (45.8%) |
| 2 Vehicles | 5,950 (48.7%) | 1,498 (23.8%) |
| 3 or more Vehicles | 2,779 (22.8%) | 653 (10.4%) |
| Total | 12,213 (100.0%) | 6,301 (100.0%) |
Real Estate & Mortgages in Cortland County
Real Estate and Mortgage Overview in Cortland County
| Characteristic | Without Mortgage | With Mortgage |
| Housing Units | 5,650 | 6,563 |
| Median Property Value | $134,700 | $156,300 |
| Median Household Income | $65,840 | $1,326 |
| Monthly Housing Costs | $608 | $339 |
| Real Estate Taxes | $3,620 | $229 |
Property Value by Mortgage Status in Cortland County
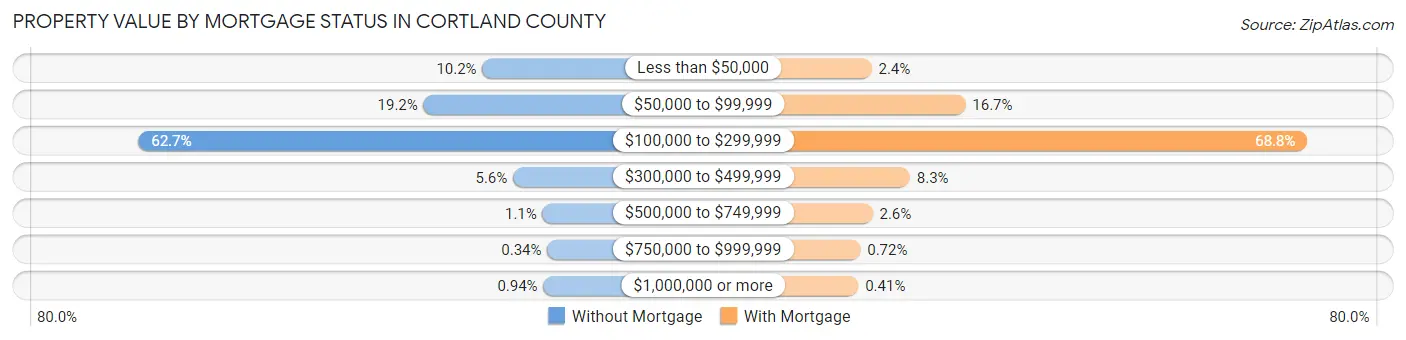
| Property Value | Without Mortgage | With Mortgage |
| Less than $50,000 | 578 (10.2%) | 160 (2.4%) |
| $50,000 to $99,999 | 1,085 (19.2%) | 1,098 (16.7%) |
| $100,000 to $299,999 | 3,541 (62.7%) | 4,518 (68.8%) |
| $300,000 to $499,999 | 314 (5.6%) | 543 (8.3%) |
| $500,000 to $749,999 | 60 (1.1%) | 170 (2.6%) |
| $750,000 to $999,999 | 19 (0.3%) | 47 (0.7%) |
| $1,000,000 or more | 53 (0.9%) | 27 (0.4%) |
| Total | 5,650 (100.0%) | 6,563 (100.0%) |
Household Income by Mortgage Status in Cortland County
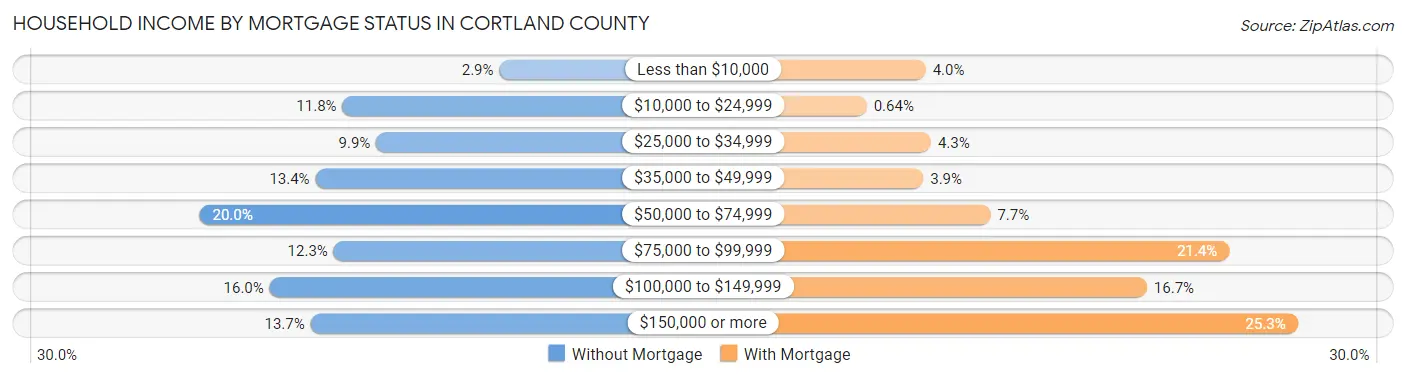
| Household Income | Without Mortgage | With Mortgage |
| Less than $10,000 | 162 (2.9%) | 263 (4.0%) |
| $10,000 to $24,999 | 669 (11.8%) | 42 (0.6%) |
| $25,000 to $34,999 | 560 (9.9%) | 283 (4.3%) |
| $35,000 to $49,999 | 756 (13.4%) | 254 (3.9%) |
| $50,000 to $74,999 | 1,130 (20.0%) | 506 (7.7%) |
| $75,000 to $99,999 | 697 (12.3%) | 1,401 (21.3%) |
| $100,000 to $149,999 | 904 (16.0%) | 1,093 (16.7%) |
| $150,000 or more | 772 (13.7%) | 1,658 (25.3%) |
| Total | 5,650 (100.0%) | 6,563 (100.0%) |
Property Value to Household Income Ratio in Cortland County
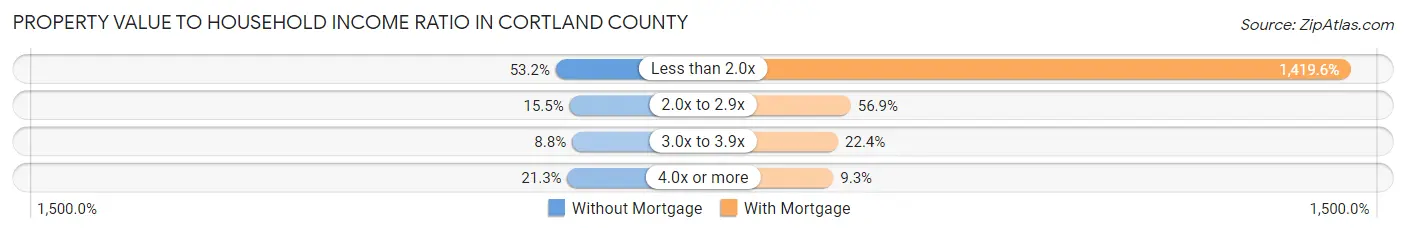
| Value-to-Income Ratio | Without Mortgage | With Mortgage |
| Less than 2.0x | 3,003 (53.1%) | 93,170 (1,419.6%) |
| 2.0x to 2.9x | 878 (15.5%) | 3,737 (56.9%) |
| 3.0x to 3.9x | 498 (8.8%) | 1,469 (22.4%) |
| 4.0x or more | 1,204 (21.3%) | 611 (9.3%) |
| Total | 5,650 (100.0%) | 6,563 (100.0%) |
Real Estate Taxes by Mortgage Status in Cortland County
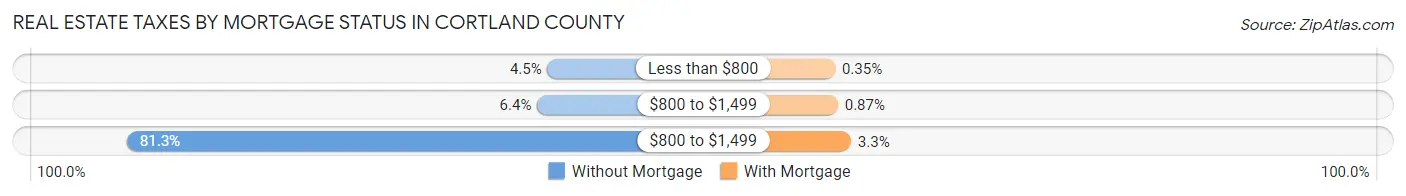
| Property Taxes | Without Mortgage | With Mortgage |
| Less than $800 | 253 (4.5%) | 23 (0.4%) |
| $800 to $1,499 | 360 (6.4%) | 57 (0.9%) |
| $800 to $1,499 | 4,594 (81.3%) | 214 (3.3%) |
| Total | 5,650 (100.0%) | 6,563 (100.0%) |
Health & Disability in Cortland County
Health Insurance Coverage by Age in Cortland County
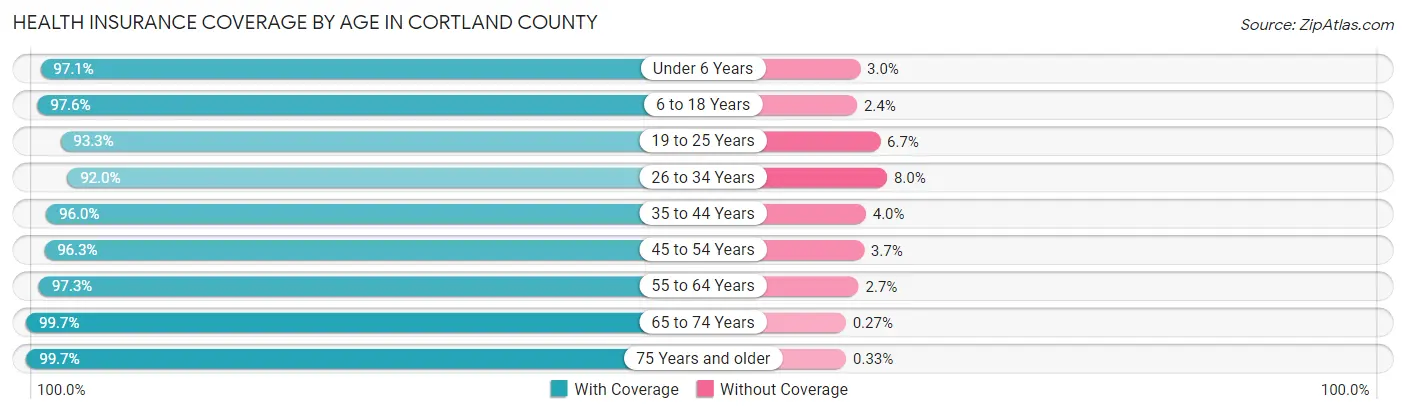
| Age Bracket | With Coverage | Without Coverage |
| Under 6 Years | 2,668 (97.1%) | 81 (2.9%) |
| 6 to 18 Years | 7,367 (97.6%) | 179 (2.4%) |
| 19 to 25 Years | 7,207 (93.3%) | 515 (6.7%) |
| 26 to 34 Years | 4,245 (92.0%) | 367 (8.0%) |
| 35 to 44 Years | 4,622 (96.0%) | 193 (4.0%) |
| 45 to 54 Years | 5,061 (96.3%) | 192 (3.7%) |
| 55 to 64 Years | 5,981 (97.3%) | 164 (2.7%) |
| 65 to 74 Years | 4,462 (99.7%) | 12 (0.3%) |
| 75 Years and older | 2,991 (99.7%) | 10 (0.3%) |
| Total | 44,604 (96.3%) | 1,713 (3.7%) |
Health Insurance Coverage by Citizenship Status in Cortland County
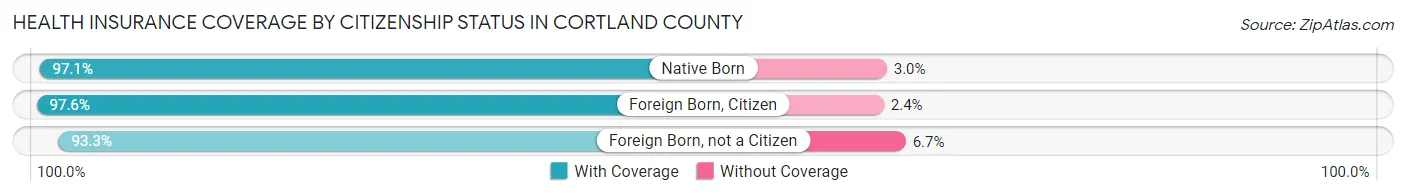
| Citizenship Status | With Coverage | Without Coverage |
| Native Born | 2,668 (97.1%) | 81 (2.9%) |
| Foreign Born, Citizen | 7,367 (97.6%) | 179 (2.4%) |
| Foreign Born, not a Citizen | 7,207 (93.3%) | 515 (6.7%) |
Health Insurance Coverage by Household Income in Cortland County
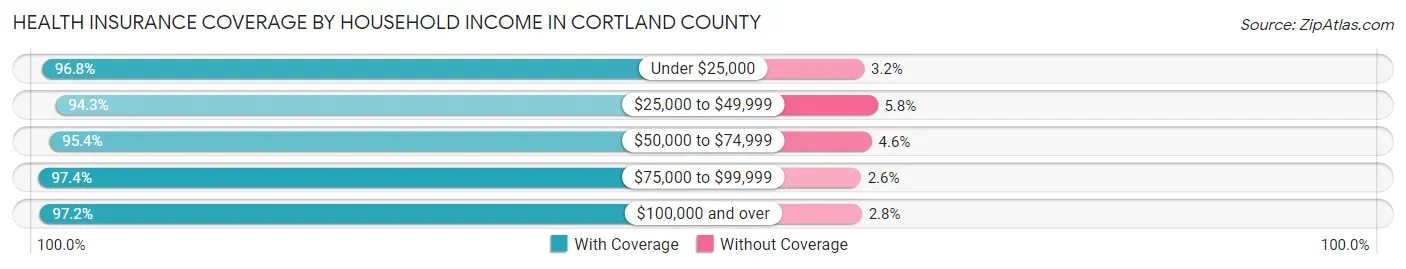
| Household Income | With Coverage | Without Coverage |
| Under $25,000 | 4,126 (96.8%) | 138 (3.2%) |
| $25,000 to $49,999 | 7,131 (94.3%) | 435 (5.8%) |
| $50,000 to $74,999 | 8,598 (95.4%) | 418 (4.6%) |
| $75,000 to $99,999 | 5,998 (97.4%) | 161 (2.6%) |
| $100,000 and over | 15,715 (97.2%) | 453 (2.8%) |
Public vs Private Health Insurance Coverage by Age in Cortland County
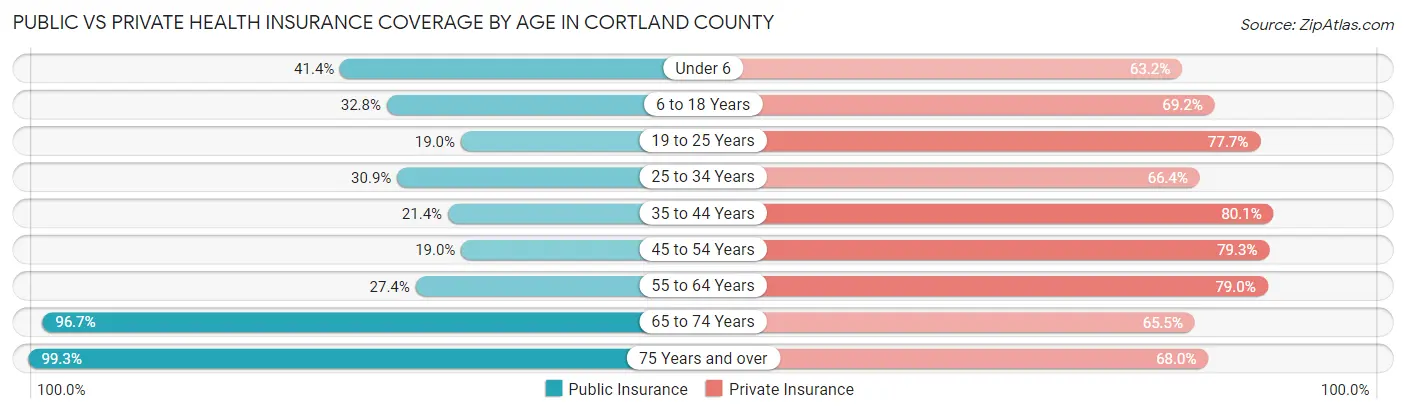
| Age Bracket | Public Insurance | Private Insurance |
| Under 6 | 1,139 (41.4%) | 1,736 (63.1%) |
| 6 to 18 Years | 2,473 (32.8%) | 5,222 (69.2%) |
| 19 to 25 Years | 1,469 (19.0%) | 5,996 (77.6%) |
| 25 to 34 Years | 1,423 (30.8%) | 3,064 (66.4%) |
| 35 to 44 Years | 1,032 (21.4%) | 3,858 (80.1%) |
| 45 to 54 Years | 996 (19.0%) | 4,167 (79.3%) |
| 55 to 64 Years | 1,685 (27.4%) | 4,855 (79.0%) |
| 65 to 74 Years | 4,327 (96.7%) | 2,931 (65.5%) |
| 75 Years and over | 2,979 (99.3%) | 2,041 (68.0%) |
| Total | 17,523 (37.8%) | 33,870 (73.1%) |
Disability Status by Sex by Age in Cortland County
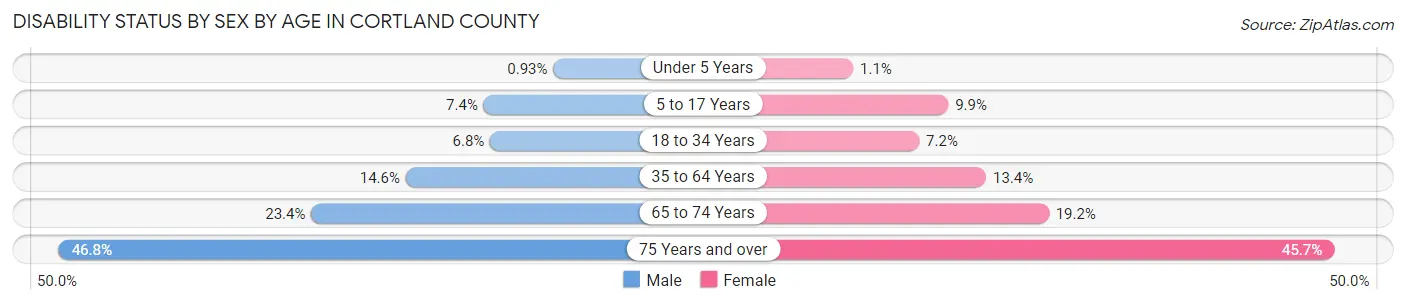
| Age Bracket | Male | Female |
| Under 5 Years | 11 (0.9%) | 11 (1.1%) |
| 5 to 17 Years | 262 (7.4%) | 304 (9.9%) |
| 18 to 34 Years | 445 (6.8%) | 519 (7.2%) |
| 35 to 64 Years | 1,224 (14.6%) | 1,050 (13.4%) |
| 65 to 74 Years | 502 (23.4%) | 447 (19.2%) |
| 75 Years and over | 576 (46.8%) | 809 (45.7%) |
Disability Class by Sex by Age in Cortland County
Disability Class: Hearing Difficulty
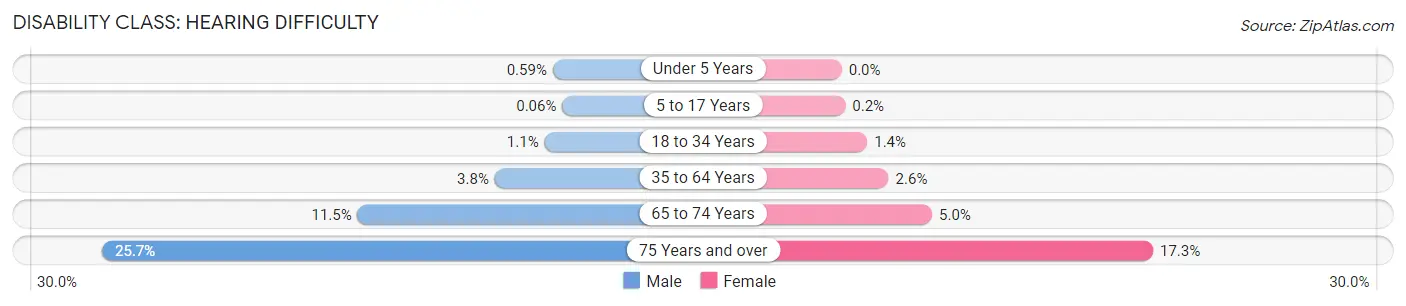
| Age Bracket | Male | Female |
| Under 5 Years | 7 (0.6%) | 0 (0.0%) |
| 5 to 17 Years | 2 (0.1%) | 6 (0.2%) |
| 18 to 34 Years | 69 (1.1%) | 103 (1.4%) |
| 35 to 64 Years | 320 (3.8%) | 205 (2.6%) |
| 65 to 74 Years | 246 (11.5%) | 117 (5.0%) |
| 75 Years and over | 316 (25.7%) | 307 (17.3%) |
Disability Class: Vision Difficulty
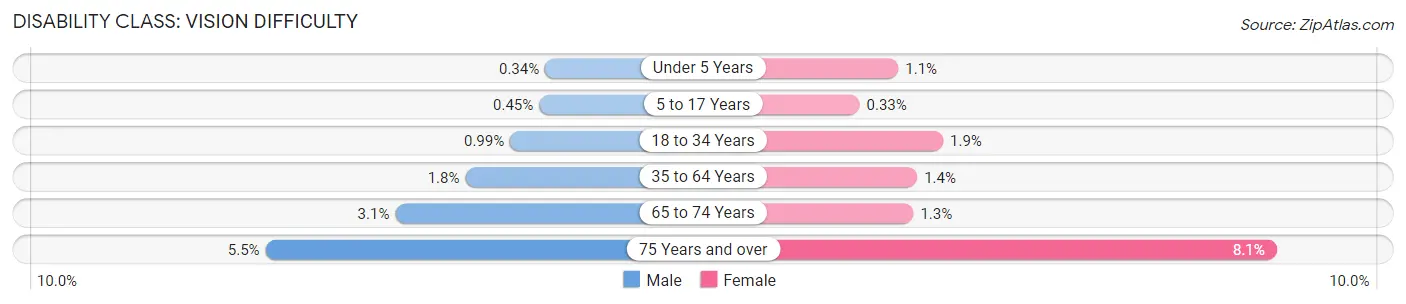
| Age Bracket | Male | Female |
| Under 5 Years | 4 (0.3%) | 11 (1.1%) |
| 5 to 17 Years | 16 (0.4%) | 10 (0.3%) |
| 18 to 34 Years | 65 (1.0%) | 136 (1.9%) |
| 35 to 64 Years | 152 (1.8%) | 110 (1.4%) |
| 65 to 74 Years | 67 (3.1%) | 31 (1.3%) |
| 75 Years and over | 68 (5.5%) | 143 (8.1%) |
Disability Class: Cognitive Difficulty
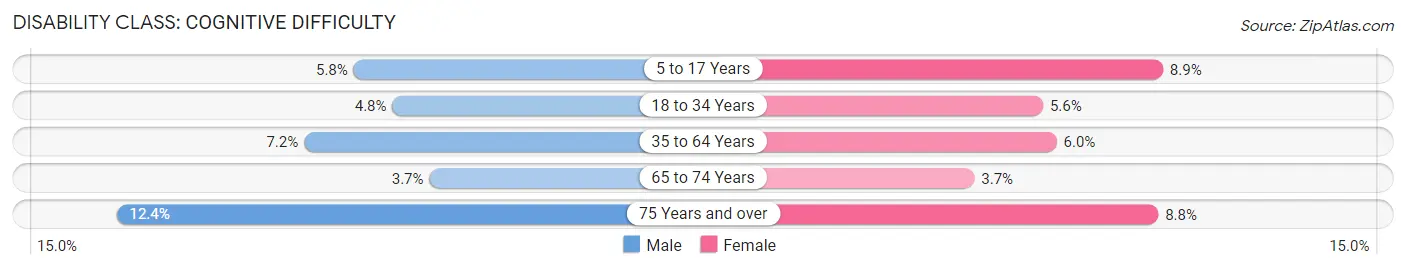
| Age Bracket | Male | Female |
| 5 to 17 Years | 207 (5.8%) | 275 (8.9%) |
| 18 to 34 Years | 312 (4.8%) | 405 (5.6%) |
| 35 to 64 Years | 604 (7.2%) | 469 (6.0%) |
| 65 to 74 Years | 80 (3.7%) | 86 (3.7%) |
| 75 Years and over | 153 (12.4%) | 156 (8.8%) |
Disability Class: Ambulatory Difficulty
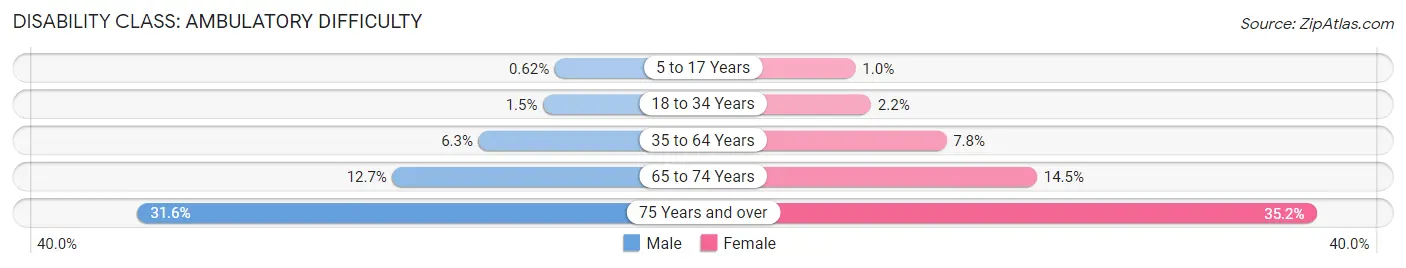
| Age Bracket | Male | Female |
| 5 to 17 Years | 22 (0.6%) | 31 (1.0%) |
| 18 to 34 Years | 98 (1.5%) | 156 (2.2%) |
| 35 to 64 Years | 526 (6.3%) | 608 (7.7%) |
| 65 to 74 Years | 272 (12.7%) | 337 (14.5%) |
| 75 Years and over | 389 (31.6%) | 624 (35.2%) |
Disability Class: Self-Care Difficulty
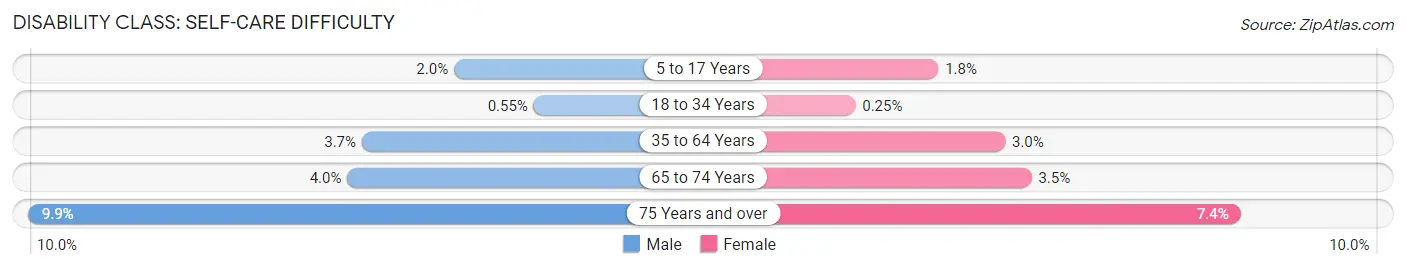
| Age Bracket | Male | Female |
| 5 to 17 Years | 72 (2.0%) | 55 (1.8%) |
| 18 to 34 Years | 36 (0.5%) | 18 (0.3%) |
| 35 to 64 Years | 313 (3.7%) | 238 (3.0%) |
| 65 to 74 Years | 86 (4.0%) | 82 (3.5%) |
| 75 Years and over | 122 (9.9%) | 131 (7.4%) |
Technology Access in Cortland County
Computing Device Access in Cortland County
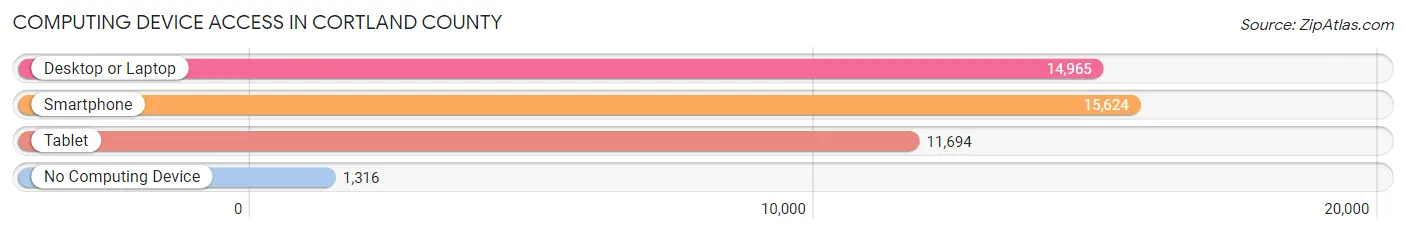
| Device Type | # Households | % Households |
| Desktop or Laptop | 14,965 | 80.8% |
| Smartphone | 15,624 | 84.4% |
| Tablet | 11,694 | 63.2% |
| No Computing Device | 1,316 | 7.1% |
| Total | 18,514 | 100.0% |
Internet Access in Cortland County
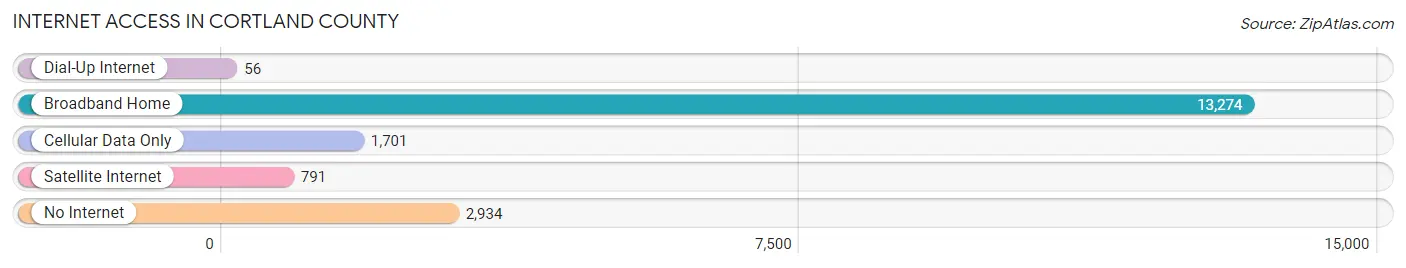
| Internet Type | # Households | % Households |
| Dial-Up Internet | 56 | 0.3% |
| Broadband Home | 13,274 | 71.7% |
| Cellular Data Only | 1,701 | 9.2% |
| Satellite Internet | 791 | 4.3% |
| No Internet | 2,934 | 15.9% |
| Total | 18,514 | 100.0% |
Cortland County Summary
Cortland County is located in the central part of New York State, in the Finger Lakes region. It is bordered by Onondaga, Cayuga, Tompkins, and Tioga Counties. Cortland County is home to the cities of Cortland and Homer, as well as the villages of Marathon, McGraw, and Cincinnatus. The county seat is Cortland.
History
Cortland County was formed in 1808 from parts of Onondaga and Tioga Counties. It was named after Pierre Van Cortlandt, the first lieutenant governor of New York. The county was originally home to the Iroquois and Algonquin Native American tribes. The first European settlers arrived in the area in the late 1700s.
The county was an important agricultural center in the 19th century, with dairy farming and fruit production being the main industries. The county was also home to several manufacturing companies, including the Cortland Wagon Works, which produced wagons and carriages.
Geography
Cortland County is located in the Finger Lakes region of New York State. It is bordered by Onondaga, Cayuga, Tompkins, and Tioga Counties. The county is home to several lakes, including Otselic Lake, Little York Lake, and Whitney Point Lake. The county is also home to several state parks, including Greek Peak Mountain Resort, Tompkins Cortland Community College Nature Preserve, and Virgil Mountain State Forest.
The county has a total area of 517 square miles, of which 514 square miles is land and 3 square miles is water. The highest point in the county is Virgil Mountain, which has an elevation of 2,092 feet.
Economy
Cortland County has a diverse economy, with agriculture, manufacturing, and tourism being the main industries. The county is home to several large employers, including Cortland Regional Medical Center, Tompkins Cortland Community College, and Greek Peak Mountain Resort.
Agriculture is an important part of the county’s economy, with dairy farming and fruit production being the main industries. The county is also home to several wineries and breweries.
Manufacturing is also an important part of the county’s economy, with several companies producing a variety of products, including furniture, paper products, and medical supplies.
Tourism is also an important part of the county’s economy, with several attractions, including Greek Peak Mountain Resort, Tompkins Cortland Community College Nature Preserve, and Virgil Mountain State Forest.
Demographics
As of the 2010 census, the population of Cortland County was 49,336. The population is made up of a variety of ethnic and racial backgrounds, including White (90.2%), African American (3.2%), Native American (0.5%), Asian (1.3%), and Hispanic or Latino (2.7%).
The median household income in the county is $45,945, and the median family income is $54,945. The per capita income in the county is $22,845. The unemployment rate in the county is 5.2%.
The largest cities in the county are Cortland (19,204), Homer (7,749), and Marathon (2,845). The largest employers in the county are Cortland Regional Medical Center, Tompkins Cortland Community College, and Greek Peak Mountain Resort.
Common Questions
What is Per Capita Income in Cortland County?
Per Capita income in Cortland County is $31,594.
What is the Median Family Income in Cortland County?
Median Family Income in Cortland County is $80,814.
What is the Median Household income in Cortland County?
Median Household Income in Cortland County is $65,029.
What is Income or Wage Gap in Cortland County?
Income or Wage Gap in Cortland County is 25.2%.
Women in Cortland County earn 74.8 cents for every dollar earned by a man.
What is Family Income Deficit in Cortland County?
Family Income Deficit in Cortland County is $9,410.
Families that are below poverty line in Cortland County earn $9,410 less on average than the poverty threshold level.
What is Inequality or Gini Index in Cortland County?
Inequality or Gini Index in Cortland County is 0.41.
What is the Total Population of Cortland County?
Total Population of Cortland County is 46,755.
What is the Total Male Population of Cortland County?
Total Male Population of Cortland County is 23,310.
What is the Total Female Population of Cortland County?
Total Female Population of Cortland County is 23,445.
What is the Ratio of Males per 100 Females in Cortland County?
There are 99.42 Males per 100 Females in Cortland County.
What is the Ratio of Females per 100 Males in Cortland County?
There are 100.58 Females per 100 Males in Cortland County.
What is the Median Population Age in Cortland County?
Median Population Age in Cortland County is 36.3 Years.
What is the Average Family Size in Cortland County
Average Family Size in Cortland County is 2.9 People.
What is the Average Household Size in Cortland County
Average Household Size in Cortland County is 2.3 People.
How Large is the Labor Force in Cortland County?
There are 24,659 People in the Labor Forcein in Cortland County.
What is the Percentage of People in the Labor Force in Cortland County?
62.9% of People are in the Labor Force in Cortland County.
What is the Unemployment Rate in Cortland County?
Unemployment Rate in Cortland County is 5.4%.