Clinton County, NY Map & Demographics
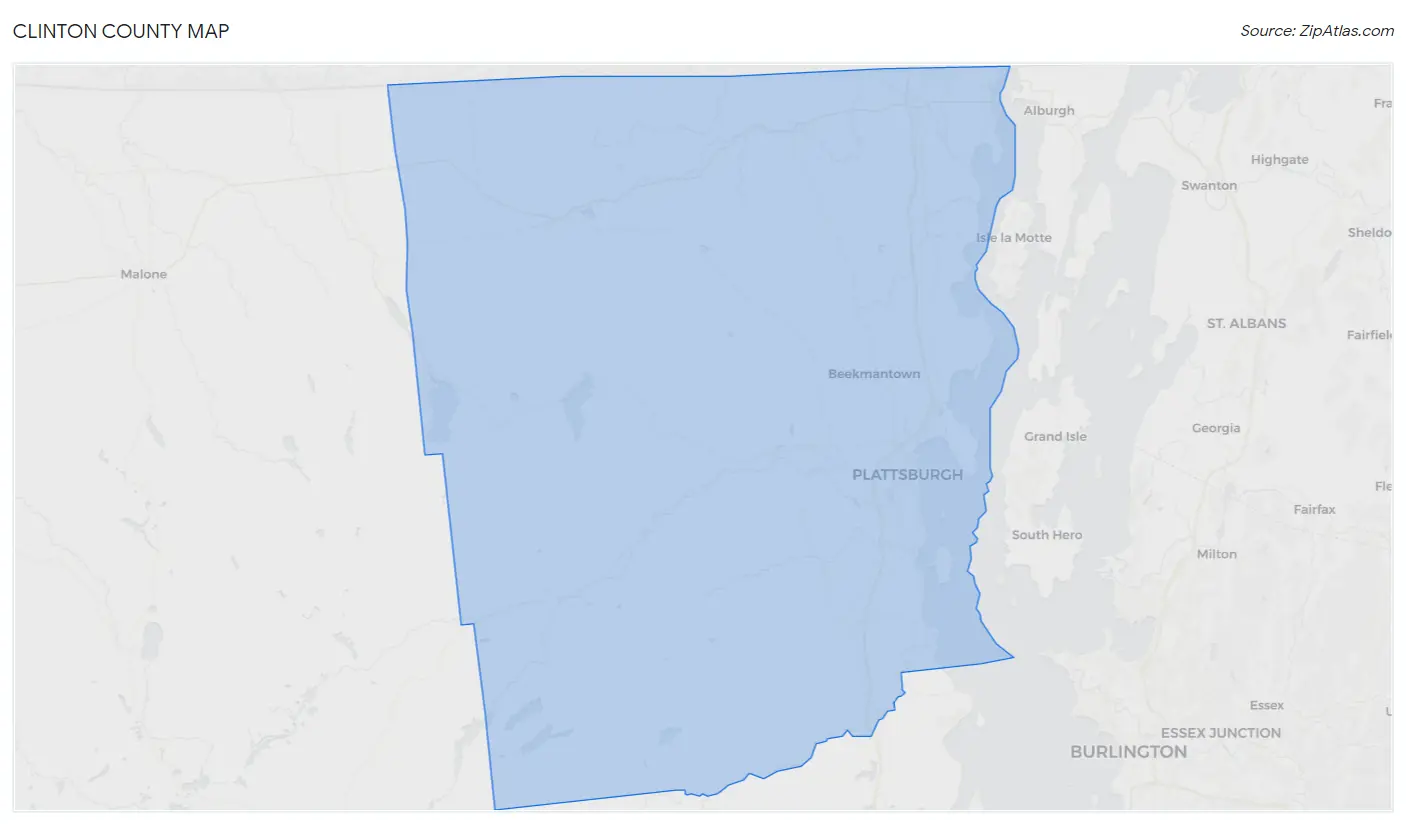
Clinton County Map
Clinton County Overview
$34,834
PER CAPITA INCOME
$86,712
AVG FAMILY INCOME
$67,097
AVG HOUSEHOLD INCOME
24.4%
WAGE / INCOME GAP [ % ]
75.6¢/ $1
WAGE / INCOME GAP [ $ ]
$11,701
FAMILY INCOME DEFICIT
0.44
INEQUALITY / GINI INDEX
79,839
TOTAL POPULATION
41,064
MALE POPULATION
38,775
FEMALE POPULATION
105.90
MALES / 100 FEMALES
94.43
FEMALES / 100 MALES
40.9
MEDIAN AGE
2.8
AVG FAMILY SIZE
2.2
AVG HOUSEHOLD SIZE
37,852
LABOR FORCE [ PEOPLE ]
56.4%
PERCENT IN LABOR FORCE
4.7%
UNEMPLOYMENT RATE
Clinton County Area Codes
Income in Clinton County
Income Overview in Clinton County
Per Capita Income in Clinton County is $34,834, while median incomes of families and households are $86,712 and $67,097 respectively.
| Characteristic | Number | Measure |
| Per Capita Income | 79,839 | $34,834 |
| Median Family Income | 19,491 | $86,712 |
| Mean Family Income | 19,491 | $100,664 |
| Median Household Income | 32,651 | $67,097 |
| Mean Household Income | 32,651 | $84,635 |
| Income Deficit | 19,491 | $11,701 |
| Wage / Income Gap (%) | 79,839 | 24.37% |
| Wage / Income Gap ($) | 79,839 | 75.63¢ per $1 |
| Gini / Inequality Index | 79,839 | 0.44 |
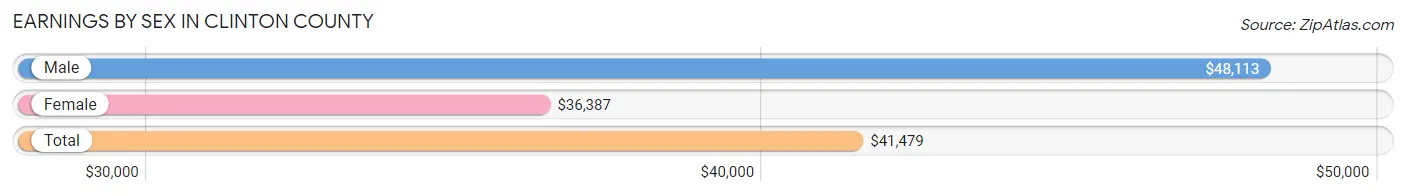
Earnings by Sex in Clinton County
Average Earnings in Clinton County are $41,479, $48,113 for men and $36,387 for women, a difference of 24.4%.
| Sex | Number | Average Earnings |
| Male | 21,338 (52.5%) | $48,113 |
| Female | 19,314 (47.5%) | $36,387 |
| Total | 40,652 (100.0%) | $41,479 |
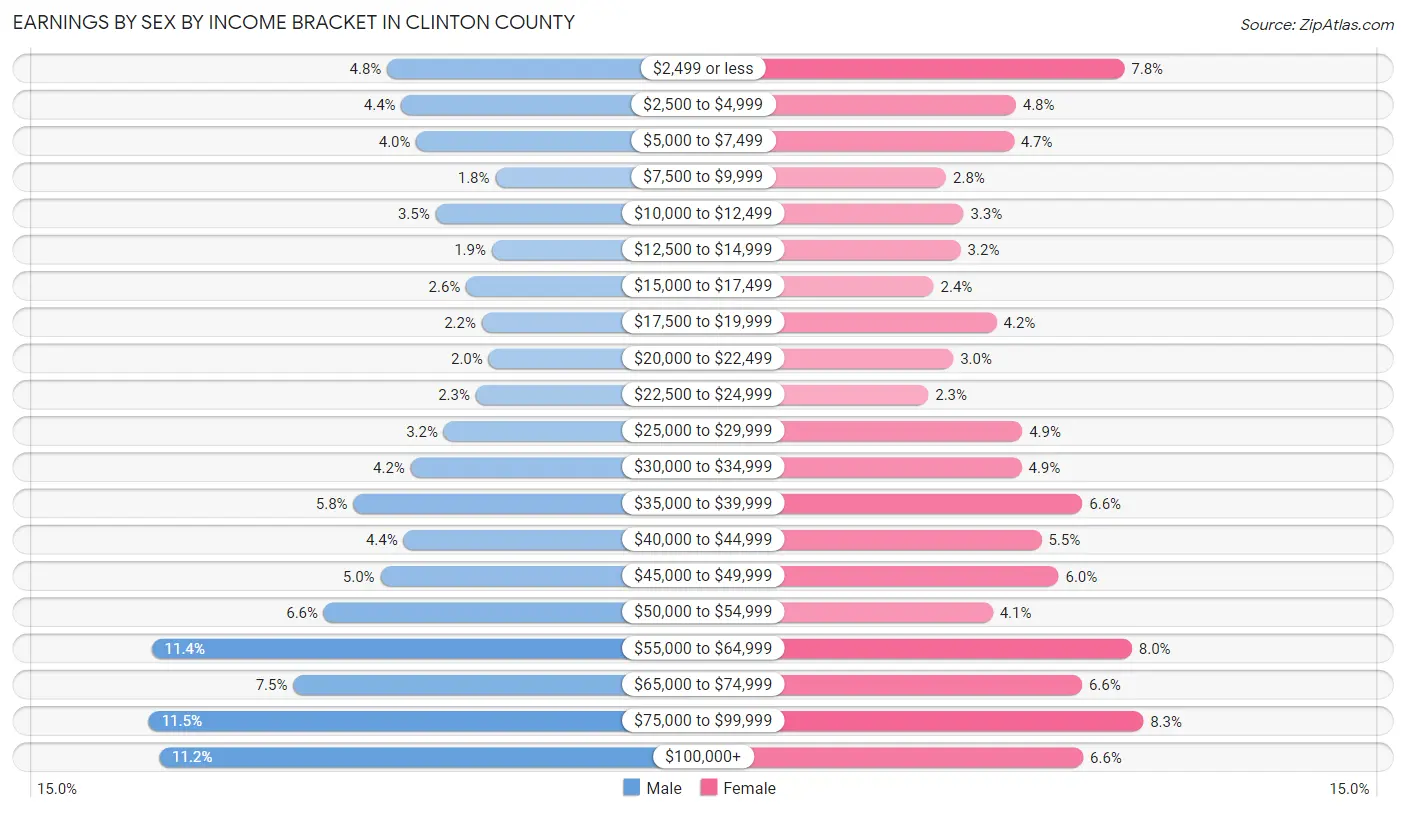
Earnings by Sex by Income Bracket in Clinton County
The most common earnings brackets in Clinton County are $75,000 to $99,999 for men (2,457 | 11.5%) and $75,000 to $99,999 for women (1,608 | 8.3%).
| Income | Male | Female |
| $2,499 or less | 1,027 (4.8%) | 1,506 (7.8%) |
| $2,500 to $4,999 | 942 (4.4%) | 917 (4.8%) |
| $5,000 to $7,499 | 851 (4.0%) | 906 (4.7%) |
| $7,500 to $9,999 | 377 (1.8%) | 538 (2.8%) |
| $10,000 to $12,499 | 736 (3.5%) | 633 (3.3%) |
| $12,500 to $14,999 | 399 (1.9%) | 618 (3.2%) |
| $15,000 to $17,499 | 553 (2.6%) | 472 (2.4%) |
| $17,500 to $19,999 | 459 (2.1%) | 813 (4.2%) |
| $20,000 to $22,499 | 419 (2.0%) | 578 (3.0%) |
| $22,500 to $24,999 | 494 (2.3%) | 442 (2.3%) |
| $25,000 to $29,999 | 688 (3.2%) | 952 (4.9%) |
| $30,000 to $34,999 | 885 (4.2%) | 948 (4.9%) |
| $35,000 to $39,999 | 1,230 (5.8%) | 1,278 (6.6%) |
| $40,000 to $44,999 | 928 (4.3%) | 1,057 (5.5%) |
| $45,000 to $49,999 | 1,066 (5.0%) | 1,149 (5.9%) |
| $50,000 to $54,999 | 1,406 (6.6%) | 792 (4.1%) |
| $55,000 to $64,999 | 2,438 (11.4%) | 1,548 (8.0%) |
| $65,000 to $74,999 | 1,589 (7.4%) | 1,276 (6.6%) |
| $75,000 to $99,999 | 2,457 (11.5%) | 1,608 (8.3%) |
| $100,000+ | 2,394 (11.2%) | 1,283 (6.6%) |
| Total | 21,338 (100.0%) | 19,314 (100.0%) |
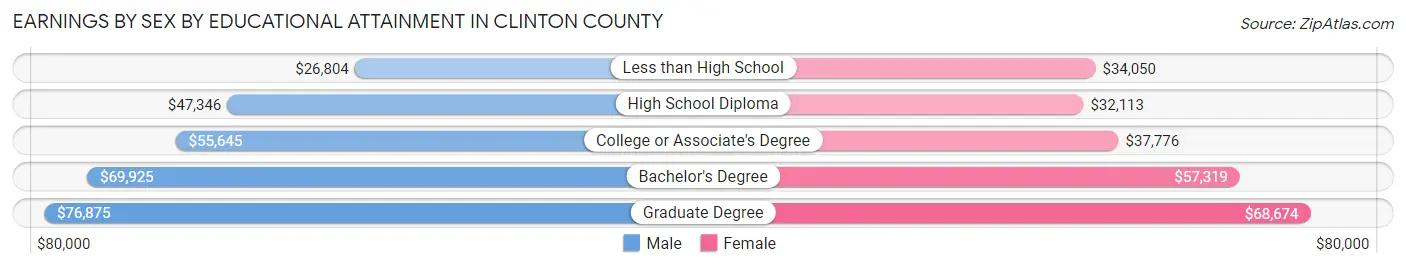
Earnings by Sex by Educational Attainment in Clinton County
Average earnings in Clinton County are $54,514 for men and $43,936 for women, a difference of 19.4%. Men with an educational attainment of graduate degree enjoy the highest average annual earnings of $76,875, while those with less than high school education earn the least with $26,804. Women with an educational attainment of graduate degree earn the most with the average annual earnings of $68,674, while those with high school diploma education have the smallest earnings of $32,113.
| Educational Attainment | Male Income | Female Income |
| Less than High School | $26,804 | $34,050 |
| High School Diploma | $47,346 | $32,113 |
| College or Associate's Degree | $55,645 | $37,776 |
| Bachelor's Degree | $69,925 | $57,319 |
| Graduate Degree | $76,875 | $68,674 |
| Total | $54,514 | $43,936 |
Family Income in Clinton County
Family Income Brackets in Clinton County
According to the Clinton County family income data, there are 4,775 families falling into the $100,000 to $149,999 income range, which is the most common income bracket and makes up 24.5% of all families. Conversely, the $10,000 to $14,999 income bracket is the least frequent group with only 409 families (2.1%) belonging to this category.
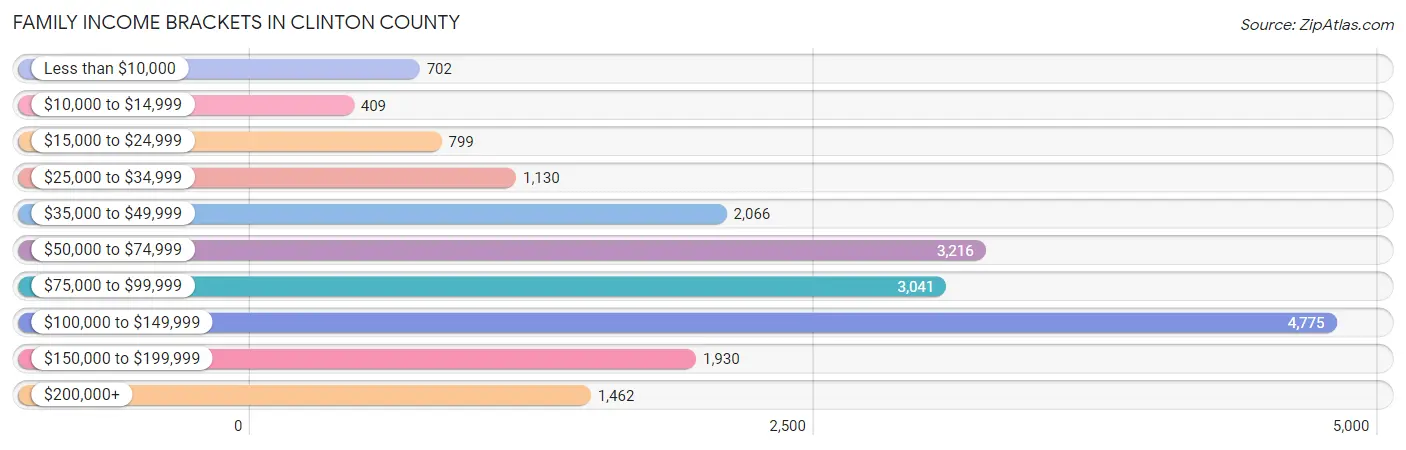
| Income Bracket | # Families | % Families |
| Less than $10,000 | 702 | 3.6% |
| $10,000 to $14,999 | 409 | 2.1% |
| $15,000 to $24,999 | 799 | 4.1% |
| $25,000 to $34,999 | 1,130 | 5.8% |
| $35,000 to $49,999 | 2,066 | 10.6% |
| $50,000 to $74,999 | 3,216 | 16.5% |
| $75,000 to $99,999 | 3,041 | 15.6% |
| $100,000 to $149,999 | 4,775 | 24.5% |
| $150,000 to $199,999 | 1,930 | 9.9% |
| $200,000+ | 1,462 | 7.5% |
Family Income by Famaliy Size in Clinton County
4-person families (3,248 | 16.7%) account for the highest median family income in Clinton County with $104,000 per family, while 2-person families (10,413 | 53.4%) have the highest median income of $38,478 per family member.
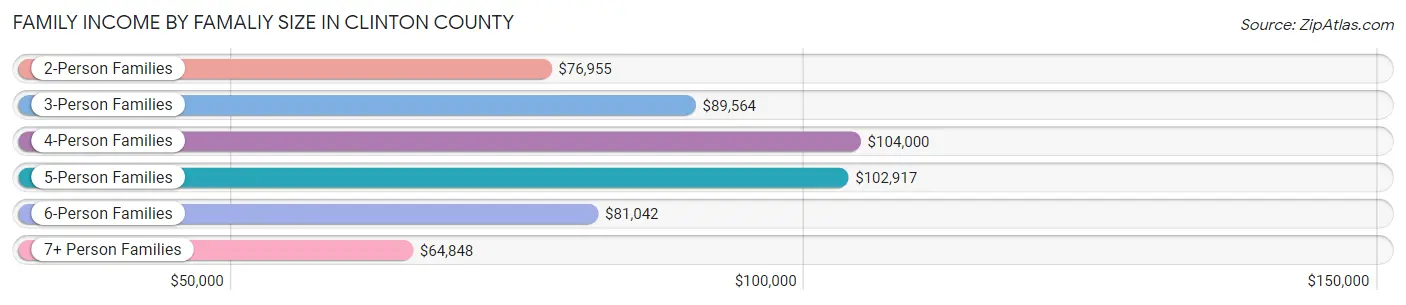
| Income Bracket | # Families | Median Income |
| 2-Person Families | 10,413 (53.4%) | $76,955 |
| 3-Person Families | 4,338 (22.3%) | $89,564 |
| 4-Person Families | 3,248 (16.7%) | $104,000 |
| 5-Person Families | 1,112 (5.7%) | $102,917 |
| 6-Person Families | 209 (1.1%) | $81,042 |
| 7+ Person Families | 171 (0.9%) | $64,848 |
| Total | 19,491 (100.0%) | $86,712 |
Family Income by Number of Earners in Clinton County
The median family income in Clinton County is $86,712, with families comprising 3+ earners (1,608) having the highest median family income of $147,941, while families with no earners (4,321) have the lowest median family income of $49,419, accounting for 8.3% and 22.2% of families, respectively.
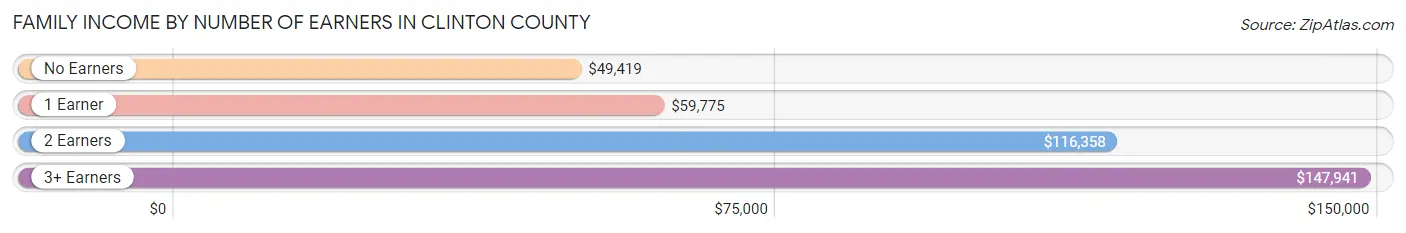
| Number of Earners | # Families | Median Income |
| No Earners | 4,321 (22.2%) | $49,419 |
| 1 Earner | 5,956 (30.6%) | $59,775 |
| 2 Earners | 7,606 (39.0%) | $116,358 |
| 3+ Earners | 1,608 (8.3%) | $147,941 |
| Total | 19,491 (100.0%) | $86,712 |
Household Income in Clinton County
Household Income Brackets in Clinton County
With 6,236 households falling in the category, the $100,000 to $149,999 income range is the most frequent in Clinton County, accounting for 19.1% of all households. In contrast, only 1,339 households (4.1%) fall into the $10,000 to $14,999 income bracket, making it the least populous group.
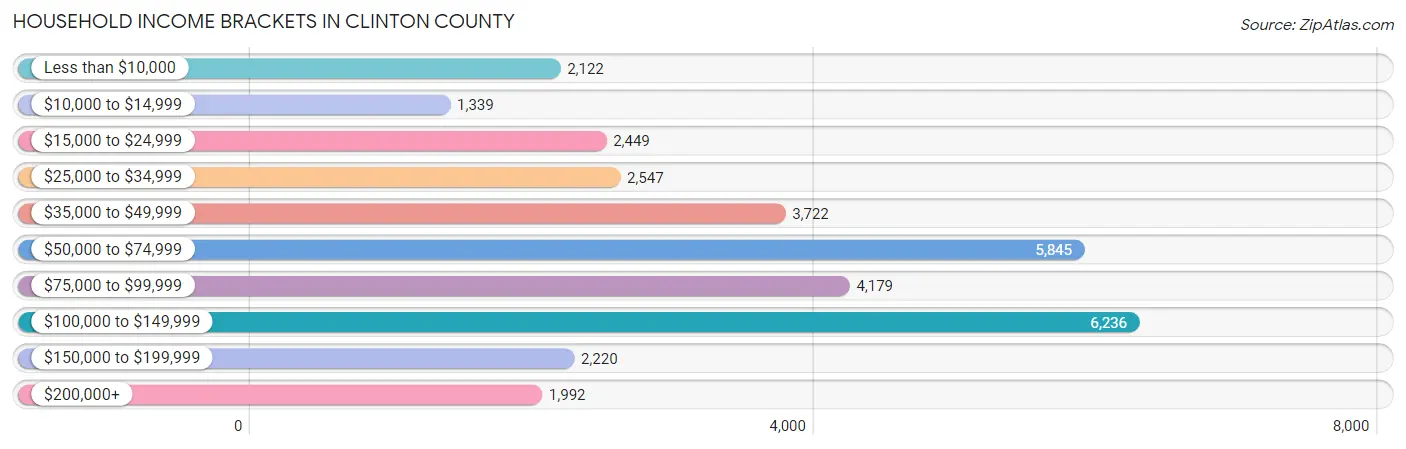
| Income Bracket | # Households | % Households |
| Less than $10,000 | 2,122 | 6.5% |
| $10,000 to $14,999 | 1,339 | 4.1% |
| $15,000 to $24,999 | 2,449 | 7.5% |
| $25,000 to $34,999 | 2,547 | 7.8% |
| $35,000 to $49,999 | 3,722 | 11.4% |
| $50,000 to $74,999 | 5,845 | 17.9% |
| $75,000 to $99,999 | 4,179 | 12.8% |
| $100,000 to $149,999 | 6,236 | 19.1% |
| $150,000 to $199,999 | 2,220 | 6.8% |
| $200,000+ | 1,992 | 6.1% |
Household Income by Householder Age in Clinton County
The median household income in Clinton County is $67,097, with the highest median household income of $79,564 found in the 45 to 64 years age bracket for the primary householder. A total of 12,059 households (36.9%) fall into this category. Meanwhile, the 15 to 24 years age bracket for the primary householder has the lowest median household income of $40,657, with 1,969 households (6.0%) in this group.
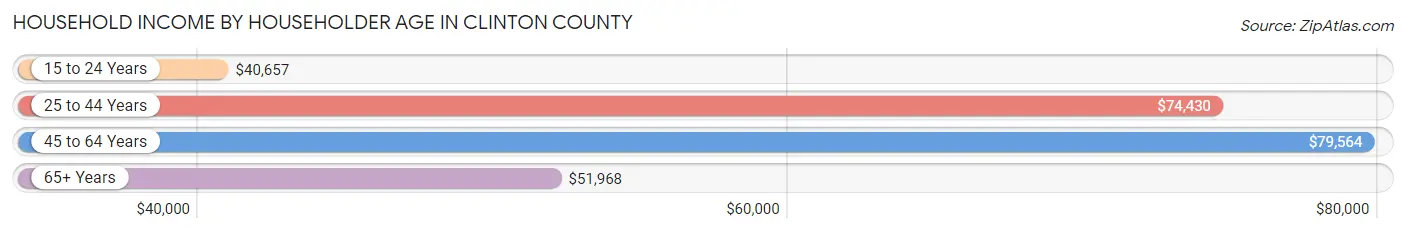
| Income Bracket | # Households | Median Income |
| 15 to 24 Years | 1,969 (6.0%) | $40,657 |
| 25 to 44 Years | 9,594 (29.4%) | $74,430 |
| 45 to 64 Years | 12,059 (36.9%) | $79,564 |
| 65+ Years | 9,029 (27.7%) | $51,968 |
| Total | 32,651 (100.0%) | $67,097 |
Poverty in Clinton County
Income Below Poverty by Sex and Age in Clinton County
With 11.5% poverty level for males and 14.6% for females among the residents of Clinton County, 18 to 24 year old males and 16 and 17 year old females are the most vulnerable to poverty, with 879 males (22.8%) and 290 females (39.9%) in their respective age groups living below the poverty level.
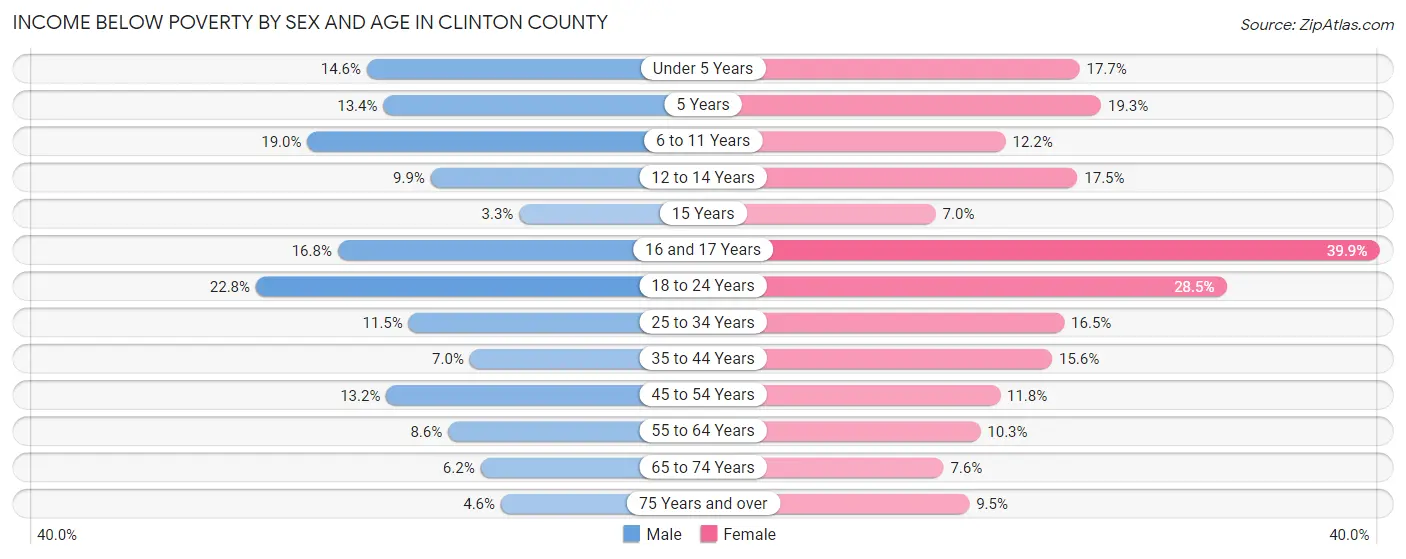
| Age Bracket | Male | Female |
| Under 5 Years | 257 (14.6%) | 297 (17.6%) |
| 5 Years | 65 (13.4%) | 67 (19.3%) |
| 6 to 11 Years | 469 (19.0%) | 294 (12.2%) |
| 12 to 14 Years | 121 (9.9%) | 202 (17.5%) |
| 15 Years | 14 (3.3%) | 34 (7.0%) |
| 16 and 17 Years | 139 (16.8%) | 290 (39.9%) |
| 18 to 24 Years | 879 (22.8%) | 1,053 (28.5%) |
| 25 to 34 Years | 512 (11.5%) | 684 (16.5%) |
| 35 to 44 Years | 306 (7.0%) | 686 (15.6%) |
| 45 to 54 Years | 621 (13.2%) | 542 (11.7%) |
| 55 to 64 Years | 473 (8.6%) | 601 (10.3%) |
| 65 to 74 Years | 257 (6.1%) | 320 (7.5%) |
| 75 Years and over | 108 (4.6%) | 295 (9.5%) |
| Total | 4,221 (11.5%) | 5,365 (14.6%) |
Income Above Poverty by Sex and Age in Clinton County
According to the poverty statistics in Clinton County, males aged 15 years and females aged 15 years are the age groups that are most secure financially, with 96.7% of males and 93.0% of females in these age groups living above the poverty line.
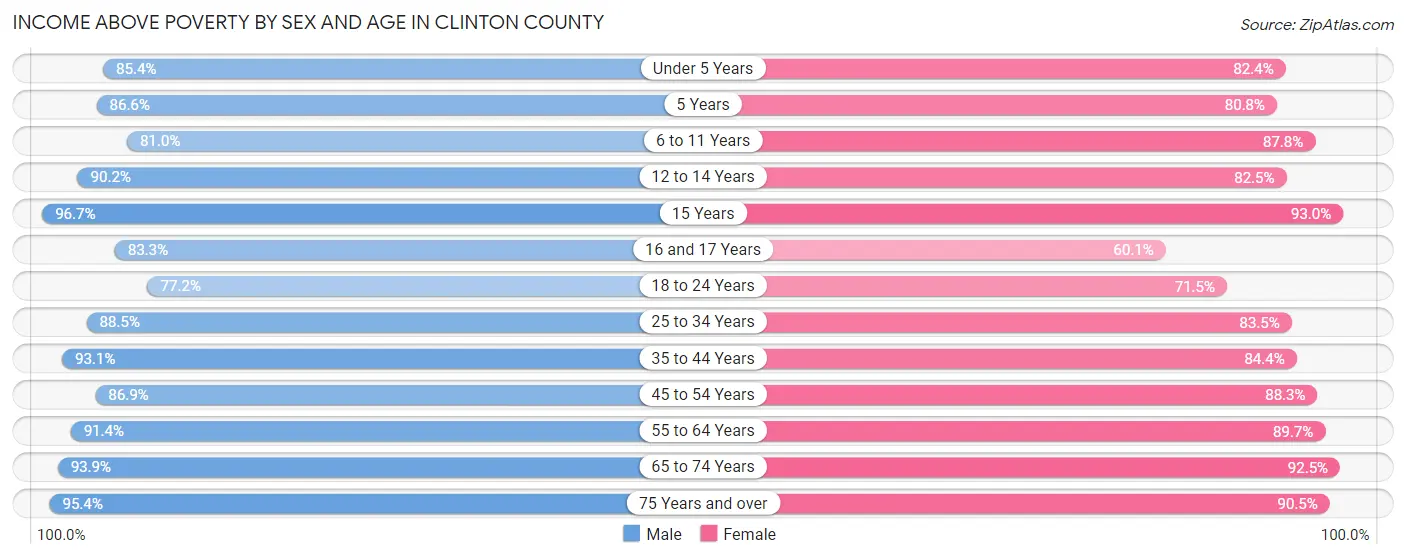
| Age Bracket | Male | Female |
| Under 5 Years | 1,505 (85.4%) | 1,386 (82.4%) |
| 5 Years | 421 (86.6%) | 281 (80.7%) |
| 6 to 11 Years | 1,998 (81.0%) | 2,124 (87.8%) |
| 12 to 14 Years | 1,107 (90.1%) | 953 (82.5%) |
| 15 Years | 413 (96.7%) | 454 (93.0%) |
| 16 and 17 Years | 691 (83.3%) | 437 (60.1%) |
| 18 to 24 Years | 2,972 (77.2%) | 2,637 (71.5%) |
| 25 to 34 Years | 3,944 (88.5%) | 3,459 (83.5%) |
| 35 to 44 Years | 4,099 (93.0%) | 3,708 (84.4%) |
| 45 to 54 Years | 4,102 (86.9%) | 4,072 (88.2%) |
| 55 to 64 Years | 5,052 (91.4%) | 5,239 (89.7%) |
| 65 to 74 Years | 3,923 (93.9%) | 3,920 (92.4%) |
| 75 Years and over | 2,218 (95.4%) | 2,825 (90.5%) |
| Total | 32,445 (88.5%) | 31,495 (85.4%) |
Income Below Poverty Among Married-Couple Families in Clinton County
The poverty statistics for married-couple families in Clinton County show that 3.5% or 528 of the total 15,041 families live below the poverty line. Families with 3 or 4 children have the highest poverty rate of 15.2%, comprising of 136 families. On the other hand, families with 1 or 2 children have the lowest poverty rate of 1.4%, which includes 64 families.
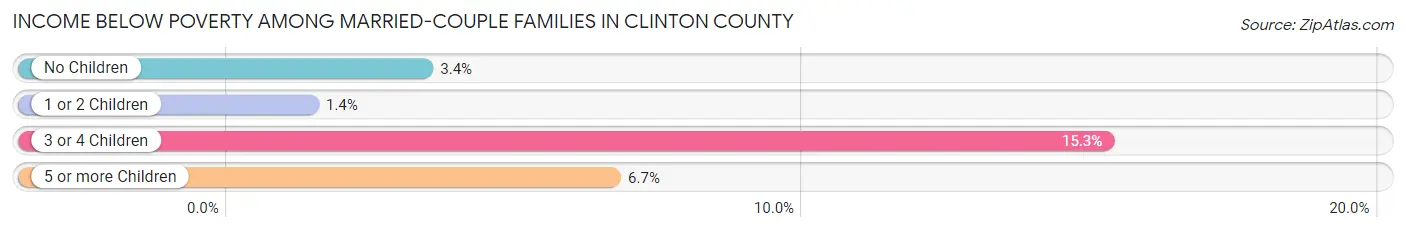
| Children | Above Poverty | Below Poverty |
| No Children | 9,243 (96.6%) | 325 (3.4%) |
| 1 or 2 Children | 4,472 (98.6%) | 64 (1.4%) |
| 3 or 4 Children | 756 (84.8%) | 136 (15.2%) |
| 5 or more Children | 42 (93.3%) | 3 (6.7%) |
| Total | 14,513 (96.5%) | 528 (3.5%) |
Income Below Poverty Among Single-Parent Households in Clinton County
According to the poverty data in Clinton County, 18.6% or 274 single-father households and 28.6% or 851 single-mother households are living below the poverty line. Among single-father households, those with 5 or more children have the highest poverty rate, with 2 households (100.0%) experiencing poverty. Likewise, among single-mother households, those with 5 or more children have the highest poverty rate, with 15 households (100.0%) falling below the poverty line.
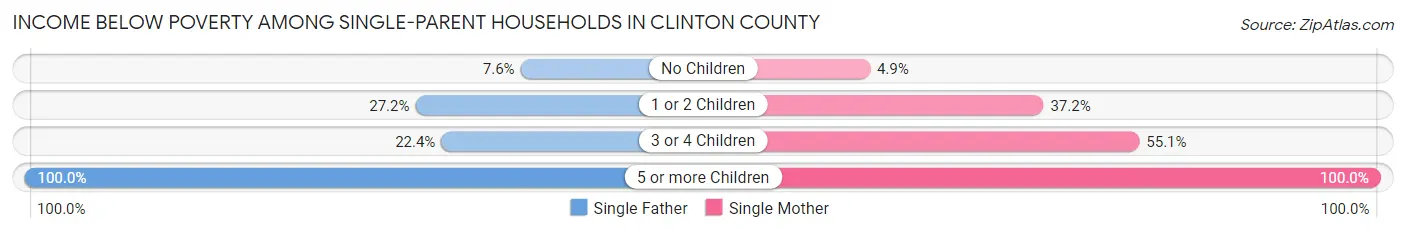
| Children | Single Father | Single Mother |
| No Children | 47 (7.6%) | 47 (4.9%) |
| 1 or 2 Children | 184 (27.2%) | 648 (37.2%) |
| 3 or 4 Children | 41 (22.4%) | 141 (55.1%) |
| 5 or more Children | 2 (100.0%) | 15 (100.0%) |
| Total | 274 (18.6%) | 851 (28.6%) |
Income Below Poverty Among Married-Couple vs Single-Parent Households in Clinton County
The poverty data for Clinton County shows that 528 of the married-couple family households (3.5%) and 1,125 of the single-parent households (25.3%) are living below the poverty level. Within the married-couple family households, those with 3 or 4 children have the highest poverty rate, with 136 households (15.2%) falling below the poverty line. Among the single-parent households, those with 5 or more children have the highest poverty rate, with 17 household (100.0%) living below poverty.
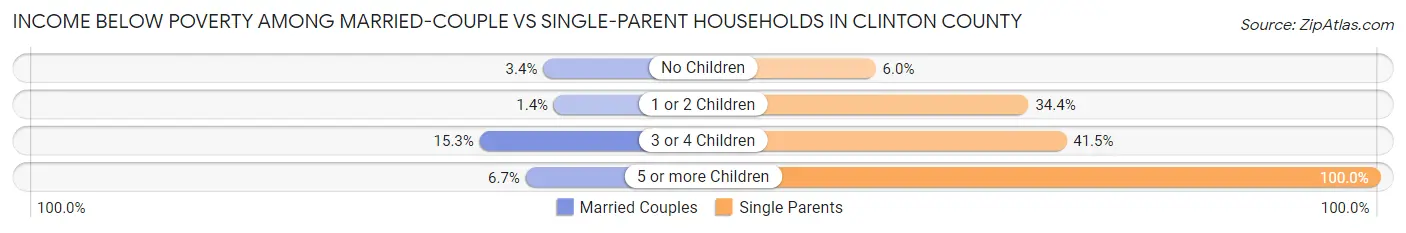
| Children | Married-Couple Families | Single-Parent Households |
| No Children | 325 (3.4%) | 94 (6.0%) |
| 1 or 2 Children | 64 (1.4%) | 832 (34.4%) |
| 3 or 4 Children | 136 (15.2%) | 182 (41.5%) |
| 5 or more Children | 3 (6.7%) | 17 (100.0%) |
| Total | 528 (3.5%) | 1,125 (25.3%) |
Race in Clinton County
The most populous races in Clinton County are White / Caucasian (72,093 | 90.3%), Black / African American (2,845 | 3.6%), and Hispanic or Latino (2,340 | 2.9%).
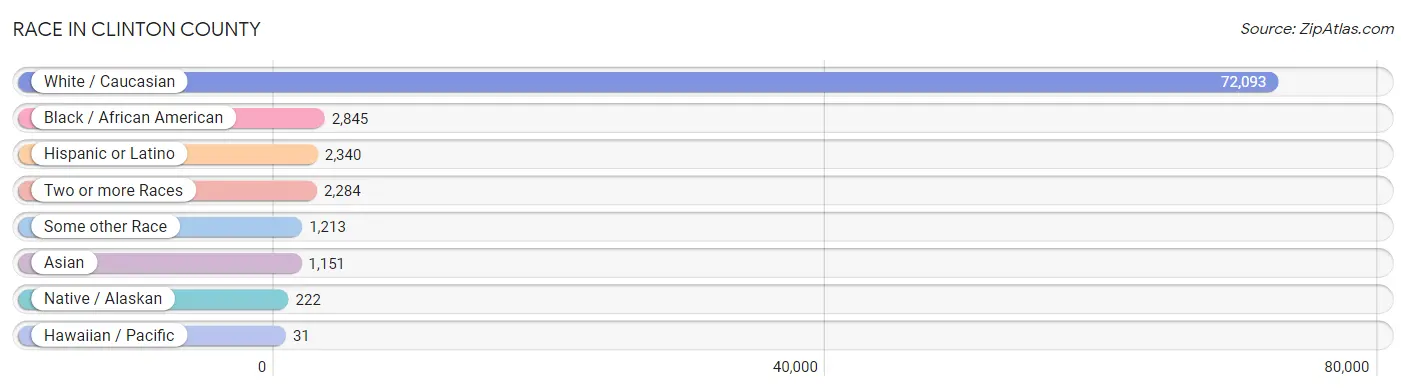
| Race | # Population | % Population |
| Asian | 1,151 | 1.4% |
| Black / African American | 2,845 | 3.6% |
| Hawaiian / Pacific | 31 | 0.0% |
| Hispanic or Latino | 2,340 | 2.9% |
| Native / Alaskan | 222 | 0.3% |
| White / Caucasian | 72,093 | 90.3% |
| Two or more Races | 2,284 | 2.9% |
| Some other Race | 1,213 | 1.5% |
| Total | 79,839 | 100.0% |
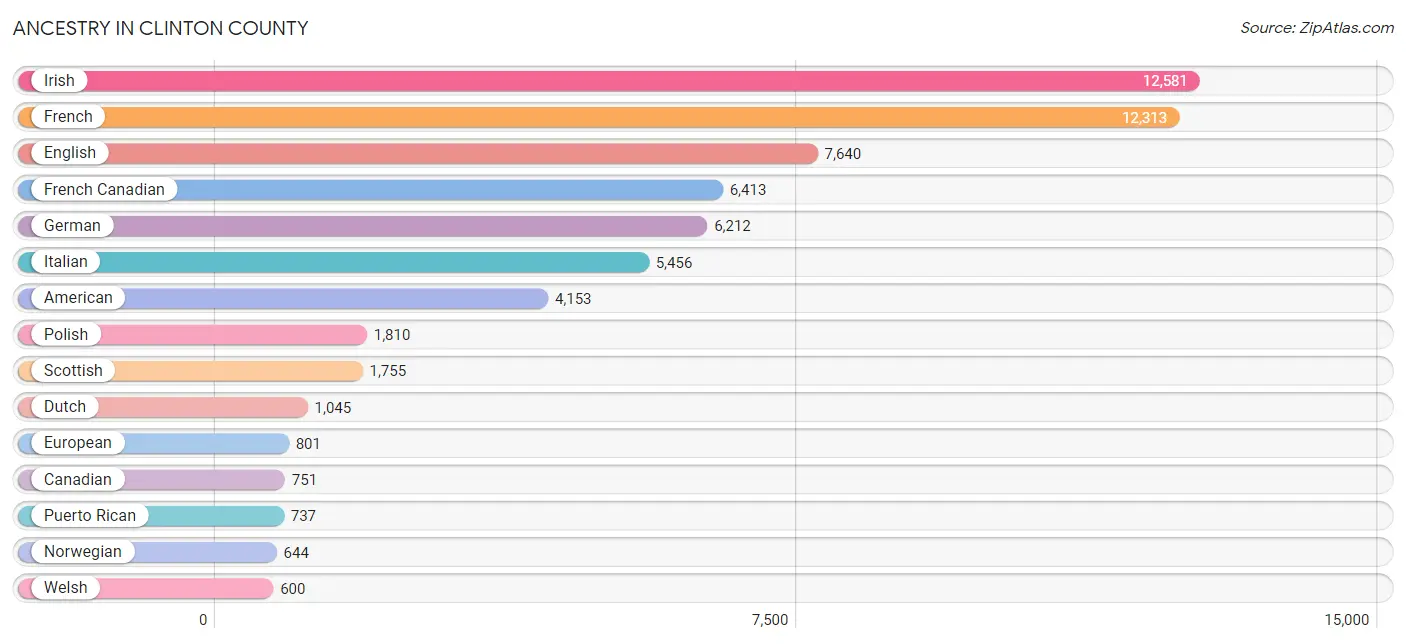
Ancestry in Clinton County
The most populous ancestries reported in Clinton County are Irish (12,581 | 15.8%), French (12,313 | 15.4%), English (7,640 | 9.6%), French Canadian (6,413 | 8.0%), and German (6,212 | 7.8%), together accounting for 56.6% of all Clinton County residents.
| Ancestry | # Population | % Population |
| African | 111 | 0.1% |
| Albanian | 12 | 0.0% |
| American | 4,153 | 5.2% |
| Arab | 223 | 0.3% |
| Argentinean | 5 | 0.0% |
| Armenian | 20 | 0.0% |
| Australian | 18 | 0.0% |
| Austrian | 167 | 0.2% |
| Belizean | 12 | 0.0% |
| Bhutanese | 164 | 0.2% |
| Blackfeet | 21 | 0.0% |
| British | 256 | 0.3% |
| British West Indian | 8 | 0.0% |
| Burmese | 137 | 0.2% |
| Cajun | 28 | 0.0% |
| Canadian | 751 | 0.9% |
| Celtic | 74 | 0.1% |
| Central American | 269 | 0.3% |
| Central American Indian | 5 | 0.0% |
| Cherokee | 3 | 0.0% |
| Chilean | 20 | 0.0% |
| Colombian | 15 | 0.0% |
| Cree | 1 | 0.0% |
| Croatian | 30 | 0.0% |
| Cuban | 52 | 0.1% |
| Czech | 235 | 0.3% |
| Czechoslovakian | 36 | 0.1% |
| Danish | 107 | 0.1% |
| Delaware | 2 | 0.0% |
| Dominican | 402 | 0.5% |
| Dutch | 1,045 | 1.3% |
| Eastern European | 194 | 0.2% |
| Ecuadorian | 75 | 0.1% |
| English | 7,640 | 9.6% |
| European | 801 | 1.0% |
| Filipino | 23 | 0.0% |
| Finnish | 59 | 0.1% |
| French | 12,313 | 15.4% |
| French American Indian | 21 | 0.0% |
| French Canadian | 6,413 | 8.0% |
| German | 6,212 | 7.8% |
| Ghanaian | 63 | 0.1% |
| Greek | 223 | 0.3% |
| Guamanian / Chamorro | 22 | 0.0% |
| Guatemalan | 46 | 0.1% |
| Guyanese | 20 | 0.0% |
| Haitian | 32 | 0.0% |
| Honduran | 42 | 0.1% |
| Hungarian | 175 | 0.2% |
| Indian (Asian) | 282 | 0.4% |
| Inupiat | 4 | 0.0% |
| Irish | 12,581 | 15.8% |
| Iroquois | 55 | 0.1% |
| Israeli | 34 | 0.0% |
| Italian | 5,456 | 6.8% |
| Jamaican | 113 | 0.1% |
| Kenyan | 17 | 0.0% |
| Korean | 424 | 0.5% |
| Latvian | 20 | 0.0% |
| Lebanese | 133 | 0.2% |
| Lithuanian | 207 | 0.3% |
| Luxembourger | 42 | 0.1% |
| Macedonian | 34 | 0.0% |
| Mexican | 293 | 0.4% |
| Mexican American Indian | 29 | 0.0% |
| Mongolian | 19 | 0.0% |
| Moroccan | 68 | 0.1% |
| Navajo | 1 | 0.0% |
| New Zealander | 20 | 0.0% |
| Nigerian | 177 | 0.2% |
| Northern European | 109 | 0.1% |
| Norwegian | 644 | 0.8% |
| Pakistani | 27 | 0.0% |
| Panamanian | 42 | 0.1% |
| Pennsylvania German | 12 | 0.0% |
| Peruvian | 13 | 0.0% |
| Polish | 1,810 | 2.3% |
| Portuguese | 117 | 0.2% |
| Potawatomi | 2 | 0.0% |
| Puerto Rican | 737 | 0.9% |
| Romanian | 74 | 0.1% |
| Russian | 239 | 0.3% |
| Salvadoran | 139 | 0.2% |
| Scandinavian | 184 | 0.2% |
| Scotch-Irish | 474 | 0.6% |
| Scottish | 1,755 | 2.2% |
| Serbian | 9 | 0.0% |
| Sioux | 4 | 0.0% |
| Slavic | 59 | 0.1% |
| Slovak | 102 | 0.1% |
| Slovene | 6 | 0.0% |
| South African | 10 | 0.0% |
| South American | 130 | 0.2% |
| South American Indian | 2 | 0.0% |
| Spaniard | 49 | 0.1% |
| Spanish | 50 | 0.1% |
| Sri Lankan | 22 | 0.0% |
| Subsaharan African | 399 | 0.5% |
| Swedish | 570 | 0.7% |
| Swiss | 236 | 0.3% |
| Thai | 273 | 0.3% |
| Trinidadian and Tobagonian | 12 | 0.0% |
| Turkish | 22 | 0.0% |
| Ukrainian | 106 | 0.1% |
| Venezuelan | 2 | 0.0% |
| Vietnamese | 63 | 0.1% |
| Welsh | 600 | 0.7% |
| West Indian | 35 | 0.0% |
| Yugoslavian | 39 | 0.1% | View All 109 Rows |
Immigrants in Clinton County
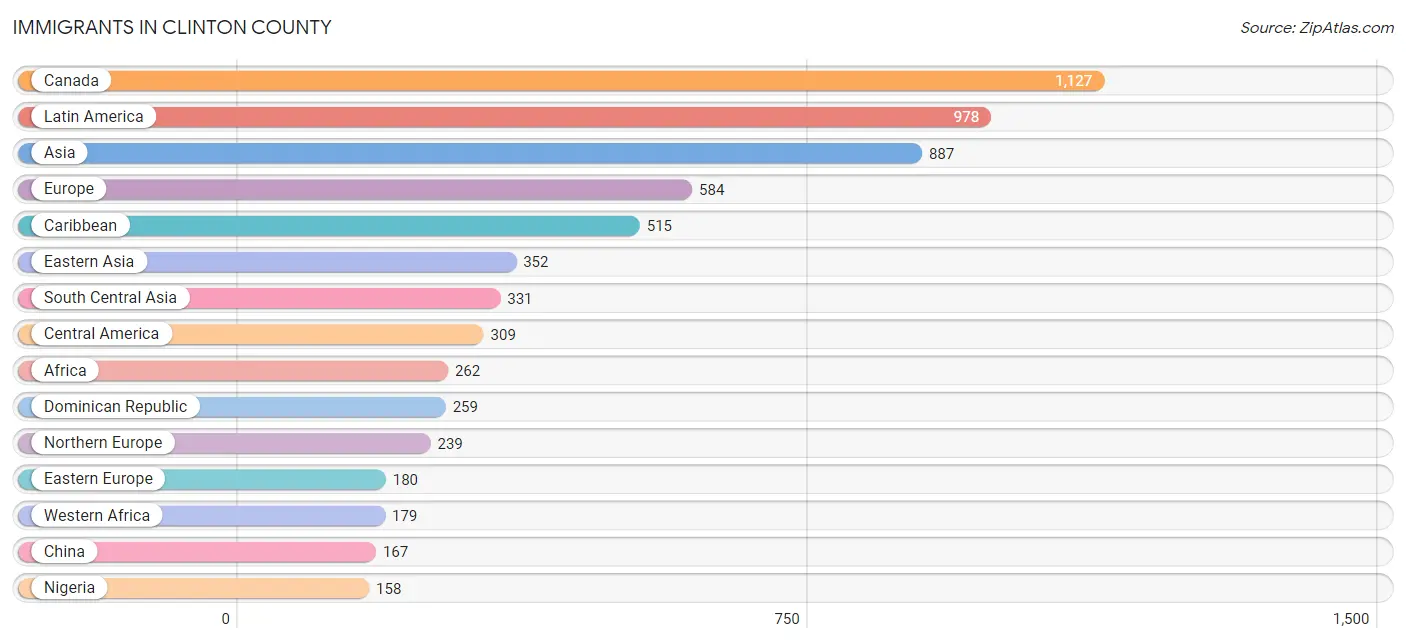
The most numerous immigrant groups reported in Clinton County came from Canada (1,127 | 1.4%), Latin America (978 | 1.2%), Asia (887 | 1.1%), Europe (584 | 0.7%), and Caribbean (515 | 0.6%), together accounting for 5.1% of all Clinton County residents.
| Immigration Origin | # Population | % Population |
| Africa | 262 | 0.3% |
| Albania | 12 | 0.0% |
| Asia | 887 | 1.1% |
| Bangladesh | 70 | 0.1% |
| Belgium | 18 | 0.0% |
| Canada | 1,127 | 1.4% |
| Caribbean | 515 | 0.6% |
| Central America | 309 | 0.4% |
| Chile | 5 | 0.0% |
| China | 167 | 0.2% |
| Colombia | 17 | 0.0% |
| Cuba | 43 | 0.1% |
| Czechoslovakia | 3 | 0.0% |
| Denmark | 22 | 0.0% |
| Dominica | 7 | 0.0% |
| Dominican Republic | 259 | 0.3% |
| Eastern Africa | 40 | 0.1% |
| Eastern Asia | 352 | 0.4% |
| Eastern Europe | 180 | 0.2% |
| Ecuador | 43 | 0.1% |
| El Salvador | 102 | 0.1% |
| England | 81 | 0.1% |
| Europe | 584 | 0.7% |
| France | 40 | 0.1% |
| Germany | 78 | 0.1% |
| Ghana | 21 | 0.0% |
| Greece | 22 | 0.0% |
| Guatemala | 40 | 0.1% |
| Guyana | 87 | 0.1% |
| Haiti | 5 | 0.0% |
| Honduras | 36 | 0.1% |
| Hong Kong | 8 | 0.0% |
| India | 141 | 0.2% |
| Ireland | 3 | 0.0% |
| Jamaica | 137 | 0.2% |
| Japan | 88 | 0.1% |
| Kenya | 23 | 0.0% |
| Korea | 97 | 0.1% |
| Kuwait | 15 | 0.0% |
| Latin America | 978 | 1.2% |
| Lebanon | 7 | 0.0% |
| Mexico | 131 | 0.2% |
| Morocco | 23 | 0.0% |
| Nepal | 27 | 0.0% |
| Netherlands | 3 | 0.0% |
| Nigeria | 158 | 0.2% |
| Northern Africa | 23 | 0.0% |
| Northern Europe | 239 | 0.3% |
| Norway | 75 | 0.1% |
| Oceania | 20 | 0.0% |
| Pakistan | 73 | 0.1% |
| Philippines | 137 | 0.2% |
| Poland | 101 | 0.1% |
| Romania | 7 | 0.0% |
| Russia | 36 | 0.1% |
| Scotland | 16 | 0.0% |
| South Africa | 16 | 0.0% |
| South America | 154 | 0.2% |
| South Central Asia | 331 | 0.4% |
| South Eastern Asia | 147 | 0.2% |
| Southern Europe | 26 | 0.0% |
| Spain | 4 | 0.0% |
| Sri Lanka | 17 | 0.0% |
| Syria | 22 | 0.0% |
| Taiwan | 29 | 0.0% |
| Thailand | 10 | 0.0% |
| Trinidad and Tobago | 51 | 0.1% |
| Turkey | 2 | 0.0% |
| Ukraine | 21 | 0.0% |
| Uzbekistan | 3 | 0.0% |
| Venezuela | 2 | 0.0% |
| Western Africa | 179 | 0.2% |
| Western Asia | 57 | 0.1% |
| Western Europe | 139 | 0.2% | View All 74 Rows |
Sex and Age in Clinton County
Sex and Age in Clinton County
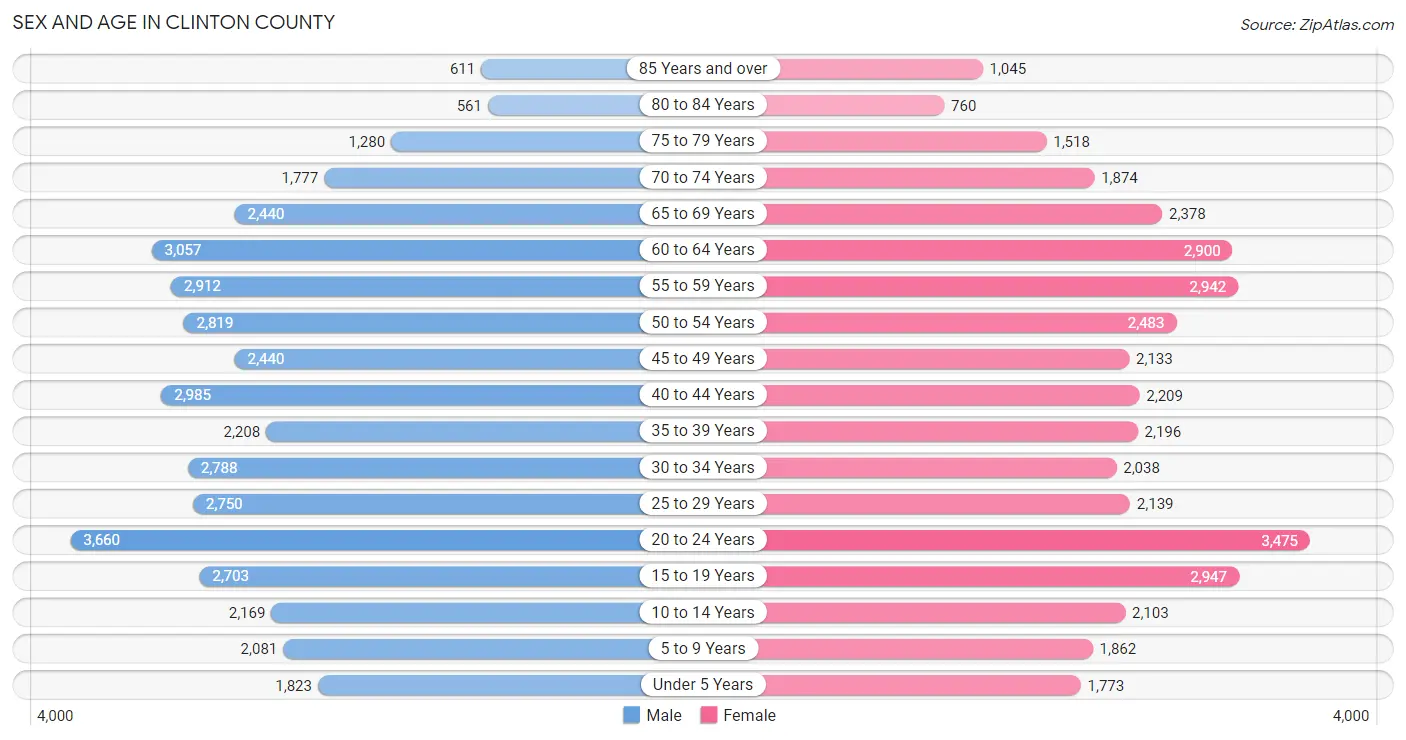
The most populous age groups in Clinton County are 20 to 24 Years (3,660 | 8.9%) for men and 20 to 24 Years (3,475 | 9.0%) for women.
| Age Bracket | Male | Female |
| Under 5 Years | 1,823 (4.4%) | 1,773 (4.6%) |
| 5 to 9 Years | 2,081 (5.1%) | 1,862 (4.8%) |
| 10 to 14 Years | 2,169 (5.3%) | 2,103 (5.4%) |
| 15 to 19 Years | 2,703 (6.6%) | 2,947 (7.6%) |
| 20 to 24 Years | 3,660 (8.9%) | 3,475 (9.0%) |
| 25 to 29 Years | 2,750 (6.7%) | 2,139 (5.5%) |
| 30 to 34 Years | 2,788 (6.8%) | 2,038 (5.3%) |
| 35 to 39 Years | 2,208 (5.4%) | 2,196 (5.7%) |
| 40 to 44 Years | 2,985 (7.3%) | 2,209 (5.7%) |
| 45 to 49 Years | 2,440 (5.9%) | 2,133 (5.5%) |
| 50 to 54 Years | 2,819 (6.9%) | 2,483 (6.4%) |
| 55 to 59 Years | 2,912 (7.1%) | 2,942 (7.6%) |
| 60 to 64 Years | 3,057 (7.4%) | 2,900 (7.5%) |
| 65 to 69 Years | 2,440 (5.9%) | 2,378 (6.1%) |
| 70 to 74 Years | 1,777 (4.3%) | 1,874 (4.8%) |
| 75 to 79 Years | 1,280 (3.1%) | 1,518 (3.9%) |
| 80 to 84 Years | 561 (1.4%) | 760 (2.0%) |
| 85 Years and over | 611 (1.5%) | 1,045 (2.7%) |
| Total | 41,064 (100.0%) | 38,775 (100.0%) |
Families and Households in Clinton County
Median Family Size in Clinton County
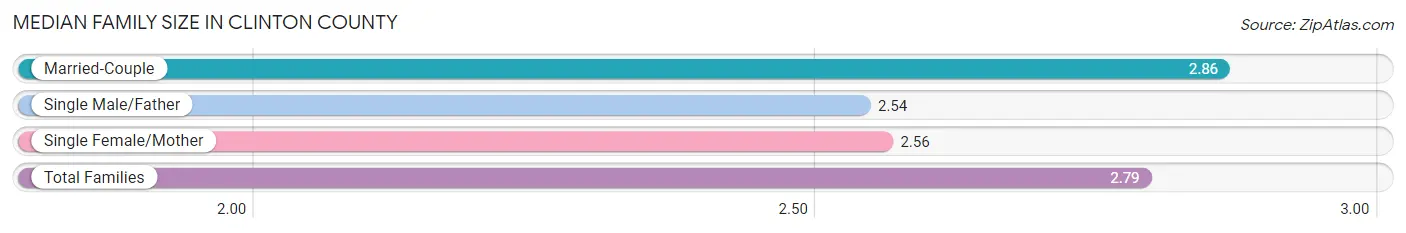
The median family size in Clinton County is 2.79 persons per family, with married-couple families (15,041 | 77.2%) accounting for the largest median family size of 2.86 persons per family. On the other hand, single male/father families (1,476 | 7.6%) represent the smallest median family size with 2.54 persons per family.
| Family Type | # Families | Family Size |
| Married-Couple | 15,041 (77.2%) | 2.86 |
| Single Male/Father | 1,476 (7.6%) | 2.54 |
| Single Female/Mother | 2,974 (15.3%) | 2.56 |
| Total Families | 19,491 (100.0%) | 2.79 |
Median Household Size in Clinton County
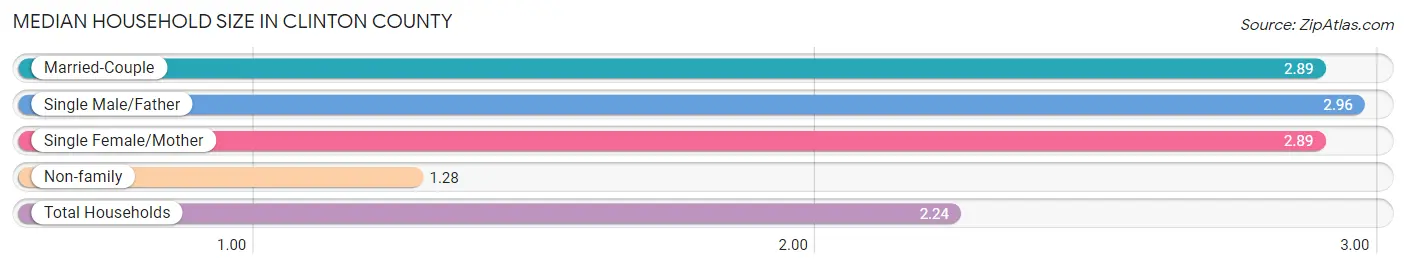
The median household size in Clinton County is 2.24 persons per household, with single male/father households (1,476 | 4.5%) accounting for the largest median household size of 2.96 persons per household. non-family households (13,160 | 40.3%) represent the smallest median household size with 1.28 persons per household.
| Household Type | # Households | Household Size |
| Married-Couple | 15,041 (46.1%) | 2.89 |
| Single Male/Father | 1,476 (4.5%) | 2.96 |
| Single Female/Mother | 2,974 (9.1%) | 2.89 |
| Non-family | 13,160 (40.3%) | 1.28 |
| Total Households | 32,651 (100.0%) | 2.24 |
Household Size by Marriage Status in Clinton County
Out of a total of 32,651 households in Clinton County, 19,491 (59.7%) are family households, while 13,160 (40.3%) are nonfamily households. The most numerous type of family households are 2-person households, comprising 9,494, and the most common type of nonfamily households are 1-person households, comprising 10,100.
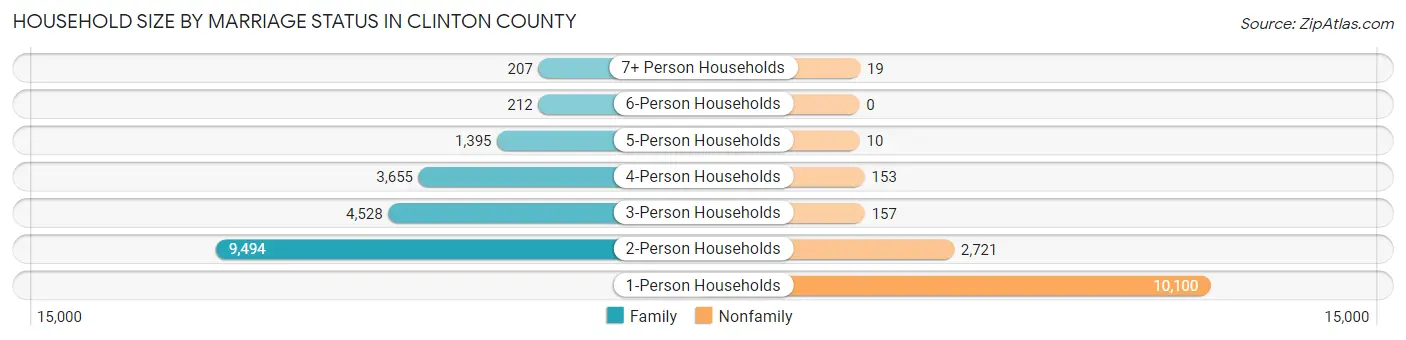
| Household Size | Family Households | Nonfamily Households |
| 1-Person Households | - | 10,100 (30.9%) |
| 2-Person Households | 9,494 (29.1%) | 2,721 (8.3%) |
| 3-Person Households | 4,528 (13.9%) | 157 (0.5%) |
| 4-Person Households | 3,655 (11.2%) | 153 (0.5%) |
| 5-Person Households | 1,395 (4.3%) | 10 (0.0%) |
| 6-Person Households | 212 (0.6%) | 0 (0.0%) |
| 7+ Person Households | 207 (0.6%) | 19 (0.1%) |
| Total | 19,491 (59.7%) | 13,160 (40.3%) |
Female Fertility in Clinton County
Fertility by Age in Clinton County
Average fertility rate in Clinton County is 50.0 births per 1,000 women. Women in the age bracket of 20 to 34 years have the highest fertility rate with 75.0 births per 1,000 women. Women in the age bracket of 20 to 34 years acount for 64.6% of all women with births.
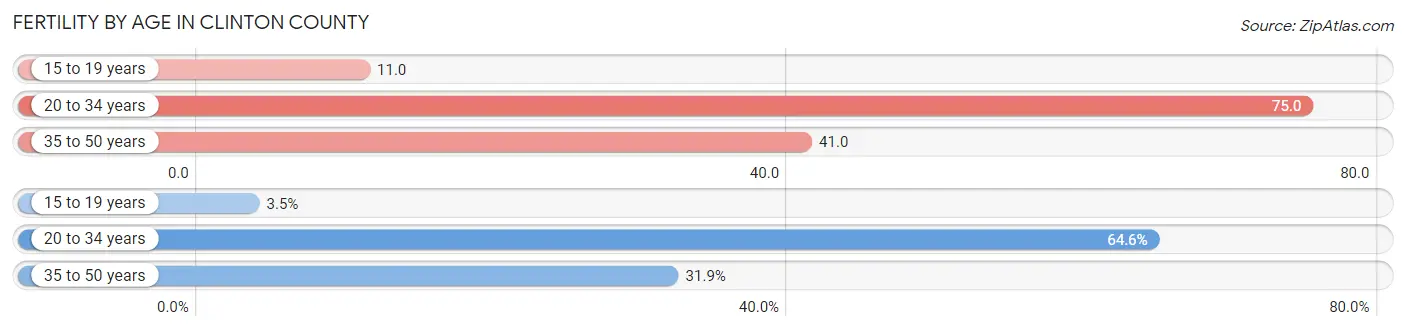
| Age Bracket | Women with Births | Births / 1,000 Women |
| 15 to 19 years | 31 (3.5%) | 11.0 |
| 20 to 34 years | 572 (64.6%) | 75.0 |
| 35 to 50 years | 283 (31.9%) | 41.0 |
| Total | 886 (100.0%) | 50.0 |
Fertility by Age by Marriage Status in Clinton County
62.0% of women with births (886) in Clinton County are married. The highest percentage of unmarried women with births falls into 15 to 19 years age bracket with 77.4% of them unmarried at the time of birth, while the lowest percentage of unmarried women with births belong to 35 to 50 years age bracket with 28.3% of them unmarried.
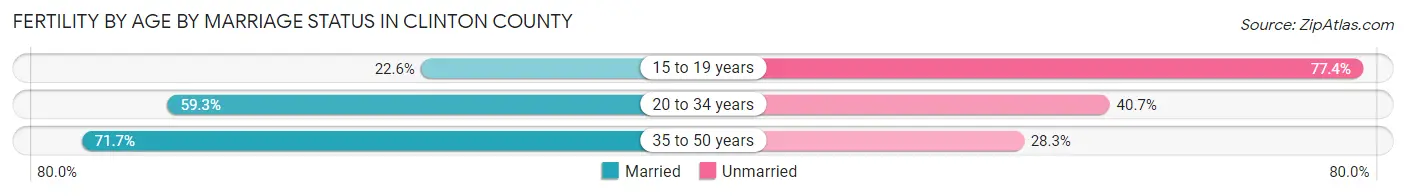
| Age Bracket | Married | Unmarried |
| 15 to 19 years | 7 (22.6%) | 24 (77.4%) |
| 20 to 34 years | 339 (59.3%) | 233 (40.7%) |
| 35 to 50 years | 203 (71.7%) | 80 (28.3%) |
| Total | 549 (62.0%) | 337 (38.0%) |
Fertility by Education in Clinton County
Average fertility rate in Clinton County is 50.0 births per 1,000 women. Women with the education attainment of graduate degree have the highest fertility rate of 78.0 births per 1,000 women, while women with the education attainment of less than high school have the lowest fertility at 15.0 births per 1,000 women. Women with the education attainment of college or associate's degree represent 33.2% of all women with births.
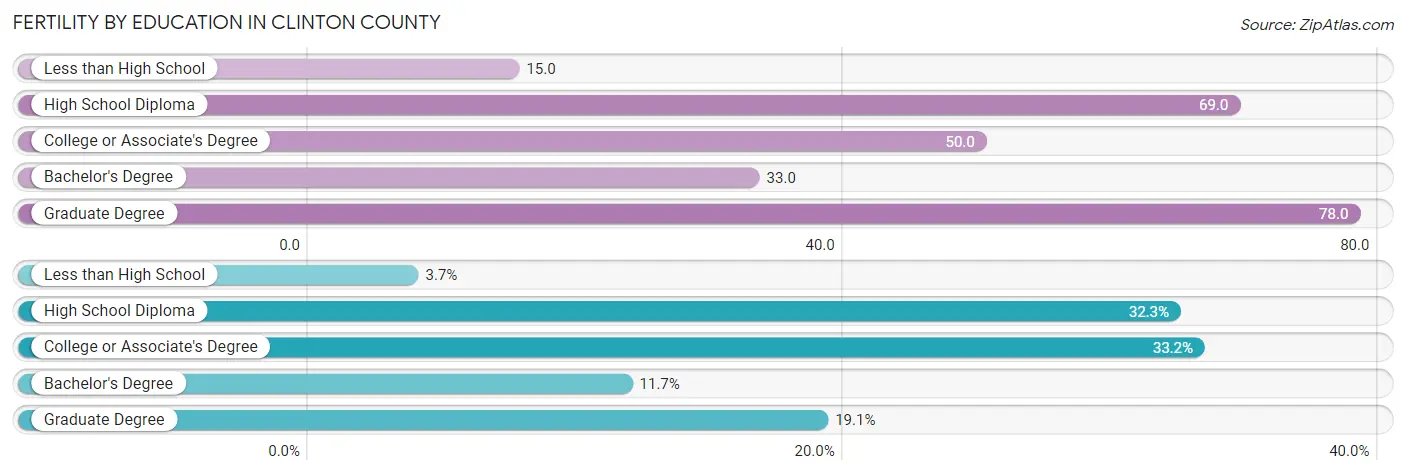
| Educational Attainment | Women with Births | Births / 1,000 Women |
| Less than High School | 33 (3.7%) | 15.0 |
| High School Diploma | 286 (32.3%) | 69.0 |
| College or Associate's Degree | 294 (33.2%) | 50.0 |
| Bachelor's Degree | 104 (11.7%) | 33.0 |
| Graduate Degree | 169 (19.1%) | 78.0 |
| Total | 886 (100.0%) | 50.0 |
Fertility by Education by Marriage Status in Clinton County
38.0% of women with births in Clinton County are unmarried. Women with the educational attainment of bachelor's degree are most likely to be married with 100.0% of them married at childbirth, while women with the educational attainment of less than high school are least likely to be married with 72.7% of them unmarried at childbirth.
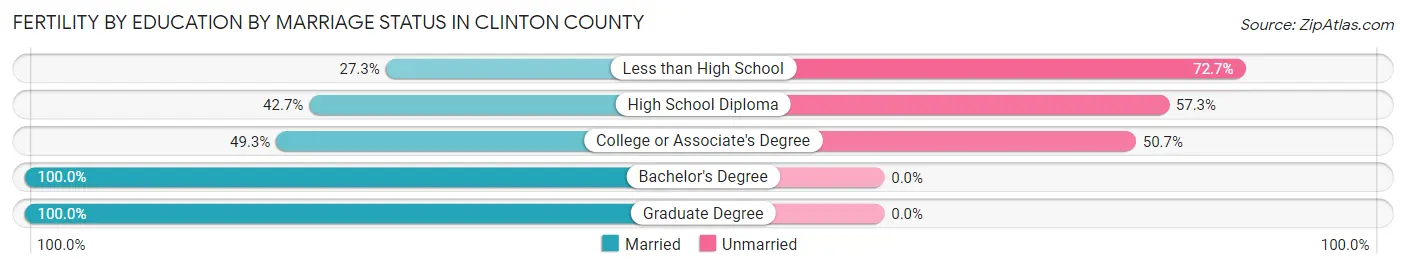
| Educational Attainment | Married | Unmarried |
| Less than High School | 9 (27.3%) | 24 (72.7%) |
| High School Diploma | 122 (42.7%) | 164 (57.3%) |
| College or Associate's Degree | 145 (49.3%) | 149 (50.7%) |
| Bachelor's Degree | 104 (100.0%) | 0 (0.0%) |
| Graduate Degree | 169 (100.0%) | 0 (0.0%) |
| Total | 549 (62.0%) | 337 (38.0%) |
Employment Characteristics in Clinton County
Employment by Class of Employer in Clinton County
Among the 35,098 employed individuals in Clinton County, private company employees (20,552 | 58.6%), state government employees (3,871 | 11.0%), and not-for-profit organizations (3,669 | 10.4%) make up the most common classes of employment.
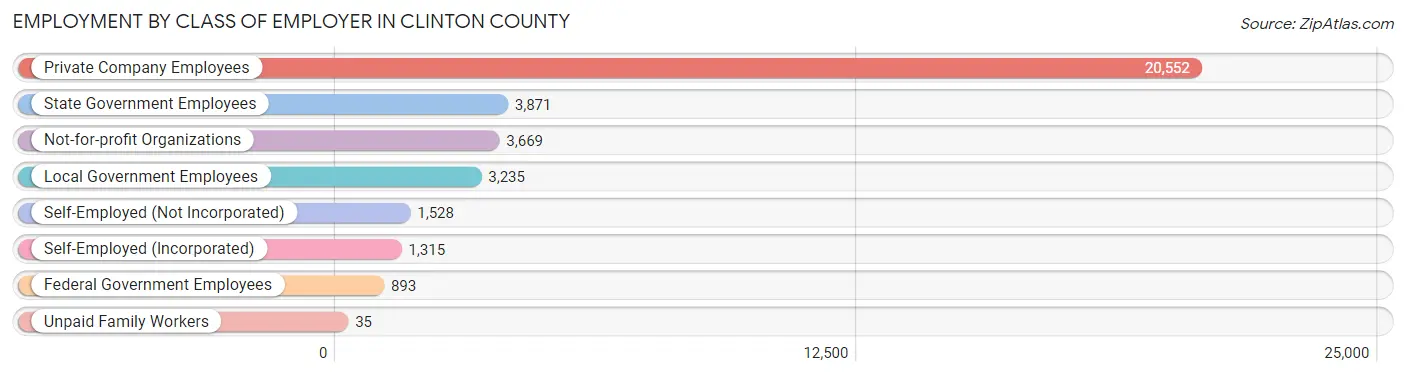
| Employer Class | # Employees | % Employees |
| Private Company Employees | 20,552 | 58.6% |
| Self-Employed (Incorporated) | 1,315 | 3.7% |
| Self-Employed (Not Incorporated) | 1,528 | 4.3% |
| Not-for-profit Organizations | 3,669 | 10.4% |
| Local Government Employees | 3,235 | 9.2% |
| State Government Employees | 3,871 | 11.0% |
| Federal Government Employees | 893 | 2.5% |
| Unpaid Family Workers | 35 | 0.1% |
| Total | 35,098 | 100.0% |
Employment Status by Age in Clinton County
According to the labor force statistics for Clinton County, out of the total population over 16 years of age (67,113), 56.4% or 37,852 individuals are in the labor force, with 4.7% or 1,779 of them unemployed. The age group with the highest labor force participation rate is 25 to 29 years, with 78.6% or 3,843 individuals in the labor force. Within the labor force, the 16 to 19 years age range has the highest percentage of unemployed individuals, with 18.3% or 337 of them being unemployed.
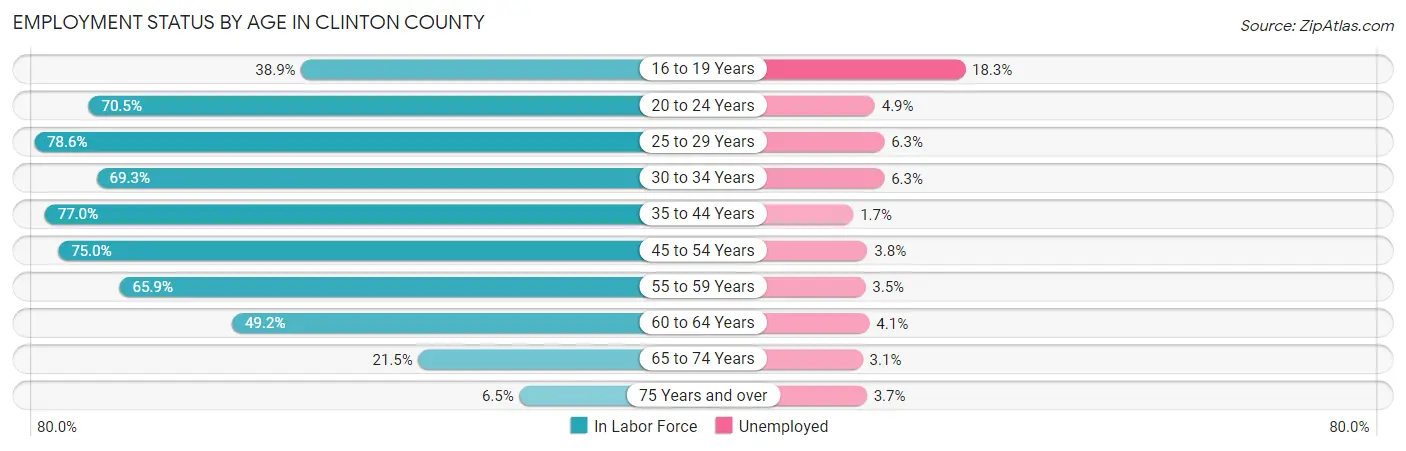
| Age Bracket | In Labor Force | Unemployed |
| 16 to 19 Years | 1,842 (38.9%) | 337 (18.3%) |
| 20 to 24 Years | 5,030 (70.5%) | 246 (4.9%) |
| 25 to 29 Years | 3,843 (78.6%) | 242 (6.3%) |
| 30 to 34 Years | 3,344 (69.3%) | 211 (6.3%) |
| 35 to 44 Years | 7,390 (77.0%) | 126 (1.7%) |
| 45 to 54 Years | 7,406 (75.0%) | 281 (3.8%) |
| 55 to 59 Years | 3,858 (65.9%) | 135 (3.5%) |
| 60 to 64 Years | 2,931 (49.2%) | 120 (4.1%) |
| 65 to 74 Years | 1,821 (21.5%) | 56 (3.1%) |
| 75 Years and over | 375 (6.5%) | 14 (3.7%) |
| Total | 37,852 (56.4%) | 1,779 (4.7%) |
Employment Status by Educational Attainment in Clinton County
According to labor force statistics for Clinton County, 70.2% of individuals (28,781) out of the total population between 25 and 64 years of age (40,999) are in the labor force, with 3.9% or 1,122 of them being unemployed. The group with the highest labor force participation rate are those with the educational attainment of bachelor's degree or higher, with 89.0% or 9,899 individuals in the labor force. Within the labor force, individuals with less than high school education have the highest percentage of unemployment, with 9.3% or 129 of them being unemployed.
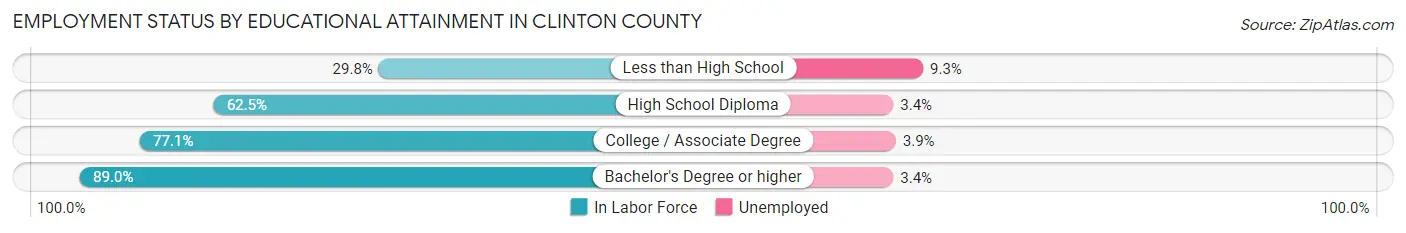
| Educational Attainment | In Labor Force | Unemployed |
| Less than High School | 1,382 (29.8%) | 431 (9.3%) |
| High School Diploma | 8,469 (62.5%) | 461 (3.4%) |
| College / Associate Degree | 9,013 (77.1%) | 456 (3.9%) |
| Bachelor's Degree or higher | 9,899 (89.0%) | 378 (3.4%) |
| Total | 28,781 (70.2%) | 1,599 (3.9%) |
Employment Occupations by Sex in Clinton County
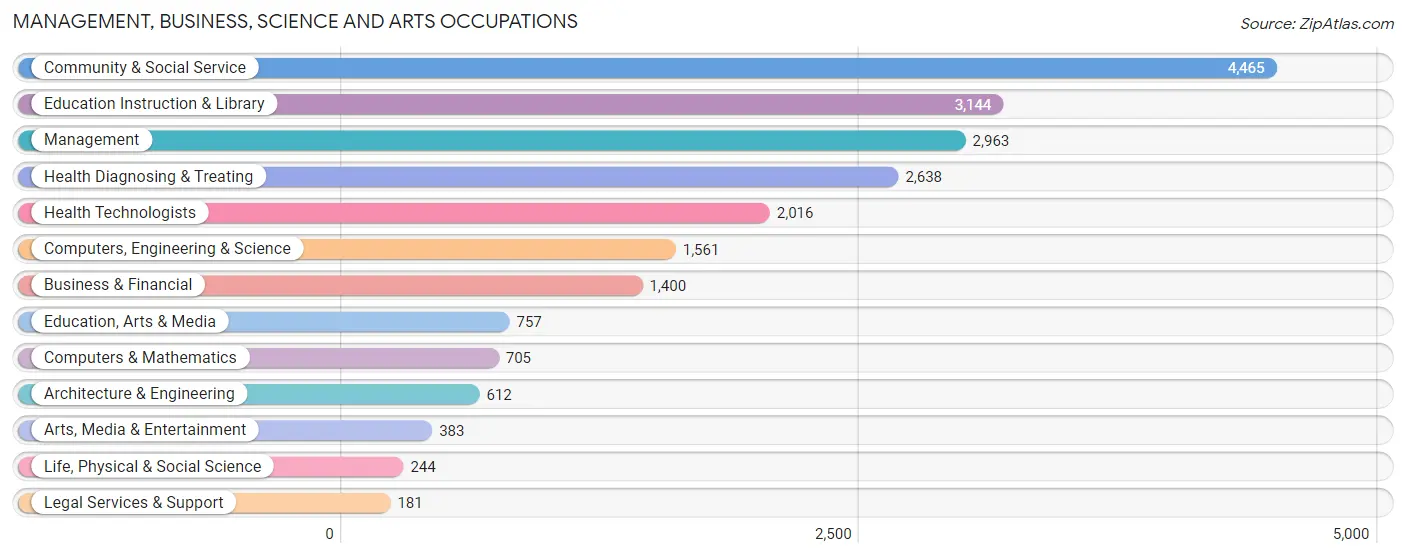
Management, Business, Science and Arts Occupations
The most common Management, Business, Science and Arts occupations in Clinton County are Community & Social Service (4,465 | 12.4%), Education Instruction & Library (3,144 | 8.7%), Management (2,963 | 8.3%), Health Diagnosing & Treating (2,638 | 7.3%), and Health Technologists (2,016 | 5.6%).
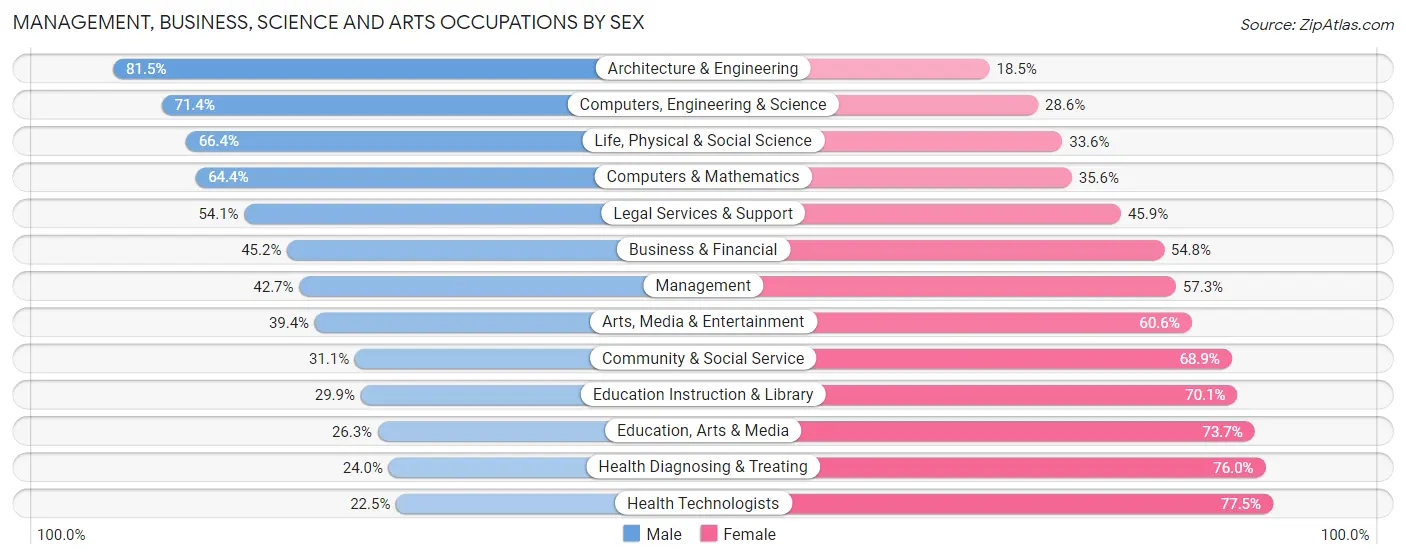
Management, Business, Science and Arts Occupations by Sex
Within the Management, Business, Science and Arts occupations in Clinton County, the most male-oriented occupations are Architecture & Engineering (81.5%), Computers, Engineering & Science (71.4%), and Life, Physical & Social Science (66.4%), while the most female-oriented occupations are Health Technologists (77.5%), Health Diagnosing & Treating (76.0%), and Education, Arts & Media (73.7%).
| Occupation | Male | Female |
| Management | 1,265 (42.7%) | 1,698 (57.3%) |
| Business & Financial | 633 (45.2%) | 767 (54.8%) |
| Computers, Engineering & Science | 1,115 (71.4%) | 446 (28.6%) |
| Computers & Mathematics | 454 (64.4%) | 251 (35.6%) |
| Architecture & Engineering | 499 (81.5%) | 113 (18.5%) |
| Life, Physical & Social Science | 162 (66.4%) | 82 (33.6%) |
| Community & Social Service | 1,387 (31.1%) | 3,078 (68.9%) |
| Education, Arts & Media | 199 (26.3%) | 558 (73.7%) |
| Legal Services & Support | 98 (54.1%) | 83 (45.9%) |
| Education Instruction & Library | 939 (29.9%) | 2,205 (70.1%) |
| Arts, Media & Entertainment | 151 (39.4%) | 232 (60.6%) |
| Health Diagnosing & Treating | 634 (24.0%) | 2,004 (76.0%) |
| Health Technologists | 453 (22.5%) | 1,563 (77.5%) |
| Total (Category) | 5,034 (38.6%) | 7,993 (61.4%) |
| Total (Overall) | 19,073 (53.1%) | 16,859 (46.9%) |
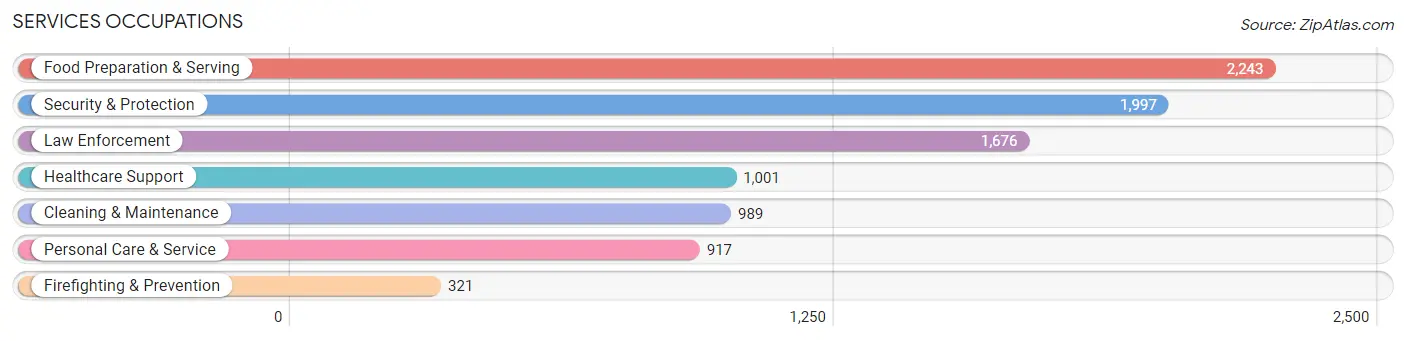
Services Occupations
The most common Services occupations in Clinton County are Food Preparation & Serving (2,243 | 6.2%), Security & Protection (1,997 | 5.6%), Law Enforcement (1,676 | 4.7%), Healthcare Support (1,001 | 2.8%), and Cleaning & Maintenance (989 | 2.8%).
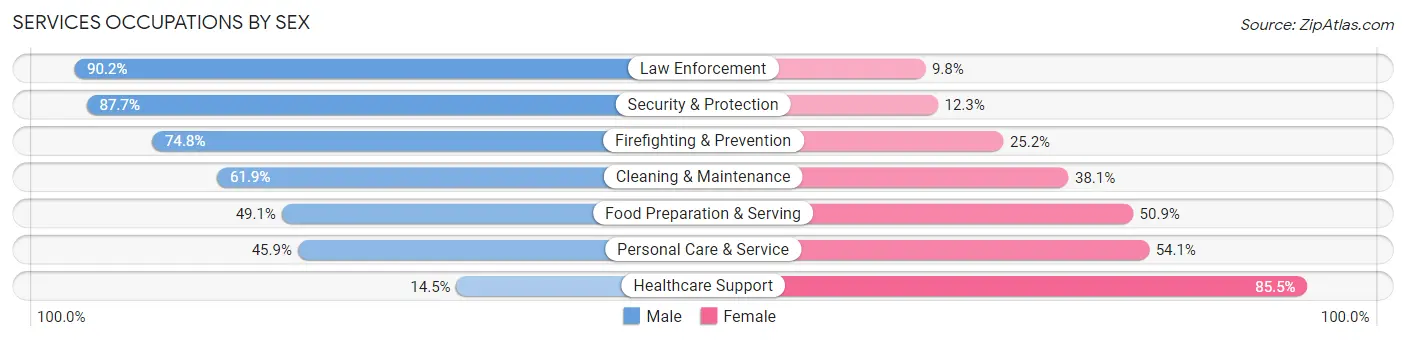
Services Occupations by Sex
Within the Services occupations in Clinton County, the most male-oriented occupations are Law Enforcement (90.2%), Security & Protection (87.7%), and Firefighting & Prevention (74.8%), while the most female-oriented occupations are Healthcare Support (85.5%), Personal Care & Service (54.1%), and Food Preparation & Serving (50.9%).
| Occupation | Male | Female |
| Healthcare Support | 145 (14.5%) | 856 (85.5%) |
| Security & Protection | 1,752 (87.7%) | 245 (12.3%) |
| Firefighting & Prevention | 240 (74.8%) | 81 (25.2%) |
| Law Enforcement | 1,512 (90.2%) | 164 (9.8%) |
| Food Preparation & Serving | 1,101 (49.1%) | 1,142 (50.9%) |
| Cleaning & Maintenance | 612 (61.9%) | 377 (38.1%) |
| Personal Care & Service | 421 (45.9%) | 496 (54.1%) |
| Total (Category) | 4,031 (56.4%) | 3,116 (43.6%) |
| Total (Overall) | 19,073 (53.1%) | 16,859 (46.9%) |
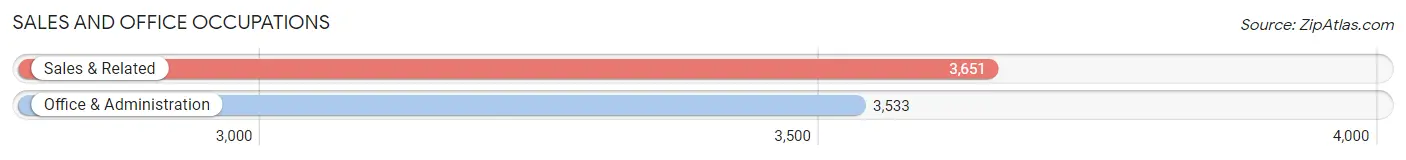
Sales and Office Occupations
The most common Sales and Office occupations in Clinton County are Sales & Related (3,651 | 10.2%), and Office & Administration (3,533 | 9.8%).
Sales and Office Occupations by Sex
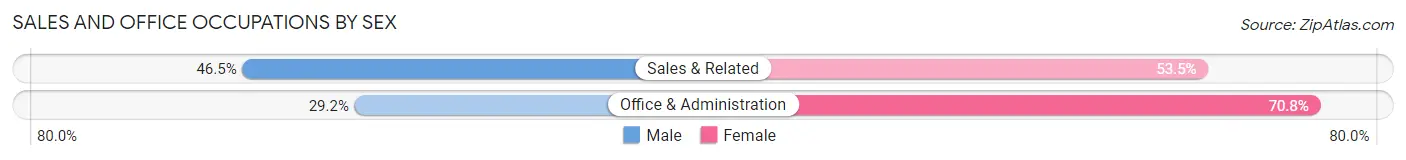
| Occupation | Male | Female |
| Sales & Related | 1,697 (46.5%) | 1,954 (53.5%) |
| Office & Administration | 1,032 (29.2%) | 2,501 (70.8%) |
| Total (Category) | 2,729 (38.0%) | 4,455 (62.0%) |
| Total (Overall) | 19,073 (53.1%) | 16,859 (46.9%) |
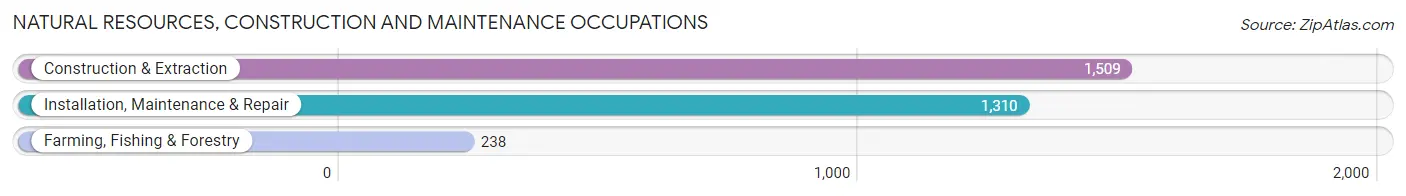
Natural Resources, Construction and Maintenance Occupations
The most common Natural Resources, Construction and Maintenance occupations in Clinton County are Construction & Extraction (1,509 | 4.2%), Installation, Maintenance & Repair (1,310 | 3.6%), and Farming, Fishing & Forestry (238 | 0.7%).
Natural Resources, Construction and Maintenance Occupations by Sex
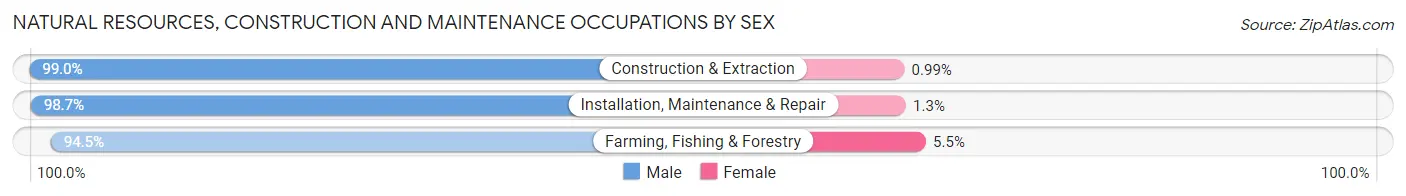
| Occupation | Male | Female |
| Farming, Fishing & Forestry | 225 (94.5%) | 13 (5.5%) |
| Construction & Extraction | 1,494 (99.0%) | 15 (1.0%) |
| Installation, Maintenance & Repair | 1,293 (98.7%) | 17 (1.3%) |
| Total (Category) | 3,012 (98.5%) | 45 (1.5%) |
| Total (Overall) | 19,073 (53.1%) | 16,859 (46.9%) |
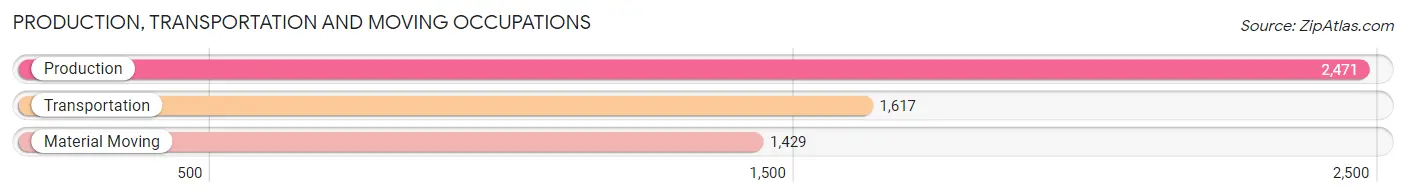
Production, Transportation and Moving Occupations
The most common Production, Transportation and Moving occupations in Clinton County are Production (2,471 | 6.9%), Transportation (1,617 | 4.5%), and Material Moving (1,429 | 4.0%).
Production, Transportation and Moving Occupations by Sex
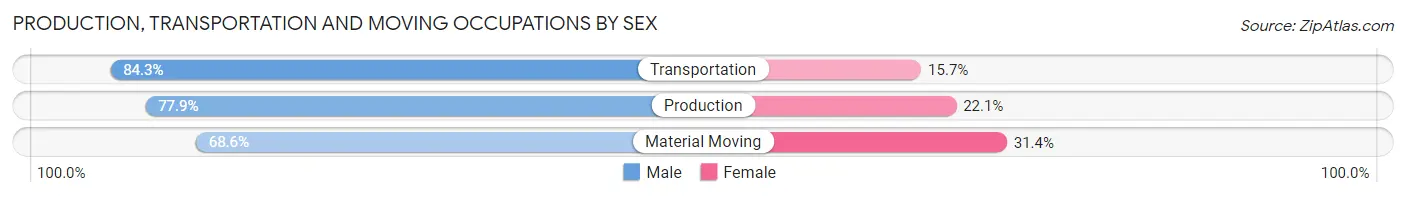
| Occupation | Male | Female |
| Production | 1,924 (77.9%) | 547 (22.1%) |
| Transportation | 1,363 (84.3%) | 254 (15.7%) |
| Material Moving | 980 (68.6%) | 449 (31.4%) |
| Total (Category) | 4,267 (77.3%) | 1,250 (22.7%) |
| Total (Overall) | 19,073 (53.1%) | 16,859 (46.9%) |
Employment Industries by Sex in Clinton County
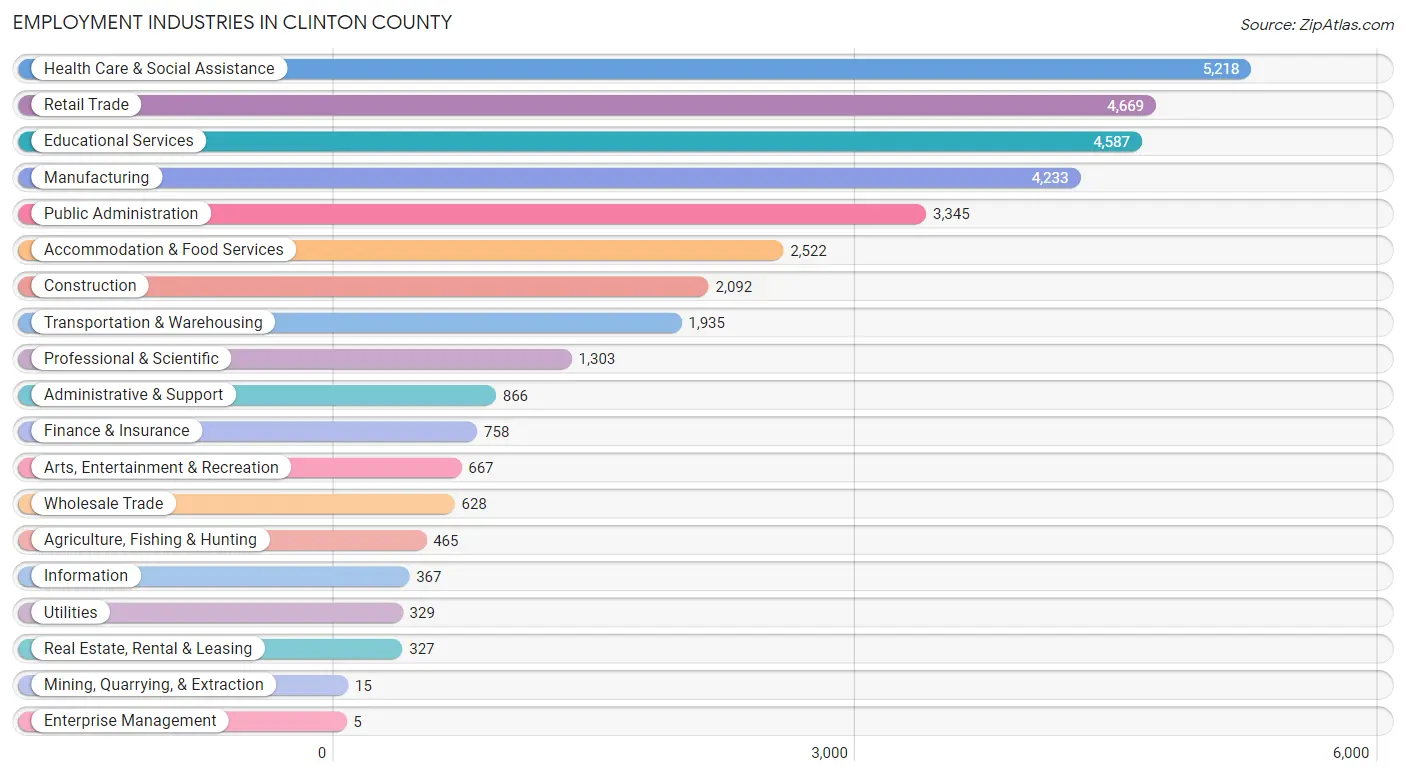
Employment Industries in Clinton County
The major employment industries in Clinton County include Health Care & Social Assistance (5,218 | 14.5%), Retail Trade (4,669 | 13.0%), Educational Services (4,587 | 12.8%), Manufacturing (4,233 | 11.8%), and Public Administration (3,345 | 9.3%).
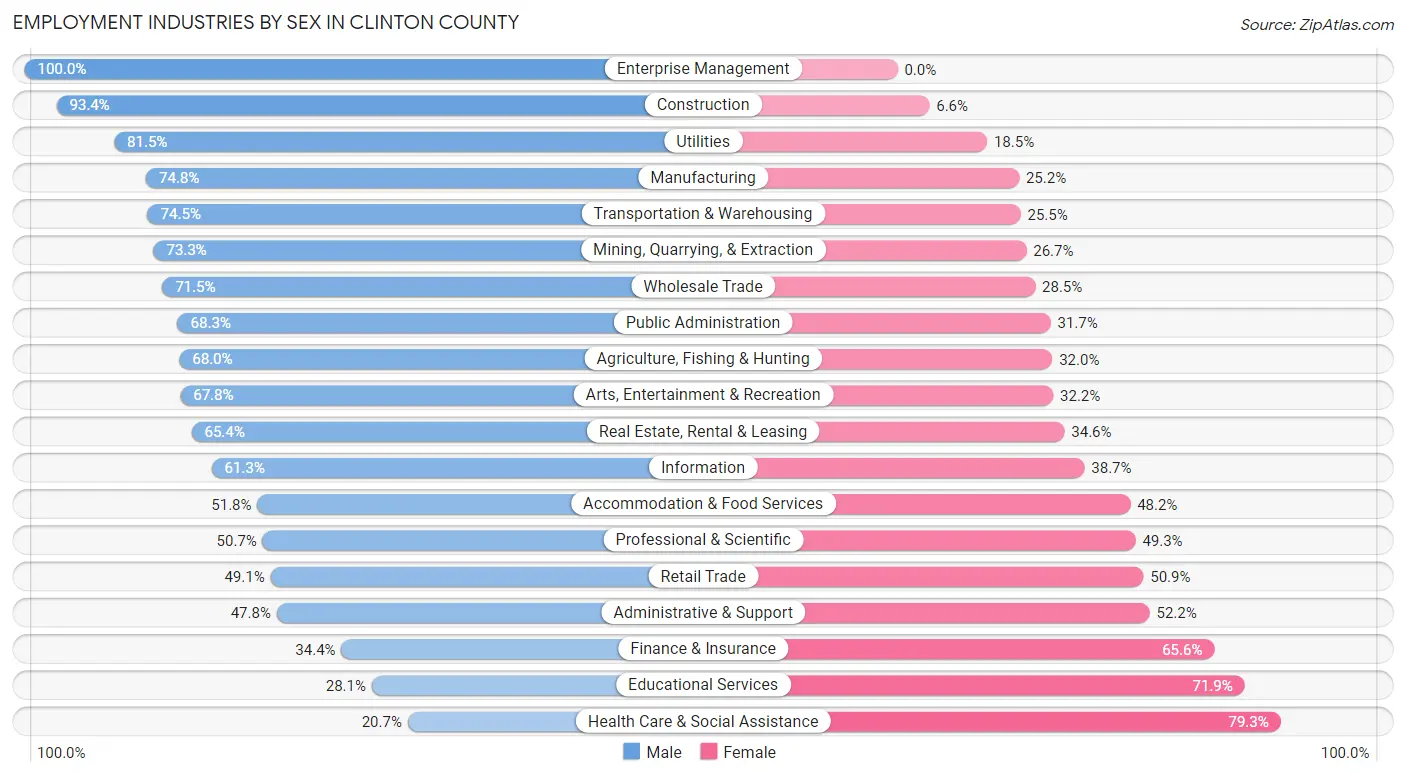
Employment Industries by Sex in Clinton County
The Clinton County industries that see more men than women are Enterprise Management (100.0%), Construction (93.4%), and Utilities (81.5%), whereas the industries that tend to have a higher number of women are Health Care & Social Assistance (79.3%), Educational Services (71.9%), and Finance & Insurance (65.6%).
| Industry | Male | Female |
| Agriculture, Fishing & Hunting | 316 (68.0%) | 149 (32.0%) |
| Mining, Quarrying, & Extraction | 11 (73.3%) | 4 (26.7%) |
| Construction | 1,954 (93.4%) | 138 (6.6%) |
| Manufacturing | 3,168 (74.8%) | 1,065 (25.2%) |
| Wholesale Trade | 449 (71.5%) | 179 (28.5%) |
| Retail Trade | 2,293 (49.1%) | 2,376 (50.9%) |
| Transportation & Warehousing | 1,442 (74.5%) | 493 (25.5%) |
| Utilities | 268 (81.5%) | 61 (18.5%) |
| Information | 225 (61.3%) | 142 (38.7%) |
| Finance & Insurance | 261 (34.4%) | 497 (65.6%) |
| Real Estate, Rental & Leasing | 214 (65.4%) | 113 (34.6%) |
| Professional & Scientific | 661 (50.7%) | 642 (49.3%) |
| Enterprise Management | 5 (100.0%) | 0 (0.0%) |
| Administrative & Support | 414 (47.8%) | 452 (52.2%) |
| Educational Services | 1,291 (28.1%) | 3,296 (71.9%) |
| Health Care & Social Assistance | 1,080 (20.7%) | 4,138 (79.3%) |
| Arts, Entertainment & Recreation | 452 (67.8%) | 215 (32.2%) |
| Accommodation & Food Services | 1,307 (51.8%) | 1,215 (48.2%) |
| Public Administration | 2,285 (68.3%) | 1,060 (31.7%) |
| Total | 19,073 (53.1%) | 16,859 (46.9%) |
Education in Clinton County
School Enrollment in Clinton County
The most common levels of schooling among the 18,079 students in Clinton County are college / undergraduate (5,795 | 32.1%), high school (3,719 | 20.6%), and middle school (3,378 | 18.7%).
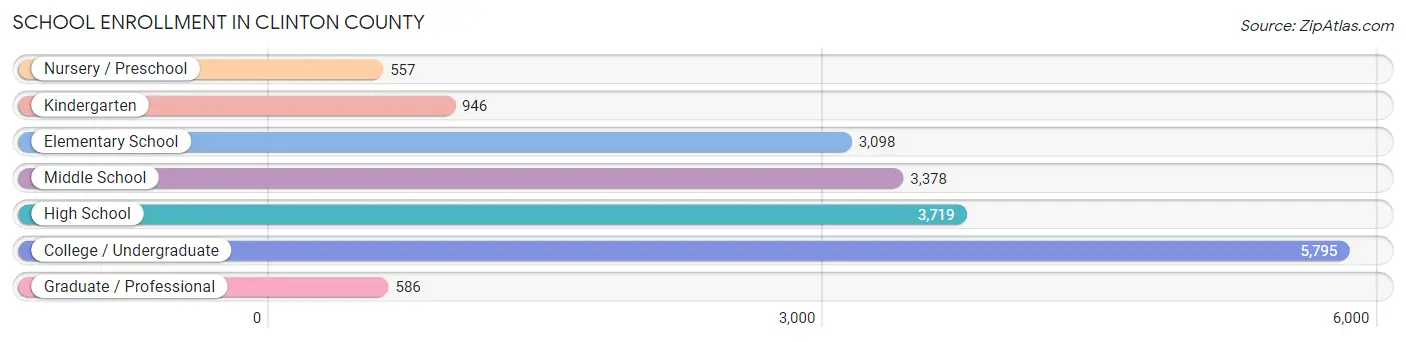
| School Level | # Students | % Students |
| Nursery / Preschool | 557 | 3.1% |
| Kindergarten | 946 | 5.2% |
| Elementary School | 3,098 | 17.1% |
| Middle School | 3,378 | 18.7% |
| High School | 3,719 | 20.6% |
| College / Undergraduate | 5,795 | 32.1% |
| Graduate / Professional | 586 | 3.2% |
| Total | 18,079 | 100.0% |
School Enrollment by Age by Funding Source in Clinton County
Out of a total of 18,079 students who are enrolled in schools in Clinton County, 1,663 (9.2%) attend a private institution, while the remaining 16,416 (90.8%) are enrolled in public schools. The age group of 25 to 34 year olds has the highest likelihood of being enrolled in private schools, with 142 (22.9% in the age bracket) enrolled. Conversely, the age group of 5 to 9 year old has the lowest likelihood of being enrolled in a private school, with 3,609 (93.9% in the age bracket) attending a public institution.
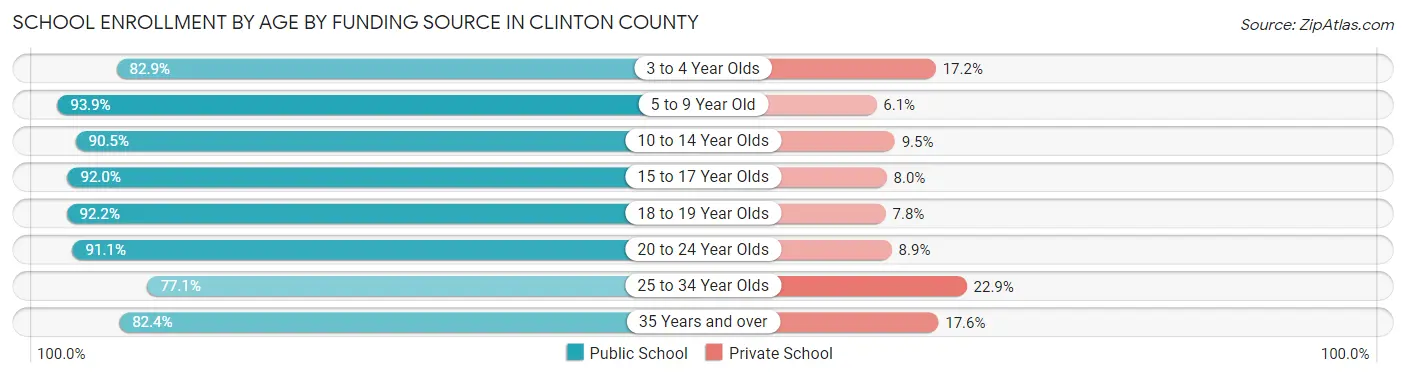
| Age Bracket | Public School | Private School |
| 3 to 4 Year Olds | 372 (82.9%) | 77 (17.2%) |
| 5 to 9 Year Old | 3,609 (93.9%) | 234 (6.1%) |
| 10 to 14 Year Olds | 3,806 (90.5%) | 400 (9.5%) |
| 15 to 17 Year Olds | 2,300 (92.0%) | 200 (8.0%) |
| 18 to 19 Year Olds | 2,467 (92.2%) | 209 (7.8%) |
| 20 to 24 Year Olds | 2,739 (91.1%) | 269 (8.9%) |
| 25 to 34 Year Olds | 478 (77.1%) | 142 (22.9%) |
| 35 Years and over | 640 (82.4%) | 137 (17.6%) |
| Total | 16,416 (90.8%) | 1,663 (9.2%) |
Educational Attainment by Field of Study in Clinton County
Education (3,296 | 19.9%), business (2,378 | 14.3%), science & technology (1,935 | 11.7%), social sciences (1,185 | 7.1%), and bio, nature & agricultural (1,170 | 7.1%) are the most common fields of study among 16,576 individuals in Clinton County who have obtained a bachelor's degree or higher.
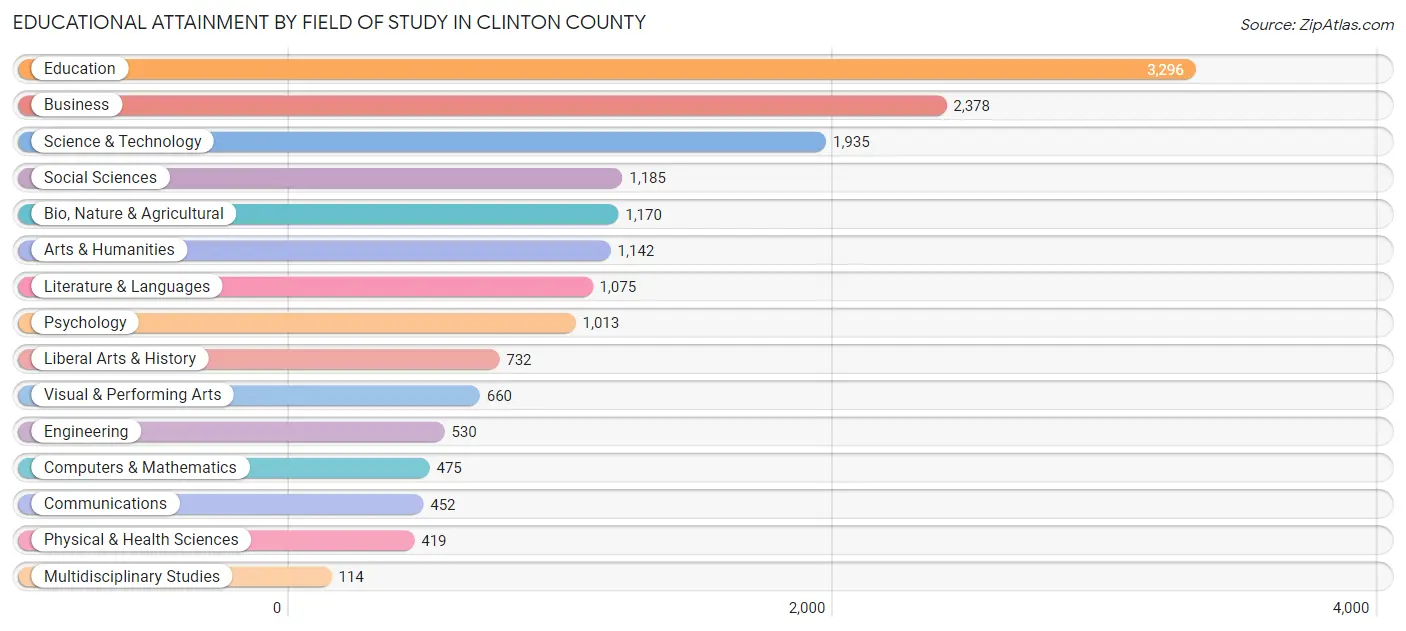
| Field of Study | # Graduates | % Graduates |
| Computers & Mathematics | 475 | 2.9% |
| Bio, Nature & Agricultural | 1,170 | 7.1% |
| Physical & Health Sciences | 419 | 2.5% |
| Psychology | 1,013 | 6.1% |
| Social Sciences | 1,185 | 7.1% |
| Engineering | 530 | 3.2% |
| Multidisciplinary Studies | 114 | 0.7% |
| Science & Technology | 1,935 | 11.7% |
| Business | 2,378 | 14.3% |
| Education | 3,296 | 19.9% |
| Literature & Languages | 1,075 | 6.5% |
| Liberal Arts & History | 732 | 4.4% |
| Visual & Performing Arts | 660 | 4.0% |
| Communications | 452 | 2.7% |
| Arts & Humanities | 1,142 | 6.9% |
| Total | 16,576 | 100.0% |
Transportation & Commute in Clinton County
Vehicle Availability by Sex in Clinton County
The most prevalent vehicle ownership categories in Clinton County are males with 2 vehicles (8,752, accounting for 47.8%) and females with 2 vehicles (7,422, making up 55.0%).
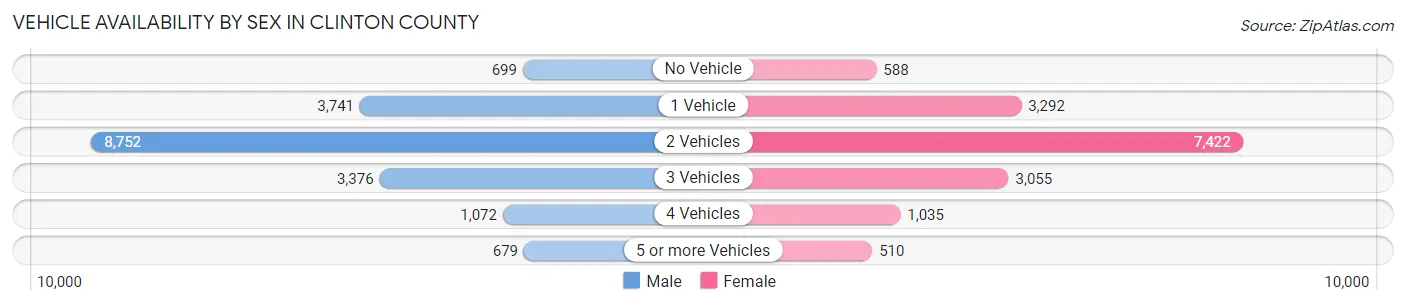
| Vehicles Available | Male | Female |
| No Vehicle | 699 (3.8%) | 588 (3.7%) |
| 1 Vehicle | 3,741 (20.4%) | 3,292 (20.7%) |
| 2 Vehicles | 8,752 (47.8%) | 7,422 (46.7%) |
| 3 Vehicles | 3,376 (18.4%) | 3,055 (19.2%) |
| 4 Vehicles | 1,072 (5.9%) | 1,035 (6.5%) |
| 5 or more Vehicles | 679 (3.7%) | 510 (3.2%) |
| Total | 18,319 (100.0%) | 15,902 (100.0%) |
Commute Time in Clinton County
The most frequently occuring commute durations in Clinton County are 10 to 14 minutes (6,397 commuters, 19.5%), 15 to 19 minutes (5,795 commuters, 17.6%), and 5 to 9 minutes (5,508 commuters, 16.8%).
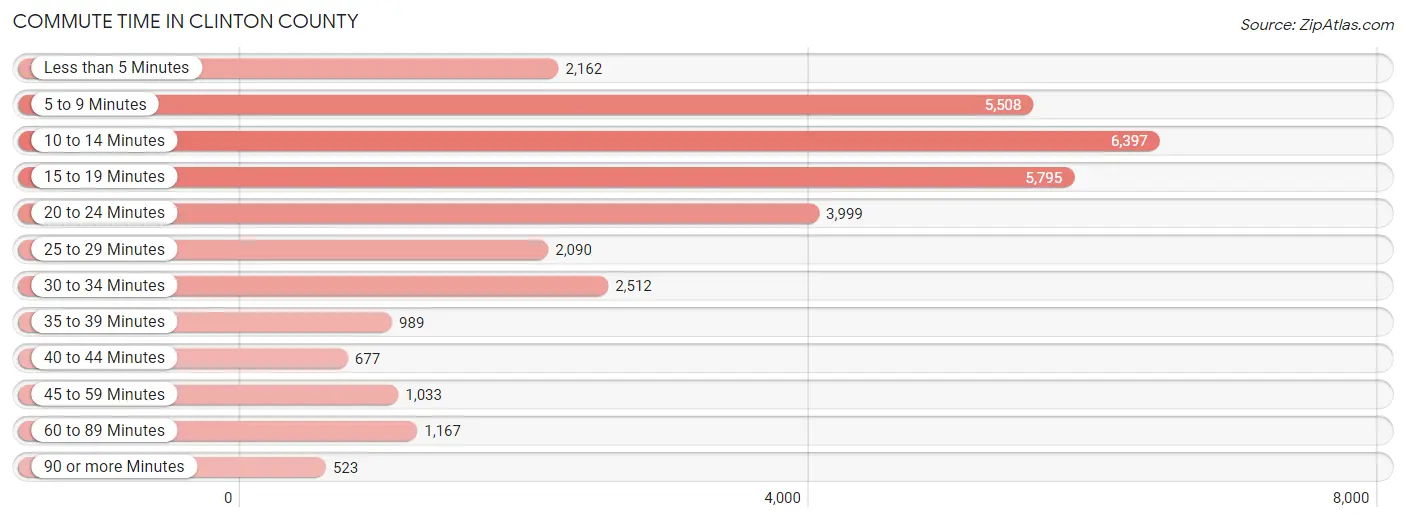
| Commute Time | # Commuters | % Commuters |
| Less than 5 Minutes | 2,162 | 6.6% |
| 5 to 9 Minutes | 5,508 | 16.8% |
| 10 to 14 Minutes | 6,397 | 19.5% |
| 15 to 19 Minutes | 5,795 | 17.6% |
| 20 to 24 Minutes | 3,999 | 12.2% |
| 25 to 29 Minutes | 2,090 | 6.4% |
| 30 to 34 Minutes | 2,512 | 7.6% |
| 35 to 39 Minutes | 989 | 3.0% |
| 40 to 44 Minutes | 677 | 2.1% |
| 45 to 59 Minutes | 1,033 | 3.1% |
| 60 to 89 Minutes | 1,167 | 3.5% |
| 90 or more Minutes | 523 | 1.6% |
Commute Time by Sex in Clinton County
The most common commute times in Clinton County are 10 to 14 minutes (3,707 commuters, 20.8%) for males and 10 to 14 minutes (2,690 commuters, 17.9%) for females.
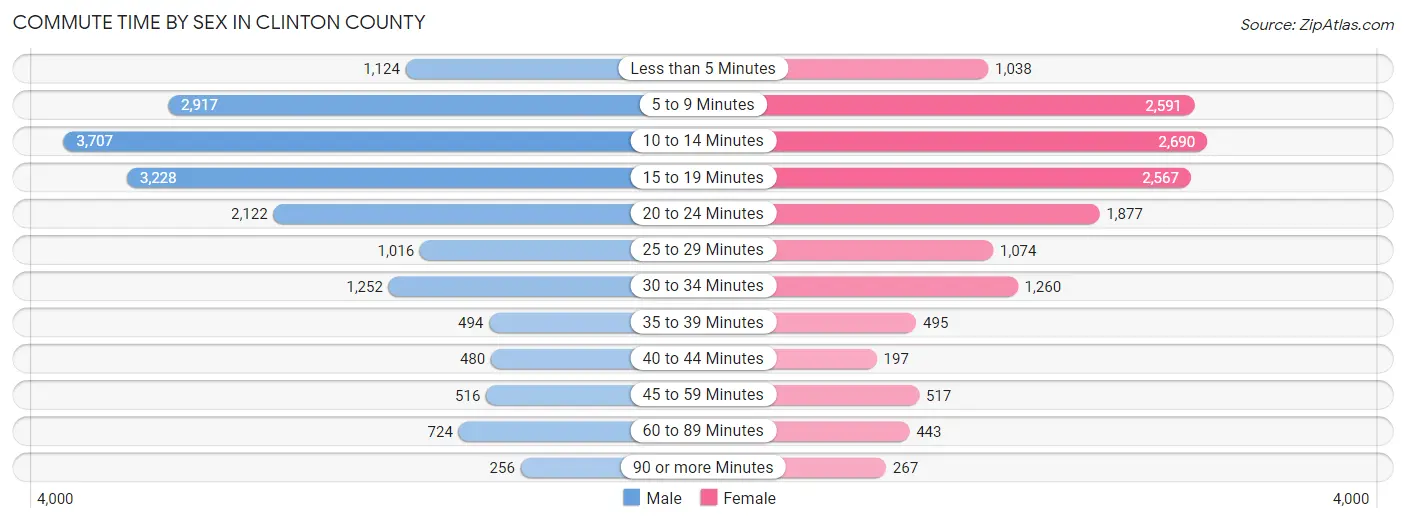
| Commute Time | Male | Female |
| Less than 5 Minutes | 1,124 (6.3%) | 1,038 (6.9%) |
| 5 to 9 Minutes | 2,917 (16.4%) | 2,591 (17.2%) |
| 10 to 14 Minutes | 3,707 (20.8%) | 2,690 (17.9%) |
| 15 to 19 Minutes | 3,228 (18.1%) | 2,567 (17.1%) |
| 20 to 24 Minutes | 2,122 (11.9%) | 1,877 (12.5%) |
| 25 to 29 Minutes | 1,016 (5.7%) | 1,074 (7.1%) |
| 30 to 34 Minutes | 1,252 (7.0%) | 1,260 (8.4%) |
| 35 to 39 Minutes | 494 (2.8%) | 495 (3.3%) |
| 40 to 44 Minutes | 480 (2.7%) | 197 (1.3%) |
| 45 to 59 Minutes | 516 (2.9%) | 517 (3.4%) |
| 60 to 89 Minutes | 724 (4.1%) | 443 (2.9%) |
| 90 or more Minutes | 256 (1.4%) | 267 (1.8%) |
Time of Departure to Work by Sex in Clinton County
The most frequent times of departure to work in Clinton County are 6:00 AM to 6:29 AM (2,434, 13.7%) for males and 7:30 AM to 7:59 AM (2,767, 18.4%) for females.
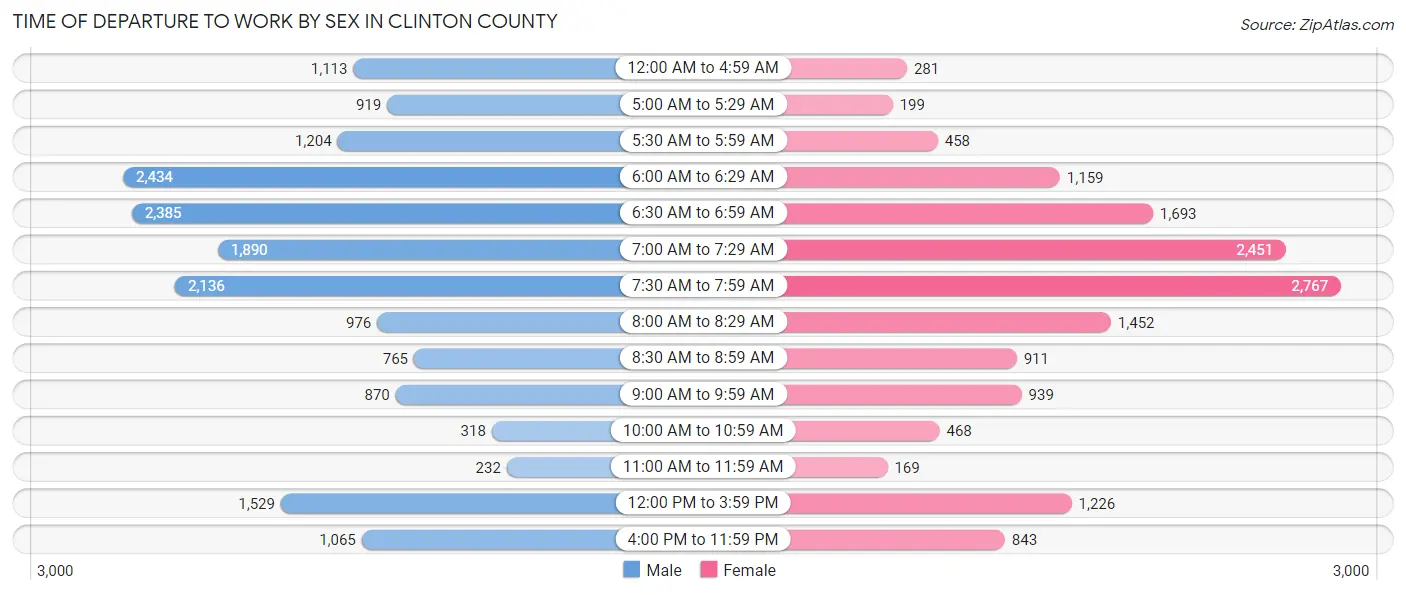
| Time of Departure | Male | Female |
| 12:00 AM to 4:59 AM | 1,113 (6.2%) | 281 (1.9%) |
| 5:00 AM to 5:29 AM | 919 (5.1%) | 199 (1.3%) |
| 5:30 AM to 5:59 AM | 1,204 (6.8%) | 458 (3.0%) |
| 6:00 AM to 6:29 AM | 2,434 (13.7%) | 1,159 (7.7%) |
| 6:30 AM to 6:59 AM | 2,385 (13.4%) | 1,693 (11.3%) |
| 7:00 AM to 7:29 AM | 1,890 (10.6%) | 2,451 (16.3%) |
| 7:30 AM to 7:59 AM | 2,136 (12.0%) | 2,767 (18.4%) |
| 8:00 AM to 8:29 AM | 976 (5.5%) | 1,452 (9.7%) |
| 8:30 AM to 8:59 AM | 765 (4.3%) | 911 (6.1%) |
| 9:00 AM to 9:59 AM | 870 (4.9%) | 939 (6.2%) |
| 10:00 AM to 10:59 AM | 318 (1.8%) | 468 (3.1%) |
| 11:00 AM to 11:59 AM | 232 (1.3%) | 169 (1.1%) |
| 12:00 PM to 3:59 PM | 1,529 (8.6%) | 1,226 (8.2%) |
| 4:00 PM to 11:59 PM | 1,065 (6.0%) | 843 (5.6%) |
| Total | 17,836 (100.0%) | 15,016 (100.0%) |
Housing Occupancy in Clinton County
Occupancy by Ownership in Clinton County
Of the total 32,651 dwellings in Clinton County, owner-occupied units account for 22,542 (69.0%), while renter-occupied units make up 10,109 (31.0%).
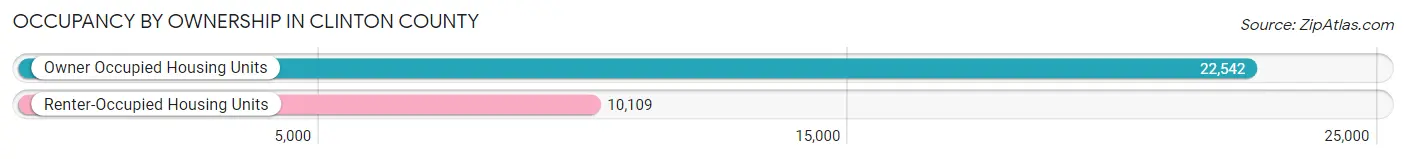
| Occupancy | # Housing Units | % Housing Units |
| Owner Occupied Housing Units | 22,542 | 69.0% |
| Renter-Occupied Housing Units | 10,109 | 31.0% |
| Total Occupied Housing Units | 32,651 | 100.0% |
Occupancy by Household Size in Clinton County
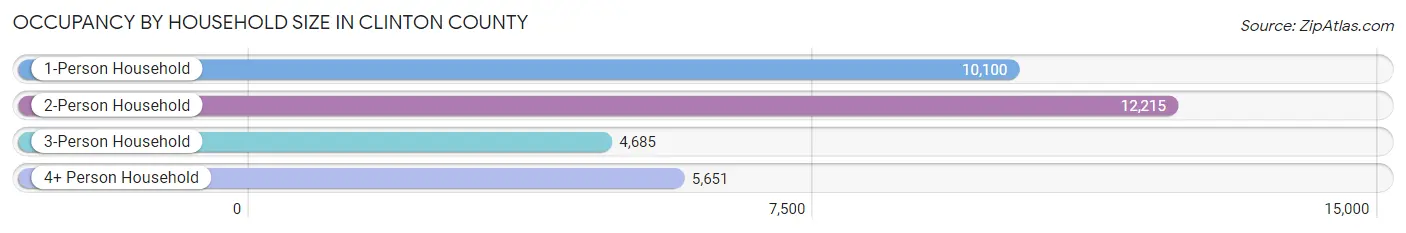
| Household Size | # Housing Units | % Housing Units |
| 1-Person Household | 10,100 | 30.9% |
| 2-Person Household | 12,215 | 37.4% |
| 3-Person Household | 4,685 | 14.3% |
| 4+ Person Household | 5,651 | 17.3% |
| Total Housing Units | 32,651 | 100.0% |
Occupancy by Ownership by Household Size in Clinton County
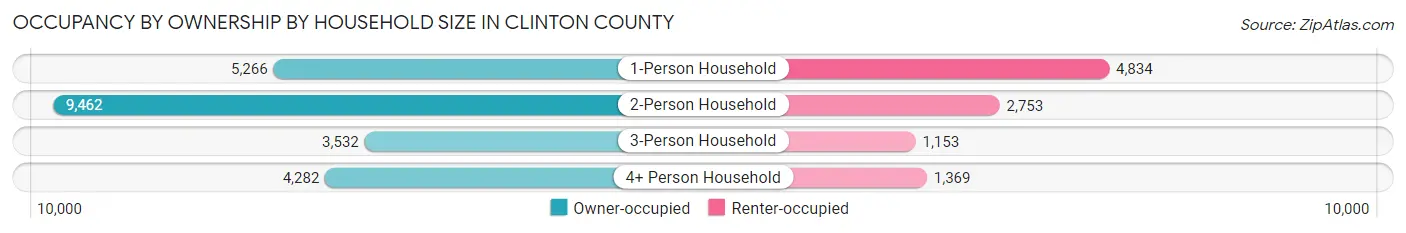
| Household Size | Owner-occupied | Renter-occupied |
| 1-Person Household | 5,266 (52.1%) | 4,834 (47.9%) |
| 2-Person Household | 9,462 (77.5%) | 2,753 (22.5%) |
| 3-Person Household | 3,532 (75.4%) | 1,153 (24.6%) |
| 4+ Person Household | 4,282 (75.8%) | 1,369 (24.2%) |
| Total Housing Units | 22,542 (69.0%) | 10,109 (31.0%) |
Occupancy by Educational Attainment in Clinton County
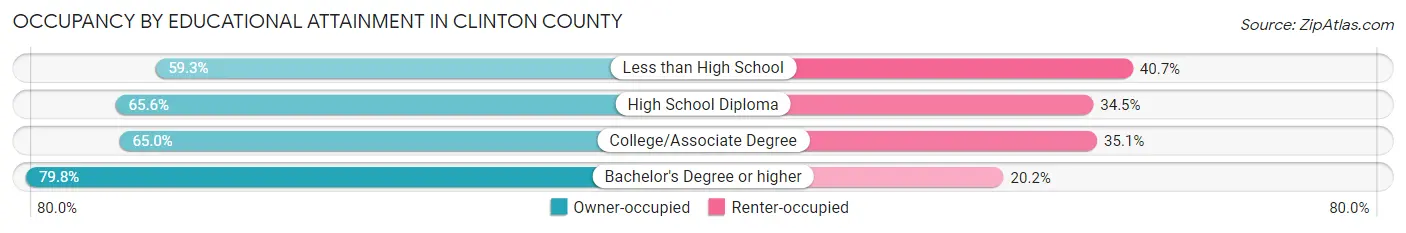
| Household Size | Owner-occupied | Renter-occupied |
| Less than High School | 1,833 (59.3%) | 1,259 (40.7%) |
| High School Diploma | 6,270 (65.5%) | 3,295 (34.4%) |
| College/Associate Degree | 6,621 (64.9%) | 3,573 (35.0%) |
| Bachelor's Degree or higher | 7,818 (79.8%) | 1,982 (20.2%) |
Occupancy by Age of Householder in Clinton County
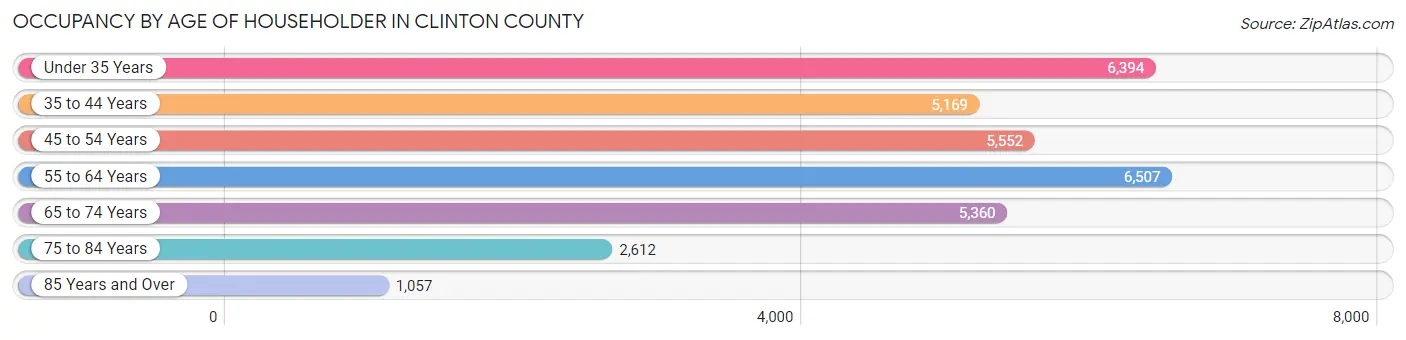
| Age Bracket | # Households | % Households |
| Under 35 Years | 6,394 | 19.6% |
| 35 to 44 Years | 5,169 | 15.8% |
| 45 to 54 Years | 5,552 | 17.0% |
| 55 to 64 Years | 6,507 | 19.9% |
| 65 to 74 Years | 5,360 | 16.4% |
| 75 to 84 Years | 2,612 | 8.0% |
| 85 Years and Over | 1,057 | 3.2% |
| Total | 32,651 | 100.0% |
Housing Finances in Clinton County
Median Income by Occupancy in Clinton County
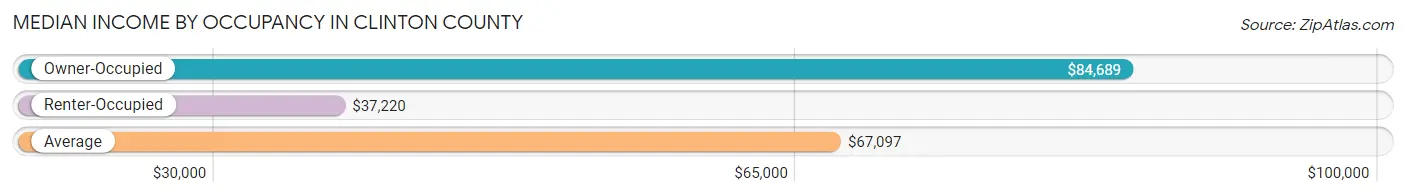
| Occupancy Type | # Households | Median Income |
| Owner-Occupied | 22,542 (69.0%) | $84,689 |
| Renter-Occupied | 10,109 (31.0%) | $37,220 |
| Average | 32,651 (100.0%) | $67,097 |
Occupancy by Householder Income Bracket in Clinton County
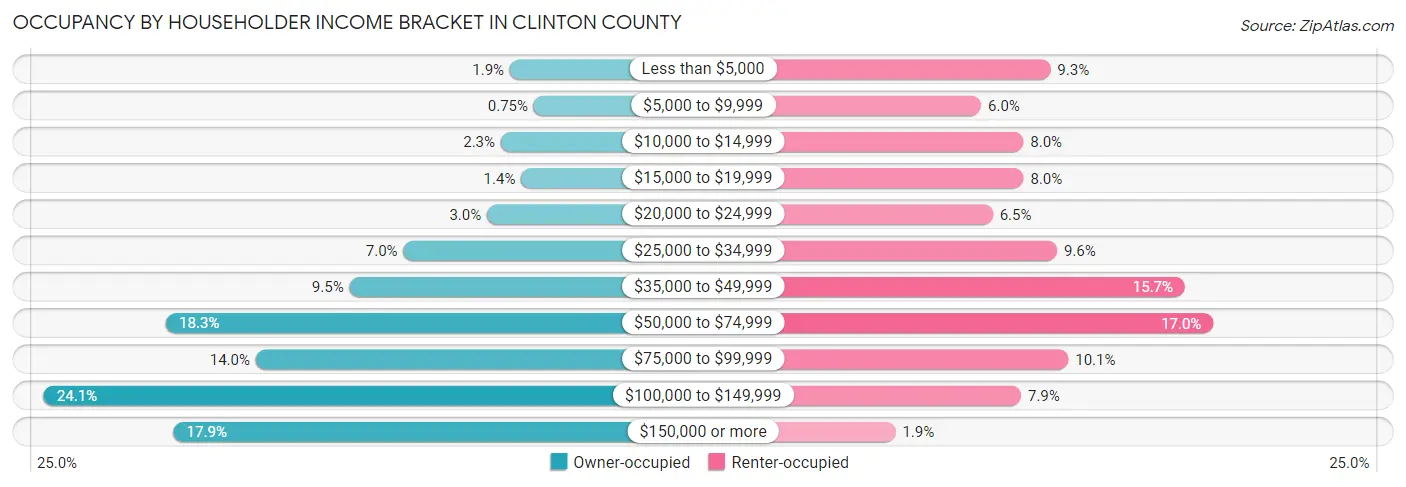
| Income Bracket | Owner-occupied | Renter-occupied |
| Less than $5,000 | 426 (1.9%) | 938 (9.3%) |
| $5,000 to $9,999 | 168 (0.7%) | 605 (6.0%) |
| $10,000 to $14,999 | 523 (2.3%) | 808 (8.0%) |
| $15,000 to $19,999 | 305 (1.3%) | 809 (8.0%) |
| $20,000 to $24,999 | 671 (3.0%) | 660 (6.5%) |
| $25,000 to $34,999 | 1,568 (7.0%) | 969 (9.6%) |
| $35,000 to $49,999 | 2,148 (9.5%) | 1,585 (15.7%) |
| $50,000 to $74,999 | 4,116 (18.3%) | 1,722 (17.0%) |
| $75,000 to $99,999 | 3,154 (14.0%) | 1,024 (10.1%) |
| $100,000 to $149,999 | 5,427 (24.1%) | 797 (7.9%) |
| $150,000 or more | 4,036 (17.9%) | 192 (1.9%) |
| Total | 22,542 (100.0%) | 10,109 (100.0%) |
Monthly Housing Cost Tiers in Clinton County
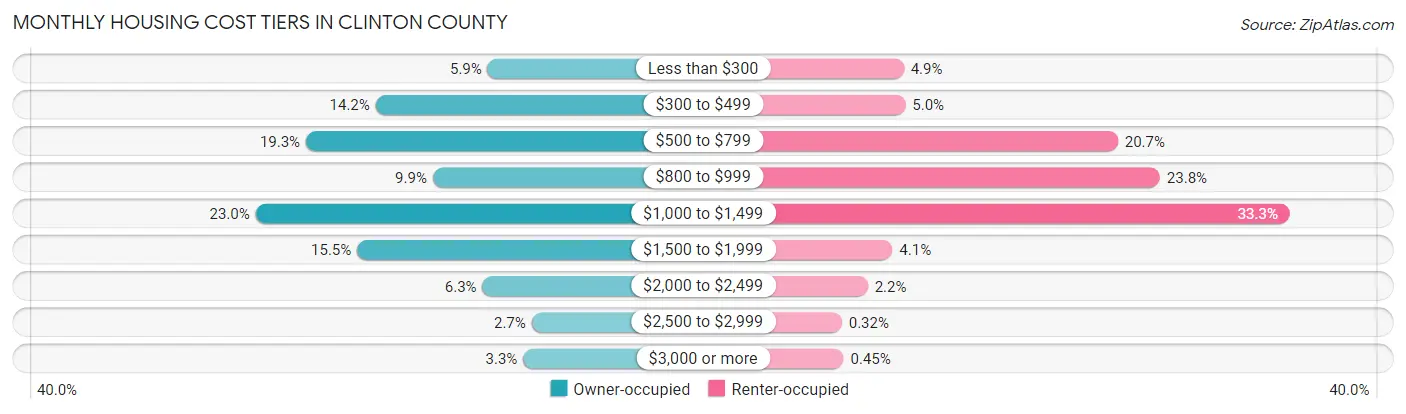
| Monthly Cost | Owner-occupied | Renter-occupied |
| Less than $300 | 1,330 (5.9%) | 493 (4.9%) |
| $300 to $499 | 3,190 (14.1%) | 505 (5.0%) |
| $500 to $799 | 4,347 (19.3%) | 2,088 (20.6%) |
| $800 to $999 | 2,240 (9.9%) | 2,401 (23.7%) |
| $1,000 to $1,499 | 5,183 (23.0%) | 3,367 (33.3%) |
| $1,500 to $1,999 | 3,496 (15.5%) | 409 (4.1%) |
| $2,000 to $2,499 | 1,416 (6.3%) | 225 (2.2%) |
| $2,500 to $2,999 | 600 (2.7%) | 32 (0.3%) |
| $3,000 or more | 740 (3.3%) | 45 (0.4%) |
| Total | 22,542 (100.0%) | 10,109 (100.0%) |
Physical Housing Characteristics in Clinton County
Housing Structures in Clinton County
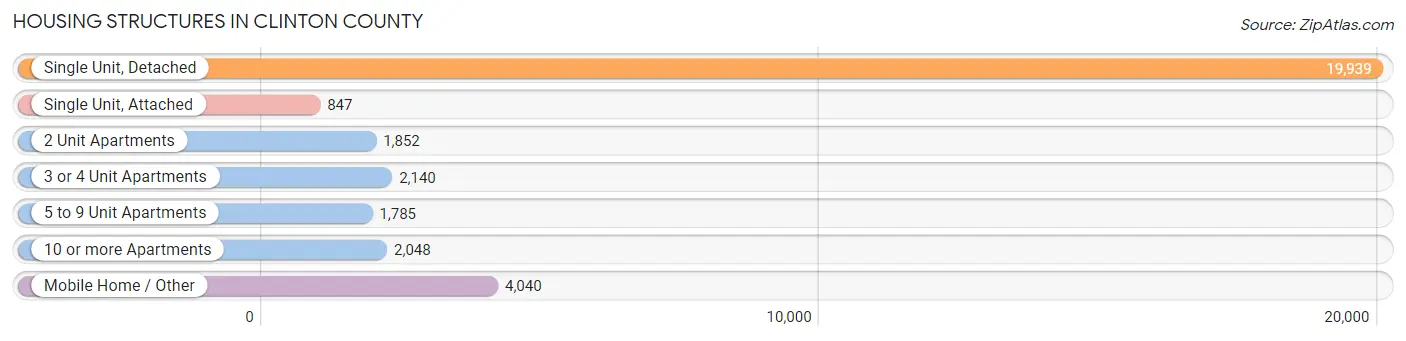
| Structure Type | # Housing Units | % Housing Units |
| Single Unit, Detached | 19,939 | 61.1% |
| Single Unit, Attached | 847 | 2.6% |
| 2 Unit Apartments | 1,852 | 5.7% |
| 3 or 4 Unit Apartments | 2,140 | 6.6% |
| 5 to 9 Unit Apartments | 1,785 | 5.5% |
| 10 or more Apartments | 2,048 | 6.3% |
| Mobile Home / Other | 4,040 | 12.4% |
| Total | 32,651 | 100.0% |
Housing Structures by Occupancy in Clinton County
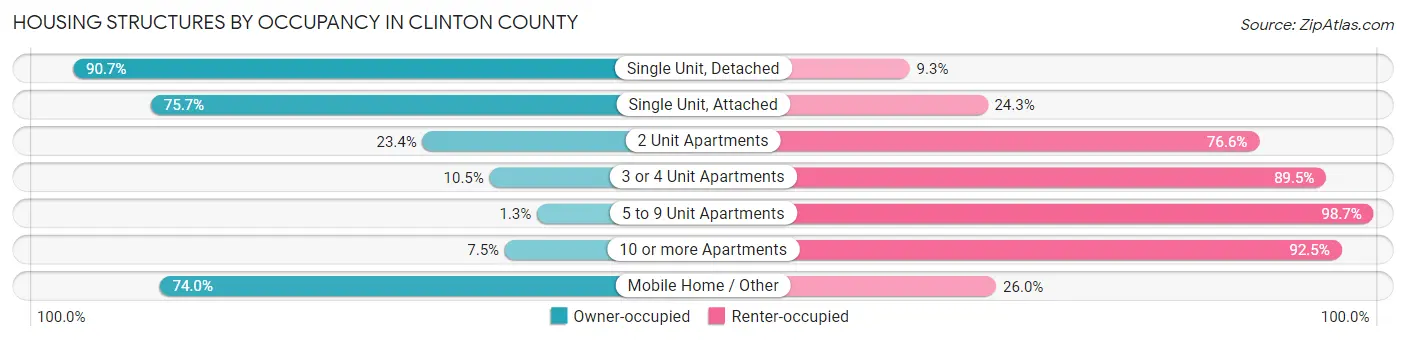
| Structure Type | Owner-occupied | Renter-occupied |
| Single Unit, Detached | 18,076 (90.7%) | 1,863 (9.3%) |
| Single Unit, Attached | 641 (75.7%) | 206 (24.3%) |
| 2 Unit Apartments | 433 (23.4%) | 1,419 (76.6%) |
| 3 or 4 Unit Apartments | 224 (10.5%) | 1,916 (89.5%) |
| 5 to 9 Unit Apartments | 24 (1.3%) | 1,761 (98.7%) |
| 10 or more Apartments | 154 (7.5%) | 1,894 (92.5%) |
| Mobile Home / Other | 2,990 (74.0%) | 1,050 (26.0%) |
| Total | 22,542 (69.0%) | 10,109 (31.0%) |
Housing Structures by Number of Rooms in Clinton County
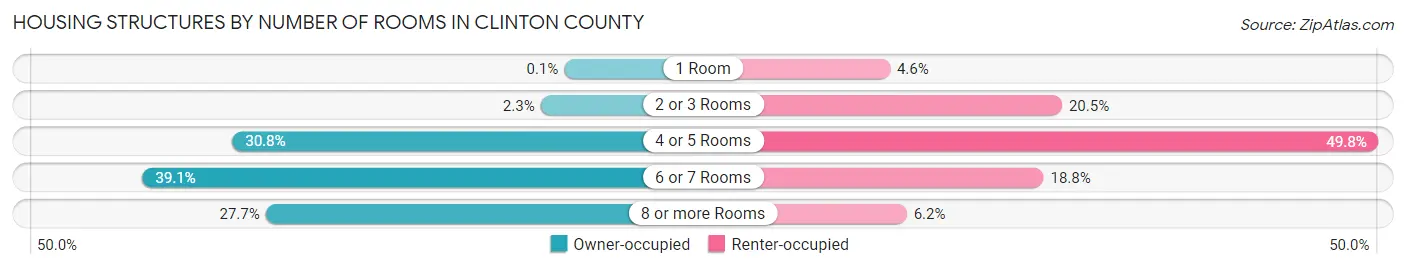
| Number of Rooms | Owner-occupied | Renter-occupied |
| 1 Room | 23 (0.1%) | 468 (4.6%) |
| 2 or 3 Rooms | 517 (2.3%) | 2,076 (20.5%) |
| 4 or 5 Rooms | 6,940 (30.8%) | 5,036 (49.8%) |
| 6 or 7 Rooms | 8,813 (39.1%) | 1,904 (18.8%) |
| 8 or more Rooms | 6,249 (27.7%) | 625 (6.2%) |
| Total | 22,542 (100.0%) | 10,109 (100.0%) |
Housing Structure by Heating Type in Clinton County
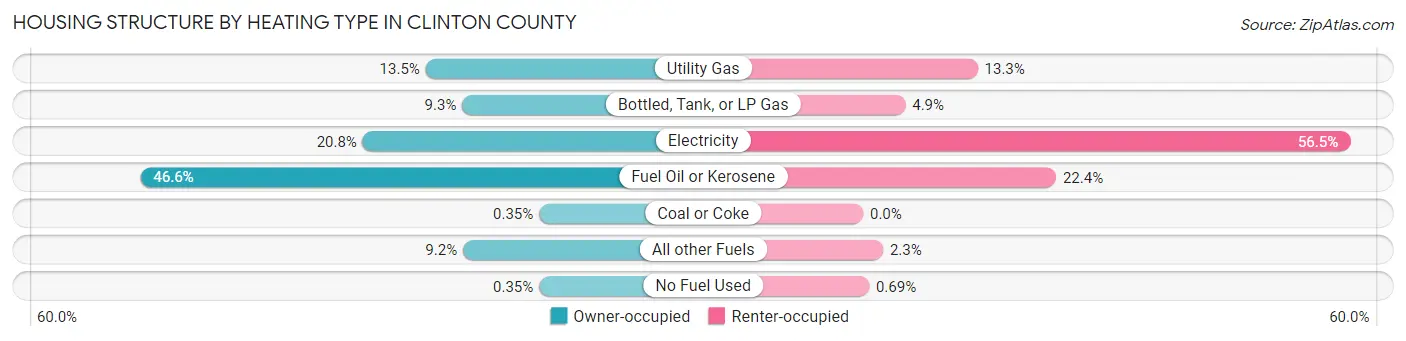
| Heating Type | Owner-occupied | Renter-occupied |
| Utility Gas | 3,043 (13.5%) | 1,342 (13.3%) |
| Bottled, Tank, or LP Gas | 2,088 (9.3%) | 495 (4.9%) |
| Electricity | 4,688 (20.8%) | 5,707 (56.5%) |
| Fuel Oil or Kerosene | 10,497 (46.6%) | 2,261 (22.4%) |
| Coal or Coke | 78 (0.4%) | 0 (0.0%) |
| All other Fuels | 2,068 (9.2%) | 234 (2.3%) |
| No Fuel Used | 80 (0.4%) | 70 (0.7%) |
| Total | 22,542 (100.0%) | 10,109 (100.0%) |
Household Vehicle Usage in Clinton County
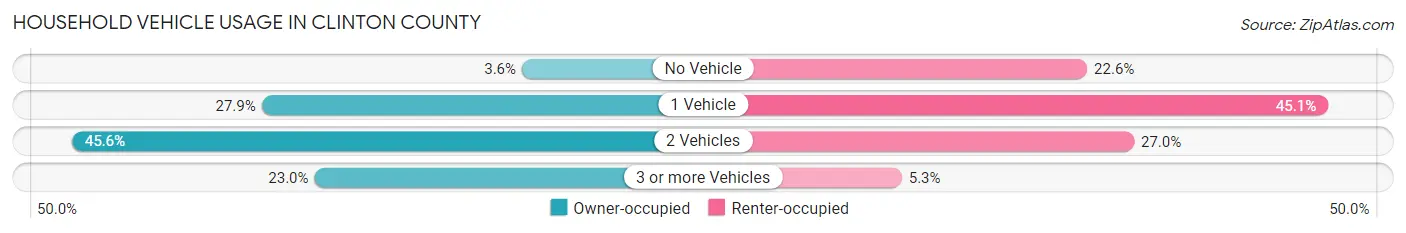
| Vehicles per Household | Owner-occupied | Renter-occupied |
| No Vehicle | 808 (3.6%) | 2,286 (22.6%) |
| 1 Vehicle | 6,284 (27.9%) | 4,558 (45.1%) |
| 2 Vehicles | 10,277 (45.6%) | 2,728 (27.0%) |
| 3 or more Vehicles | 5,173 (23.0%) | 537 (5.3%) |
| Total | 22,542 (100.0%) | 10,109 (100.0%) |
Real Estate & Mortgages in Clinton County
Real Estate and Mortgage Overview in Clinton County
| Characteristic | Without Mortgage | With Mortgage |
| Housing Units | 10,413 | 12,129 |
| Median Property Value | $146,900 | $182,800 |
| Median Household Income | $65,555 | $2,593 |
| Monthly Housing Costs | $546 | $740 |
| Real Estate Taxes | $2,661 | $327 |
Property Value by Mortgage Status in Clinton County
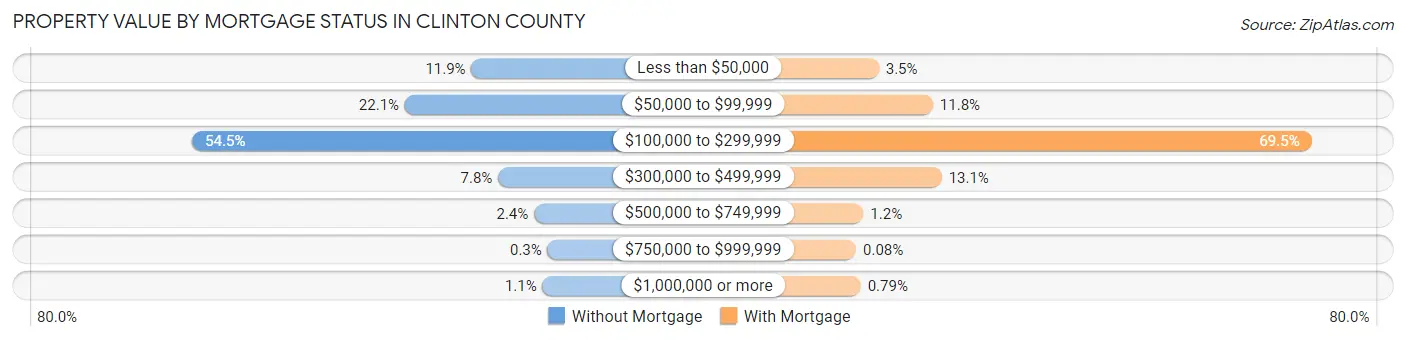
| Property Value | Without Mortgage | With Mortgage |
| Less than $50,000 | 1,240 (11.9%) | 429 (3.5%) |
| $50,000 to $99,999 | 2,296 (22.1%) | 1,430 (11.8%) |
| $100,000 to $299,999 | 5,672 (54.5%) | 8,426 (69.5%) |
| $300,000 to $499,999 | 816 (7.8%) | 1,593 (13.1%) |
| $500,000 to $749,999 | 246 (2.4%) | 145 (1.2%) |
| $750,000 to $999,999 | 31 (0.3%) | 10 (0.1%) |
| $1,000,000 or more | 112 (1.1%) | 96 (0.8%) |
| Total | 10,413 (100.0%) | 12,129 (100.0%) |
Household Income by Mortgage Status in Clinton County
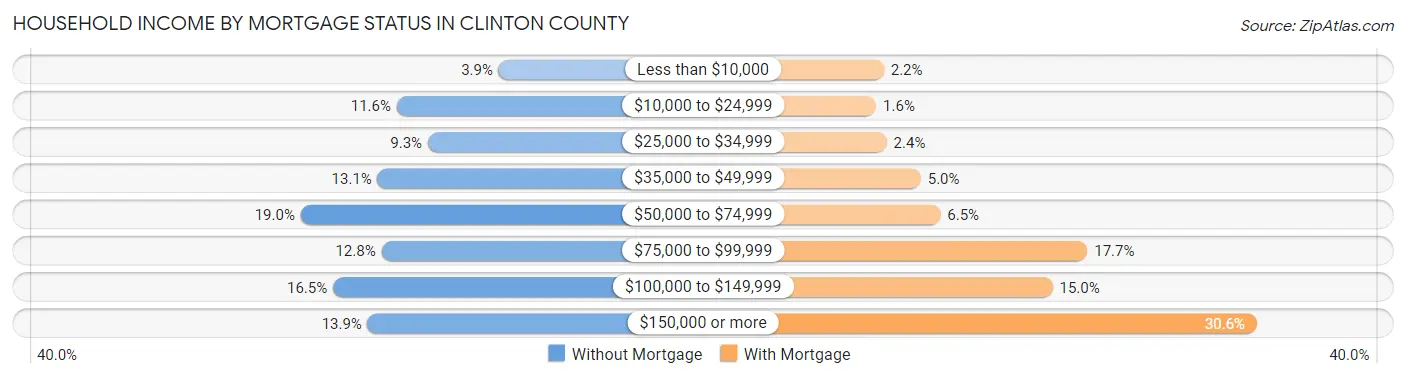
| Household Income | Without Mortgage | With Mortgage |
| Less than $10,000 | 403 (3.9%) | 261 (2.1%) |
| $10,000 to $24,999 | 1,212 (11.6%) | 191 (1.6%) |
| $25,000 to $34,999 | 965 (9.3%) | 287 (2.4%) |
| $35,000 to $49,999 | 1,364 (13.1%) | 603 (5.0%) |
| $50,000 to $74,999 | 1,974 (19.0%) | 784 (6.5%) |
| $75,000 to $99,999 | 1,334 (12.8%) | 2,142 (17.7%) |
| $100,000 to $149,999 | 1,718 (16.5%) | 1,820 (15.0%) |
| $150,000 or more | 1,443 (13.9%) | 3,709 (30.6%) |
| Total | 10,413 (100.0%) | 12,129 (100.0%) |
Property Value to Household Income Ratio in Clinton County
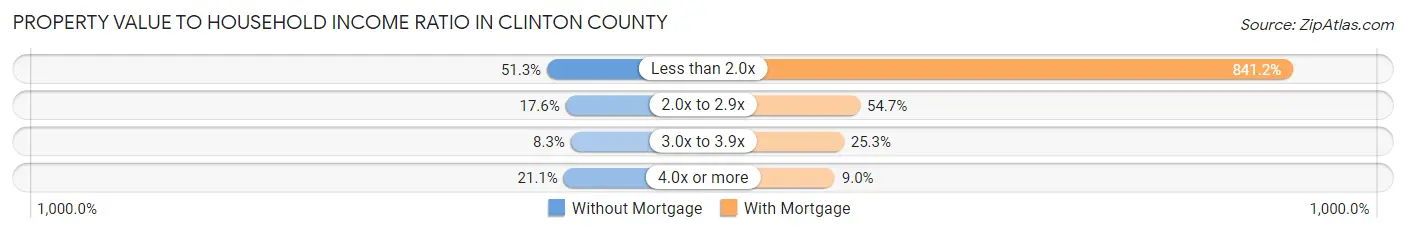
| Value-to-Income Ratio | Without Mortgage | With Mortgage |
| Less than 2.0x | 5,346 (51.3%) | 102,033 (841.2%) |
| 2.0x to 2.9x | 1,834 (17.6%) | 6,637 (54.7%) |
| 3.0x to 3.9x | 859 (8.3%) | 3,063 (25.3%) |
| 4.0x or more | 2,196 (21.1%) | 1,088 (9.0%) |
| Total | 10,413 (100.0%) | 12,129 (100.0%) |
Real Estate Taxes by Mortgage Status in Clinton County

| Property Taxes | Without Mortgage | With Mortgage |
| Less than $800 | 1,415 (13.6%) | 54 (0.4%) |
| $800 to $1,499 | 1,574 (15.1%) | 462 (3.8%) |
| $800 to $1,499 | 6,616 (63.5%) | 1,238 (10.2%) |
| Total | 10,413 (100.0%) | 12,129 (100.0%) |
Health & Disability in Clinton County
Health Insurance Coverage by Age in Clinton County
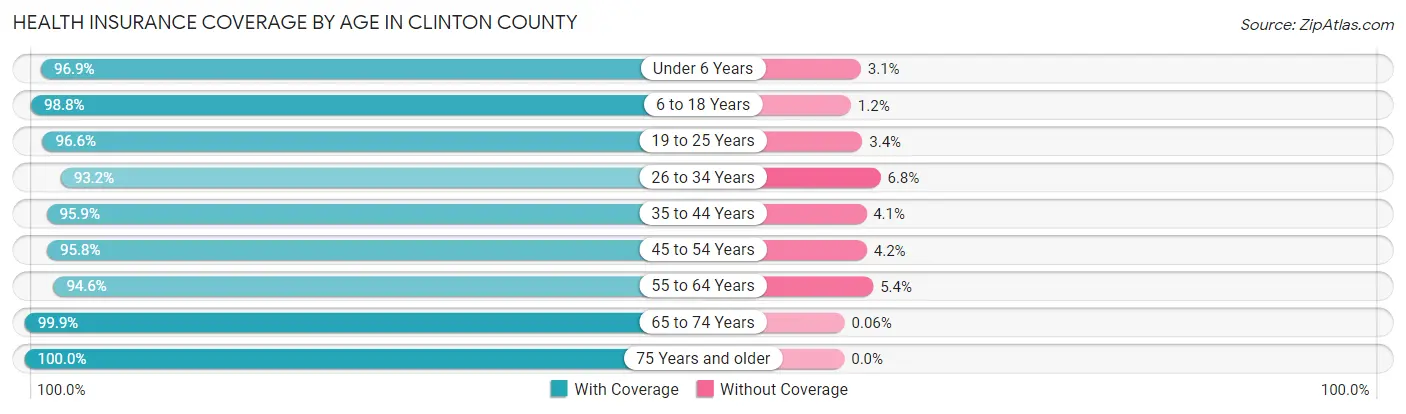
| Age Bracket | With Coverage | Without Coverage |
| Under 6 Years | 4,295 (96.9%) | 137 (3.1%) |
| 6 to 18 Years | 11,264 (98.8%) | 140 (1.2%) |
| 19 to 25 Years | 8,862 (96.6%) | 309 (3.4%) |
| 26 to 34 Years | 7,311 (93.2%) | 530 (6.8%) |
| 35 to 44 Years | 8,429 (95.9%) | 359 (4.1%) |
| 45 to 54 Years | 8,945 (95.8%) | 392 (4.2%) |
| 55 to 64 Years | 10,752 (94.6%) | 613 (5.4%) |
| 65 to 74 Years | 8,415 (99.9%) | 5 (0.1%) |
| 75 Years and older | 5,446 (100.0%) | 0 (0.0%) |
| Total | 73,719 (96.7%) | 2,485 (3.3%) |
Health Insurance Coverage by Citizenship Status in Clinton County
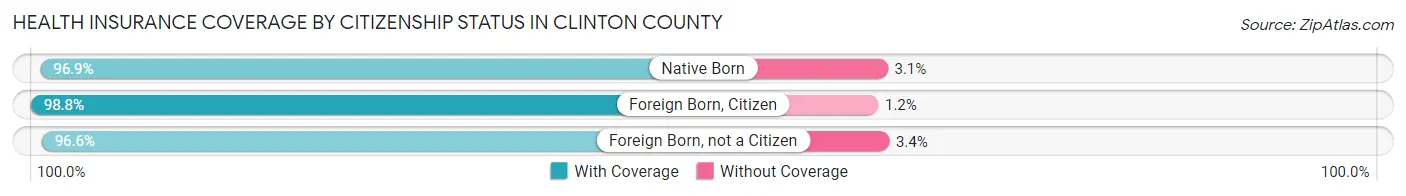
| Citizenship Status | With Coverage | Without Coverage |
| Native Born | 4,295 (96.9%) | 137 (3.1%) |
| Foreign Born, Citizen | 11,264 (98.8%) | 140 (1.2%) |
| Foreign Born, not a Citizen | 8,862 (96.6%) | 309 (3.4%) |
Health Insurance Coverage by Household Income in Clinton County
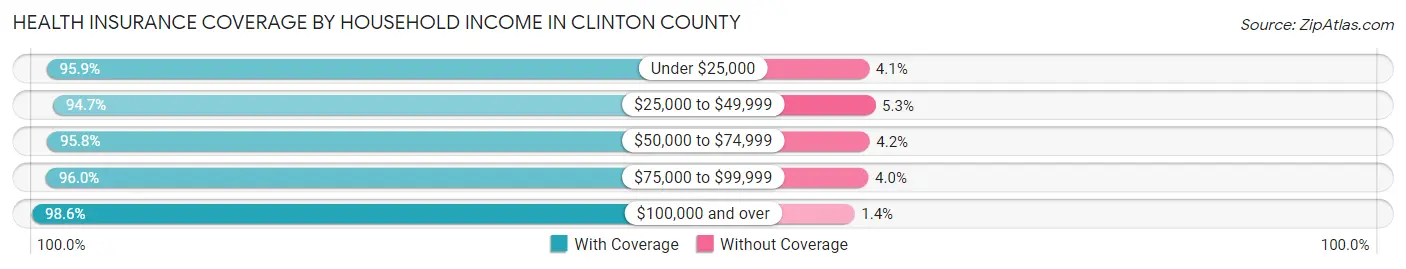
| Household Income | With Coverage | Without Coverage |
| Under $25,000 | 9,009 (95.9%) | 389 (4.1%) |
| $25,000 to $49,999 | 11,170 (94.7%) | 627 (5.3%) |
| $50,000 to $74,999 | 12,089 (95.8%) | 534 (4.2%) |
| $75,000 to $99,999 | 10,036 (96.0%) | 418 (4.0%) |
| $100,000 and over | 28,396 (98.6%) | 410 (1.4%) |
Public vs Private Health Insurance Coverage by Age in Clinton County
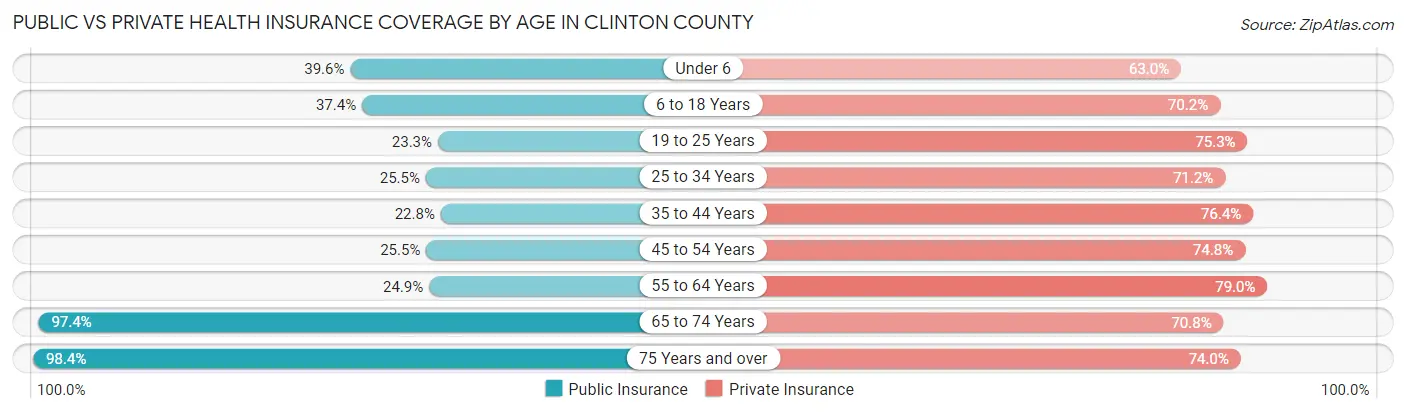
| Age Bracket | Public Insurance | Private Insurance |
| Under 6 | 1,753 (39.6%) | 2,791 (63.0%) |
| 6 to 18 Years | 4,263 (37.4%) | 8,006 (70.2%) |
| 19 to 25 Years | 2,136 (23.3%) | 6,905 (75.3%) |
| 25 to 34 Years | 2,002 (25.5%) | 5,580 (71.2%) |
| 35 to 44 Years | 2,000 (22.8%) | 6,710 (76.3%) |
| 45 to 54 Years | 2,376 (25.5%) | 6,988 (74.8%) |
| 55 to 64 Years | 2,833 (24.9%) | 8,976 (79.0%) |
| 65 to 74 Years | 8,203 (97.4%) | 5,965 (70.8%) |
| 75 Years and over | 5,361 (98.4%) | 4,032 (74.0%) |
| Total | 30,927 (40.6%) | 55,953 (73.4%) |
Disability Status by Sex by Age in Clinton County
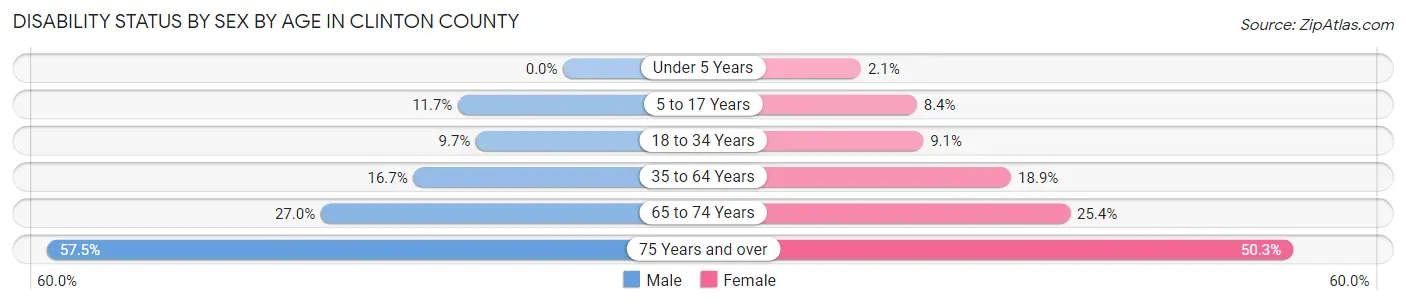
| Age Bracket | Male | Female |
| Under 5 Years | 0 (0.0%) | 38 (2.1%) |
| 5 to 17 Years | 647 (11.7%) | 434 (8.4%) |
| 18 to 34 Years | 891 (9.7%) | 848 (9.1%) |
| 35 to 64 Years | 2,442 (16.7%) | 2,801 (18.9%) |
| 65 to 74 Years | 1,128 (27.0%) | 1,078 (25.4%) |
| 75 Years and over | 1,338 (57.5%) | 1,568 (50.3%) |
Disability Class by Sex by Age in Clinton County
Disability Class: Hearing Difficulty
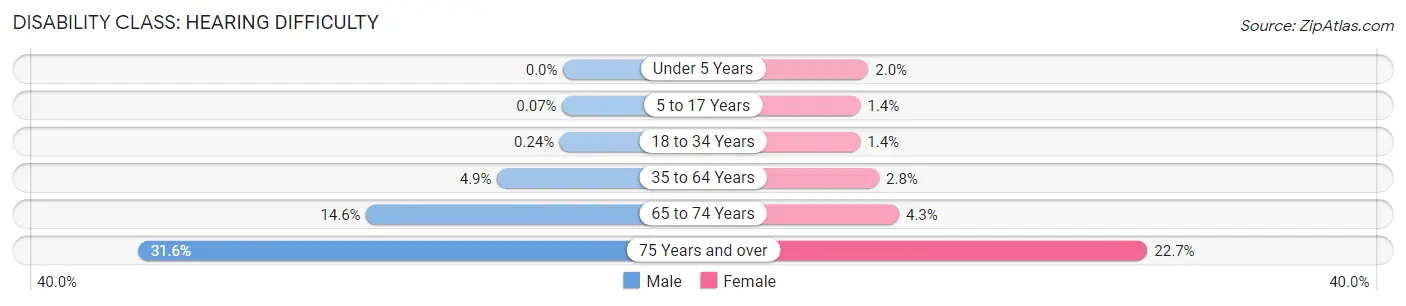
| Age Bracket | Male | Female |
| Under 5 Years | 0 (0.0%) | 35 (2.0%) |
| 5 to 17 Years | 4 (0.1%) | 72 (1.4%) |
| 18 to 34 Years | 22 (0.2%) | 129 (1.4%) |
| 35 to 64 Years | 717 (4.9%) | 411 (2.8%) |
| 65 to 74 Years | 611 (14.6%) | 180 (4.3%) |
| 75 Years and over | 735 (31.6%) | 708 (22.7%) |
Disability Class: Vision Difficulty
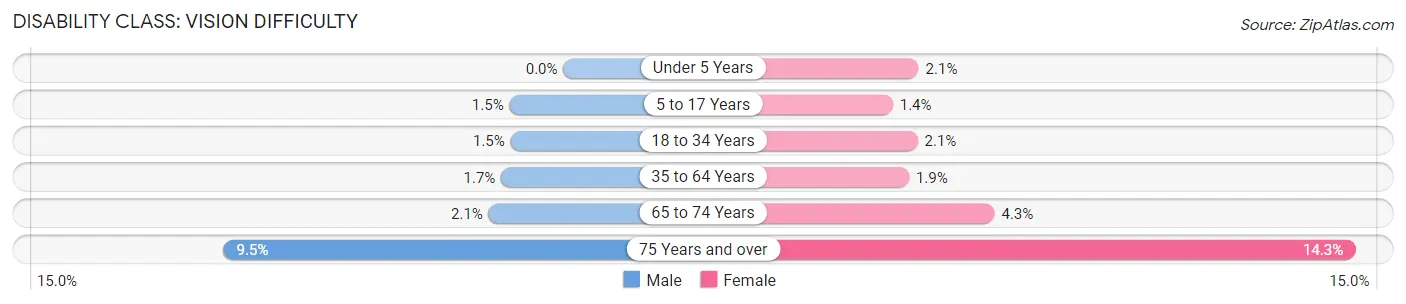
| Age Bracket | Male | Female |
| Under 5 Years | 0 (0.0%) | 38 (2.1%) |
| 5 to 17 Years | 83 (1.5%) | 74 (1.4%) |
| 18 to 34 Years | 135 (1.5%) | 197 (2.1%) |
| 35 to 64 Years | 253 (1.7%) | 278 (1.9%) |
| 65 to 74 Years | 87 (2.1%) | 180 (4.3%) |
| 75 Years and over | 220 (9.5%) | 446 (14.3%) |
Disability Class: Cognitive Difficulty
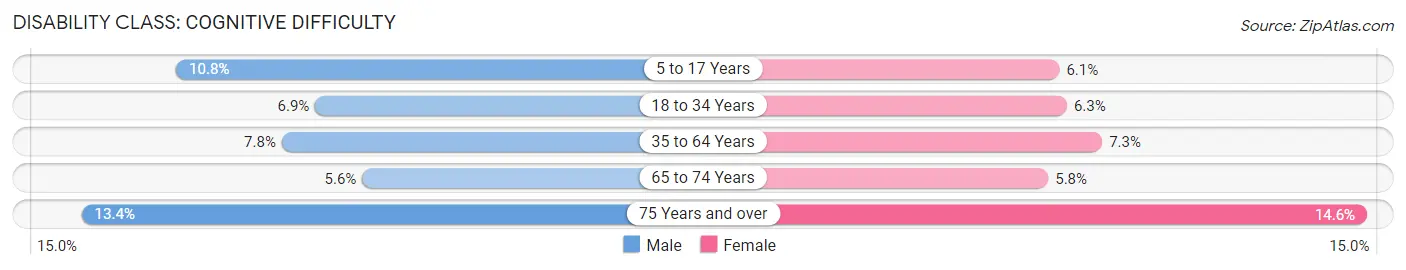
| Age Bracket | Male | Female |
| 5 to 17 Years | 596 (10.8%) | 315 (6.1%) |
| 18 to 34 Years | 634 (6.9%) | 586 (6.3%) |
| 35 to 64 Years | 1,148 (7.8%) | 1,077 (7.2%) |
| 65 to 74 Years | 234 (5.6%) | 244 (5.8%) |
| 75 Years and over | 312 (13.4%) | 456 (14.6%) |
Disability Class: Ambulatory Difficulty
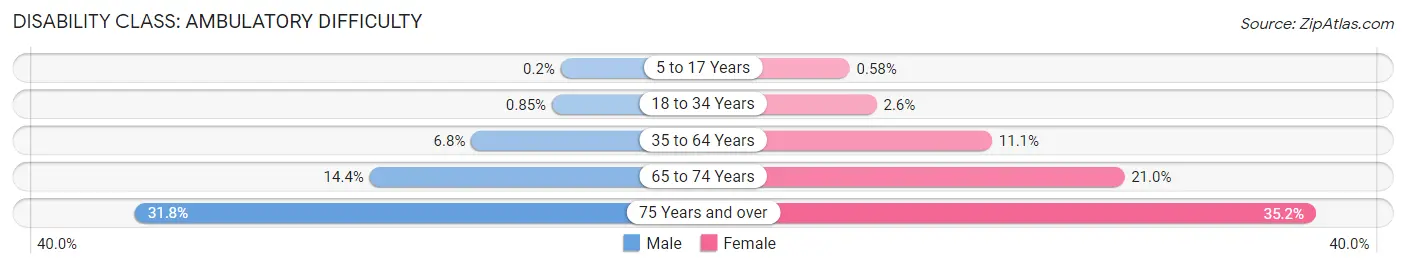
| Age Bracket | Male | Female |
| 5 to 17 Years | 11 (0.2%) | 30 (0.6%) |
| 18 to 34 Years | 78 (0.9%) | 241 (2.6%) |
| 35 to 64 Years | 1,001 (6.8%) | 1,654 (11.1%) |
| 65 to 74 Years | 601 (14.4%) | 889 (21.0%) |
| 75 Years and over | 740 (31.8%) | 1,098 (35.2%) |
Disability Class: Self-Care Difficulty
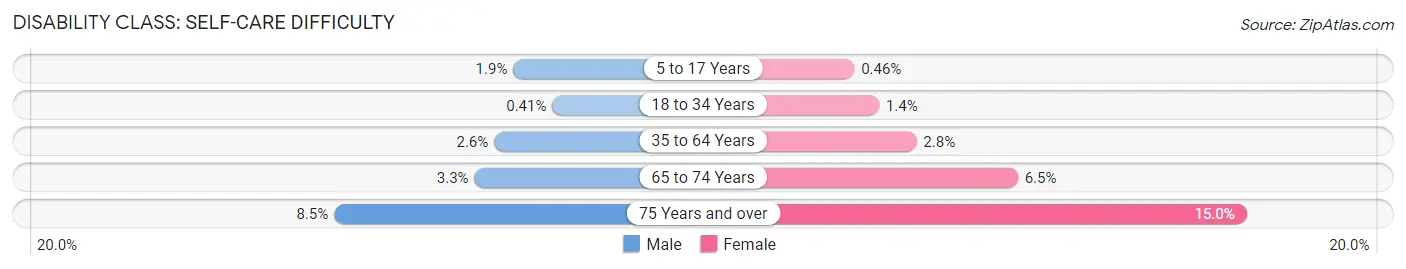
| Age Bracket | Male | Female |
| 5 to 17 Years | 103 (1.9%) | 24 (0.5%) |
| 18 to 34 Years | 38 (0.4%) | 129 (1.4%) |
| 35 to 64 Years | 376 (2.6%) | 411 (2.8%) |
| 65 to 74 Years | 138 (3.3%) | 277 (6.5%) |
| 75 Years and over | 198 (8.5%) | 469 (15.0%) |
Technology Access in Clinton County
Computing Device Access in Clinton County
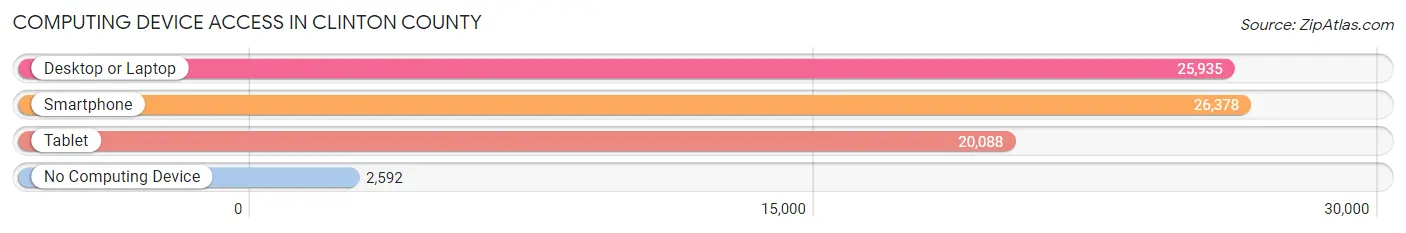
| Device Type | # Households | % Households |
| Desktop or Laptop | 25,935 | 79.4% |
| Smartphone | 26,378 | 80.8% |
| Tablet | 20,088 | 61.5% |
| No Computing Device | 2,592 | 7.9% |
| Total | 32,651 | 100.0% |
Internet Access in Clinton County
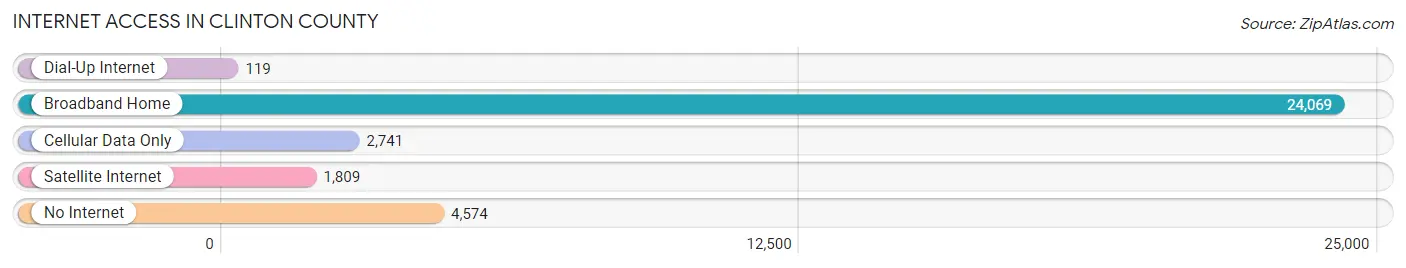
| Internet Type | # Households | % Households |
| Dial-Up Internet | 119 | 0.4% |
| Broadband Home | 24,069 | 73.7% |
| Cellular Data Only | 2,741 | 8.4% |
| Satellite Internet | 1,809 | 5.5% |
| No Internet | 4,574 | 14.0% |
| Total | 32,651 | 100.0% |
Clinton County Summary
County History
Clinton County is located in the northeastern part of New York State, and is bordered by Canada to the north, Franklin County to the east, Essex County to the south, and Franklin and St. Lawrence Counties to the west. The county was created in 1845 from parts of Franklin and Essex Counties, and was named after George Clinton, the first Governor of New York.
The first settlers in the area were the Iroquois, who were followed by French fur traders and missionaries. The first permanent settlement was established in 1787, and the county was officially organized in 1845.
The county was an important center of the lumber industry in the 19th century, and the county seat of Plattsburgh was an important port on Lake Champlain. The county was also an important center of the iron industry, and the county seat of Plattsburgh was home to several iron foundries.
The county was also an important center of the dairy industry, and the county seat of Plattsburgh was home to several dairy farms. The county was also an important center of the paper industry, and the county seat of Plattsburgh was home to several paper mills.
The county was also an important center of the tourism industry, and the county seat of Plattsburgh was home to several resorts and tourist attractions.
Geography
Clinton County is located in the northeastern part of New York State, and is bordered by Canada to the north, Franklin County to the east, Essex County to the south, and Franklin and St. Lawrence Counties to the west. The county has a total area of 1,814 square miles, of which 1,788 square miles is land and 26 square miles is water.
The county is located in the Adirondack Mountains, and is home to several mountain peaks, including Mount Marcy, the highest point in the state. The county is also home to several rivers, including the Ausable, Saranac, and Boquet Rivers.
The county is home to several state parks, including Ausable Chasm, Ausable Marsh, and Saranac Lake State Park. The county is also home to several lakes, including Lake Champlain, Lake Placid, and Lake George.
Economy
The economy of Clinton County is largely based on agriculture, manufacturing, and tourism. The county is home to several dairy farms, and is an important center of the dairy industry in the state. The county is also home to several paper mills, and is an important center of the paper industry in the state.
The county is also an important center of the tourism industry in the state, and is home to several resorts and tourist attractions. The county is also home to several state parks, including Ausable Chasm, Ausable Marsh, and Saranac Lake State Park.
Demographics
As of the 2010 census, the population of Clinton County was 82,128, with a population density of 45.6 people per square mile. The median age of the population was 41.7 years, and the median household income was $48,945.
The racial makeup of the county was 94.2% White, 1.7% African American, 0.7% Native American, 0.7% Asian, 0.1% Pacific Islander, 1.2% from other races, and 1.5% from two or more races. Hispanic or Latino of any race were 4.2% of the population.
The largest ancestry groups in the county were Irish (25.2%), French (17.2%), German (14.2%), English (13.2%), and Italian (7.2%). The largest religious affiliations were Catholic (41.2%), Protestant (25.2%), and Other (17.2%).
Conclusion
Clinton County is located in the northeastern part of New York State, and is bordered by Canada to the north, Franklin County to the east, Essex County to the south, and Franklin and St. Lawrence Counties to the west. The county was created in 1845 from parts of Franklin and Essex Counties, and was named after George Clinton, the first Governor of New York. The economy of Clinton County is largely based on agriculture, manufacturing, and tourism, and the county is home to several dairy farms, paper mills, and state parks. As of the 2010 census, the population of Clinton County was 82,128, with a median age of 41.7 years and a median household income of $48,945. The largest ancestry groups in the county were Irish, French, German, English, and Italian, and the largest religious affiliations were Catholic, Protestant, and Other.
Common Questions
What is Per Capita Income in Clinton County?
Per Capita income in Clinton County is $34,834.
What is the Median Family Income in Clinton County?
Median Family Income in Clinton County is $86,712.
What is the Median Household income in Clinton County?
Median Household Income in Clinton County is $67,097.
What is Income or Wage Gap in Clinton County?
Income or Wage Gap in Clinton County is 24.4%.
Women in Clinton County earn 75.6 cents for every dollar earned by a man.
What is Family Income Deficit in Clinton County?
Family Income Deficit in Clinton County is $11,701.
Families that are below poverty line in Clinton County earn $11,701 less on average than the poverty threshold level.
What is Inequality or Gini Index in Clinton County?
Inequality or Gini Index in Clinton County is 0.44.
What is the Total Population of Clinton County?
Total Population of Clinton County is 79,839.
What is the Total Male Population of Clinton County?
Total Male Population of Clinton County is 41,064.
What is the Total Female Population of Clinton County?
Total Female Population of Clinton County is 38,775.
What is the Ratio of Males per 100 Females in Clinton County?
There are 105.90 Males per 100 Females in Clinton County.
What is the Ratio of Females per 100 Males in Clinton County?
There are 94.43 Females per 100 Males in Clinton County.
What is the Median Population Age in Clinton County?
Median Population Age in Clinton County is 40.9 Years.
What is the Average Family Size in Clinton County
Average Family Size in Clinton County is 2.8 People.
What is the Average Household Size in Clinton County
Average Household Size in Clinton County is 2.2 People.
How Large is the Labor Force in Clinton County?
There are 37,852 People in the Labor Forcein in Clinton County.
What is the Percentage of People in the Labor Force in Clinton County?
56.4% of People are in the Labor Force in Clinton County.
What is the Unemployment Rate in Clinton County?
Unemployment Rate in Clinton County is 4.7%.