Chemung County, NY Map & Demographics
Chemung County Map
Chemung County Overview
$34,304
PER CAPITA INCOME
$77,618
AVG FAMILY INCOME
$61,358
AVG HOUSEHOLD INCOME
24.1%
WAGE / INCOME GAP [ % ]
75.9¢/ $1
WAGE / INCOME GAP [ $ ]
$9,851
FAMILY INCOME DEFICIT
0.46
INEQUALITY / GINI INDEX
83,584
TOTAL POPULATION
41,704
MALE POPULATION
41,880
FEMALE POPULATION
99.58
MALES / 100 FEMALES
100.42
FEMALES / 100 MALES
41.7
MEDIAN AGE
2.9
AVG FAMILY SIZE
2.3
AVG HOUSEHOLD SIZE
39,243
LABOR FORCE [ PEOPLE ]
57.5%
PERCENT IN LABOR FORCE
6.3%
UNEMPLOYMENT RATE
Chemung County Area Codes
Income in Chemung County
Income Overview in Chemung County
Per Capita Income in Chemung County is $34,304, while median incomes of families and households are $77,618 and $61,358 respectively.
| Characteristic | Number | Measure |
| Per Capita Income | 83,584 | $34,304 |
| Median Family Income | 20,599 | $77,618 |
| Mean Family Income | 20,599 | $94,694 |
| Median Household Income | 34,779 | $61,358 |
| Mean Household Income | 34,779 | $81,684 |
| Income Deficit | 20,599 | $9,851 |
| Wage / Income Gap (%) | 83,584 | 24.11% |
| Wage / Income Gap ($) | 83,584 | 75.89¢ per $1 |
| Gini / Inequality Index | 83,584 | 0.46 |
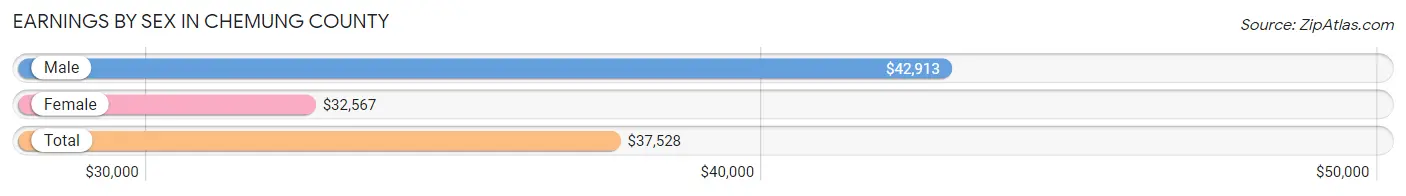
Earnings by Sex in Chemung County
Average Earnings in Chemung County are $37,528, $42,913 for men and $32,567 for women, a difference of 24.1%.
| Sex | Number | Average Earnings |
| Male | 21,223 (51.8%) | $42,913 |
| Female | 19,765 (48.2%) | $32,567 |
| Total | 40,988 (100.0%) | $37,528 |
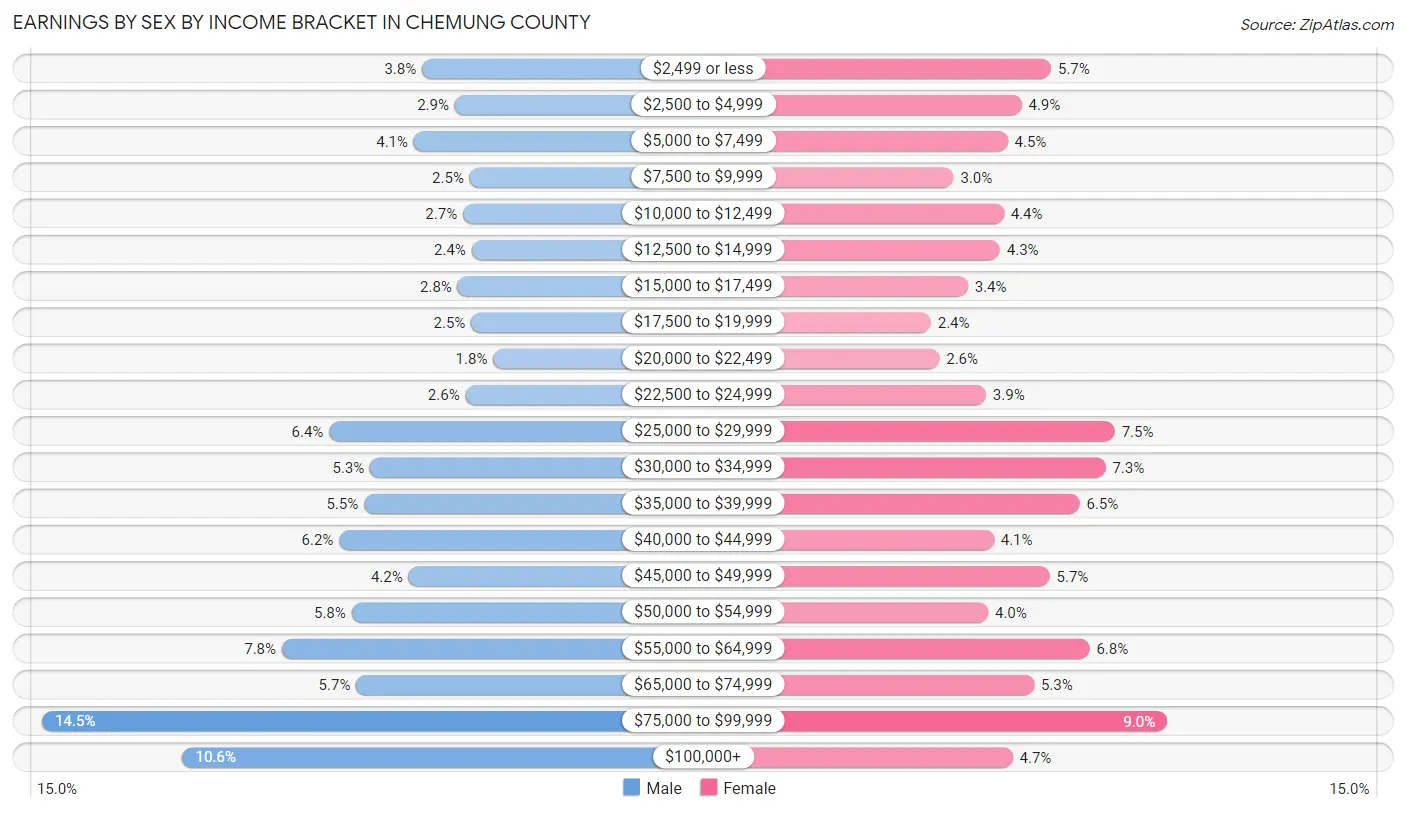
Earnings by Sex by Income Bracket in Chemung County
The most common earnings brackets in Chemung County are $75,000 to $99,999 for men (3,080 | 14.5%) and $75,000 to $99,999 for women (1,778 | 9.0%).
| Income | Male | Female |
| $2,499 or less | 813 (3.8%) | 1,135 (5.7%) |
| $2,500 to $4,999 | 618 (2.9%) | 970 (4.9%) |
| $5,000 to $7,499 | 861 (4.1%) | 894 (4.5%) |
| $7,500 to $9,999 | 529 (2.5%) | 592 (3.0%) |
| $10,000 to $12,499 | 569 (2.7%) | 872 (4.4%) |
| $12,500 to $14,999 | 518 (2.4%) | 850 (4.3%) |
| $15,000 to $17,499 | 600 (2.8%) | 672 (3.4%) |
| $17,500 to $19,999 | 519 (2.5%) | 466 (2.4%) |
| $20,000 to $22,499 | 388 (1.8%) | 513 (2.6%) |
| $22,500 to $24,999 | 553 (2.6%) | 772 (3.9%) |
| $25,000 to $29,999 | 1,366 (6.4%) | 1,489 (7.5%) |
| $30,000 to $34,999 | 1,123 (5.3%) | 1,436 (7.3%) |
| $35,000 to $39,999 | 1,158 (5.5%) | 1,293 (6.5%) |
| $40,000 to $44,999 | 1,307 (6.2%) | 816 (4.1%) |
| $45,000 to $49,999 | 893 (4.2%) | 1,126 (5.7%) |
| $50,000 to $54,999 | 1,233 (5.8%) | 784 (4.0%) |
| $55,000 to $64,999 | 1,649 (7.8%) | 1,347 (6.8%) |
| $65,000 to $74,999 | 1,205 (5.7%) | 1,039 (5.3%) |
| $75,000 to $99,999 | 3,080 (14.5%) | 1,778 (9.0%) |
| $100,000+ | 2,241 (10.6%) | 921 (4.7%) |
| Total | 21,223 (100.0%) | 19,765 (100.0%) |
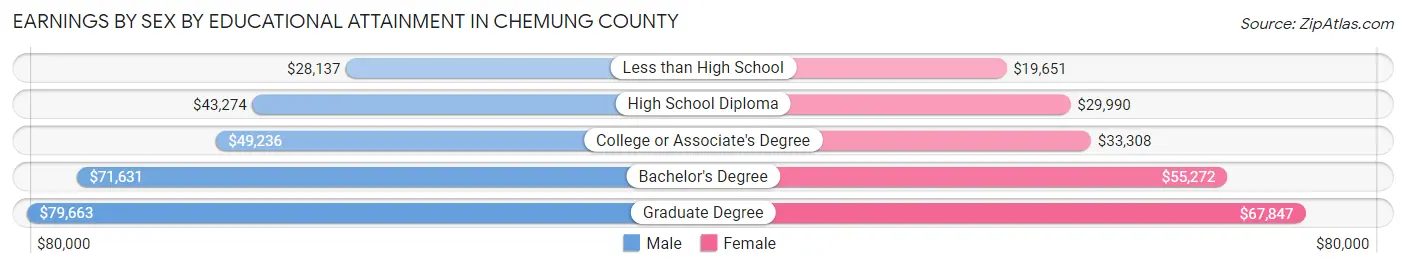
Earnings by Sex by Educational Attainment in Chemung County
Average earnings in Chemung County are $50,371 for men and $36,569 for women, a difference of 27.4%. Men with an educational attainment of graduate degree enjoy the highest average annual earnings of $79,663, while those with less than high school education earn the least with $28,137. Women with an educational attainment of graduate degree earn the most with the average annual earnings of $67,847, while those with less than high school education have the smallest earnings of $19,651.
| Educational Attainment | Male Income | Female Income |
| Less than High School | $28,137 | $19,651 |
| High School Diploma | $43,274 | $29,990 |
| College or Associate's Degree | $49,236 | $33,308 |
| Bachelor's Degree | $71,631 | $55,272 |
| Graduate Degree | $79,663 | $67,847 |
| Total | $50,371 | $36,569 |
Family Income in Chemung County
Family Income Brackets in Chemung County
According to the Chemung County family income data, there are 4,326 families falling into the $100,000 to $149,999 income range, which is the most common income bracket and makes up 21.0% of all families. Conversely, the $10,000 to $14,999 income bracket is the least frequent group with only 453 families (2.2%) belonging to this category.
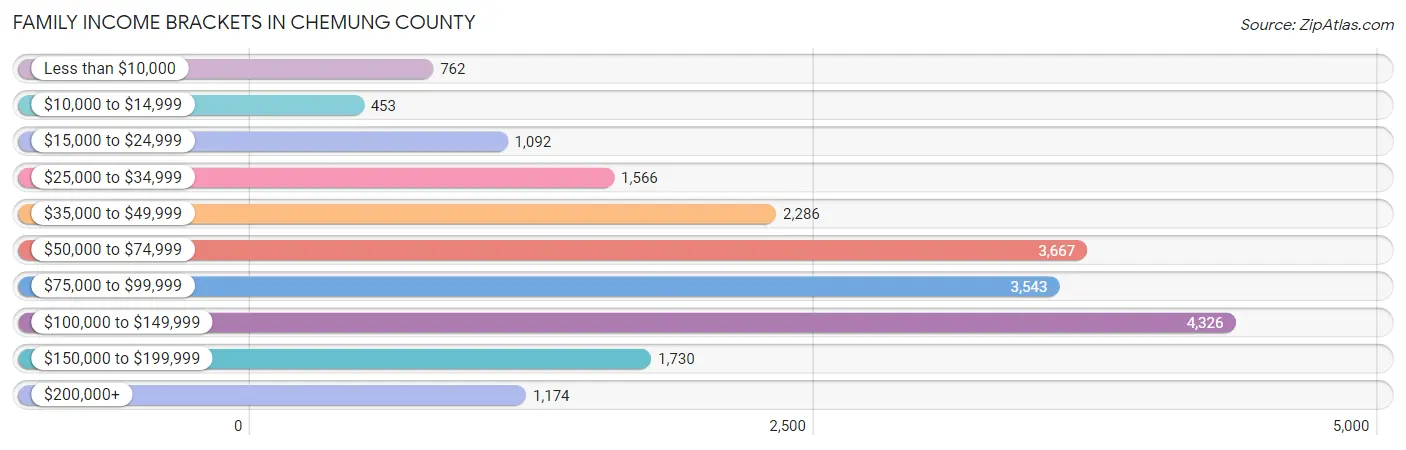
| Income Bracket | # Families | % Families |
| Less than $10,000 | 762 | 3.7% |
| $10,000 to $14,999 | 453 | 2.2% |
| $15,000 to $24,999 | 1,092 | 5.3% |
| $25,000 to $34,999 | 1,566 | 7.6% |
| $35,000 to $49,999 | 2,286 | 11.1% |
| $50,000 to $74,999 | 3,667 | 17.8% |
| $75,000 to $99,999 | 3,543 | 17.2% |
| $100,000 to $149,999 | 4,326 | 21.0% |
| $150,000 to $199,999 | 1,730 | 8.4% |
| $200,000+ | 1,174 | 5.7% |
Family Income by Famaliy Size in Chemung County
4-person families (3,148 | 15.3%) account for the highest median family income in Chemung County with $101,735 per family, while 2-person families (11,021 | 53.5%) have the highest median income of $35,668 per family member.
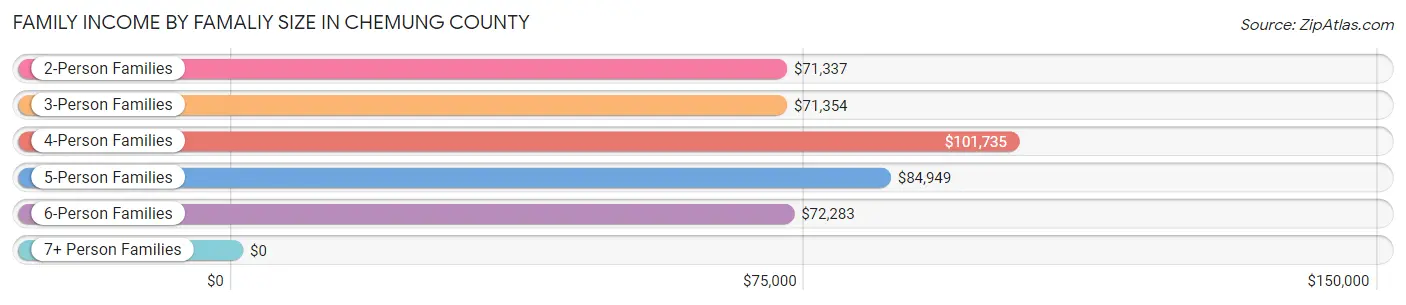
| Income Bracket | # Families | Median Income |
| 2-Person Families | 11,021 (53.5%) | $71,337 |
| 3-Person Families | 4,162 (20.2%) | $71,354 |
| 4-Person Families | 3,148 (15.3%) | $101,735 |
| 5-Person Families | 1,531 (7.4%) | $84,949 |
| 6-Person Families | 534 (2.6%) | $72,283 |
| 7+ Person Families | 203 (1.0%) | $0 |
| Total | 20,599 (100.0%) | $77,618 |
Family Income by Number of Earners in Chemung County
The median family income in Chemung County is $77,618, with families comprising 3+ earners (1,759) having the highest median family income of $130,208, while families with no earners (3,969) have the lowest median family income of $45,636, accounting for 8.5% and 19.3% of families, respectively.
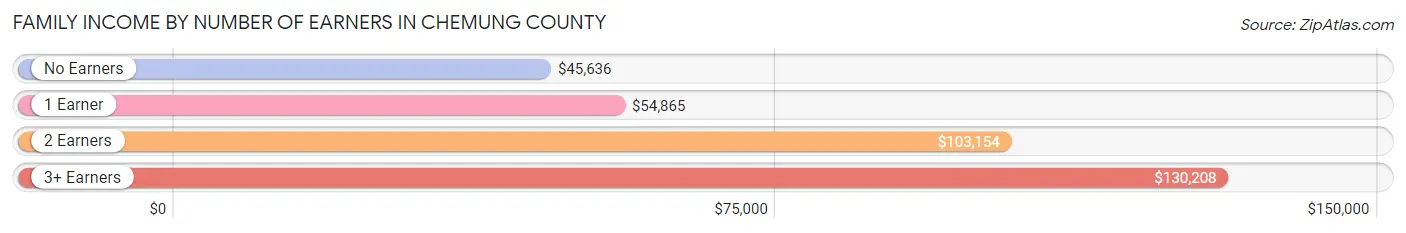
| Number of Earners | # Families | Median Income |
| No Earners | 3,969 (19.3%) | $45,636 |
| 1 Earner | 7,060 (34.3%) | $54,865 |
| 2 Earners | 7,811 (37.9%) | $103,154 |
| 3+ Earners | 1,759 (8.5%) | $130,208 |
| Total | 20,599 (100.0%) | $77,618 |
Household Income in Chemung County
Household Income Brackets in Chemung County
With 6,538 households falling in the category, the $50,000 to $74,999 income range is the most frequent in Chemung County, accounting for 18.8% of all households. In contrast, only 1,600 households (4.6%) fall into the $200,000+ income bracket, making it the least populous group.
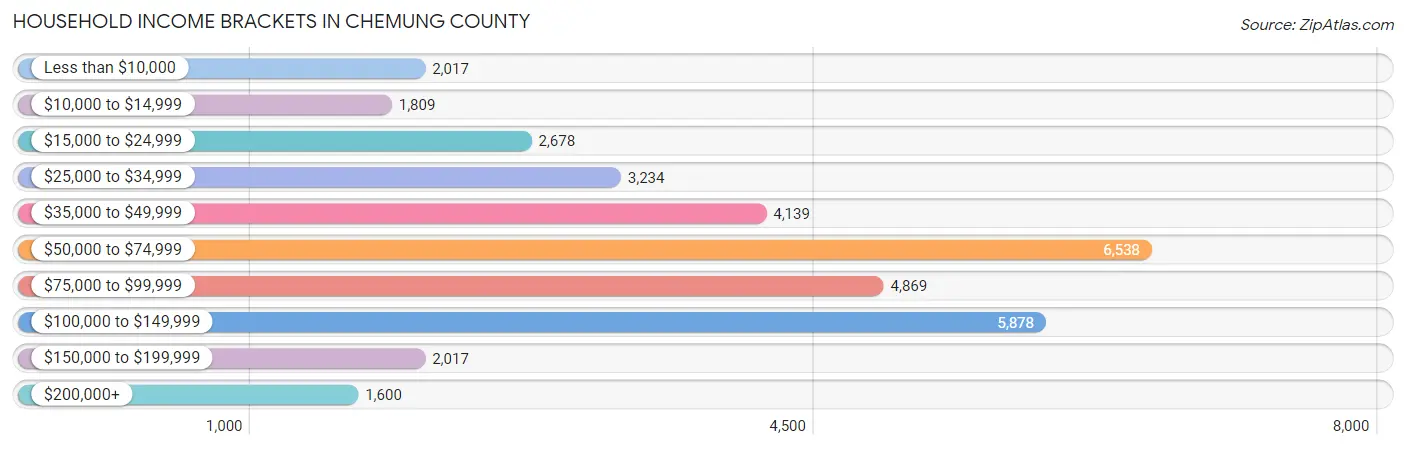
| Income Bracket | # Households | % Households |
| Less than $10,000 | 2,017 | 5.8% |
| $10,000 to $14,999 | 1,809 | 5.2% |
| $15,000 to $24,999 | 2,678 | 7.7% |
| $25,000 to $34,999 | 3,234 | 9.3% |
| $35,000 to $49,999 | 4,139 | 11.9% |
| $50,000 to $74,999 | 6,538 | 18.8% |
| $75,000 to $99,999 | 4,869 | 14.0% |
| $100,000 to $149,999 | 5,878 | 16.9% |
| $150,000 to $199,999 | 2,017 | 5.8% |
| $200,000+ | 1,600 | 4.6% |
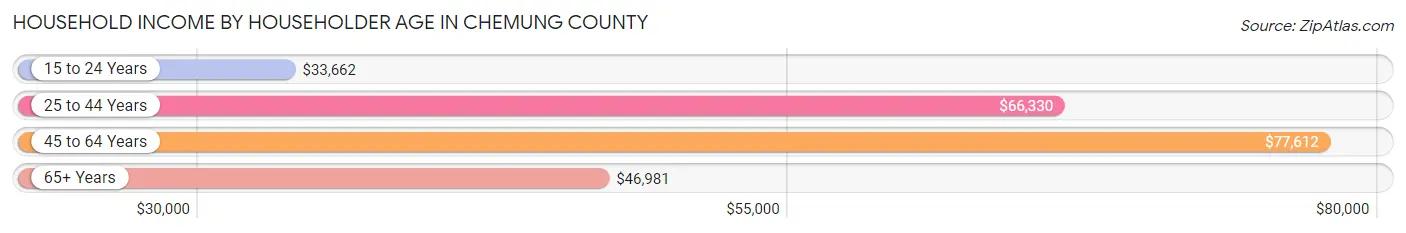
Household Income by Householder Age in Chemung County
The median household income in Chemung County is $61,358, with the highest median household income of $77,612 found in the 45 to 64 years age bracket for the primary householder. A total of 12,838 households (36.9%) fall into this category. Meanwhile, the 15 to 24 years age bracket for the primary householder has the lowest median household income of $33,662, with 1,049 households (3.0%) in this group.
| Income Bracket | # Households | Median Income |
| 15 to 24 Years | 1,049 (3.0%) | $33,662 |
| 25 to 44 Years | 10,382 (29.8%) | $66,330 |
| 45 to 64 Years | 12,838 (36.9%) | $77,612 |
| 65+ Years | 10,510 (30.2%) | $46,981 |
| Total | 34,779 (100.0%) | $61,358 |
Poverty in Chemung County
Income Below Poverty by Sex and Age in Chemung County
With 13.8% poverty level for males and 16.5% for females among the residents of Chemung County, 12 to 14 year old males and 5 year old females are the most vulnerable to poverty, with 372 males (25.1%) and 176 females (41.7%) in their respective age groups living below the poverty level.
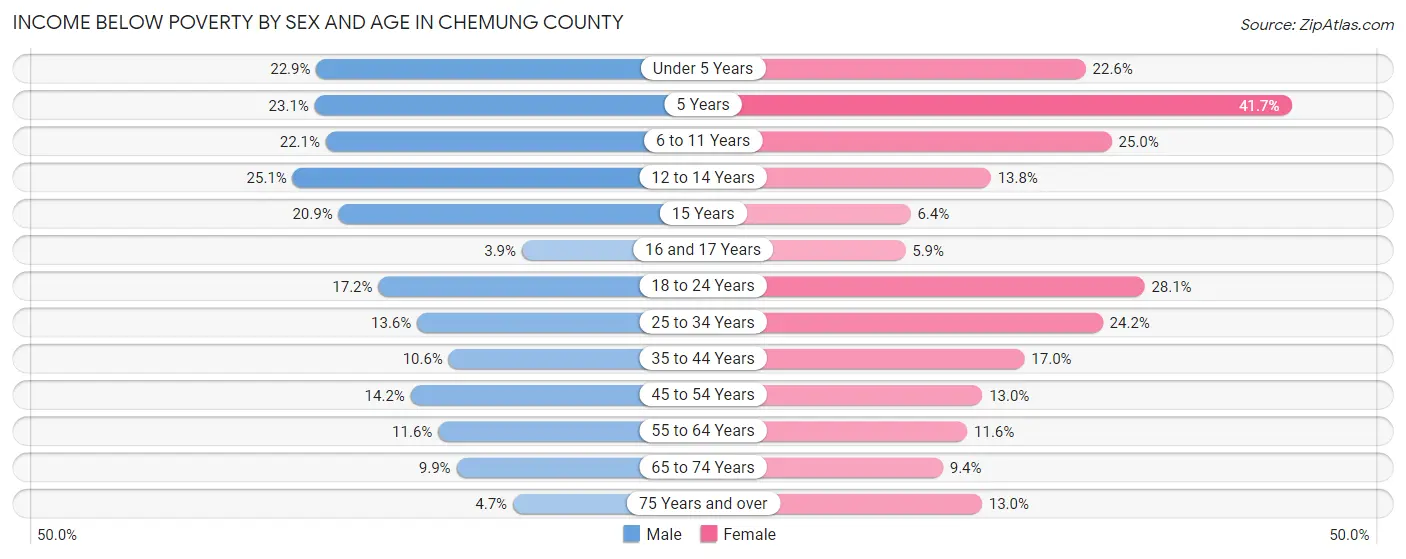
| Age Bracket | Male | Female |
| Under 5 Years | 463 (22.9%) | 500 (22.6%) |
| 5 Years | 102 (23.1%) | 176 (41.7%) |
| 6 to 11 Years | 709 (22.1%) | 626 (25.0%) |
| 12 to 14 Years | 372 (25.1%) | 231 (13.8%) |
| 15 Years | 86 (20.9%) | 30 (6.4%) |
| 16 and 17 Years | 43 (3.8%) | 66 (5.9%) |
| 18 to 24 Years | 542 (17.2%) | 788 (28.1%) |
| 25 to 34 Years | 714 (13.6%) | 1,158 (24.2%) |
| 35 to 44 Years | 467 (10.6%) | 795 (17.0%) |
| 45 to 54 Years | 680 (14.2%) | 668 (13.0%) |
| 55 to 64 Years | 663 (11.6%) | 714 (11.6%) |
| 65 to 74 Years | 437 (9.9%) | 461 (9.4%) |
| 75 Years and over | 128 (4.7%) | 499 (13.0%) |
| Total | 5,406 (13.8%) | 6,712 (16.5%) |
Income Above Poverty by Sex and Age in Chemung County
According to the poverty statistics in Chemung County, males aged 16 and 17 years and females aged 16 and 17 years are the age groups that are most secure financially, with 96.2% of males and 94.1% of females in these age groups living above the poverty line.
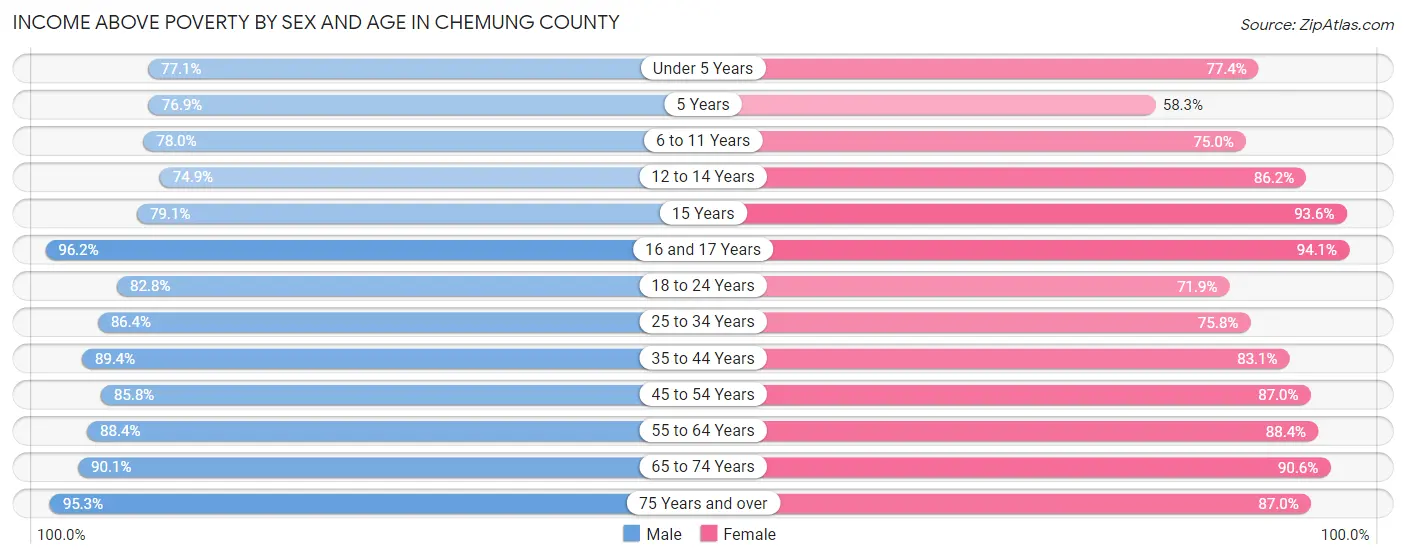
| Age Bracket | Male | Female |
| Under 5 Years | 1,556 (77.1%) | 1,709 (77.4%) |
| 5 Years | 340 (76.9%) | 246 (58.3%) |
| 6 to 11 Years | 2,507 (77.9%) | 1,874 (75.0%) |
| 12 to 14 Years | 1,109 (74.9%) | 1,440 (86.2%) |
| 15 Years | 326 (79.1%) | 441 (93.6%) |
| 16 and 17 Years | 1,073 (96.2%) | 1,054 (94.1%) |
| 18 to 24 Years | 2,615 (82.8%) | 2,017 (71.9%) |
| 25 to 34 Years | 4,549 (86.4%) | 3,625 (75.8%) |
| 35 to 44 Years | 3,923 (89.4%) | 3,895 (83.1%) |
| 45 to 54 Years | 4,119 (85.8%) | 4,459 (87.0%) |
| 55 to 64 Years | 5,043 (88.4%) | 5,426 (88.4%) |
| 65 to 74 Years | 3,968 (90.1%) | 4,458 (90.6%) |
| 75 Years and over | 2,608 (95.3%) | 3,342 (87.0%) |
| Total | 33,736 (86.2%) | 33,986 (83.5%) |
Income Below Poverty Among Married-Couple Families in Chemung County
The poverty statistics for married-couple families in Chemung County show that 4.3% or 638 of the total 14,664 families live below the poverty line. Families with 5 or more children have the highest poverty rate of 65.3%, comprising of 62 families. On the other hand, families with no children have the lowest poverty rate of 3.0%, which includes 275 families.
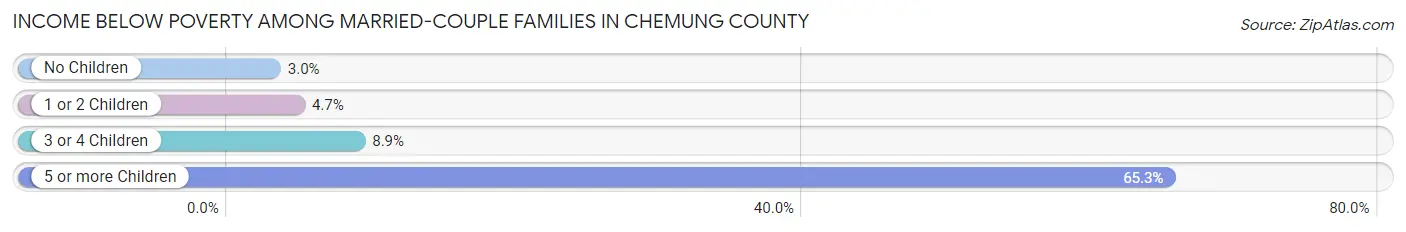
| Children | Above Poverty | Below Poverty |
| No Children | 8,945 (97.0%) | 275 (3.0%) |
| 1 or 2 Children | 3,927 (95.3%) | 192 (4.7%) |
| 3 or 4 Children | 1,121 (91.1%) | 109 (8.9%) |
| 5 or more Children | 33 (34.7%) | 62 (65.3%) |
| Total | 14,026 (95.7%) | 638 (4.3%) |
Income Below Poverty Among Single-Parent Households in Chemung County
According to the poverty data in Chemung County, 21.1% or 373 single-father households and 28.5% or 1,189 single-mother households are living below the poverty line. Among single-father households, those with 5 or more children have the highest poverty rate, with 21 households (100.0%) experiencing poverty. Likewise, among single-mother households, those with 5 or more children have the highest poverty rate, with 72 households (76.6%) falling below the poverty line.
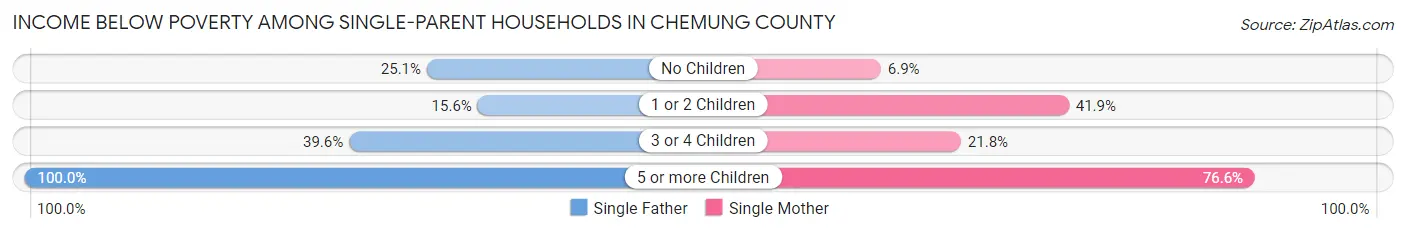
| Children | Single Father | Single Mother |
| No Children | 153 (25.1%) | 102 (6.9%) |
| 1 or 2 Children | 163 (15.6%) | 932 (41.9%) |
| 3 or 4 Children | 36 (39.6%) | 83 (21.8%) |
| 5 or more Children | 21 (100.0%) | 72 (76.6%) |
| Total | 373 (21.1%) | 1,189 (28.5%) |
Income Below Poverty Among Married-Couple vs Single-Parent Households in Chemung County
The poverty data for Chemung County shows that 638 of the married-couple family households (4.3%) and 1,562 of the single-parent households (26.3%) are living below the poverty level. Within the married-couple family households, those with 5 or more children have the highest poverty rate, with 62 households (65.3%) falling below the poverty line. Among the single-parent households, those with 5 or more children have the highest poverty rate, with 93 household (80.9%) living below poverty.
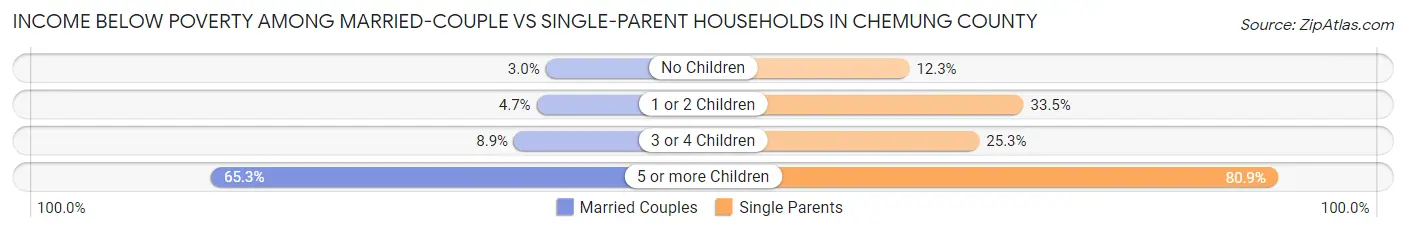
| Children | Married-Couple Families | Single-Parent Households |
| No Children | 275 (3.0%) | 255 (12.2%) |
| 1 or 2 Children | 192 (4.7%) | 1,095 (33.5%) |
| 3 or 4 Children | 109 (8.9%) | 119 (25.3%) |
| 5 or more Children | 62 (65.3%) | 93 (80.9%) |
| Total | 638 (4.3%) | 1,562 (26.3%) |
Race in Chemung County
The most populous races in Chemung County are White / Caucasian (71,833 | 85.9%), Two or more Races (4,863 | 5.8%), and Black / African American (4,470 | 5.3%).
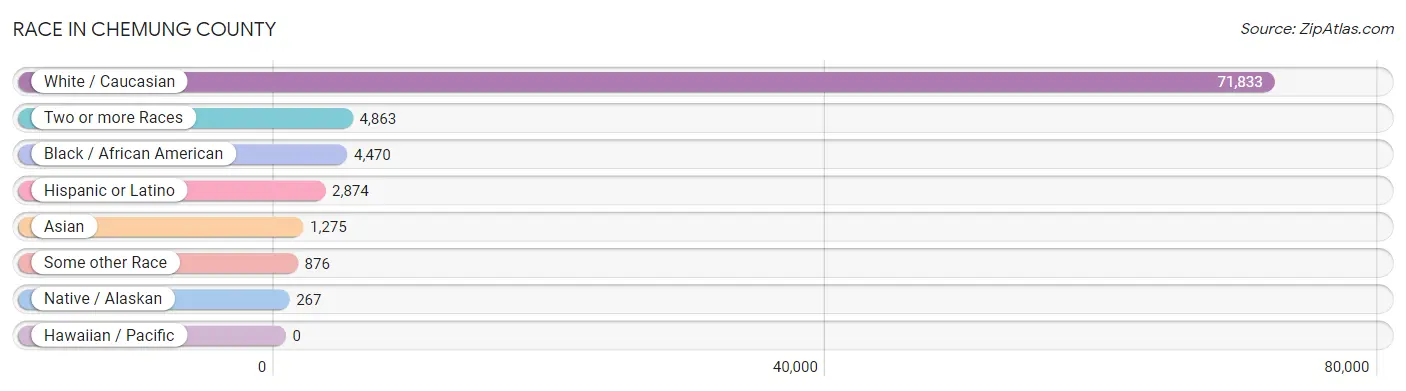
| Race | # Population | % Population |
| Asian | 1,275 | 1.5% |
| Black / African American | 4,470 | 5.3% |
| Hawaiian / Pacific | 0 | 0.0% |
| Hispanic or Latino | 2,874 | 3.4% |
| Native / Alaskan | 267 | 0.3% |
| White / Caucasian | 71,833 | 85.9% |
| Two or more Races | 4,863 | 5.8% |
| Some other Race | 876 | 1.1% |
| Total | 83,584 | 100.0% |
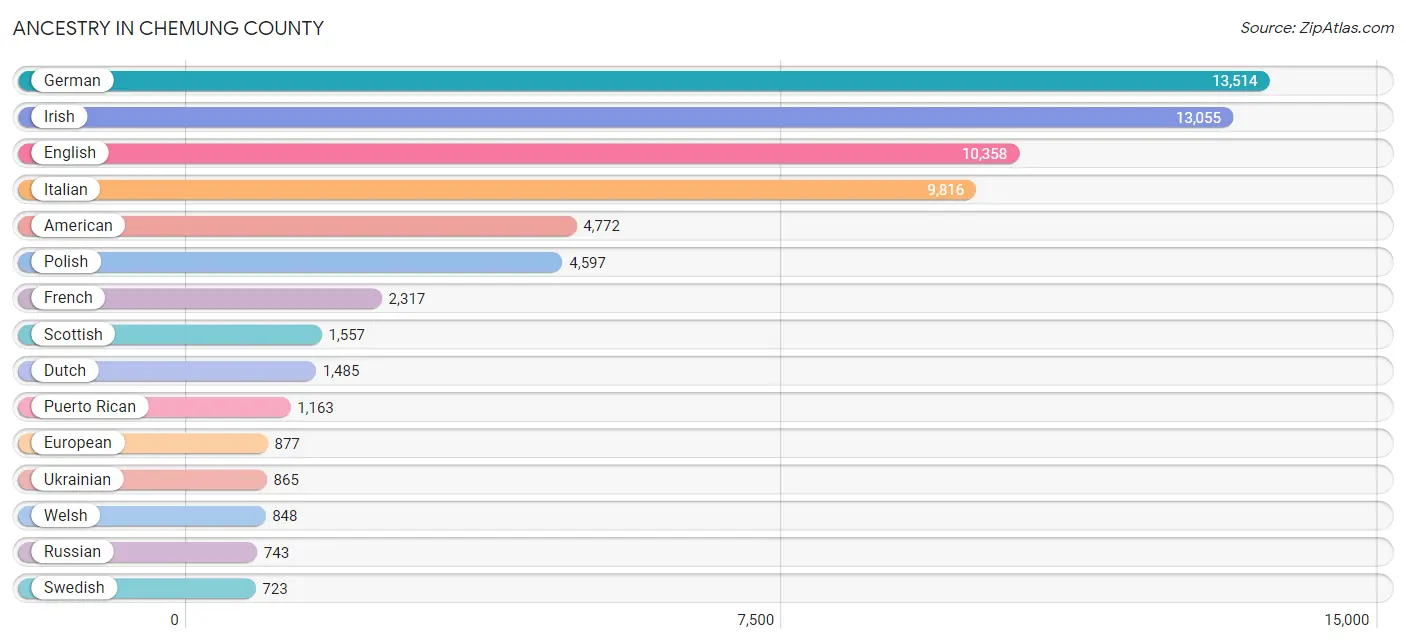
Ancestry in Chemung County
The most populous ancestries reported in Chemung County are German (13,514 | 16.2%), Irish (13,055 | 15.6%), English (10,358 | 12.4%), Italian (9,816 | 11.7%), and American (4,772 | 5.7%), together accounting for 61.6% of all Chemung County residents.
| Ancestry | # Population | % Population |
| African | 275 | 0.3% |
| Albanian | 28 | 0.0% |
| American | 4,772 | 5.7% |
| Apache | 2 | 0.0% |
| Arab | 332 | 0.4% |
| Argentinean | 70 | 0.1% |
| Armenian | 204 | 0.2% |
| Austrian | 284 | 0.3% |
| Barbadian | 13 | 0.0% |
| Belgian | 26 | 0.0% |
| Bhutanese | 146 | 0.2% |
| Blackfeet | 40 | 0.1% |
| Brazilian | 39 | 0.1% |
| British | 545 | 0.6% |
| British West Indian | 15 | 0.0% |
| Burmese | 295 | 0.4% |
| Canadian | 148 | 0.2% |
| Celtic | 18 | 0.0% |
| Central American | 43 | 0.1% |
| Central American Indian | 18 | 0.0% |
| Cherokee | 59 | 0.1% |
| Chilean | 6 | 0.0% |
| Colombian | 177 | 0.2% |
| Costa Rican | 3 | 0.0% |
| Cree | 2 | 0.0% |
| Croatian | 27 | 0.0% |
| Crow | 6 | 0.0% |
| Cuban | 40 | 0.1% |
| Czech | 407 | 0.5% |
| Czechoslovakian | 191 | 0.2% |
| Danish | 156 | 0.2% |
| Delaware | 9 | 0.0% |
| Dominican | 96 | 0.1% |
| Dutch | 1,485 | 1.8% |
| Eastern European | 212 | 0.3% |
| Ecuadorian | 69 | 0.1% |
| Egyptian | 16 | 0.0% |
| English | 10,358 | 12.4% |
| Estonian | 35 | 0.0% |
| European | 877 | 1.1% |
| Filipino | 18 | 0.0% |
| Finnish | 320 | 0.4% |
| French | 2,317 | 2.8% |
| French American Indian | 8 | 0.0% |
| French Canadian | 469 | 0.6% |
| German | 13,514 | 16.2% |
| German Russian | 16 | 0.0% |
| Greek | 64 | 0.1% |
| Guatemalan | 3 | 0.0% |
| Haitian | 32 | 0.0% |
| Honduran | 2 | 0.0% |
| Hungarian | 400 | 0.5% |
| Icelander | 25 | 0.0% |
| Indian (Asian) | 655 | 0.8% |
| Irish | 13,055 | 15.6% |
| Iroquois | 96 | 0.1% |
| Israeli | 71 | 0.1% |
| Italian | 9,816 | 11.7% |
| Jamaican | 209 | 0.3% |
| Korean | 124 | 0.2% |
| Latvian | 11 | 0.0% |
| Lebanese | 278 | 0.3% |
| Lithuanian | 434 | 0.5% |
| Luxembourger | 15 | 0.0% |
| Mexican | 648 | 0.8% |
| Mexican American Indian | 187 | 0.2% |
| Native Hawaiian | 13 | 0.0% |
| Navajo | 19 | 0.0% |
| New Zealander | 49 | 0.1% |
| Nicaraguan | 1 | 0.0% |
| Nigerian | 53 | 0.1% |
| Northern European | 117 | 0.1% |
| Norwegian | 408 | 0.5% |
| Pakistani | 45 | 0.1% |
| Panamanian | 20 | 0.0% |
| Pennsylvania German | 351 | 0.4% |
| Peruvian | 153 | 0.2% |
| Polish | 4,597 | 5.5% |
| Portuguese | 79 | 0.1% |
| Puerto Rican | 1,163 | 1.4% |
| Romanian | 26 | 0.0% |
| Russian | 743 | 0.9% |
| Salvadoran | 14 | 0.0% |
| Scandinavian | 206 | 0.3% |
| Scotch-Irish | 298 | 0.4% |
| Scottish | 1,557 | 1.9% |
| Serbian | 15 | 0.0% |
| Sioux | 6 | 0.0% |
| Slavic | 12 | 0.0% |
| Slovak | 153 | 0.2% |
| Slovene | 70 | 0.1% |
| South American | 475 | 0.6% |
| Spaniard | 19 | 0.0% |
| Spanish | 72 | 0.1% |
| Sri Lankan | 84 | 0.1% |
| Subsaharan African | 347 | 0.4% |
| Swedish | 723 | 0.9% |
| Swiss | 195 | 0.2% |
| Syrian | 23 | 0.0% |
| Thai | 162 | 0.2% |
| Trinidadian and Tobagonian | 5 | 0.0% |
| Turkish | 101 | 0.1% |
| Ukrainian | 865 | 1.0% |
| Welsh | 848 | 1.0% |
| West Indian | 17 | 0.0% |
| Yugoslavian | 115 | 0.1% | View All 106 Rows |
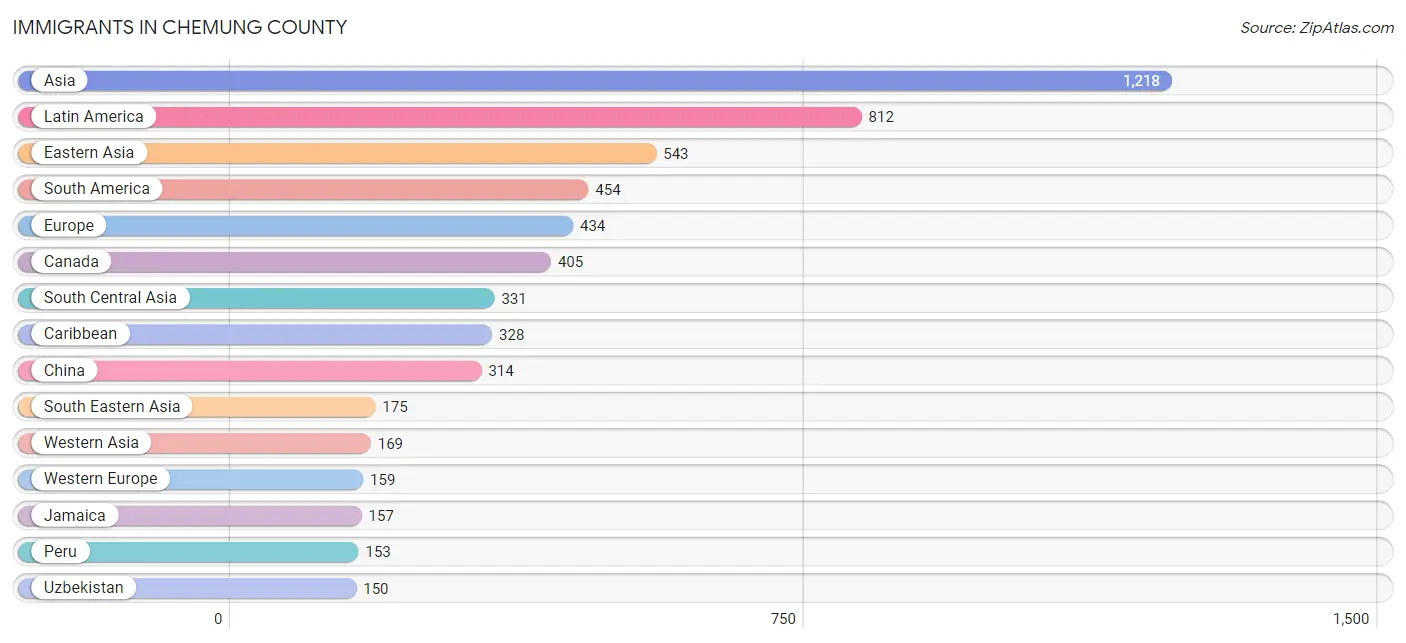
Immigrants in Chemung County
The most numerous immigrant groups reported in Chemung County came from Asia (1,218 | 1.5%), Latin America (812 | 1.0%), Eastern Asia (543 | 0.6%), South America (454 | 0.5%), and Europe (434 | 0.5%), together accounting for 4.1% of all Chemung County residents.
| Immigration Origin | # Population | % Population |
| Africa | 21 | 0.0% |
| Albania | 5 | 0.0% |
| Argentina | 70 | 0.1% |
| Asia | 1,218 | 1.5% |
| Australia | 15 | 0.0% |
| Austria | 8 | 0.0% |
| Barbados | 13 | 0.0% |
| Bosnia and Herzegovina | 15 | 0.0% |
| Brazil | 30 | 0.0% |
| Canada | 405 | 0.5% |
| Caribbean | 328 | 0.4% |
| Central America | 30 | 0.0% |
| Chile | 6 | 0.0% |
| China | 314 | 0.4% |
| Colombia | 137 | 0.2% |
| Cuba | 12 | 0.0% |
| Dominican Republic | 56 | 0.1% |
| Eastern Asia | 543 | 0.6% |
| Eastern Europe | 143 | 0.2% |
| Ecuador | 58 | 0.1% |
| El Salvador | 9 | 0.0% |
| England | 2 | 0.0% |
| Europe | 434 | 0.5% |
| France | 31 | 0.0% |
| Germany | 96 | 0.1% |
| Guatemala | 10 | 0.0% |
| Haiti | 19 | 0.0% |
| Honduras | 2 | 0.0% |
| Hong Kong | 68 | 0.1% |
| India | 59 | 0.1% |
| Israel | 38 | 0.1% |
| Italy | 130 | 0.2% |
| Jamaica | 157 | 0.2% |
| Japan | 81 | 0.1% |
| Korea | 148 | 0.2% |
| Latin America | 812 | 1.0% |
| Mexico | 9 | 0.0% |
| Moldova | 44 | 0.1% |
| Netherlands | 7 | 0.0% |
| North Macedonia | 16 | 0.0% |
| Northern Africa | 8 | 0.0% |
| Northern Europe | 2 | 0.0% |
| Oceania | 30 | 0.0% |
| Pakistan | 75 | 0.1% |
| Peru | 153 | 0.2% |
| Philippines | 95 | 0.1% |
| Russia | 17 | 0.0% |
| Saudi Arabia | 8 | 0.0% |
| South Africa | 8 | 0.0% |
| South America | 454 | 0.5% |
| South Central Asia | 331 | 0.4% |
| South Eastern Asia | 175 | 0.2% |
| Southern Europe | 130 | 0.2% |
| Taiwan | 85 | 0.1% |
| Thailand | 59 | 0.1% |
| Trinidad and Tobago | 34 | 0.0% |
| Turkey | 99 | 0.1% |
| Ukraine | 46 | 0.1% |
| Uzbekistan | 150 | 0.2% |
| Vietnam | 21 | 0.0% |
| Western Asia | 169 | 0.2% |
| Western Europe | 159 | 0.2% | View All 62 Rows |
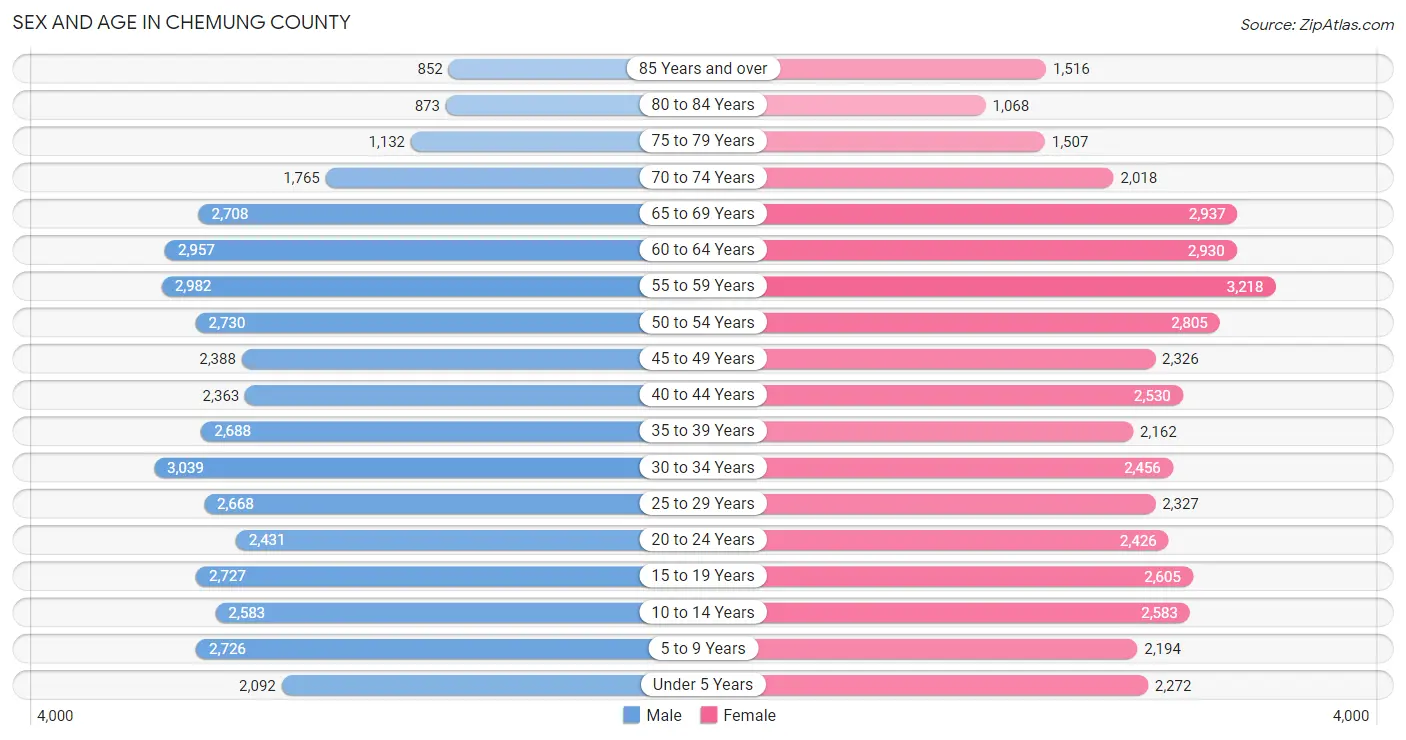
Sex and Age in Chemung County
Sex and Age in Chemung County
The most populous age groups in Chemung County are 30 to 34 Years (3,039 | 7.3%) for men and 55 to 59 Years (3,218 | 7.7%) for women.
| Age Bracket | Male | Female |
| Under 5 Years | 2,092 (5.0%) | 2,272 (5.4%) |
| 5 to 9 Years | 2,726 (6.5%) | 2,194 (5.2%) |
| 10 to 14 Years | 2,583 (6.2%) | 2,583 (6.2%) |
| 15 to 19 Years | 2,727 (6.5%) | 2,605 (6.2%) |
| 20 to 24 Years | 2,431 (5.8%) | 2,426 (5.8%) |
| 25 to 29 Years | 2,668 (6.4%) | 2,327 (5.6%) |
| 30 to 34 Years | 3,039 (7.3%) | 2,456 (5.9%) |
| 35 to 39 Years | 2,688 (6.5%) | 2,162 (5.2%) |
| 40 to 44 Years | 2,363 (5.7%) | 2,530 (6.0%) |
| 45 to 49 Years | 2,388 (5.7%) | 2,326 (5.6%) |
| 50 to 54 Years | 2,730 (6.6%) | 2,805 (6.7%) |
| 55 to 59 Years | 2,982 (7.1%) | 3,218 (7.7%) |
| 60 to 64 Years | 2,957 (7.1%) | 2,930 (7.0%) |
| 65 to 69 Years | 2,708 (6.5%) | 2,937 (7.0%) |
| 70 to 74 Years | 1,765 (4.2%) | 2,018 (4.8%) |
| 75 to 79 Years | 1,132 (2.7%) | 1,507 (3.6%) |
| 80 to 84 Years | 873 (2.1%) | 1,068 (2.5%) |
| 85 Years and over | 852 (2.0%) | 1,516 (3.6%) |
| Total | 41,704 (100.0%) | 41,880 (100.0%) |
Families and Households in Chemung County
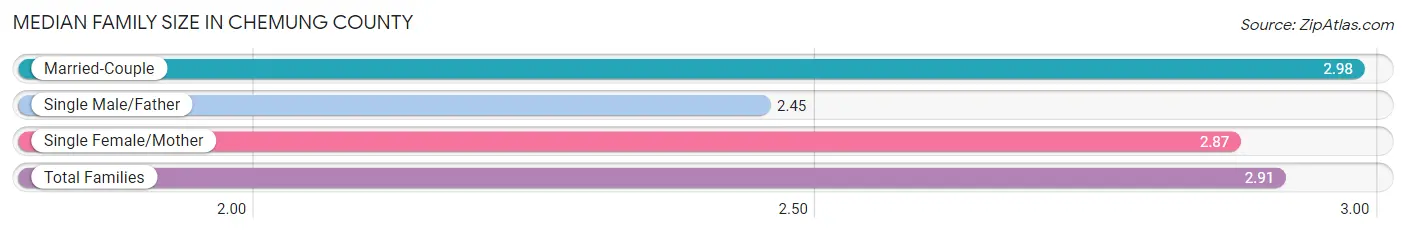
Median Family Size in Chemung County
The median family size in Chemung County is 2.91 persons per family, with married-couple families (14,664 | 71.2%) accounting for the largest median family size of 2.98 persons per family. On the other hand, single male/father families (1,766 | 8.6%) represent the smallest median family size with 2.45 persons per family.
| Family Type | # Families | Family Size |
| Married-Couple | 14,664 (71.2%) | 2.98 |
| Single Male/Father | 1,766 (8.6%) | 2.45 |
| Single Female/Mother | 4,169 (20.2%) | 2.87 |
| Total Families | 20,599 (100.0%) | 2.91 |
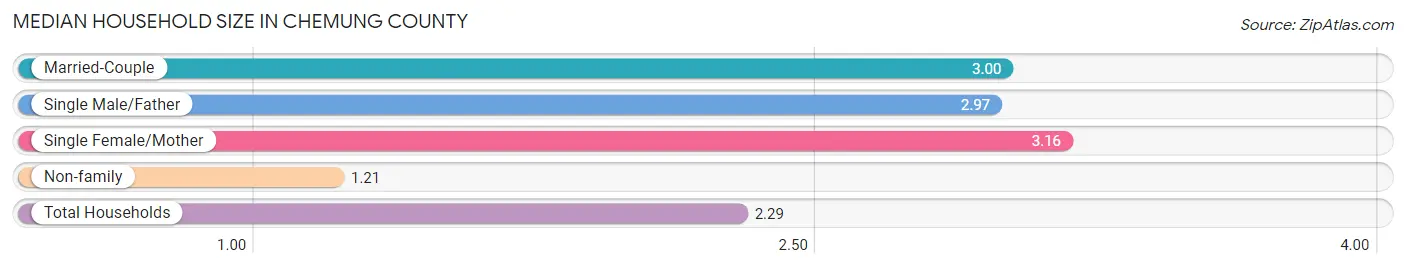
Median Household Size in Chemung County
The median household size in Chemung County is 2.29 persons per household, with single female/mother households (4,169 | 12.0%) accounting for the largest median household size of 3.16 persons per household. non-family households (14,180 | 40.8%) represent the smallest median household size with 1.21 persons per household.
| Household Type | # Households | Household Size |
| Married-Couple | 14,664 (42.2%) | 3.00 |
| Single Male/Father | 1,766 (5.1%) | 2.97 |
| Single Female/Mother | 4,169 (12.0%) | 3.16 |
| Non-family | 14,180 (40.8%) | 1.21 |
| Total Households | 34,779 (100.0%) | 2.29 |
Household Size by Marriage Status in Chemung County
Out of a total of 34,779 households in Chemung County, 20,599 (59.2%) are family households, while 14,180 (40.8%) are nonfamily households. The most numerous type of family households are 2-person households, comprising 10,134, and the most common type of nonfamily households are 1-person households, comprising 11,755.
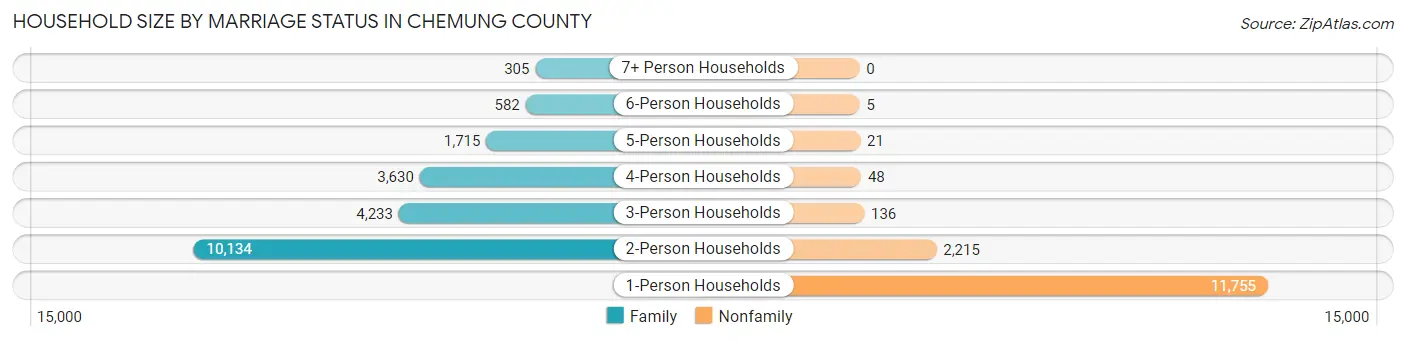
| Household Size | Family Households | Nonfamily Households |
| 1-Person Households | - | 11,755 (33.8%) |
| 2-Person Households | 10,134 (29.1%) | 2,215 (6.4%) |
| 3-Person Households | 4,233 (12.2%) | 136 (0.4%) |
| 4-Person Households | 3,630 (10.4%) | 48 (0.1%) |
| 5-Person Households | 1,715 (4.9%) | 21 (0.1%) |
| 6-Person Households | 582 (1.7%) | 5 (0.0%) |
| 7+ Person Households | 305 (0.9%) | 0 (0.0%) |
| Total | 20,599 (59.2%) | 14,180 (40.8%) |
Female Fertility in Chemung County
Fertility by Age in Chemung County
Average fertility rate in Chemung County is 58.0 births per 1,000 women. Women in the age bracket of 20 to 34 years have the highest fertility rate with 117.0 births per 1,000 women. Women in the age bracket of 20 to 34 years acount for 83.7% of all women with births.
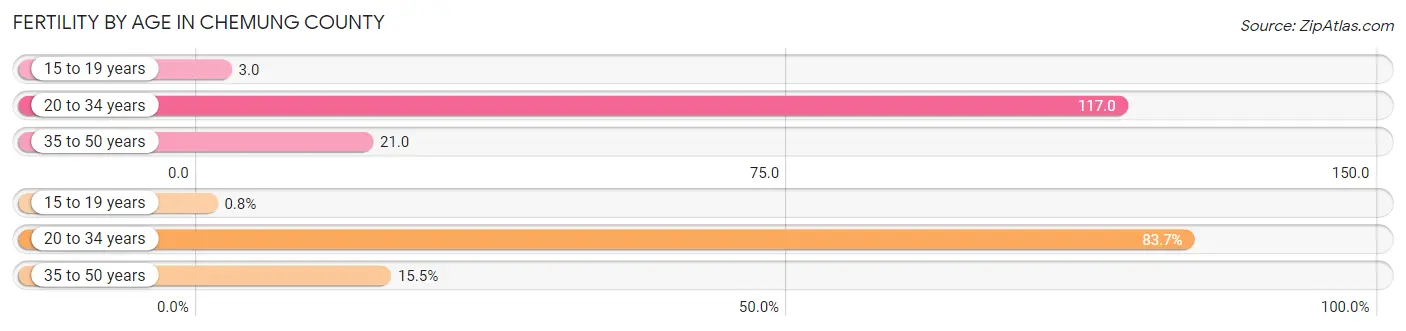
| Age Bracket | Women with Births | Births / 1,000 Women |
| 15 to 19 years | 8 (0.8%) | 3.0 |
| 20 to 34 years | 841 (83.7%) | 117.0 |
| 35 to 50 years | 156 (15.5%) | 21.0 |
| Total | 1,005 (100.0%) | 58.0 |
Fertility by Age by Marriage Status in Chemung County
59.8% of women with births (1,005) in Chemung County are married. The highest percentage of unmarried women with births falls into 15 to 19 years age bracket with 100.0% of them unmarried at the time of birth, while the lowest percentage of unmarried women with births belong to 35 to 50 years age bracket with 10.3% of them unmarried.
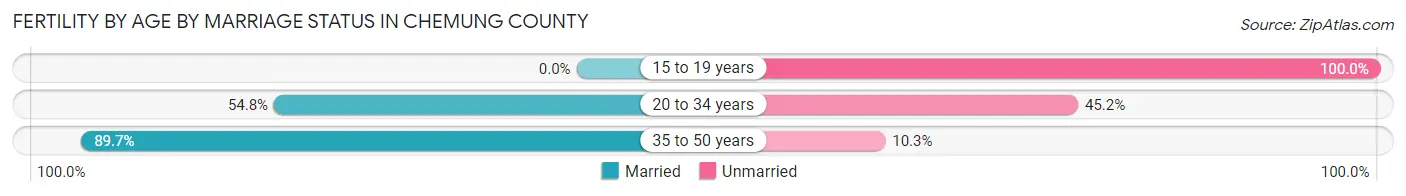
| Age Bracket | Married | Unmarried |
| 15 to 19 years | 0 (0.0%) | 8 (100.0%) |
| 20 to 34 years | 461 (54.8%) | 380 (45.2%) |
| 35 to 50 years | 140 (89.7%) | 16 (10.3%) |
| Total | 601 (59.8%) | 404 (40.2%) |
Fertility by Education in Chemung County
Average fertility rate in Chemung County is 58.0 births per 1,000 women. Women with the education attainment of graduate degree have the highest fertility rate of 67.0 births per 1,000 women, while women with the education attainment of less than high school have the lowest fertility at 44.0 births per 1,000 women. Women with the education attainment of college or associate's degree represent 33.6% of all women with births.
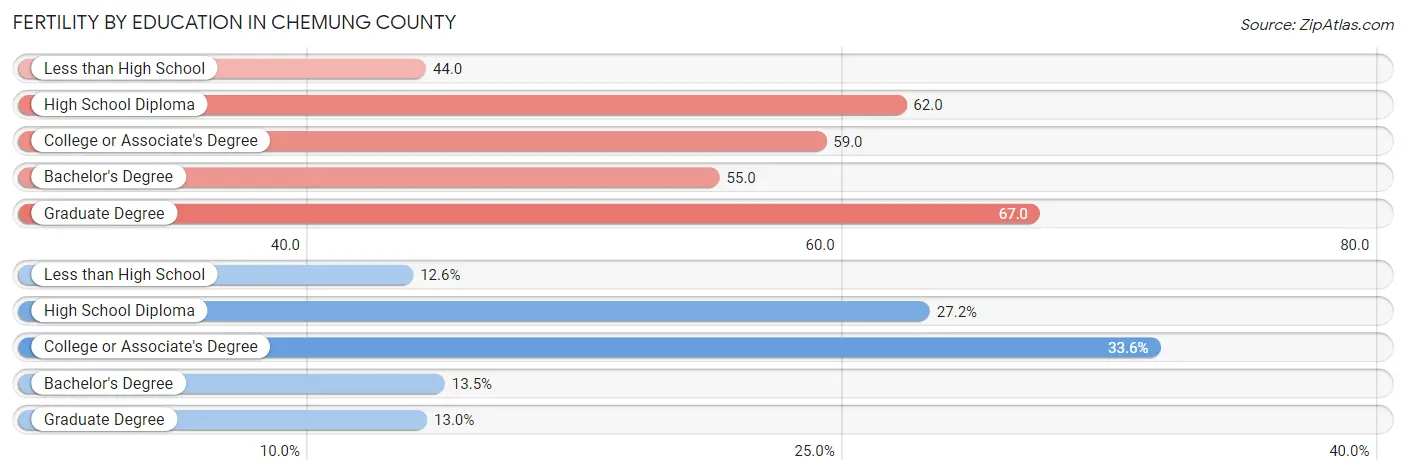
| Educational Attainment | Women with Births | Births / 1,000 Women |
| Less than High School | 127 (12.6%) | 44.0 |
| High School Diploma | 273 (27.2%) | 62.0 |
| College or Associate's Degree | 338 (33.6%) | 59.0 |
| Bachelor's Degree | 136 (13.5%) | 55.0 |
| Graduate Degree | 131 (13.0%) | 67.0 |
| Total | 1,005 (100.0%) | 58.0 |
Fertility by Education by Marriage Status in Chemung County
40.2% of women with births in Chemung County are unmarried. Women with the educational attainment of bachelor's degree are most likely to be married with 100.0% of them married at childbirth, while women with the educational attainment of high school diploma are least likely to be married with 71.1% of them unmarried at childbirth.
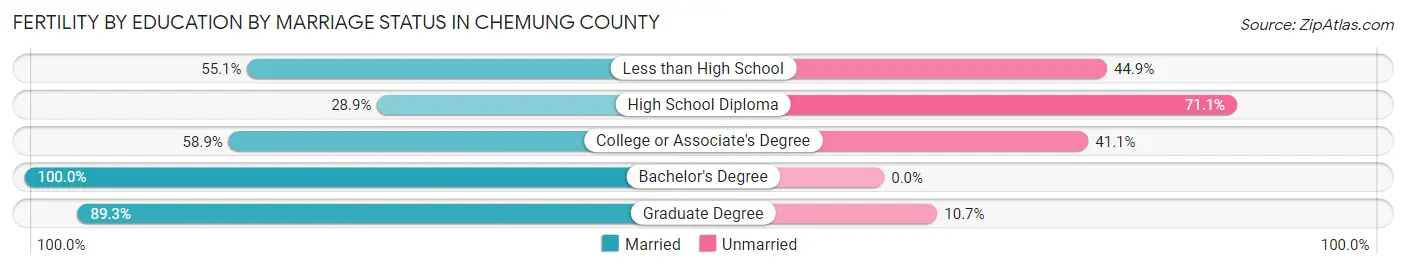
| Educational Attainment | Married | Unmarried |
| Less than High School | 70 (55.1%) | 57 (44.9%) |
| High School Diploma | 79 (28.9%) | 194 (71.1%) |
| College or Associate's Degree | 199 (58.9%) | 139 (41.1%) |
| Bachelor's Degree | 136 (100.0%) | 0 (0.0%) |
| Graduate Degree | 117 (89.3%) | 14 (10.7%) |
| Total | 601 (59.8%) | 404 (40.2%) |
Employment Characteristics in Chemung County
Employment by Class of Employer in Chemung County
Among the 35,625 employed individuals in Chemung County, private company employees (21,687 | 60.9%), not-for-profit organizations (4,912 | 13.8%), and local government employees (3,656 | 10.3%) make up the most common classes of employment.
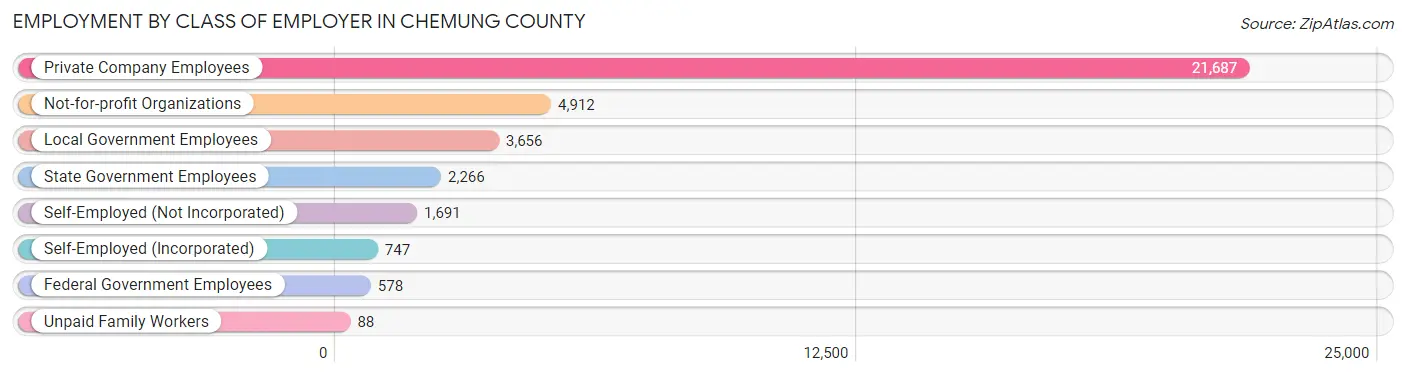
| Employer Class | # Employees | % Employees |
| Private Company Employees | 21,687 | 60.9% |
| Self-Employed (Incorporated) | 747 | 2.1% |
| Self-Employed (Not Incorporated) | 1,691 | 4.8% |
| Not-for-profit Organizations | 4,912 | 13.8% |
| Local Government Employees | 3,656 | 10.3% |
| State Government Employees | 2,266 | 6.4% |
| Federal Government Employees | 578 | 1.6% |
| Unpaid Family Workers | 88 | 0.3% |
| Total | 35,625 | 100.0% |
Employment Status by Age in Chemung County
According to the labor force statistics for Chemung County, out of the total population over 16 years of age (68,248), 57.5% or 39,243 individuals are in the labor force, with 6.3% or 2,472 of them unemployed. The age group with the highest labor force participation rate is 25 to 29 years, with 81.8% or 4,086 individuals in the labor force. Within the labor force, the 25 to 29 years age range has the highest percentage of unemployed individuals, with 15.0% or 613 of them being unemployed.
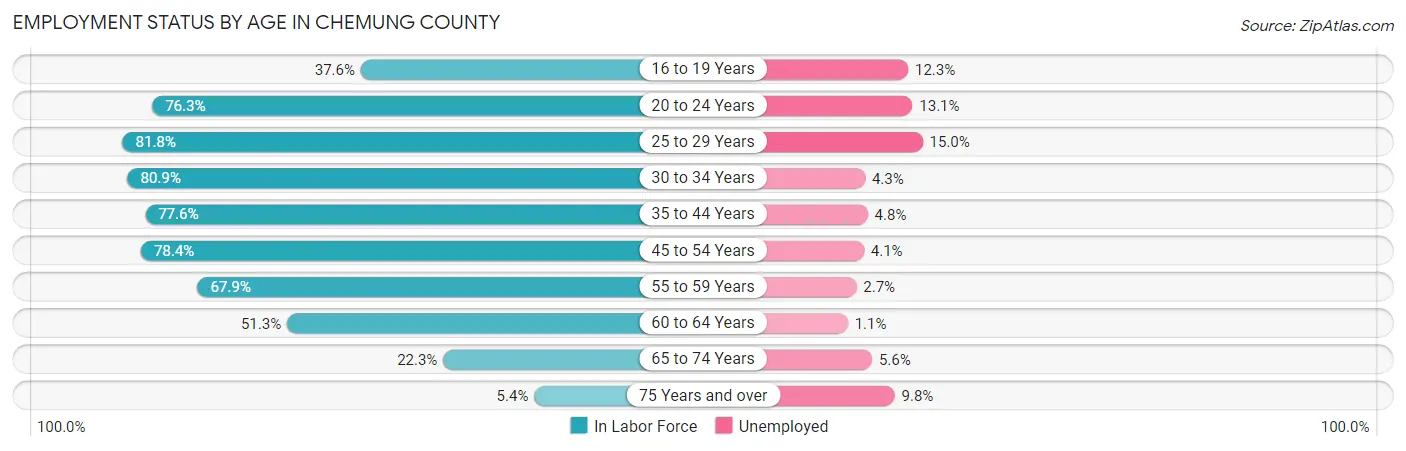
| Age Bracket | In Labor Force | Unemployed |
| 16 to 19 Years | 1,672 (37.6%) | 206 (12.3%) |
| 20 to 24 Years | 3,706 (76.3%) | 485 (13.1%) |
| 25 to 29 Years | 4,086 (81.8%) | 613 (15.0%) |
| 30 to 34 Years | 4,445 (80.9%) | 191 (4.3%) |
| 35 to 44 Years | 7,561 (77.6%) | 363 (4.8%) |
| 45 to 54 Years | 8,035 (78.4%) | 329 (4.1%) |
| 55 to 59 Years | 4,210 (67.9%) | 114 (2.7%) |
| 60 to 64 Years | 3,020 (51.3%) | 33 (1.1%) |
| 65 to 74 Years | 2,102 (22.3%) | 118 (5.6%) |
| 75 Years and over | 375 (5.4%) | 37 (9.8%) |
| Total | 39,243 (57.5%) | 2,472 (6.3%) |
Employment Status by Educational Attainment in Chemung County
According to labor force statistics for Chemung County, 73.7% of individuals (31,373) out of the total population between 25 and 64 years of age (42,569) are in the labor force, with 5.2% or 1,631 of them being unemployed. The group with the highest labor force participation rate are those with the educational attainment of bachelor's degree or higher, with 87.2% or 9,346 individuals in the labor force. Within the labor force, individuals with less than high school education have the highest percentage of unemployment, with 15.2% or 271 of them being unemployed.
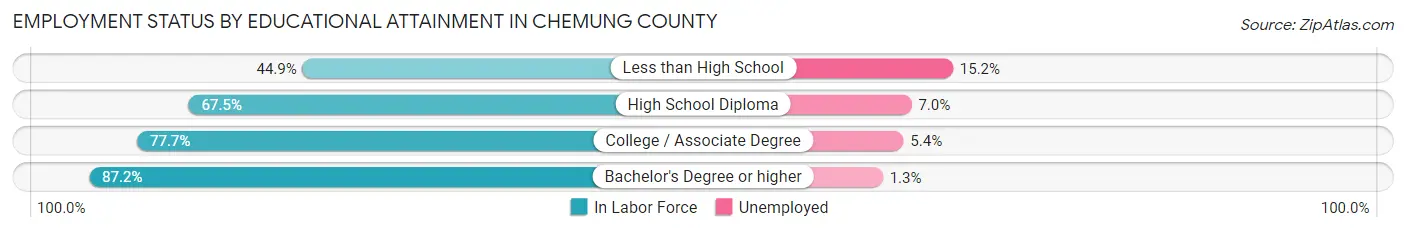
| Educational Attainment | In Labor Force | Unemployed |
| Less than High School | 1,784 (44.9%) | 604 (15.2%) |
| High School Diploma | 9,468 (67.5%) | 982 (7.0%) |
| College / Associate Degree | 10,763 (77.7%) | 748 (5.4%) |
| Bachelor's Degree or higher | 9,346 (87.2%) | 139 (1.3%) |
| Total | 31,373 (73.7%) | 2,214 (5.2%) |
Employment Occupations by Sex in Chemung County
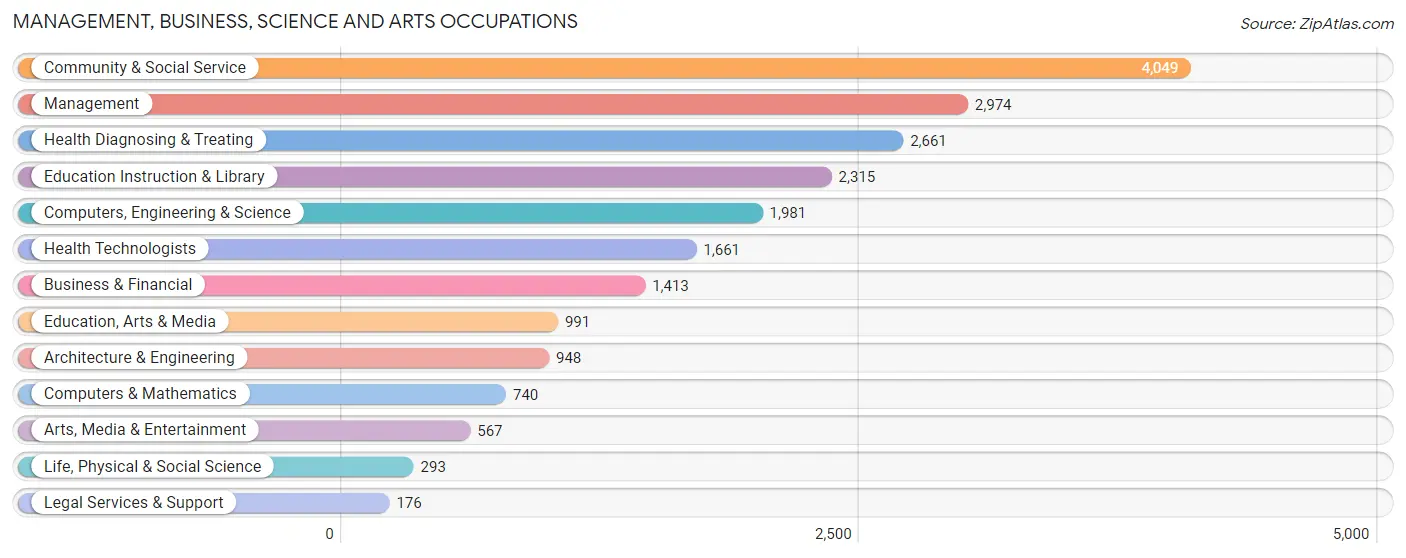
Management, Business, Science and Arts Occupations
The most common Management, Business, Science and Arts occupations in Chemung County are Community & Social Service (4,049 | 11.0%), Management (2,974 | 8.1%), Health Diagnosing & Treating (2,661 | 7.3%), Education Instruction & Library (2,315 | 6.3%), and Computers, Engineering & Science (1,981 | 5.4%).
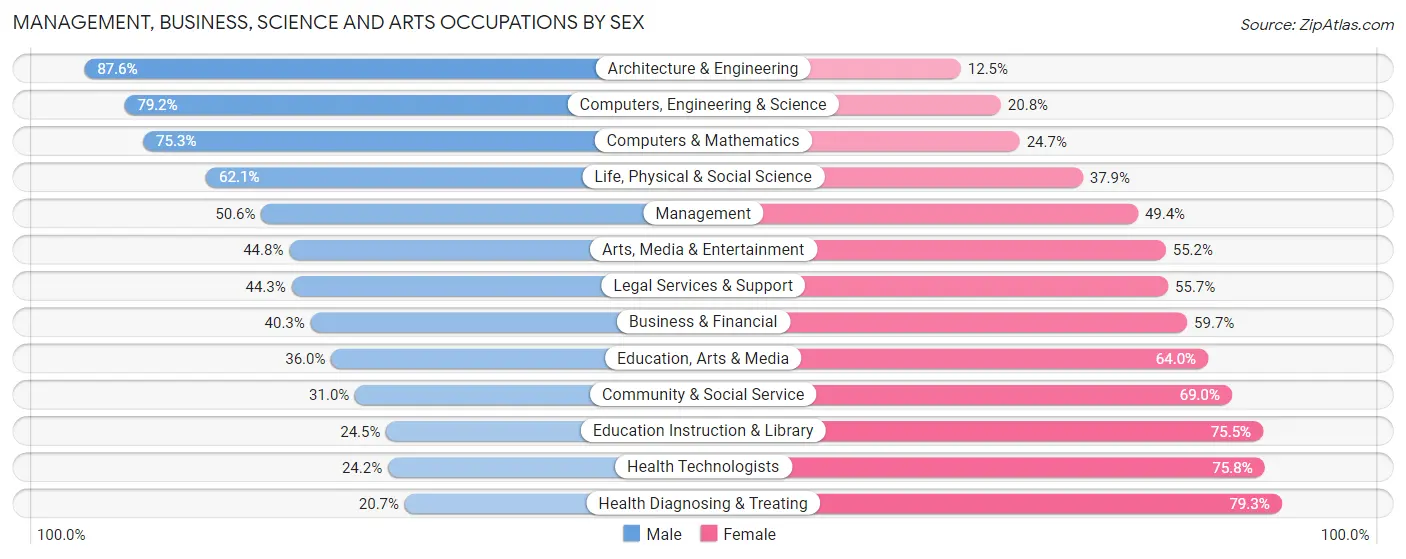
Management, Business, Science and Arts Occupations by Sex
Within the Management, Business, Science and Arts occupations in Chemung County, the most male-oriented occupations are Architecture & Engineering (87.5%), Computers, Engineering & Science (79.2%), and Computers & Mathematics (75.3%), while the most female-oriented occupations are Health Diagnosing & Treating (79.3%), Health Technologists (75.8%), and Education Instruction & Library (75.5%).
| Occupation | Male | Female |
| Management | 1,505 (50.6%) | 1,469 (49.4%) |
| Business & Financial | 570 (40.3%) | 843 (59.7%) |
| Computers, Engineering & Science | 1,569 (79.2%) | 412 (20.8%) |
| Computers & Mathematics | 557 (75.3%) | 183 (24.7%) |
| Architecture & Engineering | 830 (87.5%) | 118 (12.4%) |
| Life, Physical & Social Science | 182 (62.1%) | 111 (37.9%) |
| Community & Social Service | 1,257 (31.0%) | 2,792 (69.0%) |
| Education, Arts & Media | 357 (36.0%) | 634 (64.0%) |
| Legal Services & Support | 78 (44.3%) | 98 (55.7%) |
| Education Instruction & Library | 568 (24.5%) | 1,747 (75.5%) |
| Arts, Media & Entertainment | 254 (44.8%) | 313 (55.2%) |
| Health Diagnosing & Treating | 550 (20.7%) | 2,111 (79.3%) |
| Health Technologists | 402 (24.2%) | 1,259 (75.8%) |
| Total (Category) | 5,451 (41.7%) | 7,627 (58.3%) |
| Total (Overall) | 18,813 (51.3%) | 17,851 (48.7%) |
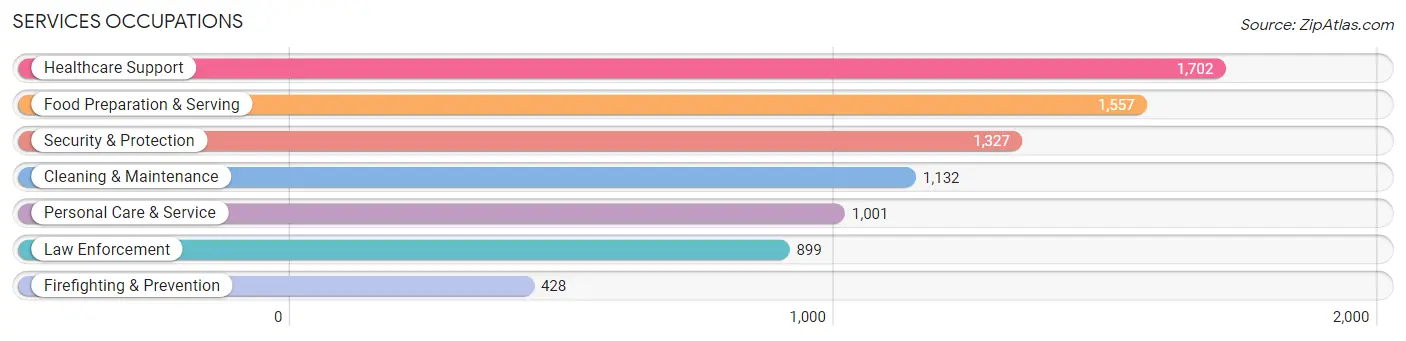
Services Occupations
The most common Services occupations in Chemung County are Healthcare Support (1,702 | 4.6%), Food Preparation & Serving (1,557 | 4.3%), Security & Protection (1,327 | 3.6%), Cleaning & Maintenance (1,132 | 3.1%), and Personal Care & Service (1,001 | 2.7%).
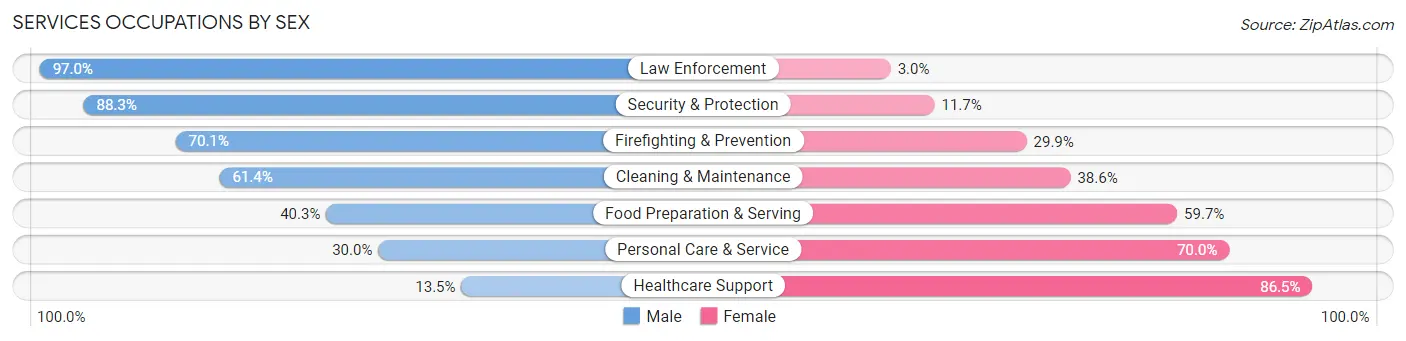
Services Occupations by Sex
Within the Services occupations in Chemung County, the most male-oriented occupations are Law Enforcement (97.0%), Security & Protection (88.3%), and Firefighting & Prevention (70.1%), while the most female-oriented occupations are Healthcare Support (86.5%), Personal Care & Service (70.0%), and Food Preparation & Serving (59.7%).
| Occupation | Male | Female |
| Healthcare Support | 230 (13.5%) | 1,472 (86.5%) |
| Security & Protection | 1,172 (88.3%) | 155 (11.7%) |
| Firefighting & Prevention | 300 (70.1%) | 128 (29.9%) |
| Law Enforcement | 872 (97.0%) | 27 (3.0%) |
| Food Preparation & Serving | 627 (40.3%) | 930 (59.7%) |
| Cleaning & Maintenance | 695 (61.4%) | 437 (38.6%) |
| Personal Care & Service | 300 (30.0%) | 701 (70.0%) |
| Total (Category) | 3,024 (45.0%) | 3,695 (55.0%) |
| Total (Overall) | 18,813 (51.3%) | 17,851 (48.7%) |
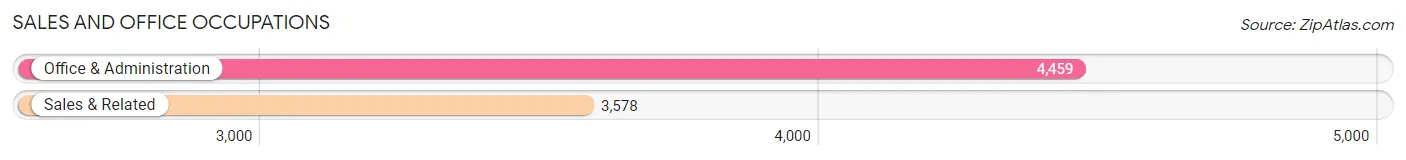
Sales and Office Occupations
The most common Sales and Office occupations in Chemung County are Office & Administration (4,459 | 12.2%), and Sales & Related (3,578 | 9.8%).
Sales and Office Occupations by Sex
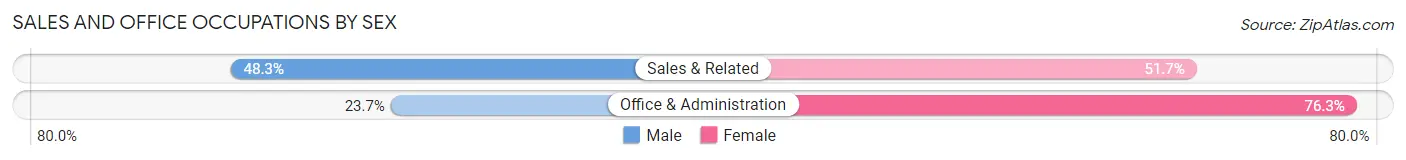
| Occupation | Male | Female |
| Sales & Related | 1,728 (48.3%) | 1,850 (51.7%) |
| Office & Administration | 1,056 (23.7%) | 3,403 (76.3%) |
| Total (Category) | 2,784 (34.6%) | 5,253 (65.4%) |
| Total (Overall) | 18,813 (51.3%) | 17,851 (48.7%) |
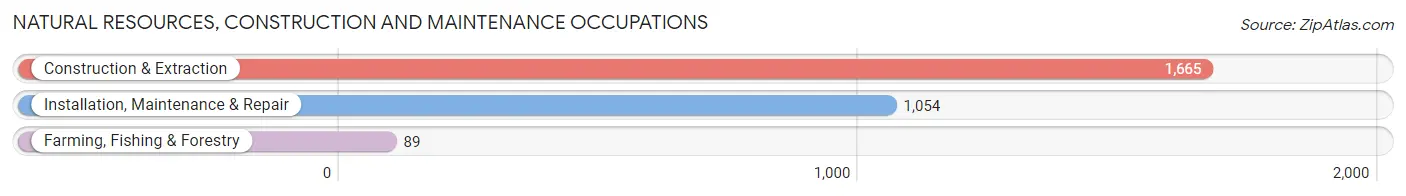
Natural Resources, Construction and Maintenance Occupations
The most common Natural Resources, Construction and Maintenance occupations in Chemung County are Construction & Extraction (1,665 | 4.5%), Installation, Maintenance & Repair (1,054 | 2.9%), and Farming, Fishing & Forestry (89 | 0.2%).
Natural Resources, Construction and Maintenance Occupations by Sex
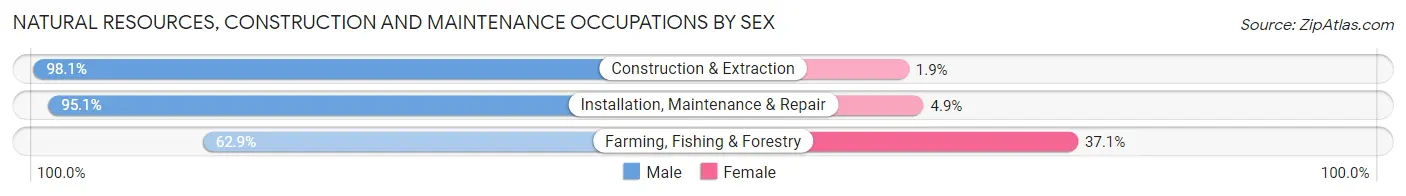
| Occupation | Male | Female |
| Farming, Fishing & Forestry | 56 (62.9%) | 33 (37.1%) |
| Construction & Extraction | 1,634 (98.1%) | 31 (1.9%) |
| Installation, Maintenance & Repair | 1,002 (95.1%) | 52 (4.9%) |
| Total (Category) | 2,692 (95.9%) | 116 (4.1%) |
| Total (Overall) | 18,813 (51.3%) | 17,851 (48.7%) |
Production, Transportation and Moving Occupations
The most common Production, Transportation and Moving occupations in Chemung County are Production (2,739 | 7.5%), Material Moving (1,644 | 4.5%), and Transportation (1,639 | 4.5%).
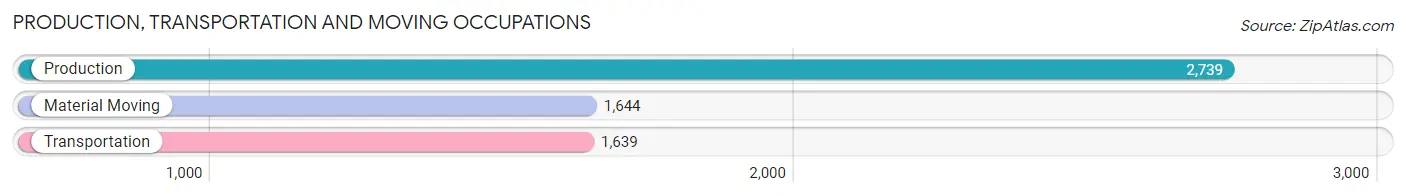
Production, Transportation and Moving Occupations by Sex
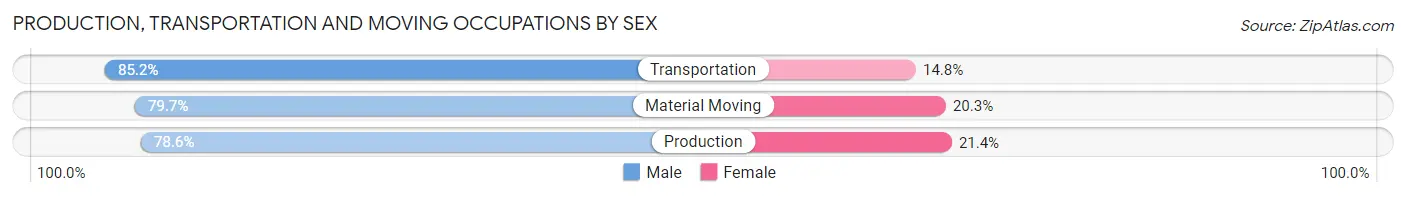
| Occupation | Male | Female |
| Production | 2,154 (78.6%) | 585 (21.4%) |
| Transportation | 1,397 (85.2%) | 242 (14.8%) |
| Material Moving | 1,311 (79.7%) | 333 (20.3%) |
| Total (Category) | 4,862 (80.7%) | 1,160 (19.3%) |
| Total (Overall) | 18,813 (51.3%) | 17,851 (48.7%) |
Employment Industries by Sex in Chemung County
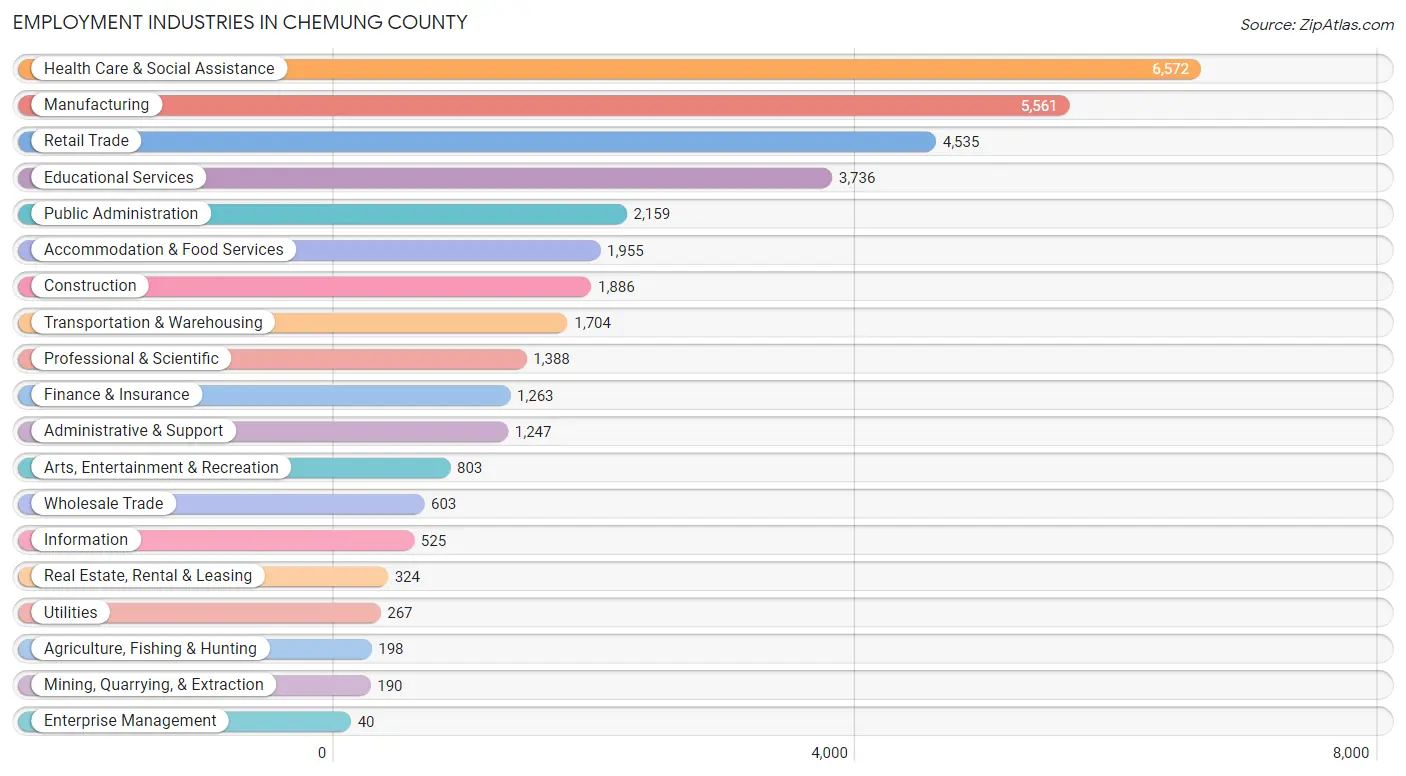
Employment Industries in Chemung County
The major employment industries in Chemung County include Health Care & Social Assistance (6,572 | 17.9%), Manufacturing (5,561 | 15.2%), Retail Trade (4,535 | 12.4%), Educational Services (3,736 | 10.2%), and Public Administration (2,159 | 5.9%).
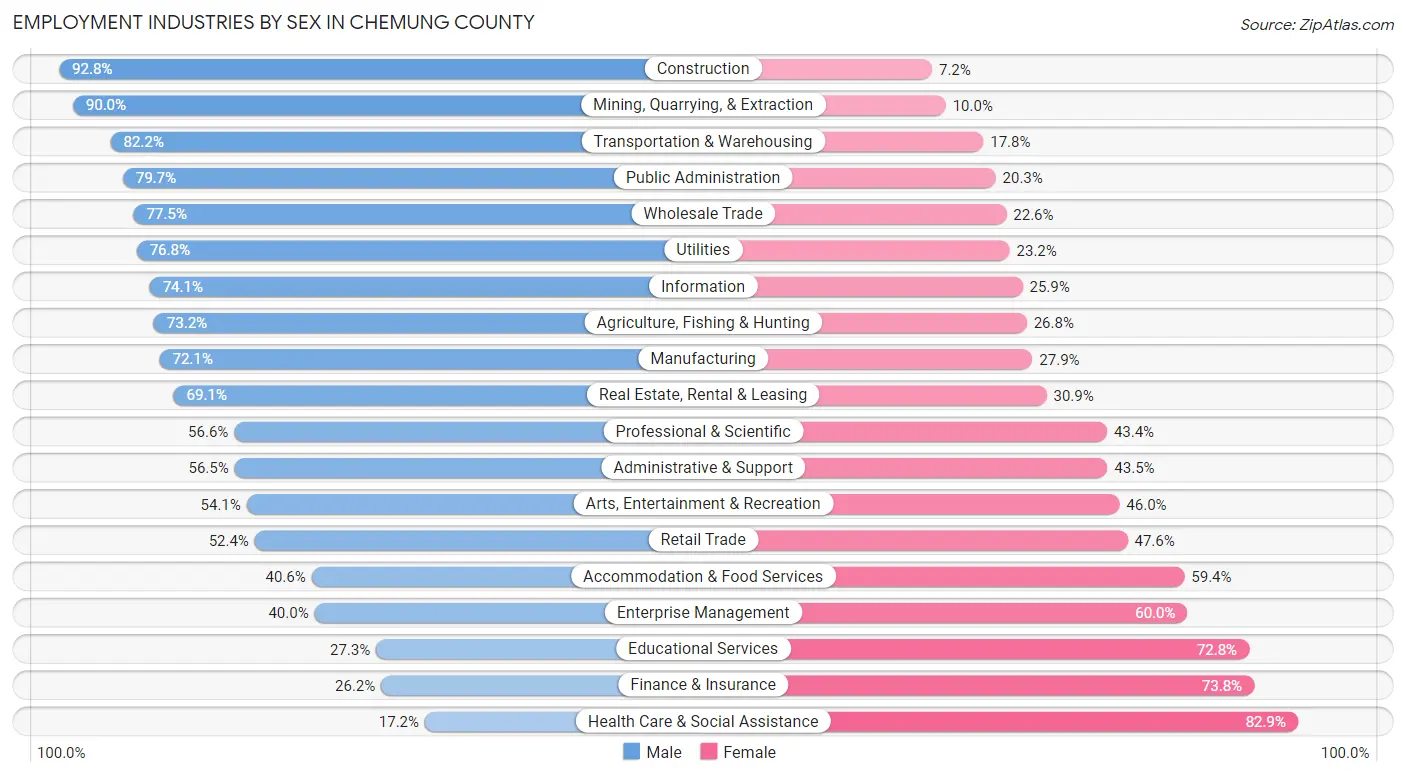
Employment Industries by Sex in Chemung County
The Chemung County industries that see more men than women are Construction (92.8%), Mining, Quarrying, & Extraction (90.0%), and Transportation & Warehousing (82.2%), whereas the industries that tend to have a higher number of women are Health Care & Social Assistance (82.9%), Finance & Insurance (73.8%), and Educational Services (72.8%).
| Industry | Male | Female |
| Agriculture, Fishing & Hunting | 145 (73.2%) | 53 (26.8%) |
| Mining, Quarrying, & Extraction | 171 (90.0%) | 19 (10.0%) |
| Construction | 1,751 (92.8%) | 135 (7.2%) |
| Manufacturing | 4,007 (72.1%) | 1,554 (27.9%) |
| Wholesale Trade | 467 (77.4%) | 136 (22.6%) |
| Retail Trade | 2,375 (52.4%) | 2,160 (47.6%) |
| Transportation & Warehousing | 1,401 (82.2%) | 303 (17.8%) |
| Utilities | 205 (76.8%) | 62 (23.2%) |
| Information | 389 (74.1%) | 136 (25.9%) |
| Finance & Insurance | 331 (26.2%) | 932 (73.8%) |
| Real Estate, Rental & Leasing | 224 (69.1%) | 100 (30.9%) |
| Professional & Scientific | 786 (56.6%) | 602 (43.4%) |
| Enterprise Management | 16 (40.0%) | 24 (60.0%) |
| Administrative & Support | 705 (56.5%) | 542 (43.5%) |
| Educational Services | 1,018 (27.3%) | 2,718 (72.8%) |
| Health Care & Social Assistance | 1,127 (17.2%) | 5,445 (82.9%) |
| Arts, Entertainment & Recreation | 434 (54.0%) | 369 (46.0%) |
| Accommodation & Food Services | 794 (40.6%) | 1,161 (59.4%) |
| Public Administration | 1,720 (79.7%) | 439 (20.3%) |
| Total | 18,813 (51.3%) | 17,851 (48.7%) |
Education in Chemung County
School Enrollment in Chemung County
The most common levels of schooling among the 17,536 students in Chemung County are high school (4,031 | 23.0%), middle school (3,890 | 22.2%), and elementary school (3,701 | 21.1%).
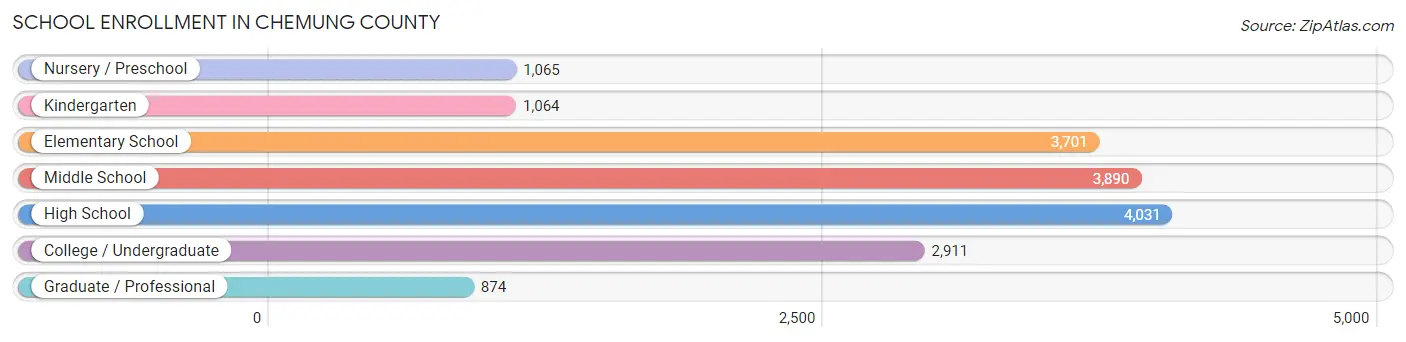
| School Level | # Students | % Students |
| Nursery / Preschool | 1,065 | 6.1% |
| Kindergarten | 1,064 | 6.1% |
| Elementary School | 3,701 | 21.1% |
| Middle School | 3,890 | 22.2% |
| High School | 4,031 | 23.0% |
| College / Undergraduate | 2,911 | 16.6% |
| Graduate / Professional | 874 | 5.0% |
| Total | 17,536 | 100.0% |
School Enrollment by Age by Funding Source in Chemung County
Out of a total of 17,536 students who are enrolled in schools in Chemung County, 3,542 (20.2%) attend a private institution, while the remaining 13,994 (79.8%) are enrolled in public schools. The age group of 25 to 34 year olds has the highest likelihood of being enrolled in private schools, with 358 (48.6% in the age bracket) enrolled. Conversely, the age group of 15 to 17 year olds has the lowest likelihood of being enrolled in a private school, with 2,666 (89.9% in the age bracket) attending a public institution.
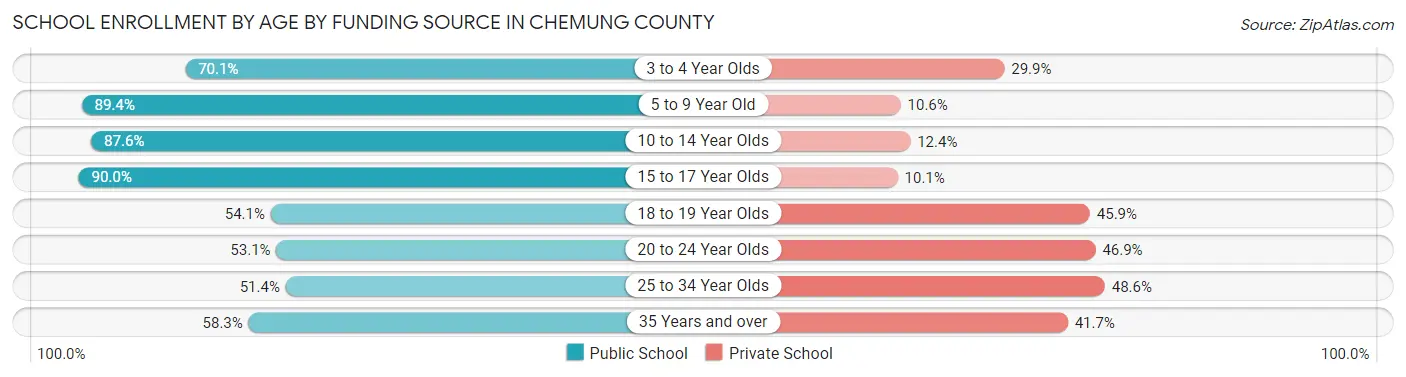
| Age Bracket | Public School | Private School |
| 3 to 4 Year Olds | 588 (70.1%) | 251 (29.9%) |
| 5 to 9 Year Old | 4,143 (89.4%) | 492 (10.6%) |
| 10 to 14 Year Olds | 4,380 (87.6%) | 620 (12.4%) |
| 15 to 17 Year Olds | 2,666 (89.9%) | 298 (10.1%) |
| 18 to 19 Year Olds | 647 (54.1%) | 548 (45.9%) |
| 20 to 24 Year Olds | 685 (53.1%) | 605 (46.9%) |
| 25 to 34 Year Olds | 378 (51.4%) | 358 (48.6%) |
| 35 Years and over | 511 (58.3%) | 366 (41.7%) |
| Total | 13,994 (79.8%) | 3,542 (20.2%) |
Educational Attainment by Field of Study in Chemung County
Education (2,940 | 19.0%), business (2,173 | 14.1%), science & technology (1,616 | 10.4%), engineering (1,446 | 9.3%), and arts & humanities (1,174 | 7.6%) are the most common fields of study among 15,469 individuals in Chemung County who have obtained a bachelor's degree or higher.
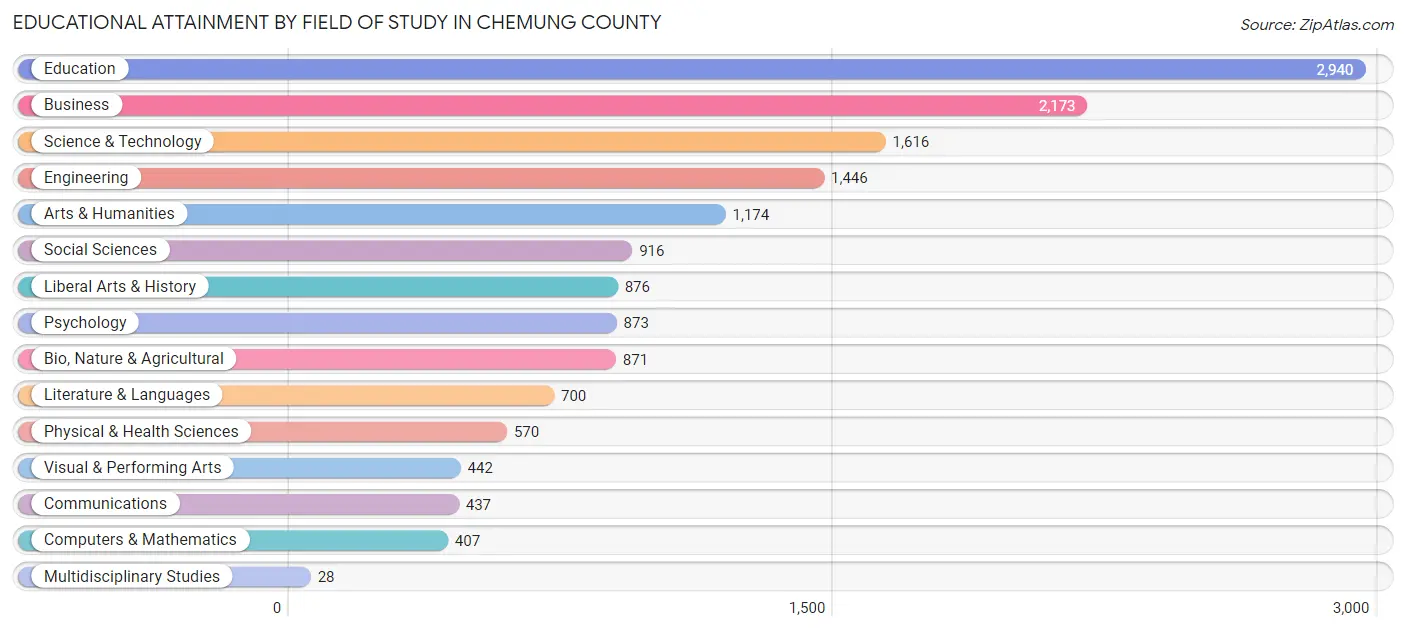
| Field of Study | # Graduates | % Graduates |
| Computers & Mathematics | 407 | 2.6% |
| Bio, Nature & Agricultural | 871 | 5.6% |
| Physical & Health Sciences | 570 | 3.7% |
| Psychology | 873 | 5.6% |
| Social Sciences | 916 | 5.9% |
| Engineering | 1,446 | 9.3% |
| Multidisciplinary Studies | 28 | 0.2% |
| Science & Technology | 1,616 | 10.4% |
| Business | 2,173 | 14.1% |
| Education | 2,940 | 19.0% |
| Literature & Languages | 700 | 4.5% |
| Liberal Arts & History | 876 | 5.7% |
| Visual & Performing Arts | 442 | 2.9% |
| Communications | 437 | 2.8% |
| Arts & Humanities | 1,174 | 7.6% |
| Total | 15,469 | 100.0% |
Transportation & Commute in Chemung County
Vehicle Availability by Sex in Chemung County
The most prevalent vehicle ownership categories in Chemung County are males with 2 vehicles (8,226, accounting for 44.9%) and females with 2 vehicles (7,422, making up 48.4%).
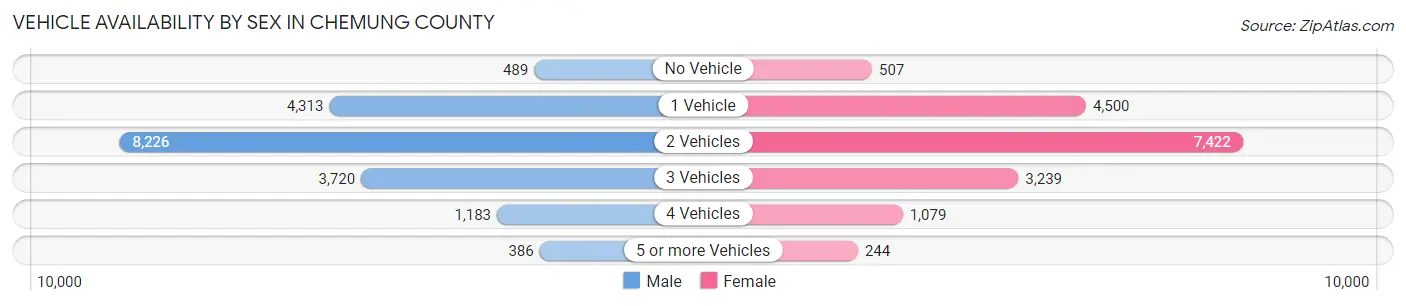
| Vehicles Available | Male | Female |
| No Vehicle | 489 (2.7%) | 507 (3.0%) |
| 1 Vehicle | 4,313 (23.5%) | 4,500 (26.5%) |
| 2 Vehicles | 8,226 (44.9%) | 7,422 (43.7%) |
| 3 Vehicles | 3,720 (20.3%) | 3,239 (19.1%) |
| 4 Vehicles | 1,183 (6.5%) | 1,079 (6.4%) |
| 5 or more Vehicles | 386 (2.1%) | 244 (1.4%) |
| Total | 18,317 (100.0%) | 16,991 (100.0%) |
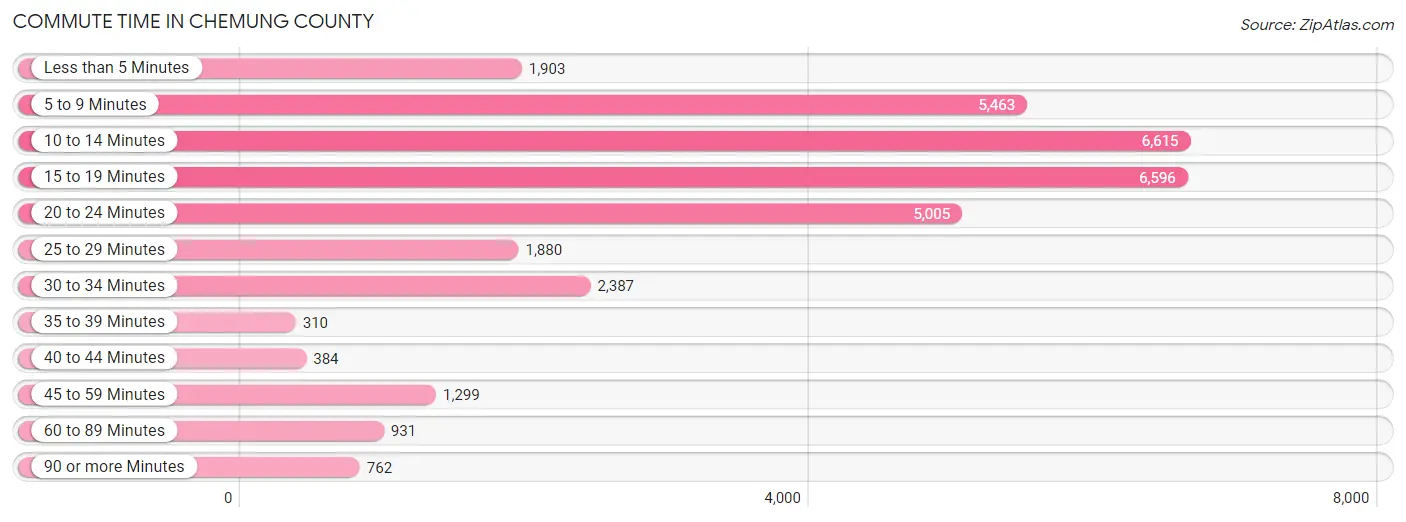
Commute Time in Chemung County
The most frequently occuring commute durations in Chemung County are 10 to 14 minutes (6,615 commuters, 19.7%), 15 to 19 minutes (6,596 commuters, 19.7%), and 5 to 9 minutes (5,463 commuters, 16.3%).
| Commute Time | # Commuters | % Commuters |
| Less than 5 Minutes | 1,903 | 5.7% |
| 5 to 9 Minutes | 5,463 | 16.3% |
| 10 to 14 Minutes | 6,615 | 19.7% |
| 15 to 19 Minutes | 6,596 | 19.7% |
| 20 to 24 Minutes | 5,005 | 14.9% |
| 25 to 29 Minutes | 1,880 | 5.6% |
| 30 to 34 Minutes | 2,387 | 7.1% |
| 35 to 39 Minutes | 310 | 0.9% |
| 40 to 44 Minutes | 384 | 1.1% |
| 45 to 59 Minutes | 1,299 | 3.9% |
| 60 to 89 Minutes | 931 | 2.8% |
| 90 or more Minutes | 762 | 2.3% |
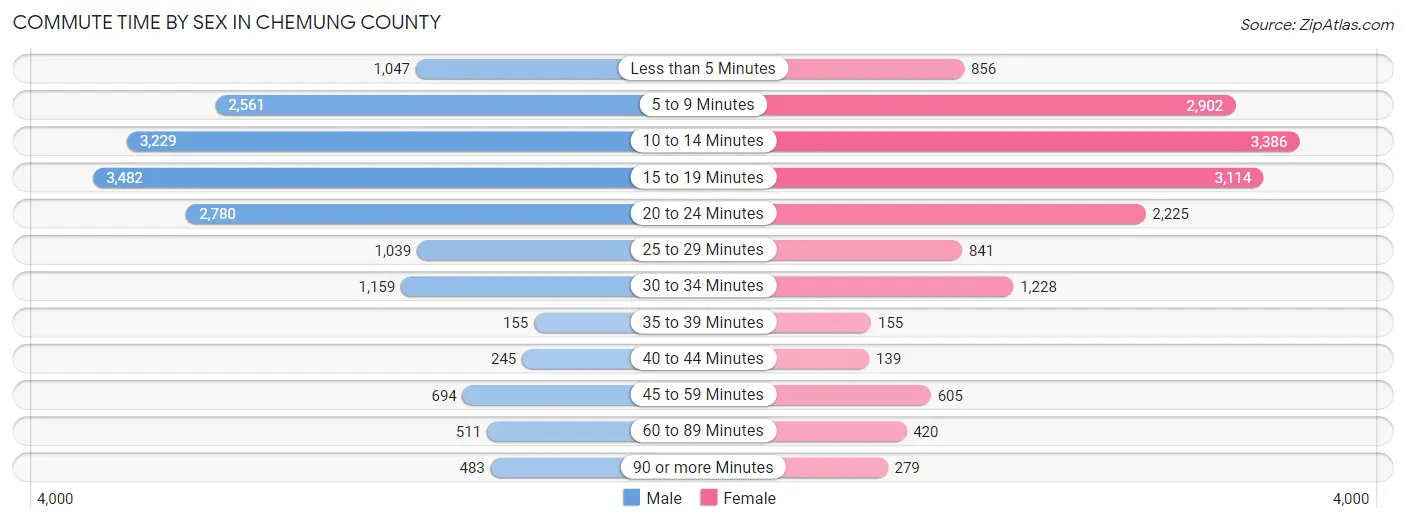
Commute Time by Sex in Chemung County
The most common commute times in Chemung County are 15 to 19 minutes (3,482 commuters, 20.0%) for males and 10 to 14 minutes (3,386 commuters, 21.0%) for females.
| Commute Time | Male | Female |
| Less than 5 Minutes | 1,047 (6.0%) | 856 (5.3%) |
| 5 to 9 Minutes | 2,561 (14.7%) | 2,902 (18.0%) |
| 10 to 14 Minutes | 3,229 (18.6%) | 3,386 (21.0%) |
| 15 to 19 Minutes | 3,482 (20.0%) | 3,114 (19.3%) |
| 20 to 24 Minutes | 2,780 (16.0%) | 2,225 (13.8%) |
| 25 to 29 Minutes | 1,039 (6.0%) | 841 (5.2%) |
| 30 to 34 Minutes | 1,159 (6.7%) | 1,228 (7.6%) |
| 35 to 39 Minutes | 155 (0.9%) | 155 (1.0%) |
| 40 to 44 Minutes | 245 (1.4%) | 139 (0.9%) |
| 45 to 59 Minutes | 694 (4.0%) | 605 (3.7%) |
| 60 to 89 Minutes | 511 (2.9%) | 420 (2.6%) |
| 90 or more Minutes | 483 (2.8%) | 279 (1.7%) |
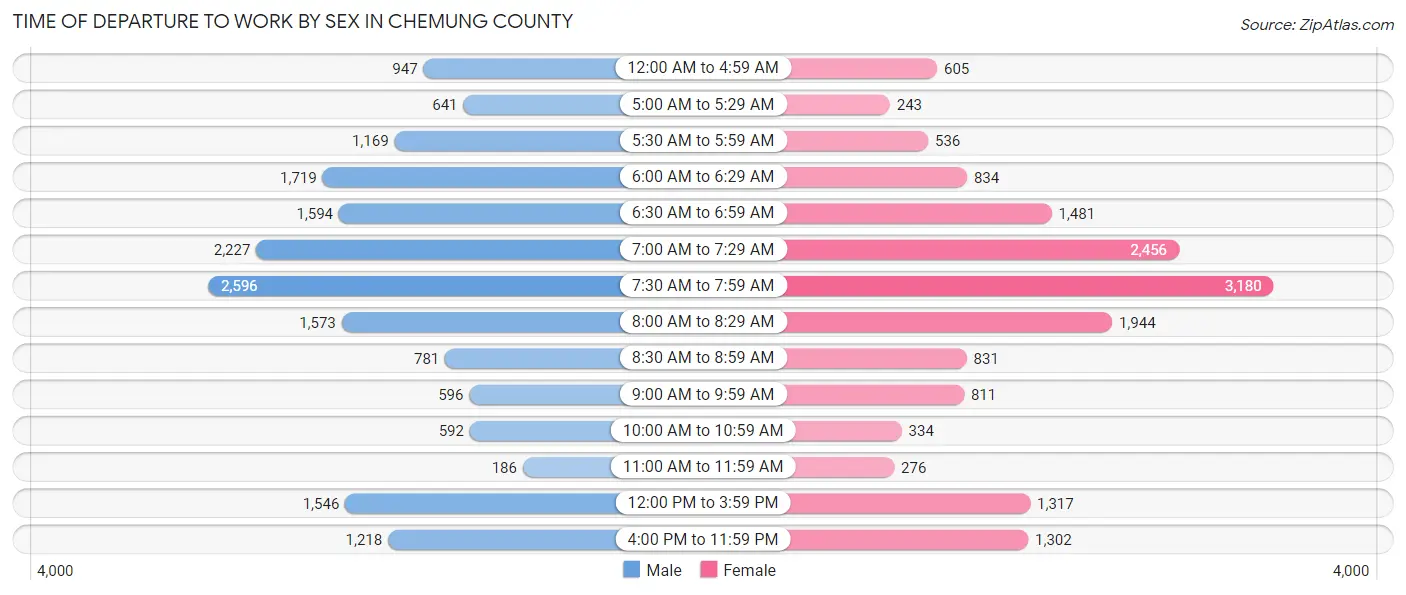
Time of Departure to Work by Sex in Chemung County
The most frequent times of departure to work in Chemung County are 7:30 AM to 7:59 AM (2,596, 14.9%) for males and 7:30 AM to 7:59 AM (3,180, 19.7%) for females.
| Time of Departure | Male | Female |
| 12:00 AM to 4:59 AM | 947 (5.4%) | 605 (3.7%) |
| 5:00 AM to 5:29 AM | 641 (3.7%) | 243 (1.5%) |
| 5:30 AM to 5:59 AM | 1,169 (6.7%) | 536 (3.3%) |
| 6:00 AM to 6:29 AM | 1,719 (9.9%) | 834 (5.2%) |
| 6:30 AM to 6:59 AM | 1,594 (9.2%) | 1,481 (9.2%) |
| 7:00 AM to 7:29 AM | 2,227 (12.8%) | 2,456 (15.2%) |
| 7:30 AM to 7:59 AM | 2,596 (14.9%) | 3,180 (19.7%) |
| 8:00 AM to 8:29 AM | 1,573 (9.0%) | 1,944 (12.0%) |
| 8:30 AM to 8:59 AM | 781 (4.5%) | 831 (5.1%) |
| 9:00 AM to 9:59 AM | 596 (3.4%) | 811 (5.0%) |
| 10:00 AM to 10:59 AM | 592 (3.4%) | 334 (2.1%) |
| 11:00 AM to 11:59 AM | 186 (1.1%) | 276 (1.7%) |
| 12:00 PM to 3:59 PM | 1,546 (8.9%) | 1,317 (8.2%) |
| 4:00 PM to 11:59 PM | 1,218 (7.0%) | 1,302 (8.1%) |
| Total | 17,385 (100.0%) | 16,150 (100.0%) |
Housing Occupancy in Chemung County
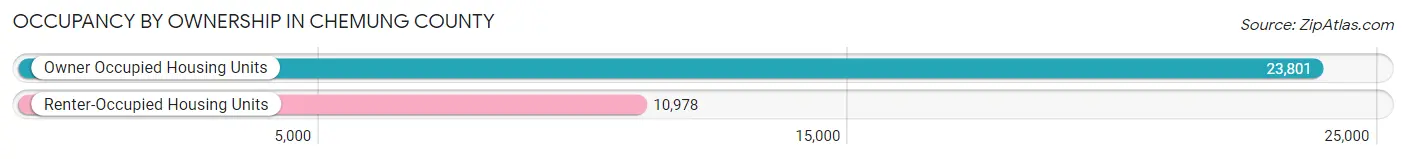
Occupancy by Ownership in Chemung County
Of the total 34,779 dwellings in Chemung County, owner-occupied units account for 23,801 (68.4%), while renter-occupied units make up 10,978 (31.6%).
| Occupancy | # Housing Units | % Housing Units |
| Owner Occupied Housing Units | 23,801 | 68.4% |
| Renter-Occupied Housing Units | 10,978 | 31.6% |
| Total Occupied Housing Units | 34,779 | 100.0% |
Occupancy by Household Size in Chemung County
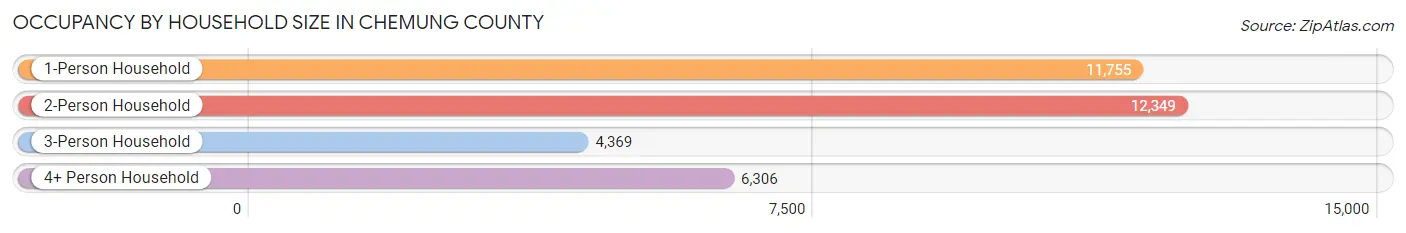
| Household Size | # Housing Units | % Housing Units |
| 1-Person Household | 11,755 | 33.8% |
| 2-Person Household | 12,349 | 35.5% |
| 3-Person Household | 4,369 | 12.6% |
| 4+ Person Household | 6,306 | 18.1% |
| Total Housing Units | 34,779 | 100.0% |
Occupancy by Ownership by Household Size in Chemung County
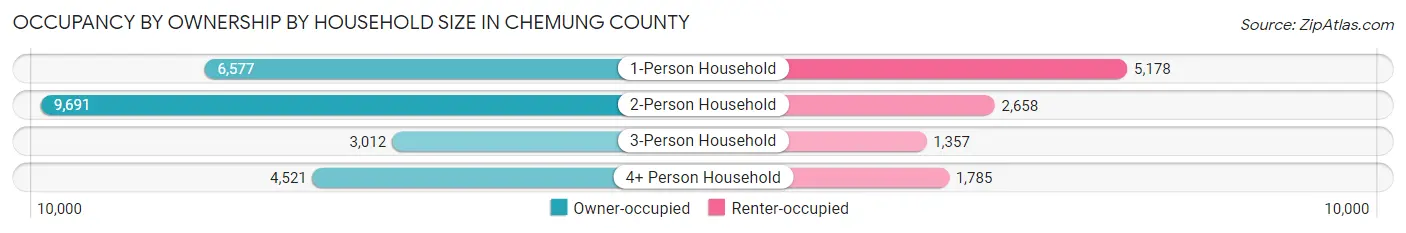
| Household Size | Owner-occupied | Renter-occupied |
| 1-Person Household | 6,577 (55.9%) | 5,178 (44.1%) |
| 2-Person Household | 9,691 (78.5%) | 2,658 (21.5%) |
| 3-Person Household | 3,012 (68.9%) | 1,357 (31.1%) |
| 4+ Person Household | 4,521 (71.7%) | 1,785 (28.3%) |
| Total Housing Units | 23,801 (68.4%) | 10,978 (31.6%) |
Occupancy by Educational Attainment in Chemung County
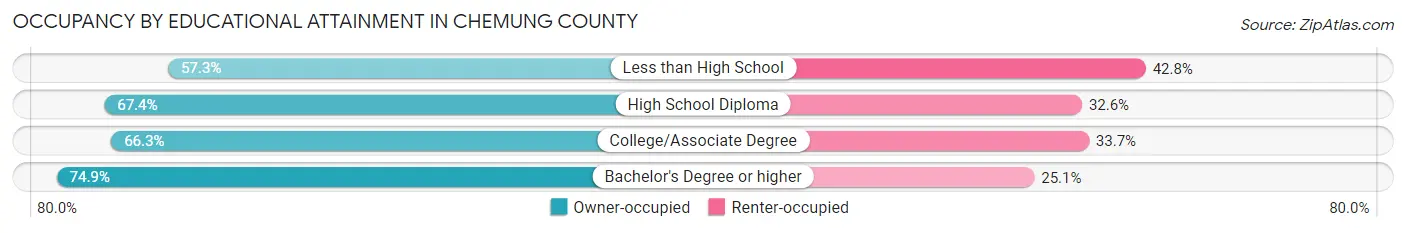
| Household Size | Owner-occupied | Renter-occupied |
| Less than High School | 1,307 (57.3%) | 976 (42.7%) |
| High School Diploma | 7,207 (67.4%) | 3,493 (32.6%) |
| College/Associate Degree | 7,979 (66.3%) | 4,063 (33.7%) |
| Bachelor's Degree or higher | 7,308 (74.9%) | 2,446 (25.1%) |
Occupancy by Age of Householder in Chemung County
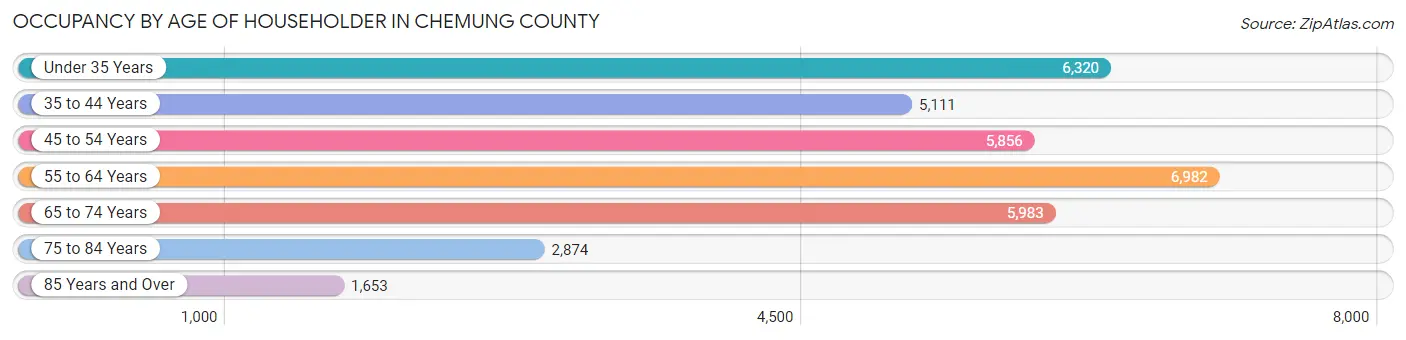
| Age Bracket | # Households | % Households |
| Under 35 Years | 6,320 | 18.2% |
| 35 to 44 Years | 5,111 | 14.7% |
| 45 to 54 Years | 5,856 | 16.8% |
| 55 to 64 Years | 6,982 | 20.1% |
| 65 to 74 Years | 5,983 | 17.2% |
| 75 to 84 Years | 2,874 | 8.3% |
| 85 Years and Over | 1,653 | 4.8% |
| Total | 34,779 | 100.0% |
Housing Finances in Chemung County
Median Income by Occupancy in Chemung County
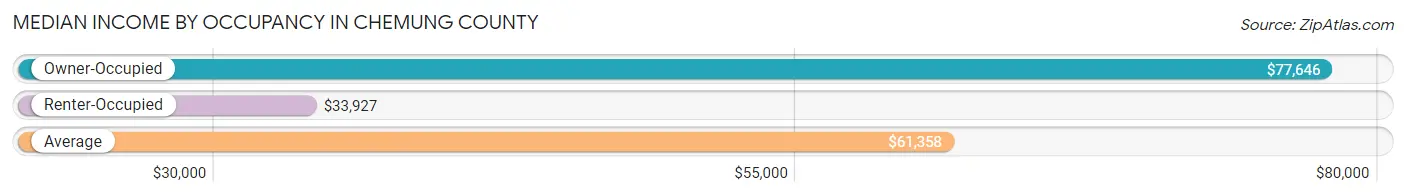
| Occupancy Type | # Households | Median Income |
| Owner-Occupied | 23,801 (68.4%) | $77,646 |
| Renter-Occupied | 10,978 (31.6%) | $33,927 |
| Average | 34,779 (100.0%) | $61,358 |
Occupancy by Householder Income Bracket in Chemung County
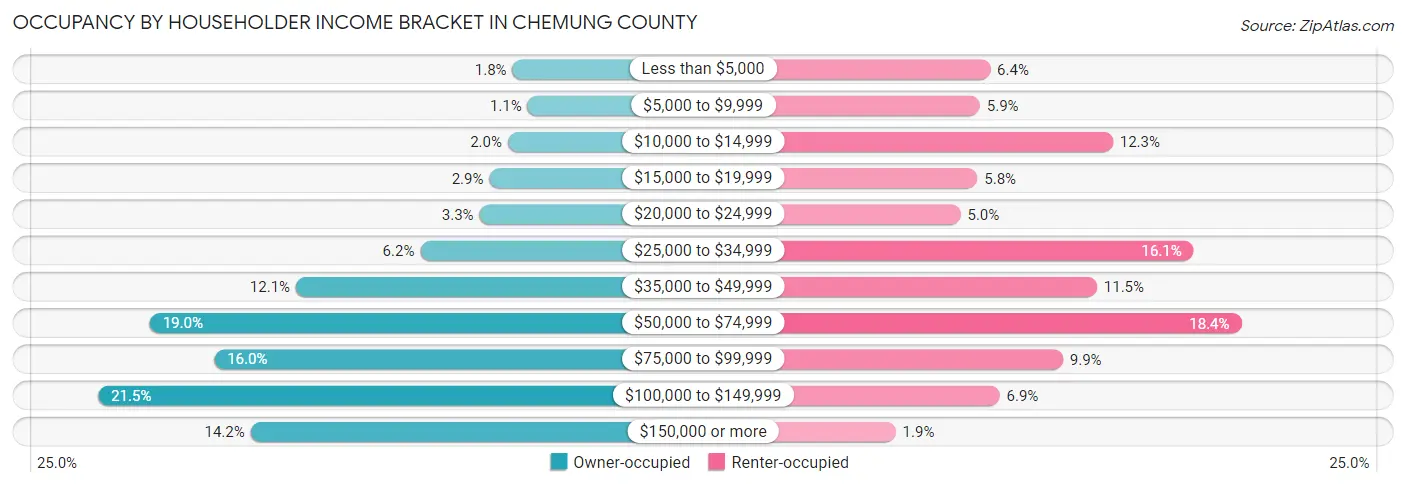
| Income Bracket | Owner-occupied | Renter-occupied |
| Less than $5,000 | 422 (1.8%) | 704 (6.4%) |
| $5,000 to $9,999 | 251 (1.1%) | 650 (5.9%) |
| $10,000 to $14,999 | 473 (2.0%) | 1,345 (12.2%) |
| $15,000 to $19,999 | 683 (2.9%) | 637 (5.8%) |
| $20,000 to $24,999 | 794 (3.3%) | 549 (5.0%) |
| $25,000 to $34,999 | 1,466 (6.2%) | 1,768 (16.1%) |
| $35,000 to $49,999 | 2,874 (12.1%) | 1,261 (11.5%) |
| $50,000 to $74,999 | 4,531 (19.0%) | 2,017 (18.4%) |
| $75,000 to $99,999 | 3,800 (16.0%) | 1,084 (9.9%) |
| $100,000 to $149,999 | 5,117 (21.5%) | 753 (6.9%) |
| $150,000 or more | 3,390 (14.2%) | 210 (1.9%) |
| Total | 23,801 (100.0%) | 10,978 (100.0%) |
Monthly Housing Cost Tiers in Chemung County
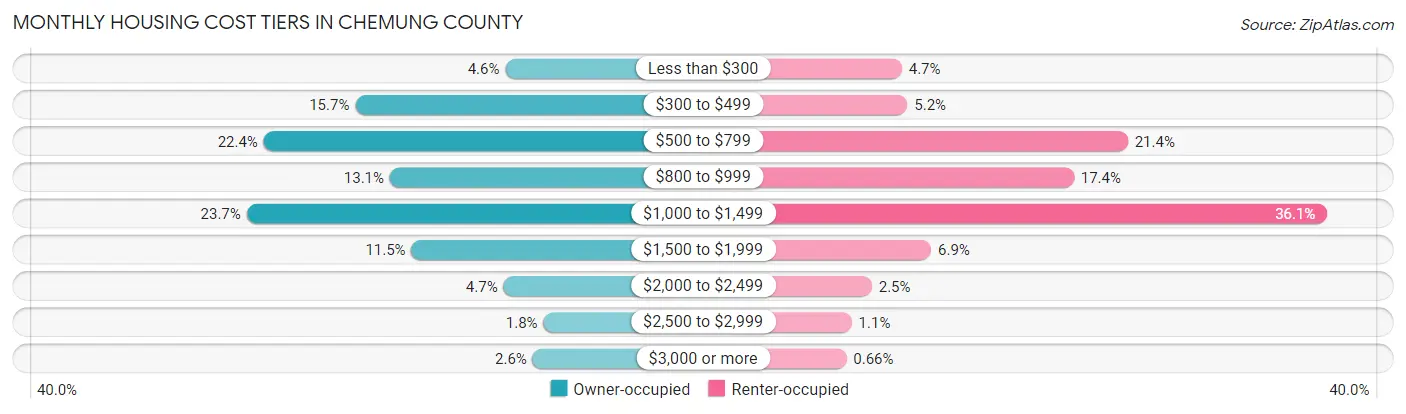
| Monthly Cost | Owner-occupied | Renter-occupied |
| Less than $300 | 1,094 (4.6%) | 520 (4.7%) |
| $300 to $499 | 3,725 (15.7%) | 565 (5.1%) |
| $500 to $799 | 5,330 (22.4%) | 2,347 (21.4%) |
| $800 to $999 | 3,118 (13.1%) | 1,911 (17.4%) |
| $1,000 to $1,499 | 5,628 (23.6%) | 3,960 (36.1%) |
| $1,500 to $1,999 | 2,740 (11.5%) | 757 (6.9%) |
| $2,000 to $2,499 | 1,125 (4.7%) | 278 (2.5%) |
| $2,500 to $2,999 | 426 (1.8%) | 115 (1.1%) |
| $3,000 or more | 615 (2.6%) | 72 (0.7%) |
| Total | 23,801 (100.0%) | 10,978 (100.0%) |
Physical Housing Characteristics in Chemung County
Housing Structures in Chemung County
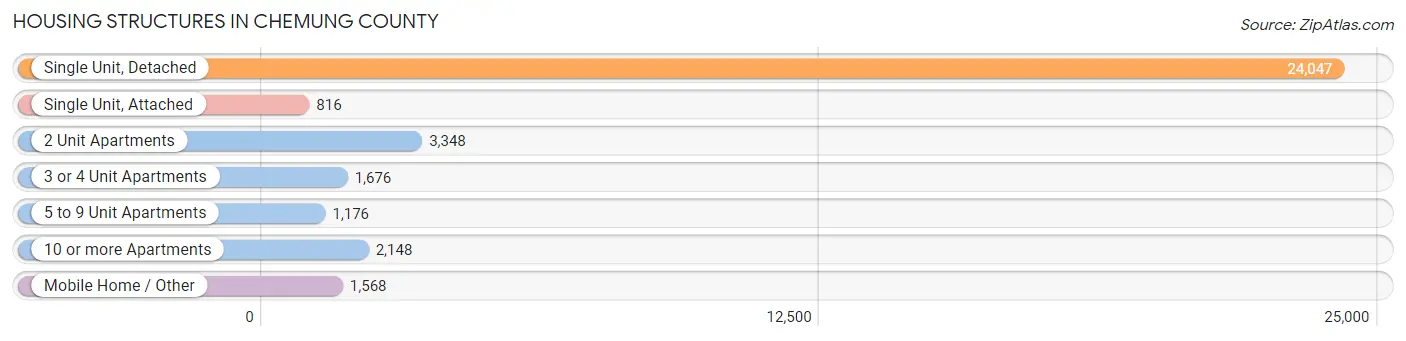
| Structure Type | # Housing Units | % Housing Units |
| Single Unit, Detached | 24,047 | 69.1% |
| Single Unit, Attached | 816 | 2.4% |
| 2 Unit Apartments | 3,348 | 9.6% |
| 3 or 4 Unit Apartments | 1,676 | 4.8% |
| 5 to 9 Unit Apartments | 1,176 | 3.4% |
| 10 or more Apartments | 2,148 | 6.2% |
| Mobile Home / Other | 1,568 | 4.5% |
| Total | 34,779 | 100.0% |
Housing Structures by Occupancy in Chemung County
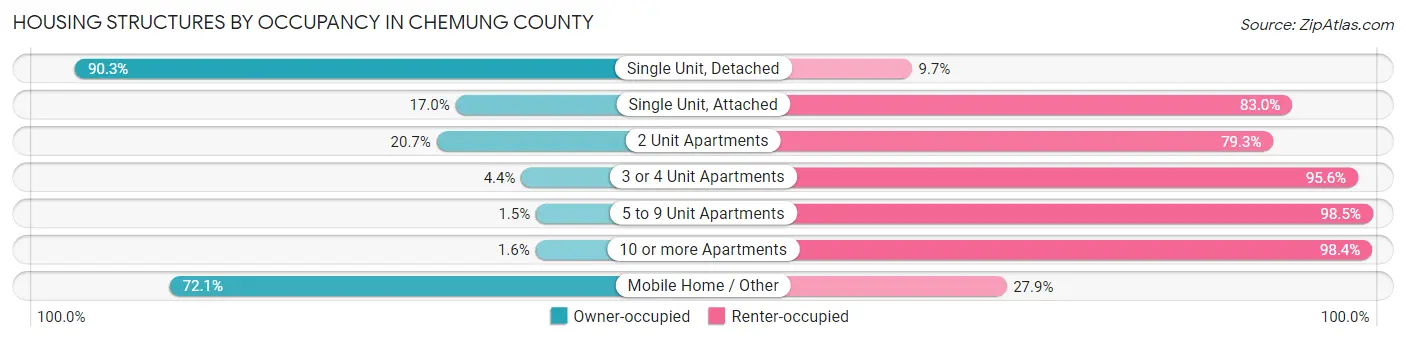
| Structure Type | Owner-occupied | Renter-occupied |
| Single Unit, Detached | 21,714 (90.3%) | 2,333 (9.7%) |
| Single Unit, Attached | 139 (17.0%) | 677 (83.0%) |
| 2 Unit Apartments | 692 (20.7%) | 2,656 (79.3%) |
| 3 or 4 Unit Apartments | 73 (4.4%) | 1,603 (95.6%) |
| 5 to 9 Unit Apartments | 18 (1.5%) | 1,158 (98.5%) |
| 10 or more Apartments | 35 (1.6%) | 2,113 (98.4%) |
| Mobile Home / Other | 1,130 (72.1%) | 438 (27.9%) |
| Total | 23,801 (68.4%) | 10,978 (31.6%) |
Housing Structures by Number of Rooms in Chemung County
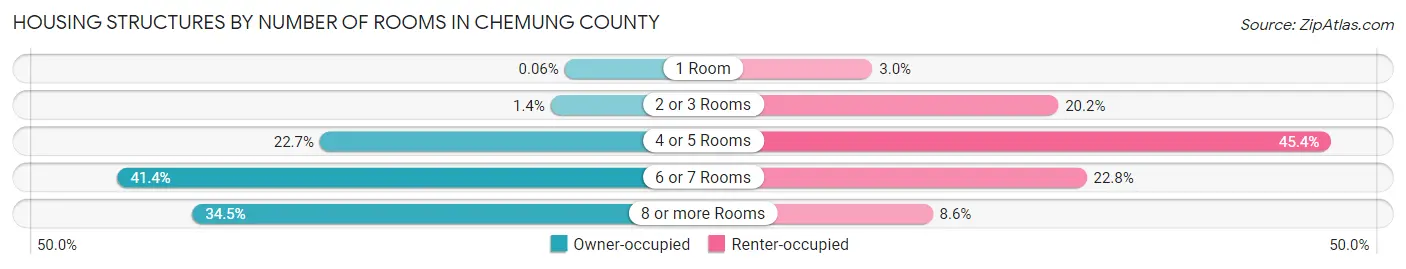
| Number of Rooms | Owner-occupied | Renter-occupied |
| 1 Room | 15 (0.1%) | 329 (3.0%) |
| 2 or 3 Rooms | 321 (1.3%) | 2,217 (20.2%) |
| 4 or 5 Rooms | 5,404 (22.7%) | 4,987 (45.4%) |
| 6 or 7 Rooms | 9,855 (41.4%) | 2,504 (22.8%) |
| 8 or more Rooms | 8,206 (34.5%) | 941 (8.6%) |
| Total | 23,801 (100.0%) | 10,978 (100.0%) |
Housing Structure by Heating Type in Chemung County
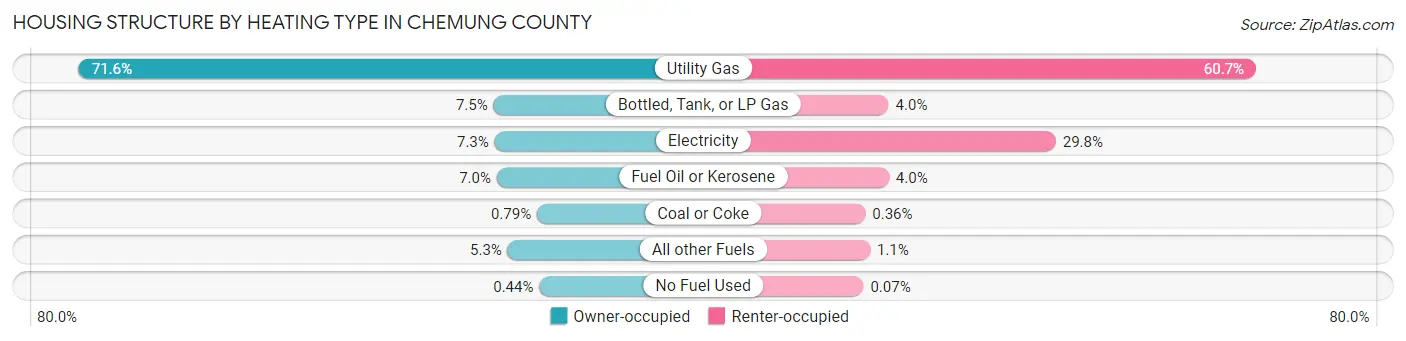
| Heating Type | Owner-occupied | Renter-occupied |
| Utility Gas | 17,044 (71.6%) | 6,667 (60.7%) |
| Bottled, Tank, or LP Gas | 1,784 (7.5%) | 435 (4.0%) |
| Electricity | 1,747 (7.3%) | 3,271 (29.8%) |
| Fuel Oil or Kerosene | 1,667 (7.0%) | 439 (4.0%) |
| Coal or Coke | 188 (0.8%) | 39 (0.4%) |
| All other Fuels | 1,266 (5.3%) | 119 (1.1%) |
| No Fuel Used | 105 (0.4%) | 8 (0.1%) |
| Total | 23,801 (100.0%) | 10,978 (100.0%) |
Household Vehicle Usage in Chemung County
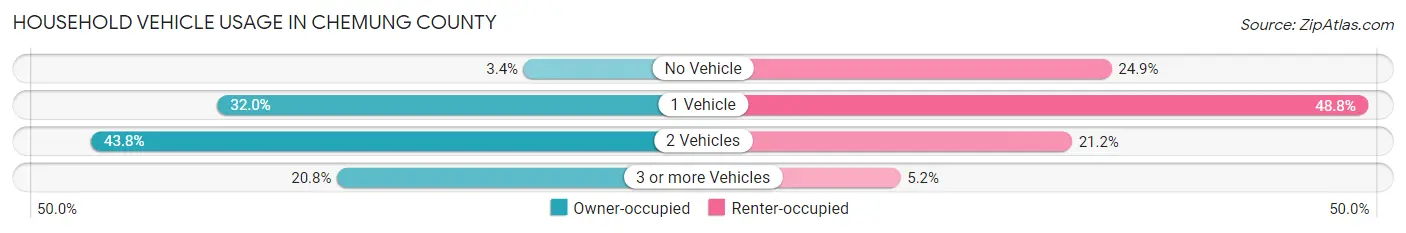
| Vehicles per Household | Owner-occupied | Renter-occupied |
| No Vehicle | 808 (3.4%) | 2,730 (24.9%) |
| 1 Vehicle | 7,617 (32.0%) | 5,356 (48.8%) |
| 2 Vehicles | 10,423 (43.8%) | 2,324 (21.2%) |
| 3 or more Vehicles | 4,953 (20.8%) | 568 (5.2%) |
| Total | 23,801 (100.0%) | 10,978 (100.0%) |
Real Estate & Mortgages in Chemung County
Real Estate and Mortgage Overview in Chemung County
| Characteristic | Without Mortgage | With Mortgage |
| Housing Units | 11,418 | 12,383 |
| Median Property Value | $118,200 | $138,200 |
| Median Household Income | $62,175 | $2,314 |
| Monthly Housing Costs | $555 | $615 |
| Real Estate Taxes | $2,885 | $396 |
Property Value by Mortgage Status in Chemung County
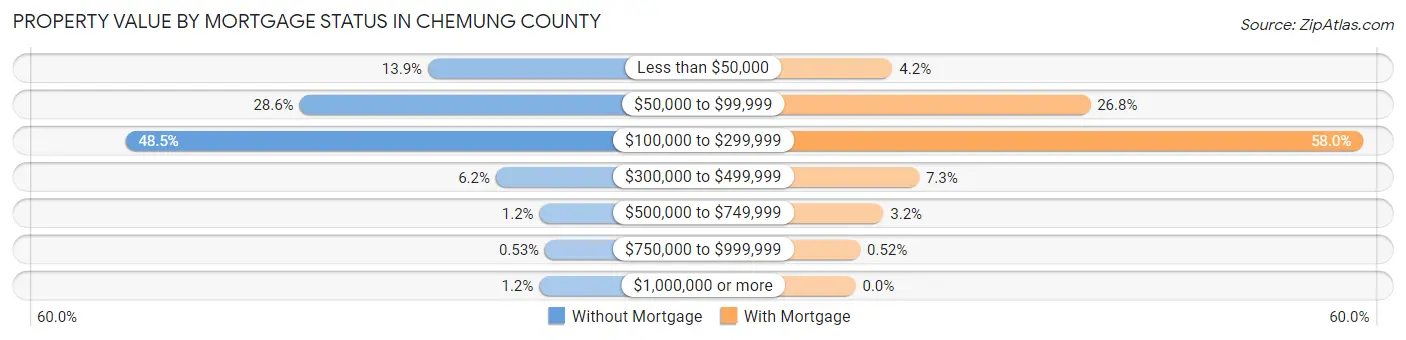
| Property Value | Without Mortgage | With Mortgage |
| Less than $50,000 | 1,588 (13.9%) | 521 (4.2%) |
| $50,000 to $99,999 | 3,264 (28.6%) | 3,321 (26.8%) |
| $100,000 to $299,999 | 5,534 (48.5%) | 7,185 (58.0%) |
| $300,000 to $499,999 | 702 (6.1%) | 898 (7.2%) |
| $500,000 to $749,999 | 133 (1.2%) | 394 (3.2%) |
| $750,000 to $999,999 | 60 (0.5%) | 64 (0.5%) |
| $1,000,000 or more | 137 (1.2%) | 0 (0.0%) |
| Total | 11,418 (100.0%) | 12,383 (100.0%) |
Household Income by Mortgage Status in Chemung County
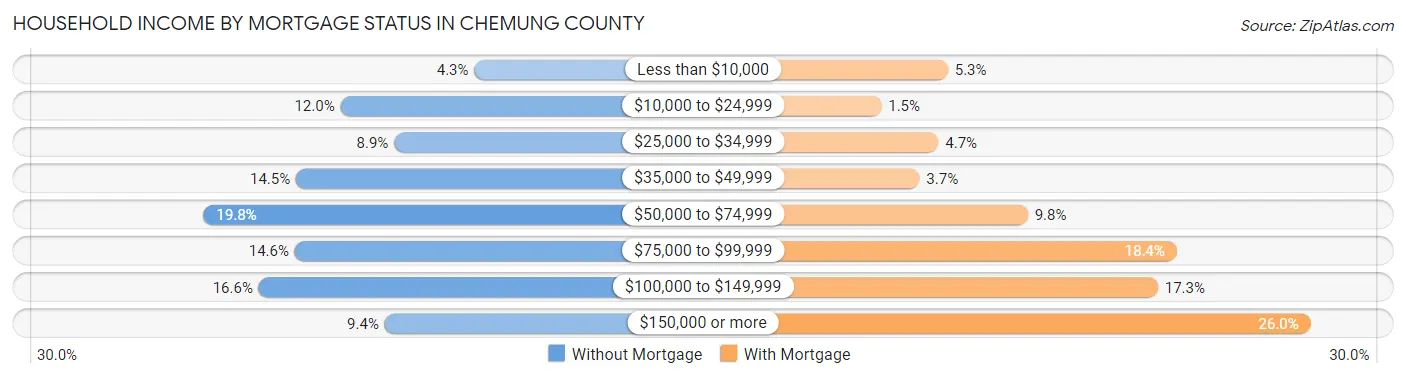
| Household Income | Without Mortgage | With Mortgage |
| Less than $10,000 | 491 (4.3%) | 652 (5.3%) |
| $10,000 to $24,999 | 1,364 (11.9%) | 182 (1.5%) |
| $25,000 to $34,999 | 1,014 (8.9%) | 586 (4.7%) |
| $35,000 to $49,999 | 1,655 (14.5%) | 452 (3.6%) |
| $50,000 to $74,999 | 2,258 (19.8%) | 1,219 (9.8%) |
| $75,000 to $99,999 | 1,662 (14.6%) | 2,273 (18.4%) |
| $100,000 to $149,999 | 1,898 (16.6%) | 2,138 (17.3%) |
| $150,000 or more | 1,076 (9.4%) | 3,219 (26.0%) |
| Total | 11,418 (100.0%) | 12,383 (100.0%) |
Property Value to Household Income Ratio in Chemung County
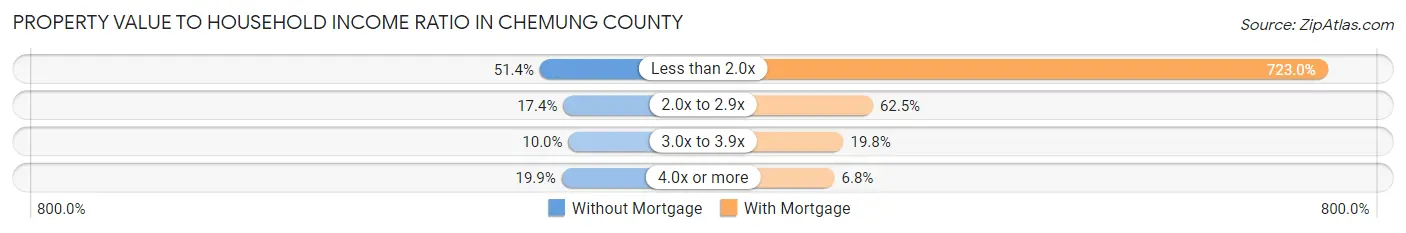
| Value-to-Income Ratio | Without Mortgage | With Mortgage |
| Less than 2.0x | 5,871 (51.4%) | 89,528 (723.0%) |
| 2.0x to 2.9x | 1,987 (17.4%) | 7,743 (62.5%) |
| 3.0x to 3.9x | 1,139 (10.0%) | 2,452 (19.8%) |
| 4.0x or more | 2,270 (19.9%) | 841 (6.8%) |
| Total | 11,418 (100.0%) | 12,383 (100.0%) |
Real Estate Taxes by Mortgage Status in Chemung County
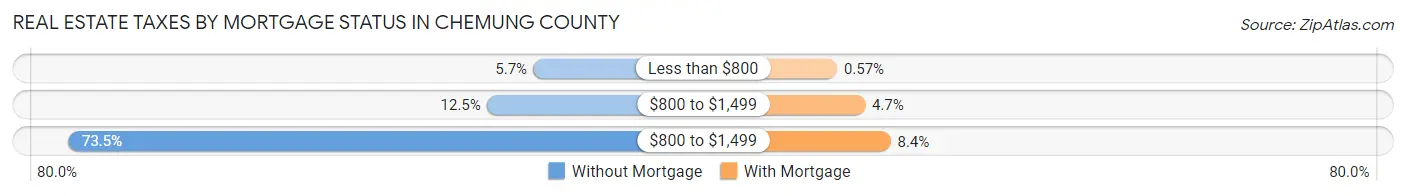
| Property Taxes | Without Mortgage | With Mortgage |
| Less than $800 | 653 (5.7%) | 71 (0.6%) |
| $800 to $1,499 | 1,426 (12.5%) | 577 (4.7%) |
| $800 to $1,499 | 8,397 (73.5%) | 1,040 (8.4%) |
| Total | 11,418 (100.0%) | 12,383 (100.0%) |
Health & Disability in Chemung County
Health Insurance Coverage by Age in Chemung County
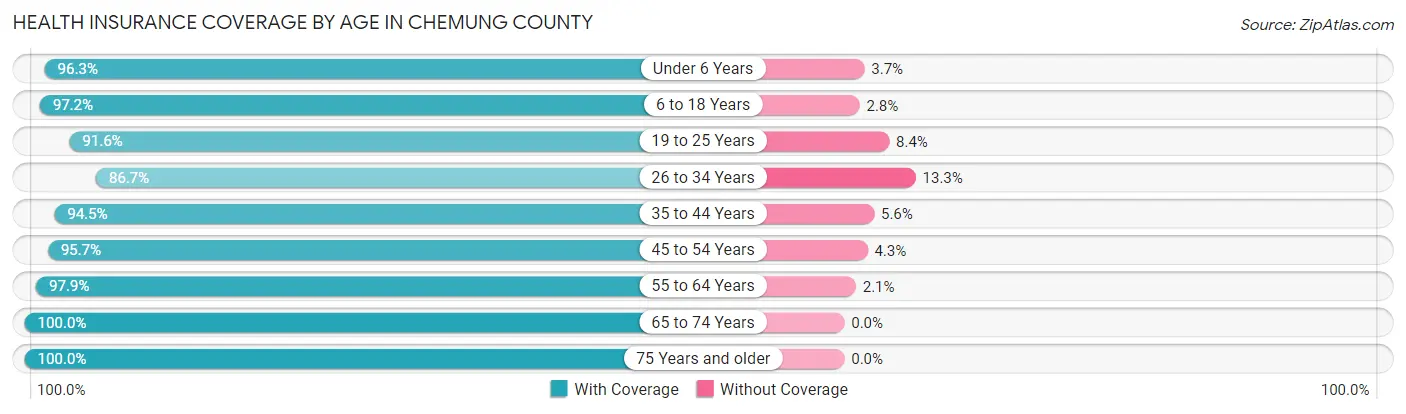
| Age Bracket | With Coverage | Without Coverage |
| Under 6 Years | 5,040 (96.3%) | 196 (3.7%) |
| 6 to 18 Years | 13,096 (97.2%) | 383 (2.8%) |
| 19 to 25 Years | 6,321 (91.6%) | 577 (8.4%) |
| 26 to 34 Years | 7,707 (86.7%) | 1,182 (13.3%) |
| 35 to 44 Years | 8,519 (94.5%) | 501 (5.6%) |
| 45 to 54 Years | 9,497 (95.7%) | 429 (4.3%) |
| 55 to 64 Years | 11,592 (97.9%) | 254 (2.1%) |
| 65 to 74 Years | 9,324 (100.0%) | 0 (0.0%) |
| 75 Years and older | 6,577 (100.0%) | 0 (0.0%) |
| Total | 77,673 (95.7%) | 3,522 (4.3%) |
Health Insurance Coverage by Citizenship Status in Chemung County
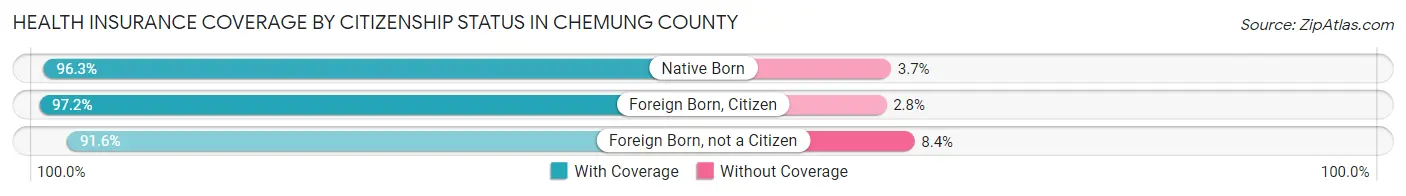
| Citizenship Status | With Coverage | Without Coverage |
| Native Born | 5,040 (96.3%) | 196 (3.7%) |
| Foreign Born, Citizen | 13,096 (97.2%) | 383 (2.8%) |
| Foreign Born, not a Citizen | 6,321 (91.6%) | 577 (8.4%) |
Health Insurance Coverage by Household Income in Chemung County
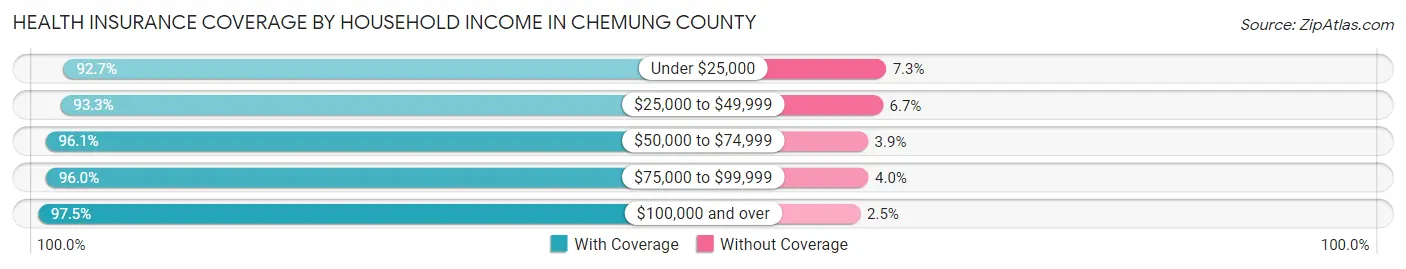
| Household Income | With Coverage | Without Coverage |
| Under $25,000 | 9,545 (92.7%) | 751 (7.3%) |
| $25,000 to $49,999 | 13,741 (93.3%) | 988 (6.7%) |
| $50,000 to $74,999 | 14,172 (96.1%) | 577 (3.9%) |
| $75,000 to $99,999 | 12,649 (96.0%) | 525 (4.0%) |
| $100,000 and over | 25,924 (97.5%) | 661 (2.5%) |
Public vs Private Health Insurance Coverage by Age in Chemung County
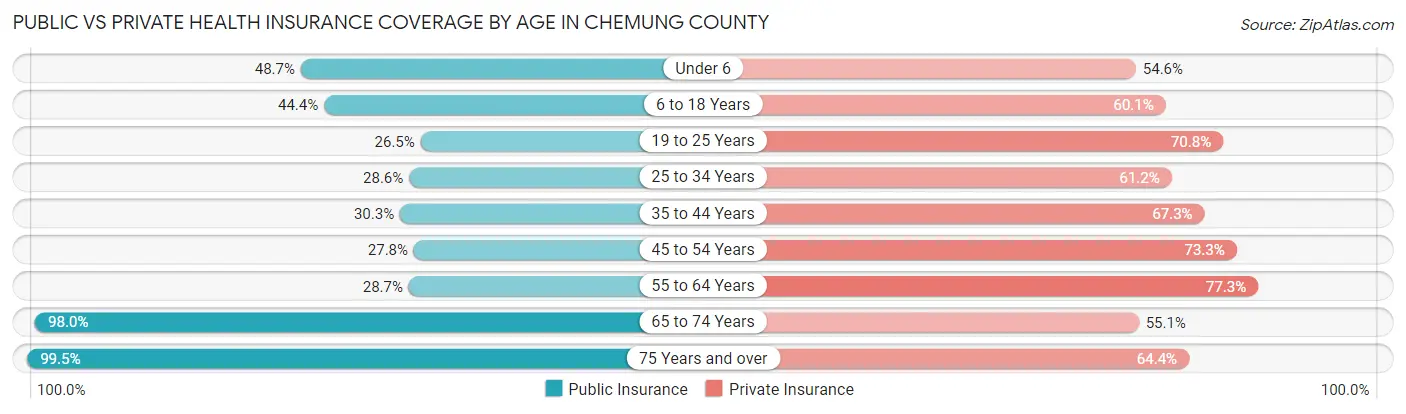
| Age Bracket | Public Insurance | Private Insurance |
| Under 6 | 2,552 (48.7%) | 2,858 (54.6%) |
| 6 to 18 Years | 5,987 (44.4%) | 8,100 (60.1%) |
| 19 to 25 Years | 1,828 (26.5%) | 4,880 (70.8%) |
| 25 to 34 Years | 2,545 (28.6%) | 5,440 (61.2%) |
| 35 to 44 Years | 2,735 (30.3%) | 6,071 (67.3%) |
| 45 to 54 Years | 2,754 (27.8%) | 7,274 (73.3%) |
| 55 to 64 Years | 3,397 (28.7%) | 9,151 (77.2%) |
| 65 to 74 Years | 9,141 (98.0%) | 5,138 (55.1%) |
| 75 Years and over | 6,544 (99.5%) | 4,237 (64.4%) |
| Total | 37,483 (46.2%) | 53,149 (65.5%) |
Disability Status by Sex by Age in Chemung County
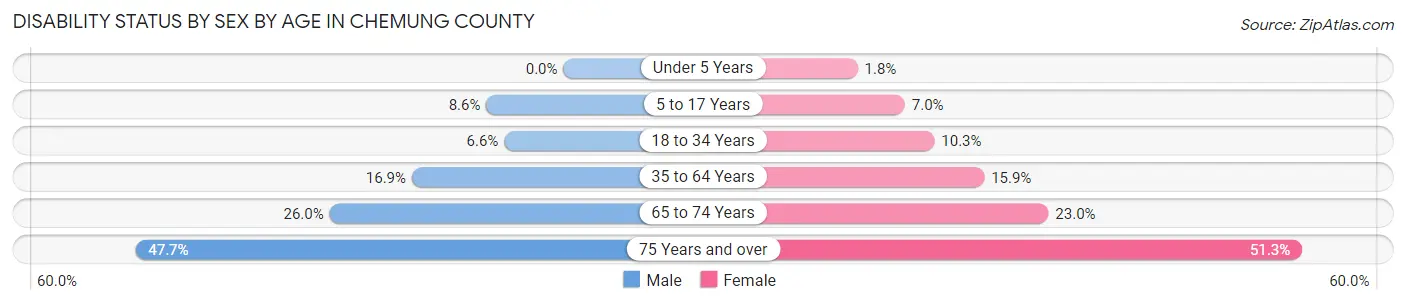
| Age Bracket | Male | Female |
| Under 5 Years | 0 (0.0%) | 40 (1.8%) |
| 5 to 17 Years | 586 (8.6%) | 447 (7.0%) |
| 18 to 34 Years | 576 (6.6%) | 845 (10.3%) |
| 35 to 64 Years | 2,502 (16.9%) | 2,531 (15.9%) |
| 65 to 74 Years | 1,147 (26.0%) | 1,132 (23.0%) |
| 75 Years and over | 1,304 (47.7%) | 1,969 (51.3%) |
Disability Class by Sex by Age in Chemung County
Disability Class: Hearing Difficulty
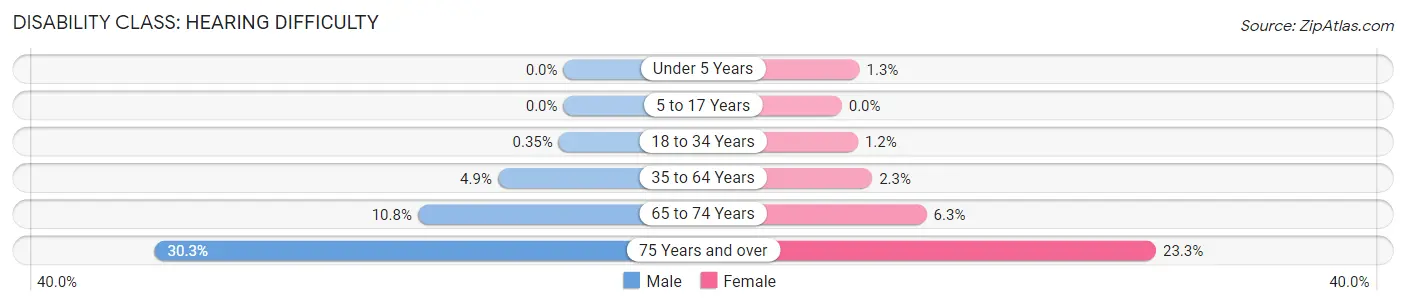
| Age Bracket | Male | Female |
| Under 5 Years | 0 (0.0%) | 30 (1.3%) |
| 5 to 17 Years | 0 (0.0%) | 0 (0.0%) |
| 18 to 34 Years | 31 (0.4%) | 98 (1.2%) |
| 35 to 64 Years | 723 (4.9%) | 360 (2.3%) |
| 65 to 74 Years | 476 (10.8%) | 310 (6.3%) |
| 75 Years and over | 830 (30.3%) | 896 (23.3%) |
Disability Class: Vision Difficulty
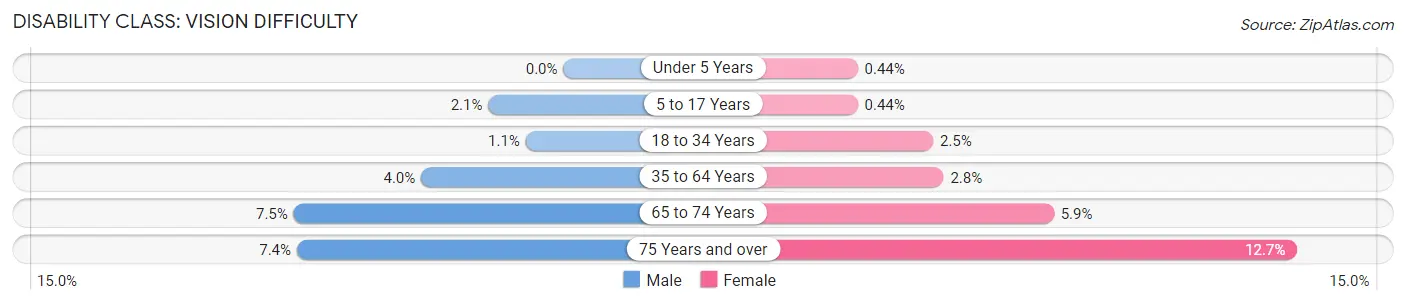
| Age Bracket | Male | Female |
| Under 5 Years | 0 (0.0%) | 10 (0.4%) |
| 5 to 17 Years | 143 (2.1%) | 28 (0.4%) |
| 18 to 34 Years | 92 (1.1%) | 208 (2.5%) |
| 35 to 64 Years | 588 (4.0%) | 452 (2.8%) |
| 65 to 74 Years | 331 (7.5%) | 290 (5.9%) |
| 75 Years and over | 203 (7.4%) | 487 (12.7%) |
Disability Class: Cognitive Difficulty
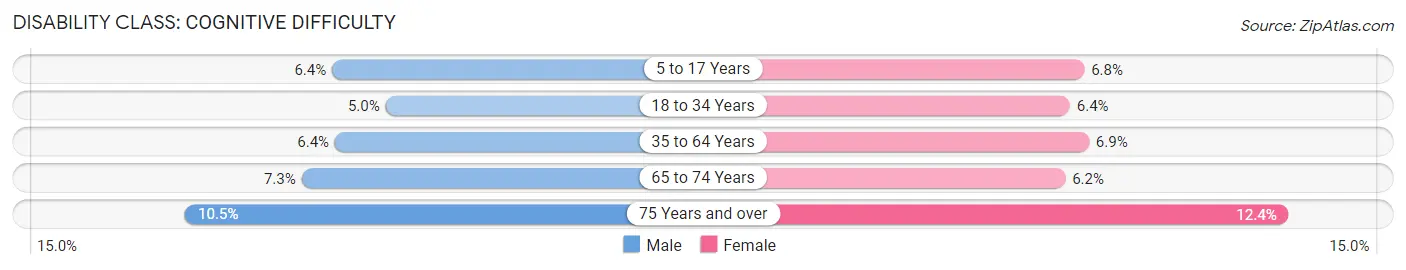
| Age Bracket | Male | Female |
| 5 to 17 Years | 440 (6.4%) | 430 (6.8%) |
| 18 to 34 Years | 433 (5.0%) | 520 (6.4%) |
| 35 to 64 Years | 944 (6.4%) | 1,098 (6.9%) |
| 65 to 74 Years | 321 (7.3%) | 306 (6.2%) |
| 75 Years and over | 288 (10.5%) | 478 (12.4%) |
Disability Class: Ambulatory Difficulty
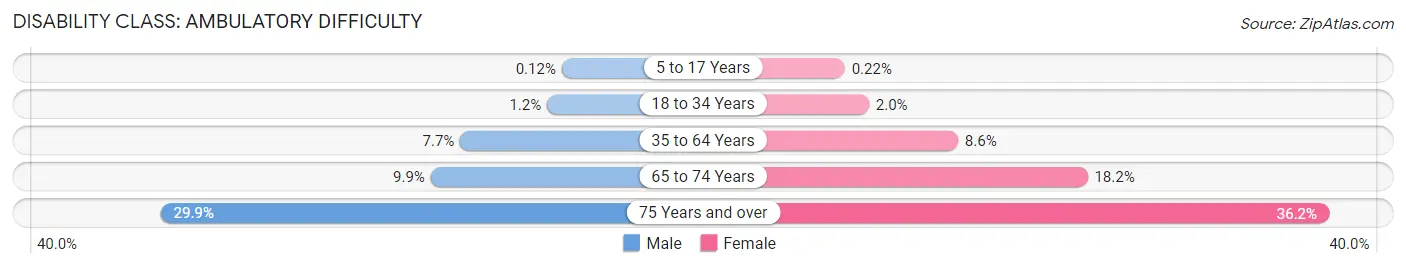
| Age Bracket | Male | Female |
| 5 to 17 Years | 8 (0.1%) | 14 (0.2%) |
| 18 to 34 Years | 106 (1.2%) | 165 (2.0%) |
| 35 to 64 Years | 1,136 (7.7%) | 1,376 (8.6%) |
| 65 to 74 Years | 434 (9.9%) | 897 (18.2%) |
| 75 Years and over | 818 (29.9%) | 1,389 (36.2%) |
Disability Class: Self-Care Difficulty
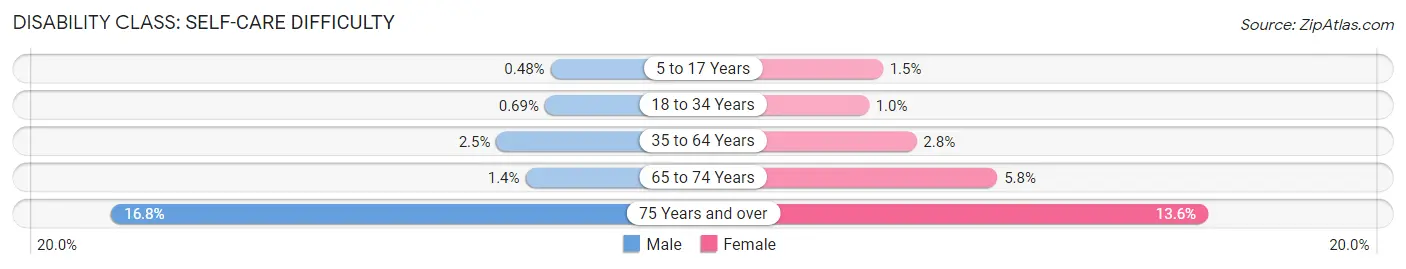
| Age Bracket | Male | Female |
| 5 to 17 Years | 33 (0.5%) | 97 (1.5%) |
| 18 to 34 Years | 60 (0.7%) | 82 (1.0%) |
| 35 to 64 Years | 370 (2.5%) | 442 (2.8%) |
| 65 to 74 Years | 62 (1.4%) | 284 (5.8%) |
| 75 Years and over | 459 (16.8%) | 522 (13.6%) |
Technology Access in Chemung County
Computing Device Access in Chemung County
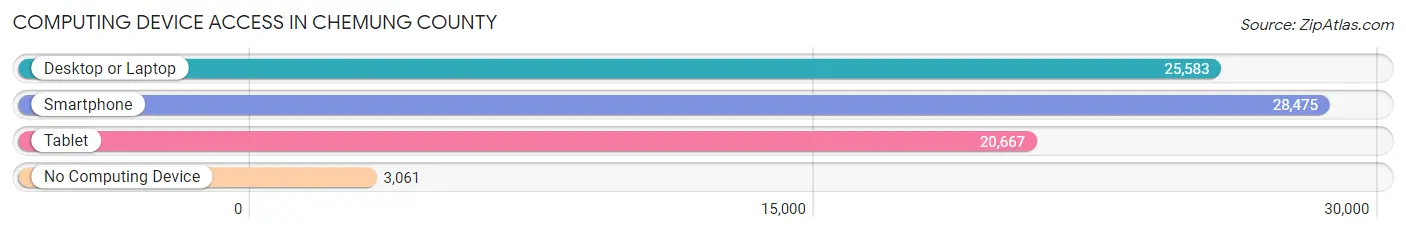
| Device Type | # Households | % Households |
| Desktop or Laptop | 25,583 | 73.6% |
| Smartphone | 28,475 | 81.9% |
| Tablet | 20,667 | 59.4% |
| No Computing Device | 3,061 | 8.8% |
| Total | 34,779 | 100.0% |
Internet Access in Chemung County
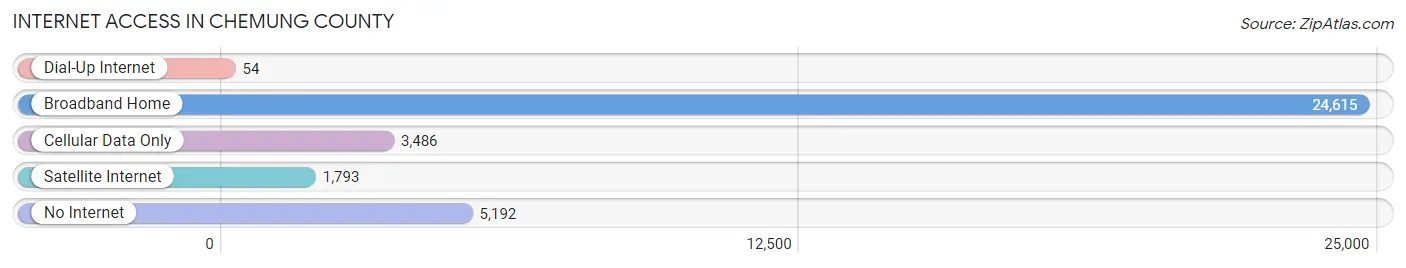
| Internet Type | # Households | % Households |
| Dial-Up Internet | 54 | 0.2% |
| Broadband Home | 24,615 | 70.8% |
| Cellular Data Only | 3,486 | 10.0% |
| Satellite Internet | 1,793 | 5.2% |
| No Internet | 5,192 | 14.9% |
| Total | 34,779 | 100.0% |
Chemung County Summary
Introduction
Chemung County is located in the Southern Tier of New York State, and is part of the Elmira-Corning Metropolitan Statistical Area. It is bordered by Schuyler County to the west, Steuben County to the east, and Tioga County to the north. The county seat is Elmira, and the largest city is Elmira. The county has a total area of 411 square miles, and a population of 88,830 as of the 2010 census.
History
The area that is now Chemung County was originally inhabited by the Iroquois and Susquehannock Native American tribes. The first European settlers arrived in the area in the late 1700s, and the county was officially established in 1836. The name “Chemung” is derived from the Native American word for “big horn,” which was the name of a river that ran through the area.
The county was an important transportation hub in the 19th century, with the Chemung Canal connecting the Chemung River to the Susquehanna River, and the Erie Railroad connecting Elmira to New York City. The county was also home to several industries, including lumber, paper, and textiles.
In the 20th century, the county’s economy shifted to manufacturing, with the opening of several factories in the area. The county was also home to the Elmira Correctional Facility, which was the largest maximum-security prison in the state.
Geography
Chemung County is located in the Southern Tier of New York State, and is part of the Elmira-Corning Metropolitan Statistical Area. It is bordered by Schuyler County to the west, Steuben County to the east, and Tioga County to the north. The county has a total area of 411 square miles, and is located in the Appalachian Plateau region of the state.
The terrain of the county is mostly hilly, with the highest point being the summit of Catlin Hill, which has an elevation of 1,912 feet. The county is home to several rivers, including the Chemung River, the Tioga River, and the Cohocton River. The county also contains several lakes, including Seneca Lake, Cayuta Lake, and Waneta Lake.
Economy
The economy of Chemung County is largely based on manufacturing, with the largest employers in the county being Corning Inc., Arnot Ogden Medical Center, and Elmira Correctional Facility. Other major employers in the county include Chemung Canal Trust Company, Elmira City School District, and Elmira College.
The county is also home to several tourist attractions, including the National Soaring Museum, the Corning Museum of Glass, and the Mark Twain Study. The county is also home to several wineries, including Hazlitt 1852 Vineyards and Wagner Vineyards.
Demographics
As of the 2010 census, the population of Chemung County was 88,830, with a population density of 217 people per square mile. The racial makeup of the county was 92.3% White, 4.2% African American, 0.5% Native American, 0.7% Asian, 0.1% Pacific Islander, and 1.2% from other races. The median household income in the county was $45,945, and the median family income was $54,945.
Conclusion
Chemung County is located in the Southern Tier of New York State, and is part of the Elmira-Corning Metropolitan Statistical Area. It has a total area of 411 square miles, and a population of 88,830 as of the 2010 census. The county’s economy is largely based on manufacturing, and it is also home to several tourist attractions and wineries. The racial makeup of the county is mostly White, with African Americans, Native Americans, Asians, and Pacific Islanders making up the remainder of the population.
Common Questions
What is Per Capita Income in Chemung County?
Per Capita income in Chemung County is $34,304.
What is the Median Family Income in Chemung County?
Median Family Income in Chemung County is $77,618.
What is the Median Household income in Chemung County?
Median Household Income in Chemung County is $61,358.
What is Income or Wage Gap in Chemung County?
Income or Wage Gap in Chemung County is 24.1%.
Women in Chemung County earn 75.9 cents for every dollar earned by a man.
What is Family Income Deficit in Chemung County?
Family Income Deficit in Chemung County is $9,851.
Families that are below poverty line in Chemung County earn $9,851 less on average than the poverty threshold level.
What is Inequality or Gini Index in Chemung County?
Inequality or Gini Index in Chemung County is 0.46.
What is the Total Population of Chemung County?
Total Population of Chemung County is 83,584.
What is the Total Male Population of Chemung County?
Total Male Population of Chemung County is 41,704.
What is the Total Female Population of Chemung County?
Total Female Population of Chemung County is 41,880.
What is the Ratio of Males per 100 Females in Chemung County?
There are 99.58 Males per 100 Females in Chemung County.
What is the Ratio of Females per 100 Males in Chemung County?
There are 100.42 Females per 100 Males in Chemung County.
What is the Median Population Age in Chemung County?
Median Population Age in Chemung County is 41.7 Years.
What is the Average Family Size in Chemung County
Average Family Size in Chemung County is 2.9 People.
What is the Average Household Size in Chemung County
Average Household Size in Chemung County is 2.3 People.
How Large is the Labor Force in Chemung County?
There are 39,243 People in the Labor Forcein in Chemung County.
What is the Percentage of People in the Labor Force in Chemung County?
57.5% of People are in the Labor Force in Chemung County.
What is the Unemployment Rate in Chemung County?
Unemployment Rate in Chemung County is 6.3%.