Cayuga County, NY Map & Demographics
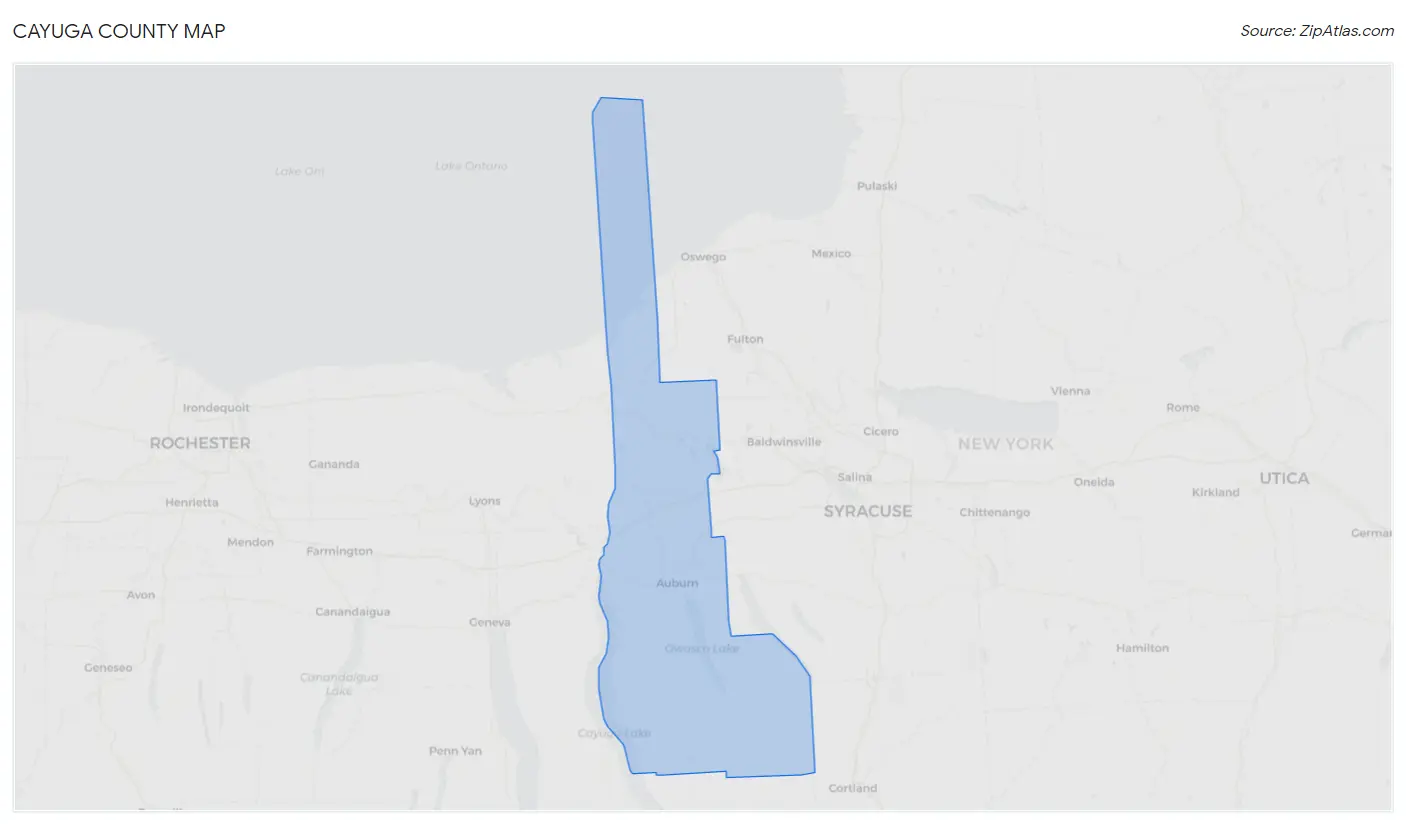
Cayuga County Map
Cayuga County Overview
$35,579
PER CAPITA INCOME
$85,900
AVG FAMILY INCOME
$63,227
AVG HOUSEHOLD INCOME
27.2%
WAGE / INCOME GAP [ % ]
72.8¢/ $1
WAGE / INCOME GAP [ $ ]
$10,712
FAMILY INCOME DEFICIT
0.45
INEQUALITY / GINI INDEX
76,171
TOTAL POPULATION
39,143
MALE POPULATION
37,028
FEMALE POPULATION
105.71
MALES / 100 FEMALES
94.60
FEMALES / 100 MALES
43.4
MEDIAN AGE
2.9
AVG FAMILY SIZE
2.3
AVG HOUSEHOLD SIZE
36,324
LABOR FORCE [ PEOPLE ]
57.6%
PERCENT IN LABOR FORCE
4.3%
UNEMPLOYMENT RATE
Cayuga County Area Codes
Income in Cayuga County
Income Overview in Cayuga County
Per Capita Income in Cayuga County is $35,579, while median incomes of families and households are $85,900 and $63,227 respectively.
| Characteristic | Number | Measure |
| Per Capita Income | 76,171 | $35,579 |
| Median Family Income | 18,716 | $85,900 |
| Mean Family Income | 18,716 | $103,535 |
| Median Household Income | 30,910 | $63,227 |
| Mean Household Income | 30,910 | $85,431 |
| Income Deficit | 18,716 | $10,712 |
| Wage / Income Gap (%) | 76,171 | 27.21% |
| Wage / Income Gap ($) | 76,171 | 72.79¢ per $1 |
| Gini / Inequality Index | 76,171 | 0.45 |
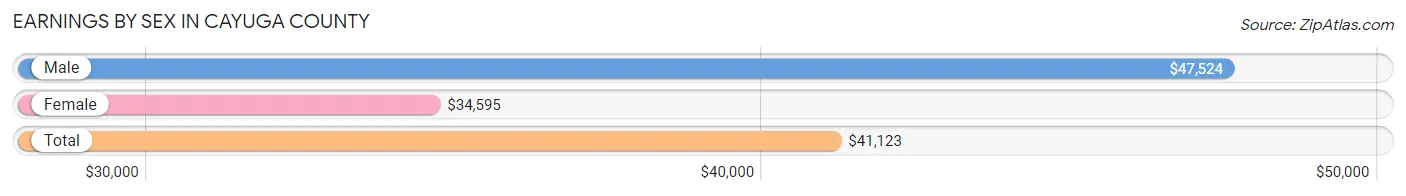
Earnings by Sex in Cayuga County
Average Earnings in Cayuga County are $41,123, $47,524 for men and $34,595 for women, a difference of 27.2%.
| Sex | Number | Average Earnings |
| Male | 20,289 (52.6%) | $47,524 |
| Female | 18,254 (47.4%) | $34,595 |
| Total | 38,543 (100.0%) | $41,123 |
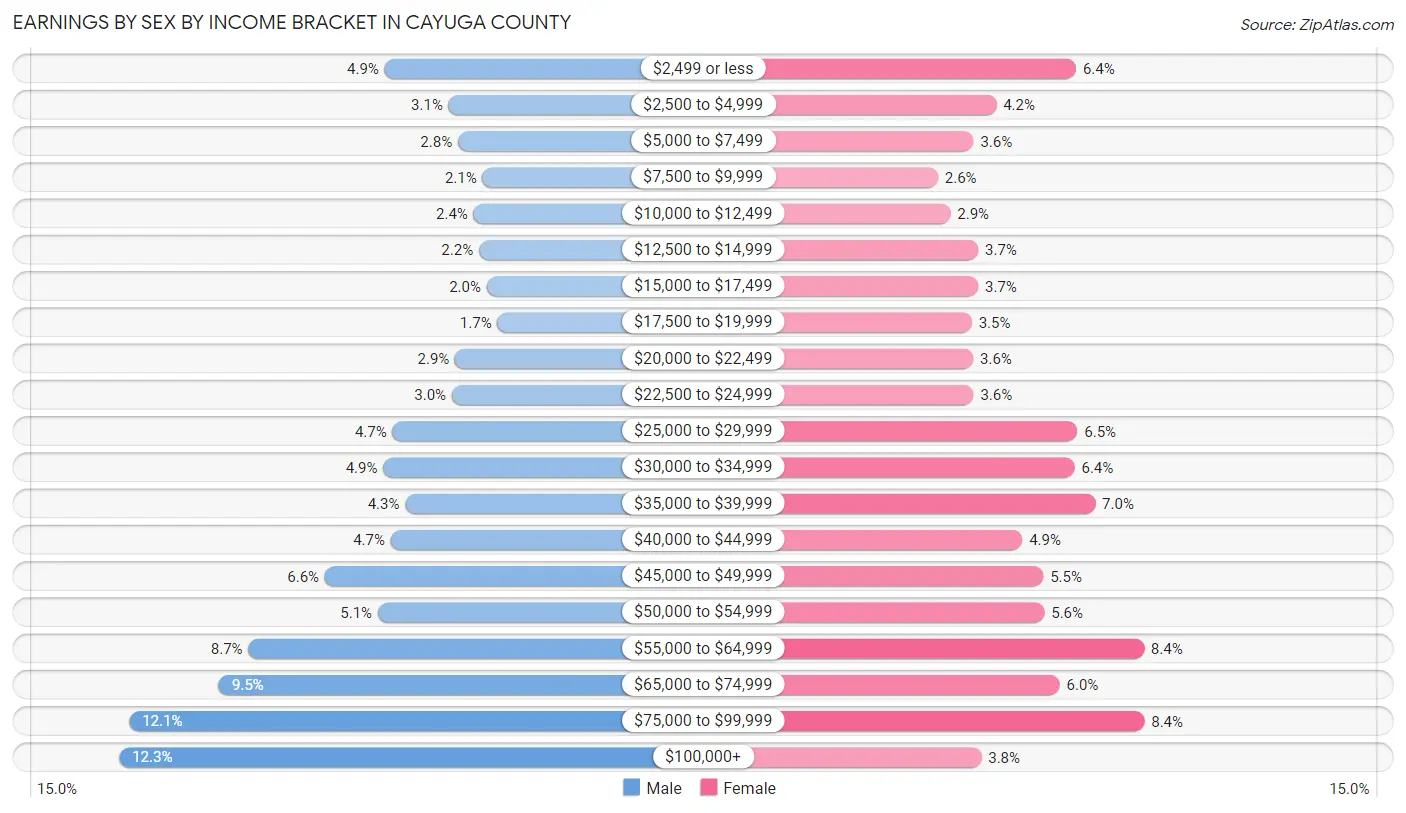
Earnings by Sex by Income Bracket in Cayuga County
The most common earnings brackets in Cayuga County are $100,000+ for men (2,504 | 12.3%) and $75,000 to $99,999 for women (1,526 | 8.4%).
| Income | Male | Female |
| $2,499 or less | 991 (4.9%) | 1,175 (6.4%) |
| $2,500 to $4,999 | 624 (3.1%) | 767 (4.2%) |
| $5,000 to $7,499 | 572 (2.8%) | 649 (3.6%) |
| $7,500 to $9,999 | 432 (2.1%) | 468 (2.6%) |
| $10,000 to $12,499 | 483 (2.4%) | 532 (2.9%) |
| $12,500 to $14,999 | 453 (2.2%) | 674 (3.7%) |
| $15,000 to $17,499 | 407 (2.0%) | 674 (3.7%) |
| $17,500 to $19,999 | 347 (1.7%) | 640 (3.5%) |
| $20,000 to $22,499 | 589 (2.9%) | 648 (3.5%) |
| $22,500 to $24,999 | 607 (3.0%) | 649 (3.6%) |
| $25,000 to $29,999 | 946 (4.7%) | 1,182 (6.5%) |
| $30,000 to $34,999 | 998 (4.9%) | 1,168 (6.4%) |
| $35,000 to $39,999 | 873 (4.3%) | 1,274 (7.0%) |
| $40,000 to $44,999 | 955 (4.7%) | 900 (4.9%) |
| $45,000 to $49,999 | 1,330 (6.6%) | 1,008 (5.5%) |
| $50,000 to $54,999 | 1,028 (5.1%) | 1,014 (5.6%) |
| $55,000 to $64,999 | 1,768 (8.7%) | 1,525 (8.4%) |
| $65,000 to $74,999 | 1,936 (9.5%) | 1,091 (6.0%) |
| $75,000 to $99,999 | 2,446 (12.1%) | 1,526 (8.4%) |
| $100,000+ | 2,504 (12.3%) | 690 (3.8%) |
| Total | 20,289 (100.0%) | 18,254 (100.0%) |
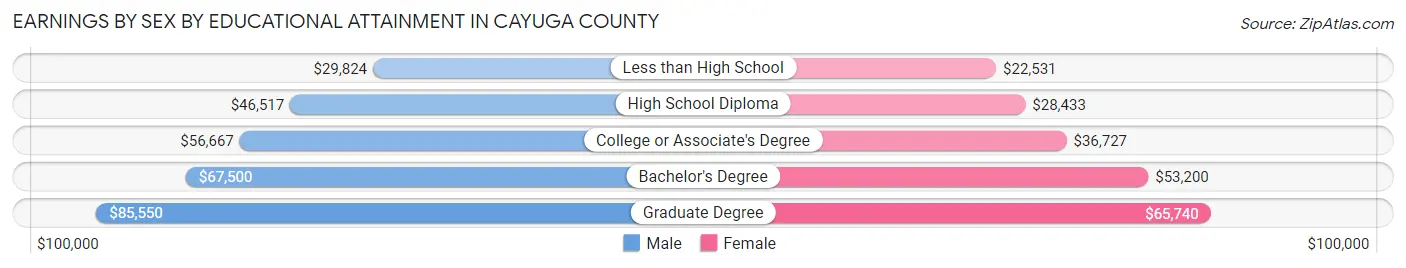
Earnings by Sex by Educational Attainment in Cayuga County
Average earnings in Cayuga County are $53,165 for men and $38,867 for women, a difference of 26.9%. Men with an educational attainment of graduate degree enjoy the highest average annual earnings of $85,550, while those with less than high school education earn the least with $29,824. Women with an educational attainment of graduate degree earn the most with the average annual earnings of $65,740, while those with less than high school education have the smallest earnings of $22,531.
| Educational Attainment | Male Income | Female Income |
| Less than High School | $29,824 | $22,531 |
| High School Diploma | $46,517 | $28,433 |
| College or Associate's Degree | $56,667 | $36,727 |
| Bachelor's Degree | $67,500 | $53,200 |
| Graduate Degree | $85,550 | $65,740 |
| Total | $53,165 | $38,867 |
Family Income in Cayuga County
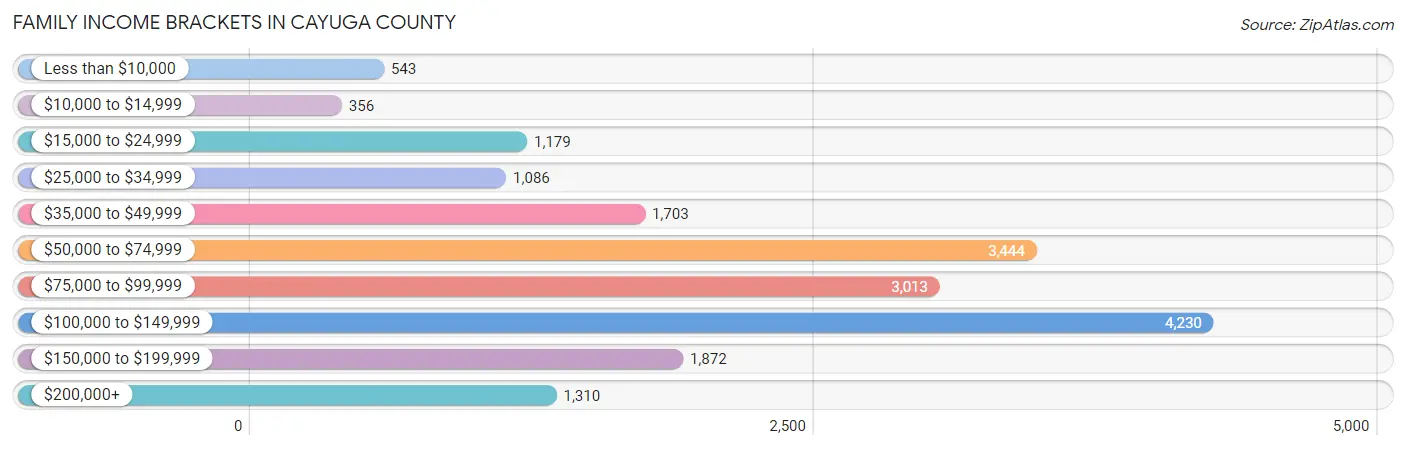
Family Income Brackets in Cayuga County
According to the Cayuga County family income data, there are 4,230 families falling into the $100,000 to $149,999 income range, which is the most common income bracket and makes up 22.6% of all families. Conversely, the $10,000 to $14,999 income bracket is the least frequent group with only 356 families (1.9%) belonging to this category.
| Income Bracket | # Families | % Families |
| Less than $10,000 | 543 | 2.9% |
| $10,000 to $14,999 | 356 | 1.9% |
| $15,000 to $24,999 | 1,179 | 6.3% |
| $25,000 to $34,999 | 1,086 | 5.8% |
| $35,000 to $49,999 | 1,703 | 9.1% |
| $50,000 to $74,999 | 3,444 | 18.4% |
| $75,000 to $99,999 | 3,013 | 16.1% |
| $100,000 to $149,999 | 4,230 | 22.6% |
| $150,000 to $199,999 | 1,872 | 10.0% |
| $200,000+ | 1,310 | 7.0% |
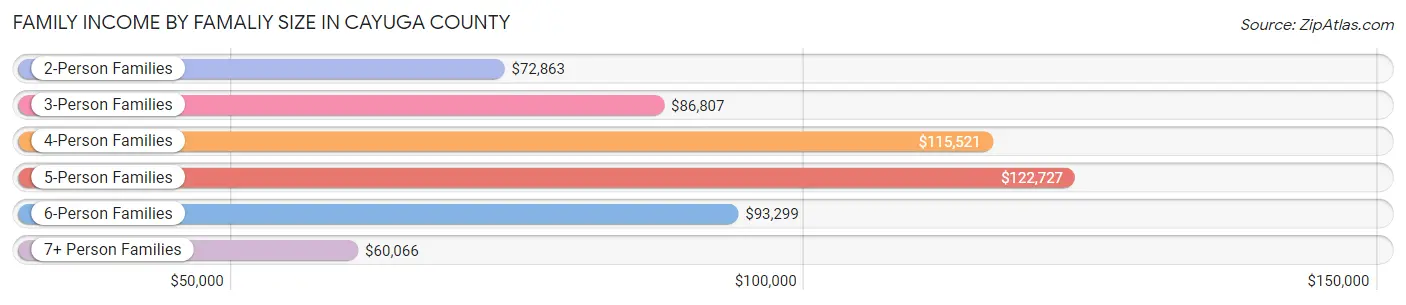
Family Income by Famaliy Size in Cayuga County
5-person families (1,144 | 6.1%) account for the highest median family income in Cayuga County with $122,727 per family, while 2-person families (10,045 | 53.7%) have the highest median income of $36,432 per family member.
| Income Bracket | # Families | Median Income |
| 2-Person Families | 10,045 (53.7%) | $72,863 |
| 3-Person Families | 3,813 (20.4%) | $86,807 |
| 4-Person Families | 3,103 (16.6%) | $115,521 |
| 5-Person Families | 1,144 (6.1%) | $122,727 |
| 6-Person Families | 354 (1.9%) | $93,299 |
| 7+ Person Families | 257 (1.4%) | $60,066 |
| Total | 18,716 (100.0%) | $85,900 |
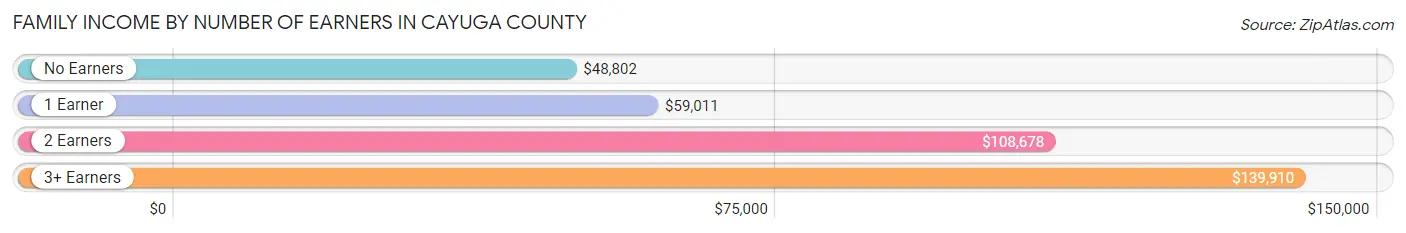
Family Income by Number of Earners in Cayuga County
The median family income in Cayuga County is $85,900, with families comprising 3+ earners (1,847) having the highest median family income of $139,910, while families with no earners (3,415) have the lowest median family income of $48,802, accounting for 9.9% and 18.2% of families, respectively.
| Number of Earners | # Families | Median Income |
| No Earners | 3,415 (18.2%) | $48,802 |
| 1 Earner | 6,093 (32.6%) | $59,011 |
| 2 Earners | 7,361 (39.3%) | $108,678 |
| 3+ Earners | 1,847 (9.9%) | $139,910 |
| Total | 18,716 (100.0%) | $85,900 |
Household Income in Cayuga County
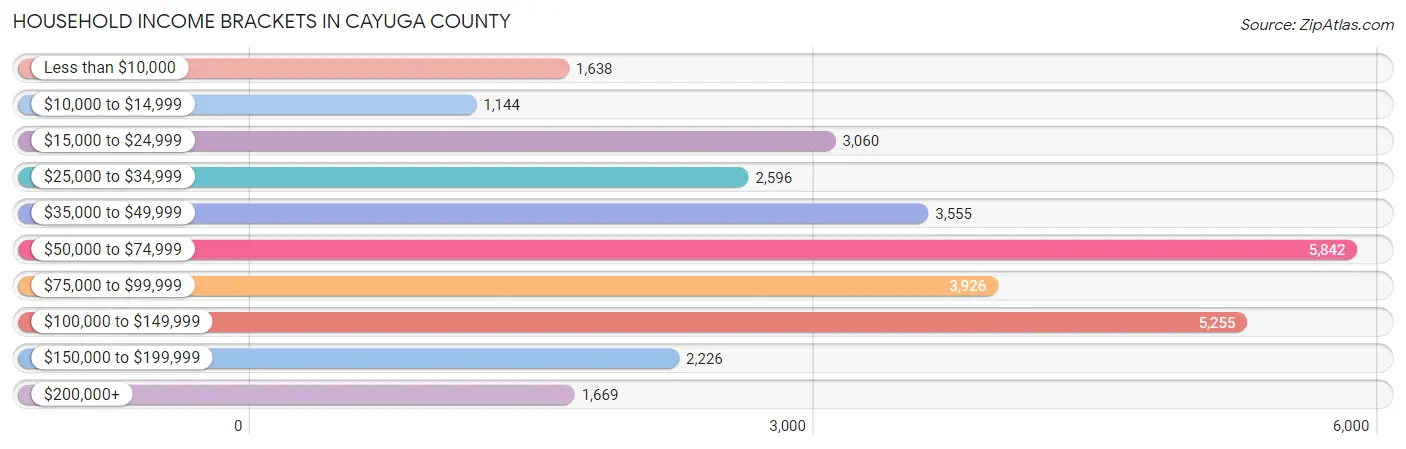
Household Income Brackets in Cayuga County
With 5,842 households falling in the category, the $50,000 to $74,999 income range is the most frequent in Cayuga County, accounting for 18.9% of all households. In contrast, only 1,144 households (3.7%) fall into the $10,000 to $14,999 income bracket, making it the least populous group.
| Income Bracket | # Households | % Households |
| Less than $10,000 | 1,638 | 5.3% |
| $10,000 to $14,999 | 1,144 | 3.7% |
| $15,000 to $24,999 | 3,060 | 9.9% |
| $25,000 to $34,999 | 2,596 | 8.4% |
| $35,000 to $49,999 | 3,555 | 11.5% |
| $50,000 to $74,999 | 5,842 | 18.9% |
| $75,000 to $99,999 | 3,926 | 12.7% |
| $100,000 to $149,999 | 5,255 | 17.0% |
| $150,000 to $199,999 | 2,226 | 7.2% |
| $200,000+ | 1,669 | 5.4% |
Household Income by Householder Age in Cayuga County
The median household income in Cayuga County is $63,227, with the highest median household income of $79,345 found in the 45 to 64 years age bracket for the primary householder. A total of 11,588 households (37.5%) fall into this category. Meanwhile, the 65+ years age bracket for the primary householder has the lowest median household income of $47,063, with 10,061 households (32.6%) in this group.
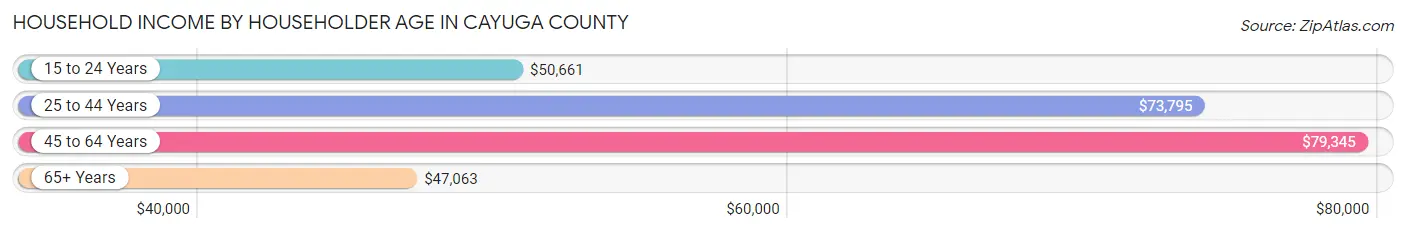
| Income Bracket | # Households | Median Income |
| 15 to 24 Years | 778 (2.5%) | $50,661 |
| 25 to 44 Years | 8,483 (27.4%) | $73,795 |
| 45 to 64 Years | 11,588 (37.5%) | $79,345 |
| 65+ Years | 10,061 (32.6%) | $47,063 |
| Total | 30,910 (100.0%) | $63,227 |
Poverty in Cayuga County
Income Below Poverty by Sex and Age in Cayuga County
With 12.0% poverty level for males and 14.9% for females among the residents of Cayuga County, 12 to 14 year old males and 5 year old females are the most vulnerable to poverty, with 337 males (23.4%) and 150 females (31.1%) in their respective age groups living below the poverty level.
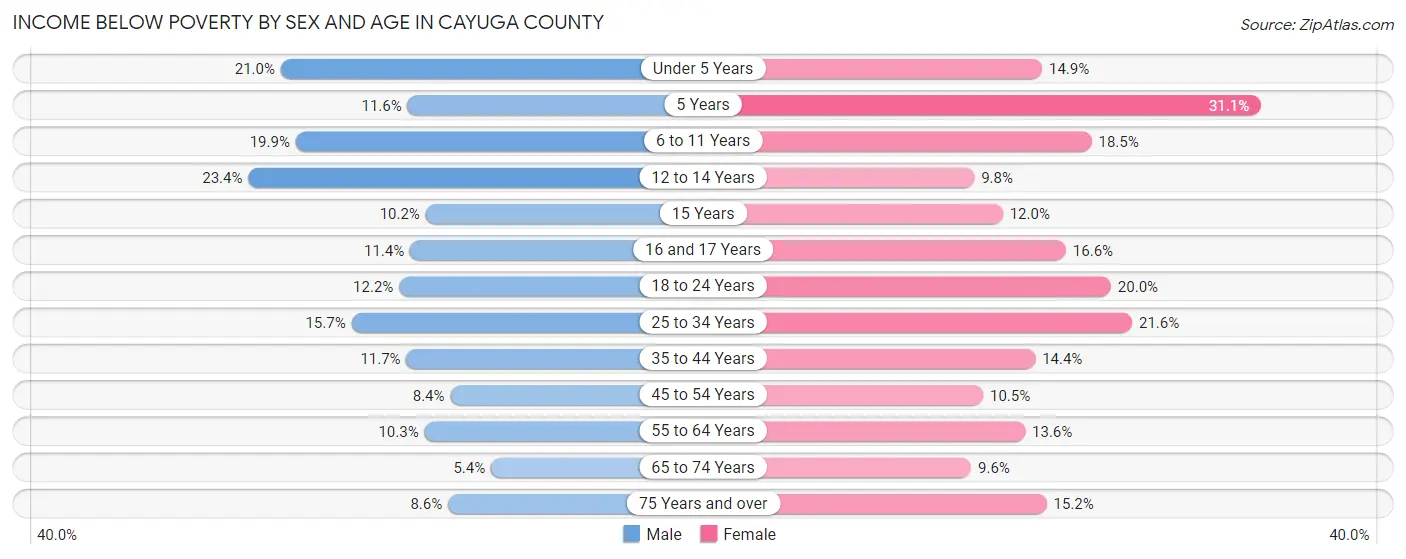
| Age Bracket | Male | Female |
| Under 5 Years | 395 (21.0%) | 259 (14.9%) |
| 5 Years | 56 (11.6%) | 150 (31.1%) |
| 6 to 11 Years | 444 (19.9%) | 427 (18.5%) |
| 12 to 14 Years | 337 (23.4%) | 108 (9.8%) |
| 15 Years | 52 (10.2%) | 65 (11.9%) |
| 16 and 17 Years | 105 (11.4%) | 125 (16.6%) |
| 18 to 24 Years | 343 (12.2%) | 512 (20.0%) |
| 25 to 34 Years | 715 (15.7%) | 926 (21.5%) |
| 35 to 44 Years | 479 (11.7%) | 599 (14.4%) |
| 45 to 54 Years | 387 (8.4%) | 477 (10.5%) |
| 55 to 64 Years | 583 (10.3%) | 803 (13.6%) |
| 65 to 74 Years | 237 (5.4%) | 425 (9.6%) |
| 75 Years and over | 221 (8.6%) | 514 (15.2%) |
| Total | 4,354 (12.0%) | 5,390 (14.9%) |
Income Above Poverty by Sex and Age in Cayuga County
According to the poverty statistics in Cayuga County, males aged 65 to 74 years and females aged 65 to 74 years are the age groups that are most secure financially, with 94.6% of males and 90.4% of females in these age groups living above the poverty line.
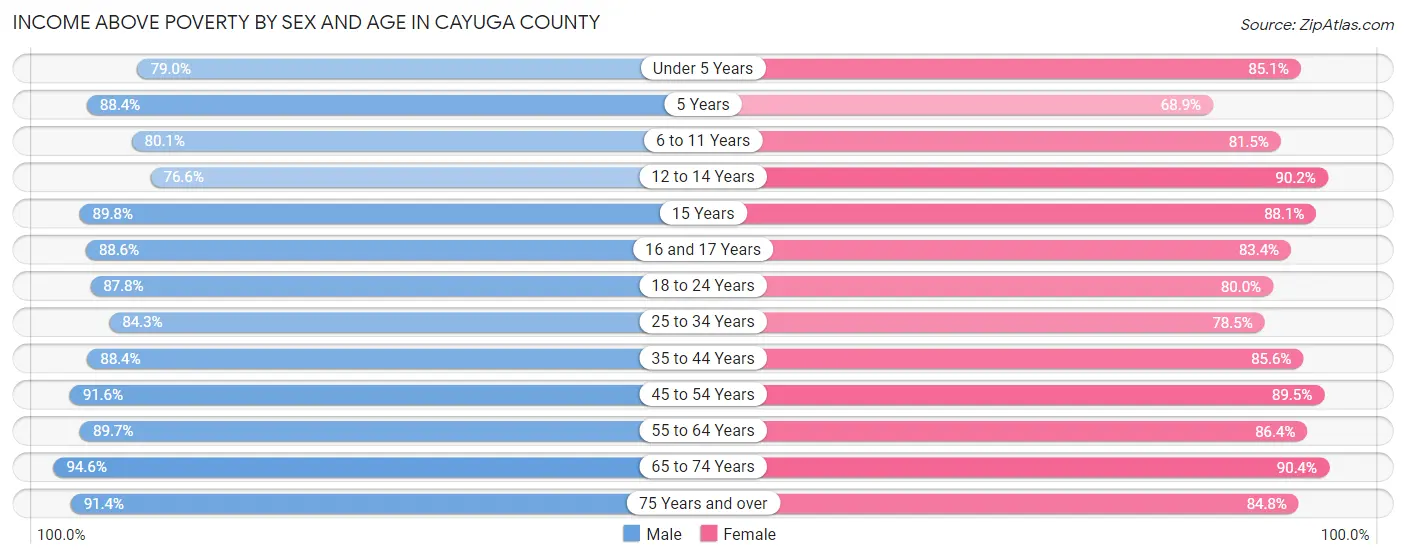
| Age Bracket | Male | Female |
| Under 5 Years | 1,488 (79.0%) | 1,483 (85.1%) |
| 5 Years | 428 (88.4%) | 332 (68.9%) |
| 6 to 11 Years | 1,790 (80.1%) | 1,876 (81.5%) |
| 12 to 14 Years | 1,104 (76.6%) | 991 (90.2%) |
| 15 Years | 457 (89.8%) | 479 (88.0%) |
| 16 and 17 Years | 818 (88.6%) | 626 (83.4%) |
| 18 to 24 Years | 2,470 (87.8%) | 2,050 (80.0%) |
| 25 to 34 Years | 3,831 (84.3%) | 3,370 (78.4%) |
| 35 to 44 Years | 3,631 (88.3%) | 3,573 (85.6%) |
| 45 to 54 Years | 4,224 (91.6%) | 4,070 (89.5%) |
| 55 to 64 Years | 5,070 (89.7%) | 5,096 (86.4%) |
| 65 to 74 Years | 4,173 (94.6%) | 4,000 (90.4%) |
| 75 Years and over | 2,362 (91.4%) | 2,867 (84.8%) |
| Total | 31,846 (88.0%) | 30,813 (85.1%) |
Income Below Poverty Among Married-Couple Families in Cayuga County
The poverty statistics for married-couple families in Cayuga County show that 3.5% or 459 of the total 13,303 families live below the poverty line. Families with 5 or more children have the highest poverty rate of 26.5%, comprising of 31 families. On the other hand, families with 1 or 2 children have the lowest poverty rate of 2.4%, which includes 82 families.
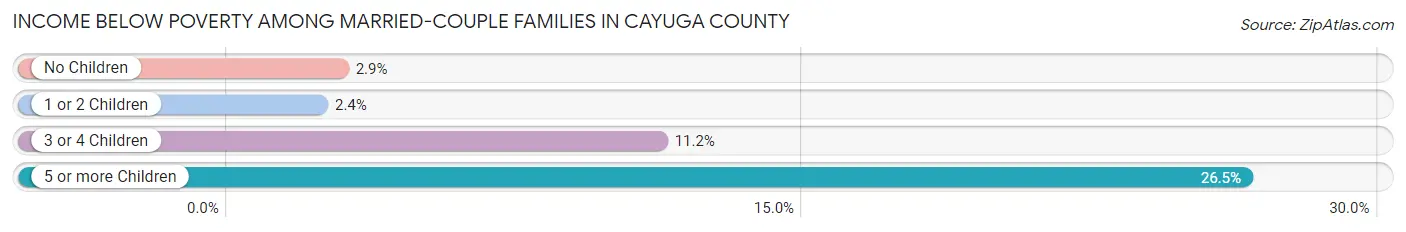
| Children | Above Poverty | Below Poverty |
| No Children | 8,643 (97.1%) | 257 (2.9%) |
| 1 or 2 Children | 3,411 (97.7%) | 82 (2.4%) |
| 3 or 4 Children | 704 (88.8%) | 89 (11.2%) |
| 5 or more Children | 86 (73.5%) | 31 (26.5%) |
| Total | 12,844 (96.6%) | 459 (3.5%) |
Income Below Poverty Among Single-Parent Households in Cayuga County
According to the poverty data in Cayuga County, 15.4% or 299 single-father households and 23.8% or 829 single-mother households are living below the poverty line. Among single-father households, those with 3 or 4 children have the highest poverty rate, with 120 households (58.0%) experiencing poverty. Likewise, among single-mother households, those with 5 or more children have the highest poverty rate, with 16 households (61.5%) falling below the poverty line.
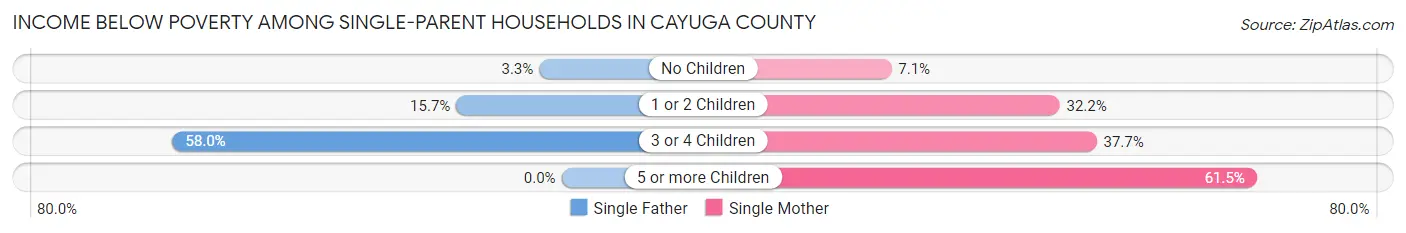
| Children | Single Father | Single Mother |
| No Children | 24 (3.3%) | 90 (7.1%) |
| 1 or 2 Children | 155 (15.7%) | 590 (32.2%) |
| 3 or 4 Children | 120 (58.0%) | 133 (37.7%) |
| 5 or more Children | 0 (0.0%) | 16 (61.5%) |
| Total | 299 (15.4%) | 829 (23.8%) |
Income Below Poverty Among Married-Couple vs Single-Parent Households in Cayuga County
The poverty data for Cayuga County shows that 459 of the married-couple family households (3.5%) and 1,128 of the single-parent households (20.8%) are living below the poverty level. Within the married-couple family households, those with 5 or more children have the highest poverty rate, with 31 households (26.5%) falling below the poverty line. Among the single-parent households, those with 3 or 4 children have the highest poverty rate, with 253 household (45.2%) living below poverty.
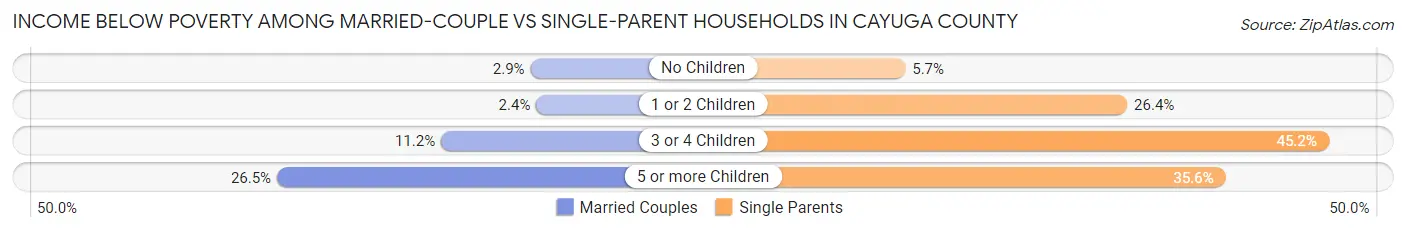
| Children | Married-Couple Families | Single-Parent Households |
| No Children | 257 (2.9%) | 114 (5.7%) |
| 1 or 2 Children | 82 (2.4%) | 745 (26.4%) |
| 3 or 4 Children | 89 (11.2%) | 253 (45.2%) |
| 5 or more Children | 31 (26.5%) | 16 (35.6%) |
| Total | 459 (3.5%) | 1,128 (20.8%) |
Race in Cayuga County
The most populous races in Cayuga County are White / Caucasian (68,242 | 89.6%), Two or more Races (3,500 | 4.6%), and Black / African American (2,625 | 3.5%).
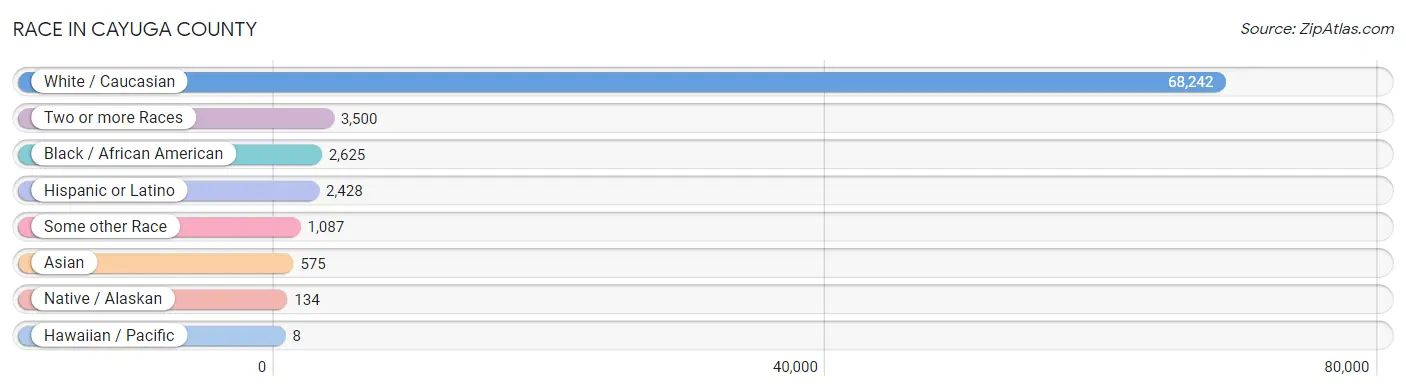
| Race | # Population | % Population |
| Asian | 575 | 0.7% |
| Black / African American | 2,625 | 3.5% |
| Hawaiian / Pacific | 8 | 0.0% |
| Hispanic or Latino | 2,428 | 3.2% |
| Native / Alaskan | 134 | 0.2% |
| White / Caucasian | 68,242 | 89.6% |
| Two or more Races | 3,500 | 4.6% |
| Some other Race | 1,087 | 1.4% |
| Total | 76,171 | 100.0% |
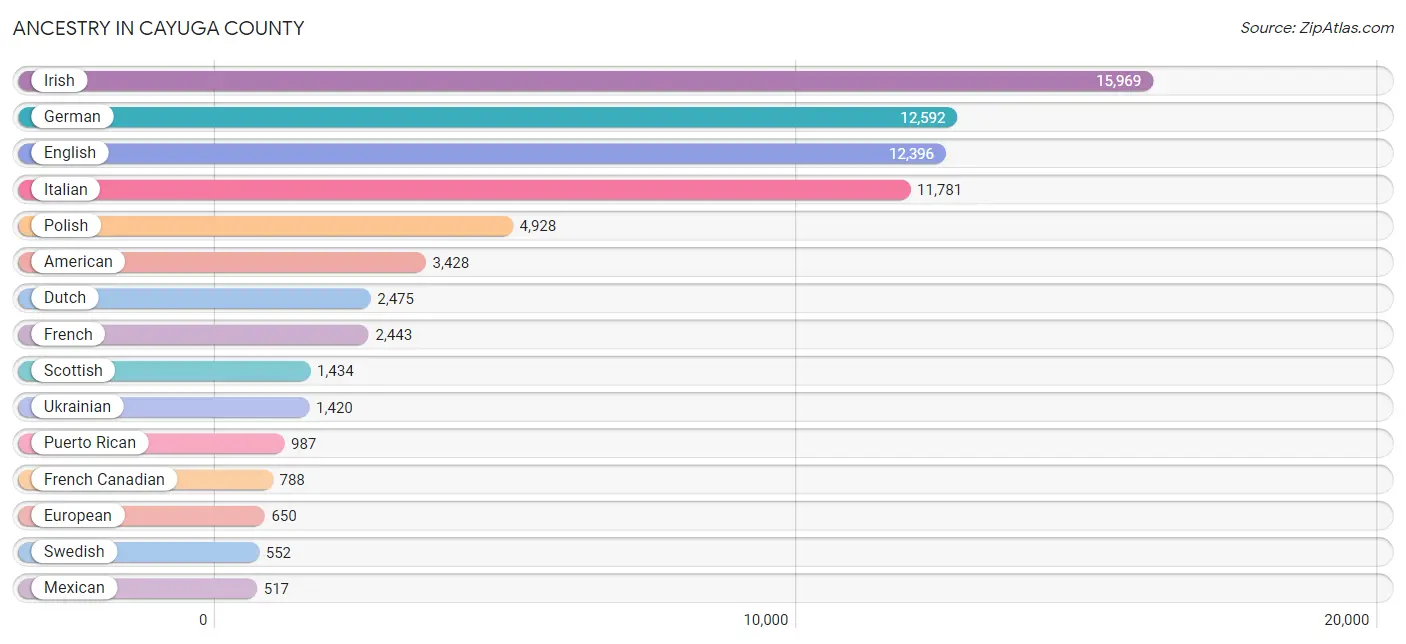
Ancestry in Cayuga County
The most populous ancestries reported in Cayuga County are Irish (15,969 | 21.0%), German (12,592 | 16.5%), English (12,396 | 16.3%), Italian (11,781 | 15.5%), and Polish (4,928 | 6.5%), together accounting for 75.7% of all Cayuga County residents.
| Ancestry | # Population | % Population |
| African | 21 | 0.0% |
| Albanian | 3 | 0.0% |
| American | 3,428 | 4.5% |
| Arab | 117 | 0.2% |
| Armenian | 27 | 0.0% |
| Australian | 3 | 0.0% |
| Austrian | 93 | 0.1% |
| Belgian | 42 | 0.1% |
| Bhutanese | 295 | 0.4% |
| Blackfeet | 4 | 0.0% |
| Brazilian | 2 | 0.0% |
| British | 239 | 0.3% |
| Burmese | 48 | 0.1% |
| Canadian | 89 | 0.1% |
| Central American | 248 | 0.3% |
| Central American Indian | 15 | 0.0% |
| Cherokee | 47 | 0.1% |
| Chilean | 5 | 0.0% |
| Chippewa | 8 | 0.0% |
| Colombian | 30 | 0.0% |
| Croatian | 21 | 0.0% |
| Crow | 20 | 0.0% |
| Cuban | 44 | 0.1% |
| Czech | 139 | 0.2% |
| Czechoslovakian | 101 | 0.1% |
| Danish | 171 | 0.2% |
| Dominican | 115 | 0.2% |
| Dutch | 2,475 | 3.3% |
| Eastern European | 110 | 0.1% |
| Ecuadorian | 122 | 0.2% |
| Egyptian | 9 | 0.0% |
| English | 12,396 | 16.3% |
| Estonian | 4 | 0.0% |
| Ethiopian | 5 | 0.0% |
| European | 650 | 0.9% |
| Finnish | 128 | 0.2% |
| French | 2,443 | 3.2% |
| French American Indian | 6 | 0.0% |
| French Canadian | 788 | 1.0% |
| German | 12,592 | 16.5% |
| Greek | 177 | 0.2% |
| Guatemalan | 184 | 0.2% |
| Guyanese | 35 | 0.1% |
| Haitian | 59 | 0.1% |
| Honduran | 27 | 0.0% |
| Hungarian | 386 | 0.5% |
| Icelander | 3 | 0.0% |
| Indian (Asian) | 76 | 0.1% |
| Irish | 15,969 | 21.0% |
| Iroquois | 165 | 0.2% |
| Italian | 11,781 | 15.5% |
| Jamaican | 80 | 0.1% |
| Korean | 145 | 0.2% |
| Latvian | 3 | 0.0% |
| Lebanese | 91 | 0.1% |
| Lithuanian | 27 | 0.0% |
| Lumbee | 1 | 0.0% |
| Macedonian | 45 | 0.1% |
| Mexican | 517 | 0.7% |
| Moroccan | 5 | 0.0% |
| Native Hawaiian | 11 | 0.0% |
| Nicaraguan | 12 | 0.0% |
| Nigerian | 21 | 0.0% |
| Northern European | 109 | 0.1% |
| Norwegian | 418 | 0.5% |
| Osage | 13 | 0.0% |
| Pakistani | 6 | 0.0% |
| Paraguayan | 26 | 0.0% |
| Pennsylvania German | 46 | 0.1% |
| Peruvian | 33 | 0.0% |
| Polish | 4,928 | 6.5% |
| Portuguese | 31 | 0.0% |
| Puerto Rican | 987 | 1.3% |
| Romanian | 44 | 0.1% |
| Russian | 240 | 0.3% |
| Salvadoran | 25 | 0.0% |
| Samoan | 8 | 0.0% |
| Scandinavian | 159 | 0.2% |
| Scotch-Irish | 381 | 0.5% |
| Scottish | 1,434 | 1.9% |
| Serbian | 25 | 0.0% |
| Sioux | 5 | 0.0% |
| Slavic | 63 | 0.1% |
| Slovak | 177 | 0.2% |
| South African | 16 | 0.0% |
| South American | 216 | 0.3% |
| Spaniard | 9 | 0.0% |
| Spanish | 43 | 0.1% |
| Spanish American Indian | 4 | 0.0% |
| Sri Lankan | 37 | 0.1% |
| Subsaharan African | 67 | 0.1% |
| Sudanese | 4 | 0.0% |
| Swedish | 552 | 0.7% |
| Swiss | 404 | 0.5% |
| Syrian | 10 | 0.0% |
| Thai | 143 | 0.2% |
| Ukrainian | 1,420 | 1.9% |
| Ute | 9 | 0.0% |
| Welsh | 452 | 0.6% |
| Yugoslavian | 2 | 0.0% | View All 100 Rows |
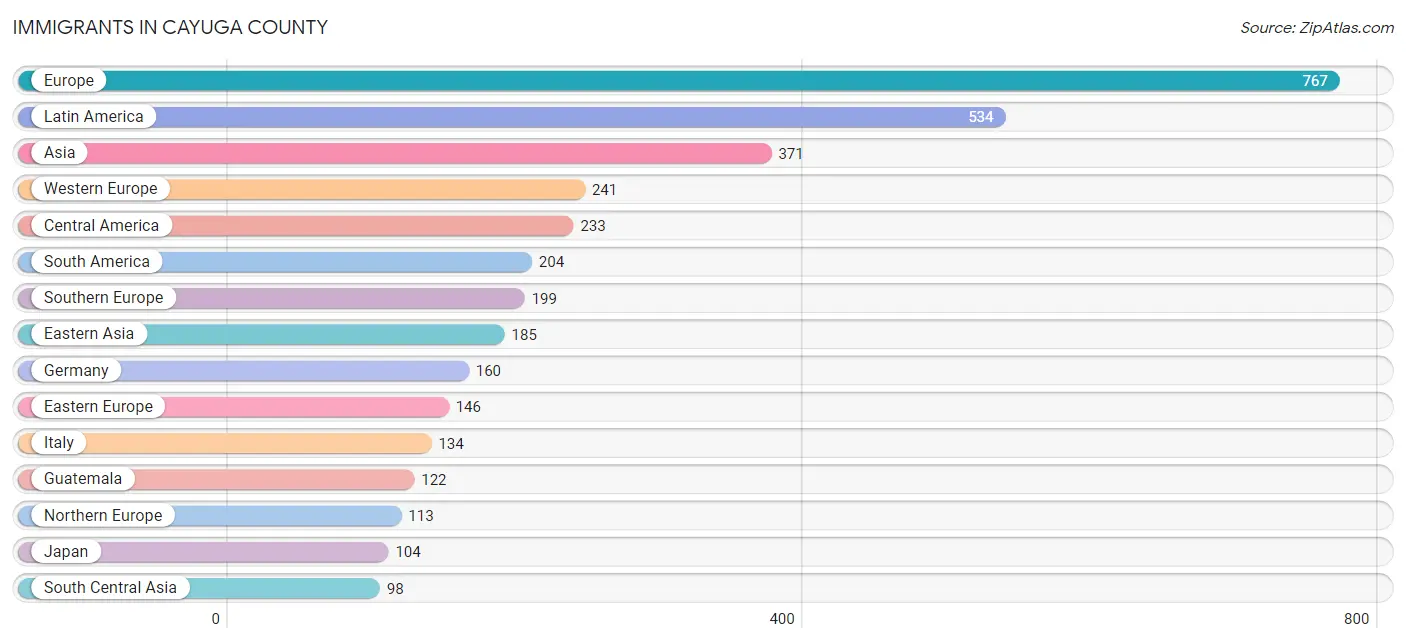
Immigrants in Cayuga County
The most numerous immigrant groups reported in Cayuga County came from Europe (767 | 1.0%), Latin America (534 | 0.7%), Asia (371 | 0.5%), Western Europe (241 | 0.3%), and Central America (233 | 0.3%), together accounting for 2.8% of all Cayuga County residents.
| Immigration Origin | # Population | % Population |
| Africa | 42 | 0.1% |
| Asia | 371 | 0.5% |
| Australia | 3 | 0.0% |
| Bangladesh | 7 | 0.0% |
| Belgium | 10 | 0.0% |
| Brazil | 26 | 0.0% |
| Canada | 53 | 0.1% |
| Caribbean | 97 | 0.1% |
| Central America | 233 | 0.3% |
| Chile | 3 | 0.0% |
| China | 80 | 0.1% |
| Colombia | 29 | 0.0% |
| Dominican Republic | 43 | 0.1% |
| Eastern Africa | 9 | 0.0% |
| Eastern Asia | 185 | 0.2% |
| Eastern Europe | 146 | 0.2% |
| Ecuador | 82 | 0.1% |
| Egypt | 9 | 0.0% |
| England | 42 | 0.1% |
| Ethiopia | 5 | 0.0% |
| Europe | 767 | 1.0% |
| France | 63 | 0.1% |
| Germany | 160 | 0.2% |
| Greece | 56 | 0.1% |
| Guatemala | 122 | 0.2% |
| Guyana | 16 | 0.0% |
| Haiti | 26 | 0.0% |
| Honduras | 23 | 0.0% |
| Hungary | 3 | 0.0% |
| India | 84 | 0.1% |
| Iraq | 7 | 0.0% |
| Italy | 134 | 0.2% |
| Jamaica | 22 | 0.0% |
| Japan | 104 | 0.1% |
| Kenya | 4 | 0.0% |
| Korea | 1 | 0.0% |
| Latin America | 534 | 0.7% |
| Mexico | 73 | 0.1% |
| Nepal | 7 | 0.0% |
| Netherlands | 5 | 0.0% |
| Nicaragua | 9 | 0.0% |
| Northern Africa | 13 | 0.0% |
| Northern Europe | 113 | 0.2% |
| Norway | 45 | 0.1% |
| Oceania | 8 | 0.0% |
| Panama | 6 | 0.0% |
| Peru | 31 | 0.0% |
| Philippines | 78 | 0.1% |
| Poland | 22 | 0.0% |
| Romania | 18 | 0.0% |
| Russia | 23 | 0.0% |
| Sierra Leone | 4 | 0.0% |
| South Africa | 16 | 0.0% |
| South America | 204 | 0.3% |
| South Central Asia | 98 | 0.1% |
| South Eastern Asia | 81 | 0.1% |
| Southern Europe | 199 | 0.3% |
| Spain | 9 | 0.0% |
| Sudan | 4 | 0.0% |
| Switzerland | 3 | 0.0% |
| Taiwan | 32 | 0.0% |
| Thailand | 3 | 0.0% |
| Ukraine | 5 | 0.0% |
| Western Africa | 4 | 0.0% |
| Western Asia | 7 | 0.0% |
| Western Europe | 241 | 0.3% | View All 66 Rows |
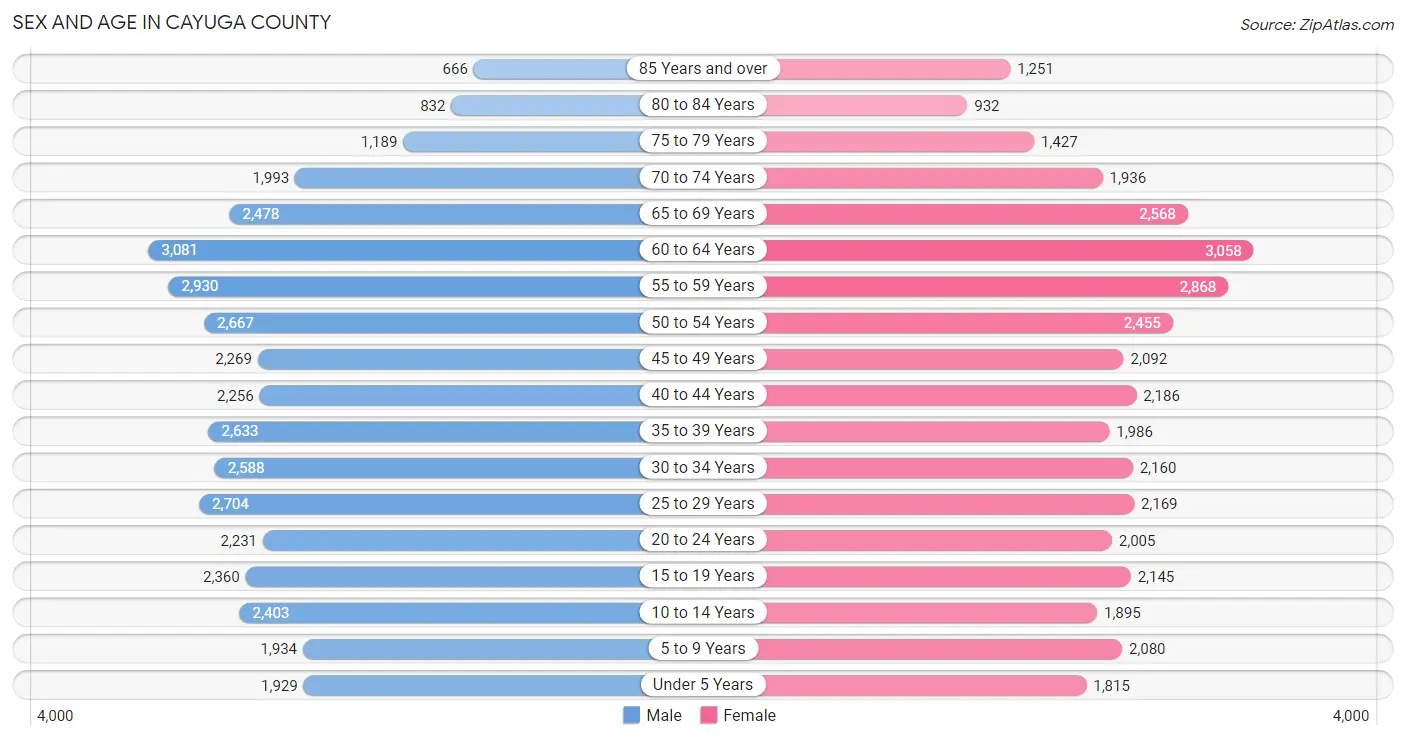
Sex and Age in Cayuga County
Sex and Age in Cayuga County
The most populous age groups in Cayuga County are 60 to 64 Years (3,081 | 7.9%) for men and 60 to 64 Years (3,058 | 8.3%) for women.
| Age Bracket | Male | Female |
| Under 5 Years | 1,929 (4.9%) | 1,815 (4.9%) |
| 5 to 9 Years | 1,934 (4.9%) | 2,080 (5.6%) |
| 10 to 14 Years | 2,403 (6.1%) | 1,895 (5.1%) |
| 15 to 19 Years | 2,360 (6.0%) | 2,145 (5.8%) |
| 20 to 24 Years | 2,231 (5.7%) | 2,005 (5.4%) |
| 25 to 29 Years | 2,704 (6.9%) | 2,169 (5.9%) |
| 30 to 34 Years | 2,588 (6.6%) | 2,160 (5.8%) |
| 35 to 39 Years | 2,633 (6.7%) | 1,986 (5.4%) |
| 40 to 44 Years | 2,256 (5.8%) | 2,186 (5.9%) |
| 45 to 49 Years | 2,269 (5.8%) | 2,092 (5.7%) |
| 50 to 54 Years | 2,667 (6.8%) | 2,455 (6.6%) |
| 55 to 59 Years | 2,930 (7.5%) | 2,868 (7.7%) |
| 60 to 64 Years | 3,081 (7.9%) | 3,058 (8.3%) |
| 65 to 69 Years | 2,478 (6.3%) | 2,568 (6.9%) |
| 70 to 74 Years | 1,993 (5.1%) | 1,936 (5.2%) |
| 75 to 79 Years | 1,189 (3.0%) | 1,427 (3.8%) |
| 80 to 84 Years | 832 (2.1%) | 932 (2.5%) |
| 85 Years and over | 666 (1.7%) | 1,251 (3.4%) |
| Total | 39,143 (100.0%) | 37,028 (100.0%) |
Families and Households in Cayuga County
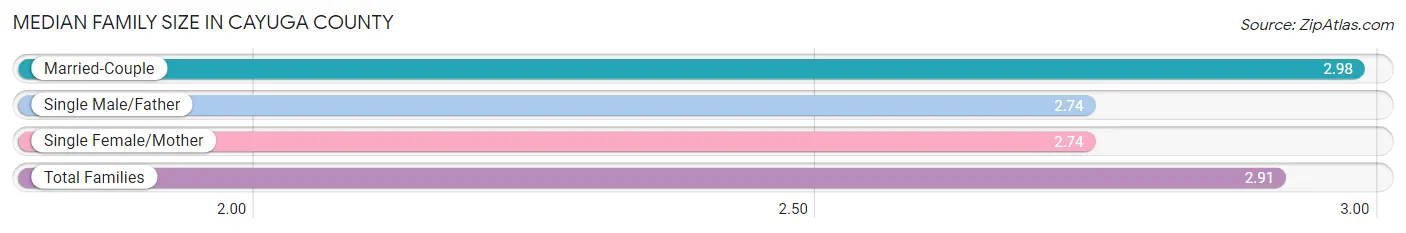
Median Family Size in Cayuga County
The median family size in Cayuga County is 2.91 persons per family, with married-couple families (13,303 | 71.1%) accounting for the largest median family size of 2.98 persons per family. On the other hand, single male/father families (1,935 | 10.3%) represent the smallest median family size with 2.74 persons per family.
| Family Type | # Families | Family Size |
| Married-Couple | 13,303 (71.1%) | 2.98 |
| Single Male/Father | 1,935 (10.3%) | 2.74 |
| Single Female/Mother | 3,478 (18.6%) | 2.74 |
| Total Families | 18,716 (100.0%) | 2.91 |
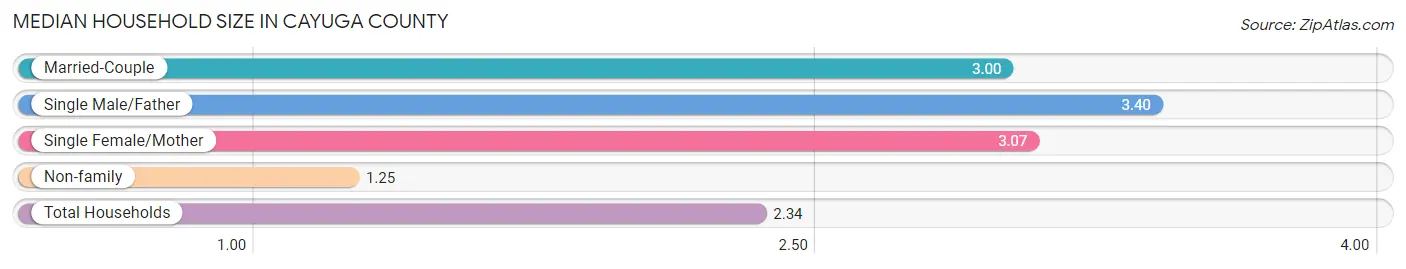
Median Household Size in Cayuga County
The median household size in Cayuga County is 2.34 persons per household, with single male/father households (1,935 | 6.3%) accounting for the largest median household size of 3.4 persons per household. non-family households (12,194 | 39.5%) represent the smallest median household size with 1.25 persons per household.
| Household Type | # Households | Household Size |
| Married-Couple | 13,303 (43.0%) | 3.00 |
| Single Male/Father | 1,935 (6.3%) | 3.40 |
| Single Female/Mother | 3,478 (11.3%) | 3.07 |
| Non-family | 12,194 (39.5%) | 1.25 |
| Total Households | 30,910 (100.0%) | 2.34 |
Household Size by Marriage Status in Cayuga County
Out of a total of 30,910 households in Cayuga County, 18,716 (60.6%) are family households, while 12,194 (39.5%) are nonfamily households. The most numerous type of family households are 2-person households, comprising 9,052, and the most common type of nonfamily households are 1-person households, comprising 9,575.
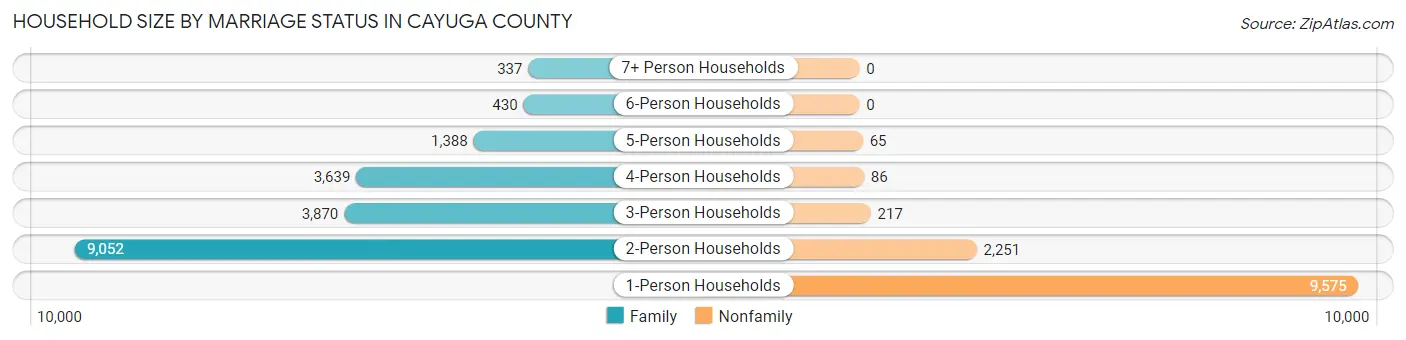
| Household Size | Family Households | Nonfamily Households |
| 1-Person Households | - | 9,575 (31.0%) |
| 2-Person Households | 9,052 (29.3%) | 2,251 (7.3%) |
| 3-Person Households | 3,870 (12.5%) | 217 (0.7%) |
| 4-Person Households | 3,639 (11.8%) | 86 (0.3%) |
| 5-Person Households | 1,388 (4.5%) | 65 (0.2%) |
| 6-Person Households | 430 (1.4%) | 0 (0.0%) |
| 7+ Person Households | 337 (1.1%) | 0 (0.0%) |
| Total | 18,716 (60.6%) | 12,194 (39.5%) |
Female Fertility in Cayuga County
Fertility by Age in Cayuga County
Average fertility rate in Cayuga County is 65.0 births per 1,000 women. Women in the age bracket of 20 to 34 years have the highest fertility rate with 128.0 births per 1,000 women. Women in the age bracket of 20 to 34 years acount for 82.2% of all women with births.
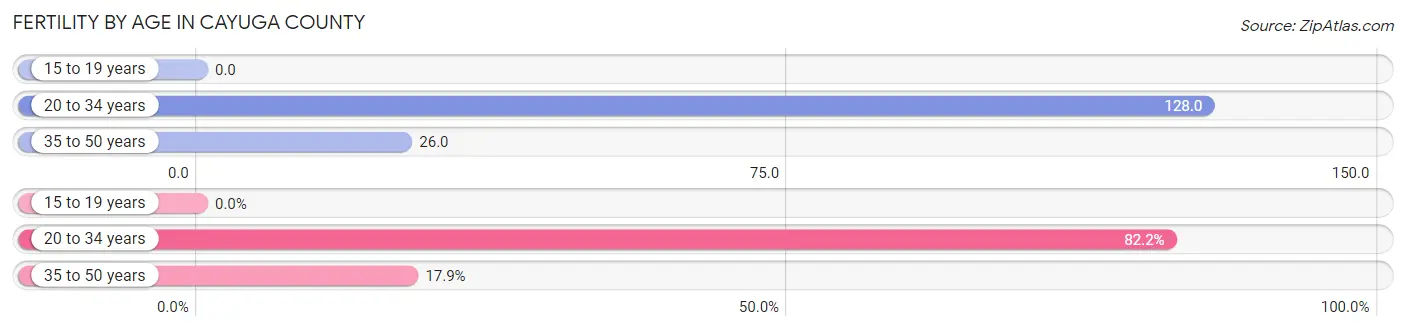
| Age Bracket | Women with Births | Births / 1,000 Women |
| 15 to 19 years | 0 (0.0%) | 0.0 |
| 20 to 34 years | 810 (82.2%) | 128.0 |
| 35 to 50 years | 176 (17.8%) | 26.0 |
| Total | 986 (100.0%) | 65.0 |
Fertility by Age by Marriage Status in Cayuga County
45.4% of women with births (986) in Cayuga County are married. The highest percentage of unmarried women with births falls into 20 to 34 years age bracket with 59.4% of them unmarried at the time of birth, while the lowest percentage of unmarried women with births belong to 35 to 50 years age bracket with 32.4% of them unmarried.
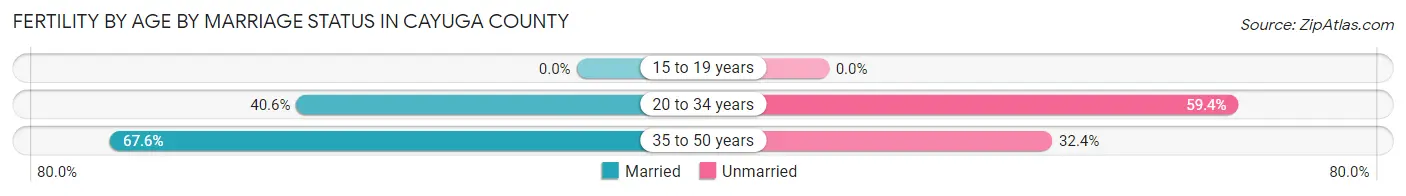
| Age Bracket | Married | Unmarried |
| 15 to 19 years | 0 (0.0%) | 0 (0.0%) |
| 20 to 34 years | 329 (40.6%) | 481 (59.4%) |
| 35 to 50 years | 119 (67.6%) | 57 (32.4%) |
| Total | 448 (45.4%) | 538 (54.6%) |
Fertility by Education in Cayuga County
Average fertility rate in Cayuga County is 65.0 births per 1,000 women. Women with the education attainment of high school diploma have the highest fertility rate of 81.0 births per 1,000 women, while women with the education attainment of less than high school have the lowest fertility at 31.0 births per 1,000 women. Women with the education attainment of college or associate's degree represent 43.5% of all women with births.
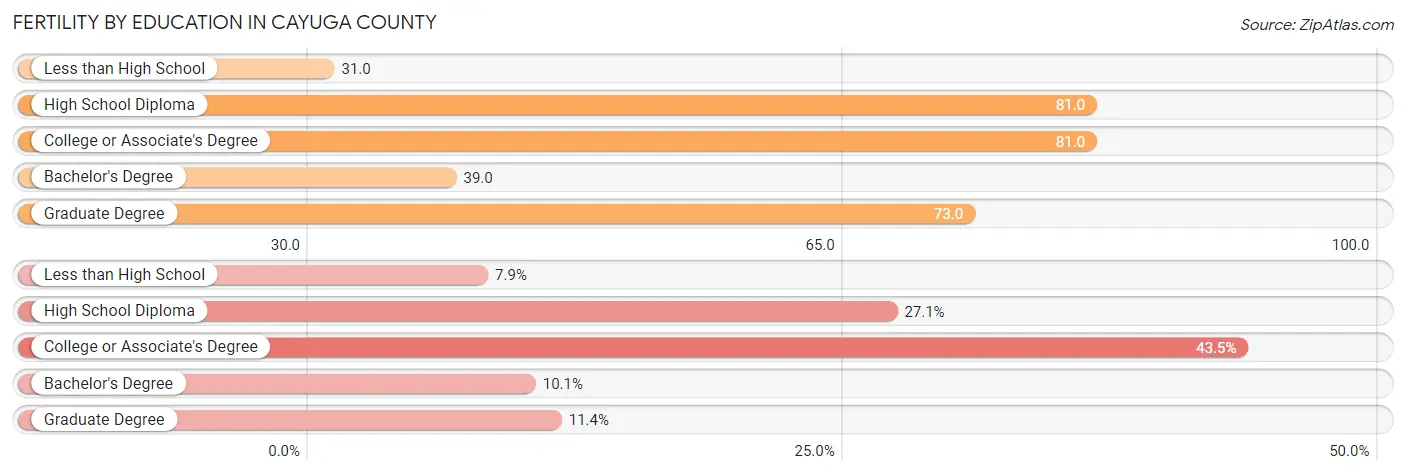
| Educational Attainment | Women with Births | Births / 1,000 Women |
| Less than High School | 78 (7.9%) | 31.0 |
| High School Diploma | 267 (27.1%) | 81.0 |
| College or Associate's Degree | 429 (43.5%) | 81.0 |
| Bachelor's Degree | 100 (10.1%) | 39.0 |
| Graduate Degree | 112 (11.4%) | 73.0 |
| Total | 986 (100.0%) | 65.0 |
Fertility by Education by Marriage Status in Cayuga County
54.6% of women with births in Cayuga County are unmarried. Women with the educational attainment of graduate degree are most likely to be married with 92.9% of them married at childbirth, while women with the educational attainment of high school diploma are least likely to be married with 80.1% of them unmarried at childbirth.
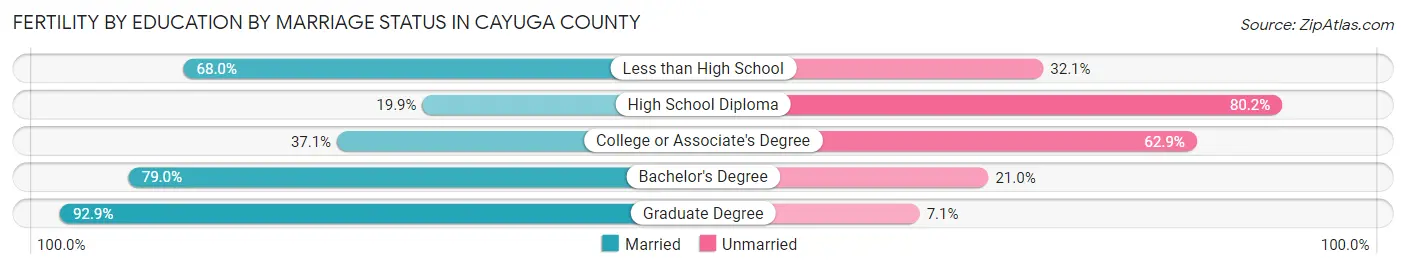
| Educational Attainment | Married | Unmarried |
| Less than High School | 53 (67.9%) | 25 (32.1%) |
| High School Diploma | 53 (19.9%) | 214 (80.1%) |
| College or Associate's Degree | 159 (37.1%) | 270 (62.9%) |
| Bachelor's Degree | 79 (79.0%) | 21 (21.0%) |
| Graduate Degree | 104 (92.9%) | 8 (7.1%) |
| Total | 448 (45.4%) | 538 (54.6%) |
Employment Characteristics in Cayuga County
Employment by Class of Employer in Cayuga County
Among the 34,081 employed individuals in Cayuga County, private company employees (20,957 | 61.5%), not-for-profit organizations (3,749 | 11.0%), and local government employees (3,529 | 10.3%) make up the most common classes of employment.
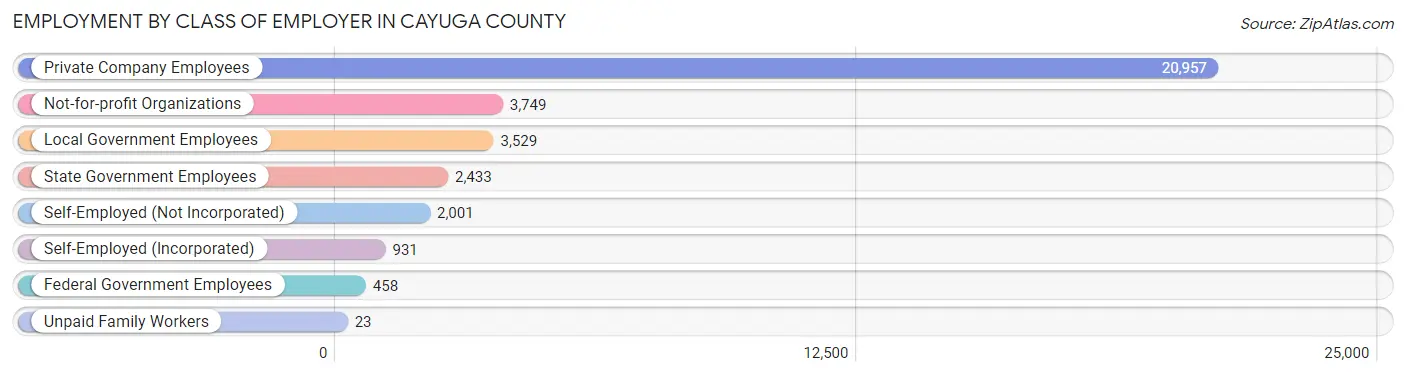
| Employer Class | # Employees | % Employees |
| Private Company Employees | 20,957 | 61.5% |
| Self-Employed (Incorporated) | 931 | 2.7% |
| Self-Employed (Not Incorporated) | 2,001 | 5.9% |
| Not-for-profit Organizations | 3,749 | 11.0% |
| Local Government Employees | 3,529 | 10.3% |
| State Government Employees | 2,433 | 7.1% |
| Federal Government Employees | 458 | 1.3% |
| Unpaid Family Workers | 23 | 0.1% |
| Total | 34,081 | 100.0% |
Employment Status by Age in Cayuga County
According to the labor force statistics for Cayuga County, out of the total population over 16 years of age (63,062), 57.6% or 36,324 individuals are in the labor force, with 4.3% or 1,562 of them unemployed. The age group with the highest labor force participation rate is 45 to 54 years, with 80.5% or 7,634 individuals in the labor force. Within the labor force, the 16 to 19 years age range has the highest percentage of unemployed individuals, with 9.5% or 133 of them being unemployed.
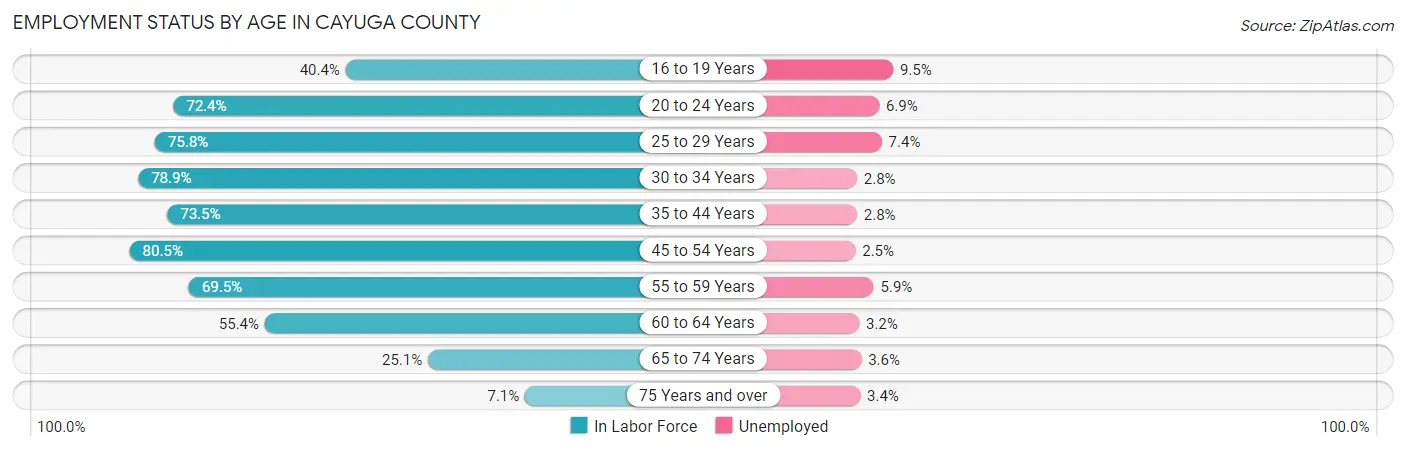
| Age Bracket | In Labor Force | Unemployed |
| 16 to 19 Years | 1,395 (40.4%) | 133 (9.5%) |
| 20 to 24 Years | 3,067 (72.4%) | 212 (6.9%) |
| 25 to 29 Years | 3,694 (75.8%) | 273 (7.4%) |
| 30 to 34 Years | 3,746 (78.9%) | 105 (2.8%) |
| 35 to 44 Years | 6,660 (73.5%) | 186 (2.8%) |
| 45 to 54 Years | 7,634 (80.5%) | 191 (2.5%) |
| 55 to 59 Years | 4,030 (69.5%) | 238 (5.9%) |
| 60 to 64 Years | 3,401 (55.4%) | 109 (3.2%) |
| 65 to 74 Years | 2,253 (25.1%) | 81 (3.6%) |
| 75 Years and over | 447 (7.1%) | 15 (3.4%) |
| Total | 36,324 (57.6%) | 1,562 (4.3%) |
Employment Status by Educational Attainment in Cayuga County
According to labor force statistics for Cayuga County, 72.7% of individuals (29,154) out of the total population between 25 and 64 years of age (40,102) are in the labor force, with 3.8% or 1,108 of them being unemployed. The group with the highest labor force participation rate are those with the educational attainment of bachelor's degree or higher, with 88.0% or 8,159 individuals in the labor force. Within the labor force, individuals with less than high school education have the highest percentage of unemployment, with 12.7% or 204 of them being unemployed.
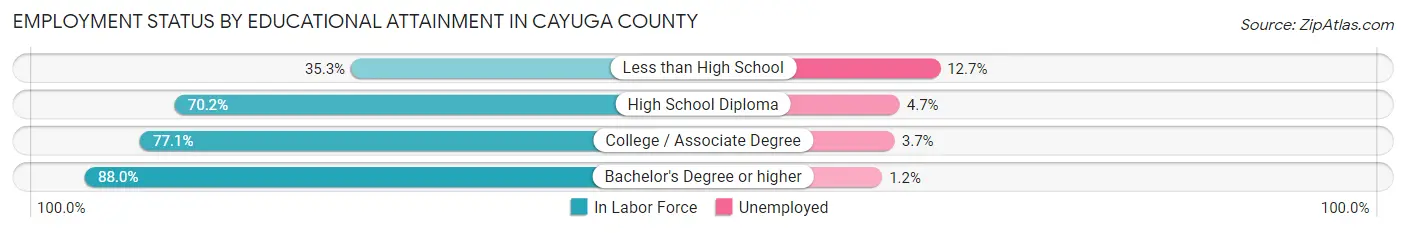
| Educational Attainment | In Labor Force | Unemployed |
| Less than High School | 1,610 (35.3%) | 579 (12.7%) |
| High School Diploma | 8,762 (70.2%) | 587 (4.7%) |
| College / Associate Degree | 10,631 (77.1%) | 510 (3.7%) |
| Bachelor's Degree or higher | 8,159 (88.0%) | 111 (1.2%) |
| Total | 29,154 (72.7%) | 1,524 (3.8%) |
Employment Occupations by Sex in Cayuga County
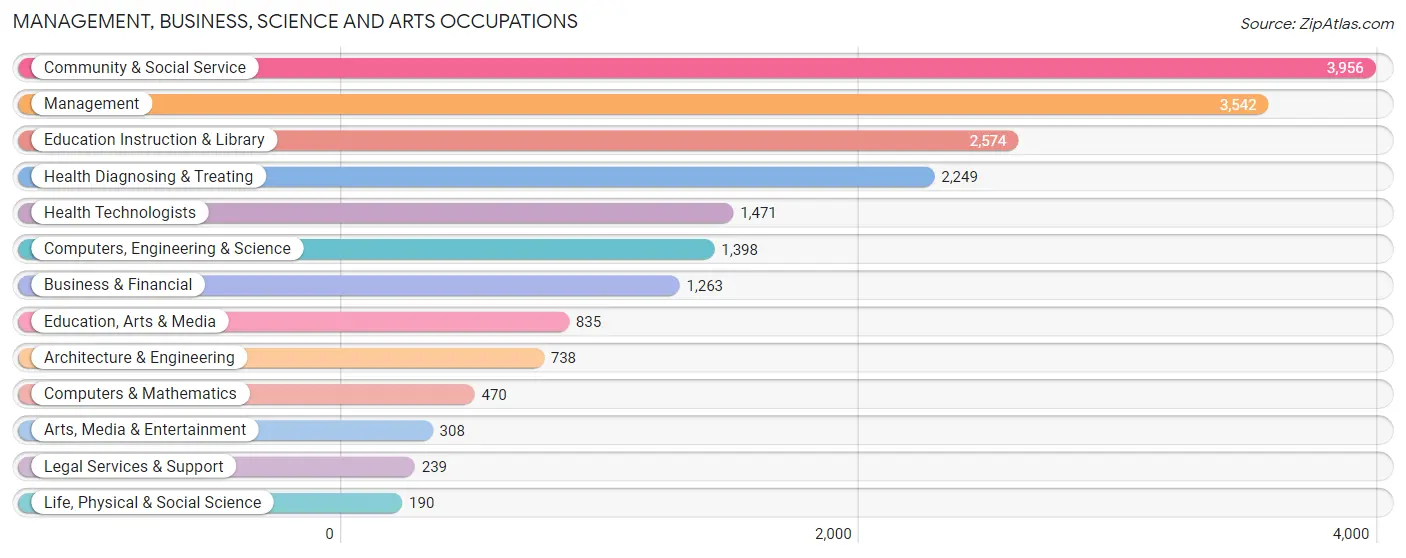
Management, Business, Science and Arts Occupations
The most common Management, Business, Science and Arts occupations in Cayuga County are Community & Social Service (3,956 | 11.4%), Management (3,542 | 10.2%), Education Instruction & Library (2,574 | 7.4%), Health Diagnosing & Treating (2,249 | 6.5%), and Health Technologists (1,471 | 4.2%).
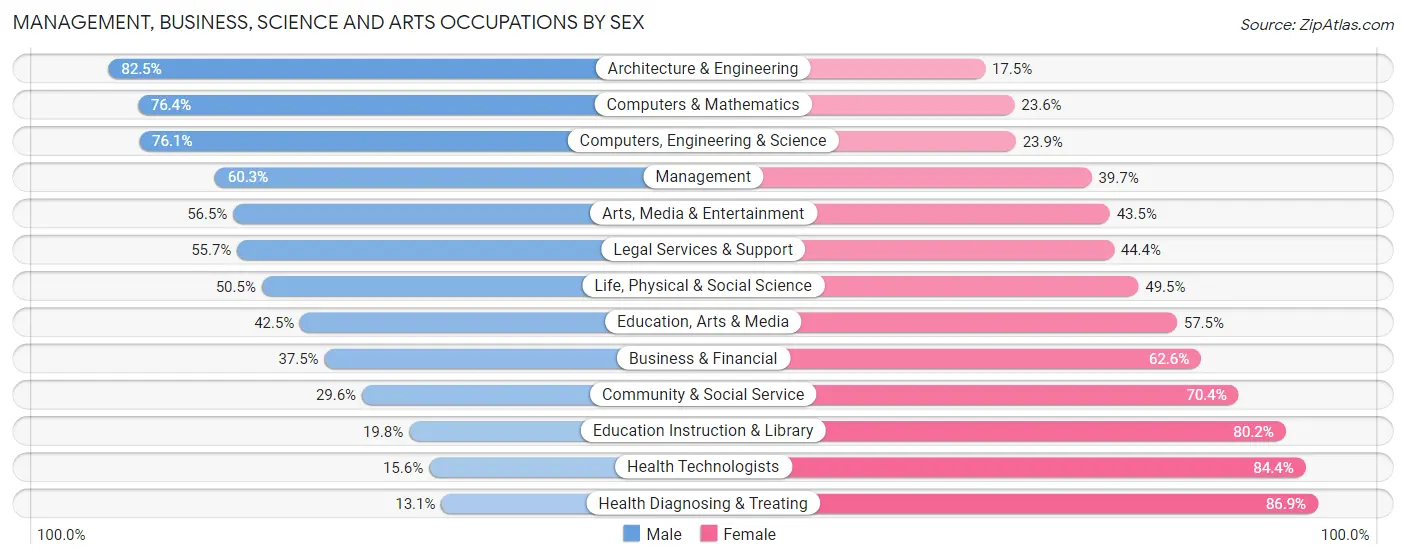
Management, Business, Science and Arts Occupations by Sex
Within the Management, Business, Science and Arts occupations in Cayuga County, the most male-oriented occupations are Architecture & Engineering (82.5%), Computers & Mathematics (76.4%), and Computers, Engineering & Science (76.1%), while the most female-oriented occupations are Health Diagnosing & Treating (86.9%), Health Technologists (84.4%), and Education Instruction & Library (80.2%).
| Occupation | Male | Female |
| Management | 2,136 (60.3%) | 1,406 (39.7%) |
| Business & Financial | 473 (37.4%) | 790 (62.5%) |
| Computers, Engineering & Science | 1,064 (76.1%) | 334 (23.9%) |
| Computers & Mathematics | 359 (76.4%) | 111 (23.6%) |
| Architecture & Engineering | 609 (82.5%) | 129 (17.5%) |
| Life, Physical & Social Science | 96 (50.5%) | 94 (49.5%) |
| Community & Social Service | 1,172 (29.6%) | 2,784 (70.4%) |
| Education, Arts & Media | 355 (42.5%) | 480 (57.5%) |
| Legal Services & Support | 133 (55.6%) | 106 (44.4%) |
| Education Instruction & Library | 510 (19.8%) | 2,064 (80.2%) |
| Arts, Media & Entertainment | 174 (56.5%) | 134 (43.5%) |
| Health Diagnosing & Treating | 294 (13.1%) | 1,955 (86.9%) |
| Health Technologists | 230 (15.6%) | 1,241 (84.4%) |
| Total (Category) | 5,139 (41.4%) | 7,269 (58.6%) |
| Total (Overall) | 18,285 (52.6%) | 16,459 (47.4%) |
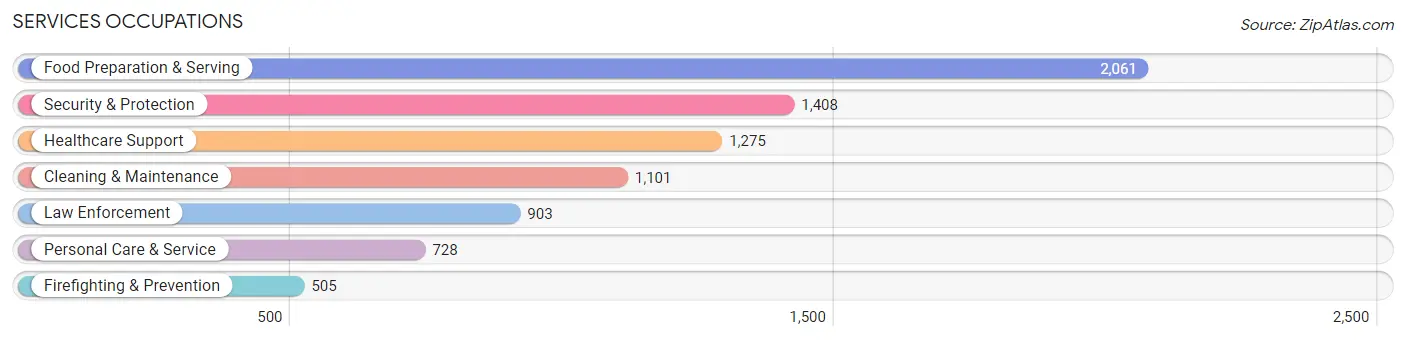
Services Occupations
The most common Services occupations in Cayuga County are Food Preparation & Serving (2,061 | 5.9%), Security & Protection (1,408 | 4.1%), Healthcare Support (1,275 | 3.7%), Cleaning & Maintenance (1,101 | 3.2%), and Law Enforcement (903 | 2.6%).
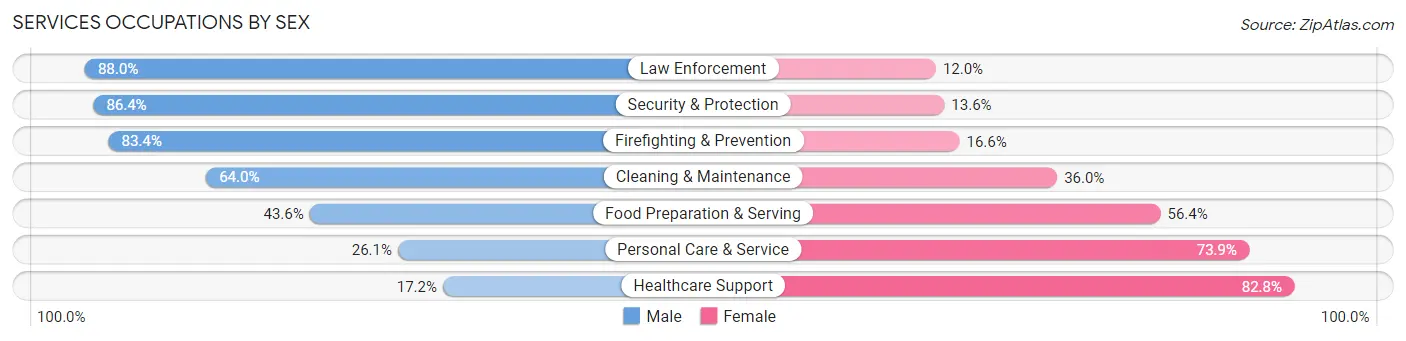
Services Occupations by Sex
Within the Services occupations in Cayuga County, the most male-oriented occupations are Law Enforcement (88.0%), Security & Protection (86.4%), and Firefighting & Prevention (83.4%), while the most female-oriented occupations are Healthcare Support (82.8%), Personal Care & Service (73.9%), and Food Preparation & Serving (56.4%).
| Occupation | Male | Female |
| Healthcare Support | 219 (17.2%) | 1,056 (82.8%) |
| Security & Protection | 1,216 (86.4%) | 192 (13.6%) |
| Firefighting & Prevention | 421 (83.4%) | 84 (16.6%) |
| Law Enforcement | 795 (88.0%) | 108 (12.0%) |
| Food Preparation & Serving | 898 (43.6%) | 1,163 (56.4%) |
| Cleaning & Maintenance | 705 (64.0%) | 396 (36.0%) |
| Personal Care & Service | 190 (26.1%) | 538 (73.9%) |
| Total (Category) | 3,228 (49.1%) | 3,345 (50.9%) |
| Total (Overall) | 18,285 (52.6%) | 16,459 (47.4%) |
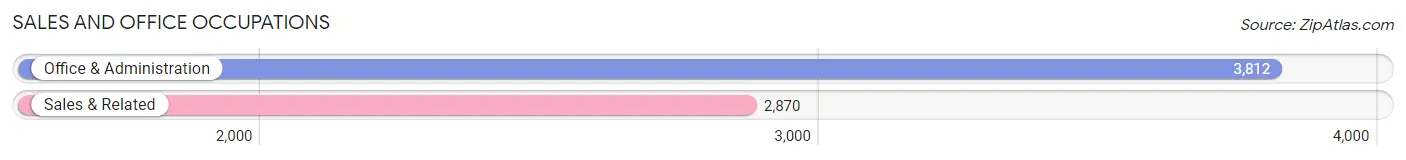
Sales and Office Occupations
The most common Sales and Office occupations in Cayuga County are Office & Administration (3,812 | 11.0%), and Sales & Related (2,870 | 8.3%).
Sales and Office Occupations by Sex
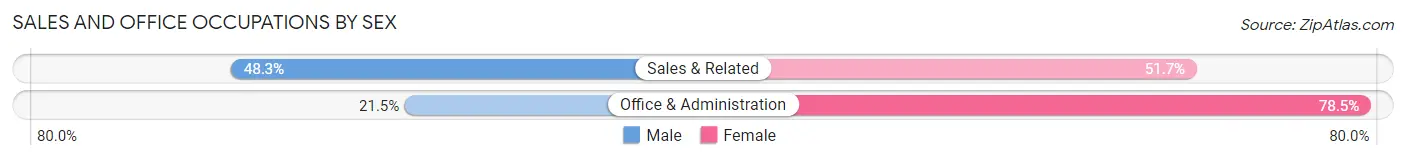
| Occupation | Male | Female |
| Sales & Related | 1,385 (48.3%) | 1,485 (51.7%) |
| Office & Administration | 818 (21.5%) | 2,994 (78.5%) |
| Total (Category) | 2,203 (33.0%) | 4,479 (67.0%) |
| Total (Overall) | 18,285 (52.6%) | 16,459 (47.4%) |
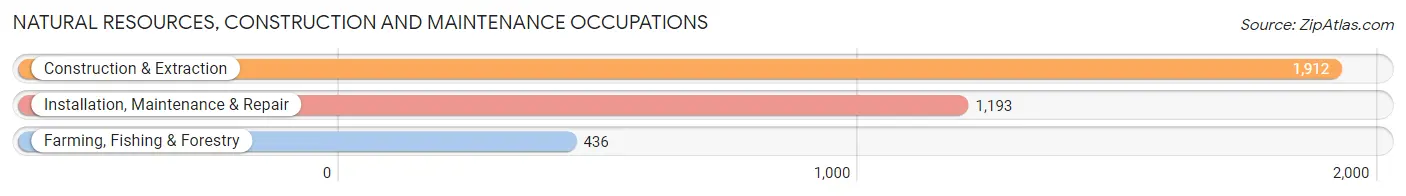
Natural Resources, Construction and Maintenance Occupations
The most common Natural Resources, Construction and Maintenance occupations in Cayuga County are Construction & Extraction (1,912 | 5.5%), Installation, Maintenance & Repair (1,193 | 3.4%), and Farming, Fishing & Forestry (436 | 1.3%).
Natural Resources, Construction and Maintenance Occupations by Sex
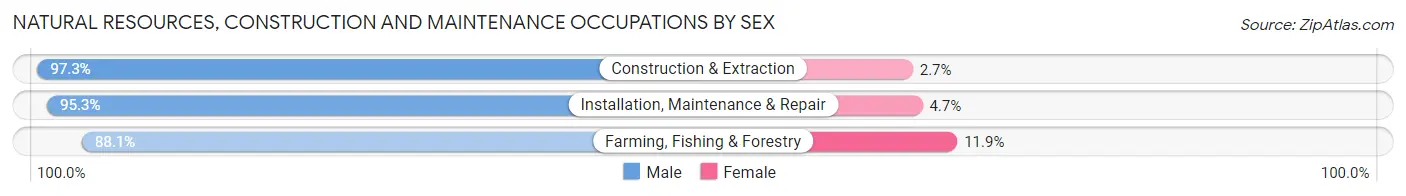
| Occupation | Male | Female |
| Farming, Fishing & Forestry | 384 (88.1%) | 52 (11.9%) |
| Construction & Extraction | 1,861 (97.3%) | 51 (2.7%) |
| Installation, Maintenance & Repair | 1,137 (95.3%) | 56 (4.7%) |
| Total (Category) | 3,382 (95.5%) | 159 (4.5%) |
| Total (Overall) | 18,285 (52.6%) | 16,459 (47.4%) |
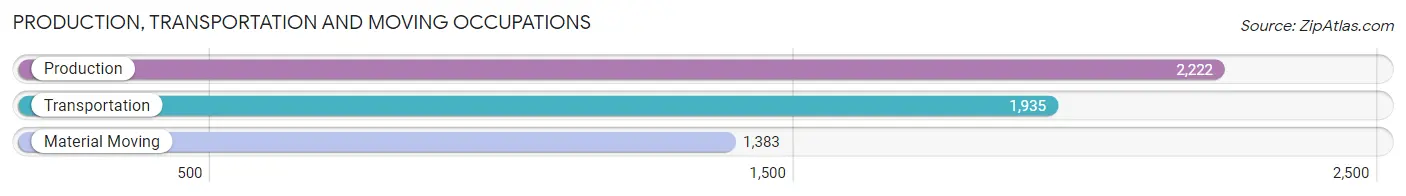
Production, Transportation and Moving Occupations
The most common Production, Transportation and Moving occupations in Cayuga County are Production (2,222 | 6.4%), Transportation (1,935 | 5.6%), and Material Moving (1,383 | 4.0%).
Production, Transportation and Moving Occupations by Sex
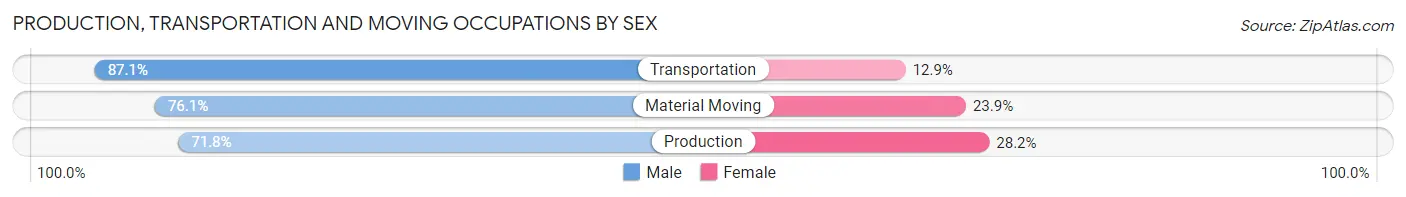
| Occupation | Male | Female |
| Production | 1,595 (71.8%) | 627 (28.2%) |
| Transportation | 1,686 (87.1%) | 249 (12.9%) |
| Material Moving | 1,052 (76.1%) | 331 (23.9%) |
| Total (Category) | 4,333 (78.2%) | 1,207 (21.8%) |
| Total (Overall) | 18,285 (52.6%) | 16,459 (47.4%) |
Employment Industries by Sex in Cayuga County
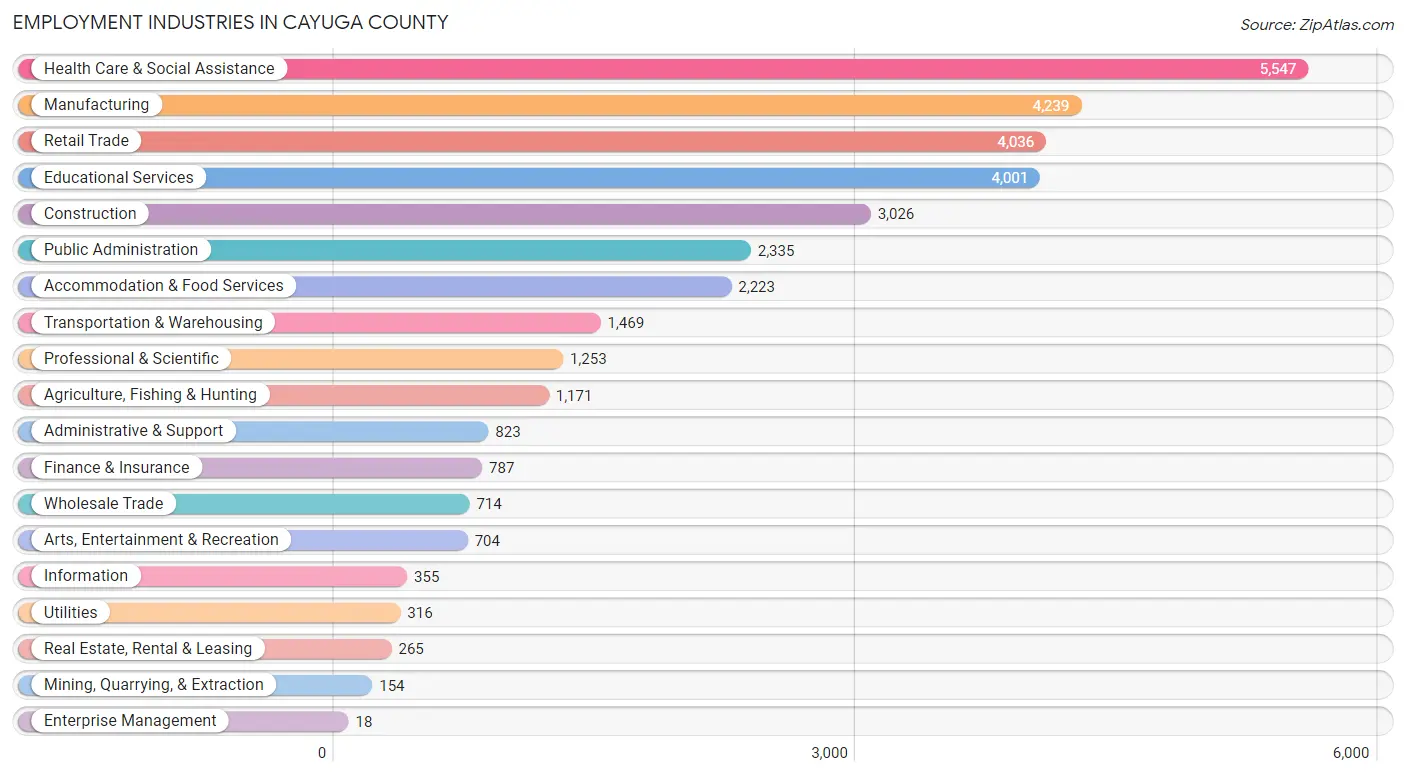
Employment Industries in Cayuga County
The major employment industries in Cayuga County include Health Care & Social Assistance (5,547 | 16.0%), Manufacturing (4,239 | 12.2%), Retail Trade (4,036 | 11.6%), Educational Services (4,001 | 11.5%), and Construction (3,026 | 8.7%).
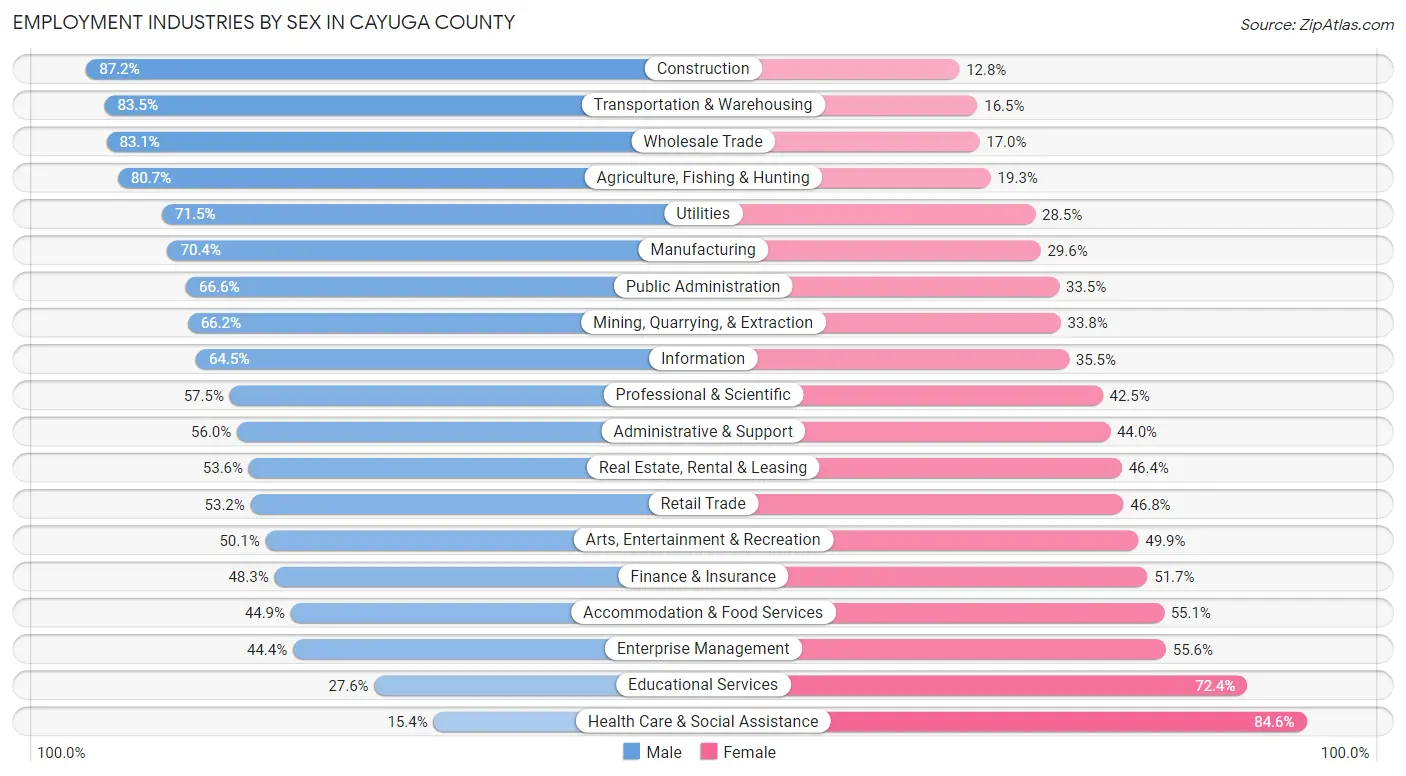
Employment Industries by Sex in Cayuga County
The Cayuga County industries that see more men than women are Construction (87.2%), Transportation & Warehousing (83.5%), and Wholesale Trade (83.1%), whereas the industries that tend to have a higher number of women are Health Care & Social Assistance (84.6%), Educational Services (72.4%), and Enterprise Management (55.6%).
| Industry | Male | Female |
| Agriculture, Fishing & Hunting | 945 (80.7%) | 226 (19.3%) |
| Mining, Quarrying, & Extraction | 102 (66.2%) | 52 (33.8%) |
| Construction | 2,639 (87.2%) | 387 (12.8%) |
| Manufacturing | 2,984 (70.4%) | 1,255 (29.6%) |
| Wholesale Trade | 593 (83.1%) | 121 (17.0%) |
| Retail Trade | 2,148 (53.2%) | 1,888 (46.8%) |
| Transportation & Warehousing | 1,226 (83.5%) | 243 (16.5%) |
| Utilities | 226 (71.5%) | 90 (28.5%) |
| Information | 229 (64.5%) | 126 (35.5%) |
| Finance & Insurance | 380 (48.3%) | 407 (51.7%) |
| Real Estate, Rental & Leasing | 142 (53.6%) | 123 (46.4%) |
| Professional & Scientific | 721 (57.5%) | 532 (42.5%) |
| Enterprise Management | 8 (44.4%) | 10 (55.6%) |
| Administrative & Support | 461 (56.0%) | 362 (44.0%) |
| Educational Services | 1,104 (27.6%) | 2,897 (72.4%) |
| Health Care & Social Assistance | 852 (15.4%) | 4,695 (84.6%) |
| Arts, Entertainment & Recreation | 353 (50.1%) | 351 (49.9%) |
| Accommodation & Food Services | 998 (44.9%) | 1,225 (55.1%) |
| Public Administration | 1,554 (66.5%) | 781 (33.5%) |
| Total | 18,285 (52.6%) | 16,459 (47.4%) |
Education in Cayuga County
School Enrollment in Cayuga County
The most common levels of schooling among the 15,155 students in Cayuga County are high school (3,717 | 24.5%), middle school (3,584 | 23.6%), and elementary school (2,850 | 18.8%).
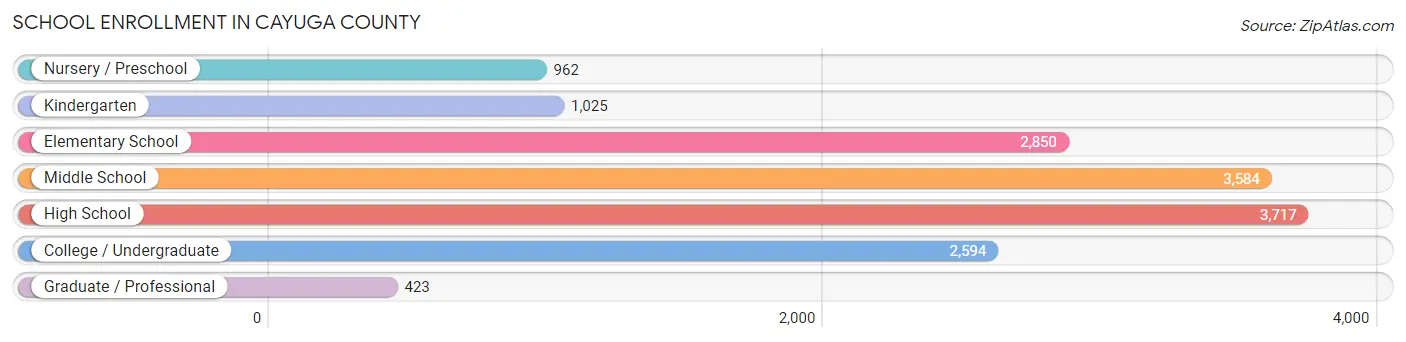
| School Level | # Students | % Students |
| Nursery / Preschool | 962 | 6.4% |
| Kindergarten | 1,025 | 6.8% |
| Elementary School | 2,850 | 18.8% |
| Middle School | 3,584 | 23.6% |
| High School | 3,717 | 24.5% |
| College / Undergraduate | 2,594 | 17.1% |
| Graduate / Professional | 423 | 2.8% |
| Total | 15,155 | 100.0% |
School Enrollment by Age by Funding Source in Cayuga County
Out of a total of 15,155 students who are enrolled in schools in Cayuga County, 2,000 (13.2%) attend a private institution, while the remaining 13,155 (86.8%) are enrolled in public schools. The age group of 20 to 24 year olds has the highest likelihood of being enrolled in private schools, with 449 (38.8% in the age bracket) enrolled. Conversely, the age group of 15 to 17 year olds has the lowest likelihood of being enrolled in a private school, with 2,595 (96.5% in the age bracket) attending a public institution.
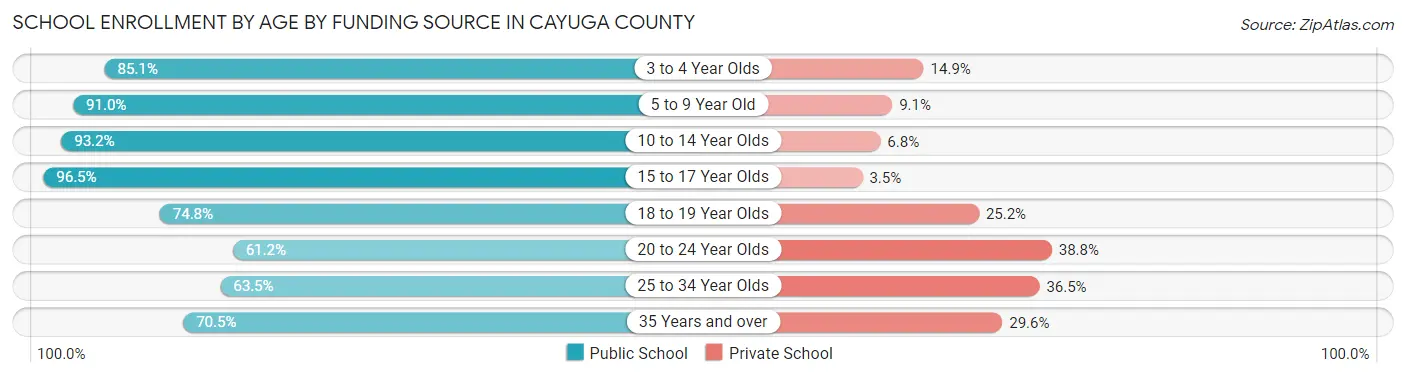
| Age Bracket | Public School | Private School |
| 3 to 4 Year Olds | 754 (85.1%) | 132 (14.9%) |
| 5 to 9 Year Old | 3,445 (90.9%) | 343 (9.0%) |
| 10 to 14 Year Olds | 3,963 (93.2%) | 291 (6.8%) |
| 15 to 17 Year Olds | 2,595 (96.5%) | 94 (3.5%) |
| 18 to 19 Year Olds | 938 (74.8%) | 316 (25.2%) |
| 20 to 24 Year Olds | 709 (61.2%) | 449 (38.8%) |
| 25 to 34 Year Olds | 324 (63.5%) | 186 (36.5%) |
| 35 Years and over | 434 (70.5%) | 182 (29.5%) |
| Total | 13,155 (86.8%) | 2,000 (13.2%) |
Educational Attainment by Field of Study in Cayuga County
Education (2,622 | 19.0%), business (2,129 | 15.4%), science & technology (1,486 | 10.7%), arts & humanities (1,192 | 8.6%), and social sciences (924 | 6.7%) are the most common fields of study among 13,839 individuals in Cayuga County who have obtained a bachelor's degree or higher.
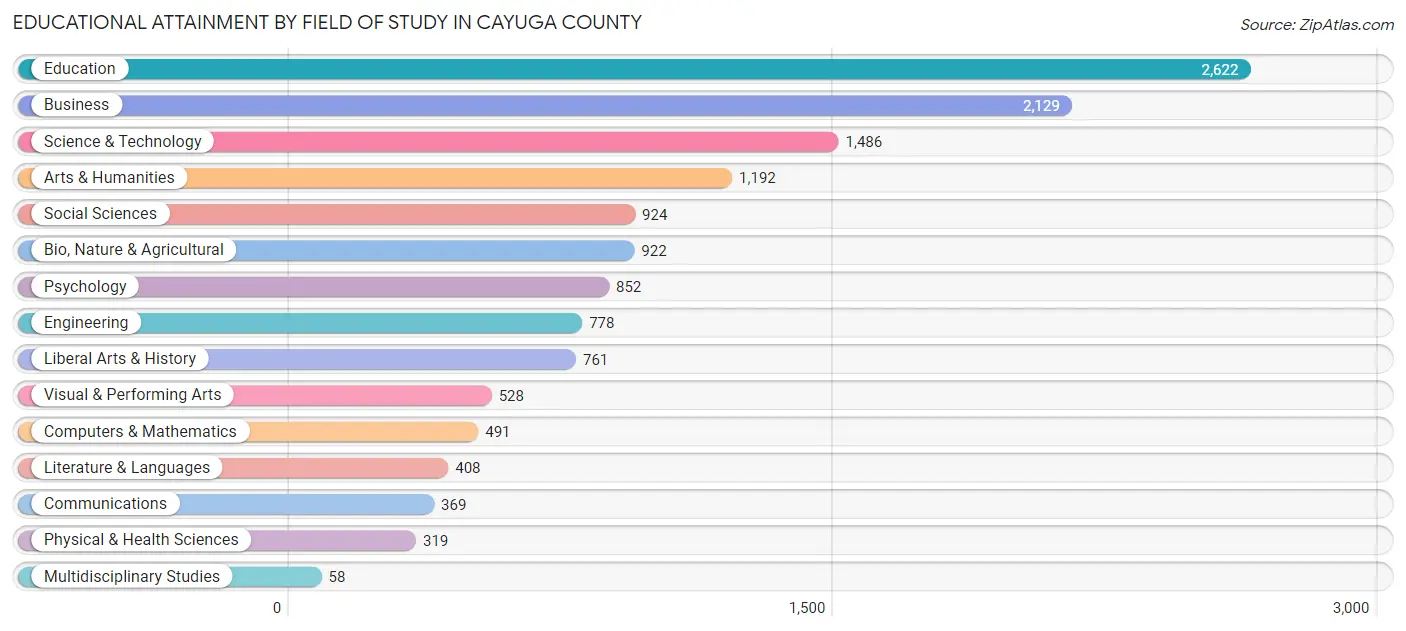
| Field of Study | # Graduates | % Graduates |
| Computers & Mathematics | 491 | 3.5% |
| Bio, Nature & Agricultural | 922 | 6.7% |
| Physical & Health Sciences | 319 | 2.3% |
| Psychology | 852 | 6.2% |
| Social Sciences | 924 | 6.7% |
| Engineering | 778 | 5.6% |
| Multidisciplinary Studies | 58 | 0.4% |
| Science & Technology | 1,486 | 10.7% |
| Business | 2,129 | 15.4% |
| Education | 2,622 | 19.0% |
| Literature & Languages | 408 | 2.9% |
| Liberal Arts & History | 761 | 5.5% |
| Visual & Performing Arts | 528 | 3.8% |
| Communications | 369 | 2.7% |
| Arts & Humanities | 1,192 | 8.6% |
| Total | 13,839 | 100.0% |
Transportation & Commute in Cayuga County
Vehicle Availability by Sex in Cayuga County
The most prevalent vehicle ownership categories in Cayuga County are males with 2 vehicles (8,361, accounting for 46.9%) and females with 2 vehicles (6,946, making up 52.7%).
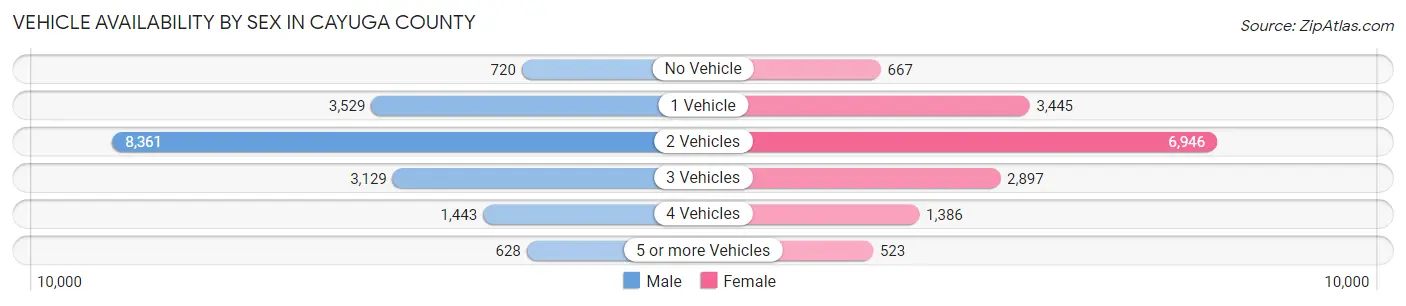
| Vehicles Available | Male | Female |
| No Vehicle | 720 (4.0%) | 667 (4.2%) |
| 1 Vehicle | 3,529 (19.8%) | 3,445 (21.7%) |
| 2 Vehicles | 8,361 (46.9%) | 6,946 (43.8%) |
| 3 Vehicles | 3,129 (17.6%) | 2,897 (18.3%) |
| 4 Vehicles | 1,443 (8.1%) | 1,386 (8.7%) |
| 5 or more Vehicles | 628 (3.5%) | 523 (3.3%) |
| Total | 17,810 (100.0%) | 15,864 (100.0%) |
Commute Time in Cayuga County
The most frequently occuring commute durations in Cayuga County are 5 to 9 minutes (5,064 commuters, 15.9%), 10 to 14 minutes (4,833 commuters, 15.1%), and 15 to 19 minutes (4,564 commuters, 14.3%).
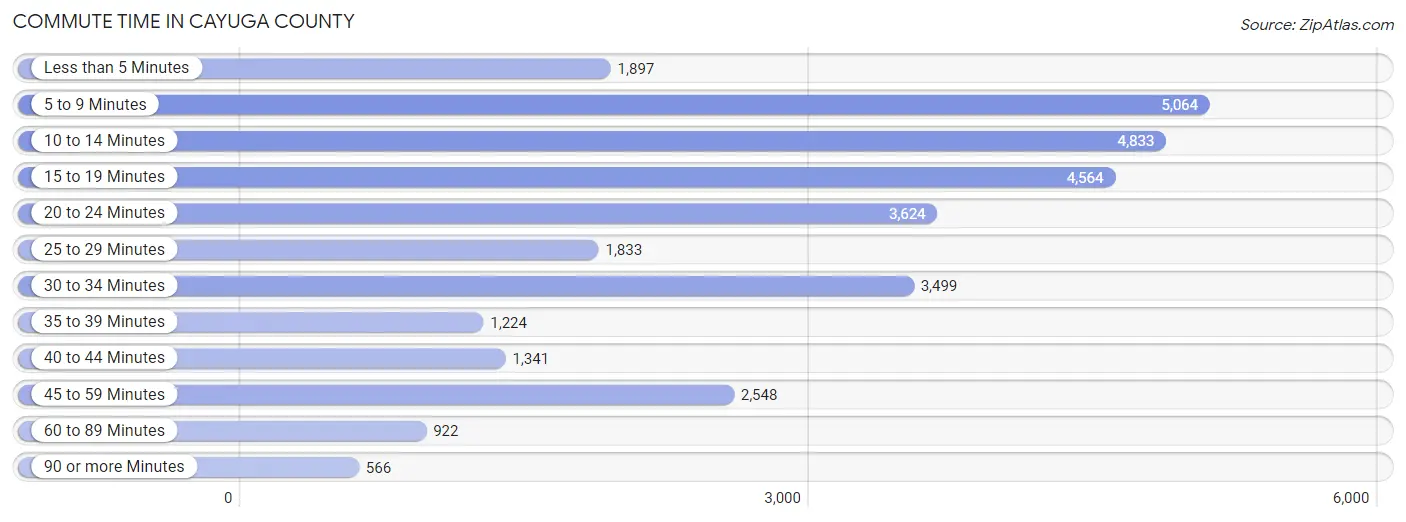
| Commute Time | # Commuters | % Commuters |
| Less than 5 Minutes | 1,897 | 5.9% |
| 5 to 9 Minutes | 5,064 | 15.9% |
| 10 to 14 Minutes | 4,833 | 15.1% |
| 15 to 19 Minutes | 4,564 | 14.3% |
| 20 to 24 Minutes | 3,624 | 11.4% |
| 25 to 29 Minutes | 1,833 | 5.7% |
| 30 to 34 Minutes | 3,499 | 11.0% |
| 35 to 39 Minutes | 1,224 | 3.8% |
| 40 to 44 Minutes | 1,341 | 4.2% |
| 45 to 59 Minutes | 2,548 | 8.0% |
| 60 to 89 Minutes | 922 | 2.9% |
| 90 or more Minutes | 566 | 1.8% |
Commute Time by Sex in Cayuga County
The most common commute times in Cayuga County are 10 to 14 minutes (2,553 commuters, 15.1%) for males and 5 to 9 minutes (2,672 commuters, 17.8%) for females.
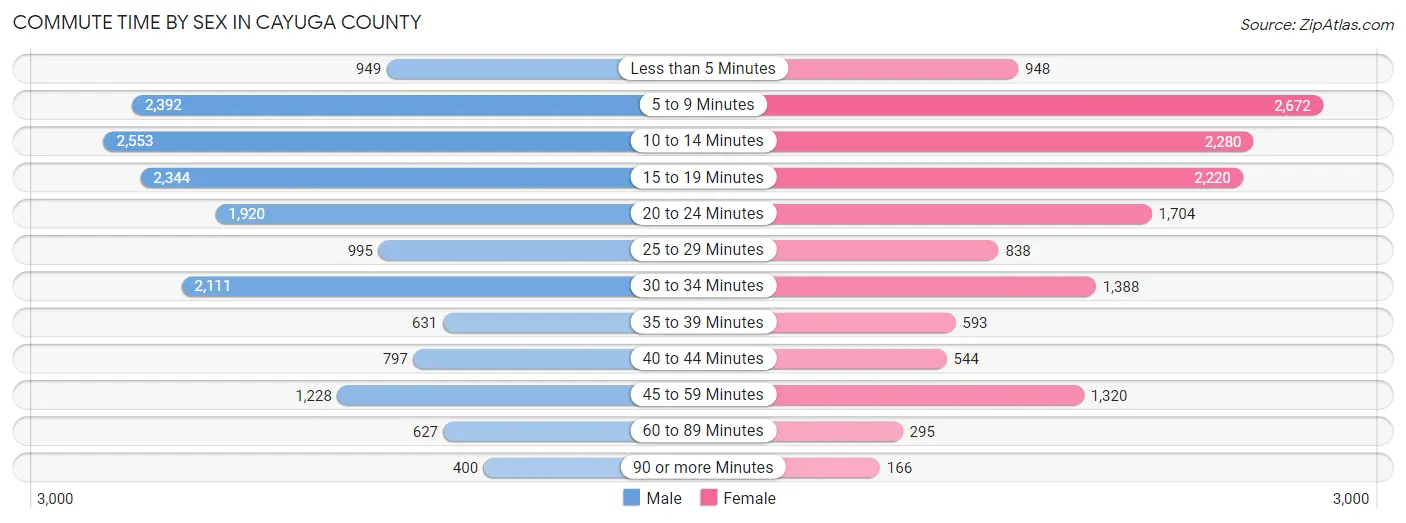
| Commute Time | Male | Female |
| Less than 5 Minutes | 949 (5.6%) | 948 (6.3%) |
| 5 to 9 Minutes | 2,392 (14.1%) | 2,672 (17.8%) |
| 10 to 14 Minutes | 2,553 (15.1%) | 2,280 (15.2%) |
| 15 to 19 Minutes | 2,344 (13.8%) | 2,220 (14.8%) |
| 20 to 24 Minutes | 1,920 (11.3%) | 1,704 (11.4%) |
| 25 to 29 Minutes | 995 (5.9%) | 838 (5.6%) |
| 30 to 34 Minutes | 2,111 (12.5%) | 1,388 (9.3%) |
| 35 to 39 Minutes | 631 (3.7%) | 593 (4.0%) |
| 40 to 44 Minutes | 797 (4.7%) | 544 (3.6%) |
| 45 to 59 Minutes | 1,228 (7.2%) | 1,320 (8.8%) |
| 60 to 89 Minutes | 627 (3.7%) | 295 (2.0%) |
| 90 or more Minutes | 400 (2.4%) | 166 (1.1%) |
Time of Departure to Work by Sex in Cayuga County
The most frequent times of departure to work in Cayuga County are 6:30 AM to 6:59 AM (2,260, 13.3%) for males and 7:00 AM to 7:29 AM (2,358, 15.8%) for females.
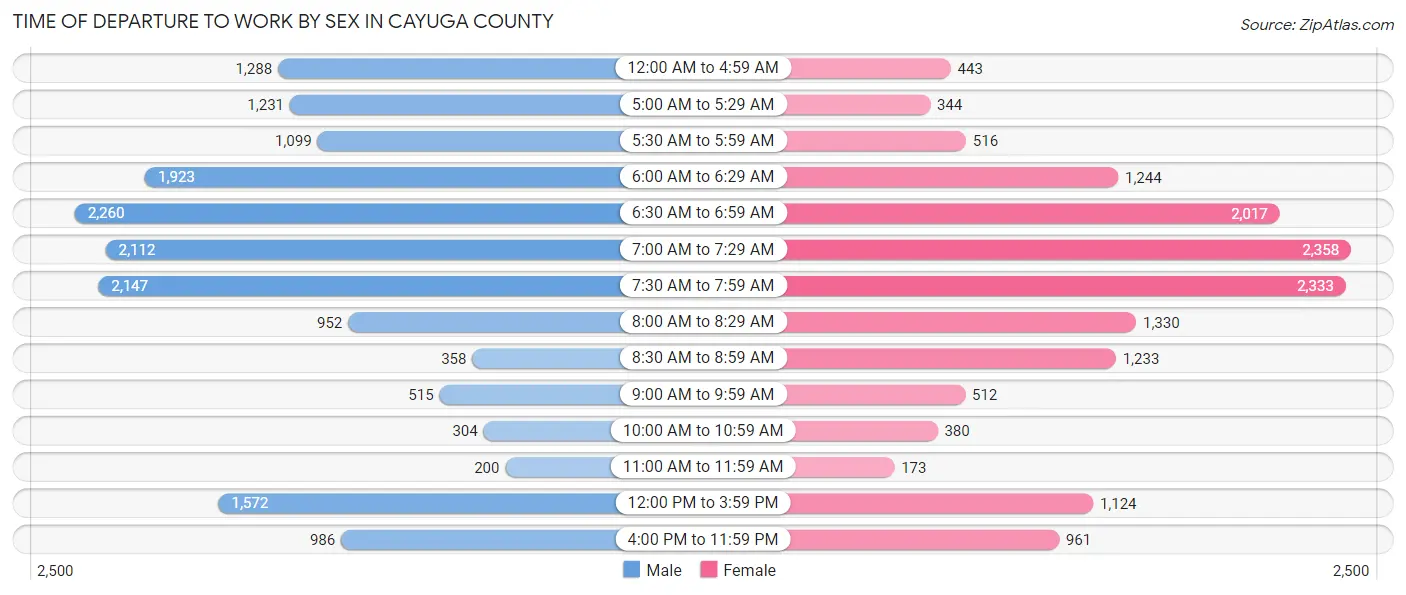
| Time of Departure | Male | Female |
| 12:00 AM to 4:59 AM | 1,288 (7.6%) | 443 (3.0%) |
| 5:00 AM to 5:29 AM | 1,231 (7.3%) | 344 (2.3%) |
| 5:30 AM to 5:59 AM | 1,099 (6.5%) | 516 (3.5%) |
| 6:00 AM to 6:29 AM | 1,923 (11.4%) | 1,244 (8.3%) |
| 6:30 AM to 6:59 AM | 2,260 (13.3%) | 2,017 (13.5%) |
| 7:00 AM to 7:29 AM | 2,112 (12.5%) | 2,358 (15.8%) |
| 7:30 AM to 7:59 AM | 2,147 (12.7%) | 2,333 (15.6%) |
| 8:00 AM to 8:29 AM | 952 (5.6%) | 1,330 (8.9%) |
| 8:30 AM to 8:59 AM | 358 (2.1%) | 1,233 (8.2%) |
| 9:00 AM to 9:59 AM | 515 (3.0%) | 512 (3.4%) |
| 10:00 AM to 10:59 AM | 304 (1.8%) | 380 (2.5%) |
| 11:00 AM to 11:59 AM | 200 (1.2%) | 173 (1.2%) |
| 12:00 PM to 3:59 PM | 1,572 (9.3%) | 1,124 (7.5%) |
| 4:00 PM to 11:59 PM | 986 (5.8%) | 961 (6.4%) |
| Total | 16,947 (100.0%) | 14,968 (100.0%) |
Housing Occupancy in Cayuga County
Occupancy by Ownership in Cayuga County
Of the total 30,910 dwellings in Cayuga County, owner-occupied units account for 21,643 (70.0%), while renter-occupied units make up 9,267 (30.0%).
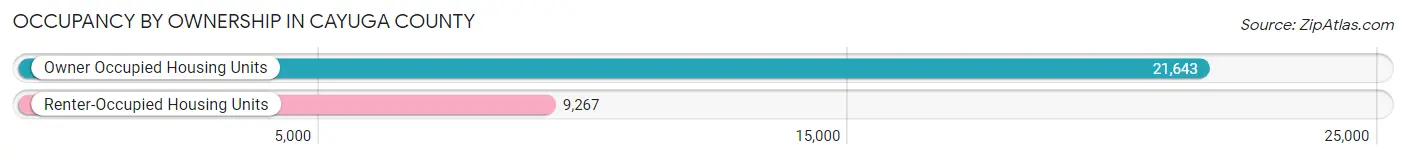
| Occupancy | # Housing Units | % Housing Units |
| Owner Occupied Housing Units | 21,643 | 70.0% |
| Renter-Occupied Housing Units | 9,267 | 30.0% |
| Total Occupied Housing Units | 30,910 | 100.0% |
Occupancy by Household Size in Cayuga County
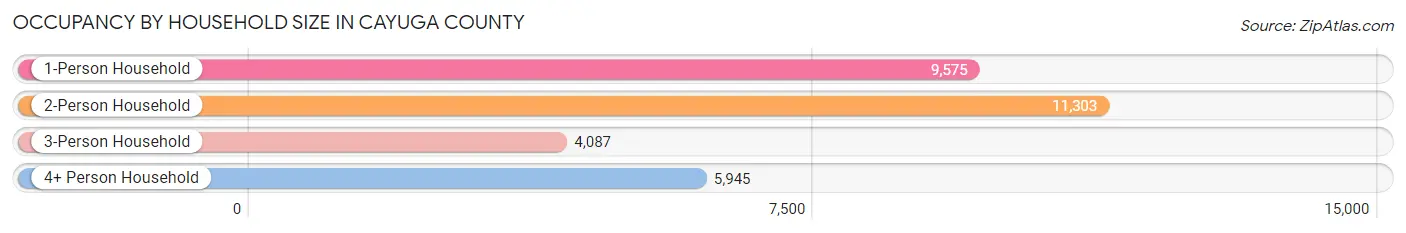
| Household Size | # Housing Units | % Housing Units |
| 1-Person Household | 9,575 | 31.0% |
| 2-Person Household | 11,303 | 36.6% |
| 3-Person Household | 4,087 | 13.2% |
| 4+ Person Household | 5,945 | 19.2% |
| Total Housing Units | 30,910 | 100.0% |
Occupancy by Ownership by Household Size in Cayuga County
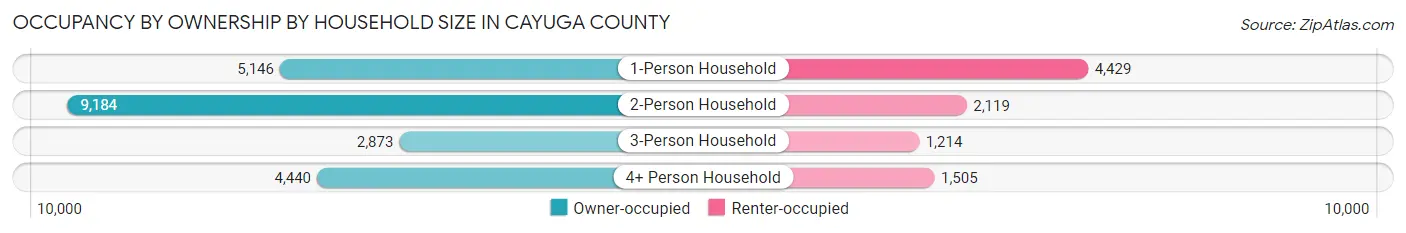
| Household Size | Owner-occupied | Renter-occupied |
| 1-Person Household | 5,146 (53.7%) | 4,429 (46.3%) |
| 2-Person Household | 9,184 (81.2%) | 2,119 (18.8%) |
| 3-Person Household | 2,873 (70.3%) | 1,214 (29.7%) |
| 4+ Person Household | 4,440 (74.7%) | 1,505 (25.3%) |
| Total Housing Units | 21,643 (70.0%) | 9,267 (30.0%) |
Occupancy by Educational Attainment in Cayuga County
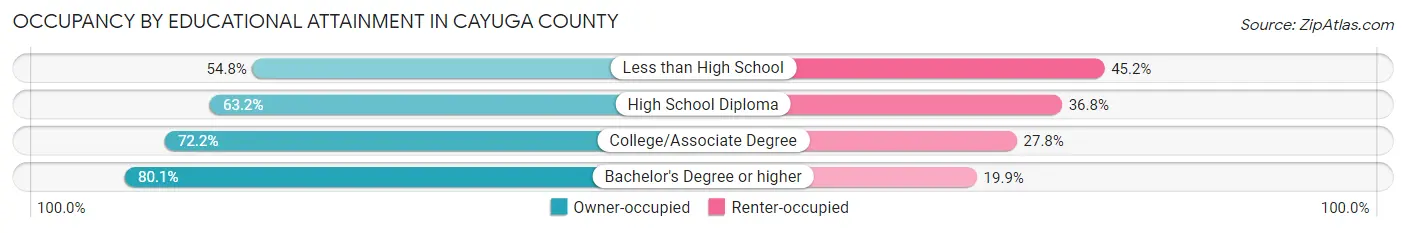
| Household Size | Owner-occupied | Renter-occupied |
| Less than High School | 1,385 (54.8%) | 1,143 (45.2%) |
| High School Diploma | 6,023 (63.2%) | 3,505 (36.8%) |
| College/Associate Degree | 7,865 (72.2%) | 3,034 (27.8%) |
| Bachelor's Degree or higher | 6,370 (80.1%) | 1,585 (19.9%) |
Occupancy by Age of Householder in Cayuga County
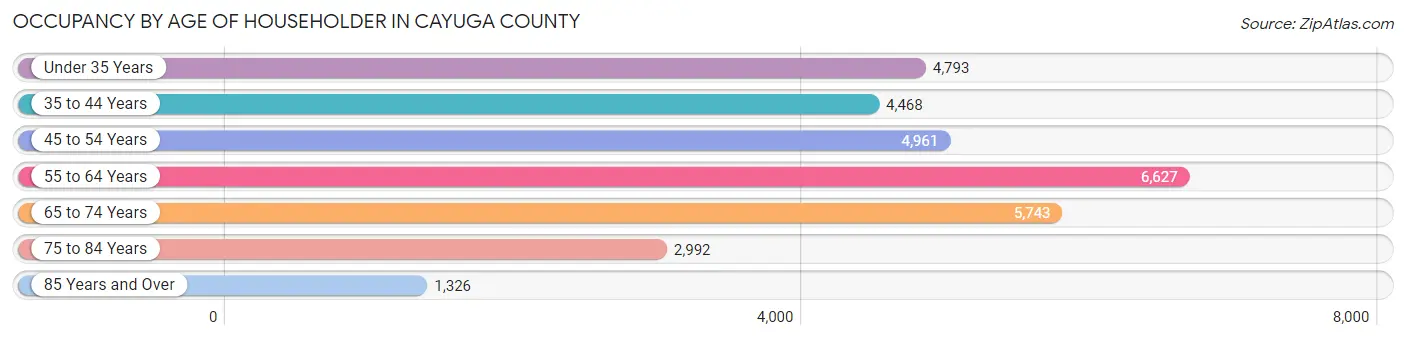
| Age Bracket | # Households | % Households |
| Under 35 Years | 4,793 | 15.5% |
| 35 to 44 Years | 4,468 | 14.4% |
| 45 to 54 Years | 4,961 | 16.1% |
| 55 to 64 Years | 6,627 | 21.4% |
| 65 to 74 Years | 5,743 | 18.6% |
| 75 to 84 Years | 2,992 | 9.7% |
| 85 Years and Over | 1,326 | 4.3% |
| Total | 30,910 | 100.0% |
Housing Finances in Cayuga County
Median Income by Occupancy in Cayuga County
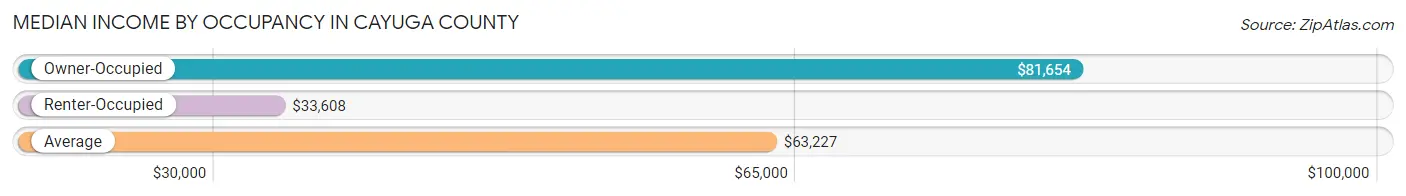
| Occupancy Type | # Households | Median Income |
| Owner-Occupied | 21,643 (70.0%) | $81,654 |
| Renter-Occupied | 9,267 (30.0%) | $33,608 |
| Average | 30,910 (100.0%) | $63,227 |
Occupancy by Householder Income Bracket in Cayuga County
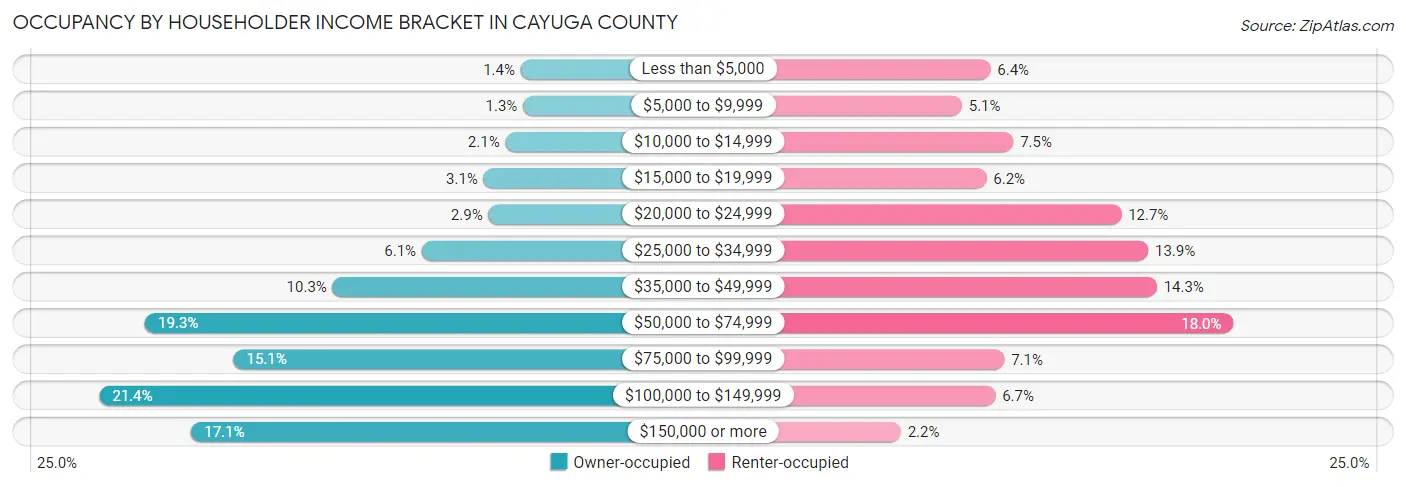
| Income Bracket | Owner-occupied | Renter-occupied |
| Less than $5,000 | 297 (1.4%) | 595 (6.4%) |
| $5,000 to $9,999 | 272 (1.3%) | 469 (5.1%) |
| $10,000 to $14,999 | 454 (2.1%) | 696 (7.5%) |
| $15,000 to $19,999 | 680 (3.1%) | 577 (6.2%) |
| $20,000 to $24,999 | 629 (2.9%) | 1,172 (12.7%) |
| $25,000 to $34,999 | 1,316 (6.1%) | 1,291 (13.9%) |
| $35,000 to $49,999 | 2,235 (10.3%) | 1,329 (14.3%) |
| $50,000 to $74,999 | 4,168 (19.3%) | 1,667 (18.0%) |
| $75,000 to $99,999 | 3,258 (15.0%) | 656 (7.1%) |
| $100,000 to $149,999 | 4,641 (21.4%) | 616 (6.7%) |
| $150,000 or more | 3,693 (17.1%) | 199 (2.1%) |
| Total | 21,643 (100.0%) | 9,267 (100.0%) |
Monthly Housing Cost Tiers in Cayuga County
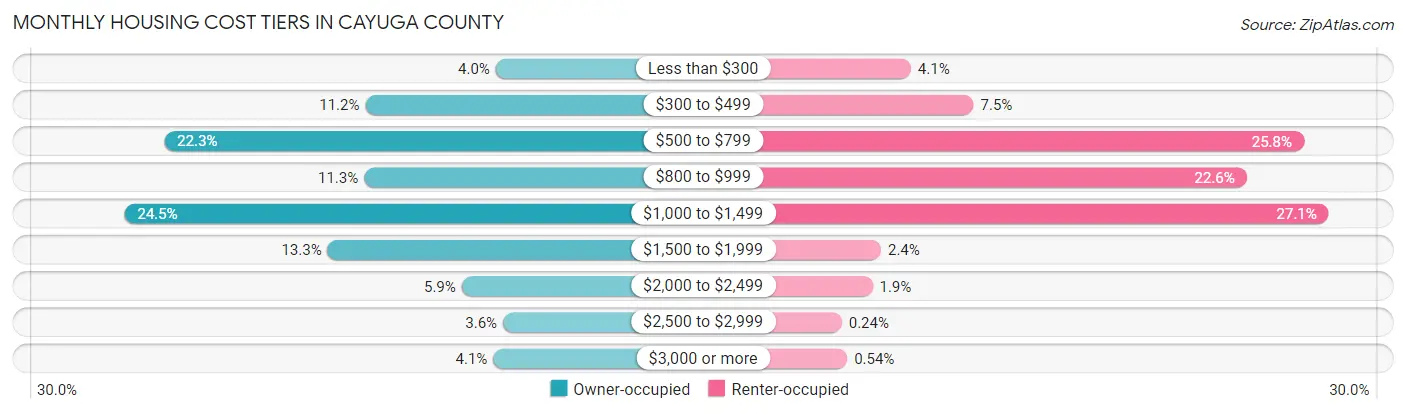
| Monthly Cost | Owner-occupied | Renter-occupied |
| Less than $300 | 861 (4.0%) | 376 (4.1%) |
| $300 to $499 | 2,419 (11.2%) | 697 (7.5%) |
| $500 to $799 | 4,824 (22.3%) | 2,387 (25.8%) |
| $800 to $999 | 2,434 (11.3%) | 2,094 (22.6%) |
| $1,000 to $1,499 | 5,300 (24.5%) | 2,514 (27.1%) |
| $1,500 to $1,999 | 2,871 (13.3%) | 223 (2.4%) |
| $2,000 to $2,499 | 1,268 (5.9%) | 180 (1.9%) |
| $2,500 to $2,999 | 775 (3.6%) | 22 (0.2%) |
| $3,000 or more | 891 (4.1%) | 50 (0.5%) |
| Total | 21,643 (100.0%) | 9,267 (100.0%) |
Physical Housing Characteristics in Cayuga County
Housing Structures in Cayuga County
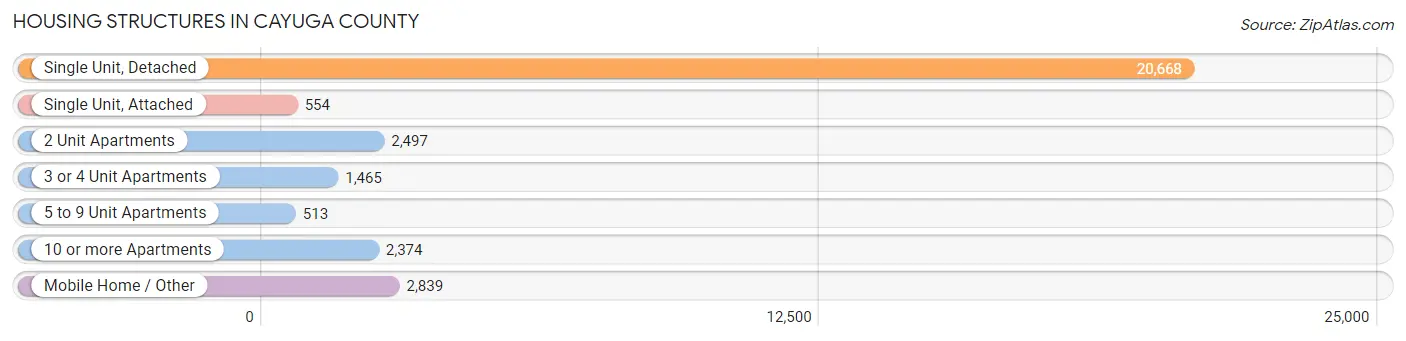
| Structure Type | # Housing Units | % Housing Units |
| Single Unit, Detached | 20,668 | 66.9% |
| Single Unit, Attached | 554 | 1.8% |
| 2 Unit Apartments | 2,497 | 8.1% |
| 3 or 4 Unit Apartments | 1,465 | 4.7% |
| 5 to 9 Unit Apartments | 513 | 1.7% |
| 10 or more Apartments | 2,374 | 7.7% |
| Mobile Home / Other | 2,839 | 9.2% |
| Total | 30,910 | 100.0% |
Housing Structures by Occupancy in Cayuga County
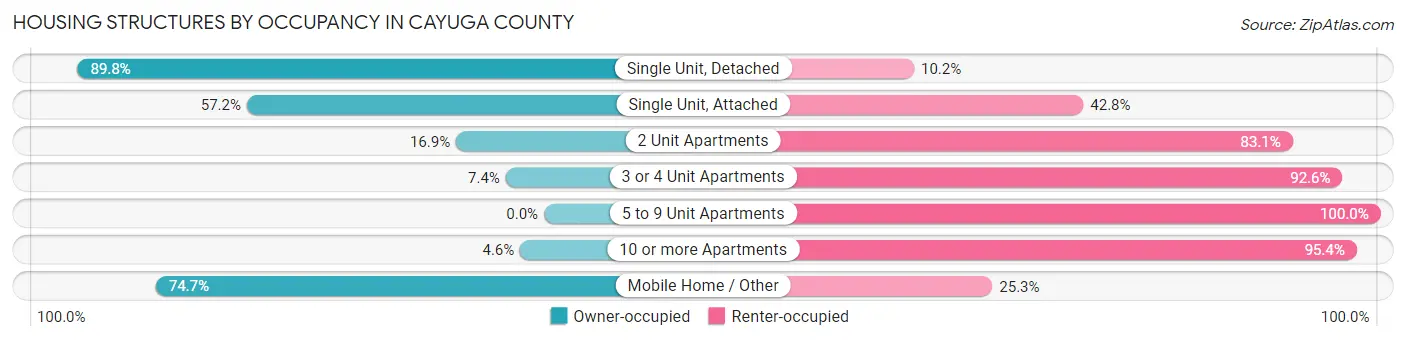
| Structure Type | Owner-occupied | Renter-occupied |
| Single Unit, Detached | 18,564 (89.8%) | 2,104 (10.2%) |
| Single Unit, Attached | 317 (57.2%) | 237 (42.8%) |
| 2 Unit Apartments | 423 (16.9%) | 2,074 (83.1%) |
| 3 or 4 Unit Apartments | 108 (7.4%) | 1,357 (92.6%) |
| 5 to 9 Unit Apartments | 0 (0.0%) | 513 (100.0%) |
| 10 or more Apartments | 109 (4.6%) | 2,265 (95.4%) |
| Mobile Home / Other | 2,122 (74.7%) | 717 (25.3%) |
| Total | 21,643 (70.0%) | 9,267 (30.0%) |
Housing Structures by Number of Rooms in Cayuga County
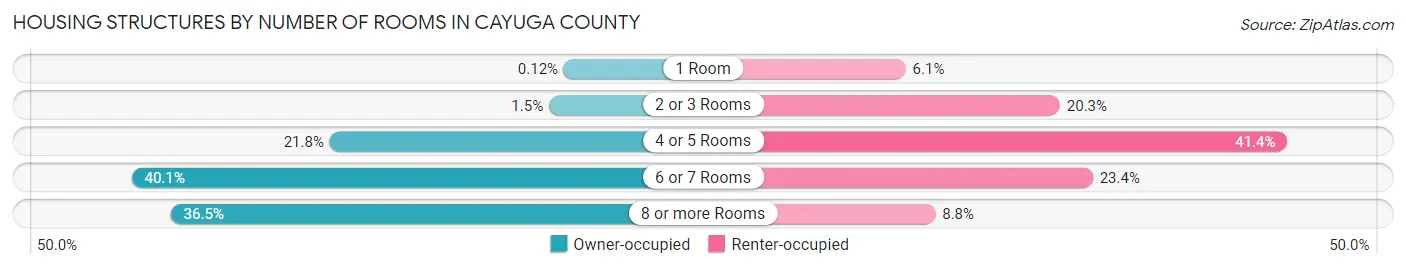
| Number of Rooms | Owner-occupied | Renter-occupied |
| 1 Room | 26 (0.1%) | 563 (6.1%) |
| 2 or 3 Rooms | 325 (1.5%) | 1,885 (20.3%) |
| 4 or 5 Rooms | 4,713 (21.8%) | 3,835 (41.4%) |
| 6 or 7 Rooms | 8,681 (40.1%) | 2,167 (23.4%) |
| 8 or more Rooms | 7,898 (36.5%) | 817 (8.8%) |
| Total | 21,643 (100.0%) | 9,267 (100.0%) |
Housing Structure by Heating Type in Cayuga County
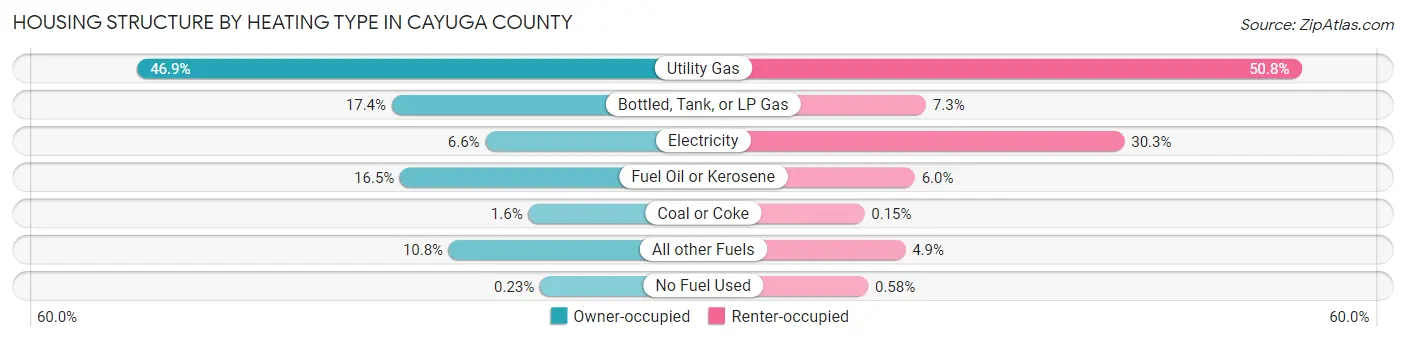
| Heating Type | Owner-occupied | Renter-occupied |
| Utility Gas | 10,159 (46.9%) | 4,708 (50.8%) |
| Bottled, Tank, or LP Gas | 3,770 (17.4%) | 676 (7.3%) |
| Electricity | 1,422 (6.6%) | 2,807 (30.3%) |
| Fuel Oil or Kerosene | 3,563 (16.5%) | 555 (6.0%) |
| Coal or Coke | 341 (1.6%) | 14 (0.2%) |
| All other Fuels | 2,338 (10.8%) | 453 (4.9%) |
| No Fuel Used | 50 (0.2%) | 54 (0.6%) |
| Total | 21,643 (100.0%) | 9,267 (100.0%) |
Household Vehicle Usage in Cayuga County
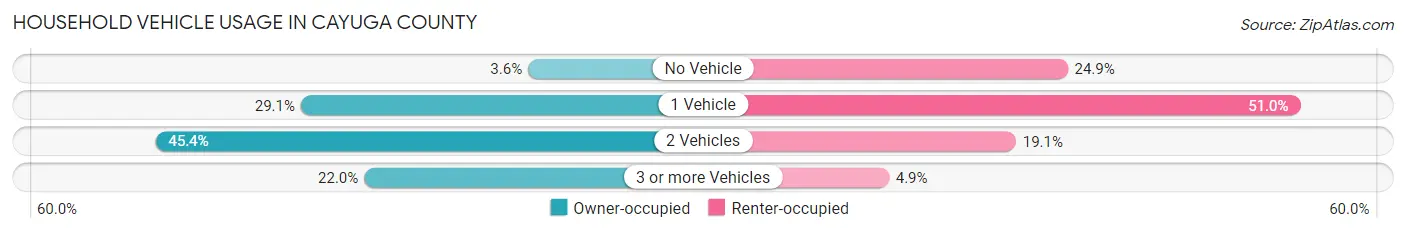
| Vehicles per Household | Owner-occupied | Renter-occupied |
| No Vehicle | 781 (3.6%) | 2,311 (24.9%) |
| 1 Vehicle | 6,290 (29.1%) | 4,727 (51.0%) |
| 2 Vehicles | 9,816 (45.4%) | 1,774 (19.1%) |
| 3 or more Vehicles | 4,756 (22.0%) | 455 (4.9%) |
| Total | 21,643 (100.0%) | 9,267 (100.0%) |
Real Estate & Mortgages in Cayuga County
Real Estate and Mortgage Overview in Cayuga County
| Characteristic | Without Mortgage | With Mortgage |
| Housing Units | 9,872 | 11,771 |
| Median Property Value | $141,800 | $168,300 |
| Median Household Income | $60,606 | $2,547 |
| Monthly Housing Costs | $639 | $881 |
| Real Estate Taxes | $3,278 | $385 |
Property Value by Mortgage Status in Cayuga County
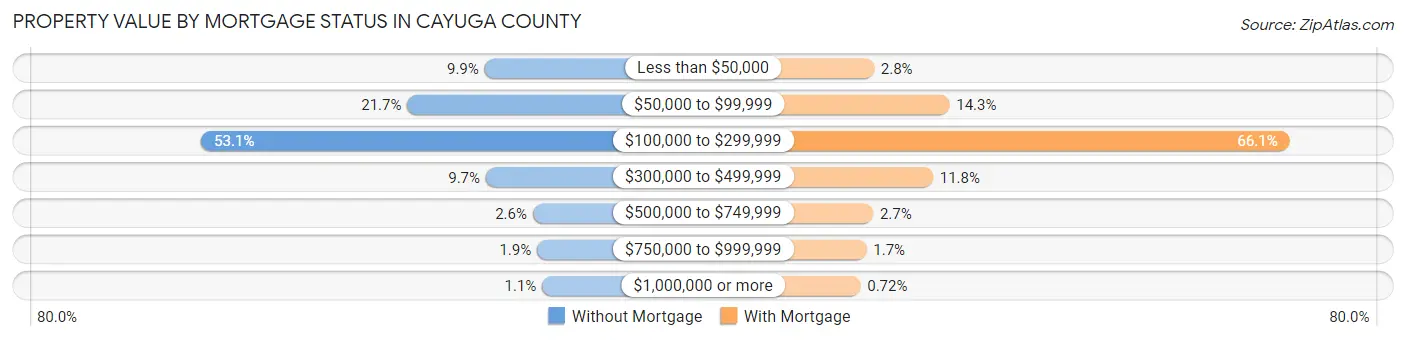
| Property Value | Without Mortgage | With Mortgage |
| Less than $50,000 | 977 (9.9%) | 328 (2.8%) |
| $50,000 to $99,999 | 2,140 (21.7%) | 1,682 (14.3%) |
| $100,000 to $299,999 | 5,242 (53.1%) | 7,784 (66.1%) |
| $300,000 to $499,999 | 959 (9.7%) | 1,385 (11.8%) |
| $500,000 to $749,999 | 253 (2.6%) | 313 (2.7%) |
| $750,000 to $999,999 | 189 (1.9%) | 194 (1.7%) |
| $1,000,000 or more | 112 (1.1%) | 85 (0.7%) |
| Total | 9,872 (100.0%) | 11,771 (100.0%) |
Household Income by Mortgage Status in Cayuga County
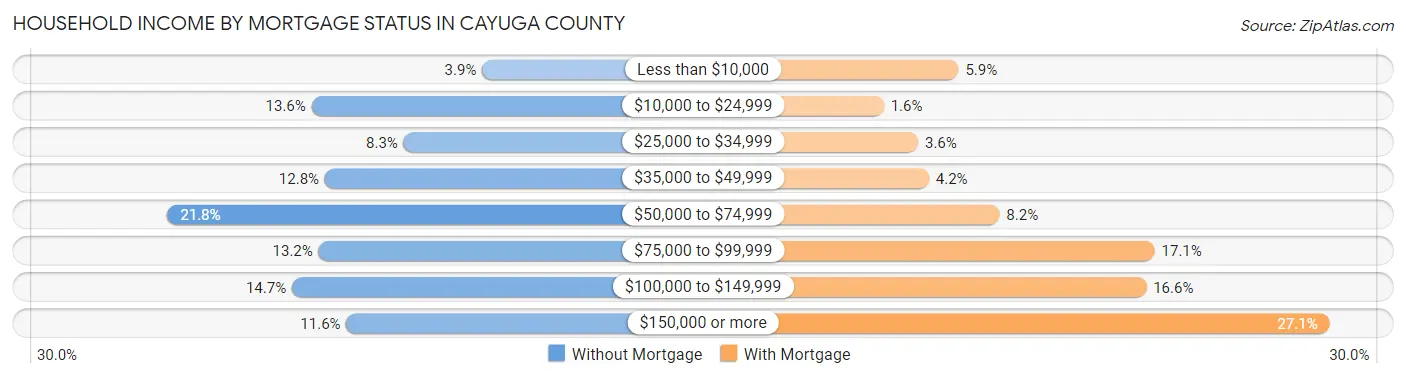
| Household Income | Without Mortgage | With Mortgage |
| Less than $10,000 | 380 (3.8%) | 692 (5.9%) |
| $10,000 to $24,999 | 1,343 (13.6%) | 189 (1.6%) |
| $25,000 to $34,999 | 823 (8.3%) | 420 (3.6%) |
| $35,000 to $49,999 | 1,268 (12.8%) | 493 (4.2%) |
| $50,000 to $74,999 | 2,156 (21.8%) | 967 (8.2%) |
| $75,000 to $99,999 | 1,303 (13.2%) | 2,012 (17.1%) |
| $100,000 to $149,999 | 1,453 (14.7%) | 1,955 (16.6%) |
| $150,000 or more | 1,146 (11.6%) | 3,188 (27.1%) |
| Total | 9,872 (100.0%) | 11,771 (100.0%) |
Property Value to Household Income Ratio in Cayuga County
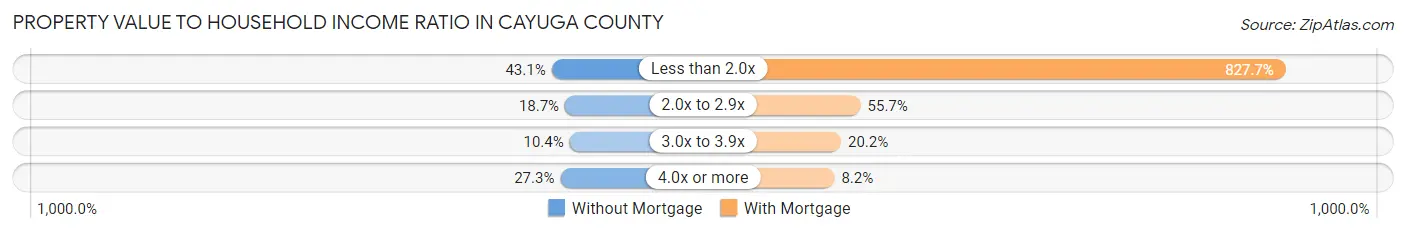
| Value-to-Income Ratio | Without Mortgage | With Mortgage |
| Less than 2.0x | 4,259 (43.1%) | 97,424 (827.7%) |
| 2.0x to 2.9x | 1,845 (18.7%) | 6,556 (55.7%) |
| 3.0x to 3.9x | 1,025 (10.4%) | 2,382 (20.2%) |
| 4.0x or more | 2,690 (27.3%) | 970 (8.2%) |
| Total | 9,872 (100.0%) | 11,771 (100.0%) |
Real Estate Taxes by Mortgage Status in Cayuga County
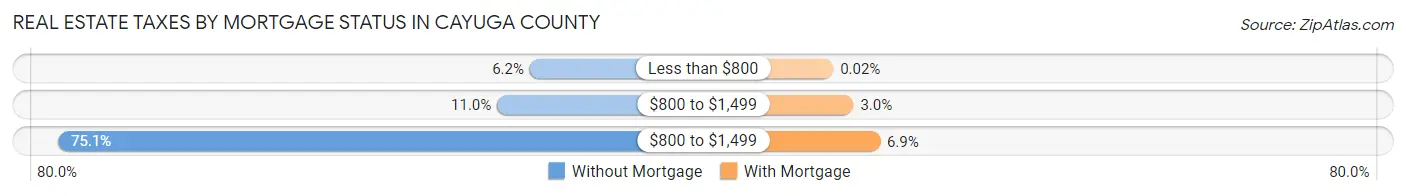
| Property Taxes | Without Mortgage | With Mortgage |
| Less than $800 | 610 (6.2%) | 2 (0.0%) |
| $800 to $1,499 | 1,082 (11.0%) | 352 (3.0%) |
| $800 to $1,499 | 7,416 (75.1%) | 806 (6.9%) |
| Total | 9,872 (100.0%) | 11,771 (100.0%) |
Health & Disability in Cayuga County
Health Insurance Coverage by Age in Cayuga County
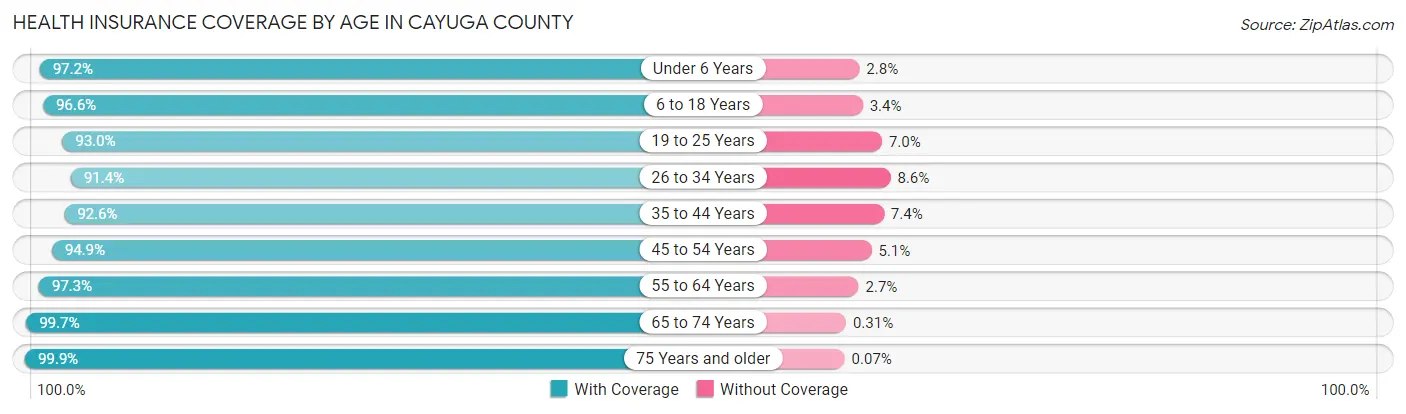
| Age Bracket | With Coverage | Without Coverage |
| Under 6 Years | 4,580 (97.2%) | 133 (2.8%) |
| 6 to 18 Years | 10,496 (96.6%) | 373 (3.4%) |
| 19 to 25 Years | 5,373 (93.0%) | 406 (7.0%) |
| 26 to 34 Years | 7,382 (91.4%) | 696 (8.6%) |
| 35 to 44 Years | 7,664 (92.6%) | 612 (7.4%) |
| 45 to 54 Years | 8,693 (94.9%) | 465 (5.1%) |
| 55 to 64 Years | 11,245 (97.3%) | 307 (2.7%) |
| 65 to 74 Years | 8,808 (99.7%) | 27 (0.3%) |
| 75 Years and older | 5,960 (99.9%) | 4 (0.1%) |
| Total | 70,201 (95.9%) | 3,023 (4.1%) |
Health Insurance Coverage by Citizenship Status in Cayuga County
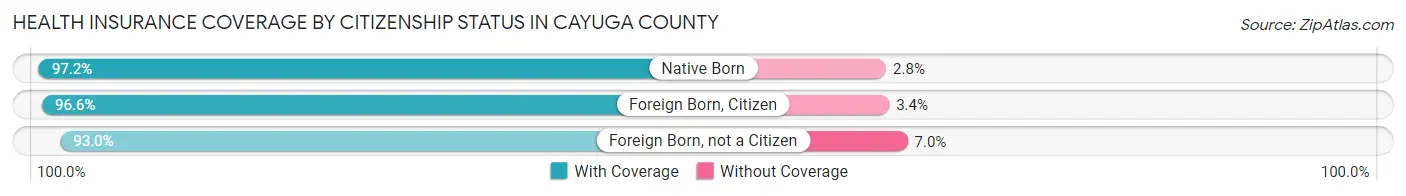
| Citizenship Status | With Coverage | Without Coverage |
| Native Born | 4,580 (97.2%) | 133 (2.8%) |
| Foreign Born, Citizen | 10,496 (96.6%) | 373 (3.4%) |
| Foreign Born, not a Citizen | 5,373 (93.0%) | 406 (7.0%) |
Health Insurance Coverage by Household Income in Cayuga County
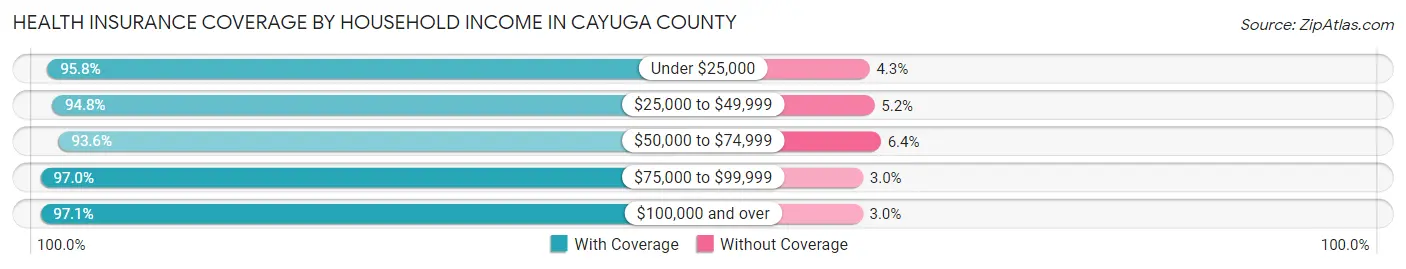
| Household Income | With Coverage | Without Coverage |
| Under $25,000 | 8,786 (95.8%) | 390 (4.3%) |
| $25,000 to $49,999 | 11,339 (94.8%) | 618 (5.2%) |
| $50,000 to $74,999 | 12,279 (93.6%) | 834 (6.4%) |
| $75,000 to $99,999 | 10,289 (97.0%) | 319 (3.0%) |
| $100,000 and over | 26,641 (97.1%) | 810 (2.9%) |
Public vs Private Health Insurance Coverage by Age in Cayuga County
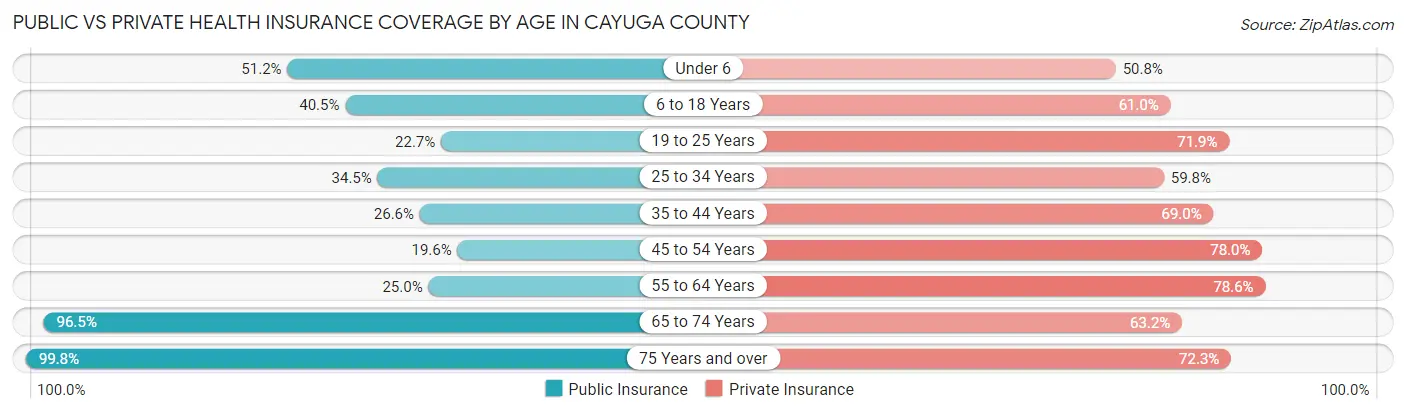
| Age Bracket | Public Insurance | Private Insurance |
| Under 6 | 2,414 (51.2%) | 2,396 (50.8%) |
| 6 to 18 Years | 4,399 (40.5%) | 6,634 (61.0%) |
| 19 to 25 Years | 1,311 (22.7%) | 4,156 (71.9%) |
| 25 to 34 Years | 2,785 (34.5%) | 4,828 (59.8%) |
| 35 to 44 Years | 2,204 (26.6%) | 5,710 (69.0%) |
| 45 to 54 Years | 1,799 (19.6%) | 7,147 (78.0%) |
| 55 to 64 Years | 2,892 (25.0%) | 9,083 (78.6%) |
| 65 to 74 Years | 8,523 (96.5%) | 5,581 (63.2%) |
| 75 Years and over | 5,950 (99.8%) | 4,310 (72.3%) |
| Total | 32,277 (44.1%) | 49,845 (68.1%) |
Disability Status by Sex by Age in Cayuga County
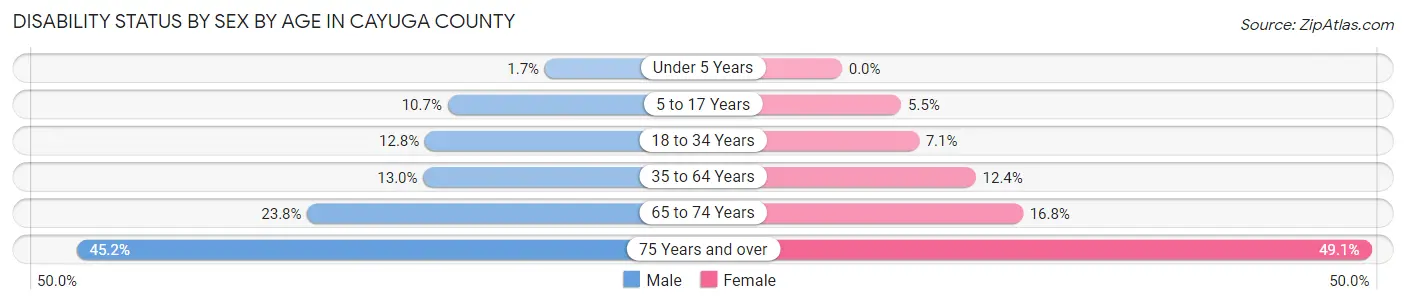
| Age Bracket | Male | Female |
| Under 5 Years | 33 (1.7%) | 0 (0.0%) |
| 5 to 17 Years | 618 (10.7%) | 289 (5.5%) |
| 18 to 34 Years | 965 (12.8%) | 511 (7.1%) |
| 35 to 64 Years | 1,866 (13.0%) | 1,816 (12.4%) |
| 65 to 74 Years | 1,048 (23.8%) | 743 (16.8%) |
| 75 Years and over | 1,167 (45.2%) | 1,661 (49.1%) |
Disability Class by Sex by Age in Cayuga County
Disability Class: Hearing Difficulty
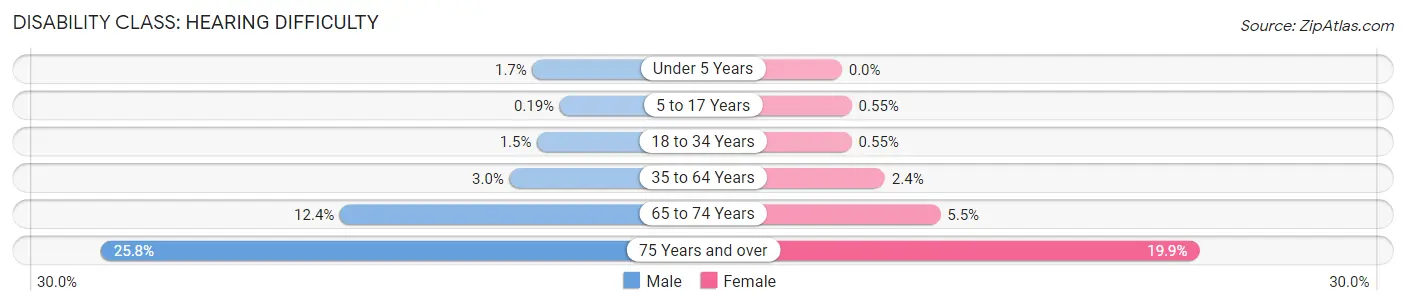
| Age Bracket | Male | Female |
| Under 5 Years | 33 (1.7%) | 0 (0.0%) |
| 5 to 17 Years | 11 (0.2%) | 29 (0.5%) |
| 18 to 34 Years | 109 (1.5%) | 39 (0.5%) |
| 35 to 64 Years | 430 (3.0%) | 351 (2.4%) |
| 65 to 74 Years | 548 (12.4%) | 243 (5.5%) |
| 75 Years and over | 665 (25.8%) | 673 (19.9%) |
Disability Class: Vision Difficulty
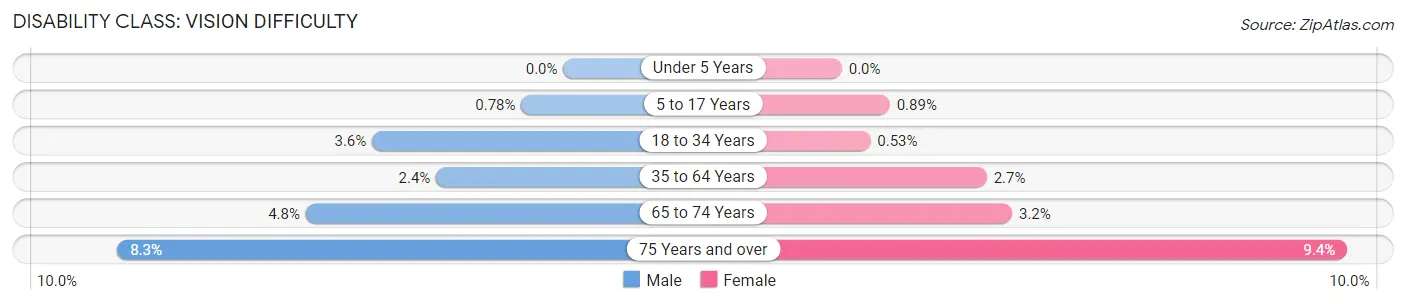
| Age Bracket | Male | Female |
| Under 5 Years | 0 (0.0%) | 0 (0.0%) |
| 5 to 17 Years | 45 (0.8%) | 47 (0.9%) |
| 18 to 34 Years | 267 (3.5%) | 38 (0.5%) |
| 35 to 64 Years | 339 (2.4%) | 393 (2.7%) |
| 65 to 74 Years | 211 (4.8%) | 140 (3.2%) |
| 75 Years and over | 214 (8.3%) | 317 (9.4%) |
Disability Class: Cognitive Difficulty
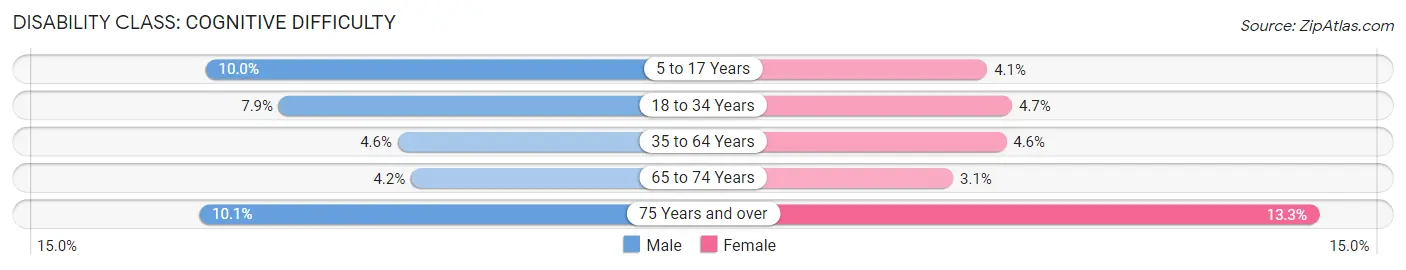
| Age Bracket | Male | Female |
| 5 to 17 Years | 574 (10.0%) | 213 (4.1%) |
| 18 to 34 Years | 596 (7.9%) | 339 (4.7%) |
| 35 to 64 Years | 662 (4.6%) | 669 (4.6%) |
| 65 to 74 Years | 187 (4.2%) | 137 (3.1%) |
| 75 Years and over | 262 (10.1%) | 449 (13.3%) |
Disability Class: Ambulatory Difficulty
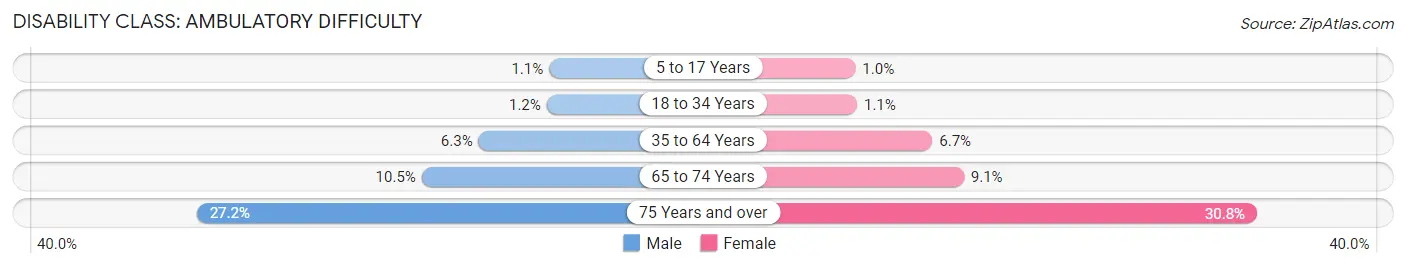
| Age Bracket | Male | Female |
| 5 to 17 Years | 61 (1.1%) | 53 (1.0%) |
| 18 to 34 Years | 93 (1.2%) | 81 (1.1%) |
| 35 to 64 Years | 905 (6.3%) | 983 (6.7%) |
| 65 to 74 Years | 464 (10.5%) | 401 (9.1%) |
| 75 Years and over | 703 (27.2%) | 1,042 (30.8%) |
Disability Class: Self-Care Difficulty
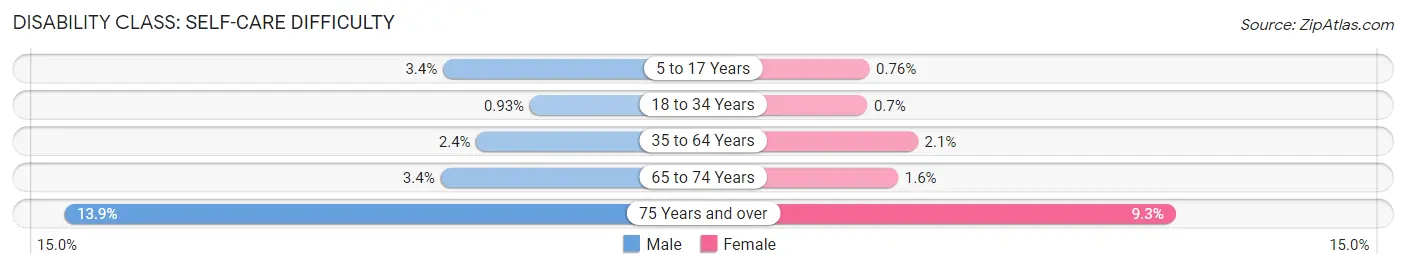
| Age Bracket | Male | Female |
| 5 to 17 Years | 193 (3.4%) | 40 (0.8%) |
| 18 to 34 Years | 70 (0.9%) | 50 (0.7%) |
| 35 to 64 Years | 347 (2.4%) | 308 (2.1%) |
| 65 to 74 Years | 151 (3.4%) | 69 (1.6%) |
| 75 Years and over | 359 (13.9%) | 314 (9.3%) |
Technology Access in Cayuga County
Computing Device Access in Cayuga County
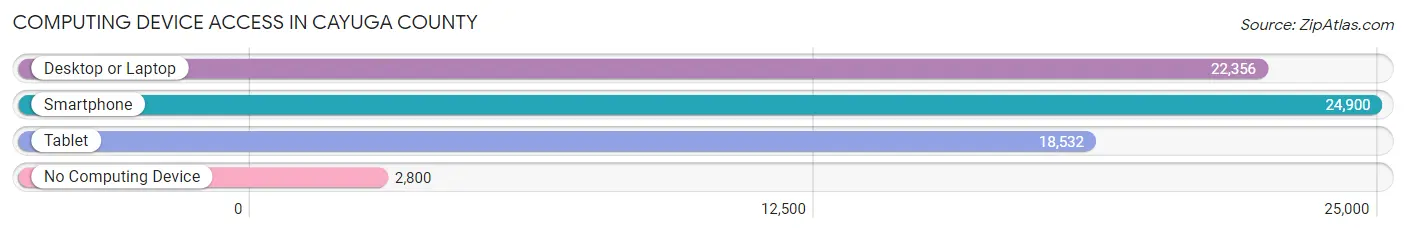
| Device Type | # Households | % Households |
| Desktop or Laptop | 22,356 | 72.3% |
| Smartphone | 24,900 | 80.6% |
| Tablet | 18,532 | 60.0% |
| No Computing Device | 2,800 | 9.1% |
| Total | 30,910 | 100.0% |
Internet Access in Cayuga County
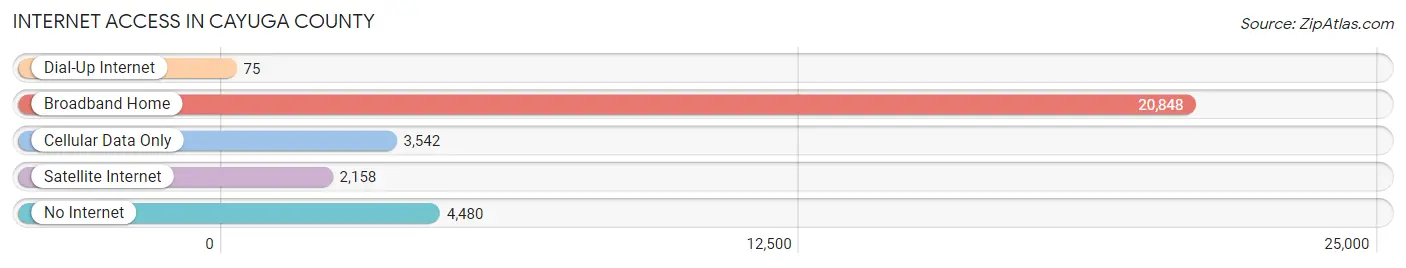
| Internet Type | # Households | % Households |
| Dial-Up Internet | 75 | 0.2% |
| Broadband Home | 20,848 | 67.4% |
| Cellular Data Only | 3,542 | 11.5% |
| Satellite Internet | 2,158 | 7.0% |
| No Internet | 4,480 | 14.5% |
| Total | 30,910 | 100.0% |
Cayuga County Summary
Cayuga County is located in the Finger Lakes region of New York State. It is bordered by Seneca, Tompkins, Cortland, Onondaga, and Oswego Counties. The county seat is Auburn, and the largest city is Auburn. The county has a total area of 664 square miles, of which 658 square miles is land and 6.2 square miles is water.
History
The area that is now Cayuga County was originally inhabited by the Cayuga Nation, a member of the Iroquois Confederacy. The first Europeans to settle in the area were the French in the late 17th century. The area was part of the Central New York Military Tract, which was set aside for veterans of the Revolutionary War. The first county seat was established in 1799 in the village of Aurelius.
In 1817, the county was divided into two parts, with the northern part becoming Cayuga County and the southern part becoming Tompkins County. The county was named after the Cayuga Nation, which had been forced to cede its land to the state in 1795.
Geography
Cayuga County is located in the Finger Lakes region of New York State. It is bordered by Seneca, Tompkins, Cortland, Onondaga, and Oswego Counties. The county has a total area of 664 square miles, of which 658 square miles is land and 6.2 square miles is water.
The terrain of the county is generally flat, with rolling hills in the northern and eastern parts of the county. The highest point in the county is 1,945 feet above sea level, located in the town of Springport. The county is drained by the Seneca and Cayuga Rivers, as well as several smaller streams.
Economy
Cayuga County has a diverse economy, with a mix of manufacturing, agriculture, and tourism. The county is home to several large manufacturing companies, including Nestle, Welch Allyn, and BorgWarner. Agriculture is also an important part of the economy, with dairy farming being the most common type of farming in the county.
Tourism is also an important part of the economy, with the Finger Lakes region being a popular destination for visitors. The county is home to several wineries, as well as several state parks and historic sites.
Demographics
As of the 2010 census, the population of Cayuga County was 80,026. The population has been steadily increasing since 2000, when it was 76,227. The population is spread out, with the largest population centers being Auburn, Weedsport, and Moravia.
The racial makeup of the county is 92.3% White, 4.2% Black or African American, 0.5% Native American, 0.7% Asian, 0.1% Pacific Islander, and 1.2% from two or more races. The median household income is $48,945, and the median family income is $60,945. The per capita income is $25,845.
Common Questions
What is Per Capita Income in Cayuga County?
Per Capita income in Cayuga County is $35,579.
What is the Median Family Income in Cayuga County?
Median Family Income in Cayuga County is $85,900.
What is the Median Household income in Cayuga County?
Median Household Income in Cayuga County is $63,227.
What is Income or Wage Gap in Cayuga County?
Income or Wage Gap in Cayuga County is 27.2%.
Women in Cayuga County earn 72.8 cents for every dollar earned by a man.
What is Family Income Deficit in Cayuga County?
Family Income Deficit in Cayuga County is $10,712.
Families that are below poverty line in Cayuga County earn $10,712 less on average than the poverty threshold level.
What is Inequality or Gini Index in Cayuga County?
Inequality or Gini Index in Cayuga County is 0.45.
What is the Total Population of Cayuga County?
Total Population of Cayuga County is 76,171.
What is the Total Male Population of Cayuga County?
Total Male Population of Cayuga County is 39,143.
What is the Total Female Population of Cayuga County?
Total Female Population of Cayuga County is 37,028.
What is the Ratio of Males per 100 Females in Cayuga County?
There are 105.71 Males per 100 Females in Cayuga County.
What is the Ratio of Females per 100 Males in Cayuga County?
There are 94.60 Females per 100 Males in Cayuga County.
What is the Median Population Age in Cayuga County?
Median Population Age in Cayuga County is 43.4 Years.
What is the Average Family Size in Cayuga County
Average Family Size in Cayuga County is 2.9 People.
What is the Average Household Size in Cayuga County
Average Household Size in Cayuga County is 2.3 People.
How Large is the Labor Force in Cayuga County?
There are 36,324 People in the Labor Forcein in Cayuga County.
What is the Percentage of People in the Labor Force in Cayuga County?
57.6% of People are in the Labor Force in Cayuga County.
What is the Unemployment Rate in Cayuga County?
Unemployment Rate in Cayuga County is 4.3%.