Broome County, NY Map & Demographics
Broome County Map
Broome County Overview
$33,674
PER CAPITA INCOME
$78,605
AVG FAMILY INCOME
$58,317
AVG HOUSEHOLD INCOME
24.2%
WAGE / INCOME GAP [ % ]
75.8¢/ $1
WAGE / INCOME GAP [ $ ]
$11,109
FAMILY INCOME DEFICIT
0.48
INEQUALITY / GINI INDEX
198,365
TOTAL POPULATION
98,025
MALE POPULATION
100,340
FEMALE POPULATION
97.69
MALES / 100 FEMALES
102.36
FEMALES / 100 MALES
39.7
MEDIAN AGE
3.0
AVG FAMILY SIZE
2.3
AVG HOUSEHOLD SIZE
93,834
LABOR FORCE [ PEOPLE ]
56.8%
PERCENT IN LABOR FORCE
6.9%
UNEMPLOYMENT RATE
Broome County Area Codes
Income in Broome County
Income Overview in Broome County
Per Capita Income in Broome County is $33,674, while median incomes of families and households are $78,605 and $58,317 respectively.
| Characteristic | Number | Measure |
| Per Capita Income | 198,365 | $33,674 |
| Median Family Income | 45,883 | $78,605 |
| Mean Family Income | 45,883 | $100,317 |
| Median Household Income | 81,339 | $58,317 |
| Mean Household Income | 81,339 | $81,198 |
| Income Deficit | 45,883 | $11,109 |
| Wage / Income Gap (%) | 198,365 | 24.19% |
| Wage / Income Gap ($) | 198,365 | 75.81¢ per $1 |
| Gini / Inequality Index | 198,365 | 0.48 |
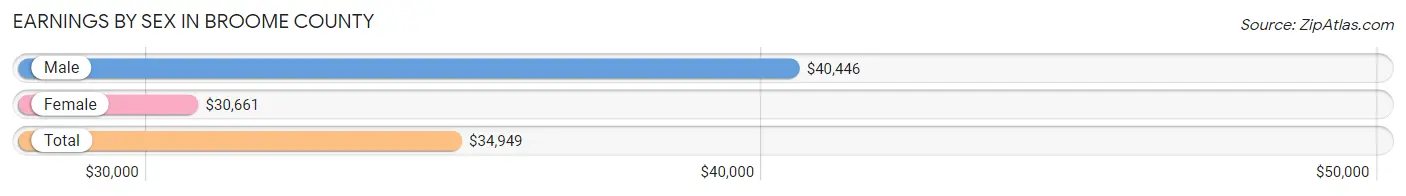
Earnings by Sex in Broome County
Average Earnings in Broome County are $34,949, $40,446 for men and $30,661 for women, a difference of 24.2%.
| Sex | Number | Average Earnings |
| Male | 52,101 (51.8%) | $40,446 |
| Female | 48,458 (48.2%) | $30,661 |
| Total | 100,559 (100.0%) | $34,949 |
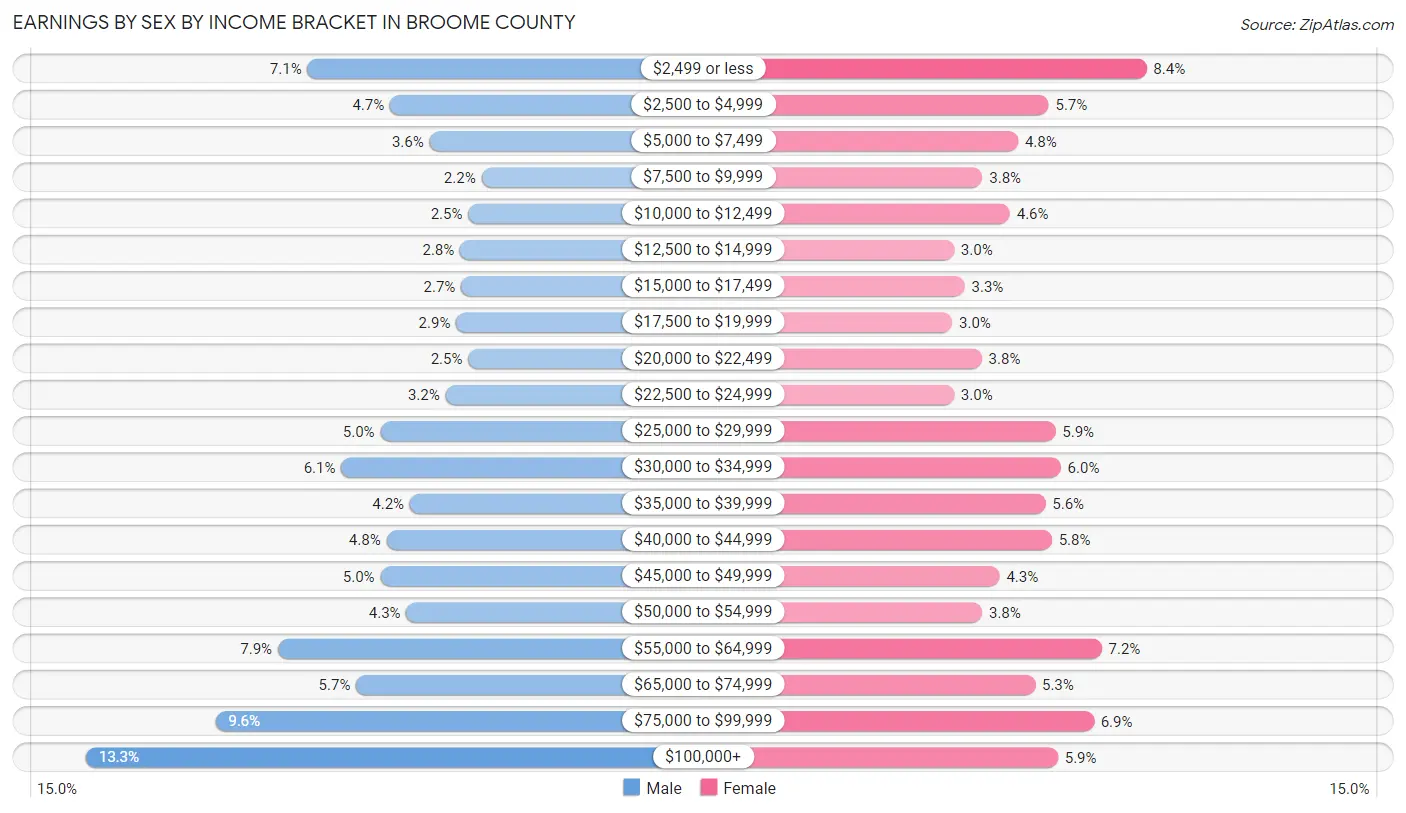
Earnings by Sex by Income Bracket in Broome County
The most common earnings brackets in Broome County are $100,000+ for men (6,918 | 13.3%) and $2,499 or less for women (4,081 | 8.4%).
| Income | Male | Female |
| $2,499 or less | 3,674 (7.0%) | 4,081 (8.4%) |
| $2,500 to $4,999 | 2,463 (4.7%) | 2,747 (5.7%) |
| $5,000 to $7,499 | 1,884 (3.6%) | 2,331 (4.8%) |
| $7,500 to $9,999 | 1,127 (2.2%) | 1,844 (3.8%) |
| $10,000 to $12,499 | 1,318 (2.5%) | 2,218 (4.6%) |
| $12,500 to $14,999 | 1,437 (2.8%) | 1,459 (3.0%) |
| $15,000 to $17,499 | 1,422 (2.7%) | 1,603 (3.3%) |
| $17,500 to $19,999 | 1,497 (2.9%) | 1,433 (3.0%) |
| $20,000 to $22,499 | 1,320 (2.5%) | 1,836 (3.8%) |
| $22,500 to $24,999 | 1,652 (3.2%) | 1,461 (3.0%) |
| $25,000 to $29,999 | 2,603 (5.0%) | 2,842 (5.9%) |
| $30,000 to $34,999 | 3,179 (6.1%) | 2,914 (6.0%) |
| $35,000 to $39,999 | 2,175 (4.2%) | 2,705 (5.6%) |
| $40,000 to $44,999 | 2,517 (4.8%) | 2,792 (5.8%) |
| $45,000 to $49,999 | 2,607 (5.0%) | 2,081 (4.3%) |
| $50,000 to $54,999 | 2,224 (4.3%) | 1,842 (3.8%) |
| $55,000 to $64,999 | 4,103 (7.9%) | 3,471 (7.2%) |
| $65,000 to $74,999 | 2,959 (5.7%) | 2,563 (5.3%) |
| $75,000 to $99,999 | 5,022 (9.6%) | 3,361 (6.9%) |
| $100,000+ | 6,918 (13.3%) | 2,874 (5.9%) |
| Total | 52,101 (100.0%) | 48,458 (100.0%) |
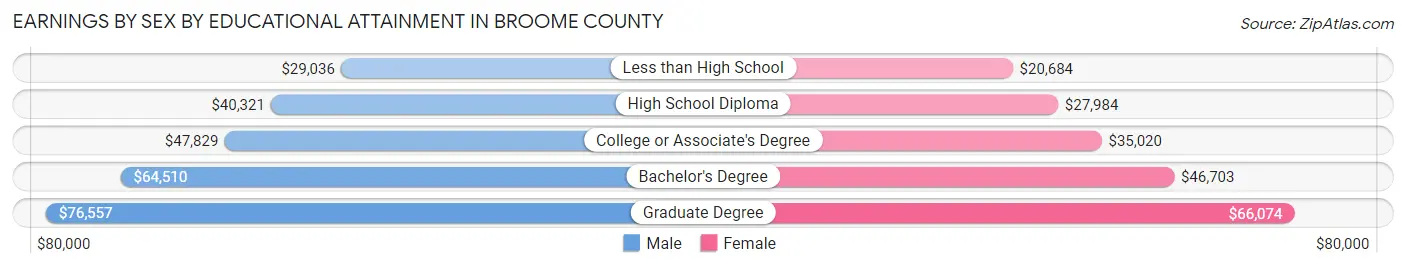
Earnings by Sex by Educational Attainment in Broome County
Average earnings in Broome County are $49,247 for men and $38,412 for women, a difference of 22.0%. Men with an educational attainment of graduate degree enjoy the highest average annual earnings of $76,557, while those with less than high school education earn the least with $29,036. Women with an educational attainment of graduate degree earn the most with the average annual earnings of $66,074, while those with less than high school education have the smallest earnings of $20,684.
| Educational Attainment | Male Income | Female Income |
| Less than High School | $29,036 | $20,684 |
| High School Diploma | $40,321 | $27,984 |
| College or Associate's Degree | $47,829 | $35,020 |
| Bachelor's Degree | $64,510 | $46,703 |
| Graduate Degree | $76,557 | $66,074 |
| Total | $49,247 | $38,412 |
Family Income in Broome County
Family Income Brackets in Broome County
According to the Broome County family income data, there are 9,544 families falling into the $100,000 to $149,999 income range, which is the most common income bracket and makes up 20.8% of all families. Conversely, the $10,000 to $14,999 income bracket is the least frequent group with only 1,285 families (2.8%) belonging to this category.
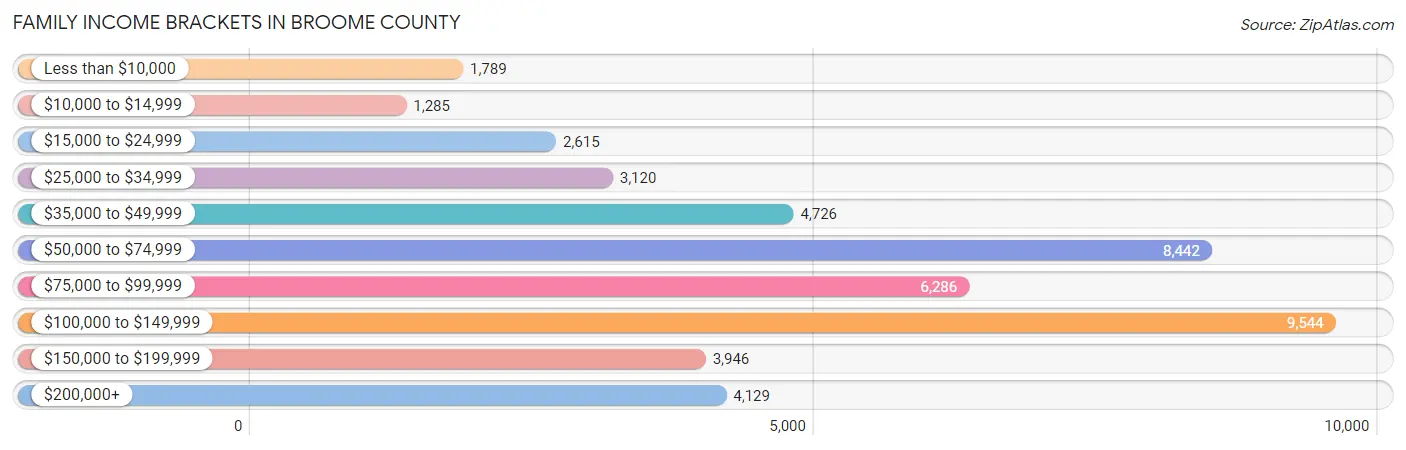
| Income Bracket | # Families | % Families |
| Less than $10,000 | 1,789 | 3.9% |
| $10,000 to $14,999 | 1,285 | 2.8% |
| $15,000 to $24,999 | 2,615 | 5.7% |
| $25,000 to $34,999 | 3,120 | 6.8% |
| $35,000 to $49,999 | 4,726 | 10.3% |
| $50,000 to $74,999 | 8,442 | 18.4% |
| $75,000 to $99,999 | 6,286 | 13.7% |
| $100,000 to $149,999 | 9,544 | 20.8% |
| $150,000 to $199,999 | 3,946 | 8.6% |
| $200,000+ | 4,129 | 9.0% |
Family Income by Famaliy Size in Broome County
4-person families (6,765 | 14.7%) account for the highest median family income in Broome County with $108,175 per family, while 2-person families (24,146 | 52.6%) have the highest median income of $36,218 per family member.
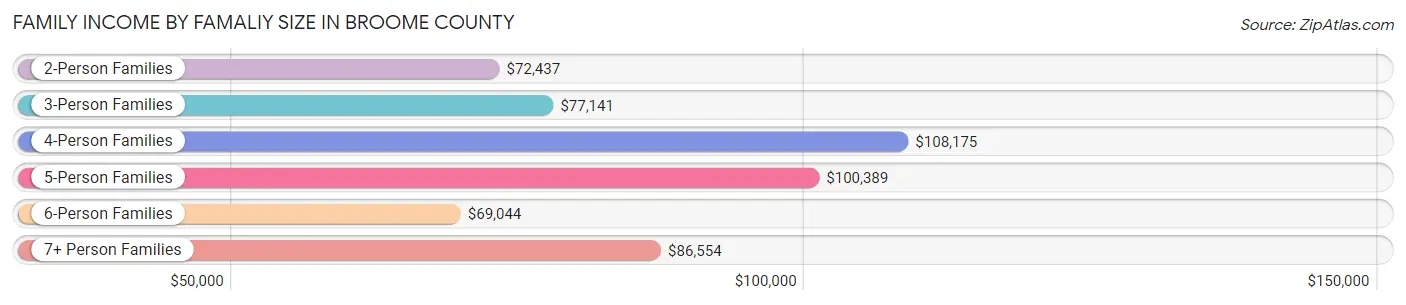
| Income Bracket | # Families | Median Income |
| 2-Person Families | 24,146 (52.6%) | $72,437 |
| 3-Person Families | 9,919 (21.6%) | $77,141 |
| 4-Person Families | 6,765 (14.7%) | $108,175 |
| 5-Person Families | 3,220 (7.0%) | $100,389 |
| 6-Person Families | 1,167 (2.5%) | $69,044 |
| 7+ Person Families | 666 (1.5%) | $86,554 |
| Total | 45,883 (100.0%) | $78,605 |
Family Income by Number of Earners in Broome County
The median family income in Broome County is $78,605, with families comprising 3+ earners (4,218) having the highest median family income of $143,750, while families with no earners (8,772) have the lowest median family income of $46,235, accounting for 9.2% and 19.1% of families, respectively.
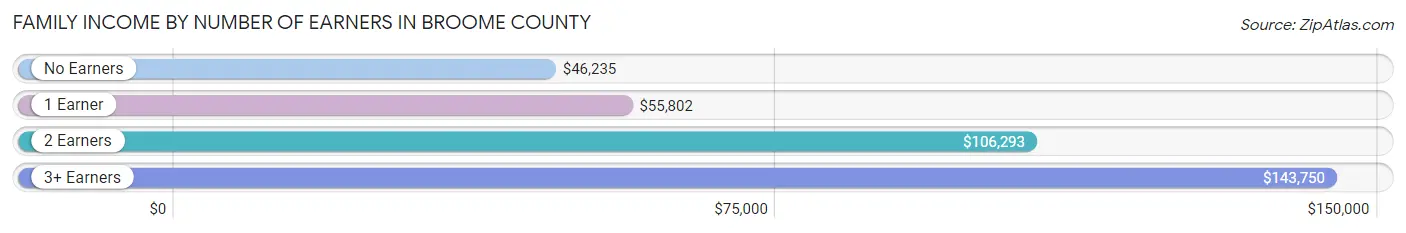
| Number of Earners | # Families | Median Income |
| No Earners | 8,772 (19.1%) | $46,235 |
| 1 Earner | 14,797 (32.3%) | $55,802 |
| 2 Earners | 18,096 (39.4%) | $106,293 |
| 3+ Earners | 4,218 (9.2%) | $143,750 |
| Total | 45,883 (100.0%) | $78,605 |
Household Income in Broome County
Household Income Brackets in Broome County
With 14,316 households falling in the category, the $50,000 to $74,999 income range is the most frequent in Broome County, accounting for 17.6% of all households. In contrast, only 4,392 households (5.4%) fall into the $10,000 to $14,999 income bracket, making it the least populous group.
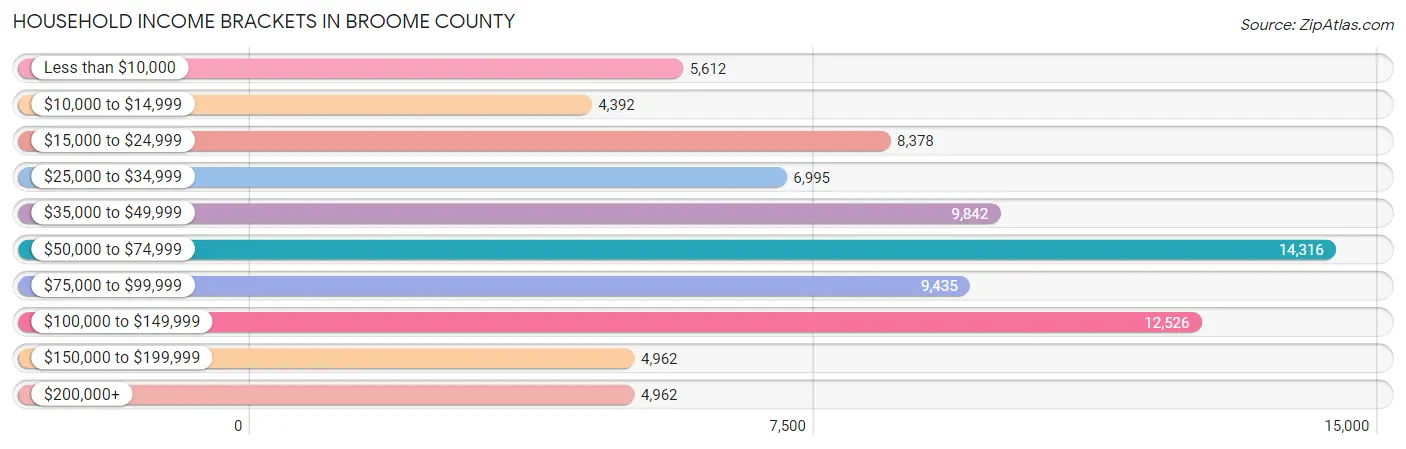
| Income Bracket | # Households | % Households |
| Less than $10,000 | 5,612 | 6.9% |
| $10,000 to $14,999 | 4,392 | 5.4% |
| $15,000 to $24,999 | 8,378 | 10.3% |
| $25,000 to $34,999 | 6,995 | 8.6% |
| $35,000 to $49,999 | 9,842 | 12.1% |
| $50,000 to $74,999 | 14,316 | 17.6% |
| $75,000 to $99,999 | 9,435 | 11.6% |
| $100,000 to $149,999 | 12,526 | 15.4% |
| $150,000 to $199,999 | 4,962 | 6.1% |
| $200,000+ | 4,962 | 6.1% |
Household Income by Householder Age in Broome County
The median household income in Broome County is $58,317, with the highest median household income of $72,434 found in the 45 to 64 years age bracket for the primary householder. A total of 29,148 households (35.8%) fall into this category. Meanwhile, the 15 to 24 years age bracket for the primary householder has the lowest median household income of $23,503, with 5,905 households (7.3%) in this group.
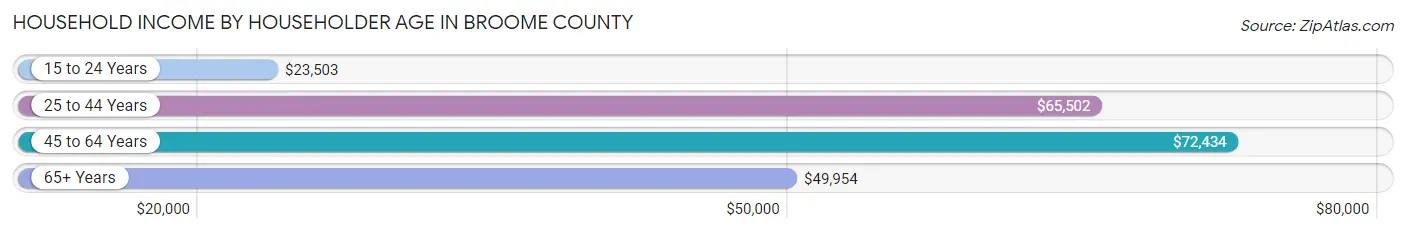
| Income Bracket | # Households | Median Income |
| 15 to 24 Years | 5,905 (7.3%) | $23,503 |
| 25 to 44 Years | 21,034 (25.9%) | $65,502 |
| 45 to 64 Years | 29,148 (35.8%) | $72,434 |
| 65+ Years | 25,252 (31.0%) | $49,954 |
| Total | 81,339 (100.0%) | $58,317 |
Poverty in Broome County
Income Below Poverty by Sex and Age in Broome County
With 18.0% poverty level for males and 20.1% for females among the residents of Broome County, 18 to 24 year old males and 18 to 24 year old females are the most vulnerable to poverty, with 4,316 males (36.1%) and 5,059 females (47.0%) in their respective age groups living below the poverty level.
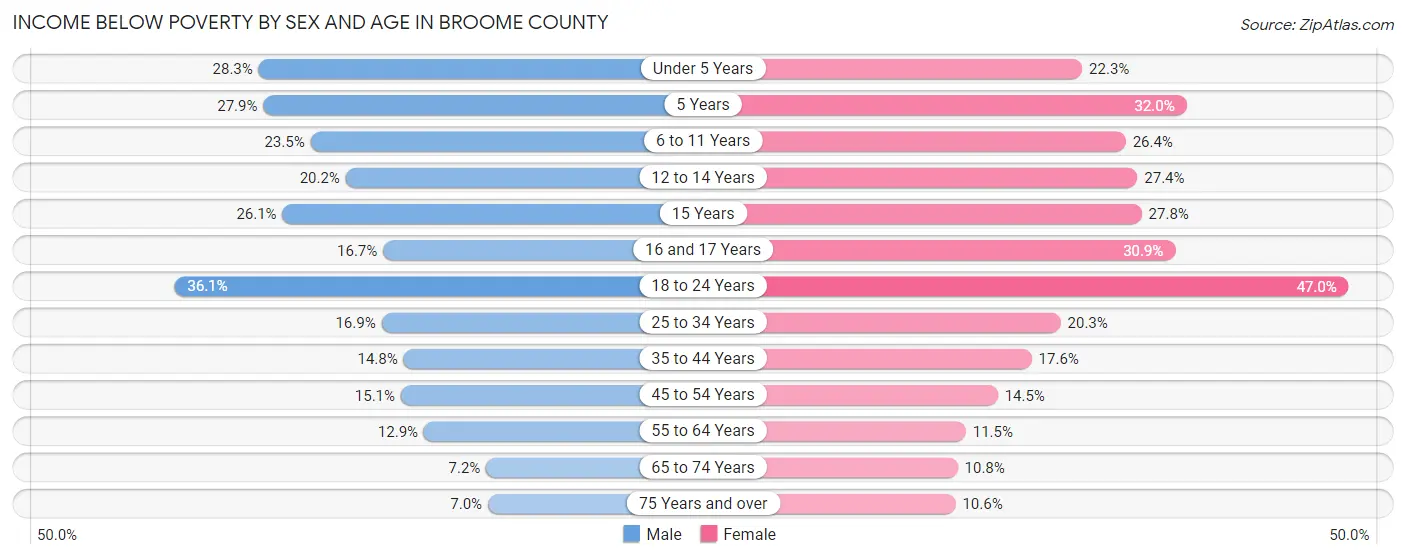
| Age Bracket | Male | Female |
| Under 5 Years | 1,351 (28.3%) | 1,063 (22.3%) |
| 5 Years | 347 (27.9%) | 261 (32.0%) |
| 6 to 11 Years | 1,529 (23.5%) | 1,392 (26.4%) |
| 12 to 14 Years | 632 (20.2%) | 1,079 (27.4%) |
| 15 Years | 310 (26.1%) | 221 (27.8%) |
| 16 and 17 Years | 386 (16.7%) | 719 (30.9%) |
| 18 to 24 Years | 4,316 (36.1%) | 5,059 (47.0%) |
| 25 to 34 Years | 1,875 (16.9%) | 2,187 (20.3%) |
| 35 to 44 Years | 1,554 (14.8%) | 1,830 (17.6%) |
| 45 to 54 Years | 1,579 (15.1%) | 1,539 (14.5%) |
| 55 to 64 Years | 1,759 (12.9%) | 1,587 (11.5%) |
| 65 to 74 Years | 720 (7.2%) | 1,156 (10.7%) |
| 75 Years and over | 453 (7.0%) | 1,087 (10.5%) |
| Total | 16,811 (18.0%) | 19,180 (20.1%) |
Income Above Poverty by Sex and Age in Broome County
According to the poverty statistics in Broome County, males aged 75 years and over and females aged 75 years and over are the age groups that are most secure financially, with 93.0% of males and 89.4% of females in these age groups living above the poverty line.
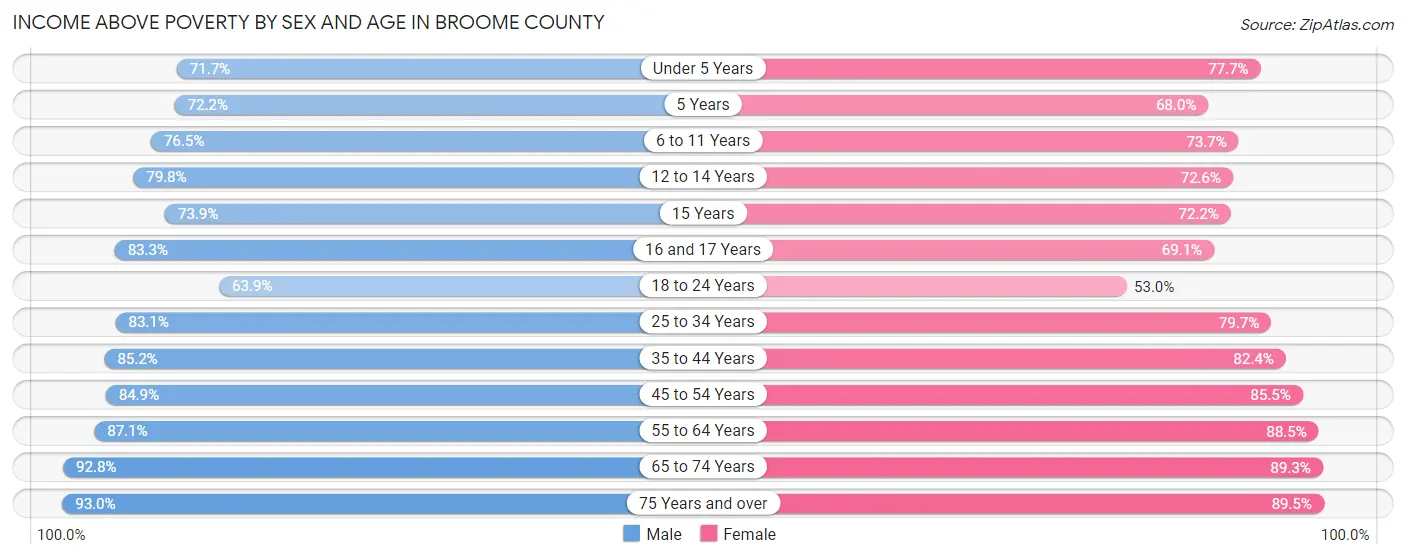
| Age Bracket | Male | Female |
| Under 5 Years | 3,426 (71.7%) | 3,701 (77.7%) |
| 5 Years | 899 (72.2%) | 555 (68.0%) |
| 6 to 11 Years | 4,986 (76.5%) | 3,891 (73.7%) |
| 12 to 14 Years | 2,497 (79.8%) | 2,854 (72.6%) |
| 15 Years | 879 (73.9%) | 573 (72.2%) |
| 16 and 17 Years | 1,921 (83.3%) | 1,605 (69.1%) |
| 18 to 24 Years | 7,641 (63.9%) | 5,695 (53.0%) |
| 25 to 34 Years | 9,230 (83.1%) | 8,581 (79.7%) |
| 35 to 44 Years | 8,928 (85.2%) | 8,555 (82.4%) |
| 45 to 54 Years | 8,895 (84.9%) | 9,096 (85.5%) |
| 55 to 64 Years | 11,838 (87.1%) | 12,206 (88.5%) |
| 65 to 74 Years | 9,342 (92.8%) | 9,599 (89.2%) |
| 75 Years and over | 6,022 (93.0%) | 9,214 (89.4%) |
| Total | 76,504 (82.0%) | 76,125 (79.9%) |
Income Below Poverty Among Married-Couple Families in Broome County
The poverty statistics for married-couple families in Broome County show that 5.7% or 1,888 of the total 33,340 families live below the poverty line. Families with 5 or more children have the highest poverty rate of 47.4%, comprising of 138 families. On the other hand, families with no children have the lowest poverty rate of 3.5%, which includes 753 families.
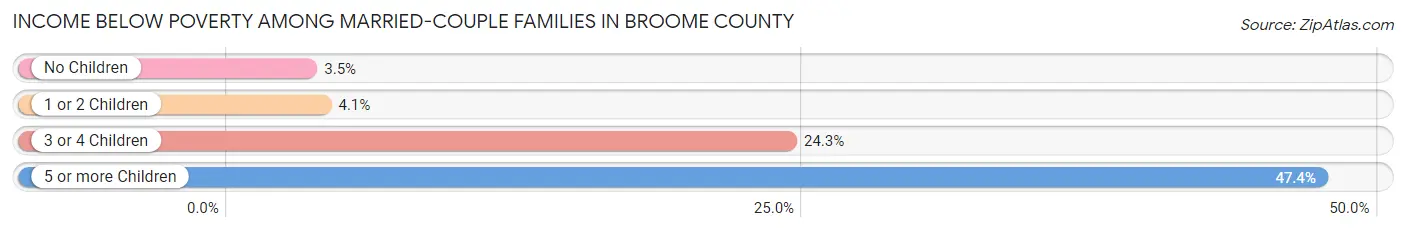
| Children | Above Poverty | Below Poverty |
| No Children | 21,065 (96.6%) | 753 (3.5%) |
| 1 or 2 Children | 8,219 (95.9%) | 349 (4.1%) |
| 3 or 4 Children | 2,015 (75.7%) | 648 (24.3%) |
| 5 or more Children | 153 (52.6%) | 138 (47.4%) |
| Total | 31,452 (94.3%) | 1,888 (5.7%) |
Income Below Poverty Among Single-Parent Households in Broome County
According to the poverty data in Broome County, 18.9% or 659 single-father households and 30.2% or 2,730 single-mother households are living below the poverty line. Among single-father households, those with 5 or more children have the highest poverty rate, with 54 households (100.0%) experiencing poverty. Likewise, among single-mother households, those with 3 or 4 children have the highest poverty rate, with 398 households (59.4%) falling below the poverty line.
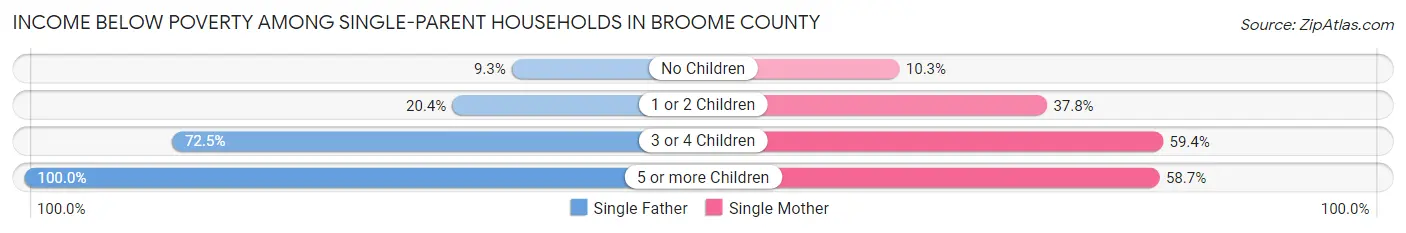
| Children | Single Father | Single Mother |
| No Children | 142 (9.3%) | 322 (10.3%) |
| 1 or 2 Children | 360 (20.4%) | 1,936 (37.8%) |
| 3 or 4 Children | 103 (72.5%) | 398 (59.4%) |
| 5 or more Children | 54 (100.0%) | 74 (58.7%) |
| Total | 659 (18.9%) | 2,730 (30.2%) |
Income Below Poverty Among Married-Couple vs Single-Parent Households in Broome County
The poverty data for Broome County shows that 1,888 of the married-couple family households (5.7%) and 3,389 of the single-parent households (27.0%) are living below the poverty level. Within the married-couple family households, those with 5 or more children have the highest poverty rate, with 138 households (47.4%) falling below the poverty line. Among the single-parent households, those with 5 or more children have the highest poverty rate, with 128 household (71.1%) living below poverty.
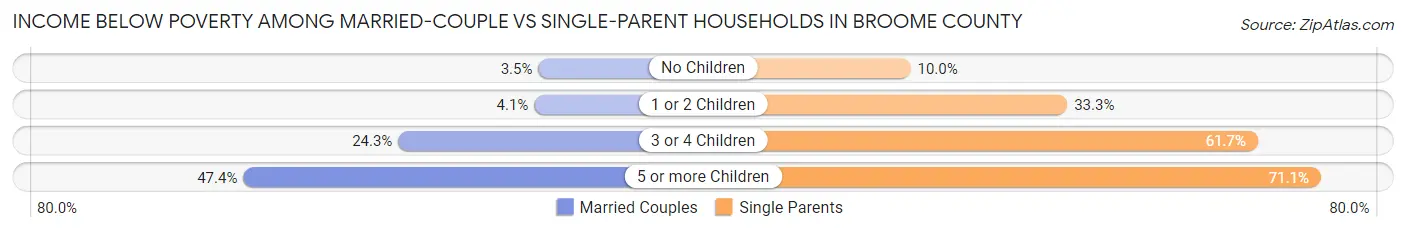
| Children | Married-Couple Families | Single-Parent Households |
| No Children | 753 (3.5%) | 464 (10.0%) |
| 1 or 2 Children | 349 (4.1%) | 2,296 (33.3%) |
| 3 or 4 Children | 648 (24.3%) | 501 (61.7%) |
| 5 or more Children | 138 (47.4%) | 128 (71.1%) |
| Total | 1,888 (5.7%) | 3,389 (27.0%) |
Race in Broome County
The most populous races in Broome County are White / Caucasian (163,872 | 82.6%), Black / African American (10,808 | 5.4%), and Two or more Races (9,899 | 5.0%).
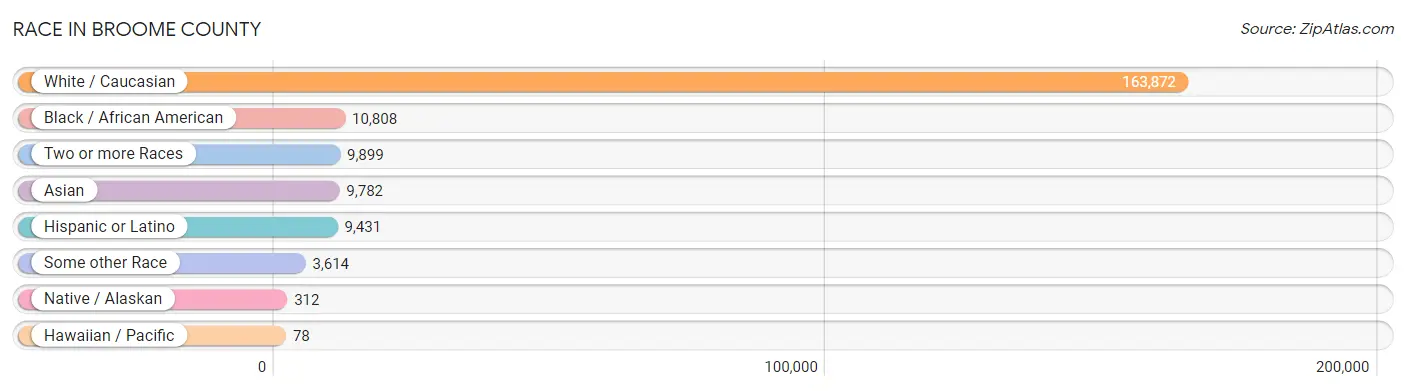
| Race | # Population | % Population |
| Asian | 9,782 | 4.9% |
| Black / African American | 10,808 | 5.4% |
| Hawaiian / Pacific | 78 | 0.0% |
| Hispanic or Latino | 9,431 | 4.8% |
| Native / Alaskan | 312 | 0.2% |
| White / Caucasian | 163,872 | 82.6% |
| Two or more Races | 9,899 | 5.0% |
| Some other Race | 3,614 | 1.8% |
| Total | 198,365 | 100.0% |
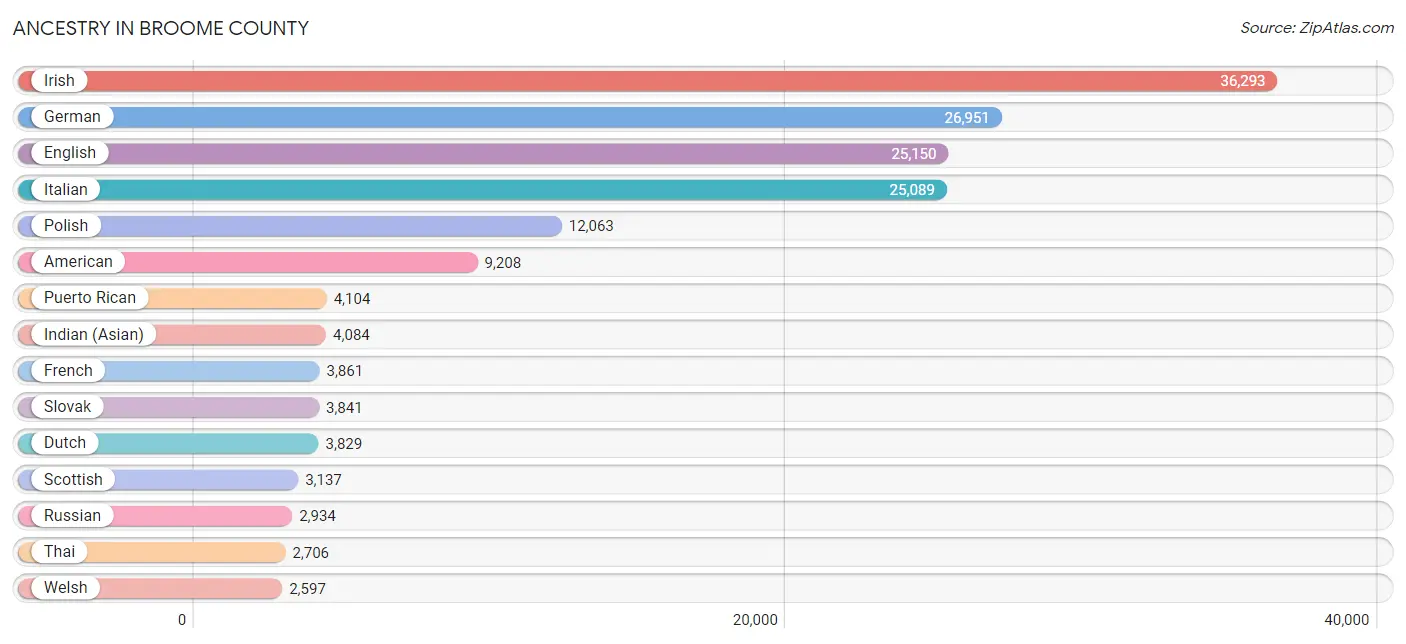
Ancestry in Broome County
The most populous ancestries reported in Broome County are Irish (36,293 | 18.3%), German (26,951 | 13.6%), English (25,150 | 12.7%), Italian (25,089 | 12.7%), and Polish (12,063 | 6.1%), together accounting for 63.3% of all Broome County residents.
| Ancestry | # Population | % Population |
| African | 389 | 0.2% |
| Albanian | 124 | 0.1% |
| American | 9,208 | 4.6% |
| Apache | 82 | 0.0% |
| Arab | 1,709 | 0.9% |
| Argentinean | 73 | 0.0% |
| Armenian | 286 | 0.1% |
| Australian | 1 | 0.0% |
| Austrian | 522 | 0.3% |
| Barbadian | 44 | 0.0% |
| Belgian | 68 | 0.0% |
| Belizean | 23 | 0.0% |
| Bhutanese | 361 | 0.2% |
| Blackfeet | 5 | 0.0% |
| Brazilian | 127 | 0.1% |
| British | 875 | 0.4% |
| British West Indian | 87 | 0.0% |
| Bulgarian | 15 | 0.0% |
| Burmese | 878 | 0.4% |
| Canadian | 518 | 0.3% |
| Carpatho Rusyn | 54 | 0.0% |
| Celtic | 16 | 0.0% |
| Central American | 520 | 0.3% |
| Central American Indian | 194 | 0.1% |
| Cherokee | 561 | 0.3% |
| Chilean | 91 | 0.1% |
| Chippewa | 42 | 0.0% |
| Choctaw | 6 | 0.0% |
| Colombian | 421 | 0.2% |
| Costa Rican | 26 | 0.0% |
| Croatian | 83 | 0.0% |
| Cuban | 132 | 0.1% |
| Cypriot | 31 | 0.0% |
| Czech | 1,045 | 0.5% |
| Czechoslovakian | 765 | 0.4% |
| Danish | 357 | 0.2% |
| Delaware | 17 | 0.0% |
| Dominican | 991 | 0.5% |
| Dutch | 3,829 | 1.9% |
| Eastern European | 999 | 0.5% |
| Ecuadorian | 573 | 0.3% |
| Egyptian | 39 | 0.0% |
| English | 25,150 | 12.7% |
| Estonian | 19 | 0.0% |
| European | 2,064 | 1.0% |
| Filipino | 61 | 0.0% |
| Finnish | 349 | 0.2% |
| French | 3,861 | 1.9% |
| French Canadian | 991 | 0.5% |
| German | 26,951 | 13.6% |
| German Russian | 4 | 0.0% |
| Ghanaian | 34 | 0.0% |
| Greek | 1,122 | 0.6% |
| Guamanian / Chamorro | 24 | 0.0% |
| Guatemalan | 119 | 0.1% |
| Guyanese | 169 | 0.1% |
| Haitian | 1,377 | 0.7% |
| Honduran | 207 | 0.1% |
| Hungarian | 1,091 | 0.5% |
| Icelander | 10 | 0.0% |
| Indian (Asian) | 4,084 | 2.1% |
| Indonesian | 53 | 0.0% |
| Iranian | 220 | 0.1% |
| Iraqi | 109 | 0.1% |
| Irish | 36,293 | 18.3% |
| Iroquois | 208 | 0.1% |
| Israeli | 141 | 0.1% |
| Italian | 25,089 | 12.7% |
| Jamaican | 912 | 0.5% |
| Jordanian | 95 | 0.1% |
| Kenyan | 107 | 0.1% |
| Kiowa | 1 | 0.0% |
| Korean | 608 | 0.3% |
| Laotian | 16 | 0.0% |
| Latvian | 68 | 0.0% |
| Lebanese | 417 | 0.2% |
| Lithuanian | 1,041 | 0.5% |
| Malaysian | 435 | 0.2% |
| Mexican | 1,350 | 0.7% |
| Mexican American Indian | 64 | 0.0% |
| Mongolian | 18 | 0.0% |
| Moroccan | 14 | 0.0% |
| Native Hawaiian | 53 | 0.0% |
| Navajo | 10 | 0.0% |
| Nicaraguan | 21 | 0.0% |
| Nigerian | 85 | 0.0% |
| Northern European | 224 | 0.1% |
| Norwegian | 815 | 0.4% |
| Paiute | 8 | 0.0% |
| Pakistani | 111 | 0.1% |
| Palestinian | 47 | 0.0% |
| Panamanian | 77 | 0.0% |
| Pennsylvania German | 511 | 0.3% |
| Peruvian | 201 | 0.1% |
| Polish | 12,063 | 6.1% |
| Portuguese | 373 | 0.2% |
| Puerto Rican | 4,104 | 2.1% |
| Romanian | 216 | 0.1% |
| Russian | 2,934 | 1.5% |
| Salvadoran | 46 | 0.0% |
| Samoan | 45 | 0.0% |
| Scandinavian | 435 | 0.2% |
| Scotch-Irish | 1,258 | 0.6% |
| Scottish | 3,137 | 1.6% |
| Serbian | 142 | 0.1% |
| Shoshone | 8 | 0.0% |
| Sioux | 3 | 0.0% |
| Slavic | 291 | 0.2% |
| Slovak | 3,841 | 1.9% |
| Slovene | 102 | 0.1% |
| Somali | 8 | 0.0% |
| South American | 1,402 | 0.7% |
| Spaniard | 112 | 0.1% |
| Spanish | 122 | 0.1% |
| Sri Lankan | 520 | 0.3% |
| Subsaharan African | 938 | 0.5% |
| Sudanese | 152 | 0.1% |
| Swedish | 1,327 | 0.7% |
| Swiss | 221 | 0.1% |
| Syrian | 177 | 0.1% |
| Thai | 2,706 | 1.4% |
| Trinidadian and Tobagonian | 141 | 0.1% |
| Turkish | 262 | 0.1% |
| U.S. Virgin Islander | 19 | 0.0% |
| Ukrainian | 1,469 | 0.7% |
| Venezuelan | 17 | 0.0% |
| Vietnamese | 163 | 0.1% |
| Welsh | 2,597 | 1.3% |
| West Indian | 54 | 0.0% |
| Yugoslavian | 569 | 0.3% |
| Zimbabwean | 11 | 0.0% | View All 131 Rows |
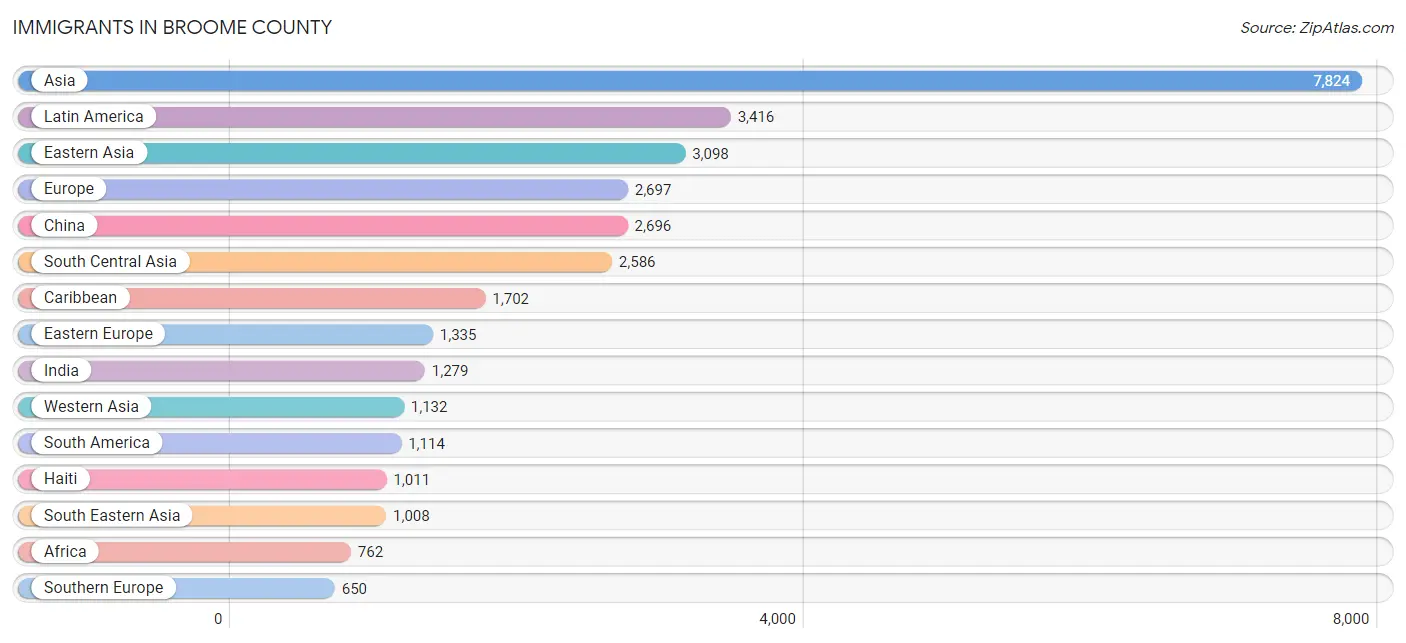
Immigrants in Broome County
The most numerous immigrant groups reported in Broome County came from Asia (7,824 | 3.9%), Latin America (3,416 | 1.7%), Eastern Asia (3,098 | 1.6%), Europe (2,697 | 1.4%), and China (2,696 | 1.4%), together accounting for 9.9% of all Broome County residents.
| Immigration Origin | # Population | % Population |
| Afghanistan | 28 | 0.0% |
| Africa | 762 | 0.4% |
| Albania | 7 | 0.0% |
| Argentina | 51 | 0.0% |
| Asia | 7,824 | 3.9% |
| Bangladesh | 364 | 0.2% |
| Barbados | 5 | 0.0% |
| Belarus | 29 | 0.0% |
| Bosnia and Herzegovina | 309 | 0.2% |
| Brazil | 83 | 0.0% |
| Bulgaria | 15 | 0.0% |
| Cambodia | 17 | 0.0% |
| Canada | 385 | 0.2% |
| Caribbean | 1,702 | 0.9% |
| Central America | 600 | 0.3% |
| Chile | 19 | 0.0% |
| China | 2,696 | 1.4% |
| Colombia | 203 | 0.1% |
| Costa Rica | 14 | 0.0% |
| Croatia | 13 | 0.0% |
| Cuba | 14 | 0.0% |
| Czechoslovakia | 56 | 0.0% |
| Denmark | 14 | 0.0% |
| Dominican Republic | 275 | 0.1% |
| Eastern Africa | 183 | 0.1% |
| Eastern Asia | 3,098 | 1.6% |
| Eastern Europe | 1,335 | 0.7% |
| Ecuador | 400 | 0.2% |
| Egypt | 46 | 0.0% |
| El Salvador | 35 | 0.0% |
| England | 195 | 0.1% |
| Europe | 2,697 | 1.4% |
| France | 24 | 0.0% |
| Germany | 214 | 0.1% |
| Ghana | 11 | 0.0% |
| Greece | 263 | 0.1% |
| Guatemala | 73 | 0.0% |
| Guyana | 254 | 0.1% |
| Haiti | 1,011 | 0.5% |
| Honduras | 104 | 0.1% |
| Hong Kong | 45 | 0.0% |
| Hungary | 5 | 0.0% |
| India | 1,279 | 0.6% |
| Indonesia | 13 | 0.0% |
| Iran | 130 | 0.1% |
| Iraq | 392 | 0.2% |
| Ireland | 102 | 0.1% |
| Israel | 109 | 0.1% |
| Italy | 372 | 0.2% |
| Jamaica | 342 | 0.2% |
| Japan | 65 | 0.0% |
| Jordan | 92 | 0.1% |
| Kazakhstan | 59 | 0.0% |
| Kenya | 106 | 0.1% |
| Korea | 337 | 0.2% |
| Kuwait | 2 | 0.0% |
| Laos | 162 | 0.1% |
| Latin America | 3,416 | 1.7% |
| Latvia | 16 | 0.0% |
| Lebanon | 95 | 0.1% |
| Malaysia | 46 | 0.0% |
| Mexico | 364 | 0.2% |
| Netherlands | 13 | 0.0% |
| Nigeria | 29 | 0.0% |
| Northern Africa | 341 | 0.2% |
| Northern Europe | 442 | 0.2% |
| Norway | 16 | 0.0% |
| Pakistan | 487 | 0.3% |
| Panama | 10 | 0.0% |
| Peru | 97 | 0.1% |
| Philippines | 175 | 0.1% |
| Poland | 28 | 0.0% |
| Portugal | 7 | 0.0% |
| Romania | 90 | 0.1% |
| Russia | 343 | 0.2% |
| Saudi Arabia | 37 | 0.0% |
| Scotland | 24 | 0.0% |
| Senegal | 8 | 0.0% |
| Serbia | 74 | 0.0% |
| Somalia | 8 | 0.0% |
| South Africa | 117 | 0.1% |
| South America | 1,114 | 0.6% |
| South Central Asia | 2,586 | 1.3% |
| South Eastern Asia | 1,008 | 0.5% |
| Southern Europe | 650 | 0.3% |
| Spain | 8 | 0.0% |
| Sri Lanka | 207 | 0.1% |
| Sudan | 107 | 0.1% |
| Sweden | 2 | 0.0% |
| Switzerland | 19 | 0.0% |
| Taiwan | 54 | 0.0% |
| Thailand | 89 | 0.0% |
| Trinidad and Tobago | 43 | 0.0% |
| Turkey | 273 | 0.1% |
| Ukraine | 232 | 0.1% |
| Uzbekistan | 32 | 0.0% |
| Venezuela | 7 | 0.0% |
| Vietnam | 446 | 0.2% |
| Western Africa | 110 | 0.1% |
| Western Asia | 1,132 | 0.6% |
| Western Europe | 270 | 0.1% |
| Yemen | 53 | 0.0% | View All 102 Rows |
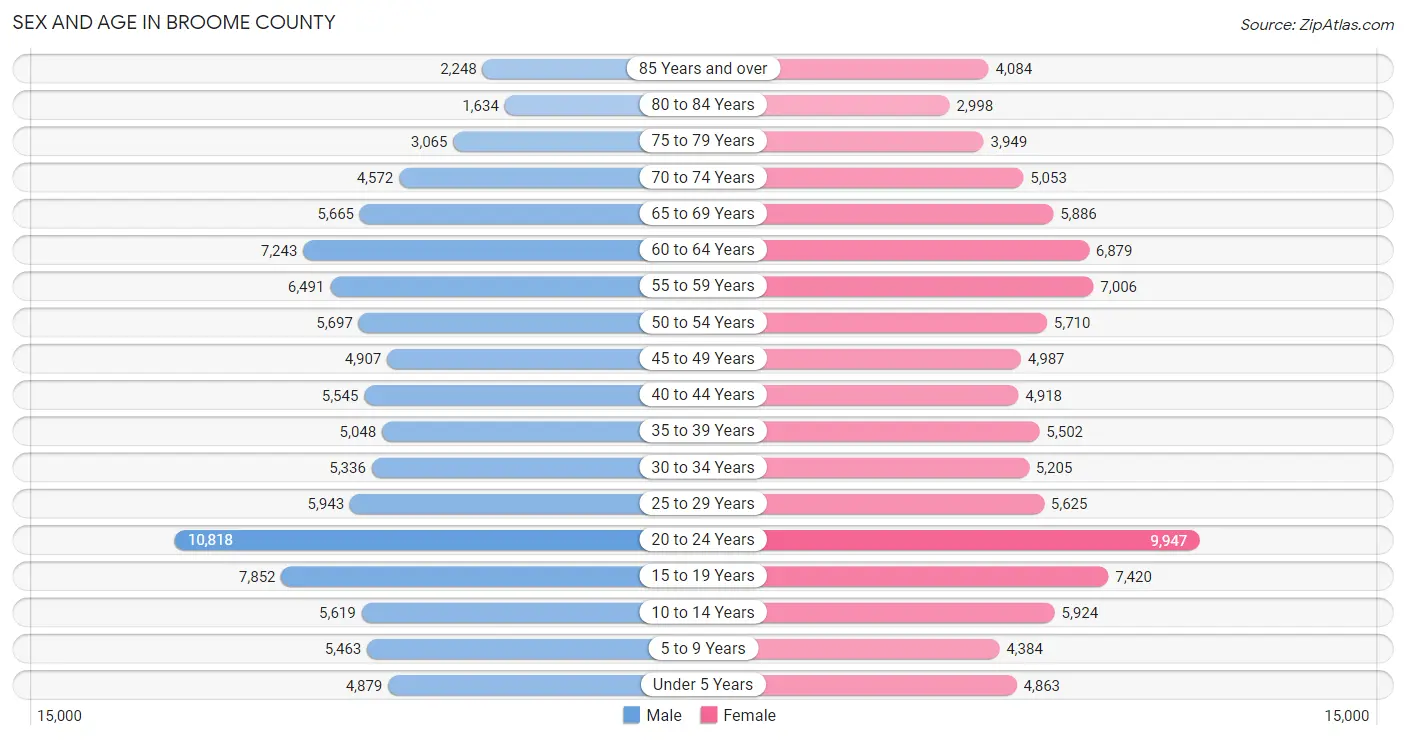
Sex and Age in Broome County
Sex and Age in Broome County
The most populous age groups in Broome County are 20 to 24 Years (10,818 | 11.0%) for men and 20 to 24 Years (9,947 | 9.9%) for women.
| Age Bracket | Male | Female |
| Under 5 Years | 4,879 (5.0%) | 4,863 (4.9%) |
| 5 to 9 Years | 5,463 (5.6%) | 4,384 (4.4%) |
| 10 to 14 Years | 5,619 (5.7%) | 5,924 (5.9%) |
| 15 to 19 Years | 7,852 (8.0%) | 7,420 (7.4%) |
| 20 to 24 Years | 10,818 (11.0%) | 9,947 (9.9%) |
| 25 to 29 Years | 5,943 (6.1%) | 5,625 (5.6%) |
| 30 to 34 Years | 5,336 (5.4%) | 5,205 (5.2%) |
| 35 to 39 Years | 5,048 (5.1%) | 5,502 (5.5%) |
| 40 to 44 Years | 5,545 (5.7%) | 4,918 (4.9%) |
| 45 to 49 Years | 4,907 (5.0%) | 4,987 (5.0%) |
| 50 to 54 Years | 5,697 (5.8%) | 5,710 (5.7%) |
| 55 to 59 Years | 6,491 (6.6%) | 7,006 (7.0%) |
| 60 to 64 Years | 7,243 (7.4%) | 6,879 (6.9%) |
| 65 to 69 Years | 5,665 (5.8%) | 5,886 (5.9%) |
| 70 to 74 Years | 4,572 (4.7%) | 5,053 (5.0%) |
| 75 to 79 Years | 3,065 (3.1%) | 3,949 (3.9%) |
| 80 to 84 Years | 1,634 (1.7%) | 2,998 (3.0%) |
| 85 Years and over | 2,248 (2.3%) | 4,084 (4.1%) |
| Total | 98,025 (100.0%) | 100,340 (100.0%) |
Families and Households in Broome County
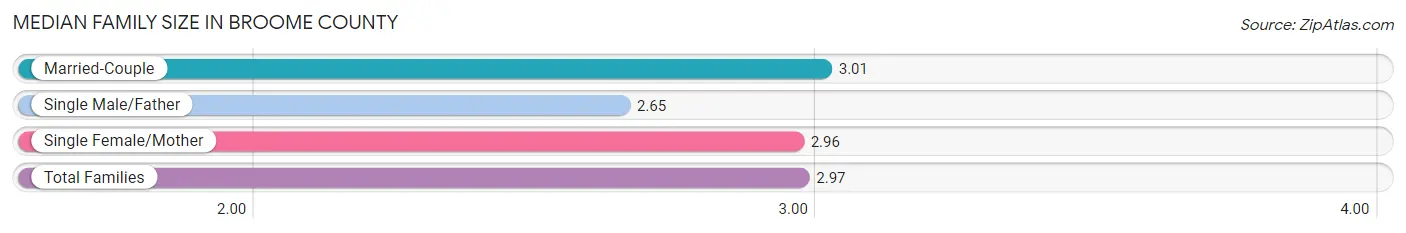
Median Family Size in Broome County
The median family size in Broome County is 2.97 persons per family, with married-couple families (33,340 | 72.7%) accounting for the largest median family size of 3.01 persons per family. On the other hand, single male/father families (3,490 | 7.6%) represent the smallest median family size with 2.65 persons per family.
| Family Type | # Families | Family Size |
| Married-Couple | 33,340 (72.7%) | 3.01 |
| Single Male/Father | 3,490 (7.6%) | 2.65 |
| Single Female/Mother | 9,053 (19.7%) | 2.96 |
| Total Families | 45,883 (100.0%) | 2.97 |
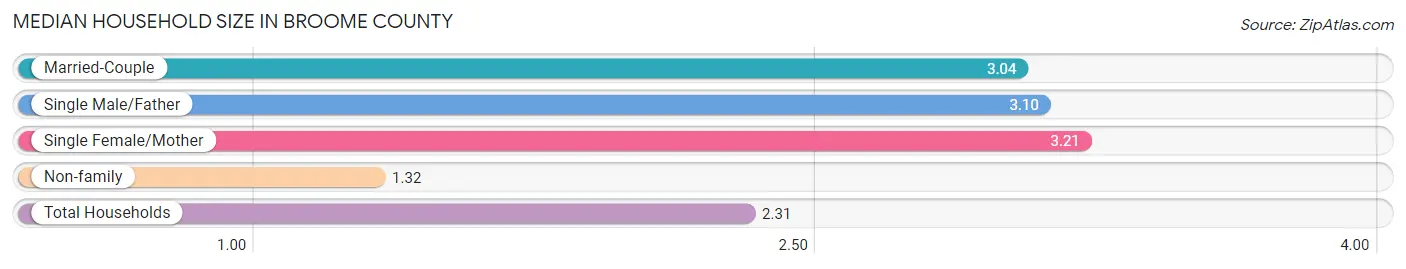
Median Household Size in Broome County
The median household size in Broome County is 2.31 persons per household, with single female/mother households (9,053 | 11.1%) accounting for the largest median household size of 3.21 persons per household. non-family households (35,456 | 43.6%) represent the smallest median household size with 1.32 persons per household.
| Household Type | # Households | Household Size |
| Married-Couple | 33,340 (41.0%) | 3.04 |
| Single Male/Father | 3,490 (4.3%) | 3.10 |
| Single Female/Mother | 9,053 (11.1%) | 3.21 |
| Non-family | 35,456 (43.6%) | 1.32 |
| Total Households | 81,339 (100.0%) | 2.31 |
Household Size by Marriage Status in Broome County
Out of a total of 81,339 households in Broome County, 45,883 (56.4%) are family households, while 35,456 (43.6%) are nonfamily households. The most numerous type of family households are 2-person households, comprising 22,182, and the most common type of nonfamily households are 1-person households, comprising 27,741.
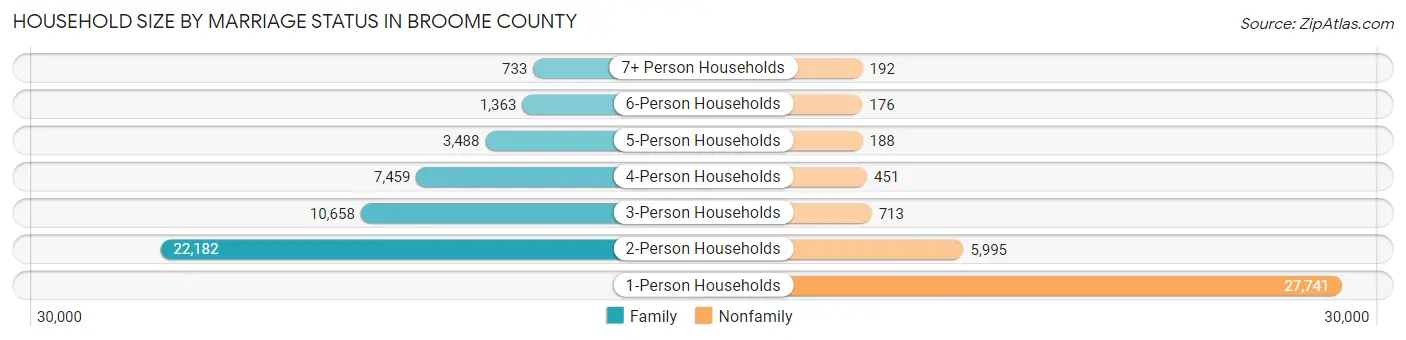
| Household Size | Family Households | Nonfamily Households |
| 1-Person Households | - | 27,741 (34.1%) |
| 2-Person Households | 22,182 (27.3%) | 5,995 (7.4%) |
| 3-Person Households | 10,658 (13.1%) | 713 (0.9%) |
| 4-Person Households | 7,459 (9.2%) | 451 (0.5%) |
| 5-Person Households | 3,488 (4.3%) | 188 (0.2%) |
| 6-Person Households | 1,363 (1.7%) | 176 (0.2%) |
| 7+ Person Households | 733 (0.9%) | 192 (0.2%) |
| Total | 45,883 (56.4%) | 35,456 (43.6%) |
Female Fertility in Broome County
Fertility by Age in Broome County
Average fertility rate in Broome County is 47.0 births per 1,000 women. Women in the age bracket of 20 to 34 years have the highest fertility rate with 71.0 births per 1,000 women. Women in the age bracket of 20 to 34 years acount for 69.7% of all women with births.
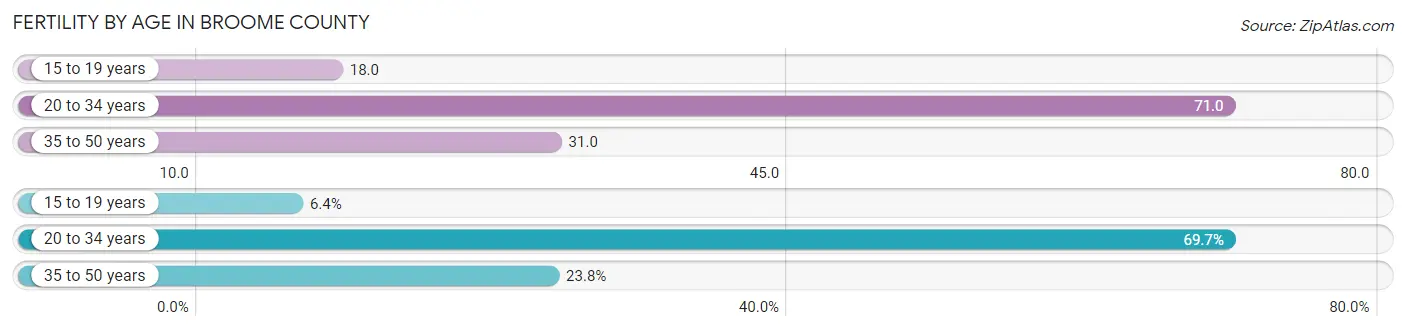
| Age Bracket | Women with Births | Births / 1,000 Women |
| 15 to 19 years | 136 (6.4%) | 18.0 |
| 20 to 34 years | 1,472 (69.7%) | 71.0 |
| 35 to 50 years | 503 (23.8%) | 31.0 |
| Total | 2,111 (100.0%) | 47.0 |
Fertility by Age by Marriage Status in Broome County
55.0% of women with births (2,111) in Broome County are married. The highest percentage of unmarried women with births falls into 15 to 19 years age bracket with 85.3% of them unmarried at the time of birth, while the lowest percentage of unmarried women with births belong to 35 to 50 years age bracket with 24.3% of them unmarried.
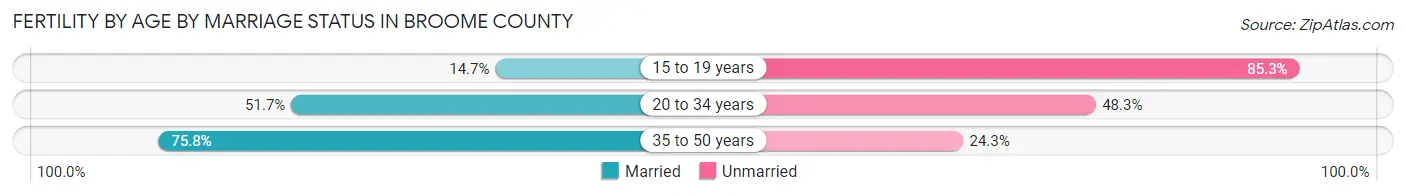
| Age Bracket | Married | Unmarried |
| 15 to 19 years | 20 (14.7%) | 116 (85.3%) |
| 20 to 34 years | 761 (51.7%) | 711 (48.3%) |
| 35 to 50 years | 381 (75.7%) | 122 (24.2%) |
| Total | 1,161 (55.0%) | 950 (45.0%) |
Fertility by Education in Broome County
Average fertility rate in Broome County is 47.0 births per 1,000 women. Women with the education attainment of graduate degree have the highest fertility rate of 60.0 births per 1,000 women, while women with the education attainment of bachelor's degree have the lowest fertility at 23.0 births per 1,000 women. Women with the education attainment of college or associate's degree represent 45.2% of all women with births.
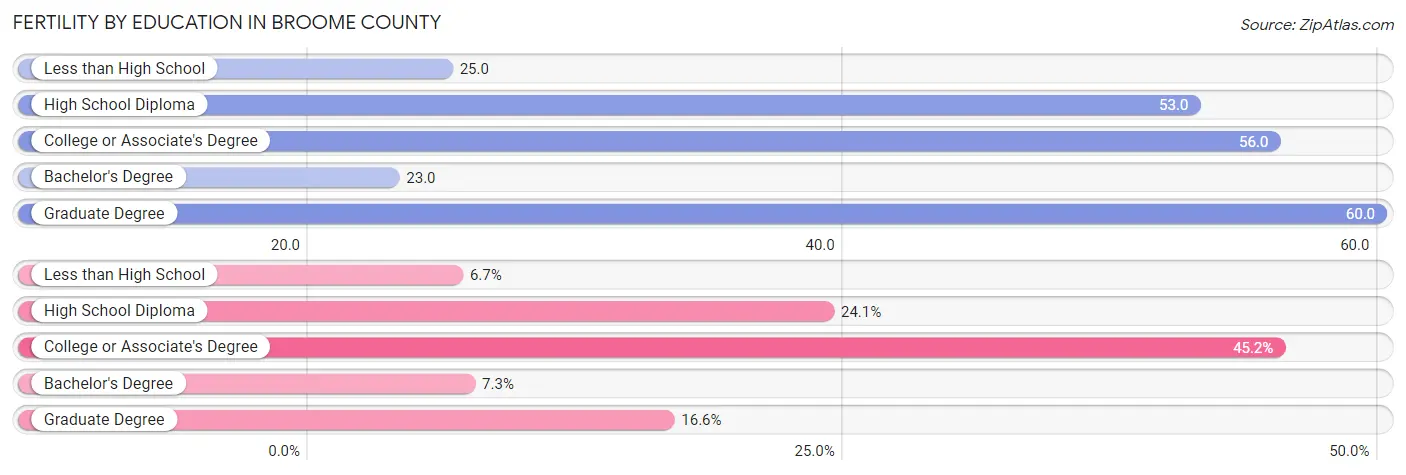
| Educational Attainment | Women with Births | Births / 1,000 Women |
| Less than High School | 142 (6.7%) | 25.0 |
| High School Diploma | 509 (24.1%) | 53.0 |
| College or Associate's Degree | 955 (45.2%) | 56.0 |
| Bachelor's Degree | 154 (7.3%) | 23.0 |
| Graduate Degree | 351 (16.6%) | 60.0 |
| Total | 2,111 (100.0%) | 47.0 |
Fertility by Education by Marriage Status in Broome County
45.0% of women with births in Broome County are unmarried. Women with the educational attainment of graduate degree are most likely to be married with 87.2% of them married at childbirth, while women with the educational attainment of college or associate's degree are least likely to be married with 62.1% of them unmarried at childbirth.
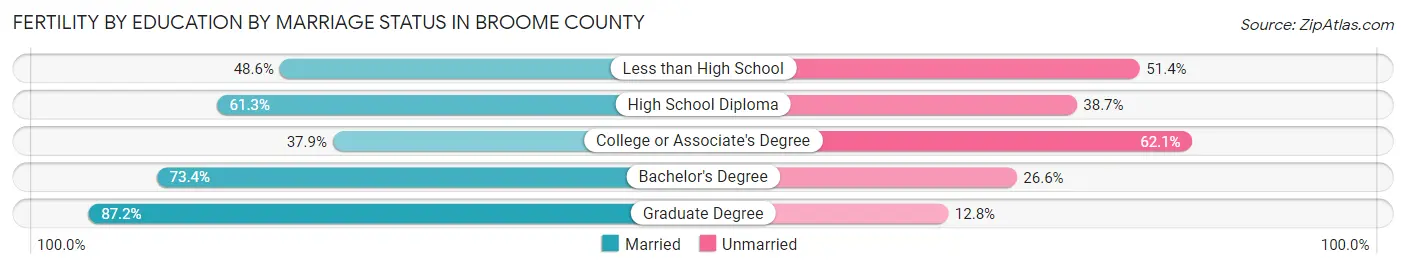
| Educational Attainment | Married | Unmarried |
| Less than High School | 69 (48.6%) | 73 (51.4%) |
| High School Diploma | 312 (61.3%) | 197 (38.7%) |
| College or Associate's Degree | 362 (37.9%) | 593 (62.1%) |
| Bachelor's Degree | 113 (73.4%) | 41 (26.6%) |
| Graduate Degree | 306 (87.2%) | 45 (12.8%) |
| Total | 1,161 (55.0%) | 950 (45.0%) |
Employment Characteristics in Broome County
Employment by Class of Employer in Broome County
Among the 84,789 employed individuals in Broome County, private company employees (49,279 | 58.1%), not-for-profit organizations (10,870 | 12.8%), and local government employees (9,017 | 10.6%) make up the most common classes of employment.
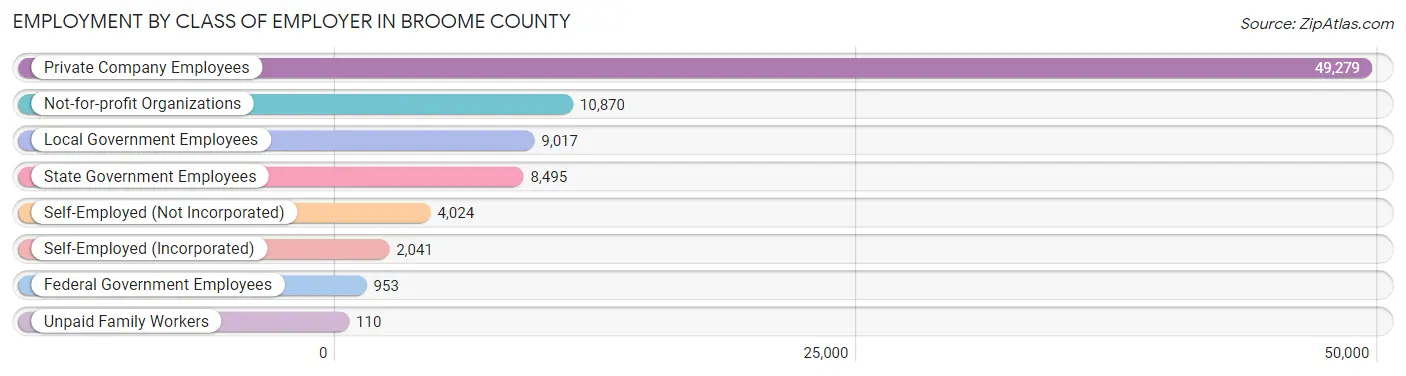
| Employer Class | # Employees | % Employees |
| Private Company Employees | 49,279 | 58.1% |
| Self-Employed (Incorporated) | 2,041 | 2.4% |
| Self-Employed (Not Incorporated) | 4,024 | 4.8% |
| Not-for-profit Organizations | 10,870 | 12.8% |
| Local Government Employees | 9,017 | 10.6% |
| State Government Employees | 8,495 | 10.0% |
| Federal Government Employees | 953 | 1.1% |
| Unpaid Family Workers | 110 | 0.1% |
| Total | 84,789 | 100.0% |
Employment Status by Age in Broome County
According to the labor force statistics for Broome County, out of the total population over 16 years of age (165,200), 56.8% or 93,834 individuals are in the labor force, with 6.9% or 6,475 of them unemployed. The age group with the highest labor force participation rate is 30 to 34 years, with 85.9% or 9,055 individuals in the labor force. Within the labor force, the 16 to 19 years age range has the highest percentage of unemployed individuals, with 25.9% or 1,159 of them being unemployed.
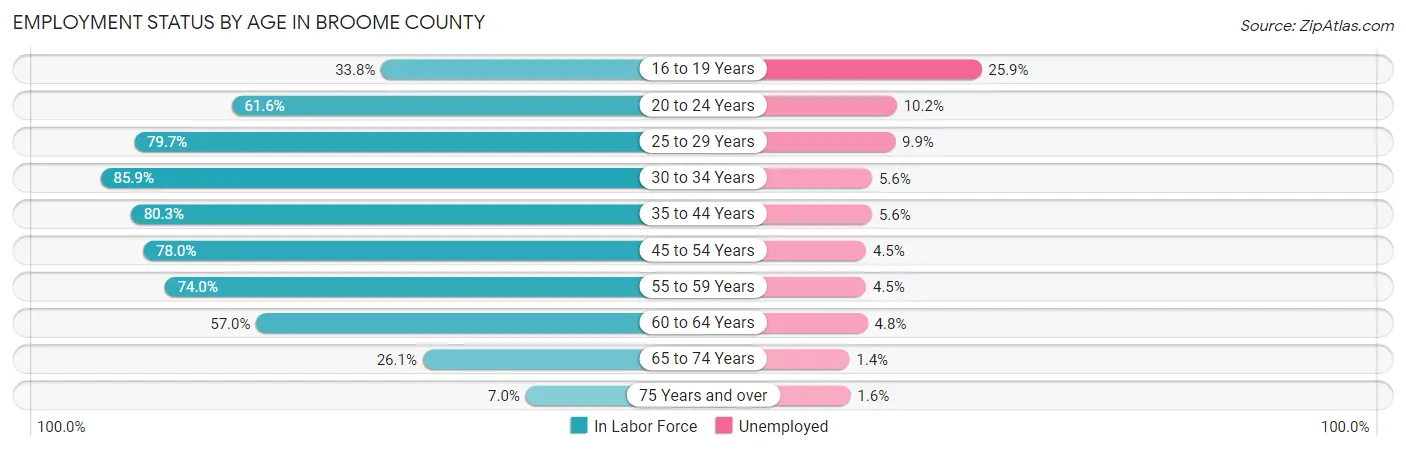
| Age Bracket | In Labor Force | Unemployed |
| 16 to 19 Years | 4,475 (33.8%) | 1,159 (25.9%) |
| 20 to 24 Years | 12,791 (61.6%) | 1,305 (10.2%) |
| 25 to 29 Years | 9,220 (79.7%) | 913 (9.9%) |
| 30 to 34 Years | 9,055 (85.9%) | 507 (5.6%) |
| 35 to 44 Years | 16,873 (80.3%) | 945 (5.6%) |
| 45 to 54 Years | 16,615 (78.0%) | 748 (4.5%) |
| 55 to 59 Years | 9,988 (74.0%) | 449 (4.5%) |
| 60 to 64 Years | 8,050 (57.0%) | 386 (4.8%) |
| 65 to 74 Years | 5,527 (26.1%) | 77 (1.4%) |
| 75 Years and over | 1,258 (7.0%) | 20 (1.6%) |
| Total | 93,834 (56.8%) | 6,475 (6.9%) |
Employment Status by Educational Attainment in Broome County
According to labor force statistics for Broome County, 75.9% of individuals (69,860) out of the total population between 25 and 64 years of age (92,042) are in the labor force, with 5.7% or 3,982 of them being unemployed. The group with the highest labor force participation rate are those with the educational attainment of bachelor's degree or higher, with 87.4% or 25,623 individuals in the labor force. Within the labor force, individuals with less than high school education have the highest percentage of unemployment, with 10.8% or 457 of them being unemployed.
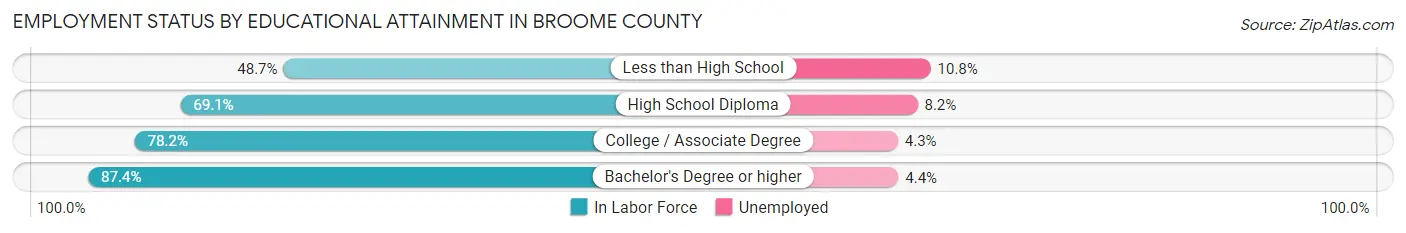
| Educational Attainment | In Labor Force | Unemployed |
| Less than High School | 4,230 (48.7%) | 938 (10.8%) |
| High School Diploma | 17,364 (69.1%) | 2,061 (8.2%) |
| College / Associate Degree | 22,608 (78.2%) | 1,243 (4.3%) |
| Bachelor's Degree or higher | 25,623 (87.4%) | 1,290 (4.4%) |
| Total | 69,860 (75.9%) | 5,246 (5.7%) |
Employment Occupations by Sex in Broome County
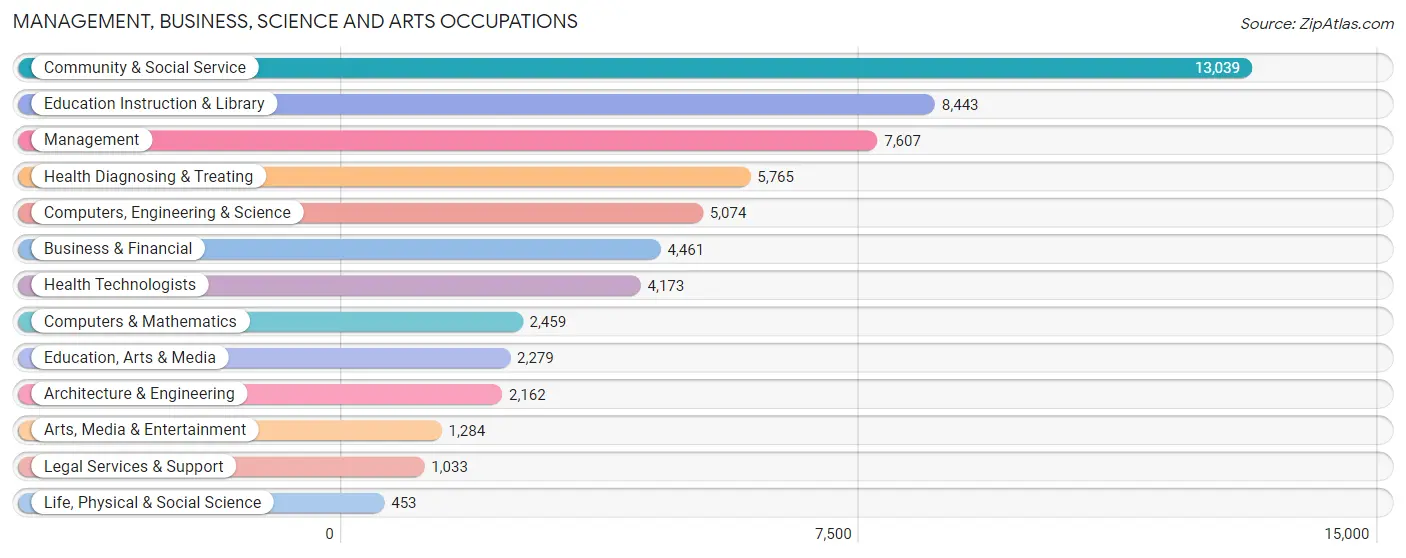
Management, Business, Science and Arts Occupations
The most common Management, Business, Science and Arts occupations in Broome County are Community & Social Service (13,039 | 14.9%), Education Instruction & Library (8,443 | 9.7%), Management (7,607 | 8.7%), Health Diagnosing & Treating (5,765 | 6.6%), and Computers, Engineering & Science (5,074 | 5.8%).
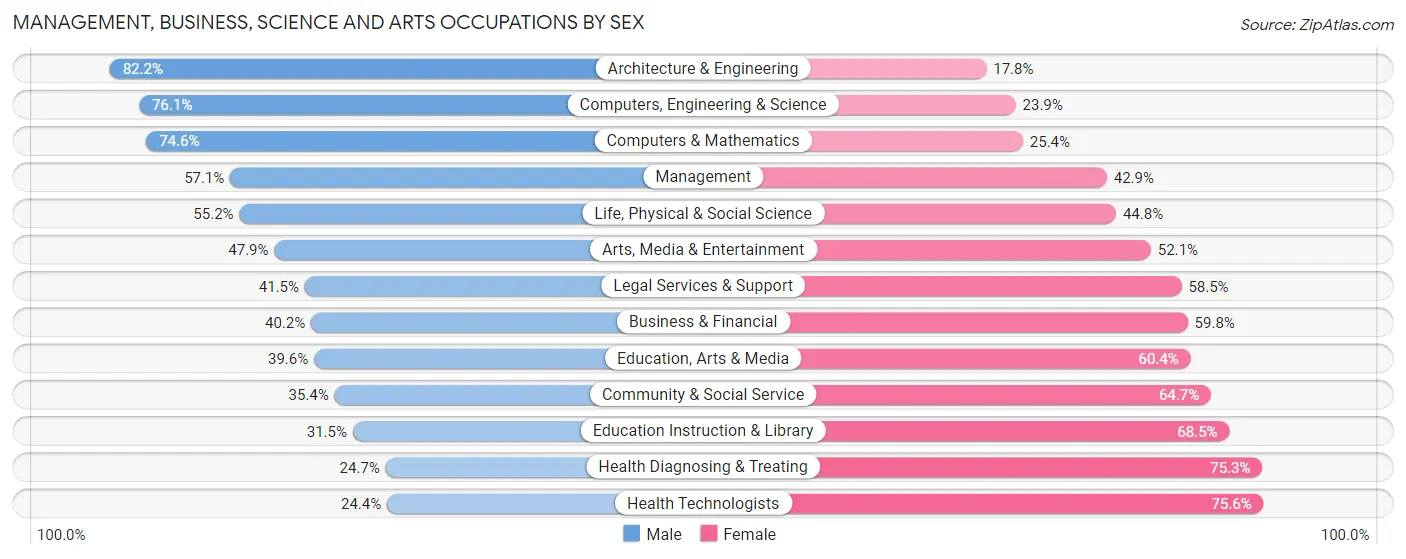
Management, Business, Science and Arts Occupations by Sex
Within the Management, Business, Science and Arts occupations in Broome County, the most male-oriented occupations are Architecture & Engineering (82.2%), Computers, Engineering & Science (76.1%), and Computers & Mathematics (74.6%), while the most female-oriented occupations are Health Technologists (75.6%), Health Diagnosing & Treating (75.3%), and Education Instruction & Library (68.5%).
| Occupation | Male | Female |
| Management | 4,344 (57.1%) | 3,263 (42.9%) |
| Business & Financial | 1,795 (40.2%) | 2,666 (59.8%) |
| Computers, Engineering & Science | 3,863 (76.1%) | 1,211 (23.9%) |
| Computers & Mathematics | 1,835 (74.6%) | 624 (25.4%) |
| Architecture & Engineering | 1,778 (82.2%) | 384 (17.8%) |
| Life, Physical & Social Science | 250 (55.2%) | 203 (44.8%) |
| Community & Social Service | 4,609 (35.3%) | 8,430 (64.6%) |
| Education, Arts & Media | 903 (39.6%) | 1,376 (60.4%) |
| Legal Services & Support | 429 (41.5%) | 604 (58.5%) |
| Education Instruction & Library | 2,662 (31.5%) | 5,781 (68.5%) |
| Arts, Media & Entertainment | 615 (47.9%) | 669 (52.1%) |
| Health Diagnosing & Treating | 1,423 (24.7%) | 4,342 (75.3%) |
| Health Technologists | 1,018 (24.4%) | 3,155 (75.6%) |
| Total (Category) | 16,034 (44.6%) | 19,912 (55.4%) |
| Total (Overall) | 44,904 (51.4%) | 42,398 (48.6%) |
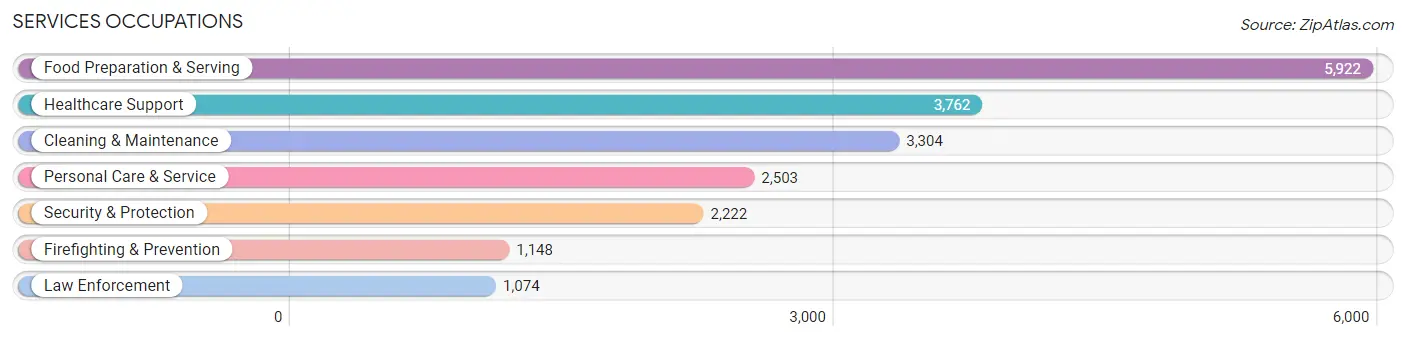
Services Occupations
The most common Services occupations in Broome County are Food Preparation & Serving (5,922 | 6.8%), Healthcare Support (3,762 | 4.3%), Cleaning & Maintenance (3,304 | 3.8%), Personal Care & Service (2,503 | 2.9%), and Security & Protection (2,222 | 2.5%).
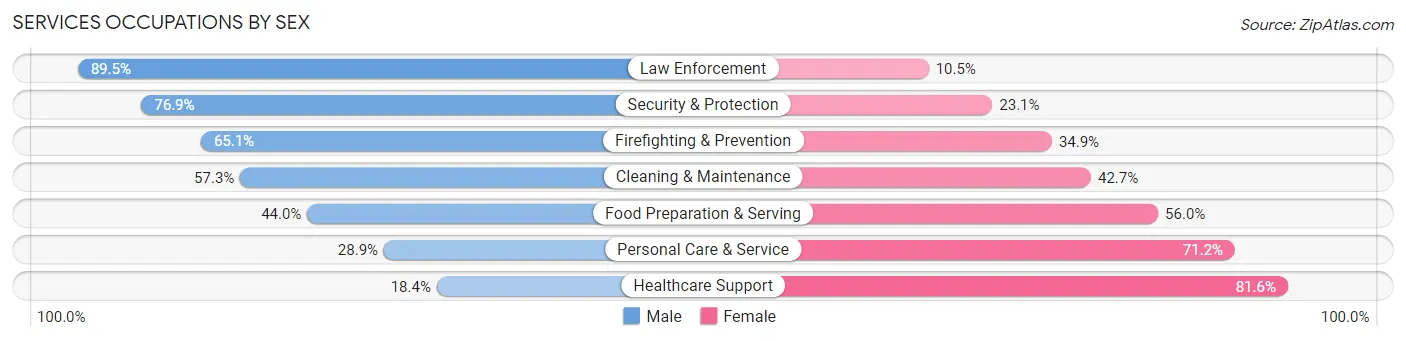
Services Occupations by Sex
Within the Services occupations in Broome County, the most male-oriented occupations are Law Enforcement (89.5%), Security & Protection (76.9%), and Firefighting & Prevention (65.1%), while the most female-oriented occupations are Healthcare Support (81.6%), Personal Care & Service (71.2%), and Food Preparation & Serving (56.0%).
| Occupation | Male | Female |
| Healthcare Support | 692 (18.4%) | 3,070 (81.6%) |
| Security & Protection | 1,708 (76.9%) | 514 (23.1%) |
| Firefighting & Prevention | 747 (65.1%) | 401 (34.9%) |
| Law Enforcement | 961 (89.5%) | 113 (10.5%) |
| Food Preparation & Serving | 2,608 (44.0%) | 3,314 (56.0%) |
| Cleaning & Maintenance | 1,894 (57.3%) | 1,410 (42.7%) |
| Personal Care & Service | 722 (28.8%) | 1,781 (71.2%) |
| Total (Category) | 7,624 (43.0%) | 10,089 (57.0%) |
| Total (Overall) | 44,904 (51.4%) | 42,398 (48.6%) |
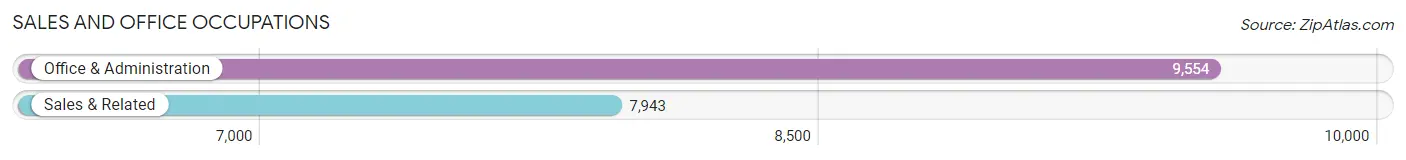
Sales and Office Occupations
The most common Sales and Office occupations in Broome County are Office & Administration (9,554 | 10.9%), and Sales & Related (7,943 | 9.1%).
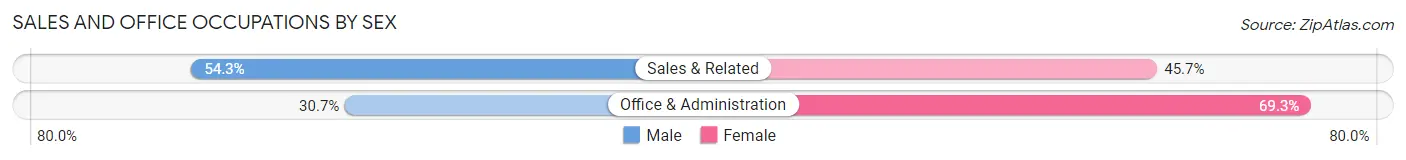
Sales and Office Occupations by Sex
| Occupation | Male | Female |
| Sales & Related | 4,316 (54.3%) | 3,627 (45.7%) |
| Office & Administration | 2,931 (30.7%) | 6,623 (69.3%) |
| Total (Category) | 7,247 (41.4%) | 10,250 (58.6%) |
| Total (Overall) | 44,904 (51.4%) | 42,398 (48.6%) |
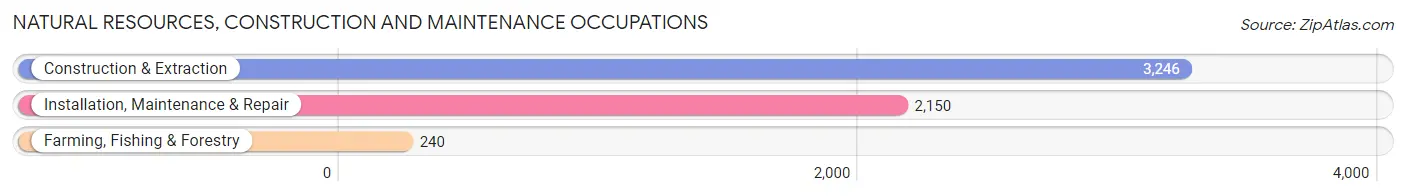
Natural Resources, Construction and Maintenance Occupations
The most common Natural Resources, Construction and Maintenance occupations in Broome County are Construction & Extraction (3,246 | 3.7%), Installation, Maintenance & Repair (2,150 | 2.5%), and Farming, Fishing & Forestry (240 | 0.3%).
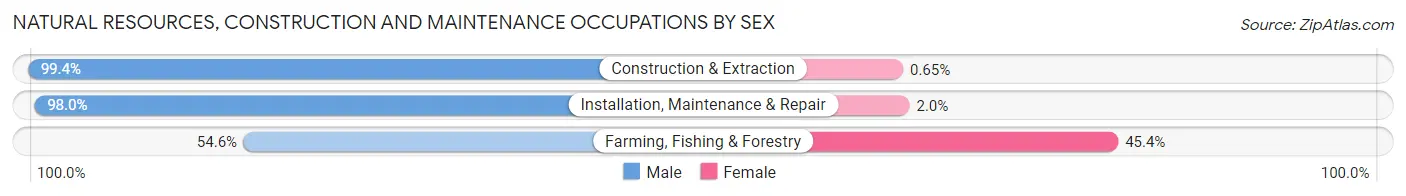
Natural Resources, Construction and Maintenance Occupations by Sex
| Occupation | Male | Female |
| Farming, Fishing & Forestry | 131 (54.6%) | 109 (45.4%) |
| Construction & Extraction | 3,225 (99.4%) | 21 (0.6%) |
| Installation, Maintenance & Repair | 2,107 (98.0%) | 43 (2.0%) |
| Total (Category) | 5,463 (96.9%) | 173 (3.1%) |
| Total (Overall) | 44,904 (51.4%) | 42,398 (48.6%) |
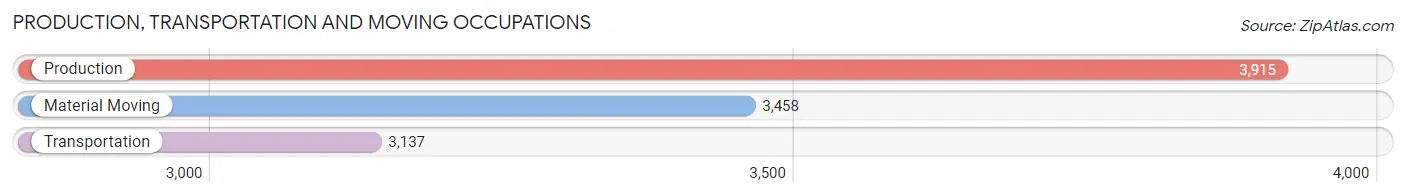
Production, Transportation and Moving Occupations
The most common Production, Transportation and Moving occupations in Broome County are Production (3,915 | 4.5%), Material Moving (3,458 | 4.0%), and Transportation (3,137 | 3.6%).
Production, Transportation and Moving Occupations by Sex
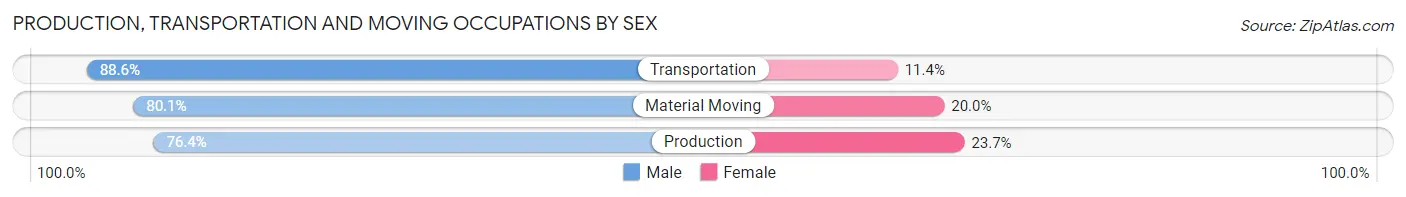
| Occupation | Male | Female |
| Production | 2,989 (76.3%) | 926 (23.6%) |
| Transportation | 2,779 (88.6%) | 358 (11.4%) |
| Material Moving | 2,768 (80.0%) | 690 (20.0%) |
| Total (Category) | 8,536 (81.2%) | 1,974 (18.8%) |
| Total (Overall) | 44,904 (51.4%) | 42,398 (48.6%) |
Employment Industries by Sex in Broome County
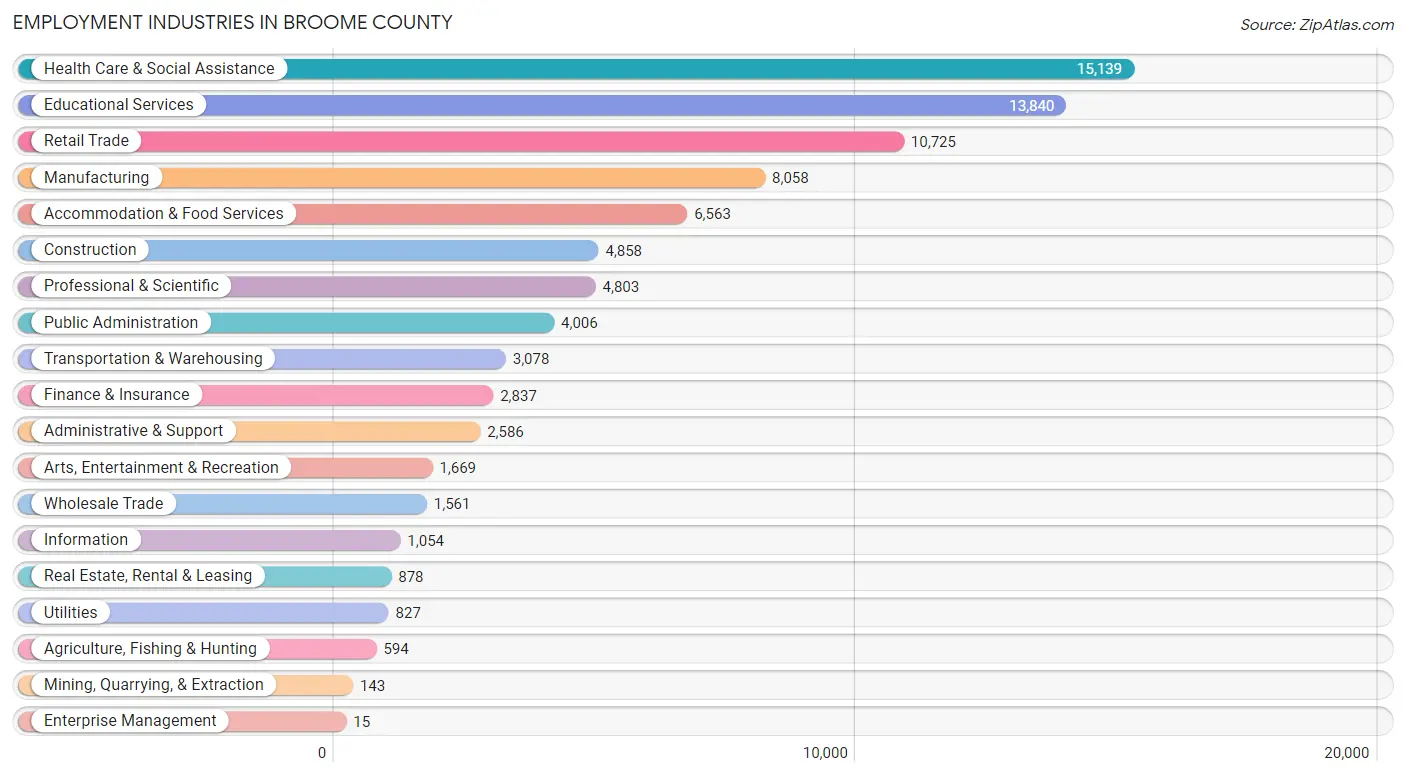
Employment Industries in Broome County
The major employment industries in Broome County include Health Care & Social Assistance (15,139 | 17.3%), Educational Services (13,840 | 15.9%), Retail Trade (10,725 | 12.3%), Manufacturing (8,058 | 9.2%), and Accommodation & Food Services (6,563 | 7.5%).
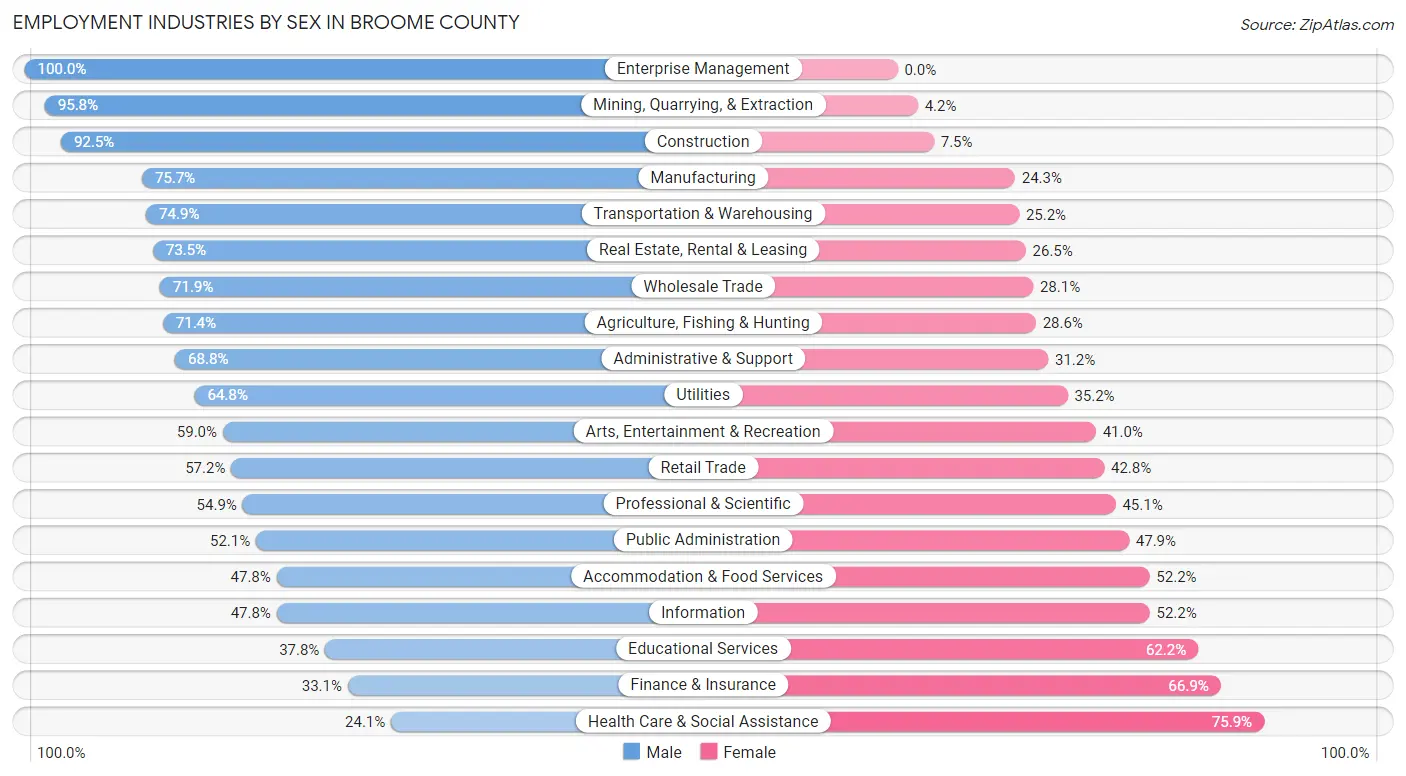
Employment Industries by Sex in Broome County
The Broome County industries that see more men than women are Enterprise Management (100.0%), Mining, Quarrying, & Extraction (95.8%), and Construction (92.5%), whereas the industries that tend to have a higher number of women are Health Care & Social Assistance (75.9%), Finance & Insurance (66.9%), and Educational Services (62.2%).
| Industry | Male | Female |
| Agriculture, Fishing & Hunting | 424 (71.4%) | 170 (28.6%) |
| Mining, Quarrying, & Extraction | 137 (95.8%) | 6 (4.2%) |
| Construction | 4,492 (92.5%) | 366 (7.5%) |
| Manufacturing | 6,100 (75.7%) | 1,958 (24.3%) |
| Wholesale Trade | 1,123 (71.9%) | 438 (28.1%) |
| Retail Trade | 6,138 (57.2%) | 4,587 (42.8%) |
| Transportation & Warehousing | 2,304 (74.9%) | 774 (25.2%) |
| Utilities | 536 (64.8%) | 291 (35.2%) |
| Information | 504 (47.8%) | 550 (52.2%) |
| Finance & Insurance | 939 (33.1%) | 1,898 (66.9%) |
| Real Estate, Rental & Leasing | 645 (73.5%) | 233 (26.5%) |
| Professional & Scientific | 2,635 (54.9%) | 2,168 (45.1%) |
| Enterprise Management | 15 (100.0%) | 0 (0.0%) |
| Administrative & Support | 1,780 (68.8%) | 806 (31.2%) |
| Educational Services | 5,229 (37.8%) | 8,611 (62.2%) |
| Health Care & Social Assistance | 3,654 (24.1%) | 11,485 (75.9%) |
| Arts, Entertainment & Recreation | 984 (59.0%) | 685 (41.0%) |
| Accommodation & Food Services | 3,140 (47.8%) | 3,423 (52.2%) |
| Public Administration | 2,087 (52.1%) | 1,919 (47.9%) |
| Total | 44,904 (51.4%) | 42,398 (48.6%) |
Education in Broome County
School Enrollment in Broome County
The most common levels of schooling among the 53,359 students in Broome County are college / undergraduate (19,184 | 35.9%), middle school (9,375 | 17.6%), and high school (8,897 | 16.7%).
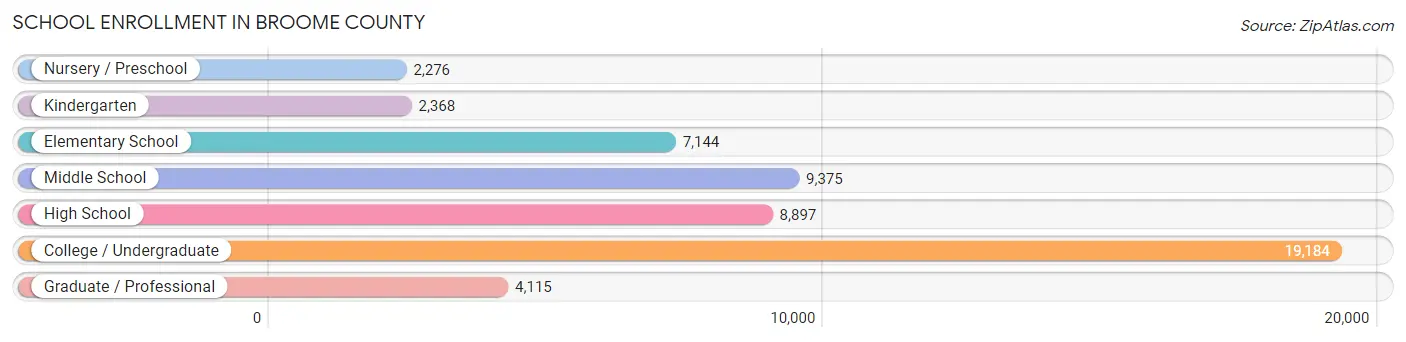
| School Level | # Students | % Students |
| Nursery / Preschool | 2,276 | 4.3% |
| Kindergarten | 2,368 | 4.4% |
| Elementary School | 7,144 | 13.4% |
| Middle School | 9,375 | 17.6% |
| High School | 8,897 | 16.7% |
| College / Undergraduate | 19,184 | 35.9% |
| Graduate / Professional | 4,115 | 7.7% |
| Total | 53,359 | 100.0% |
School Enrollment by Age by Funding Source in Broome County
Out of a total of 53,359 students who are enrolled in schools in Broome County, 5,816 (10.9%) attend a private institution, while the remaining 47,543 (89.1%) are enrolled in public schools. The age group of 3 to 4 year olds has the highest likelihood of being enrolled in private schools, with 762 (39.0% in the age bracket) enrolled. Conversely, the age group of 18 to 19 year olds has the lowest likelihood of being enrolled in a private school, with 7,156 (94.9% in the age bracket) attending a public institution.
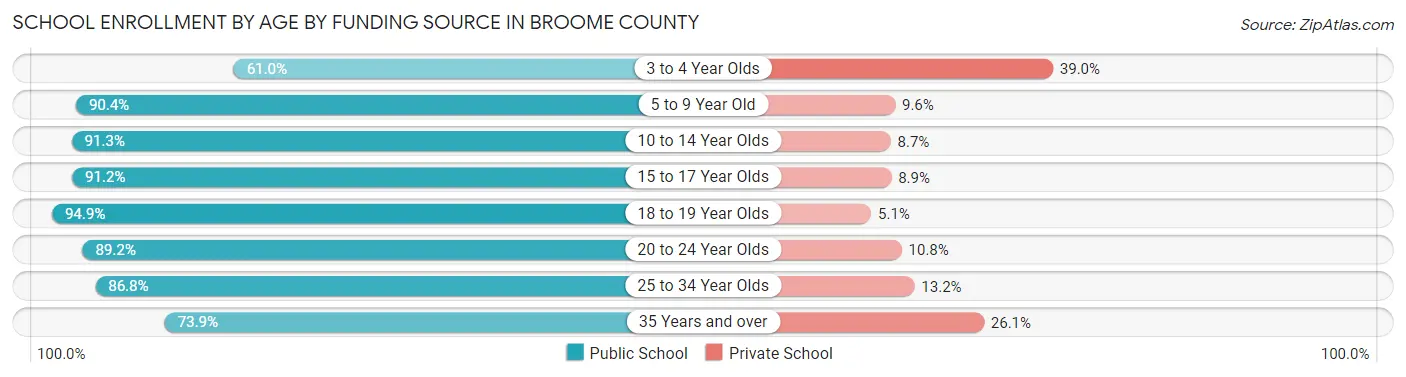
| Age Bracket | Public School | Private School |
| 3 to 4 Year Olds | 1,194 (61.0%) | 762 (39.0%) |
| 5 to 9 Year Old | 8,307 (90.4%) | 879 (9.6%) |
| 10 to 14 Year Olds | 10,367 (91.3%) | 993 (8.7%) |
| 15 to 17 Year Olds | 5,966 (91.1%) | 579 (8.8%) |
| 18 to 19 Year Olds | 7,156 (94.9%) | 385 (5.1%) |
| 20 to 24 Year Olds | 10,529 (89.2%) | 1,273 (10.8%) |
| 25 to 34 Year Olds | 2,352 (86.8%) | 357 (13.2%) |
| 35 Years and over | 1,670 (73.9%) | 590 (26.1%) |
| Total | 47,543 (89.1%) | 5,816 (10.9%) |
Educational Attainment by Field of Study in Broome County
Education (5,969 | 14.1%), business (5,494 | 13.0%), science & technology (4,069 | 9.6%), engineering (3,836 | 9.1%), and social sciences (3,471 | 8.2%) are the most common fields of study among 42,357 individuals in Broome County who have obtained a bachelor's degree or higher.
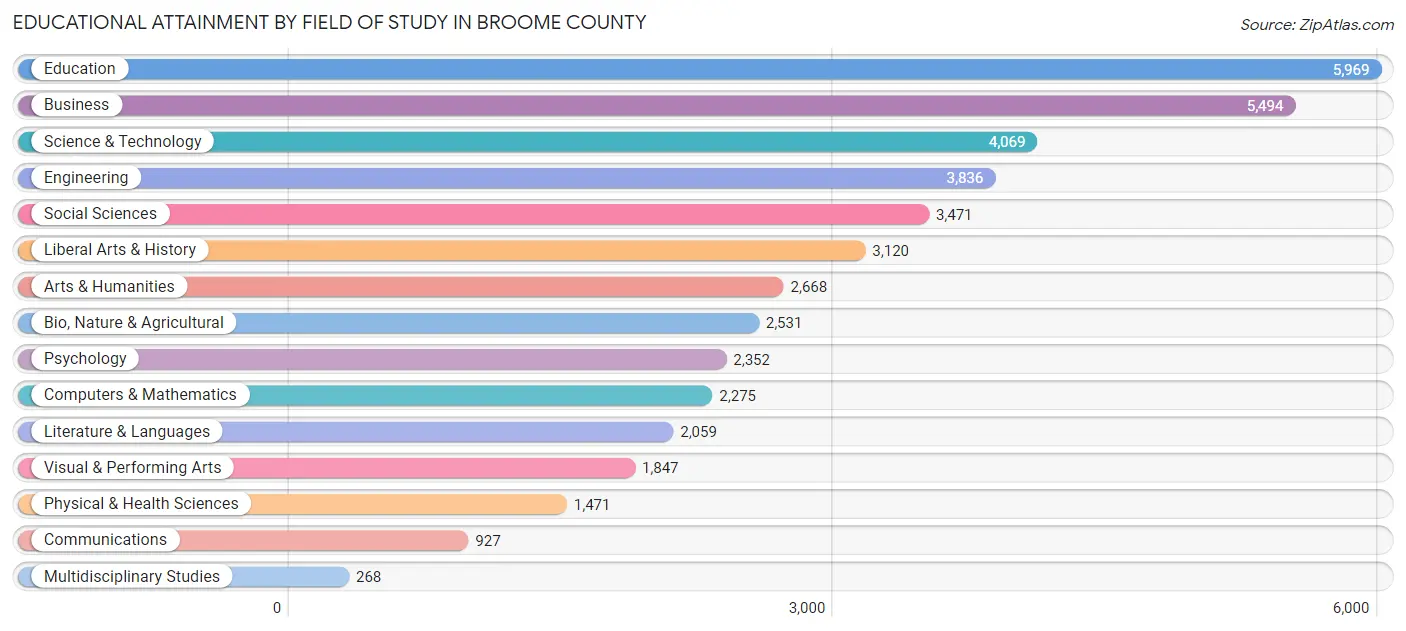
| Field of Study | # Graduates | % Graduates |
| Computers & Mathematics | 2,275 | 5.4% |
| Bio, Nature & Agricultural | 2,531 | 6.0% |
| Physical & Health Sciences | 1,471 | 3.5% |
| Psychology | 2,352 | 5.6% |
| Social Sciences | 3,471 | 8.2% |
| Engineering | 3,836 | 9.1% |
| Multidisciplinary Studies | 268 | 0.6% |
| Science & Technology | 4,069 | 9.6% |
| Business | 5,494 | 13.0% |
| Education | 5,969 | 14.1% |
| Literature & Languages | 2,059 | 4.9% |
| Liberal Arts & History | 3,120 | 7.4% |
| Visual & Performing Arts | 1,847 | 4.4% |
| Communications | 927 | 2.2% |
| Arts & Humanities | 2,668 | 6.3% |
| Total | 42,357 | 100.0% |
Transportation & Commute in Broome County
Vehicle Availability by Sex in Broome County
The most prevalent vehicle ownership categories in Broome County are males with 2 vehicles (17,972, accounting for 41.5%) and females with 2 vehicles (16,602, making up 44.7%).
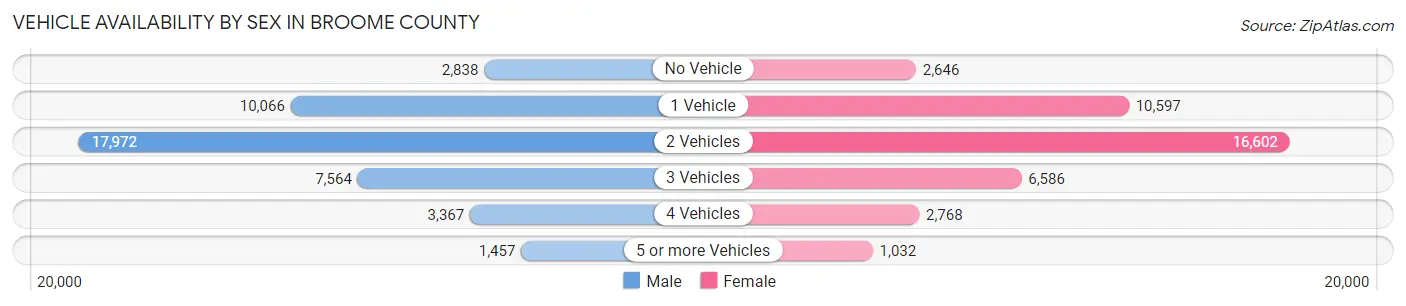
| Vehicles Available | Male | Female |
| No Vehicle | 2,838 (6.6%) | 2,646 (6.6%) |
| 1 Vehicle | 10,066 (23.3%) | 10,597 (26.3%) |
| 2 Vehicles | 17,972 (41.5%) | 16,602 (41.3%) |
| 3 Vehicles | 7,564 (17.5%) | 6,586 (16.4%) |
| 4 Vehicles | 3,367 (7.8%) | 2,768 (6.9%) |
| 5 or more Vehicles | 1,457 (3.4%) | 1,032 (2.6%) |
| Total | 43,264 (100.0%) | 40,231 (100.0%) |
Commute Time in Broome County
The most frequently occuring commute durations in Broome County are 15 to 19 minutes (17,113 commuters, 21.7%), 10 to 14 minutes (17,013 commuters, 21.6%), and 20 to 24 minutes (12,911 commuters, 16.4%).
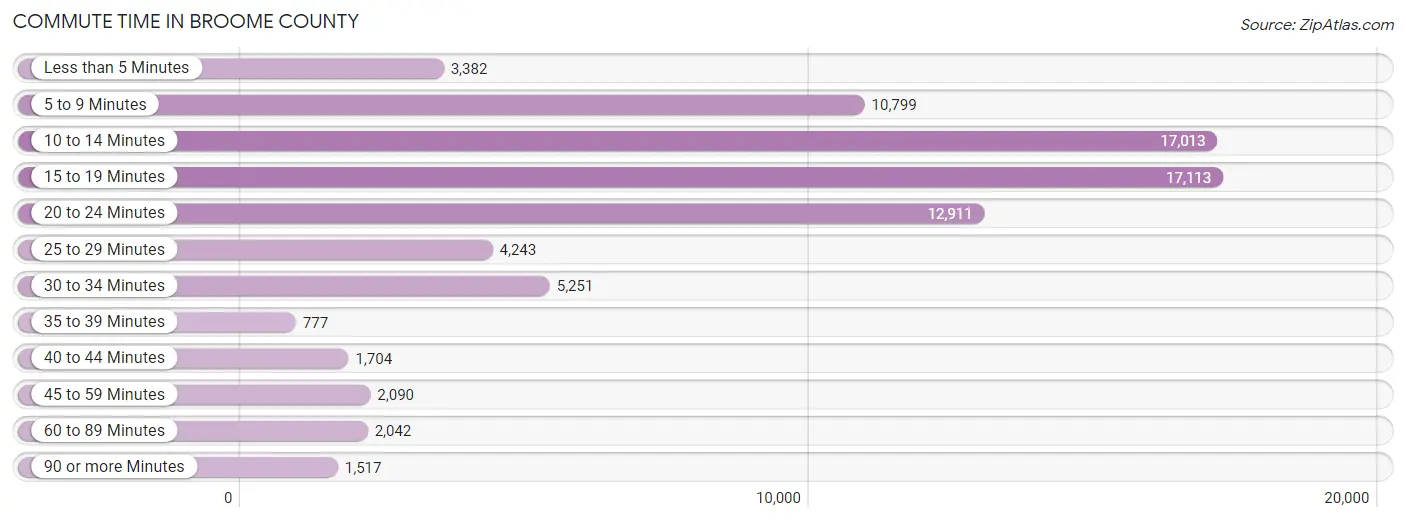
| Commute Time | # Commuters | % Commuters |
| Less than 5 Minutes | 3,382 | 4.3% |
| 5 to 9 Minutes | 10,799 | 13.7% |
| 10 to 14 Minutes | 17,013 | 21.6% |
| 15 to 19 Minutes | 17,113 | 21.7% |
| 20 to 24 Minutes | 12,911 | 16.4% |
| 25 to 29 Minutes | 4,243 | 5.4% |
| 30 to 34 Minutes | 5,251 | 6.7% |
| 35 to 39 Minutes | 777 | 1.0% |
| 40 to 44 Minutes | 1,704 | 2.2% |
| 45 to 59 Minutes | 2,090 | 2.6% |
| 60 to 89 Minutes | 2,042 | 2.6% |
| 90 or more Minutes | 1,517 | 1.9% |
Commute Time by Sex in Broome County
The most common commute times in Broome County are 10 to 14 minutes (8,744 commuters, 21.5%) for males and 15 to 19 minutes (8,600 commuters, 22.5%) for females.
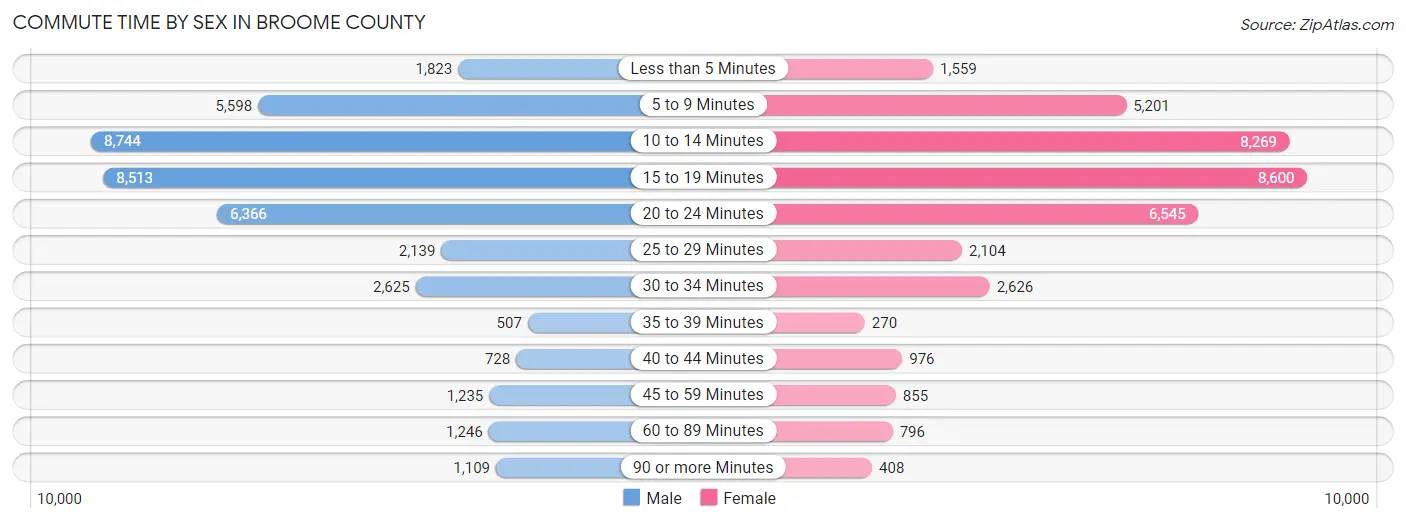
| Commute Time | Male | Female |
| Less than 5 Minutes | 1,823 (4.5%) | 1,559 (4.1%) |
| 5 to 9 Minutes | 5,598 (13.8%) | 5,201 (13.6%) |
| 10 to 14 Minutes | 8,744 (21.5%) | 8,269 (21.6%) |
| 15 to 19 Minutes | 8,513 (20.9%) | 8,600 (22.5%) |
| 20 to 24 Minutes | 6,366 (15.7%) | 6,545 (17.1%) |
| 25 to 29 Minutes | 2,139 (5.3%) | 2,104 (5.5%) |
| 30 to 34 Minutes | 2,625 (6.5%) | 2,626 (6.9%) |
| 35 to 39 Minutes | 507 (1.3%) | 270 (0.7%) |
| 40 to 44 Minutes | 728 (1.8%) | 976 (2.5%) |
| 45 to 59 Minutes | 1,235 (3.0%) | 855 (2.2%) |
| 60 to 89 Minutes | 1,246 (3.1%) | 796 (2.1%) |
| 90 or more Minutes | 1,109 (2.7%) | 408 (1.1%) |
Time of Departure to Work by Sex in Broome County
The most frequent times of departure to work in Broome County are 7:30 AM to 7:59 AM (5,436, 13.4%) for males and 7:30 AM to 7:59 AM (6,615, 17.3%) for females.
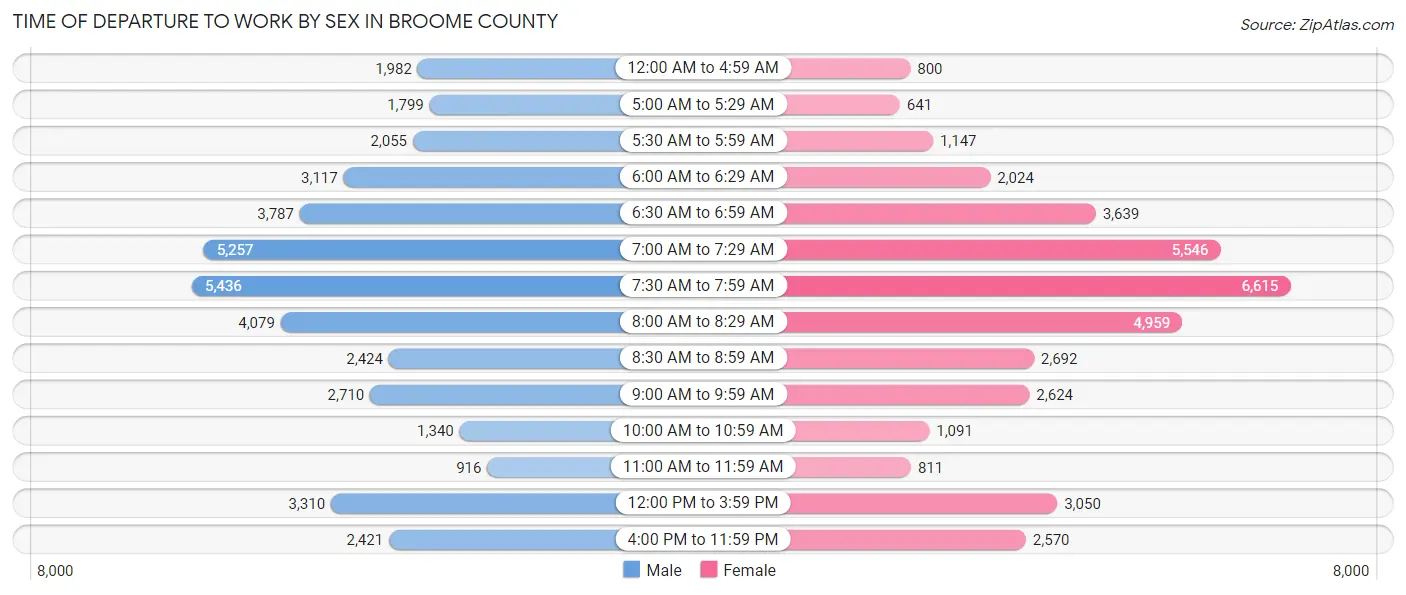
| Time of Departure | Male | Female |
| 12:00 AM to 4:59 AM | 1,982 (4.9%) | 800 (2.1%) |
| 5:00 AM to 5:29 AM | 1,799 (4.4%) | 641 (1.7%) |
| 5:30 AM to 5:59 AM | 2,055 (5.1%) | 1,147 (3.0%) |
| 6:00 AM to 6:29 AM | 3,117 (7.7%) | 2,024 (5.3%) |
| 6:30 AM to 6:59 AM | 3,787 (9.3%) | 3,639 (9.5%) |
| 7:00 AM to 7:29 AM | 5,257 (12.9%) | 5,546 (14.5%) |
| 7:30 AM to 7:59 AM | 5,436 (13.4%) | 6,615 (17.3%) |
| 8:00 AM to 8:29 AM | 4,079 (10.0%) | 4,959 (13.0%) |
| 8:30 AM to 8:59 AM | 2,424 (6.0%) | 2,692 (7.0%) |
| 9:00 AM to 9:59 AM | 2,710 (6.7%) | 2,624 (6.9%) |
| 10:00 AM to 10:59 AM | 1,340 (3.3%) | 1,091 (2.9%) |
| 11:00 AM to 11:59 AM | 916 (2.2%) | 811 (2.1%) |
| 12:00 PM to 3:59 PM | 3,310 (8.2%) | 3,050 (8.0%) |
| 4:00 PM to 11:59 PM | 2,421 (6.0%) | 2,570 (6.7%) |
| Total | 40,633 (100.0%) | 38,209 (100.0%) |
Housing Occupancy in Broome County
Occupancy by Ownership in Broome County
Of the total 81,339 dwellings in Broome County, owner-occupied units account for 52,748 (64.8%), while renter-occupied units make up 28,591 (35.1%).
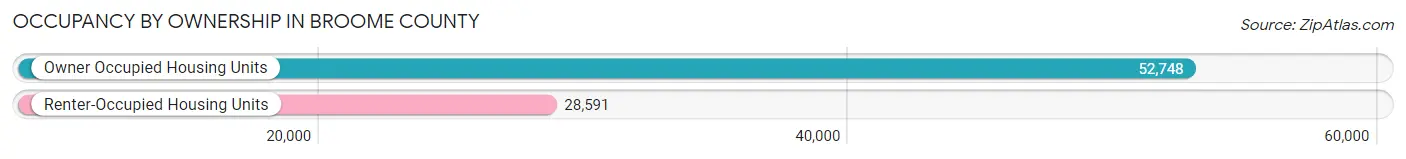
| Occupancy | # Housing Units | % Housing Units |
| Owner Occupied Housing Units | 52,748 | 64.8% |
| Renter-Occupied Housing Units | 28,591 | 35.1% |
| Total Occupied Housing Units | 81,339 | 100.0% |
Occupancy by Household Size in Broome County
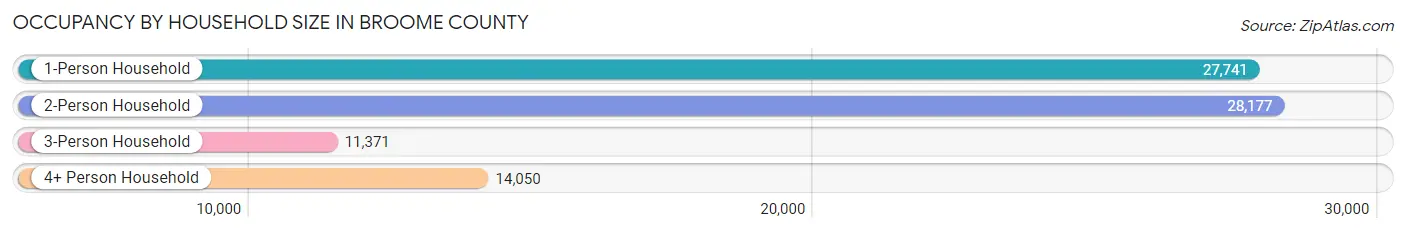
| Household Size | # Housing Units | % Housing Units |
| 1-Person Household | 27,741 | 34.1% |
| 2-Person Household | 28,177 | 34.6% |
| 3-Person Household | 11,371 | 14.0% |
| 4+ Person Household | 14,050 | 17.3% |
| Total Housing Units | 81,339 | 100.0% |
Occupancy by Ownership by Household Size in Broome County
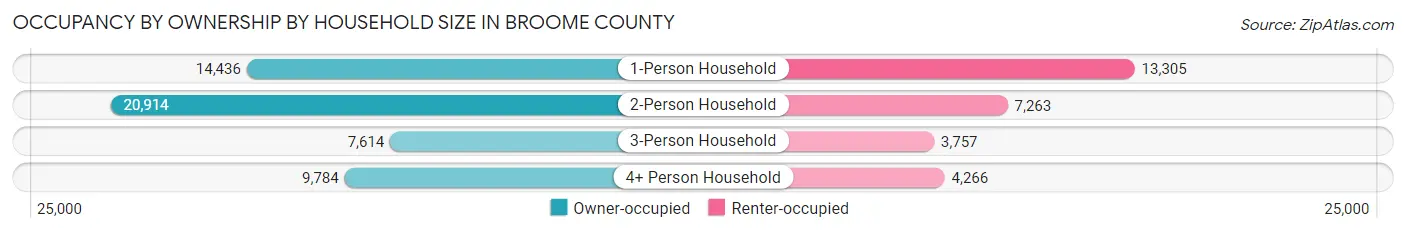
| Household Size | Owner-occupied | Renter-occupied |
| 1-Person Household | 14,436 (52.0%) | 13,305 (48.0%) |
| 2-Person Household | 20,914 (74.2%) | 7,263 (25.8%) |
| 3-Person Household | 7,614 (67.0%) | 3,757 (33.0%) |
| 4+ Person Household | 9,784 (69.6%) | 4,266 (30.4%) |
| Total Housing Units | 52,748 (64.8%) | 28,591 (35.1%) |
Occupancy by Educational Attainment in Broome County
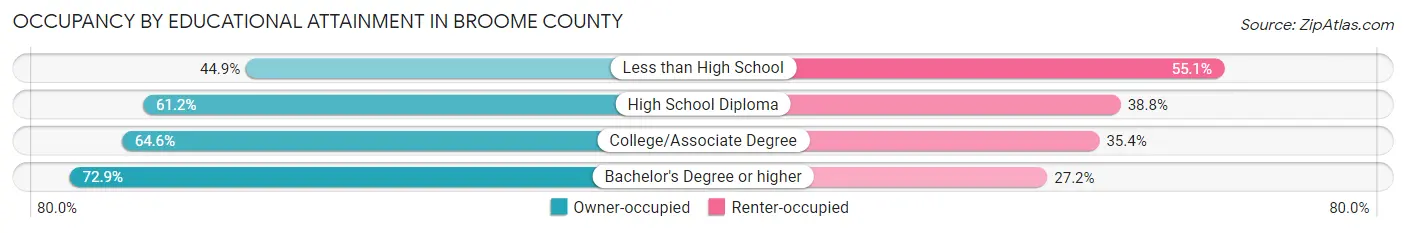
| Household Size | Owner-occupied | Renter-occupied |
| Less than High School | 2,587 (44.9%) | 3,178 (55.1%) |
| High School Diploma | 13,799 (61.2%) | 8,744 (38.8%) |
| College/Associate Degree | 17,724 (64.6%) | 9,723 (35.4%) |
| Bachelor's Degree or higher | 18,638 (72.9%) | 6,946 (27.2%) |
Occupancy by Age of Householder in Broome County
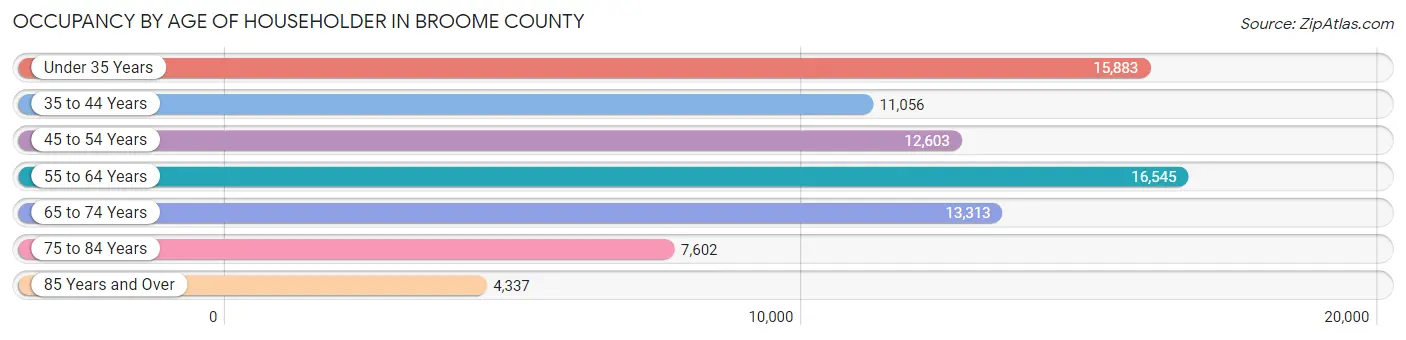
| Age Bracket | # Households | % Households |
| Under 35 Years | 15,883 | 19.5% |
| 35 to 44 Years | 11,056 | 13.6% |
| 45 to 54 Years | 12,603 | 15.5% |
| 55 to 64 Years | 16,545 | 20.3% |
| 65 to 74 Years | 13,313 | 16.4% |
| 75 to 84 Years | 7,602 | 9.3% |
| 85 Years and Over | 4,337 | 5.3% |
| Total | 81,339 | 100.0% |
Housing Finances in Broome County
Median Income by Occupancy in Broome County
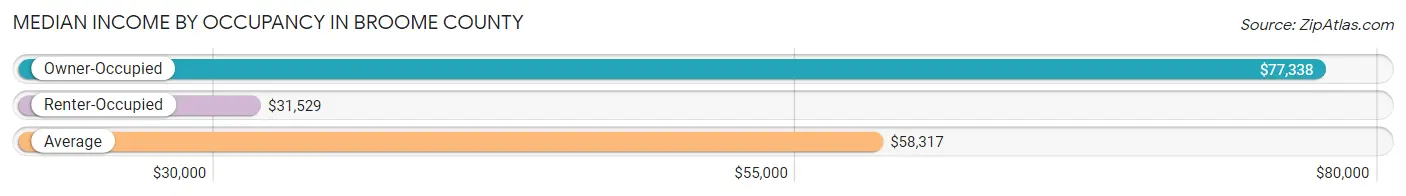
| Occupancy Type | # Households | Median Income |
| Owner-Occupied | 52,748 (64.8%) | $77,338 |
| Renter-Occupied | 28,591 (35.1%) | $31,529 |
| Average | 81,339 (100.0%) | $58,317 |
Occupancy by Householder Income Bracket in Broome County
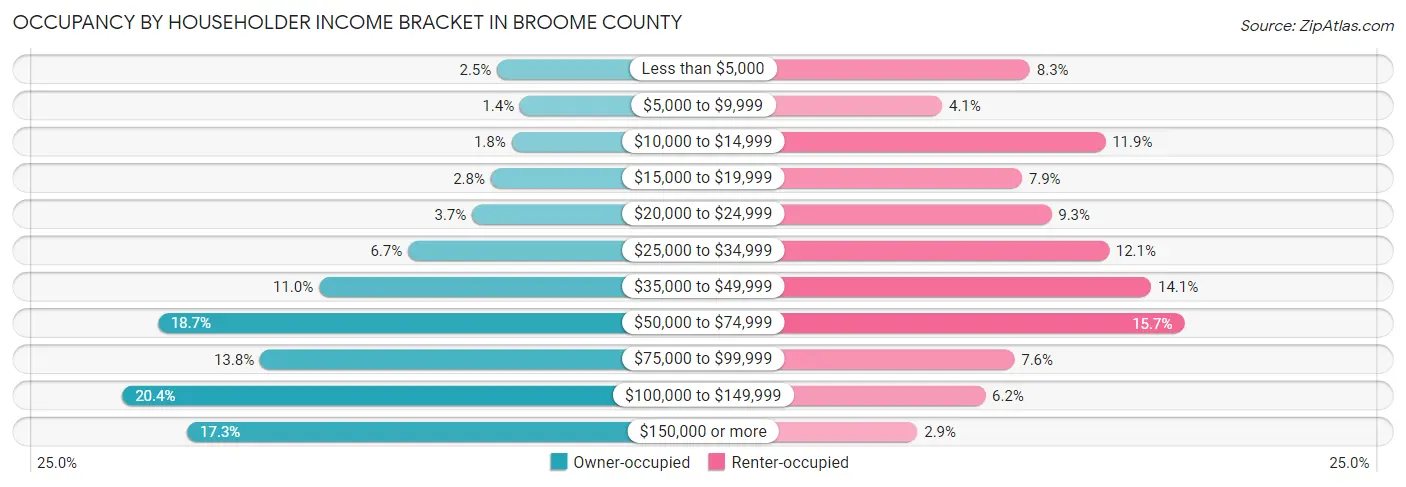
| Income Bracket | Owner-occupied | Renter-occupied |
| Less than $5,000 | 1,320 (2.5%) | 2,373 (8.3%) |
| $5,000 to $9,999 | 743 (1.4%) | 1,178 (4.1%) |
| $10,000 to $14,999 | 957 (1.8%) | 3,399 (11.9%) |
| $15,000 to $19,999 | 1,475 (2.8%) | 2,265 (7.9%) |
| $20,000 to $24,999 | 1,944 (3.7%) | 2,664 (9.3%) |
| $25,000 to $34,999 | 3,555 (6.7%) | 3,448 (12.1%) |
| $35,000 to $49,999 | 5,791 (11.0%) | 4,024 (14.1%) |
| $50,000 to $74,999 | 9,841 (18.7%) | 4,475 (15.7%) |
| $75,000 to $99,999 | 7,275 (13.8%) | 2,161 (7.6%) |
| $100,000 to $149,999 | 10,736 (20.3%) | 1,763 (6.2%) |
| $150,000 or more | 9,111 (17.3%) | 841 (2.9%) |
| Total | 52,748 (100.0%) | 28,591 (100.0%) |
Monthly Housing Cost Tiers in Broome County
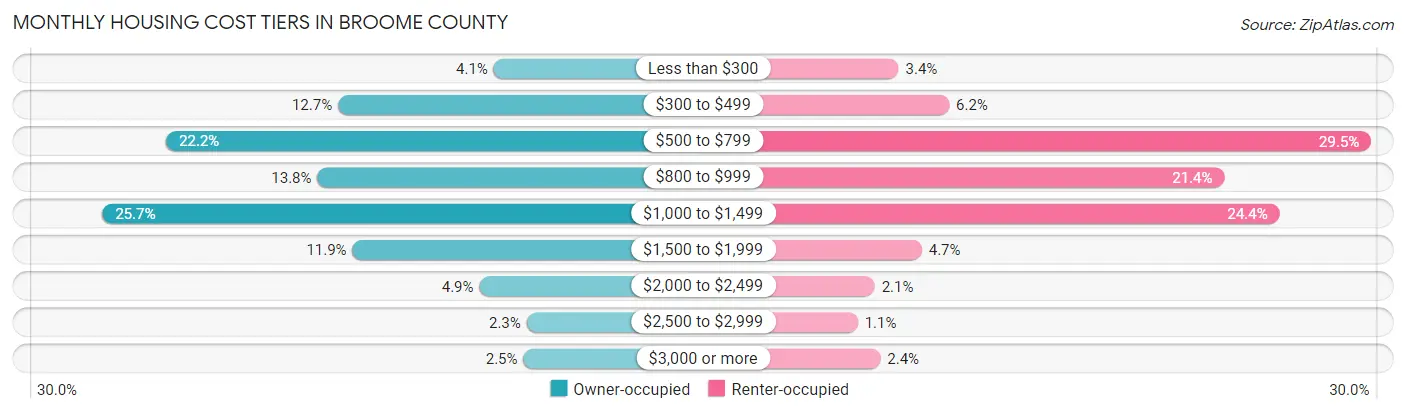
| Monthly Cost | Owner-occupied | Renter-occupied |
| Less than $300 | 2,157 (4.1%) | 967 (3.4%) |
| $300 to $499 | 6,696 (12.7%) | 1,765 (6.2%) |
| $500 to $799 | 11,705 (22.2%) | 8,429 (29.5%) |
| $800 to $999 | 7,294 (13.8%) | 6,110 (21.4%) |
| $1,000 to $1,499 | 13,560 (25.7%) | 6,982 (24.4%) |
| $1,500 to $1,999 | 6,271 (11.9%) | 1,333 (4.7%) |
| $2,000 to $2,499 | 2,573 (4.9%) | 589 (2.1%) |
| $2,500 to $2,999 | 1,198 (2.3%) | 320 (1.1%) |
| $3,000 or more | 1,294 (2.5%) | 678 (2.4%) |
| Total | 52,748 (100.0%) | 28,591 (100.0%) |
Physical Housing Characteristics in Broome County
Housing Structures in Broome County
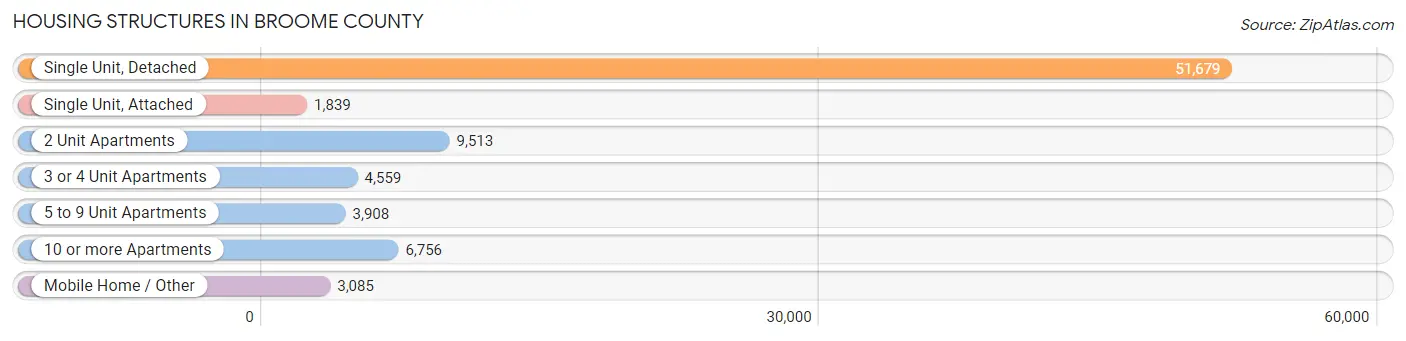
| Structure Type | # Housing Units | % Housing Units |
| Single Unit, Detached | 51,679 | 63.5% |
| Single Unit, Attached | 1,839 | 2.3% |
| 2 Unit Apartments | 9,513 | 11.7% |
| 3 or 4 Unit Apartments | 4,559 | 5.6% |
| 5 to 9 Unit Apartments | 3,908 | 4.8% |
| 10 or more Apartments | 6,756 | 8.3% |
| Mobile Home / Other | 3,085 | 3.8% |
| Total | 81,339 | 100.0% |
Housing Structures by Occupancy in Broome County
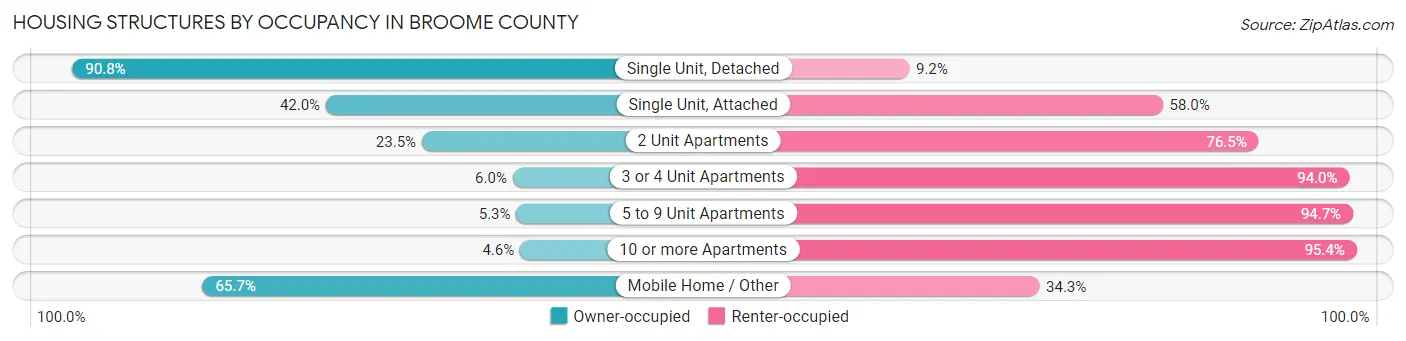
| Structure Type | Owner-occupied | Renter-occupied |
| Single Unit, Detached | 46,919 (90.8%) | 4,760 (9.2%) |
| Single Unit, Attached | 772 (42.0%) | 1,067 (58.0%) |
| 2 Unit Apartments | 2,236 (23.5%) | 7,277 (76.5%) |
| 3 or 4 Unit Apartments | 274 (6.0%) | 4,285 (94.0%) |
| 5 to 9 Unit Apartments | 208 (5.3%) | 3,700 (94.7%) |
| 10 or more Apartments | 311 (4.6%) | 6,445 (95.4%) |
| Mobile Home / Other | 2,028 (65.7%) | 1,057 (34.3%) |
| Total | 52,748 (64.8%) | 28,591 (35.1%) |
Housing Structures by Number of Rooms in Broome County
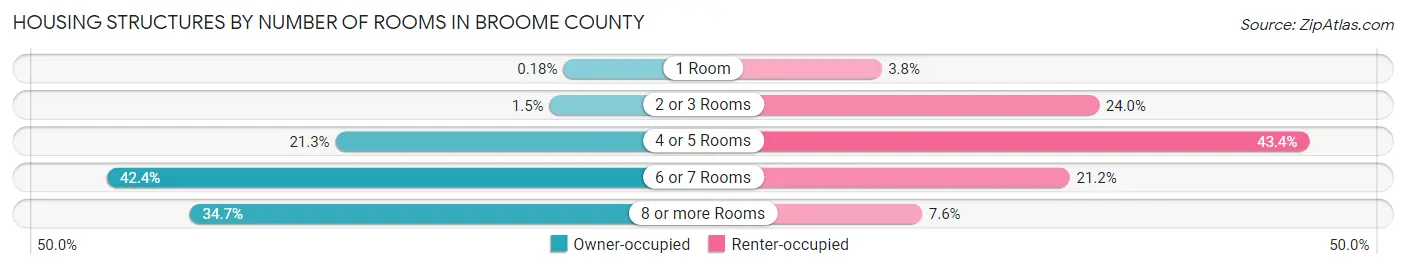
| Number of Rooms | Owner-occupied | Renter-occupied |
| 1 Room | 93 (0.2%) | 1,093 (3.8%) |
| 2 or 3 Rooms | 771 (1.5%) | 6,847 (23.9%) |
| 4 or 5 Rooms | 11,207 (21.2%) | 12,410 (43.4%) |
| 6 or 7 Rooms | 22,356 (42.4%) | 6,073 (21.2%) |
| 8 or more Rooms | 18,321 (34.7%) | 2,168 (7.6%) |
| Total | 52,748 (100.0%) | 28,591 (100.0%) |
Housing Structure by Heating Type in Broome County
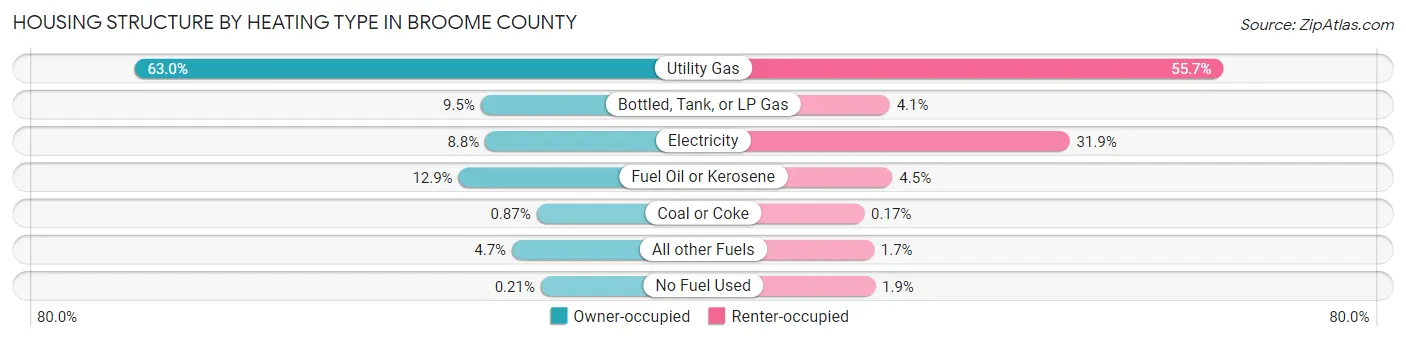
| Heating Type | Owner-occupied | Renter-occupied |
| Utility Gas | 33,238 (63.0%) | 15,924 (55.7%) |
| Bottled, Tank, or LP Gas | 5,006 (9.5%) | 1,181 (4.1%) |
| Electricity | 4,652 (8.8%) | 9,129 (31.9%) |
| Fuel Oil or Kerosene | 6,819 (12.9%) | 1,297 (4.5%) |
| Coal or Coke | 460 (0.9%) | 50 (0.2%) |
| All other Fuels | 2,461 (4.7%) | 477 (1.7%) |
| No Fuel Used | 112 (0.2%) | 533 (1.9%) |
| Total | 52,748 (100.0%) | 28,591 (100.0%) |
Household Vehicle Usage in Broome County
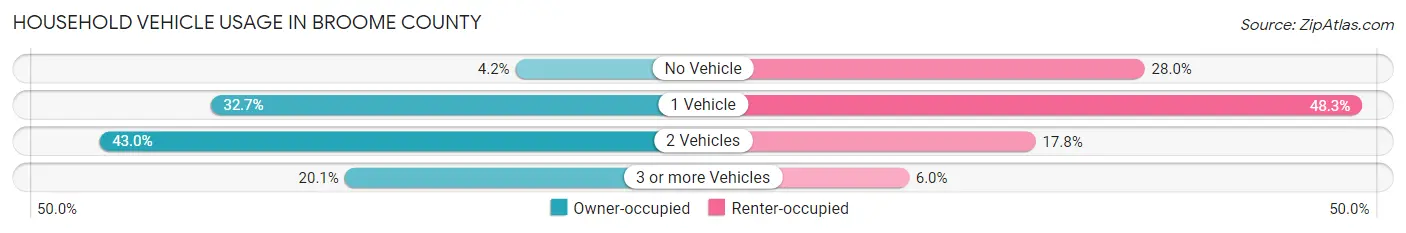
| Vehicles per Household | Owner-occupied | Renter-occupied |
| No Vehicle | 2,205 (4.2%) | 7,999 (28.0%) |
| 1 Vehicle | 17,227 (32.7%) | 13,802 (48.3%) |
| 2 Vehicles | 22,700 (43.0%) | 5,086 (17.8%) |
| 3 or more Vehicles | 10,616 (20.1%) | 1,704 (6.0%) |
| Total | 52,748 (100.0%) | 28,591 (100.0%) |
Real Estate & Mortgages in Broome County
Real Estate and Mortgage Overview in Broome County
| Characteristic | Without Mortgage | With Mortgage |
| Housing Units | 24,565 | 28,183 |
| Median Property Value | $129,100 | $146,100 |
| Median Household Income | $59,434 | $5,838 |
| Monthly Housing Costs | $597 | $1,216 |
| Real Estate Taxes | $3,345 | $750 |
Property Value by Mortgage Status in Broome County
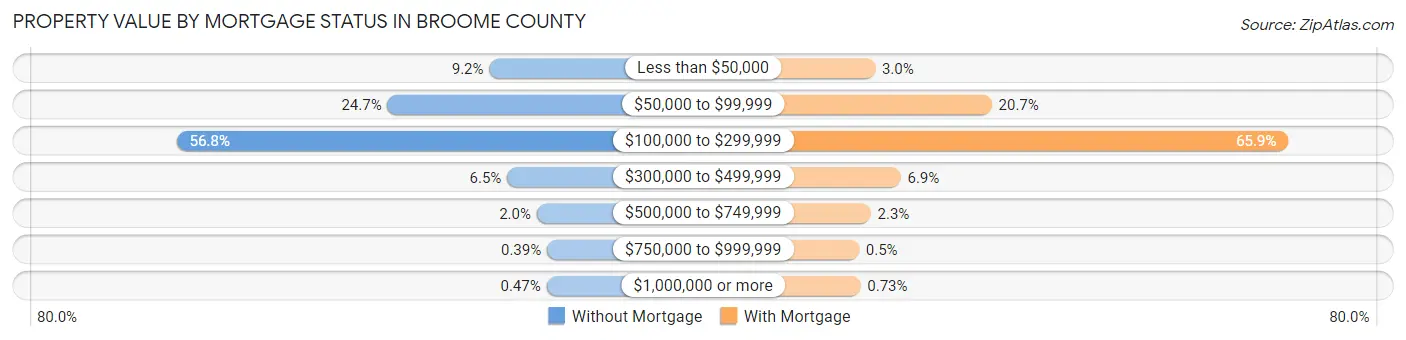
| Property Value | Without Mortgage | With Mortgage |
| Less than $50,000 | 2,256 (9.2%) | 834 (3.0%) |
| $50,000 to $99,999 | 6,067 (24.7%) | 5,842 (20.7%) |
| $100,000 to $299,999 | 13,963 (56.8%) | 18,581 (65.9%) |
| $300,000 to $499,999 | 1,586 (6.5%) | 1,933 (6.9%) |
| $500,000 to $749,999 | 480 (1.9%) | 646 (2.3%) |
| $750,000 to $999,999 | 97 (0.4%) | 140 (0.5%) |
| $1,000,000 or more | 116 (0.5%) | 207 (0.7%) |
| Total | 24,565 (100.0%) | 28,183 (100.0%) |
Household Income by Mortgage Status in Broome County
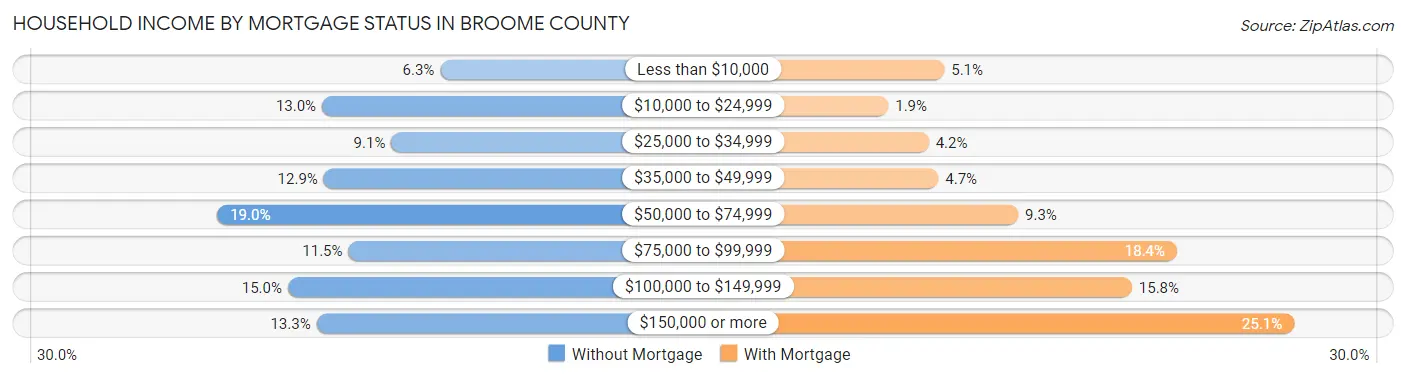
| Household Income | Without Mortgage | With Mortgage |
| Less than $10,000 | 1,535 (6.2%) | 1,428 (5.1%) |
| $10,000 to $24,999 | 3,197 (13.0%) | 528 (1.9%) |
| $25,000 to $34,999 | 2,223 (9.0%) | 1,179 (4.2%) |
| $35,000 to $49,999 | 3,172 (12.9%) | 1,332 (4.7%) |
| $50,000 to $74,999 | 4,666 (19.0%) | 2,619 (9.3%) |
| $75,000 to $99,999 | 2,825 (11.5%) | 5,175 (18.4%) |
| $100,000 to $149,999 | 3,674 (15.0%) | 4,450 (15.8%) |
| $150,000 or more | 3,273 (13.3%) | 7,062 (25.1%) |
| Total | 24,565 (100.0%) | 28,183 (100.0%) |
Property Value to Household Income Ratio in Broome County
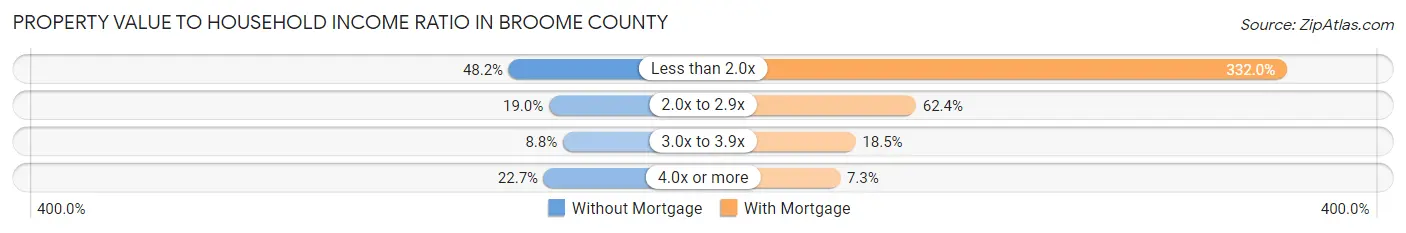
| Value-to-Income Ratio | Without Mortgage | With Mortgage |
| Less than 2.0x | 11,827 (48.1%) | 93,575 (332.0%) |
| 2.0x to 2.9x | 4,677 (19.0%) | 17,587 (62.4%) |
| 3.0x to 3.9x | 2,166 (8.8%) | 5,220 (18.5%) |
| 4.0x or more | 5,584 (22.7%) | 2,049 (7.3%) |
| Total | 24,565 (100.0%) | 28,183 (100.0%) |
Real Estate Taxes by Mortgage Status in Broome County
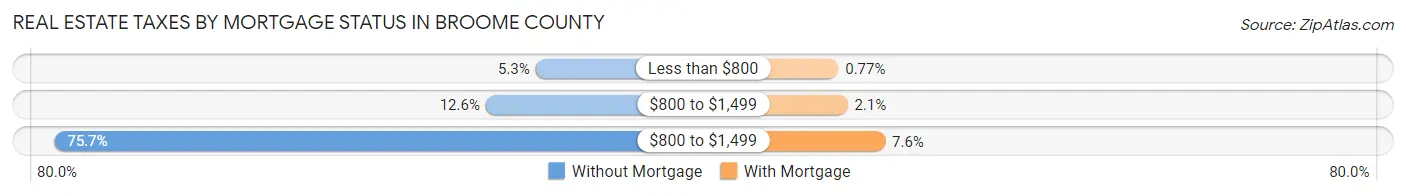
| Property Taxes | Without Mortgage | With Mortgage |
| Less than $800 | 1,311 (5.3%) | 217 (0.8%) |
| $800 to $1,499 | 3,100 (12.6%) | 595 (2.1%) |
| $800 to $1,499 | 18,586 (75.7%) | 2,144 (7.6%) |
| Total | 24,565 (100.0%) | 28,183 (100.0%) |
Health & Disability in Broome County
Health Insurance Coverage by Age in Broome County
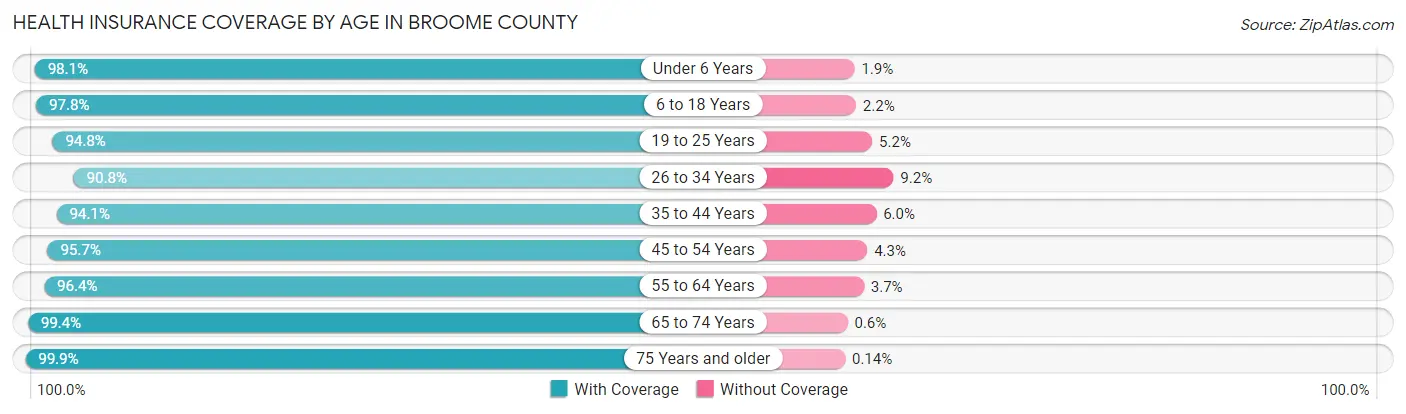
| Age Bracket | With Coverage | Without Coverage |
| Under 6 Years | 11,675 (98.1%) | 226 (1.9%) |
| 6 to 18 Years | 29,494 (97.8%) | 650 (2.2%) |
| 19 to 25 Years | 25,793 (94.8%) | 1,415 (5.2%) |
| 26 to 34 Years | 17,761 (90.8%) | 1,792 (9.2%) |
| 35 to 44 Years | 19,625 (94.1%) | 1,242 (5.9%) |
| 45 to 54 Years | 20,207 (95.7%) | 902 (4.3%) |
| 55 to 64 Years | 26,390 (96.4%) | 1,000 (3.6%) |
| 65 to 74 Years | 20,692 (99.4%) | 125 (0.6%) |
| 75 Years and older | 16,753 (99.9%) | 23 (0.1%) |
| Total | 188,390 (96.2%) | 7,375 (3.8%) |
Health Insurance Coverage by Citizenship Status in Broome County
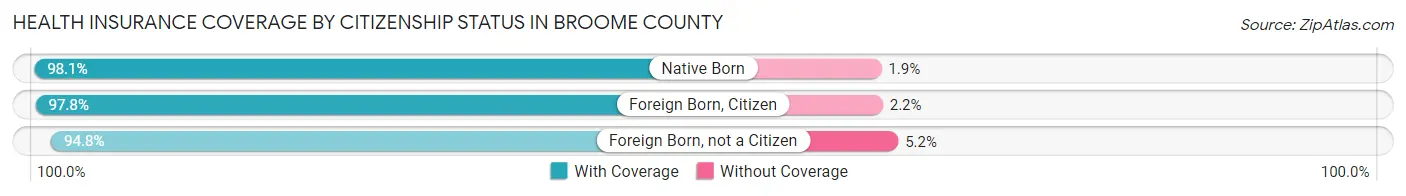
| Citizenship Status | With Coverage | Without Coverage |
| Native Born | 11,675 (98.1%) | 226 (1.9%) |
| Foreign Born, Citizen | 29,494 (97.8%) | 650 (2.2%) |
| Foreign Born, not a Citizen | 25,793 (94.8%) | 1,415 (5.2%) |
Health Insurance Coverage by Household Income in Broome County
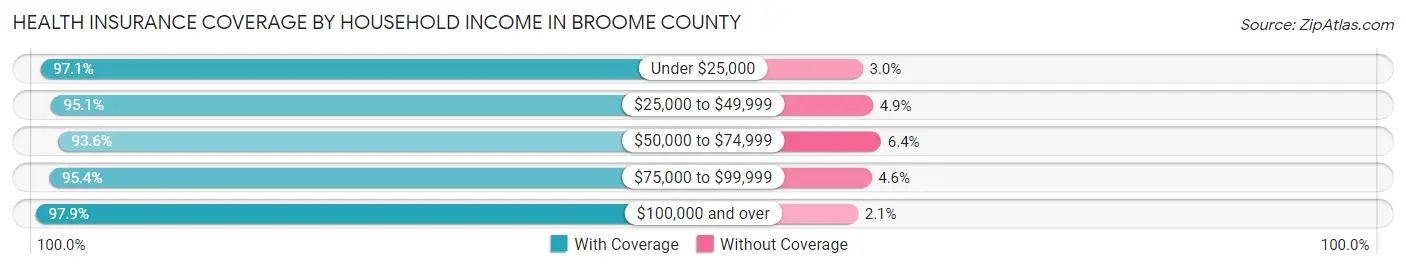
| Household Income | With Coverage | Without Coverage |
| Under $25,000 | 30,815 (97.1%) | 937 (2.9%) |
| $25,000 to $49,999 | 32,510 (95.1%) | 1,663 (4.9%) |
| $50,000 to $74,999 | 29,663 (93.6%) | 2,023 (6.4%) |
| $75,000 to $99,999 | 22,904 (95.4%) | 1,103 (4.6%) |
| $100,000 and over | 64,953 (97.9%) | 1,365 (2.1%) |
Public vs Private Health Insurance Coverage by Age in Broome County
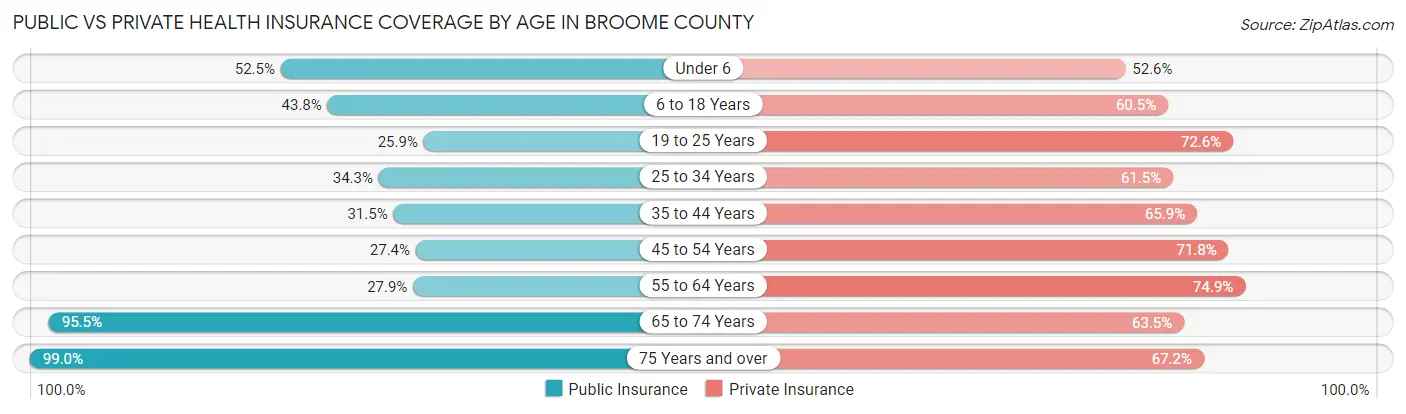
| Age Bracket | Public Insurance | Private Insurance |
| Under 6 | 6,242 (52.4%) | 6,264 (52.6%) |
| 6 to 18 Years | 13,191 (43.8%) | 18,248 (60.5%) |
| 19 to 25 Years | 7,050 (25.9%) | 19,760 (72.6%) |
| 25 to 34 Years | 6,698 (34.3%) | 12,020 (61.5%) |
| 35 to 44 Years | 6,580 (31.5%) | 13,759 (65.9%) |
| 45 to 54 Years | 5,780 (27.4%) | 15,156 (71.8%) |
| 55 to 64 Years | 7,633 (27.9%) | 20,504 (74.9%) |
| 65 to 74 Years | 19,881 (95.5%) | 13,226 (63.5%) |
| 75 Years and over | 16,612 (99.0%) | 11,272 (67.2%) |
| Total | 89,667 (45.8%) | 130,209 (66.5%) |
Disability Status by Sex by Age in Broome County
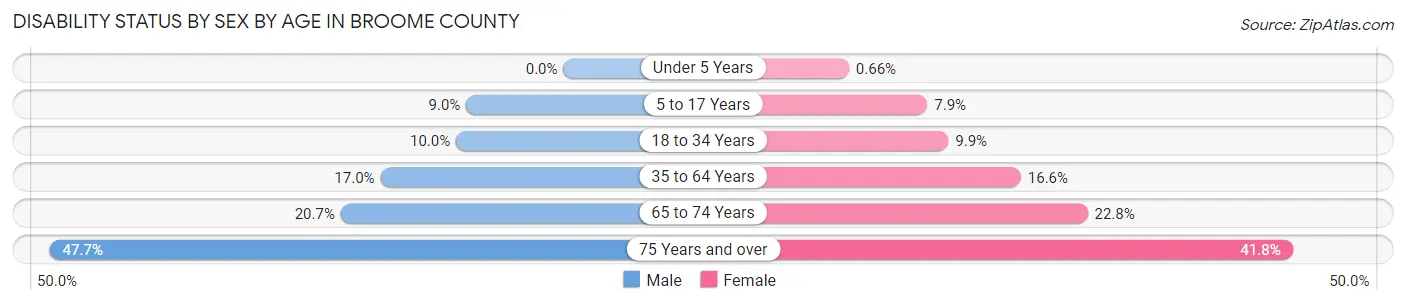
| Age Bracket | Male | Female |
| Under 5 Years | 0 (0.0%) | 32 (0.7%) |
| 5 to 17 Years | 1,315 (9.0%) | 1,068 (7.9%) |
| 18 to 34 Years | 2,604 (10.0%) | 2,460 (9.9%) |
| 35 to 64 Years | 5,867 (17.0%) | 5,786 (16.6%) |
| 65 to 74 Years | 2,079 (20.7%) | 2,453 (22.8%) |
| 75 Years and over | 3,087 (47.7%) | 4,309 (41.8%) |
Disability Class by Sex by Age in Broome County
Disability Class: Hearing Difficulty
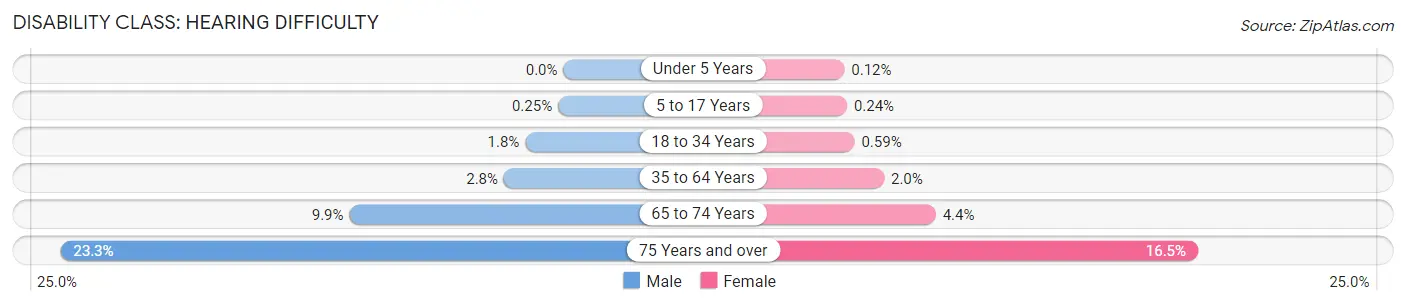
| Age Bracket | Male | Female |
| Under 5 Years | 0 (0.0%) | 6 (0.1%) |
| 5 to 17 Years | 37 (0.3%) | 32 (0.2%) |
| 18 to 34 Years | 462 (1.8%) | 146 (0.6%) |
| 35 to 64 Years | 954 (2.8%) | 684 (2.0%) |
| 65 to 74 Years | 999 (9.9%) | 469 (4.4%) |
| 75 Years and over | 1,511 (23.3%) | 1,702 (16.5%) |
Disability Class: Vision Difficulty
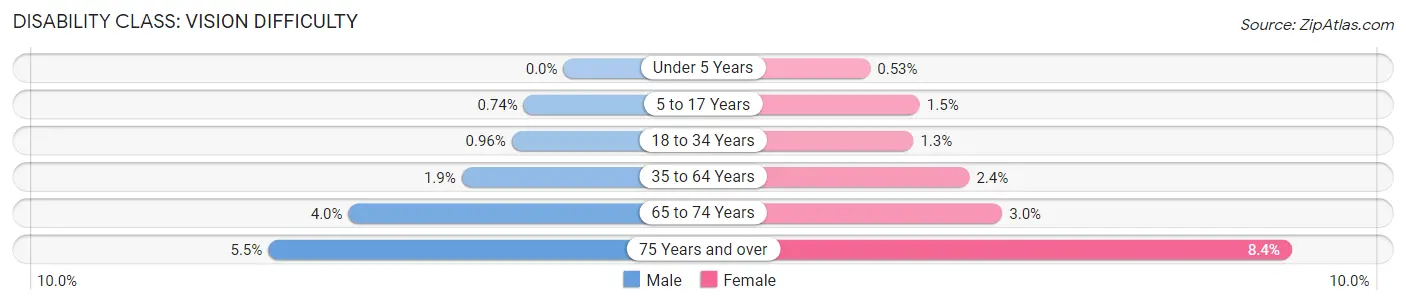
| Age Bracket | Male | Female |
| Under 5 Years | 0 (0.0%) | 26 (0.5%) |
| 5 to 17 Years | 108 (0.7%) | 195 (1.5%) |
| 18 to 34 Years | 252 (1.0%) | 332 (1.3%) |
| 35 to 64 Years | 654 (1.9%) | 826 (2.4%) |
| 65 to 74 Years | 401 (4.0%) | 321 (3.0%) |
| 75 Years and over | 355 (5.5%) | 860 (8.4%) |
Disability Class: Cognitive Difficulty
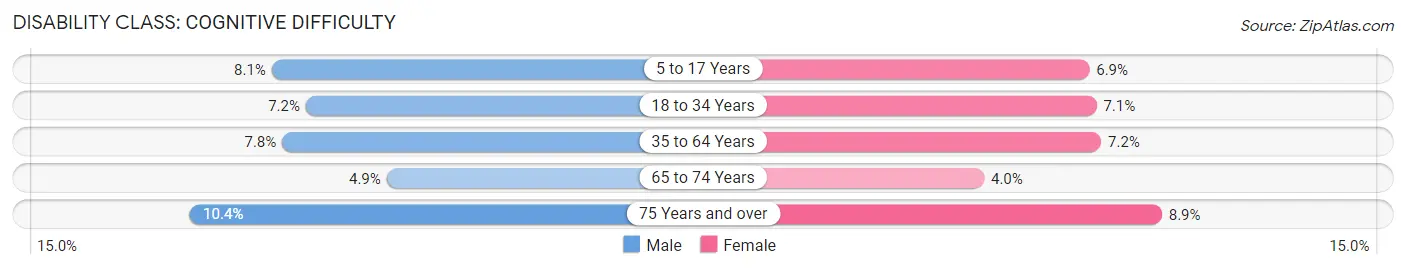
| Age Bracket | Male | Female |
| 5 to 17 Years | 1,184 (8.1%) | 927 (6.9%) |
| 18 to 34 Years | 1,875 (7.2%) | 1,765 (7.1%) |
| 35 to 64 Years | 2,704 (7.8%) | 2,512 (7.2%) |
| 65 to 74 Years | 495 (4.9%) | 426 (4.0%) |
| 75 Years and over | 673 (10.4%) | 918 (8.9%) |
Disability Class: Ambulatory Difficulty
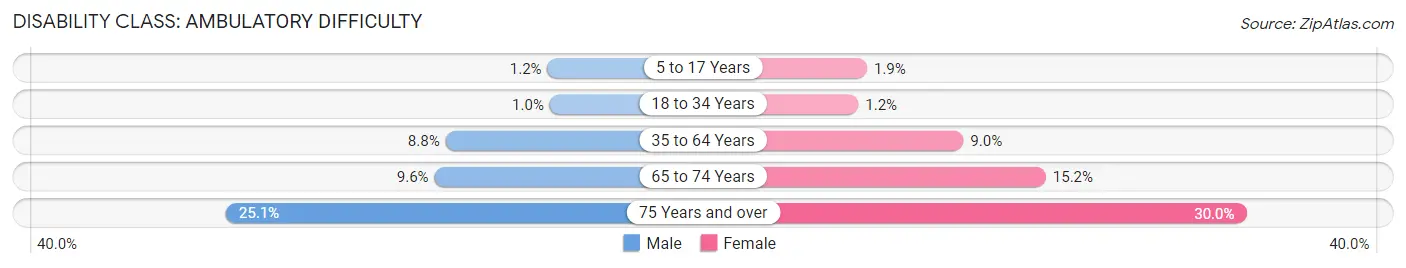
| Age Bracket | Male | Female |
| 5 to 17 Years | 172 (1.2%) | 251 (1.9%) |
| 18 to 34 Years | 263 (1.0%) | 306 (1.2%) |
| 35 to 64 Years | 3,024 (8.7%) | 3,143 (9.0%) |
| 65 to 74 Years | 963 (9.6%) | 1,629 (15.1%) |
| 75 Years and over | 1,622 (25.1%) | 3,093 (30.0%) |
Disability Class: Self-Care Difficulty
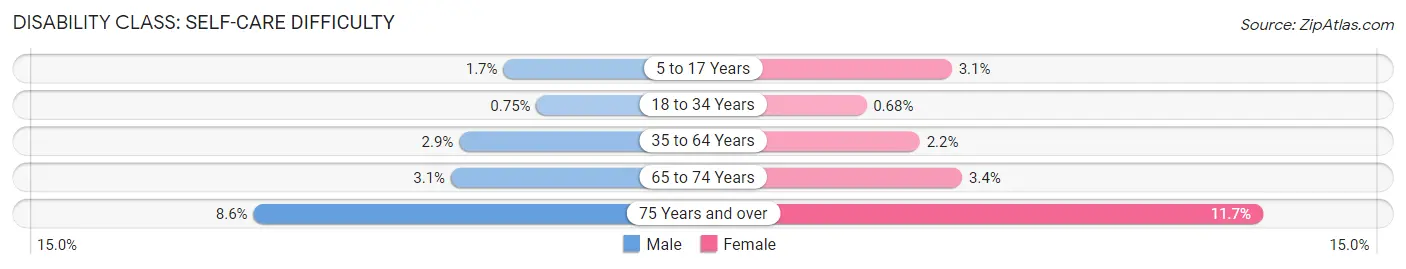
| Age Bracket | Male | Female |
| 5 to 17 Years | 243 (1.7%) | 412 (3.1%) |
| 18 to 34 Years | 196 (0.7%) | 169 (0.7%) |
| 35 to 64 Years | 1,002 (2.9%) | 754 (2.2%) |
| 65 to 74 Years | 315 (3.1%) | 360 (3.4%) |
| 75 Years and over | 559 (8.6%) | 1,207 (11.7%) |
Technology Access in Broome County
Computing Device Access in Broome County
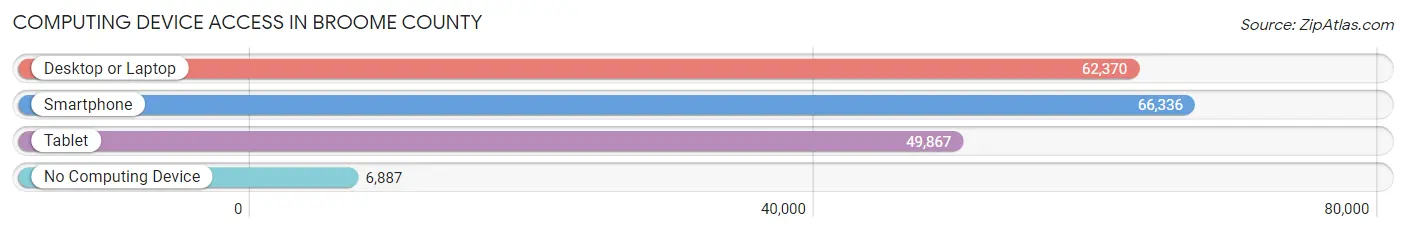
| Device Type | # Households | % Households |
| Desktop or Laptop | 62,370 | 76.7% |
| Smartphone | 66,336 | 81.6% |
| Tablet | 49,867 | 61.3% |
| No Computing Device | 6,887 | 8.5% |
| Total | 81,339 | 100.0% |
Internet Access in Broome County
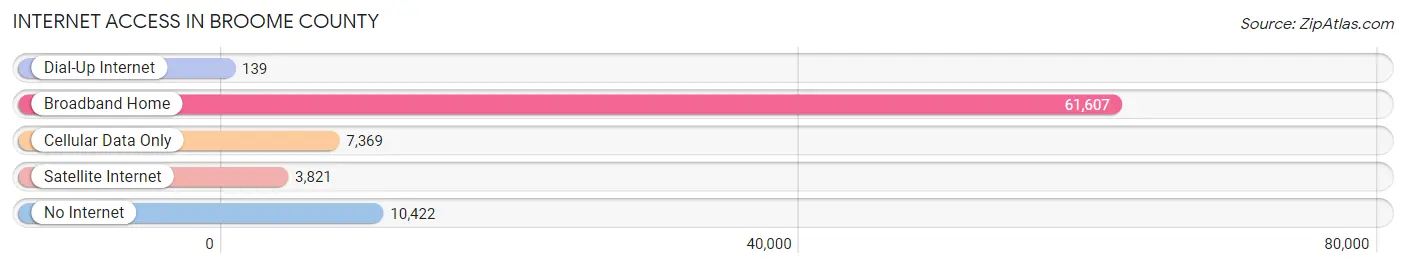
| Internet Type | # Households | % Households |
| Dial-Up Internet | 139 | 0.2% |
| Broadband Home | 61,607 | 75.7% |
| Cellular Data Only | 7,369 | 9.1% |
| Satellite Internet | 3,821 | 4.7% |
| No Internet | 10,422 | 12.8% |
| Total | 81,339 | 100.0% |
Broome County Summary
Broome County is located in the south-central region of New York State, and is part of the Binghamton Metropolitan Statistical Area. It is bordered by Chenango County to the north, Tioga County to the west, and Susquehanna County in Pennsylvania to the south. The county seat is Binghamton, and the largest city is the city of Binghamton.
History
Broome County was formed in 1806 from parts of Tioga and Onondaga counties. It was named after John Broome, who was the lieutenant governor of New York from 1804 to 1810. The county was originally part of the Iroquois Confederacy, and was home to the Susquehannock and Iroquois tribes.
The first settlers in the area were mostly German and Dutch immigrants, who began arriving in the late 1700s. The first permanent settlement was established in 1787 in the town of Union. The county was officially established in 1806, and the first county seat was located in the town of Chenango.
In the early 1800s, the county was home to a thriving lumber industry, and the area was known for its production of maple syrup. The county was also home to a number of mills, including the first paper mill in the United States, which was established in 1801 in the town of Chenango.
The county was also home to a number of prominent figures in American history, including the first female doctor in the United States, Elizabeth Blackwell, who was born in the town of Chenango in 1821.
Geography
Broome County is located in the south-central region of New York State, and is part of the Binghamton Metropolitan Statistical Area. It is bordered by Chenango County to the north, Tioga County to the west, and Susquehanna County in Pennsylvania to the south. The county seat is Binghamton, and the largest city is the city of Binghamton.
The county has a total area of 717 square miles, of which 709 square miles is land and 8 square miles is water. The terrain is mostly hilly, with the highest point being the summit of Mount Prospect, which is 1,945 feet above sea level. The county is home to a number of rivers, including the Susquehanna River, the Chenango River, and the Tioughnioga River.
Economy
The economy of Broome County is largely based on manufacturing, healthcare, and education. The county is home to a number of large employers, including IBM, Lockheed Martin, and BAE Systems. The county is also home to a number of hospitals, including UHS Wilson Medical Center, Lourdes Hospital, and Binghamton General Hospital.
The county is also home to a number of higher education institutions, including Binghamton University, SUNY Broome Community College, and Davis College.
Demographics
As of the 2010 census, the population of Broome County was 200,600. The racial makeup of the county was 90.2% White, 4.3% African American, 0.7% Native American, 2.2% Asian, 0.1% Pacific Islander, and 2.5% from two or more races. The median household income was $45,845, and the median family income was $55,867. The per capita income was $23,845.
Conclusion
Broome County is located in the south-central region of New York State, and is part of the Binghamton Metropolitan Statistical Area. It is bordered by Chenango County to the north, Tioga County to the west, and Susquehanna County in Pennsylvania to the south. The county seat is Binghamton, and the largest city is the city of Binghamton. The county has a long history, and was originally part of the Iroquois Confederacy. The economy of the county is largely based on manufacturing, healthcare, and education. As of the 2010 census, the population of Broome County was 200,600, and the median household income was $45,845.
Common Questions
What is Per Capita Income in Broome County?
Per Capita income in Broome County is $33,674.
What is the Median Family Income in Broome County?
Median Family Income in Broome County is $78,605.
What is the Median Household income in Broome County?
Median Household Income in Broome County is $58,317.
What is Income or Wage Gap in Broome County?
Income or Wage Gap in Broome County is 24.2%.
Women in Broome County earn 75.8 cents for every dollar earned by a man.
What is Family Income Deficit in Broome County?
Family Income Deficit in Broome County is $11,109.
Families that are below poverty line in Broome County earn $11,109 less on average than the poverty threshold level.
What is Inequality or Gini Index in Broome County?
Inequality or Gini Index in Broome County is 0.48.
What is the Total Population of Broome County?
Total Population of Broome County is 198,365.
What is the Total Male Population of Broome County?
Total Male Population of Broome County is 98,025.
What is the Total Female Population of Broome County?
Total Female Population of Broome County is 100,340.
What is the Ratio of Males per 100 Females in Broome County?
There are 97.69 Males per 100 Females in Broome County.
What is the Ratio of Females per 100 Males in Broome County?
There are 102.36 Females per 100 Males in Broome County.
What is the Median Population Age in Broome County?
Median Population Age in Broome County is 39.7 Years.
What is the Average Family Size in Broome County
Average Family Size in Broome County is 3.0 People.
What is the Average Household Size in Broome County
Average Household Size in Broome County is 2.3 People.
How Large is the Labor Force in Broome County?
There are 93,834 People in the Labor Forcein in Broome County.
What is the Percentage of People in the Labor Force in Broome County?
56.8% of People are in the Labor Force in Broome County.
What is the Unemployment Rate in Broome County?
Unemployment Rate in Broome County is 6.9%.