Allegany County, NY Map & Demographics
Allegany County Map
Allegany County Overview
$28,506
PER CAPITA INCOME
$75,880
AVG FAMILY INCOME
$58,725
AVG HOUSEHOLD INCOME
26.7%
WAGE / INCOME GAP [ % ]
73.3¢/ $1
WAGE / INCOME GAP [ $ ]
$12,292
FAMILY INCOME DEFICIT
0.44
INEQUALITY / GINI INDEX
47,222
TOTAL POPULATION
23,892
MALE POPULATION
23,330
FEMALE POPULATION
102.41
MALES / 100 FEMALES
97.65
FEMALES / 100 MALES
38.9
MEDIAN AGE
3.1
AVG FAMILY SIZE
2.5
AVG HOUSEHOLD SIZE
21,162
LABOR FORCE [ PEOPLE ]
54.2%
PERCENT IN LABOR FORCE
7.3%
UNEMPLOYMENT RATE
Income in Allegany County
Income Overview in Allegany County
Per Capita Income in Allegany County is $28,506, while median incomes of families and households are $75,880 and $58,725 respectively.
| Characteristic | Number | Measure |
| Per Capita Income | 47,222 | $28,506 |
| Median Family Income | 10,573 | $75,880 |
| Mean Family Income | 10,573 | $86,561 |
| Median Household Income | 16,813 | $58,725 |
| Mean Household Income | 16,813 | $75,036 |
| Income Deficit | 10,573 | $12,292 |
| Wage / Income Gap (%) | 47,222 | 26.67% |
| Wage / Income Gap ($) | 47,222 | 73.33¢ per $1 |
| Gini / Inequality Index | 47,222 | 0.44 |
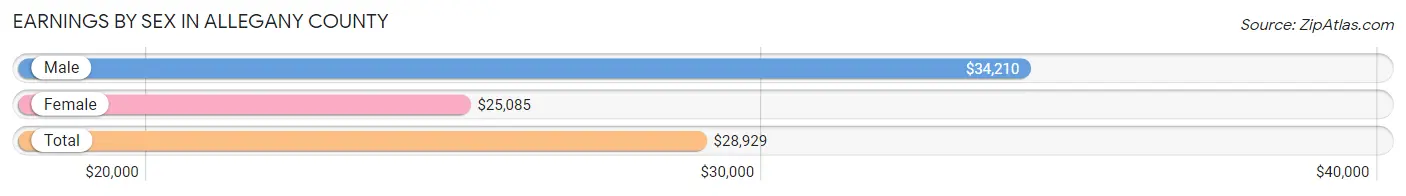
Earnings by Sex in Allegany County
Average Earnings in Allegany County are $28,929, $34,210 for men and $25,085 for women, a difference of 26.7%.
| Sex | Number | Average Earnings |
| Male | 12,216 (52.2%) | $34,210 |
| Female | 11,201 (47.8%) | $25,085 |
| Total | 23,417 (100.0%) | $28,929 |
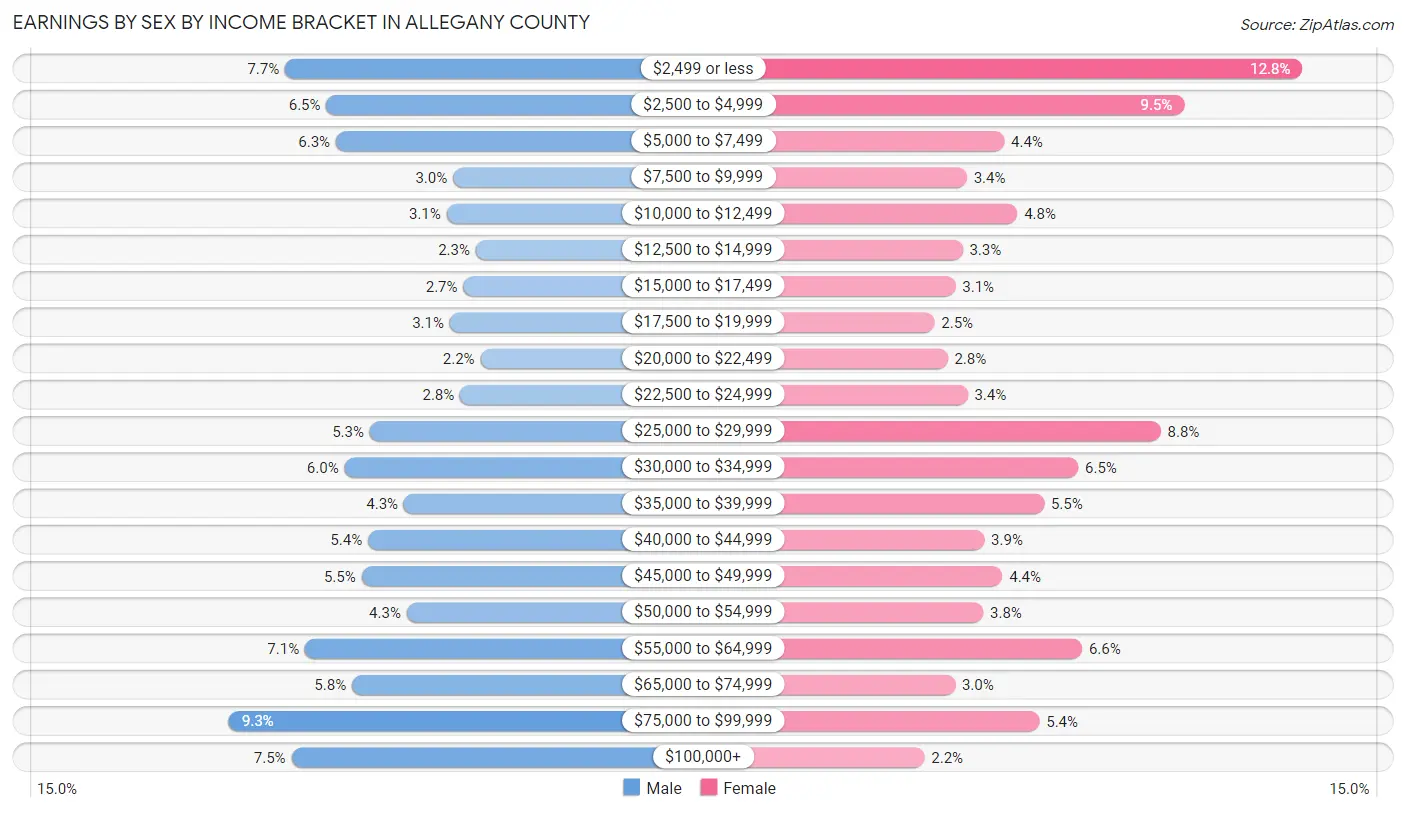
Earnings by Sex by Income Bracket in Allegany County
The most common earnings brackets in Allegany County are $75,000 to $99,999 for men (1,131 | 9.3%) and $2,499 or less for women (1,434 | 12.8%).
| Income | Male | Female |
| $2,499 or less | 938 (7.7%) | 1,434 (12.8%) |
| $2,500 to $4,999 | 797 (6.5%) | 1,062 (9.5%) |
| $5,000 to $7,499 | 763 (6.2%) | 495 (4.4%) |
| $7,500 to $9,999 | 362 (3.0%) | 377 (3.4%) |
| $10,000 to $12,499 | 384 (3.1%) | 537 (4.8%) |
| $12,500 to $14,999 | 284 (2.3%) | 364 (3.3%) |
| $15,000 to $17,499 | 326 (2.7%) | 342 (3.0%) |
| $17,500 to $19,999 | 372 (3.0%) | 275 (2.5%) |
| $20,000 to $22,499 | 268 (2.2%) | 317 (2.8%) |
| $22,500 to $24,999 | 337 (2.8%) | 380 (3.4%) |
| $25,000 to $29,999 | 647 (5.3%) | 988 (8.8%) |
| $30,000 to $34,999 | 734 (6.0%) | 728 (6.5%) |
| $35,000 to $39,999 | 530 (4.3%) | 621 (5.5%) |
| $40,000 to $44,999 | 653 (5.3%) | 432 (3.9%) |
| $45,000 to $49,999 | 675 (5.5%) | 490 (4.4%) |
| $50,000 to $54,999 | 521 (4.3%) | 429 (3.8%) |
| $55,000 to $64,999 | 870 (7.1%) | 740 (6.6%) |
| $65,000 to $74,999 | 708 (5.8%) | 340 (3.0%) |
| $75,000 to $99,999 | 1,131 (9.3%) | 606 (5.4%) |
| $100,000+ | 916 (7.5%) | 244 (2.2%) |
| Total | 12,216 (100.0%) | 11,201 (100.0%) |
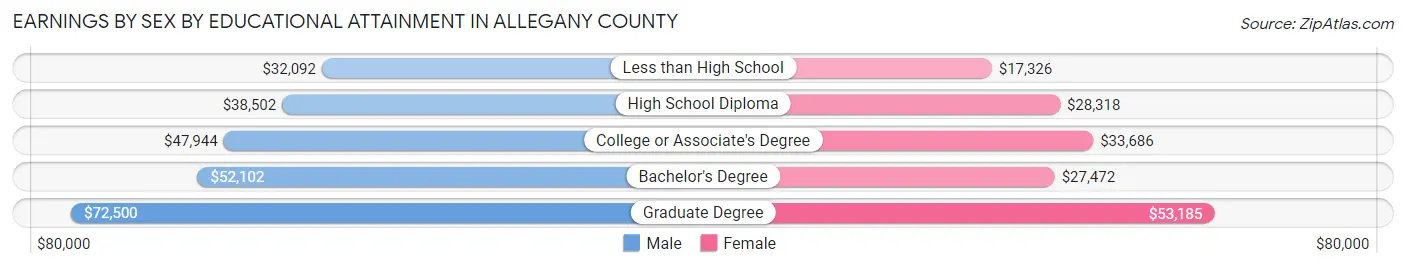
Earnings by Sex by Educational Attainment in Allegany County
Average earnings in Allegany County are $45,804 for men and $33,315 for women, a difference of 27.3%. Men with an educational attainment of graduate degree enjoy the highest average annual earnings of $72,500, while those with less than high school education earn the least with $32,092. Women with an educational attainment of graduate degree earn the most with the average annual earnings of $53,185, while those with less than high school education have the smallest earnings of $17,326.
| Educational Attainment | Male Income | Female Income |
| Less than High School | $32,092 | $17,326 |
| High School Diploma | $38,502 | $28,318 |
| College or Associate's Degree | $47,944 | $33,686 |
| Bachelor's Degree | $52,102 | $27,472 |
| Graduate Degree | $72,500 | $53,185 |
| Total | $45,804 | $33,315 |
Family Income in Allegany County
Family Income Brackets in Allegany County
According to the Allegany County family income data, there are 2,199 families falling into the $100,000 to $149,999 income range, which is the most common income bracket and makes up 20.8% of all families. Conversely, the $10,000 to $14,999 income bracket is the least frequent group with only 254 families (2.4%) belonging to this category.
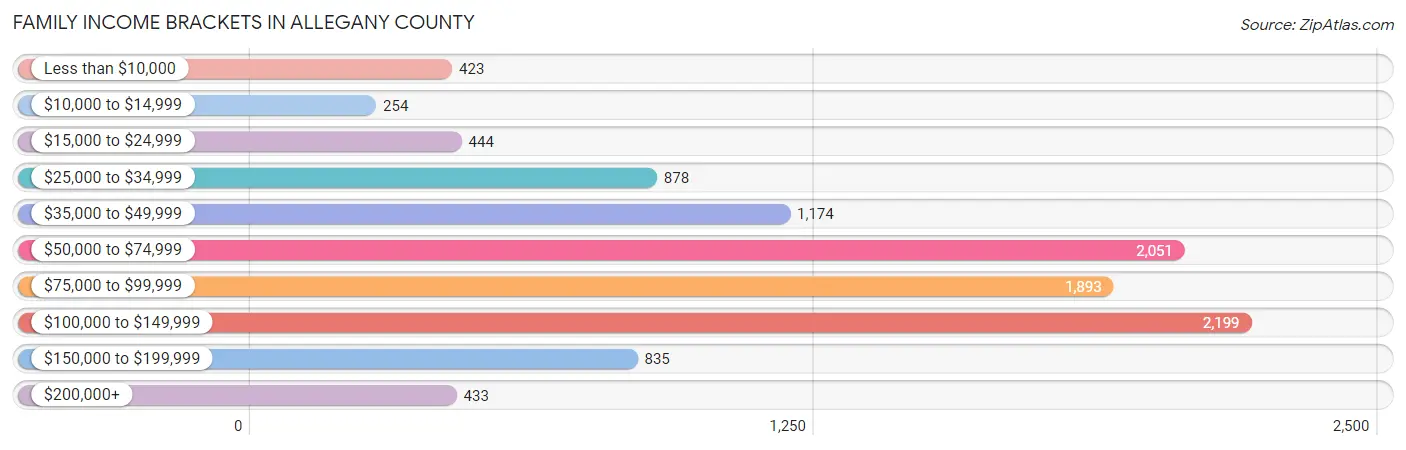
| Income Bracket | # Families | % Families |
| Less than $10,000 | 423 | 4.0% |
| $10,000 to $14,999 | 254 | 2.4% |
| $15,000 to $24,999 | 444 | 4.2% |
| $25,000 to $34,999 | 878 | 8.3% |
| $35,000 to $49,999 | 1,174 | 11.1% |
| $50,000 to $74,999 | 2,051 | 19.4% |
| $75,000 to $99,999 | 1,893 | 17.9% |
| $100,000 to $149,999 | 2,199 | 20.8% |
| $150,000 to $199,999 | 835 | 7.9% |
| $200,000+ | 433 | 4.1% |
Family Income by Famaliy Size in Allegany County
4-person families (1,719 | 16.3%) account for the highest median family income in Allegany County with $94,494 per family, while 2-person families (5,851 | 55.3%) have the highest median income of $35,310 per family member.
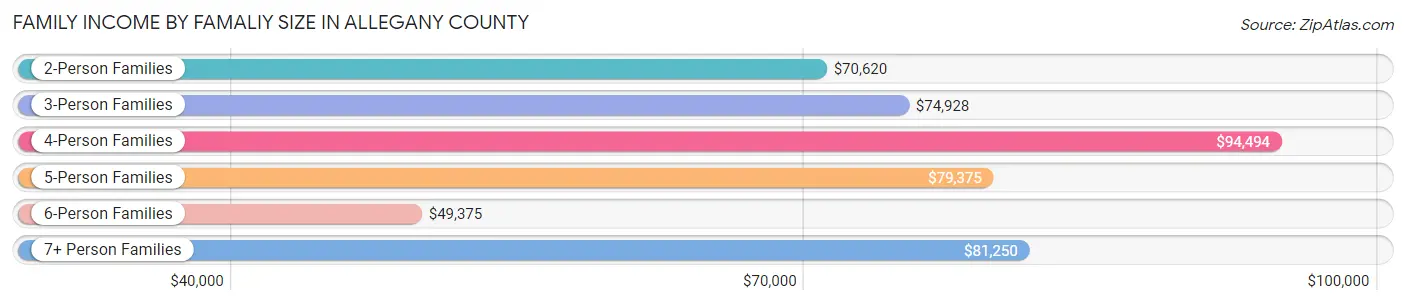
| Income Bracket | # Families | Median Income |
| 2-Person Families | 5,851 (55.3%) | $70,620 |
| 3-Person Families | 1,909 (18.1%) | $74,928 |
| 4-Person Families | 1,719 (16.3%) | $94,494 |
| 5-Person Families | 722 (6.8%) | $79,375 |
| 6-Person Families | 189 (1.8%) | $49,375 |
| 7+ Person Families | 183 (1.7%) | $81,250 |
| Total | 10,573 (100.0%) | $75,880 |
Family Income by Number of Earners in Allegany County
The median family income in Allegany County is $75,880, with families comprising 3+ earners (1,020) having the highest median family income of $116,324, while families with no earners (2,300) have the lowest median family income of $48,703, accounting for 9.7% and 21.7% of families, respectively.
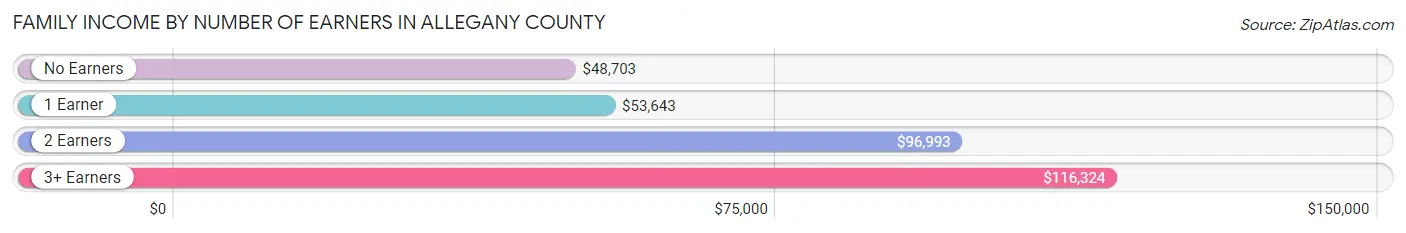
| Number of Earners | # Families | Median Income |
| No Earners | 2,300 (21.7%) | $48,703 |
| 1 Earner | 3,188 (30.1%) | $53,643 |
| 2 Earners | 4,065 (38.5%) | $96,993 |
| 3+ Earners | 1,020 (9.7%) | $116,324 |
| Total | 10,573 (100.0%) | $75,880 |
Household Income in Allegany County
Household Income Brackets in Allegany County
With 3,245 households falling in the category, the $50,000 to $74,999 income range is the most frequent in Allegany County, accounting for 19.3% of all households. In contrast, only 572 households (3.4%) fall into the $200,000+ income bracket, making it the least populous group.
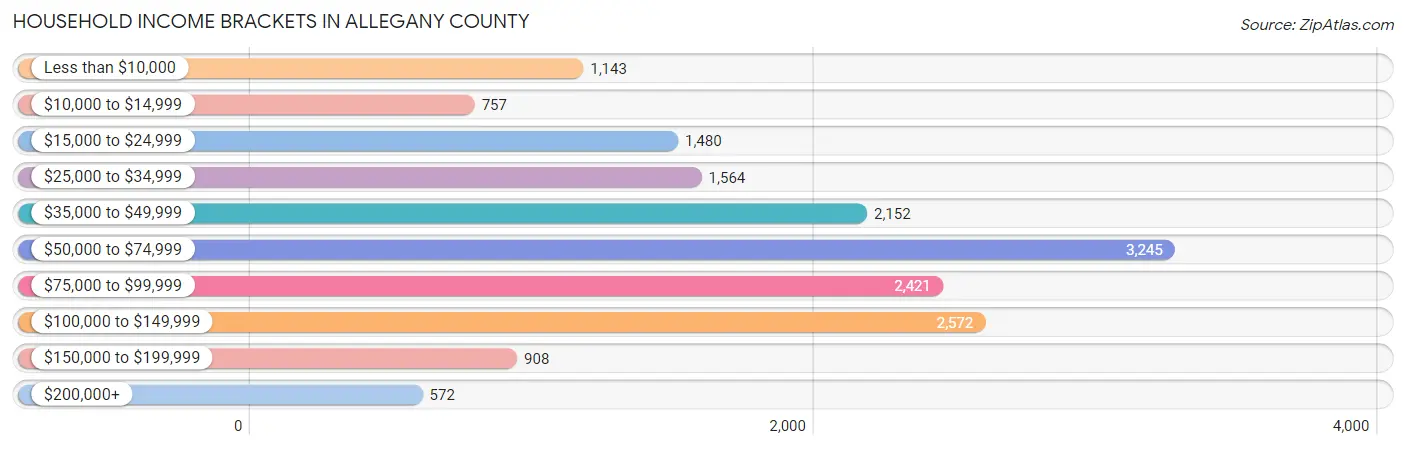
| Income Bracket | # Households | % Households |
| Less than $10,000 | 1,143 | 6.8% |
| $10,000 to $14,999 | 757 | 4.5% |
| $15,000 to $24,999 | 1,480 | 8.8% |
| $25,000 to $34,999 | 1,564 | 9.3% |
| $35,000 to $49,999 | 2,152 | 12.8% |
| $50,000 to $74,999 | 3,245 | 19.3% |
| $75,000 to $99,999 | 2,421 | 14.4% |
| $100,000 to $149,999 | 2,572 | 15.3% |
| $150,000 to $199,999 | 908 | 5.4% |
| $200,000+ | 572 | 3.4% |
Household Income by Householder Age in Allegany County
The median household income in Allegany County is $58,725, with the highest median household income of $68,621 found in the 25 to 44 years age bracket for the primary householder. A total of 4,152 households (24.7%) fall into this category. Meanwhile, the 15 to 24 years age bracket for the primary householder has the lowest median household income of $38,224, with 573 households (3.4%) in this group.
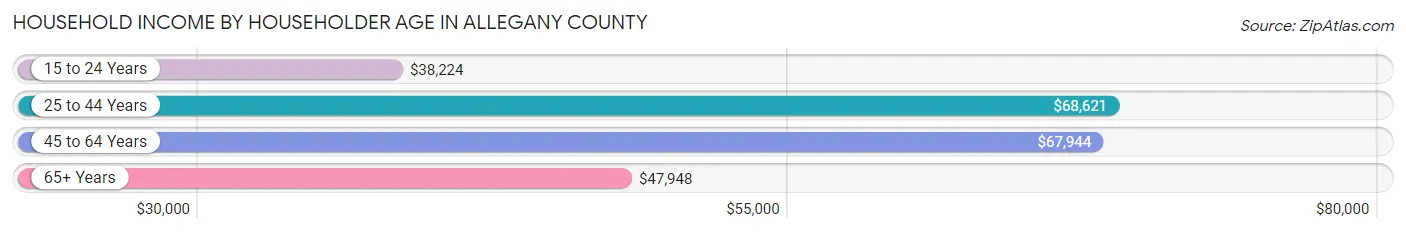
| Income Bracket | # Households | Median Income |
| 15 to 24 Years | 573 (3.4%) | $38,224 |
| 25 to 44 Years | 4,152 (24.7%) | $68,621 |
| 45 to 64 Years | 6,522 (38.8%) | $67,944 |
| 65+ Years | 5,566 (33.1%) | $47,948 |
| Total | 16,813 (100.0%) | $58,725 |
Poverty in Allegany County
Income Below Poverty by Sex and Age in Allegany County
With 16.4% poverty level for males and 17.7% for females among the residents of Allegany County, 6 to 11 year old males and 6 to 11 year old females are the most vulnerable to poverty, with 484 males (30.1%) and 392 females (29.4%) in their respective age groups living below the poverty level.
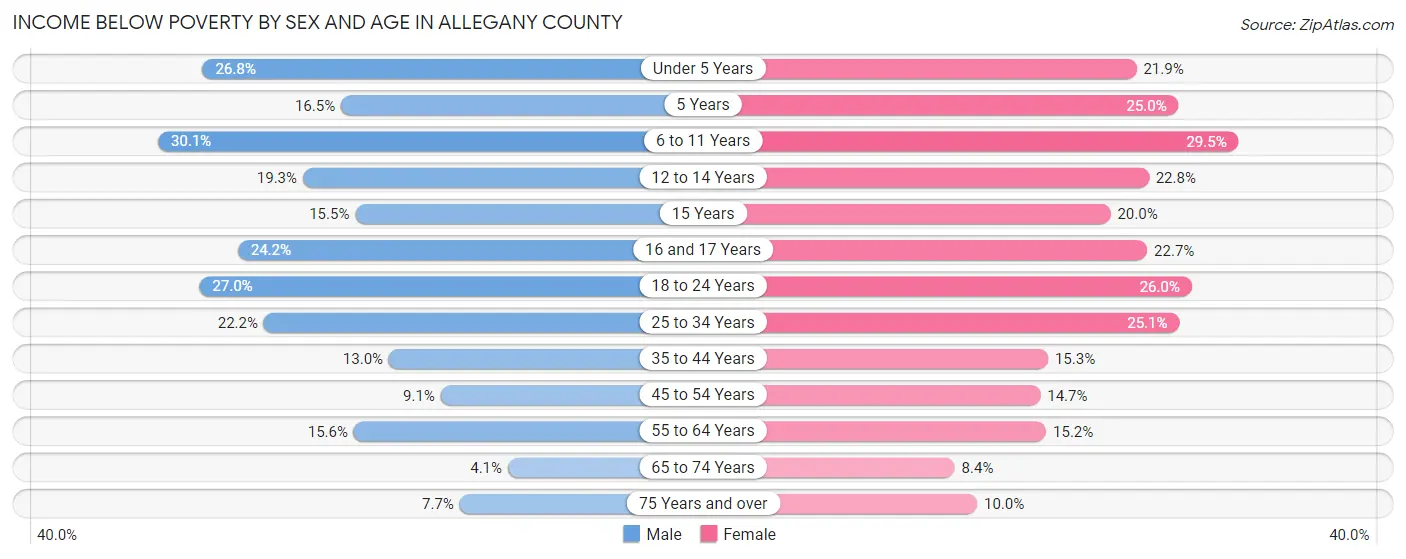
| Age Bracket | Male | Female |
| Under 5 Years | 303 (26.8%) | 249 (21.9%) |
| 5 Years | 35 (16.5%) | 33 (25.0%) |
| 6 to 11 Years | 484 (30.1%) | 392 (29.4%) |
| 12 to 14 Years | 159 (19.3%) | 214 (22.8%) |
| 15 Years | 36 (15.4%) | 73 (20.0%) |
| 16 and 17 Years | 152 (24.2%) | 95 (22.7%) |
| 18 to 24 Years | 576 (27.0%) | 476 (26.0%) |
| 25 to 34 Years | 501 (22.2%) | 541 (25.1%) |
| 35 to 44 Years | 301 (13.0%) | 352 (15.3%) |
| 45 to 54 Years | 229 (9.1%) | 368 (14.7%) |
| 55 to 64 Years | 516 (15.6%) | 505 (15.2%) |
| 65 to 74 Years | 110 (4.1%) | 221 (8.4%) |
| 75 Years and over | 124 (7.7%) | 191 (10.0%) |
| Total | 3,526 (16.4%) | 3,710 (17.7%) |
Income Above Poverty by Sex and Age in Allegany County
According to the poverty statistics in Allegany County, males aged 65 to 74 years and females aged 65 to 74 years are the age groups that are most secure financially, with 95.9% of males and 91.6% of females in these age groups living above the poverty line.
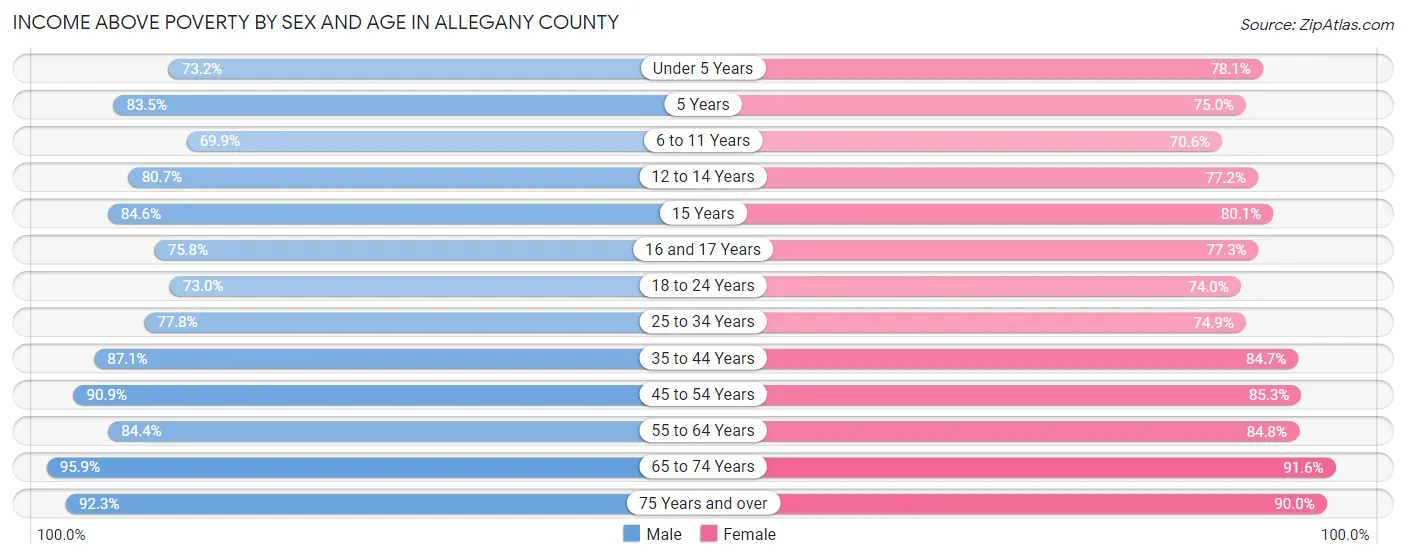
| Age Bracket | Male | Female |
| Under 5 Years | 828 (73.2%) | 889 (78.1%) |
| 5 Years | 177 (83.5%) | 99 (75.0%) |
| 6 to 11 Years | 1,124 (69.9%) | 939 (70.6%) |
| 12 to 14 Years | 663 (80.7%) | 725 (77.2%) |
| 15 Years | 197 (84.6%) | 293 (80.0%) |
| 16 and 17 Years | 477 (75.8%) | 324 (77.3%) |
| 18 to 24 Years | 1,556 (73.0%) | 1,356 (74.0%) |
| 25 to 34 Years | 1,752 (77.8%) | 1,618 (74.9%) |
| 35 to 44 Years | 2,023 (87.1%) | 1,947 (84.7%) |
| 45 to 54 Years | 2,284 (90.9%) | 2,128 (85.3%) |
| 55 to 64 Years | 2,801 (84.4%) | 2,824 (84.8%) |
| 65 to 74 Years | 2,562 (95.9%) | 2,415 (91.6%) |
| 75 Years and over | 1,486 (92.3%) | 1,711 (90.0%) |
| Total | 17,930 (83.6%) | 17,268 (82.3%) |
Income Below Poverty Among Married-Couple Families in Allegany County
The poverty statistics for married-couple families in Allegany County show that 5.6% or 478 of the total 8,540 families live below the poverty line. Families with 5 or more children have the highest poverty rate of 50.0%, comprising of 60 families. On the other hand, families with no children have the lowest poverty rate of 2.8%, which includes 156 families.
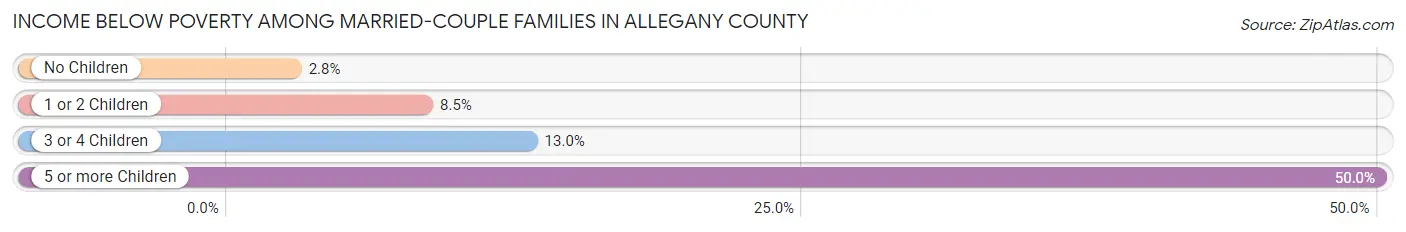
| Children | Above Poverty | Below Poverty |
| No Children | 5,466 (97.2%) | 156 (2.8%) |
| 1 or 2 Children | 2,069 (91.5%) | 192 (8.5%) |
| 3 or 4 Children | 467 (87.0%) | 70 (13.0%) |
| 5 or more Children | 60 (50.0%) | 60 (50.0%) |
| Total | 8,062 (94.4%) | 478 (5.6%) |
Income Below Poverty Among Single-Parent Households in Allegany County
According to the poverty data in Allegany County, 15.9% or 114 single-father households and 38.4% or 505 single-mother households are living below the poverty line. Among single-father households, those with 3 or 4 children have the highest poverty rate, with 41 households (59.4%) experiencing poverty. Likewise, among single-mother households, those with 5 or more children have the highest poverty rate, with 38 households (100.0%) falling below the poverty line.
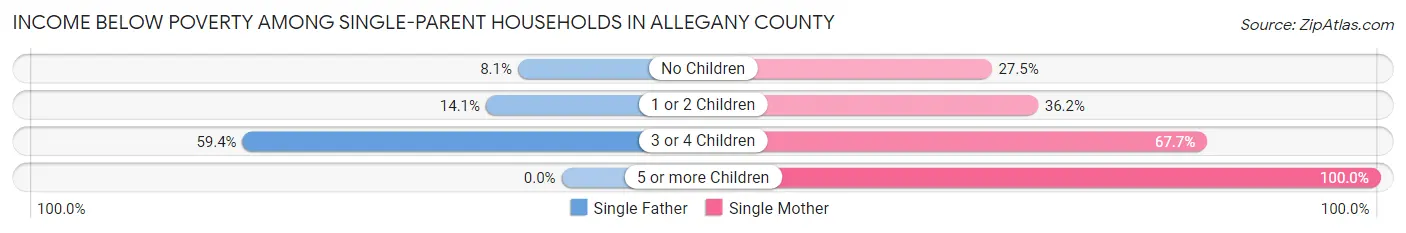
| Children | Single Father | Single Mother |
| No Children | 23 (8.1%) | 117 (27.5%) |
| 1 or 2 Children | 50 (14.1%) | 260 (36.2%) |
| 3 or 4 Children | 41 (59.4%) | 90 (67.7%) |
| 5 or more Children | 0 (0.0%) | 38 (100.0%) |
| Total | 114 (15.9%) | 505 (38.4%) |
Income Below Poverty Among Married-Couple vs Single-Parent Households in Allegany County
The poverty data for Allegany County shows that 478 of the married-couple family households (5.6%) and 619 of the single-parent households (30.4%) are living below the poverty level. Within the married-couple family households, those with 5 or more children have the highest poverty rate, with 60 households (50.0%) falling below the poverty line. Among the single-parent households, those with 5 or more children have the highest poverty rate, with 38 household (77.5%) living below poverty.
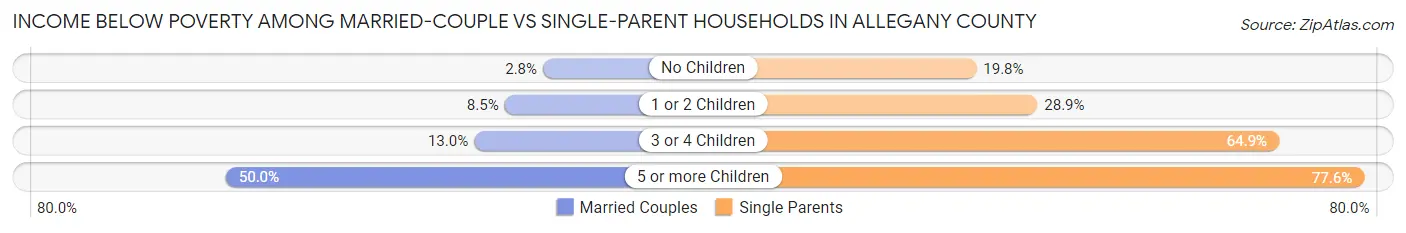
| Children | Married-Couple Families | Single-Parent Households |
| No Children | 156 (2.8%) | 140 (19.8%) |
| 1 or 2 Children | 192 (8.5%) | 310 (28.9%) |
| 3 or 4 Children | 70 (13.0%) | 131 (64.8%) |
| 5 or more Children | 60 (50.0%) | 38 (77.5%) |
| Total | 478 (5.6%) | 619 (30.4%) |
Race in Allegany County
The most populous races in Allegany County are White / Caucasian (44,575 | 94.4%), Two or more Races (1,034 | 2.2%), and Hispanic or Latino (886 | 1.9%).
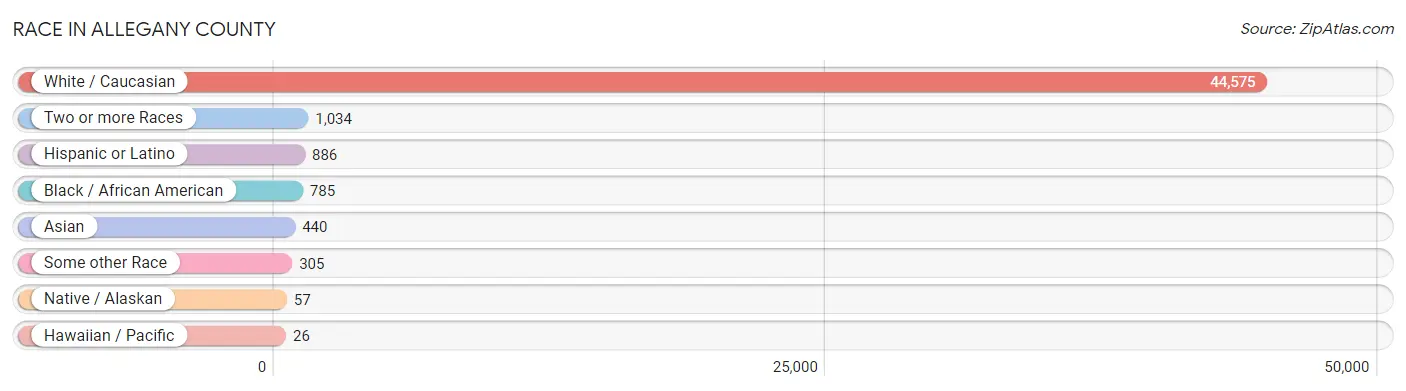
| Race | # Population | % Population |
| Asian | 440 | 0.9% |
| Black / African American | 785 | 1.7% |
| Hawaiian / Pacific | 26 | 0.1% |
| Hispanic or Latino | 886 | 1.9% |
| Native / Alaskan | 57 | 0.1% |
| White / Caucasian | 44,575 | 94.4% |
| Two or more Races | 1,034 | 2.2% |
| Some other Race | 305 | 0.6% |
| Total | 47,222 | 100.0% |
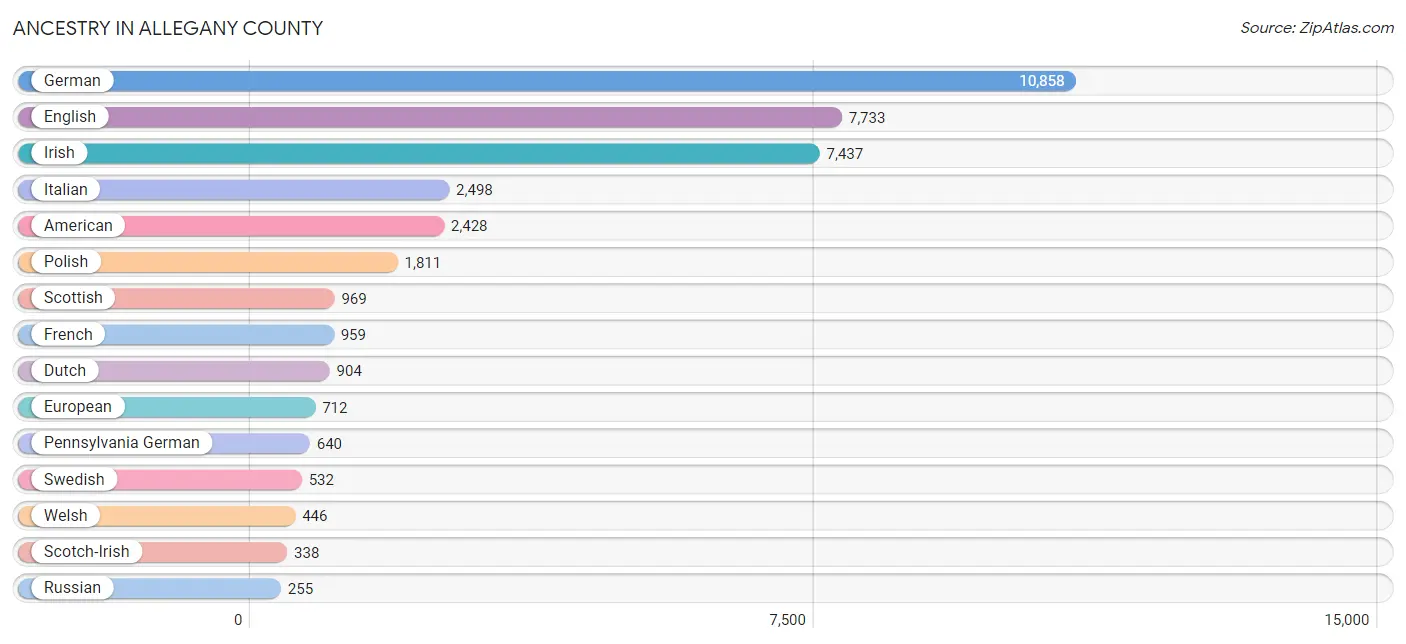
Ancestry in Allegany County
The most populous ancestries reported in Allegany County are German (10,858 | 23.0%), English (7,733 | 16.4%), Irish (7,437 | 15.8%), Italian (2,498 | 5.3%), and American (2,428 | 5.1%), together accounting for 65.6% of all Allegany County residents.
| Ancestry | # Population | % Population |
| African | 114 | 0.2% |
| Alsatian | 1 | 0.0% |
| American | 2,428 | 5.1% |
| Arab | 193 | 0.4% |
| Australian | 25 | 0.1% |
| Austrian | 99 | 0.2% |
| Barbadian | 7 | 0.0% |
| Belgian | 41 | 0.1% |
| Bhutanese | 192 | 0.4% |
| Blackfeet | 24 | 0.1% |
| Bolivian | 1 | 0.0% |
| Brazilian | 12 | 0.0% |
| British | 180 | 0.4% |
| British West Indian | 1 | 0.0% |
| Burmese | 65 | 0.1% |
| Canadian | 67 | 0.1% |
| Cape Verdean | 3 | 0.0% |
| Celtic | 4 | 0.0% |
| Central American | 50 | 0.1% |
| Central American Indian | 17 | 0.0% |
| Cherokee | 39 | 0.1% |
| Cheyenne | 2 | 0.0% |
| Colombian | 42 | 0.1% |
| Croatian | 64 | 0.1% |
| Crow | 2 | 0.0% |
| Cuban | 63 | 0.1% |
| Czech | 55 | 0.1% |
| Czechoslovakian | 37 | 0.1% |
| Danish | 83 | 0.2% |
| Dominican | 48 | 0.1% |
| Dutch | 904 | 1.9% |
| Eastern European | 127 | 0.3% |
| Ecuadorian | 35 | 0.1% |
| Egyptian | 37 | 0.1% |
| English | 7,733 | 16.4% |
| Estonian | 25 | 0.1% |
| European | 712 | 1.5% |
| Filipino | 9 | 0.0% |
| Finnish | 29 | 0.1% |
| French | 959 | 2.0% |
| French American Indian | 1 | 0.0% |
| French Canadian | 251 | 0.5% |
| German | 10,858 | 23.0% |
| Ghanaian | 5 | 0.0% |
| Greek | 77 | 0.2% |
| Guamanian / Chamorro | 18 | 0.0% |
| Guatemalan | 19 | 0.0% |
| Haitian | 5 | 0.0% |
| Honduran | 26 | 0.1% |
| Hungarian | 142 | 0.3% |
| Icelander | 2 | 0.0% |
| Indian (Asian) | 167 | 0.4% |
| Indonesian | 4 | 0.0% |
| Irish | 7,437 | 15.8% |
| Iroquois | 46 | 0.1% |
| Israeli | 10 | 0.0% |
| Italian | 2,498 | 5.3% |
| Jamaican | 25 | 0.1% |
| Korean | 121 | 0.3% |
| Lebanese | 67 | 0.1% |
| Lithuanian | 27 | 0.1% |
| Luxembourger | 3 | 0.0% |
| Malaysian | 17 | 0.0% |
| Mexican | 113 | 0.2% |
| Mongolian | 3 | 0.0% |
| Native Hawaiian | 5 | 0.0% |
| Nigerian | 6 | 0.0% |
| Northern European | 28 | 0.1% |
| Norwegian | 103 | 0.2% |
| Pakistani | 4 | 0.0% |
| Paraguayan | 10 | 0.0% |
| Pennsylvania German | 640 | 1.4% |
| Polish | 1,811 | 3.8% |
| Portuguese | 36 | 0.1% |
| Puerto Rican | 155 | 0.3% |
| Romanian | 3 | 0.0% |
| Russian | 255 | 0.5% |
| Salvadoran | 5 | 0.0% |
| Samoan | 8 | 0.0% |
| Scandinavian | 78 | 0.2% |
| Scotch-Irish | 338 | 0.7% |
| Scottish | 969 | 2.1% |
| Serbian | 11 | 0.0% |
| Sioux | 3 | 0.0% |
| Slavic | 26 | 0.1% |
| Slovak | 35 | 0.1% |
| Slovene | 5 | 0.0% |
| South American | 89 | 0.2% |
| Spaniard | 33 | 0.1% |
| Spanish | 8 | 0.0% |
| Sri Lankan | 62 | 0.1% |
| Subsaharan African | 136 | 0.3% |
| Swedish | 532 | 1.1% |
| Swiss | 233 | 0.5% |
| Syrian | 39 | 0.1% |
| Thai | 129 | 0.3% |
| Trinidadian and Tobagonian | 6 | 0.0% |
| Turkish | 2 | 0.0% |
| Ukrainian | 122 | 0.3% |
| Venezuelan | 1 | 0.0% |
| Welsh | 446 | 0.9% |
| West Indian | 18 | 0.0% |
| Yugoslavian | 9 | 0.0% | View All 103 Rows |
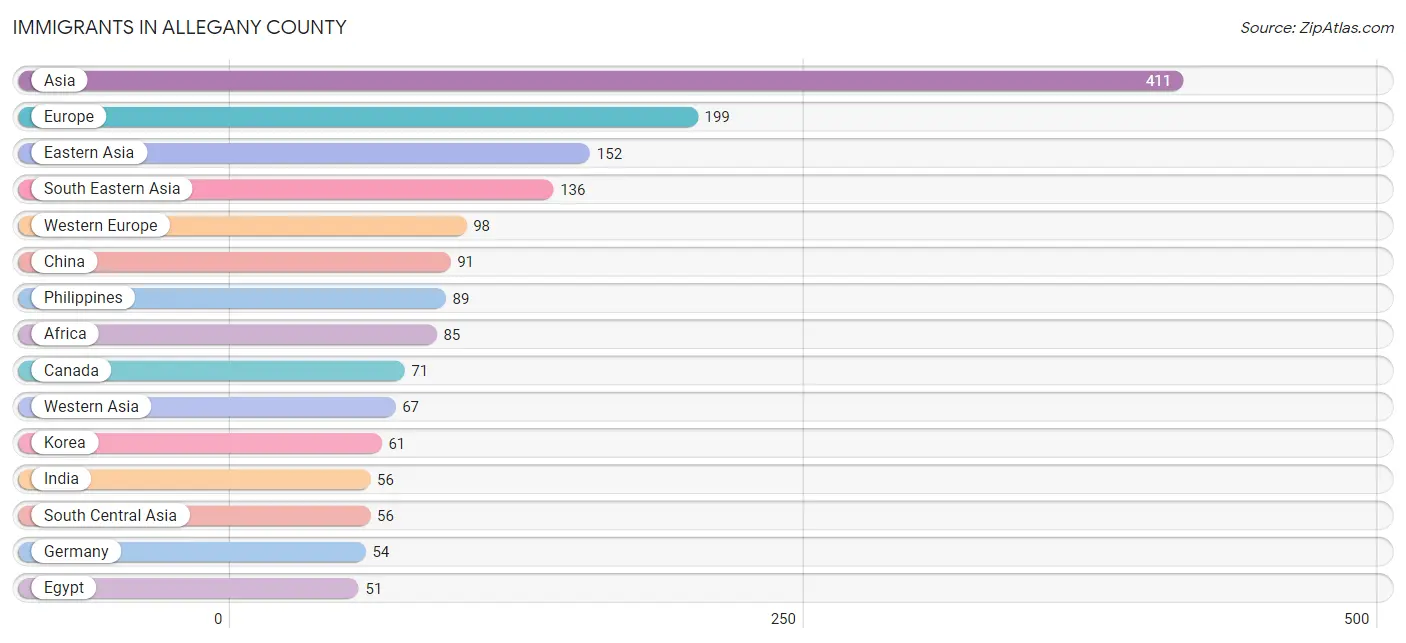
Immigrants in Allegany County
The most numerous immigrant groups reported in Allegany County came from Asia (411 | 0.9%), Europe (199 | 0.4%), Eastern Asia (152 | 0.3%), South Eastern Asia (136 | 0.3%), and Western Europe (98 | 0.2%), together accounting for 2.1% of all Allegany County residents.
| Immigration Origin | # Population | % Population |
| Africa | 85 | 0.2% |
| Asia | 411 | 0.9% |
| Austria | 6 | 0.0% |
| Canada | 71 | 0.2% |
| Caribbean | 31 | 0.1% |
| Central America | 10 | 0.0% |
| China | 91 | 0.2% |
| Cuba | 5 | 0.0% |
| Czechoslovakia | 11 | 0.0% |
| Dominican Republic | 3 | 0.0% |
| Eastern Africa | 3 | 0.0% |
| Eastern Asia | 152 | 0.3% |
| Eastern Europe | 39 | 0.1% |
| Ecuador | 4 | 0.0% |
| Egypt | 51 | 0.1% |
| El Salvador | 5 | 0.0% |
| England | 40 | 0.1% |
| Ethiopia | 1 | 0.0% |
| Europe | 199 | 0.4% |
| France | 30 | 0.1% |
| Germany | 54 | 0.1% |
| Ghana | 1 | 0.0% |
| Guatemala | 3 | 0.0% |
| Hong Kong | 6 | 0.0% |
| Hungary | 10 | 0.0% |
| India | 56 | 0.1% |
| Israel | 10 | 0.0% |
| Italy | 13 | 0.0% |
| Jamaica | 22 | 0.1% |
| Korea | 61 | 0.1% |
| Kuwait | 21 | 0.0% |
| Laos | 7 | 0.0% |
| Latin America | 46 | 0.1% |
| Latvia | 3 | 0.0% |
| Lebanon | 3 | 0.0% |
| Malaysia | 7 | 0.0% |
| Mexico | 2 | 0.0% |
| Middle Africa | 1 | 0.0% |
| Netherlands | 6 | 0.0% |
| Northern Africa | 51 | 0.1% |
| Northern Europe | 47 | 0.1% |
| Oceania | 9 | 0.0% |
| Philippines | 89 | 0.2% |
| Poland | 4 | 0.0% |
| Portugal | 2 | 0.0% |
| Romania | 3 | 0.0% |
| Saudi Arabia | 33 | 0.1% |
| South Africa | 9 | 0.0% |
| South America | 5 | 0.0% |
| South Central Asia | 56 | 0.1% |
| South Eastern Asia | 136 | 0.3% |
| Southern Europe | 15 | 0.0% |
| Switzerland | 2 | 0.0% |
| Taiwan | 8 | 0.0% |
| Thailand | 4 | 0.0% |
| Ukraine | 5 | 0.0% |
| Venezuela | 1 | 0.0% |
| Vietnam | 21 | 0.0% |
| West Indies | 1 | 0.0% |
| Western Africa | 18 | 0.0% |
| Western Asia | 67 | 0.1% |
| Western Europe | 98 | 0.2% |
| Zaire | 1 | 0.0% | View All 63 Rows |
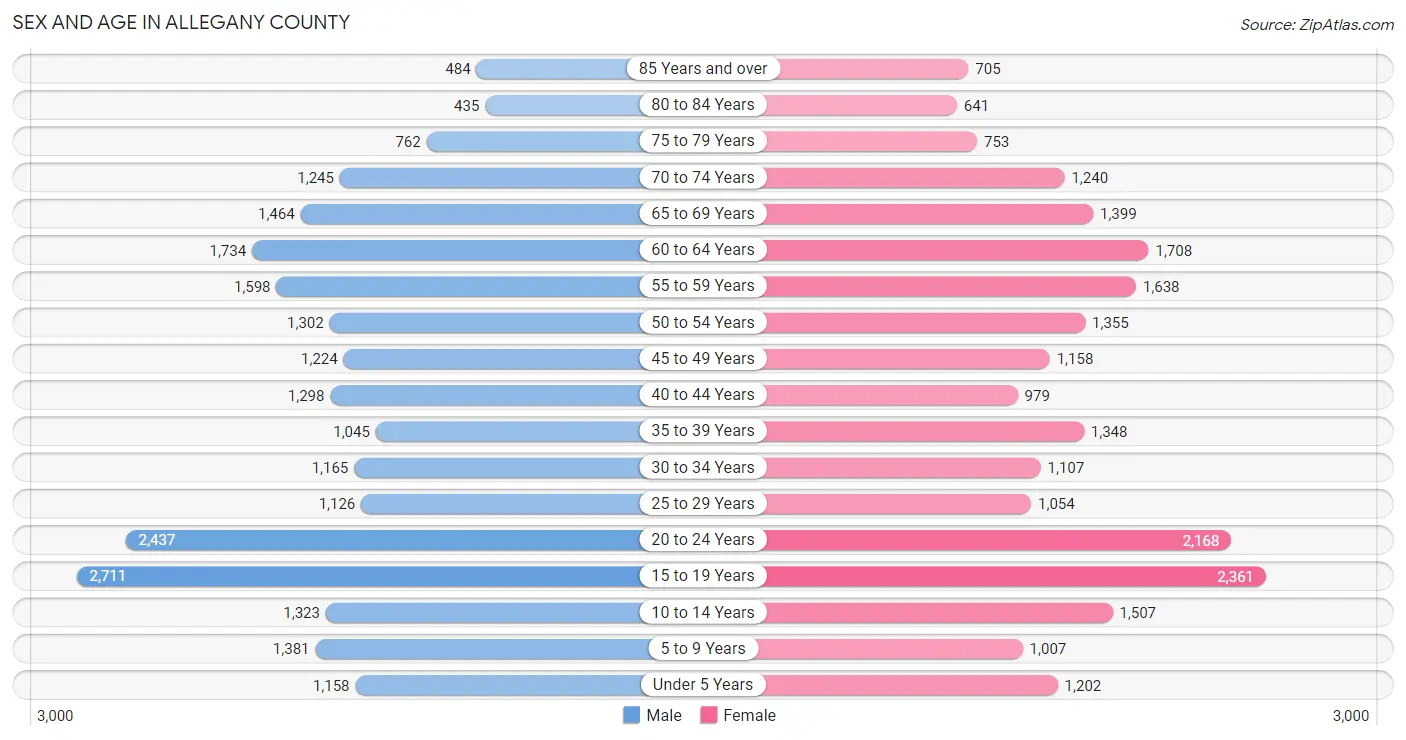
Sex and Age in Allegany County
Sex and Age in Allegany County
The most populous age groups in Allegany County are 15 to 19 Years (2,711 | 11.4%) for men and 15 to 19 Years (2,361 | 10.1%) for women.
| Age Bracket | Male | Female |
| Under 5 Years | 1,158 (4.9%) | 1,202 (5.1%) |
| 5 to 9 Years | 1,381 (5.8%) | 1,007 (4.3%) |
| 10 to 14 Years | 1,323 (5.5%) | 1,507 (6.5%) |
| 15 to 19 Years | 2,711 (11.4%) | 2,361 (10.1%) |
| 20 to 24 Years | 2,437 (10.2%) | 2,168 (9.3%) |
| 25 to 29 Years | 1,126 (4.7%) | 1,054 (4.5%) |
| 30 to 34 Years | 1,165 (4.9%) | 1,107 (4.7%) |
| 35 to 39 Years | 1,045 (4.4%) | 1,348 (5.8%) |
| 40 to 44 Years | 1,298 (5.4%) | 979 (4.2%) |
| 45 to 49 Years | 1,224 (5.1%) | 1,158 (5.0%) |
| 50 to 54 Years | 1,302 (5.4%) | 1,355 (5.8%) |
| 55 to 59 Years | 1,598 (6.7%) | 1,638 (7.0%) |
| 60 to 64 Years | 1,734 (7.3%) | 1,708 (7.3%) |
| 65 to 69 Years | 1,464 (6.1%) | 1,399 (6.0%) |
| 70 to 74 Years | 1,245 (5.2%) | 1,240 (5.3%) |
| 75 to 79 Years | 762 (3.2%) | 753 (3.2%) |
| 80 to 84 Years | 435 (1.8%) | 641 (2.8%) |
| 85 Years and over | 484 (2.0%) | 705 (3.0%) |
| Total | 23,892 (100.0%) | 23,330 (100.0%) |
Families and Households in Allegany County
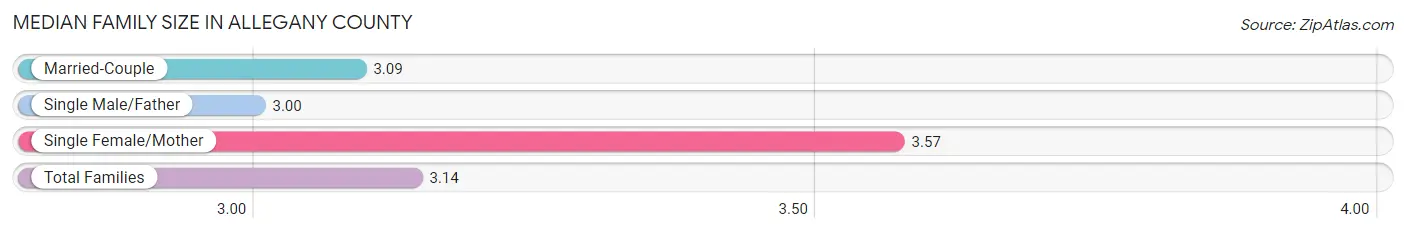
Median Family Size in Allegany County
The median family size in Allegany County is 3.14 persons per family, with single female/mother families (1,315 | 12.4%) accounting for the largest median family size of 3.57 persons per family. On the other hand, single male/father families (718 | 6.8%) represent the smallest median family size with 3.00 persons per family.
| Family Type | # Families | Family Size |
| Married-Couple | 8,540 (80.8%) | 3.09 |
| Single Male/Father | 718 (6.8%) | 3.00 |
| Single Female/Mother | 1,315 (12.4%) | 3.57 |
| Total Families | 10,573 (100.0%) | 3.14 |
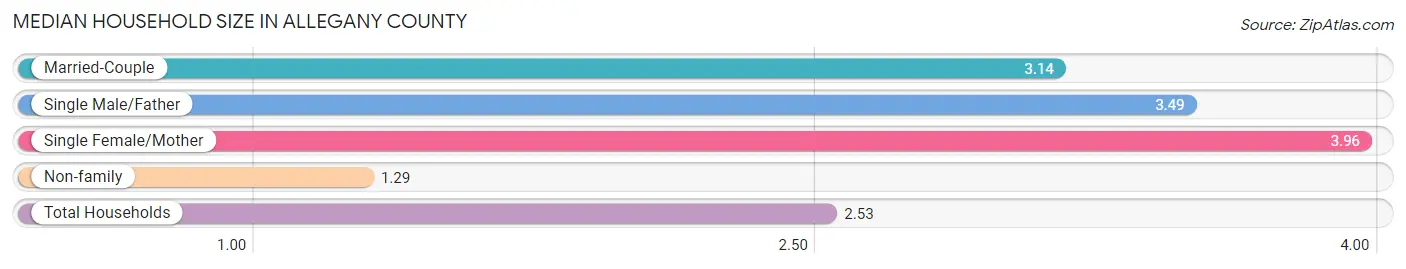
Median Household Size in Allegany County
The median household size in Allegany County is 2.53 persons per household, with single female/mother households (1,315 | 7.8%) accounting for the largest median household size of 3.96 persons per household. non-family households (6,240 | 37.1%) represent the smallest median household size with 1.29 persons per household.
| Household Type | # Households | Household Size |
| Married-Couple | 8,540 (50.8%) | 3.14 |
| Single Male/Father | 718 (4.3%) | 3.49 |
| Single Female/Mother | 1,315 (7.8%) | 3.96 |
| Non-family | 6,240 (37.1%) | 1.29 |
| Total Households | 16,813 (100.0%) | 2.53 |
Household Size by Marriage Status in Allegany County
Out of a total of 16,813 households in Allegany County, 10,573 (62.9%) are family households, while 6,240 (37.1%) are nonfamily households. The most numerous type of family households are 2-person households, comprising 5,531, and the most common type of nonfamily households are 1-person households, comprising 5,208.
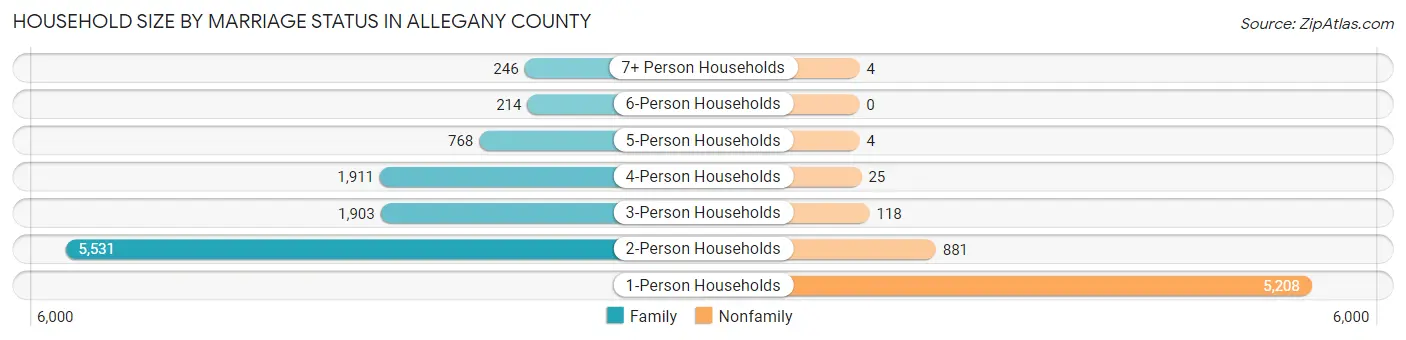
| Household Size | Family Households | Nonfamily Households |
| 1-Person Households | - | 5,208 (31.0%) |
| 2-Person Households | 5,531 (32.9%) | 881 (5.2%) |
| 3-Person Households | 1,903 (11.3%) | 118 (0.7%) |
| 4-Person Households | 1,911 (11.4%) | 25 (0.2%) |
| 5-Person Households | 768 (4.6%) | 4 (0.0%) |
| 6-Person Households | 214 (1.3%) | 0 (0.0%) |
| 7+ Person Households | 246 (1.5%) | 4 (0.0%) |
| Total | 10,573 (62.9%) | 6,240 (37.1%) |
Female Fertility in Allegany County
Fertility by Age in Allegany County
Average fertility rate in Allegany County is 48.0 births per 1,000 women. Women in the age bracket of 20 to 34 years have the highest fertility rate with 88.0 births per 1,000 women. Women in the age bracket of 20 to 34 years acount for 77.4% of all women with births.
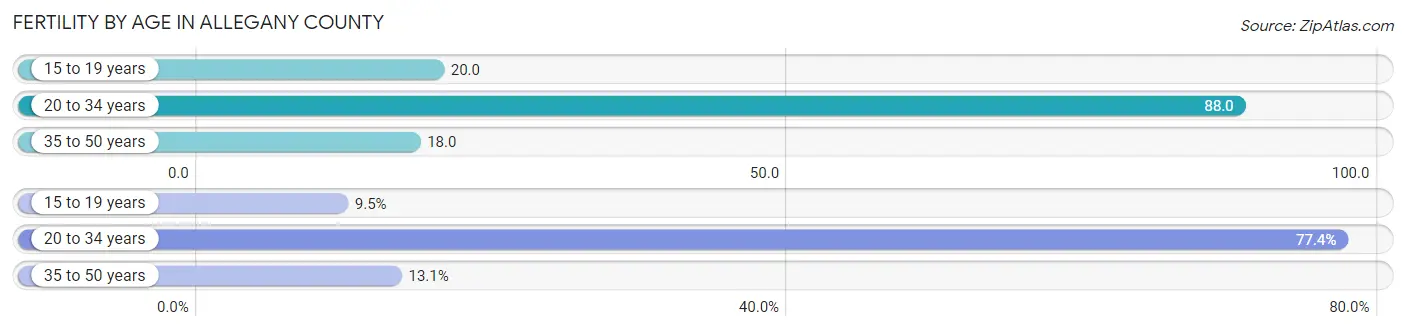
| Age Bracket | Women with Births | Births / 1,000 Women |
| 15 to 19 years | 47 (9.5%) | 20.0 |
| 20 to 34 years | 383 (77.4%) | 88.0 |
| 35 to 50 years | 65 (13.1%) | 18.0 |
| Total | 495 (100.0%) | 48.0 |
Fertility by Age by Marriage Status in Allegany County
60.8% of women with births (495) in Allegany County are married. The highest percentage of unmarried women with births falls into 15 to 19 years age bracket with 100.0% of them unmarried at the time of birth, while the lowest percentage of unmarried women with births belong to 20 to 34 years age bracket with 31.1% of them unmarried.
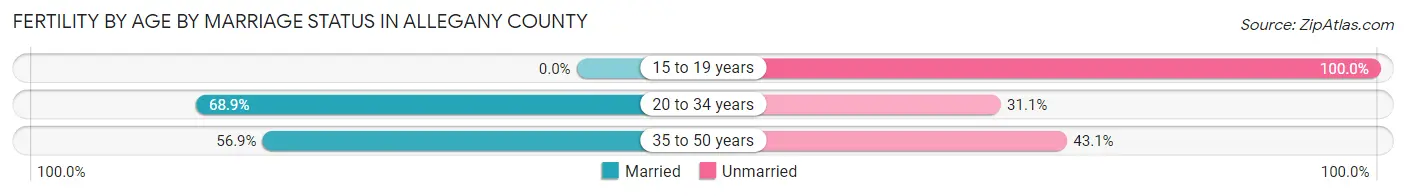
| Age Bracket | Married | Unmarried |
| 15 to 19 years | 0 (0.0%) | 47 (100.0%) |
| 20 to 34 years | 264 (68.9%) | 119 (31.1%) |
| 35 to 50 years | 37 (56.9%) | 28 (43.1%) |
| Total | 301 (60.8%) | 194 (39.2%) |
Fertility by Education in Allegany County
Average fertility rate in Allegany County is 48.0 births per 1,000 women. Women with the education attainment of less than high school have the highest fertility rate of 108.0 births per 1,000 women, while women with the education attainment of high school diploma have the lowest fertility at 21.0 births per 1,000 women. Women with the education attainment of less than high school represent 30.9% of all women with births.
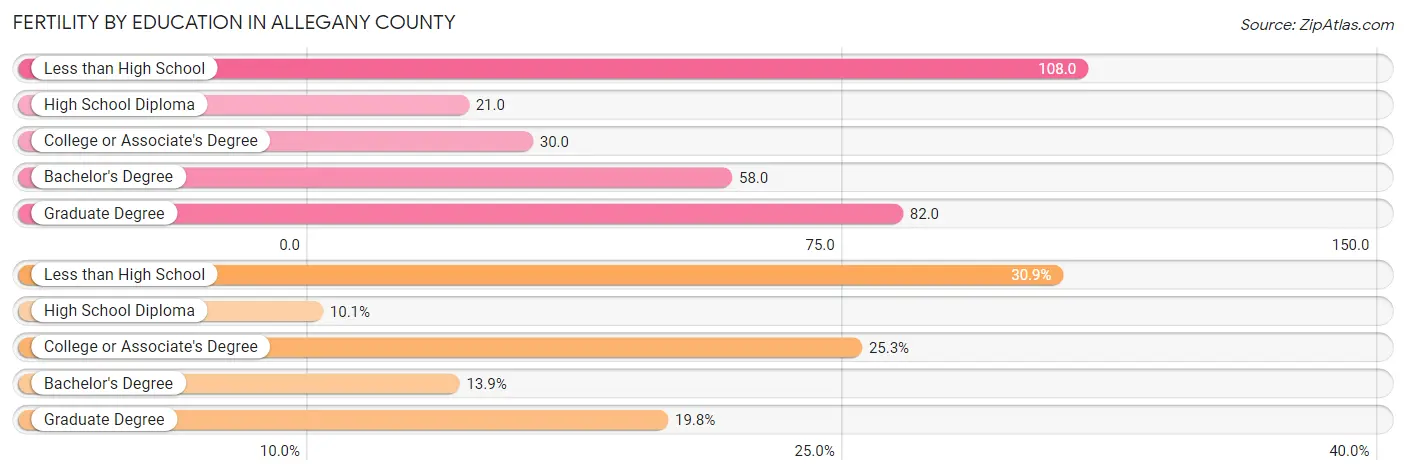
| Educational Attainment | Women with Births | Births / 1,000 Women |
| Less than High School | 153 (30.9%) | 108.0 |
| High School Diploma | 50 (10.1%) | 21.0 |
| College or Associate's Degree | 125 (25.3%) | 30.0 |
| Bachelor's Degree | 69 (13.9%) | 58.0 |
| Graduate Degree | 98 (19.8%) | 82.0 |
| Total | 495 (100.0%) | 48.0 |
Fertility by Education by Marriage Status in Allegany County
39.2% of women with births in Allegany County are unmarried. Women with the educational attainment of graduate degree are most likely to be married with 75.5% of them married at childbirth, while women with the educational attainment of high school diploma are least likely to be married with 54.0% of them unmarried at childbirth.
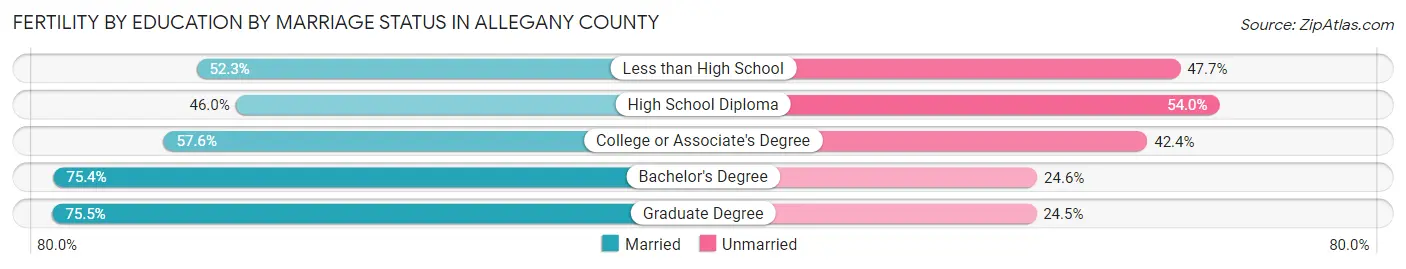
| Educational Attainment | Married | Unmarried |
| Less than High School | 80 (52.3%) | 73 (47.7%) |
| High School Diploma | 23 (46.0%) | 27 (54.0%) |
| College or Associate's Degree | 72 (57.6%) | 53 (42.4%) |
| Bachelor's Degree | 52 (75.4%) | 17 (24.6%) |
| Graduate Degree | 74 (75.5%) | 24 (24.5%) |
| Total | 301 (60.8%) | 194 (39.2%) |
Employment Characteristics in Allegany County
Employment by Class of Employer in Allegany County
Among the 18,985 employed individuals in Allegany County, private company employees (10,296 | 54.2%), not-for-profit organizations (2,603 | 13.7%), and local government employees (2,585 | 13.6%) make up the most common classes of employment.
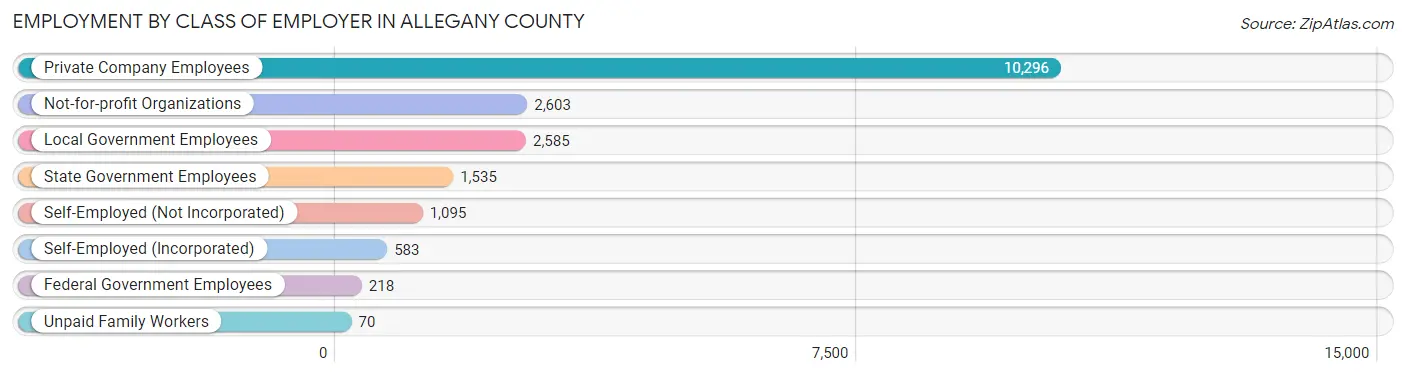
| Employer Class | # Employees | % Employees |
| Private Company Employees | 10,296 | 54.2% |
| Self-Employed (Incorporated) | 583 | 3.1% |
| Self-Employed (Not Incorporated) | 1,095 | 5.8% |
| Not-for-profit Organizations | 2,603 | 13.7% |
| Local Government Employees | 2,585 | 13.6% |
| State Government Employees | 1,535 | 8.1% |
| Federal Government Employees | 218 | 1.1% |
| Unpaid Family Workers | 70 | 0.4% |
| Total | 18,985 | 100.0% |
Employment Status by Age in Allegany County
According to the labor force statistics for Allegany County, out of the total population over 16 years of age (39,045), 54.2% or 21,162 individuals are in the labor force, with 7.3% or 1,545 of them unemployed. The age group with the highest labor force participation rate is 30 to 34 years, with 83.5% or 1,897 individuals in the labor force. Within the labor force, the 16 to 19 years age range has the highest percentage of unemployed individuals, with 15.2% or 233 of them being unemployed.
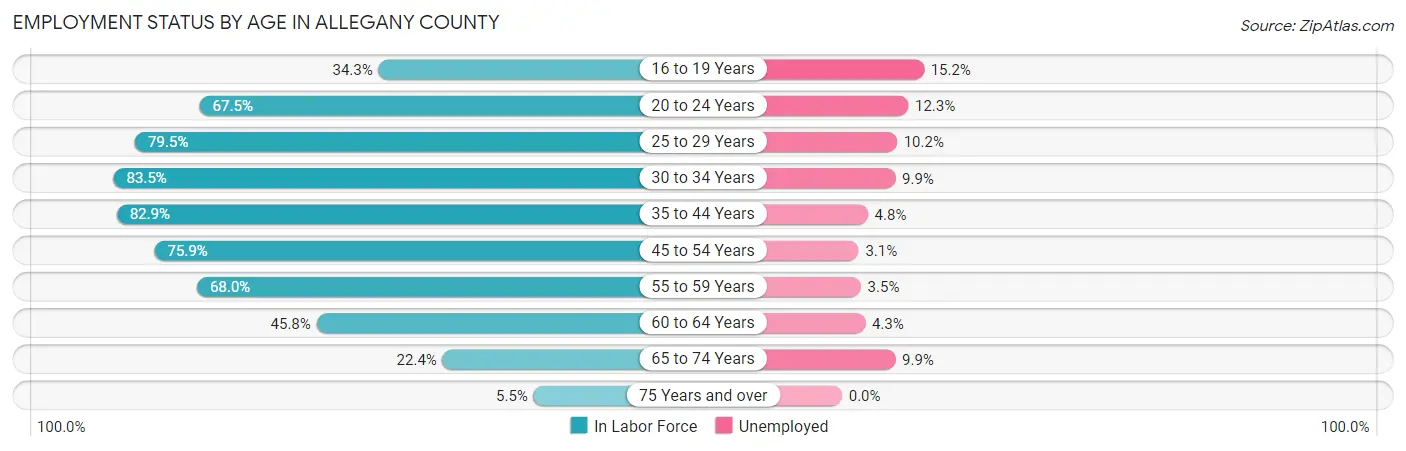
| Age Bracket | In Labor Force | Unemployed |
| 16 to 19 Years | 1,534 (34.3%) | 233 (15.2%) |
| 20 to 24 Years | 3,108 (67.5%) | 382 (12.3%) |
| 25 to 29 Years | 1,733 (79.5%) | 177 (10.2%) |
| 30 to 34 Years | 1,897 (83.5%) | 188 (9.9%) |
| 35 to 44 Years | 3,871 (82.9%) | 186 (4.8%) |
| 45 to 54 Years | 3,825 (75.9%) | 119 (3.1%) |
| 55 to 59 Years | 2,200 (68.0%) | 77 (3.5%) |
| 60 to 64 Years | 1,576 (45.8%) | 68 (4.3%) |
| 65 to 74 Years | 1,198 (22.4%) | 119 (9.9%) |
| 75 Years and over | 208 (5.5%) | 0 (0.0%) |
| Total | 21,162 (54.2%) | 1,545 (7.3%) |
Employment Status by Educational Attainment in Allegany County
According to labor force statistics for Allegany County, 72.5% of individuals (15,108) out of the total population between 25 and 64 years of age (20,839) are in the labor force, with 5.4% or 816 of them being unemployed. The group with the highest labor force participation rate are those with the educational attainment of bachelor's degree or higher, with 87.4% or 4,430 individuals in the labor force. Within the labor force, individuals with high school diploma education have the highest percentage of unemployment, with 9.8% or 431 of them being unemployed.
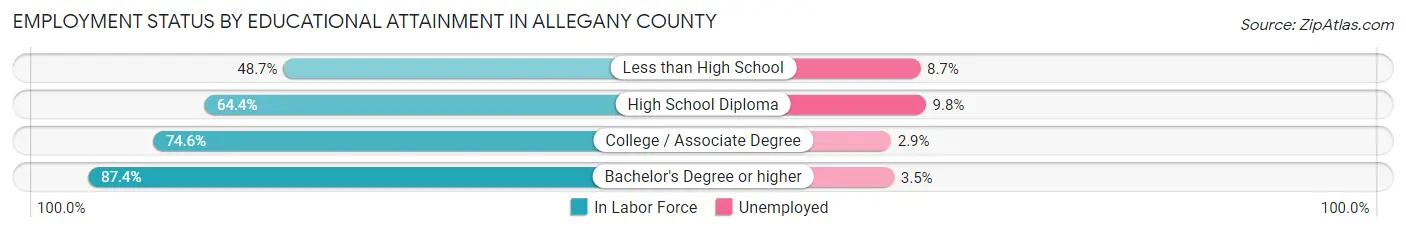
| Educational Attainment | In Labor Force | Unemployed |
| Less than High School | 759 (48.7%) | 136 (8.7%) |
| High School Diploma | 4,400 (64.4%) | 670 (9.8%) |
| College / Associate Degree | 5,505 (74.6%) | 214 (2.9%) |
| Bachelor's Degree or higher | 4,430 (87.4%) | 177 (3.5%) |
| Total | 15,108 (72.5%) | 1,125 (5.4%) |
Employment Occupations by Sex in Allegany County
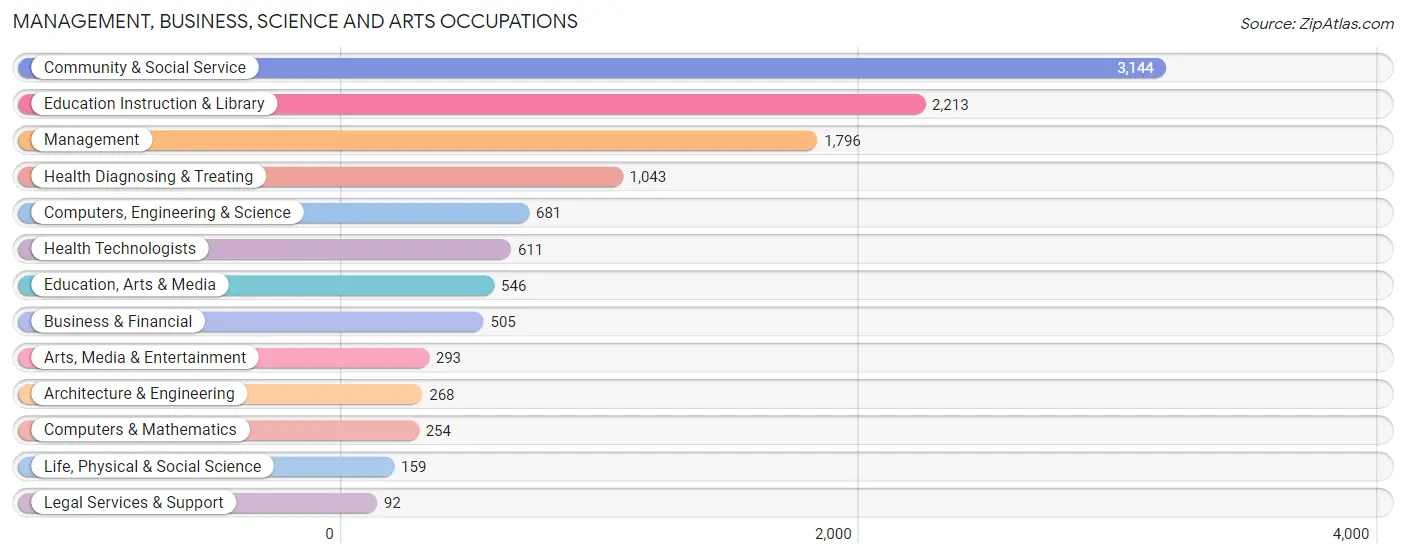
Management, Business, Science and Arts Occupations
The most common Management, Business, Science and Arts occupations in Allegany County are Community & Social Service (3,144 | 16.0%), Education Instruction & Library (2,213 | 11.3%), Management (1,796 | 9.2%), Health Diagnosing & Treating (1,043 | 5.3%), and Computers, Engineering & Science (681 | 3.5%).
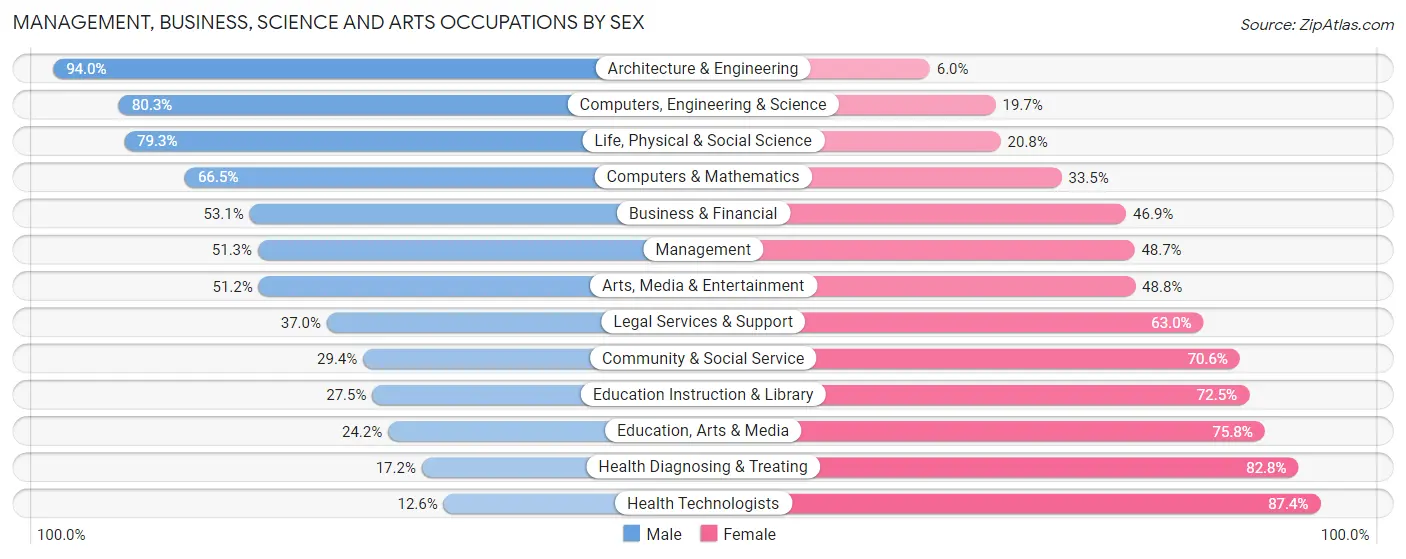
Management, Business, Science and Arts Occupations by Sex
Within the Management, Business, Science and Arts occupations in Allegany County, the most male-oriented occupations are Architecture & Engineering (94.0%), Computers, Engineering & Science (80.3%), and Life, Physical & Social Science (79.2%), while the most female-oriented occupations are Health Technologists (87.4%), Health Diagnosing & Treating (82.8%), and Education, Arts & Media (75.8%).
| Occupation | Male | Female |
| Management | 922 (51.3%) | 874 (48.7%) |
| Business & Financial | 268 (53.1%) | 237 (46.9%) |
| Computers, Engineering & Science | 547 (80.3%) | 134 (19.7%) |
| Computers & Mathematics | 169 (66.5%) | 85 (33.5%) |
| Architecture & Engineering | 252 (94.0%) | 16 (6.0%) |
| Life, Physical & Social Science | 126 (79.2%) | 33 (20.7%) |
| Community & Social Service | 924 (29.4%) | 2,220 (70.6%) |
| Education, Arts & Media | 132 (24.2%) | 414 (75.8%) |
| Legal Services & Support | 34 (37.0%) | 58 (63.0%) |
| Education Instruction & Library | 608 (27.5%) | 1,605 (72.5%) |
| Arts, Media & Entertainment | 150 (51.2%) | 143 (48.8%) |
| Health Diagnosing & Treating | 179 (17.2%) | 864 (82.8%) |
| Health Technologists | 77 (12.6%) | 534 (87.4%) |
| Total (Category) | 2,840 (39.6%) | 4,329 (60.4%) |
| Total (Overall) | 10,113 (51.6%) | 9,482 (48.4%) |
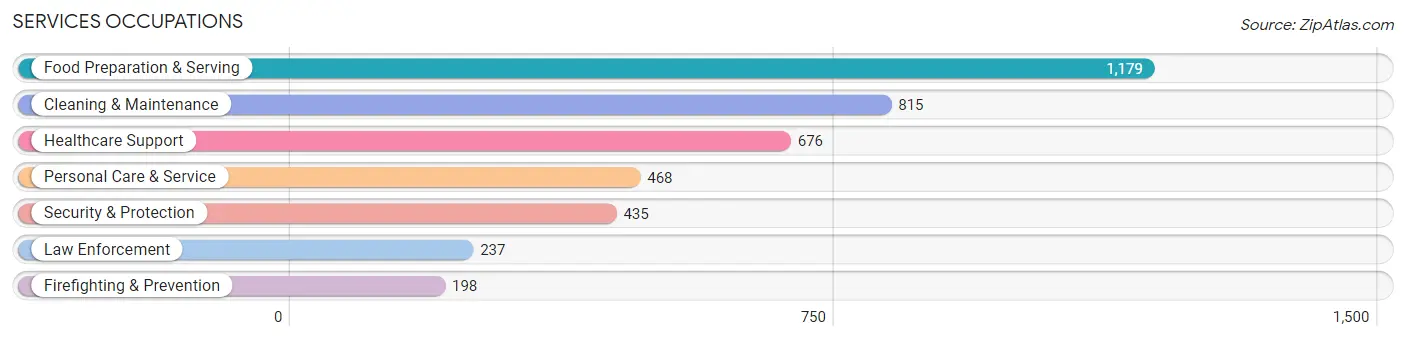
Services Occupations
The most common Services occupations in Allegany County are Food Preparation & Serving (1,179 | 6.0%), Cleaning & Maintenance (815 | 4.2%), Healthcare Support (676 | 3.5%), Personal Care & Service (468 | 2.4%), and Security & Protection (435 | 2.2%).
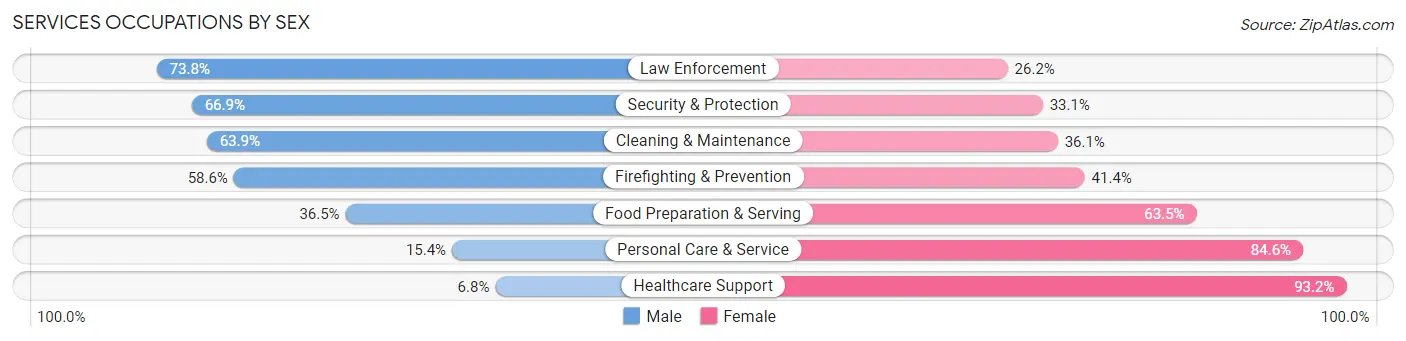
Services Occupations by Sex
Within the Services occupations in Allegany County, the most male-oriented occupations are Law Enforcement (73.8%), Security & Protection (66.9%), and Cleaning & Maintenance (63.9%), while the most female-oriented occupations are Healthcare Support (93.2%), Personal Care & Service (84.6%), and Food Preparation & Serving (63.5%).
| Occupation | Male | Female |
| Healthcare Support | 46 (6.8%) | 630 (93.2%) |
| Security & Protection | 291 (66.9%) | 144 (33.1%) |
| Firefighting & Prevention | 116 (58.6%) | 82 (41.4%) |
| Law Enforcement | 175 (73.8%) | 62 (26.2%) |
| Food Preparation & Serving | 430 (36.5%) | 749 (63.5%) |
| Cleaning & Maintenance | 521 (63.9%) | 294 (36.1%) |
| Personal Care & Service | 72 (15.4%) | 396 (84.6%) |
| Total (Category) | 1,360 (38.1%) | 2,213 (61.9%) |
| Total (Overall) | 10,113 (51.6%) | 9,482 (48.4%) |
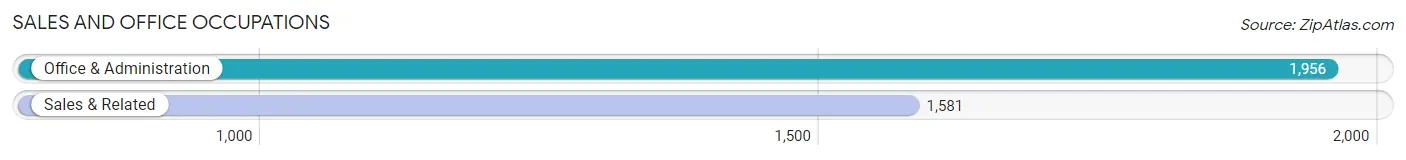
Sales and Office Occupations
The most common Sales and Office occupations in Allegany County are Office & Administration (1,956 | 10.0%), and Sales & Related (1,581 | 8.1%).
Sales and Office Occupations by Sex

| Occupation | Male | Female |
| Sales & Related | 786 (49.7%) | 795 (50.3%) |
| Office & Administration | 384 (19.6%) | 1,572 (80.4%) |
| Total (Category) | 1,170 (33.1%) | 2,367 (66.9%) |
| Total (Overall) | 10,113 (51.6%) | 9,482 (48.4%) |
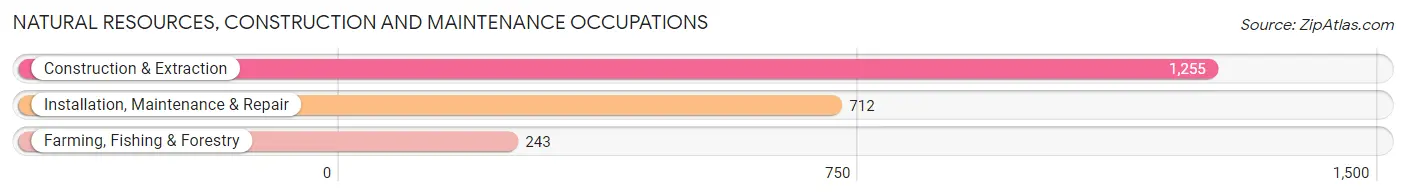
Natural Resources, Construction and Maintenance Occupations
The most common Natural Resources, Construction and Maintenance occupations in Allegany County are Construction & Extraction (1,255 | 6.4%), Installation, Maintenance & Repair (712 | 3.6%), and Farming, Fishing & Forestry (243 | 1.2%).
Natural Resources, Construction and Maintenance Occupations by Sex
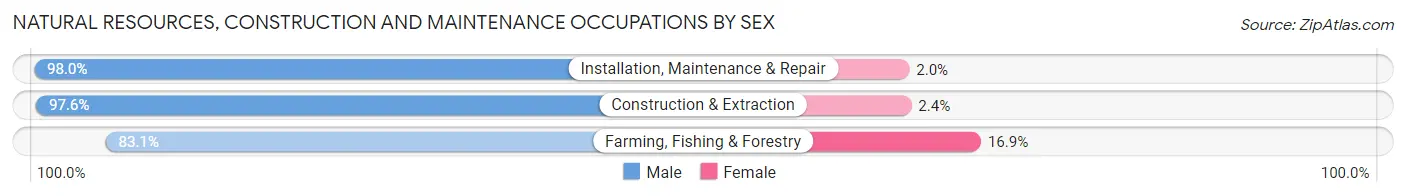
| Occupation | Male | Female |
| Farming, Fishing & Forestry | 202 (83.1%) | 41 (16.9%) |
| Construction & Extraction | 1,225 (97.6%) | 30 (2.4%) |
| Installation, Maintenance & Repair | 698 (98.0%) | 14 (2.0%) |
| Total (Category) | 2,125 (96.2%) | 85 (3.8%) |
| Total (Overall) | 10,113 (51.6%) | 9,482 (48.4%) |
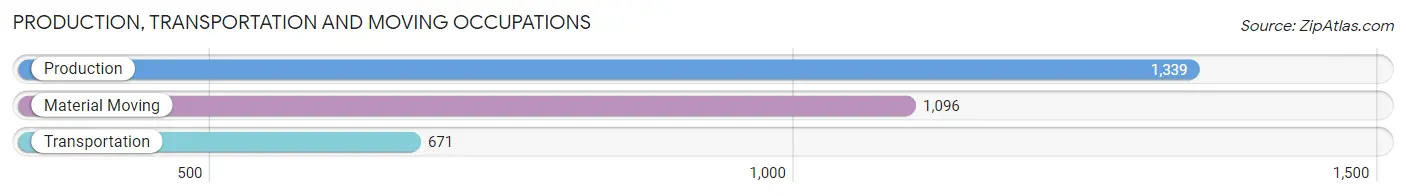
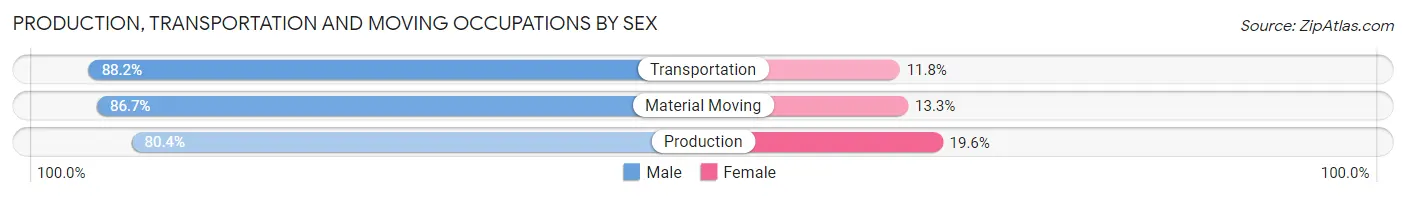
Production, Transportation and Moving Occupations
The most common Production, Transportation and Moving occupations in Allegany County are Production (1,339 | 6.8%), Material Moving (1,096 | 5.6%), and Transportation (671 | 3.4%).
Production, Transportation and Moving Occupations by Sex
| Occupation | Male | Female |
| Production | 1,076 (80.4%) | 263 (19.6%) |
| Transportation | 592 (88.2%) | 79 (11.8%) |
| Material Moving | 950 (86.7%) | 146 (13.3%) |
| Total (Category) | 2,618 (84.3%) | 488 (15.7%) |
| Total (Overall) | 10,113 (51.6%) | 9,482 (48.4%) |
Employment Industries by Sex in Allegany County
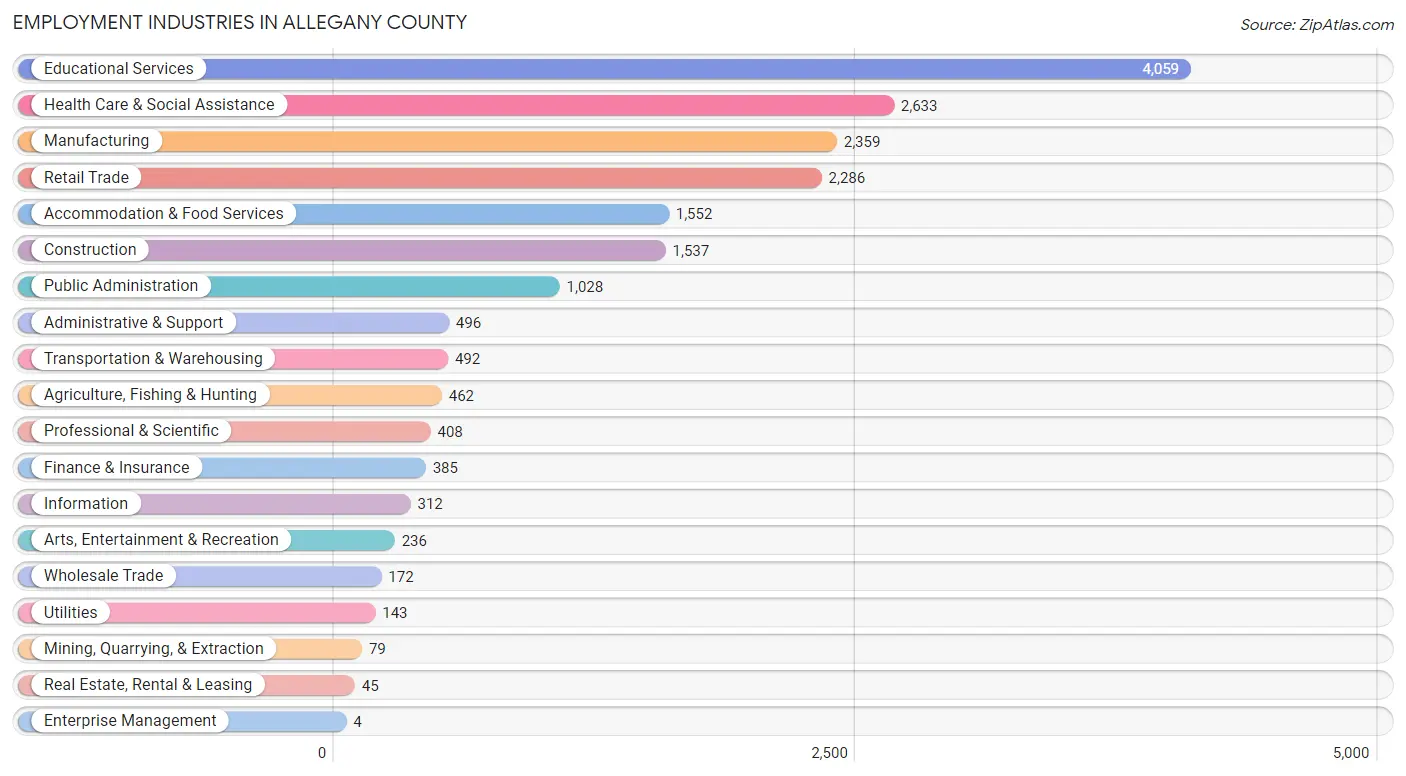
Employment Industries in Allegany County
The major employment industries in Allegany County include Educational Services (4,059 | 20.7%), Health Care & Social Assistance (2,633 | 13.4%), Manufacturing (2,359 | 12.0%), Retail Trade (2,286 | 11.7%), and Accommodation & Food Services (1,552 | 7.9%).
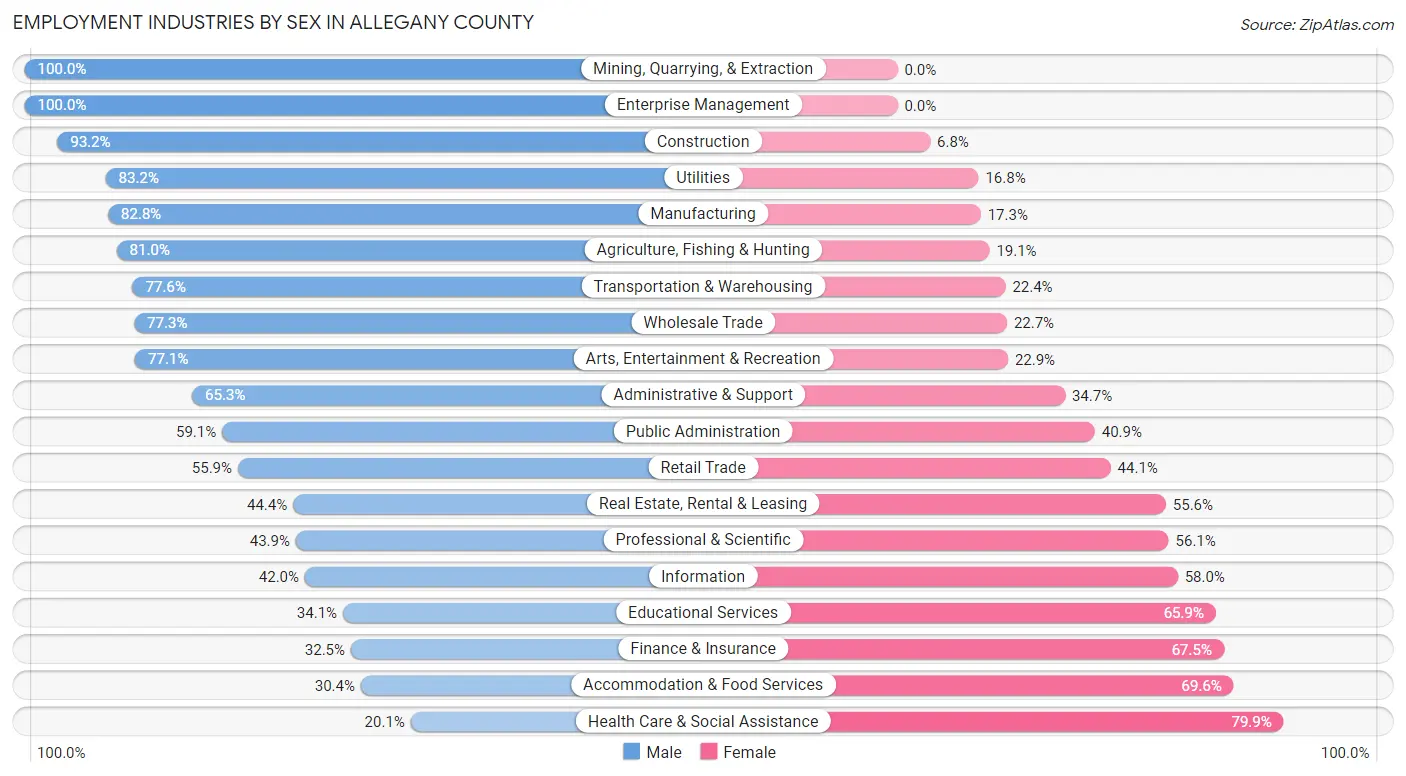
Employment Industries by Sex in Allegany County
The Allegany County industries that see more men than women are Mining, Quarrying, & Extraction (100.0%), Enterprise Management (100.0%), and Construction (93.2%), whereas the industries that tend to have a higher number of women are Health Care & Social Assistance (79.9%), Accommodation & Food Services (69.6%), and Finance & Insurance (67.5%).
| Industry | Male | Female |
| Agriculture, Fishing & Hunting | 374 (80.9%) | 88 (19.1%) |
| Mining, Quarrying, & Extraction | 79 (100.0%) | 0 (0.0%) |
| Construction | 1,433 (93.2%) | 104 (6.8%) |
| Manufacturing | 1,952 (82.8%) | 407 (17.2%) |
| Wholesale Trade | 133 (77.3%) | 39 (22.7%) |
| Retail Trade | 1,277 (55.9%) | 1,009 (44.1%) |
| Transportation & Warehousing | 382 (77.6%) | 110 (22.4%) |
| Utilities | 119 (83.2%) | 24 (16.8%) |
| Information | 131 (42.0%) | 181 (58.0%) |
| Finance & Insurance | 125 (32.5%) | 260 (67.5%) |
| Real Estate, Rental & Leasing | 20 (44.4%) | 25 (55.6%) |
| Professional & Scientific | 179 (43.9%) | 229 (56.1%) |
| Enterprise Management | 4 (100.0%) | 0 (0.0%) |
| Administrative & Support | 324 (65.3%) | 172 (34.7%) |
| Educational Services | 1,385 (34.1%) | 2,674 (65.9%) |
| Health Care & Social Assistance | 529 (20.1%) | 2,104 (79.9%) |
| Arts, Entertainment & Recreation | 182 (77.1%) | 54 (22.9%) |
| Accommodation & Food Services | 472 (30.4%) | 1,080 (69.6%) |
| Public Administration | 608 (59.1%) | 420 (40.9%) |
| Total | 10,113 (51.6%) | 9,482 (48.4%) |
Education in Allegany County
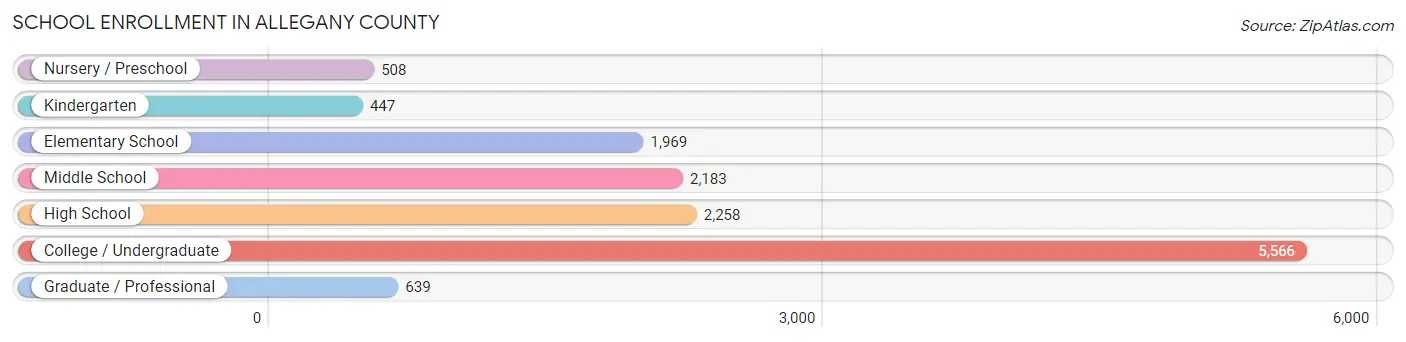
School Enrollment in Allegany County
The most common levels of schooling among the 13,570 students in Allegany County are college / undergraduate (5,566 | 41.0%), high school (2,258 | 16.6%), and middle school (2,183 | 16.1%).
| School Level | # Students | % Students |
| Nursery / Preschool | 508 | 3.7% |
| Kindergarten | 447 | 3.3% |
| Elementary School | 1,969 | 14.5% |
| Middle School | 2,183 | 16.1% |
| High School | 2,258 | 16.6% |
| College / Undergraduate | 5,566 | 41.0% |
| Graduate / Professional | 639 | 4.7% |
| Total | 13,570 | 100.0% |
School Enrollment by Age by Funding Source in Allegany County
Out of a total of 13,570 students who are enrolled in schools in Allegany County, 3,867 (28.5%) attend a private institution, while the remaining 9,703 (71.5%) are enrolled in public schools. The age group of 25 to 34 year olds has the highest likelihood of being enrolled in private schools, with 291 (69.1% in the age bracket) enrolled. Conversely, the age group of 15 to 17 year olds has the lowest likelihood of being enrolled in a private school, with 1,450 (90.9% in the age bracket) attending a public institution.
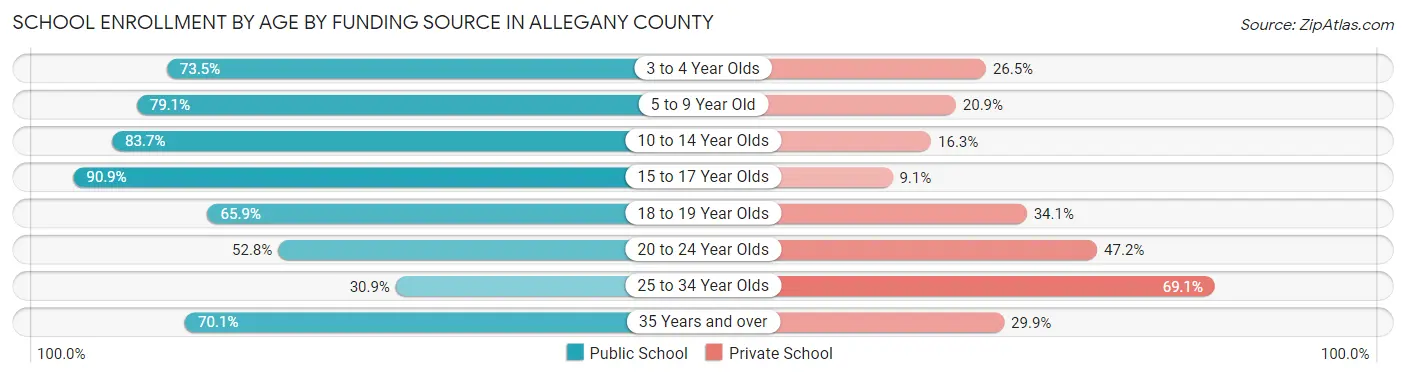
| Age Bracket | Public School | Private School |
| 3 to 4 Year Olds | 344 (73.5%) | 124 (26.5%) |
| 5 to 9 Year Old | 1,805 (79.1%) | 477 (20.9%) |
| 10 to 14 Year Olds | 2,282 (83.7%) | 444 (16.3%) |
| 15 to 17 Year Olds | 1,450 (90.9%) | 145 (9.1%) |
| 18 to 19 Year Olds | 2,023 (65.9%) | 1,047 (34.1%) |
| 20 to 24 Year Olds | 1,337 (52.8%) | 1,196 (47.2%) |
| 25 to 34 Year Olds | 130 (30.9%) | 291 (69.1%) |
| 35 Years and over | 333 (70.1%) | 142 (29.9%) |
| Total | 9,703 (71.5%) | 3,867 (28.5%) |
Educational Attainment by Field of Study in Allegany County
Education (1,896 | 23.9%), business (1,079 | 13.6%), bio, nature & agricultural (767 | 9.7%), science & technology (631 | 8.0%), and engineering (470 | 5.9%) are the most common fields of study among 7,937 individuals in Allegany County who have obtained a bachelor's degree or higher.
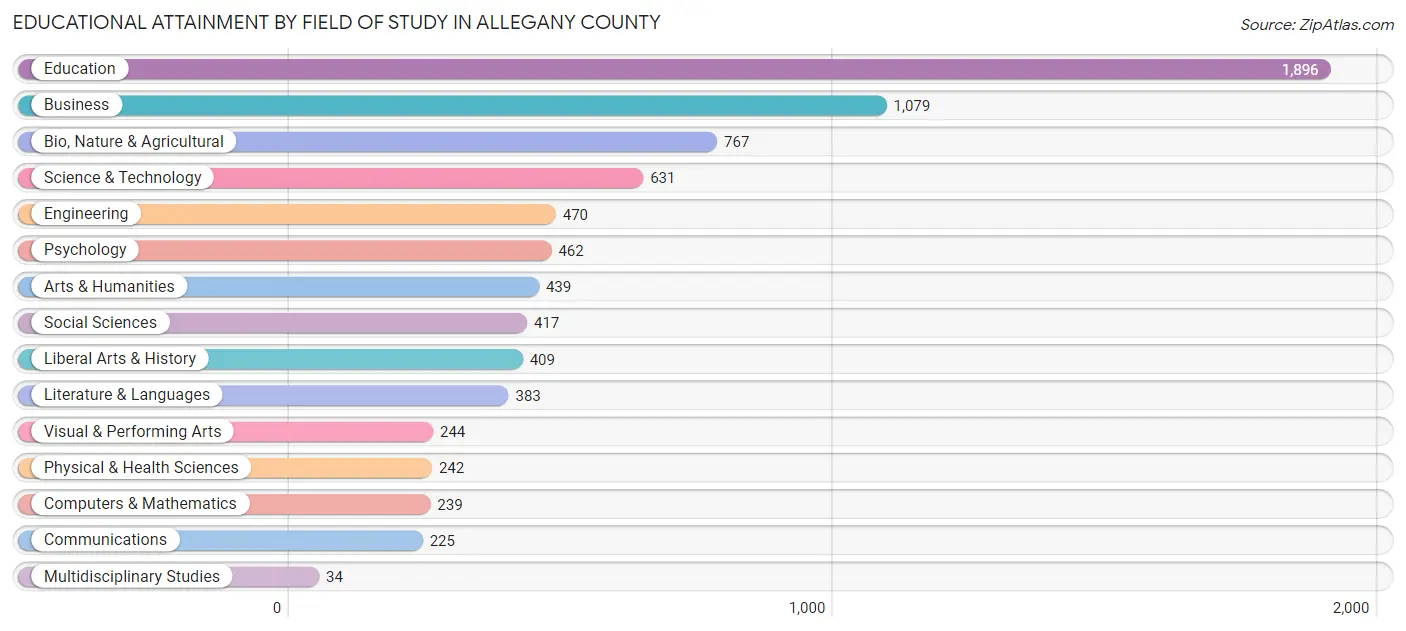
| Field of Study | # Graduates | % Graduates |
| Computers & Mathematics | 239 | 3.0% |
| Bio, Nature & Agricultural | 767 | 9.7% |
| Physical & Health Sciences | 242 | 3.0% |
| Psychology | 462 | 5.8% |
| Social Sciences | 417 | 5.2% |
| Engineering | 470 | 5.9% |
| Multidisciplinary Studies | 34 | 0.4% |
| Science & Technology | 631 | 8.0% |
| Business | 1,079 | 13.6% |
| Education | 1,896 | 23.9% |
| Literature & Languages | 383 | 4.8% |
| Liberal Arts & History | 409 | 5.1% |
| Visual & Performing Arts | 244 | 3.1% |
| Communications | 225 | 2.8% |
| Arts & Humanities | 439 | 5.5% |
| Total | 7,937 | 100.0% |
Transportation & Commute in Allegany County
Vehicle Availability by Sex in Allegany County
The most prevalent vehicle ownership categories in Allegany County are males with 2 vehicles (4,388, accounting for 46.7%) and females with 2 vehicles (4,076, making up 51.6%).
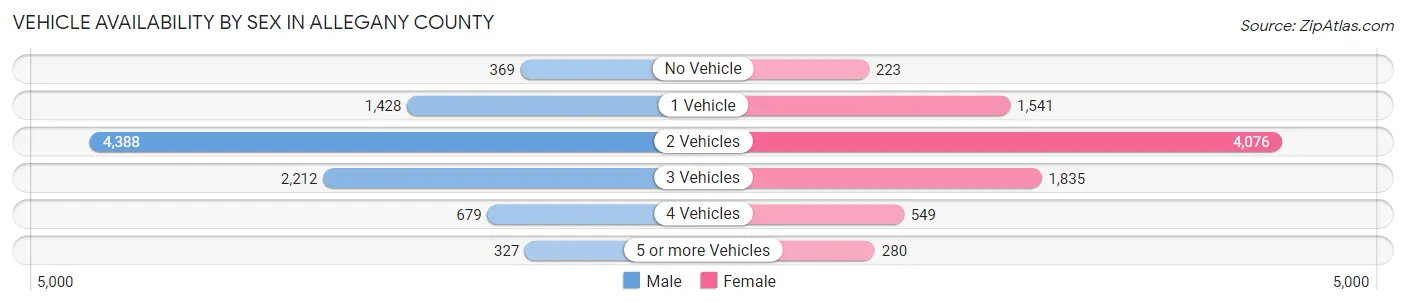
| Vehicles Available | Male | Female |
| No Vehicle | 369 (3.9%) | 223 (2.6%) |
| 1 Vehicle | 1,428 (15.2%) | 1,541 (18.1%) |
| 2 Vehicles | 4,388 (46.7%) | 4,076 (47.9%) |
| 3 Vehicles | 2,212 (23.5%) | 1,835 (21.6%) |
| 4 Vehicles | 679 (7.2%) | 549 (6.5%) |
| 5 or more Vehicles | 327 (3.5%) | 280 (3.3%) |
| Total | 9,403 (100.0%) | 8,504 (100.0%) |
Commute Time in Allegany County
The most frequently occuring commute durations in Allegany County are 5 to 9 minutes (3,329 commuters, 18.7%), 10 to 14 minutes (2,610 commuters, 14.6%), and 15 to 19 minutes (2,077 commuters, 11.7%).
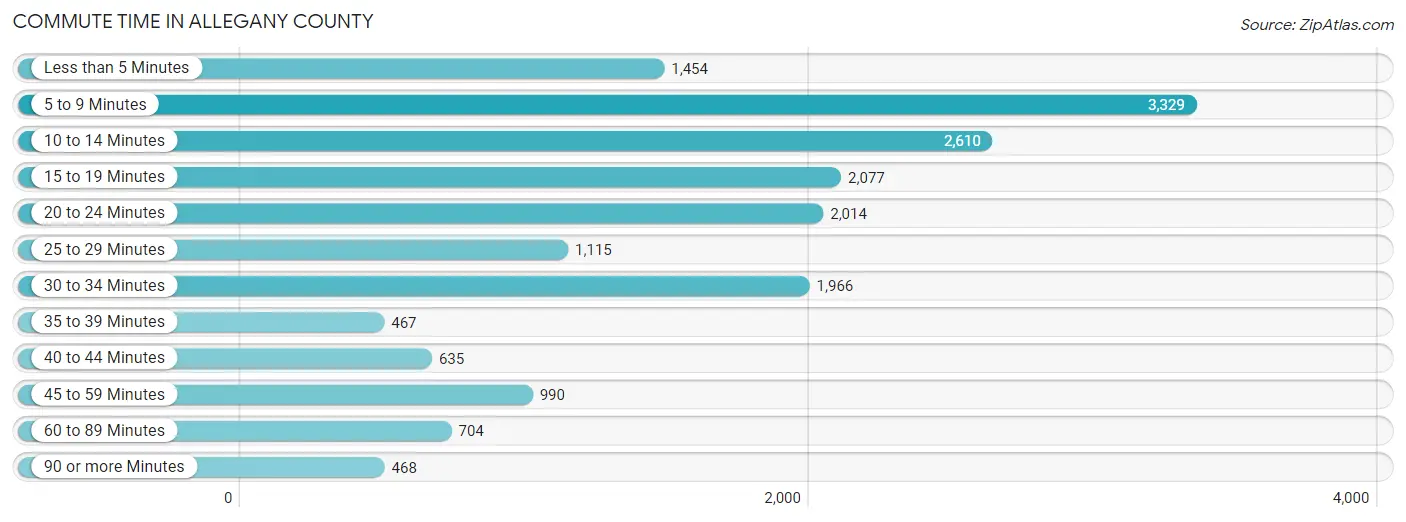
| Commute Time | # Commuters | % Commuters |
| Less than 5 Minutes | 1,454 | 8.2% |
| 5 to 9 Minutes | 3,329 | 18.7% |
| 10 to 14 Minutes | 2,610 | 14.6% |
| 15 to 19 Minutes | 2,077 | 11.7% |
| 20 to 24 Minutes | 2,014 | 11.3% |
| 25 to 29 Minutes | 1,115 | 6.2% |
| 30 to 34 Minutes | 1,966 | 11.0% |
| 35 to 39 Minutes | 467 | 2.6% |
| 40 to 44 Minutes | 635 | 3.6% |
| 45 to 59 Minutes | 990 | 5.6% |
| 60 to 89 Minutes | 704 | 4.0% |
| 90 or more Minutes | 468 | 2.6% |
Commute Time by Sex in Allegany County
The most common commute times in Allegany County are 5 to 9 minutes (1,624 commuters, 17.2%) for males and 5 to 9 minutes (1,705 commuters, 20.3%) for females.
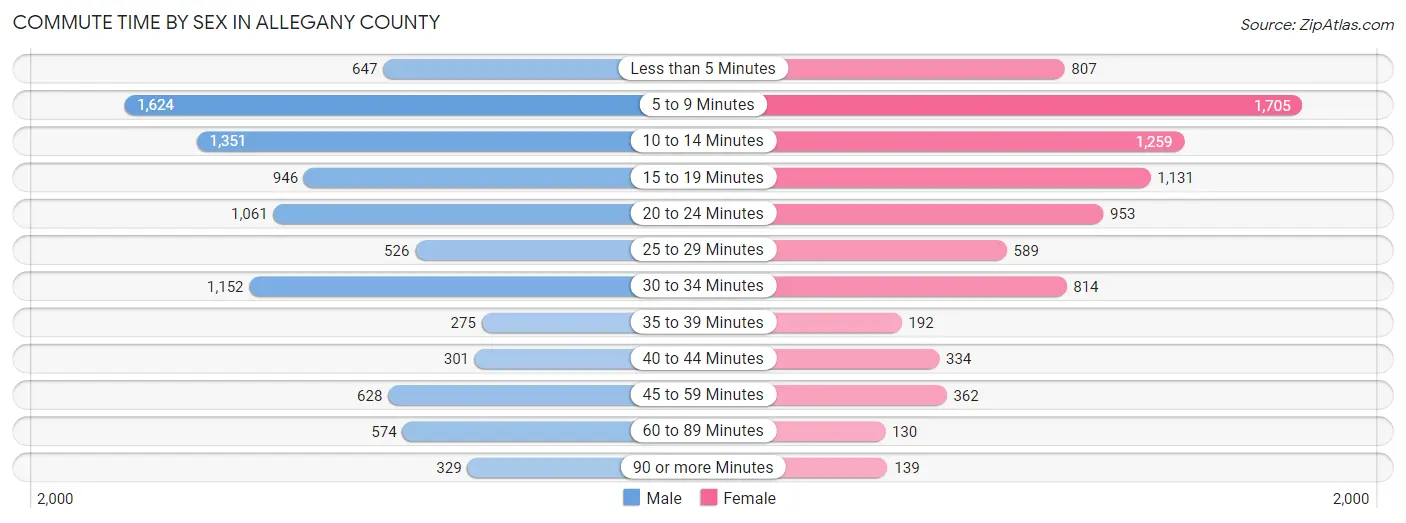
| Commute Time | Male | Female |
| Less than 5 Minutes | 647 (6.9%) | 807 (9.6%) |
| 5 to 9 Minutes | 1,624 (17.2%) | 1,705 (20.3%) |
| 10 to 14 Minutes | 1,351 (14.3%) | 1,259 (15.0%) |
| 15 to 19 Minutes | 946 (10.1%) | 1,131 (13.4%) |
| 20 to 24 Minutes | 1,061 (11.3%) | 953 (11.3%) |
| 25 to 29 Minutes | 526 (5.6%) | 589 (7.0%) |
| 30 to 34 Minutes | 1,152 (12.2%) | 814 (9.7%) |
| 35 to 39 Minutes | 275 (2.9%) | 192 (2.3%) |
| 40 to 44 Minutes | 301 (3.2%) | 334 (4.0%) |
| 45 to 59 Minutes | 628 (6.7%) | 362 (4.3%) |
| 60 to 89 Minutes | 574 (6.1%) | 130 (1.5%) |
| 90 or more Minutes | 329 (3.5%) | 139 (1.7%) |
Time of Departure to Work by Sex in Allegany County
The most frequent times of departure to work in Allegany County are 7:00 AM to 7:29 AM (1,336, 14.2%) for males and 7:30 AM to 7:59 AM (1,656, 19.7%) for females.
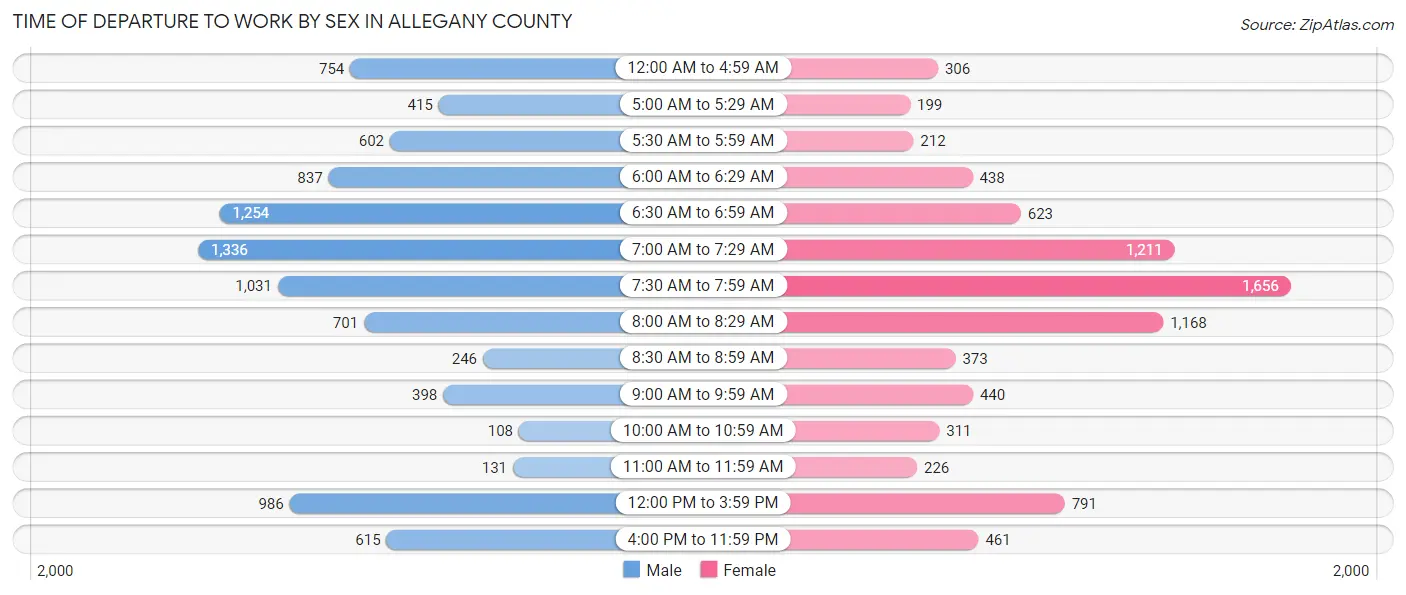
| Time of Departure | Male | Female |
| 12:00 AM to 4:59 AM | 754 (8.0%) | 306 (3.6%) |
| 5:00 AM to 5:29 AM | 415 (4.4%) | 199 (2.4%) |
| 5:30 AM to 5:59 AM | 602 (6.4%) | 212 (2.5%) |
| 6:00 AM to 6:29 AM | 837 (8.9%) | 438 (5.2%) |
| 6:30 AM to 6:59 AM | 1,254 (13.3%) | 623 (7.4%) |
| 7:00 AM to 7:29 AM | 1,336 (14.2%) | 1,211 (14.4%) |
| 7:30 AM to 7:59 AM | 1,031 (11.0%) | 1,656 (19.7%) |
| 8:00 AM to 8:29 AM | 701 (7.4%) | 1,168 (13.9%) |
| 8:30 AM to 8:59 AM | 246 (2.6%) | 373 (4.4%) |
| 9:00 AM to 9:59 AM | 398 (4.2%) | 440 (5.2%) |
| 10:00 AM to 10:59 AM | 108 (1.1%) | 311 (3.7%) |
| 11:00 AM to 11:59 AM | 131 (1.4%) | 226 (2.7%) |
| 12:00 PM to 3:59 PM | 986 (10.5%) | 791 (9.4%) |
| 4:00 PM to 11:59 PM | 615 (6.5%) | 461 (5.5%) |
| Total | 9,414 (100.0%) | 8,415 (100.0%) |
Housing Occupancy in Allegany County
Occupancy by Ownership in Allegany County
Of the total 16,813 dwellings in Allegany County, owner-occupied units account for 13,584 (80.8%), while renter-occupied units make up 3,229 (19.2%).
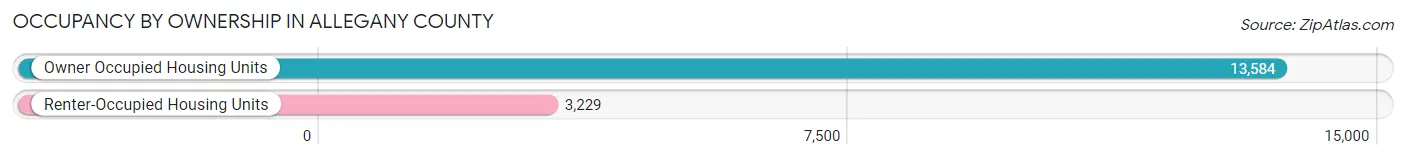
| Occupancy | # Housing Units | % Housing Units |
| Owner Occupied Housing Units | 13,584 | 80.8% |
| Renter-Occupied Housing Units | 3,229 | 19.2% |
| Total Occupied Housing Units | 16,813 | 100.0% |
Occupancy by Household Size in Allegany County
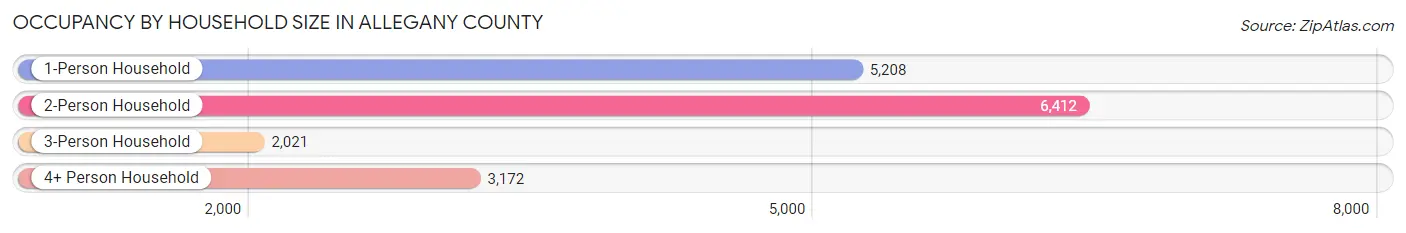
| Household Size | # Housing Units | % Housing Units |
| 1-Person Household | 5,208 | 31.0% |
| 2-Person Household | 6,412 | 38.1% |
| 3-Person Household | 2,021 | 12.0% |
| 4+ Person Household | 3,172 | 18.9% |
| Total Housing Units | 16,813 | 100.0% |
Occupancy by Ownership by Household Size in Allegany County
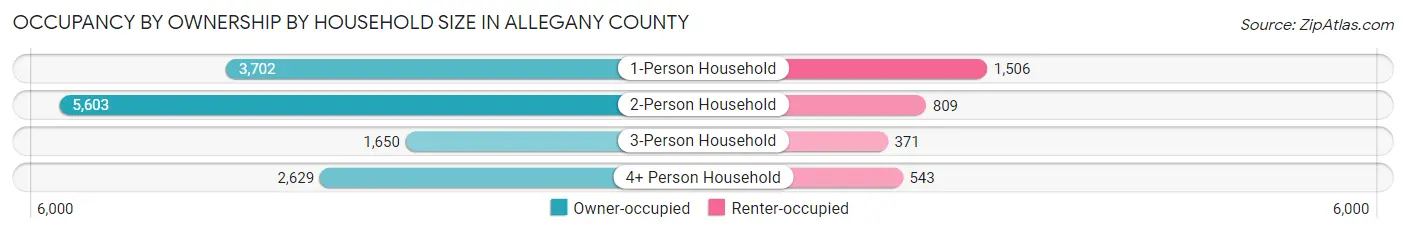
| Household Size | Owner-occupied | Renter-occupied |
| 1-Person Household | 3,702 (71.1%) | 1,506 (28.9%) |
| 2-Person Household | 5,603 (87.4%) | 809 (12.6%) |
| 3-Person Household | 1,650 (81.6%) | 371 (18.4%) |
| 4+ Person Household | 2,629 (82.9%) | 543 (17.1%) |
| Total Housing Units | 13,584 (80.8%) | 3,229 (19.2%) |
Occupancy by Educational Attainment in Allegany County
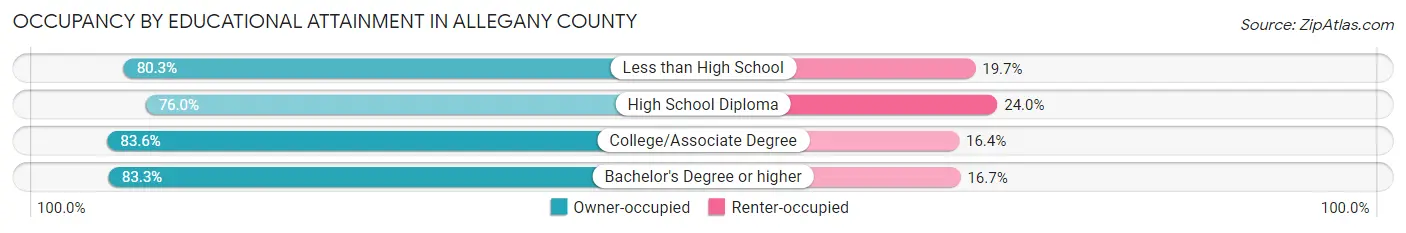
| Household Size | Owner-occupied | Renter-occupied |
| Less than High School | 936 (80.3%) | 229 (19.7%) |
| High School Diploma | 4,169 (76.0%) | 1,318 (24.0%) |
| College/Associate Degree | 4,853 (83.6%) | 954 (16.4%) |
| Bachelor's Degree or higher | 3,626 (83.3%) | 728 (16.7%) |
Occupancy by Age of Householder in Allegany County
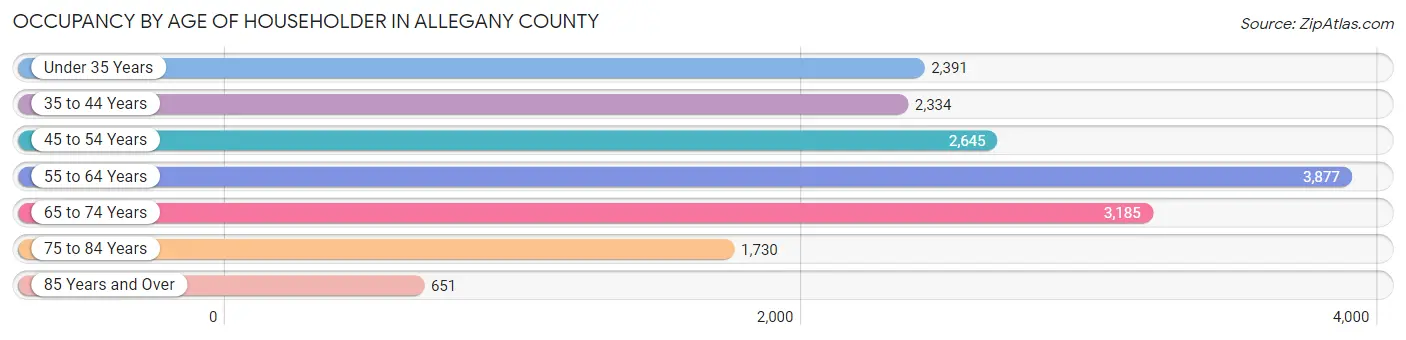
| Age Bracket | # Households | % Households |
| Under 35 Years | 2,391 | 14.2% |
| 35 to 44 Years | 2,334 | 13.9% |
| 45 to 54 Years | 2,645 | 15.7% |
| 55 to 64 Years | 3,877 | 23.1% |
| 65 to 74 Years | 3,185 | 18.9% |
| 75 to 84 Years | 1,730 | 10.3% |
| 85 Years and Over | 651 | 3.9% |
| Total | 16,813 | 100.0% |
Housing Finances in Allegany County
Median Income by Occupancy in Allegany County
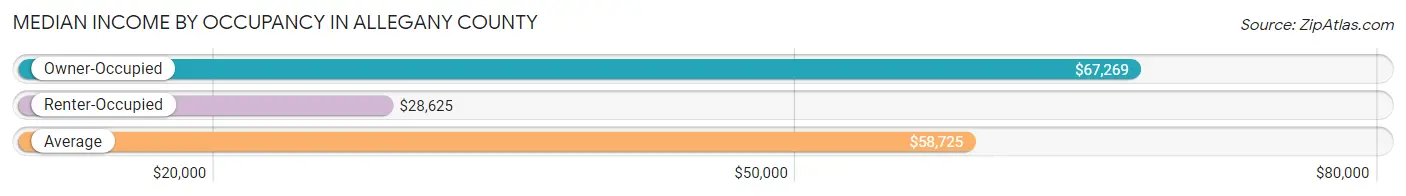
| Occupancy Type | # Households | Median Income |
| Owner-Occupied | 13,584 (80.8%) | $67,269 |
| Renter-Occupied | 3,229 (19.2%) | $28,625 |
| Average | 16,813 (100.0%) | $58,725 |
Occupancy by Householder Income Bracket in Allegany County
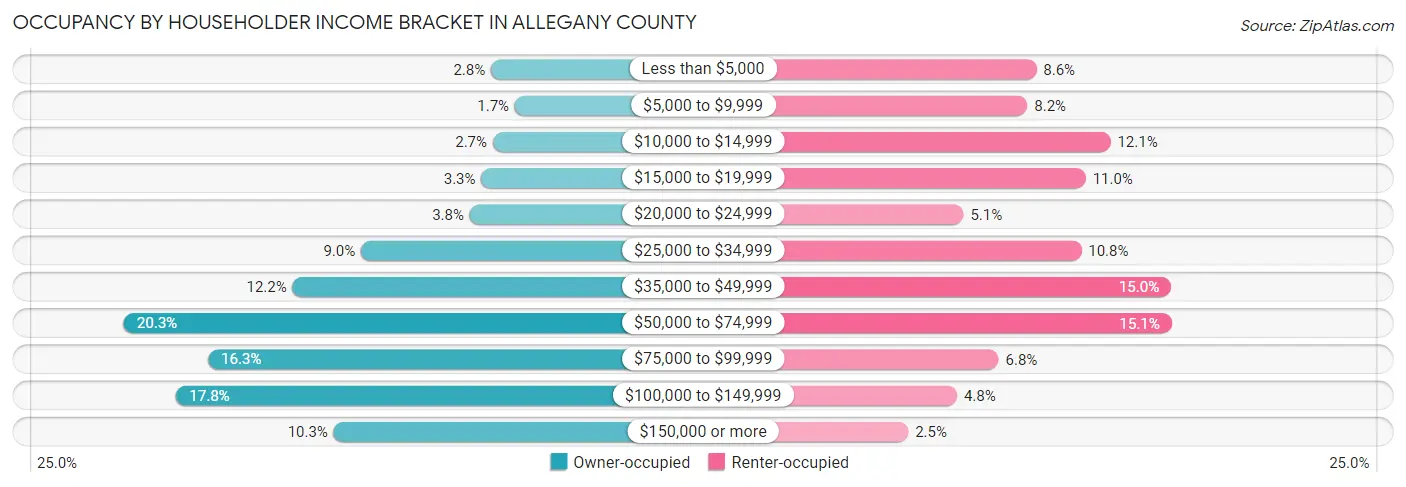
| Income Bracket | Owner-occupied | Renter-occupied |
| Less than $5,000 | 379 (2.8%) | 278 (8.6%) |
| $5,000 to $9,999 | 224 (1.7%) | 264 (8.2%) |
| $10,000 to $14,999 | 367 (2.7%) | 392 (12.1%) |
| $15,000 to $19,999 | 442 (3.3%) | 354 (11.0%) |
| $20,000 to $24,999 | 516 (3.8%) | 166 (5.1%) |
| $25,000 to $34,999 | 1,220 (9.0%) | 347 (10.7%) |
| $35,000 to $49,999 | 1,663 (12.2%) | 485 (15.0%) |
| $50,000 to $74,999 | 2,753 (20.3%) | 486 (15.0%) |
| $75,000 to $99,999 | 2,209 (16.3%) | 220 (6.8%) |
| $100,000 to $149,999 | 2,414 (17.8%) | 156 (4.8%) |
| $150,000 or more | 1,397 (10.3%) | 81 (2.5%) |
| Total | 13,584 (100.0%) | 3,229 (100.0%) |
Monthly Housing Cost Tiers in Allegany County
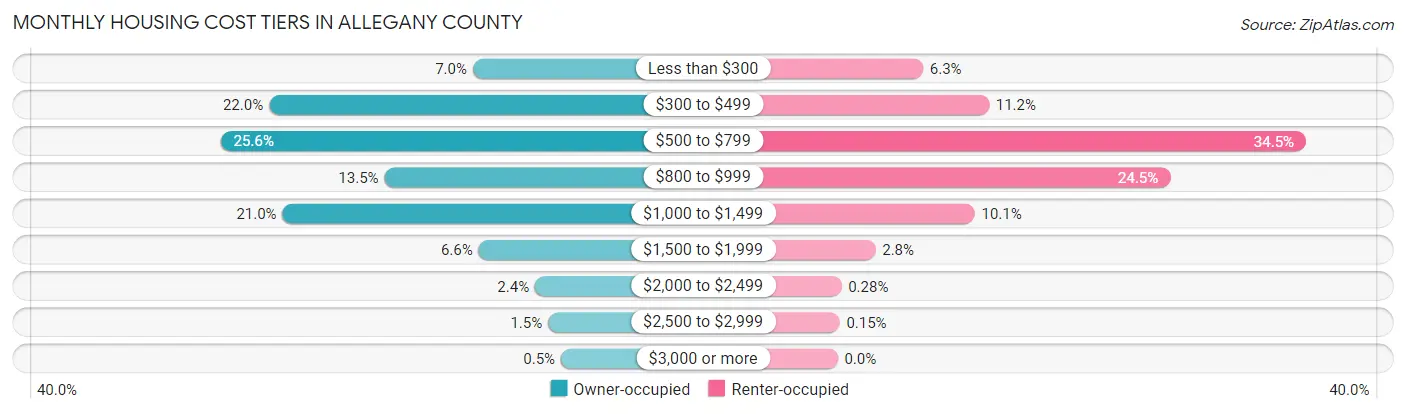
| Monthly Cost | Owner-occupied | Renter-occupied |
| Less than $300 | 949 (7.0%) | 203 (6.3%) |
| $300 to $499 | 2,989 (22.0%) | 360 (11.2%) |
| $500 to $799 | 3,474 (25.6%) | 1,114 (34.5%) |
| $800 to $999 | 1,834 (13.5%) | 791 (24.5%) |
| $1,000 to $1,499 | 2,854 (21.0%) | 326 (10.1%) |
| $1,500 to $1,999 | 892 (6.6%) | 90 (2.8%) |
| $2,000 to $2,499 | 327 (2.4%) | 9 (0.3%) |
| $2,500 to $2,999 | 197 (1.5%) | 5 (0.2%) |
| $3,000 or more | 68 (0.5%) | 0 (0.0%) |
| Total | 13,584 (100.0%) | 3,229 (100.0%) |
Physical Housing Characteristics in Allegany County
Housing Structures in Allegany County
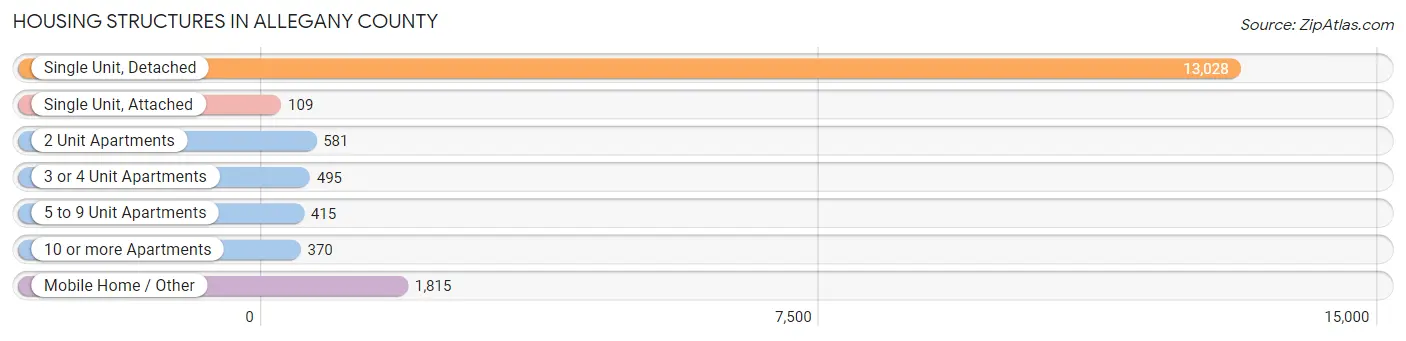
| Structure Type | # Housing Units | % Housing Units |
| Single Unit, Detached | 13,028 | 77.5% |
| Single Unit, Attached | 109 | 0.6% |
| 2 Unit Apartments | 581 | 3.5% |
| 3 or 4 Unit Apartments | 495 | 2.9% |
| 5 to 9 Unit Apartments | 415 | 2.5% |
| 10 or more Apartments | 370 | 2.2% |
| Mobile Home / Other | 1,815 | 10.8% |
| Total | 16,813 | 100.0% |
Housing Structures by Occupancy in Allegany County
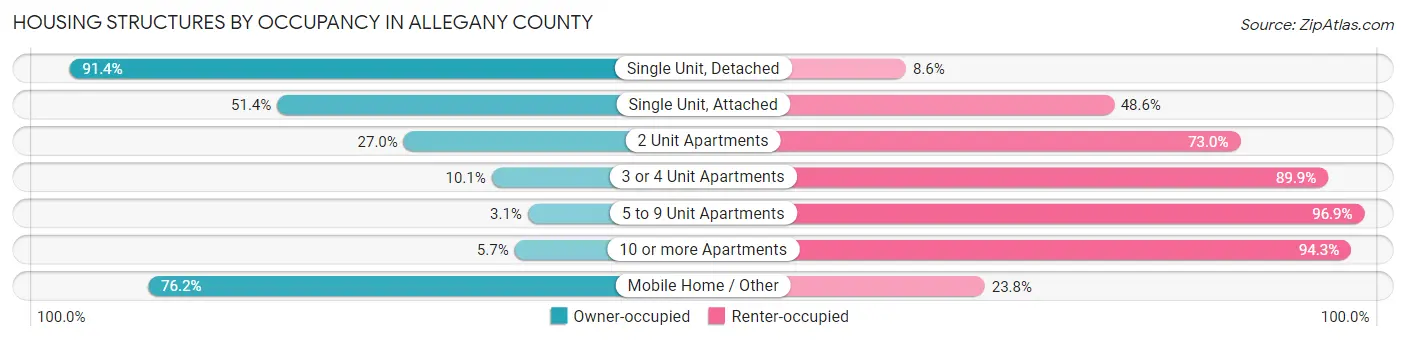
| Structure Type | Owner-occupied | Renter-occupied |
| Single Unit, Detached | 11,904 (91.4%) | 1,124 (8.6%) |
| Single Unit, Attached | 56 (51.4%) | 53 (48.6%) |
| 2 Unit Apartments | 157 (27.0%) | 424 (73.0%) |
| 3 or 4 Unit Apartments | 50 (10.1%) | 445 (89.9%) |
| 5 to 9 Unit Apartments | 13 (3.1%) | 402 (96.9%) |
| 10 or more Apartments | 21 (5.7%) | 349 (94.3%) |
| Mobile Home / Other | 1,383 (76.2%) | 432 (23.8%) |
| Total | 13,584 (80.8%) | 3,229 (19.2%) |
Housing Structures by Number of Rooms in Allegany County
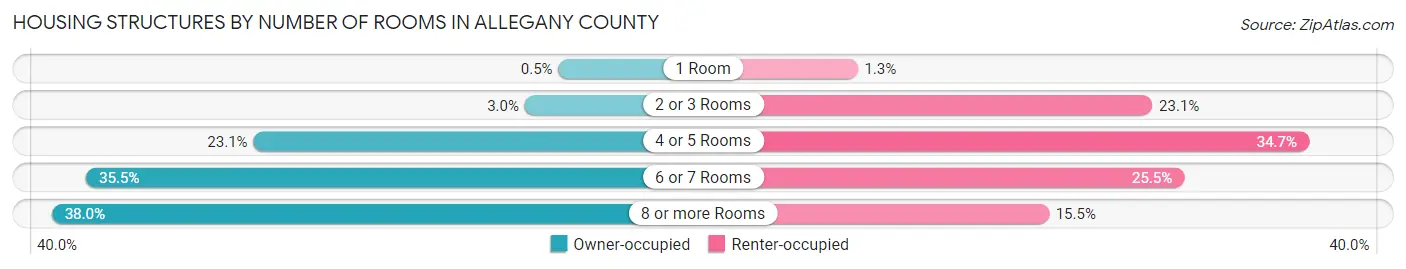
| Number of Rooms | Owner-occupied | Renter-occupied |
| 1 Room | 68 (0.5%) | 42 (1.3%) |
| 2 or 3 Rooms | 406 (3.0%) | 746 (23.1%) |
| 4 or 5 Rooms | 3,134 (23.1%) | 1,120 (34.7%) |
| 6 or 7 Rooms | 4,815 (35.4%) | 822 (25.5%) |
| 8 or more Rooms | 5,161 (38.0%) | 499 (15.4%) |
| Total | 13,584 (100.0%) | 3,229 (100.0%) |
Housing Structure by Heating Type in Allegany County
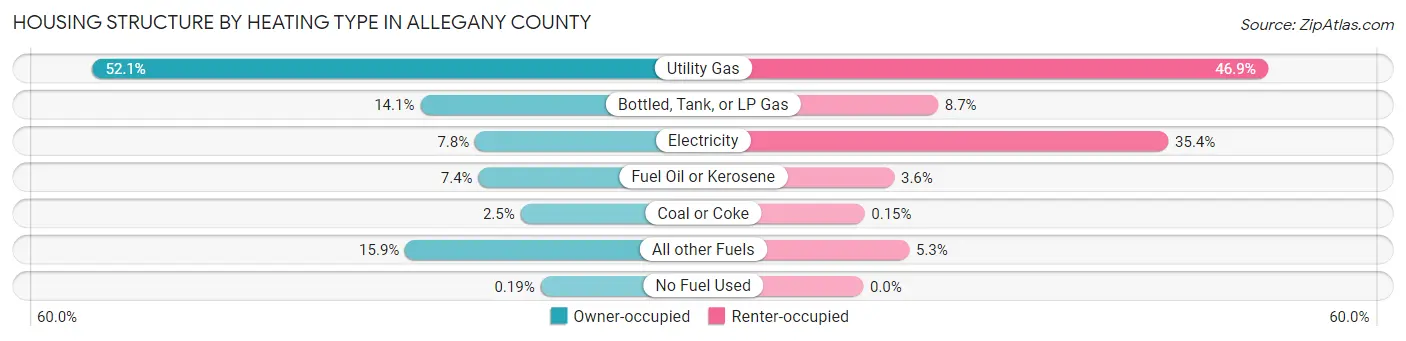
| Heating Type | Owner-occupied | Renter-occupied |
| Utility Gas | 7,082 (52.1%) | 1,514 (46.9%) |
| Bottled, Tank, or LP Gas | 1,920 (14.1%) | 280 (8.7%) |
| Electricity | 1,056 (7.8%) | 1,142 (35.4%) |
| Fuel Oil or Kerosene | 1,003 (7.4%) | 116 (3.6%) |
| Coal or Coke | 340 (2.5%) | 5 (0.2%) |
| All other Fuels | 2,157 (15.9%) | 172 (5.3%) |
| No Fuel Used | 26 (0.2%) | 0 (0.0%) |
| Total | 13,584 (100.0%) | 3,229 (100.0%) |
Household Vehicle Usage in Allegany County
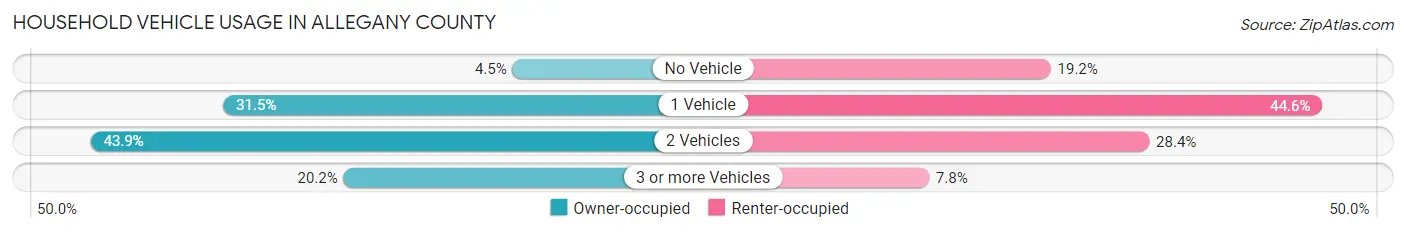
| Vehicles per Household | Owner-occupied | Renter-occupied |
| No Vehicle | 605 (4.4%) | 620 (19.2%) |
| 1 Vehicle | 4,275 (31.5%) | 1,439 (44.6%) |
| 2 Vehicles | 5,956 (43.9%) | 917 (28.4%) |
| 3 or more Vehicles | 2,748 (20.2%) | 253 (7.8%) |
| Total | 13,584 (100.0%) | 3,229 (100.0%) |
Real Estate & Mortgages in Allegany County
Real Estate and Mortgage Overview in Allegany County
| Characteristic | Without Mortgage | With Mortgage |
| Housing Units | 7,834 | 5,750 |
| Median Property Value | $87,900 | $99,900 |
| Median Household Income | $55,794 | $648 |
| Monthly Housing Costs | $506 | $61 |
| Real Estate Taxes | $2,524 | $185 |
Property Value by Mortgage Status in Allegany County
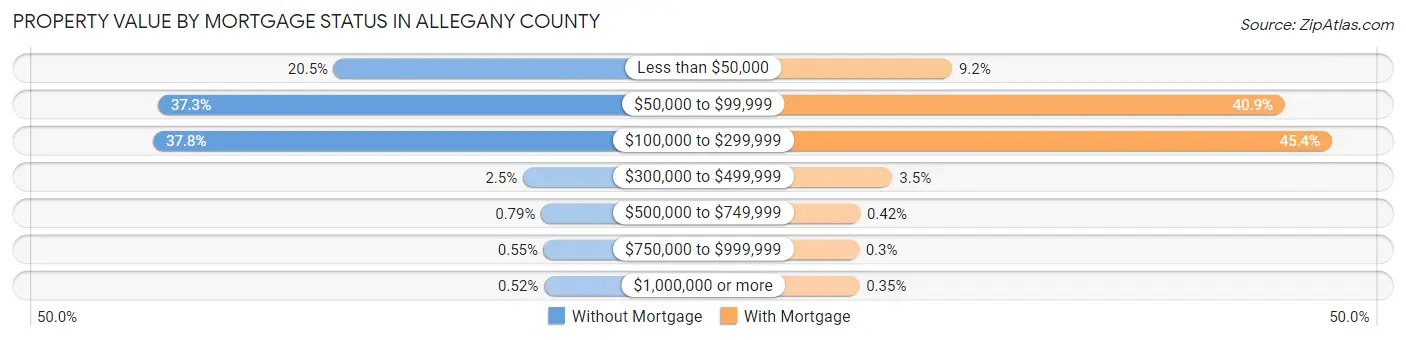
| Property Value | Without Mortgage | With Mortgage |
| Less than $50,000 | 1,609 (20.5%) | 528 (9.2%) |
| $50,000 to $99,999 | 2,923 (37.3%) | 2,351 (40.9%) |
| $100,000 to $299,999 | 2,958 (37.8%) | 2,608 (45.4%) |
| $300,000 to $499,999 | 198 (2.5%) | 202 (3.5%) |
| $500,000 to $749,999 | 62 (0.8%) | 24 (0.4%) |
| $750,000 to $999,999 | 43 (0.5%) | 17 (0.3%) |
| $1,000,000 or more | 41 (0.5%) | 20 (0.4%) |
| Total | 7,834 (100.0%) | 5,750 (100.0%) |
Household Income by Mortgage Status in Allegany County
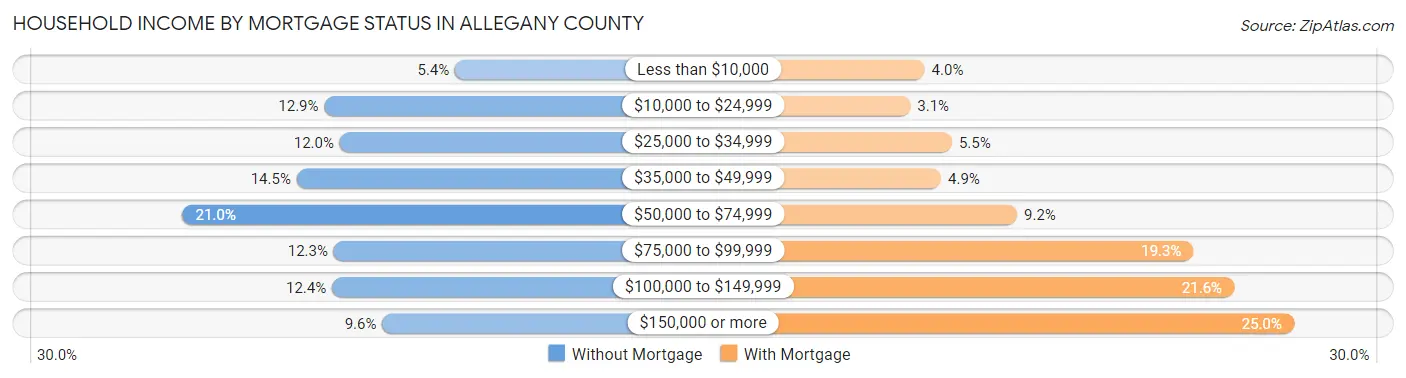
| Household Income | Without Mortgage | With Mortgage |
| Less than $10,000 | 423 (5.4%) | 227 (4.0%) |
| $10,000 to $24,999 | 1,008 (12.9%) | 180 (3.1%) |
| $25,000 to $34,999 | 939 (12.0%) | 317 (5.5%) |
| $35,000 to $49,999 | 1,132 (14.4%) | 281 (4.9%) |
| $50,000 to $74,999 | 1,643 (21.0%) | 531 (9.2%) |
| $75,000 to $99,999 | 966 (12.3%) | 1,110 (19.3%) |
| $100,000 to $149,999 | 974 (12.4%) | 1,243 (21.6%) |
| $150,000 or more | 749 (9.6%) | 1,440 (25.0%) |
| Total | 7,834 (100.0%) | 5,750 (100.0%) |
Property Value to Household Income Ratio in Allegany County
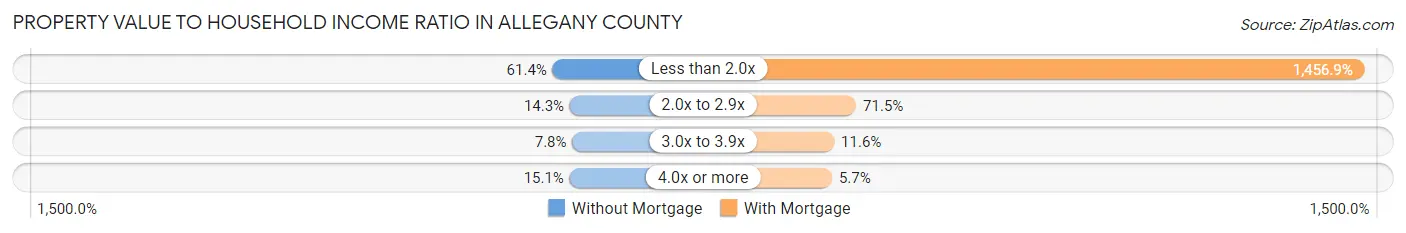
| Value-to-Income Ratio | Without Mortgage | With Mortgage |
| Less than 2.0x | 4,812 (61.4%) | 83,772 (1,456.9%) |
| 2.0x to 2.9x | 1,123 (14.3%) | 4,110 (71.5%) |
| 3.0x to 3.9x | 613 (7.8%) | 665 (11.6%) |
| 4.0x or more | 1,181 (15.1%) | 327 (5.7%) |
| Total | 7,834 (100.0%) | 5,750 (100.0%) |
Real Estate Taxes by Mortgage Status in Allegany County
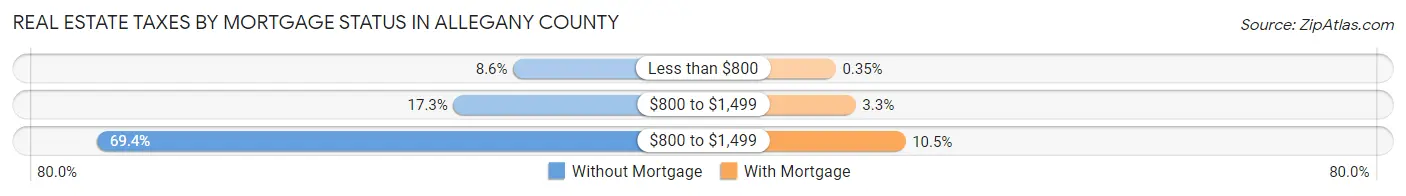
| Property Taxes | Without Mortgage | With Mortgage |
| Less than $800 | 672 (8.6%) | 20 (0.4%) |
| $800 to $1,499 | 1,356 (17.3%) | 188 (3.3%) |
| $800 to $1,499 | 5,439 (69.4%) | 606 (10.5%) |
| Total | 7,834 (100.0%) | 5,750 (100.0%) |
Health & Disability in Allegany County
Health Insurance Coverage by Age in Allegany County
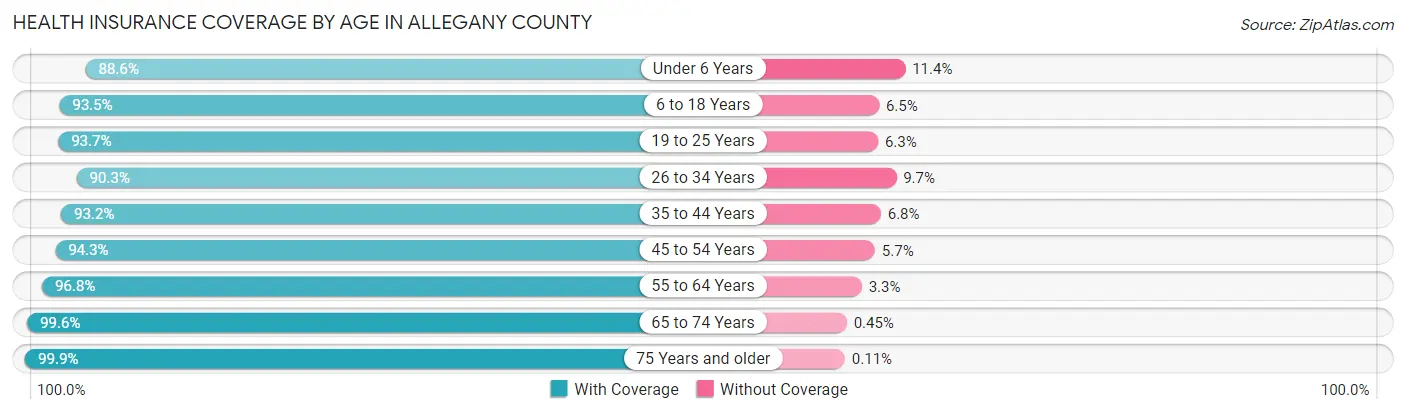
| Age Bracket | With Coverage | Without Coverage |
| Under 6 Years | 2,449 (88.6%) | 314 (11.4%) |
| 6 to 18 Years | 7,822 (93.5%) | 541 (6.5%) |
| 19 to 25 Years | 6,302 (93.7%) | 422 (6.3%) |
| 26 to 34 Years | 3,442 (90.3%) | 369 (9.7%) |
| 35 to 44 Years | 4,308 (93.2%) | 315 (6.8%) |
| 45 to 54 Years | 4,723 (94.3%) | 286 (5.7%) |
| 55 to 64 Years | 6,430 (96.8%) | 216 (3.3%) |
| 65 to 74 Years | 5,284 (99.6%) | 24 (0.4%) |
| 75 Years and older | 3,508 (99.9%) | 4 (0.1%) |
| Total | 44,268 (94.7%) | 2,491 (5.3%) |
Health Insurance Coverage by Citizenship Status in Allegany County
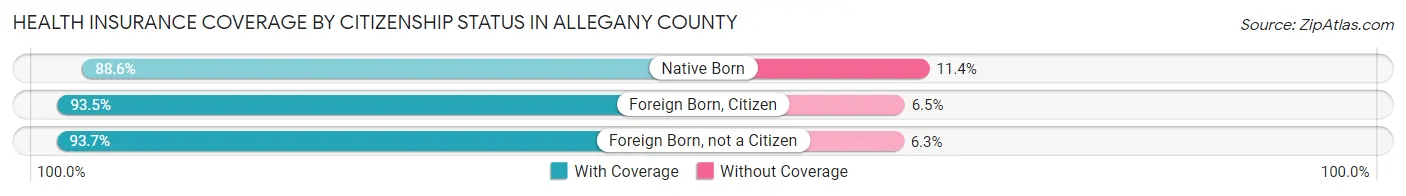
| Citizenship Status | With Coverage | Without Coverage |
| Native Born | 2,449 (88.6%) | 314 (11.4%) |
| Foreign Born, Citizen | 7,822 (93.5%) | 541 (6.5%) |
| Foreign Born, not a Citizen | 6,302 (93.7%) | 422 (6.3%) |
Health Insurance Coverage by Household Income in Allegany County
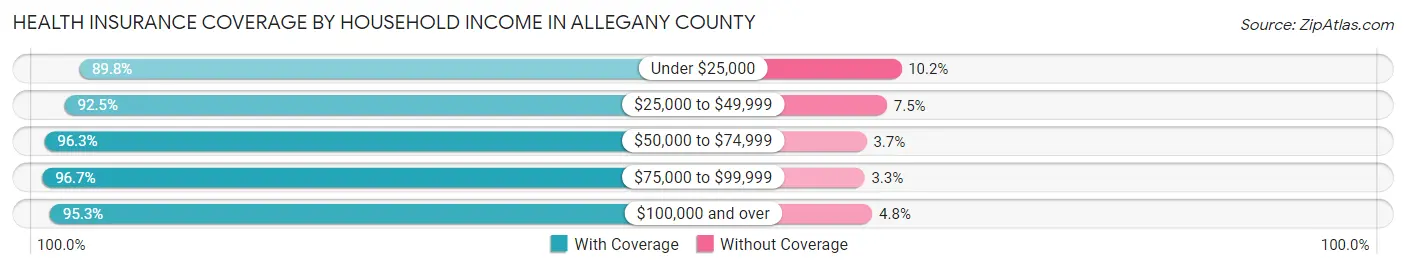
| Household Income | With Coverage | Without Coverage |
| Under $25,000 | 5,323 (89.8%) | 604 (10.2%) |
| $25,000 to $49,999 | 7,429 (92.5%) | 602 (7.5%) |
| $50,000 to $74,999 | 8,024 (96.3%) | 307 (3.7%) |
| $75,000 to $99,999 | 6,918 (96.7%) | 237 (3.3%) |
| $100,000 and over | 12,482 (95.3%) | 622 (4.8%) |
Public vs Private Health Insurance Coverage by Age in Allegany County
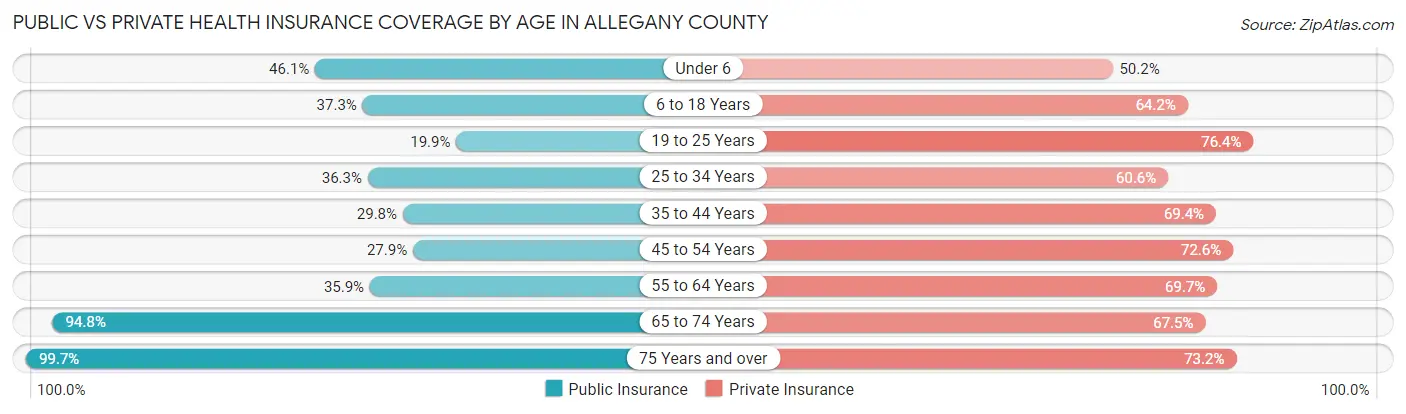
| Age Bracket | Public Insurance | Private Insurance |
| Under 6 | 1,273 (46.1%) | 1,388 (50.2%) |
| 6 to 18 Years | 3,115 (37.2%) | 5,369 (64.2%) |
| 19 to 25 Years | 1,336 (19.9%) | 5,135 (76.4%) |
| 25 to 34 Years | 1,383 (36.3%) | 2,308 (60.6%) |
| 35 to 44 Years | 1,377 (29.8%) | 3,210 (69.4%) |
| 45 to 54 Years | 1,398 (27.9%) | 3,637 (72.6%) |
| 55 to 64 Years | 2,386 (35.9%) | 4,630 (69.7%) |
| 65 to 74 Years | 5,033 (94.8%) | 3,581 (67.5%) |
| 75 Years and over | 3,503 (99.7%) | 2,571 (73.2%) |
| Total | 20,804 (44.5%) | 31,829 (68.1%) |
Disability Status by Sex by Age in Allegany County
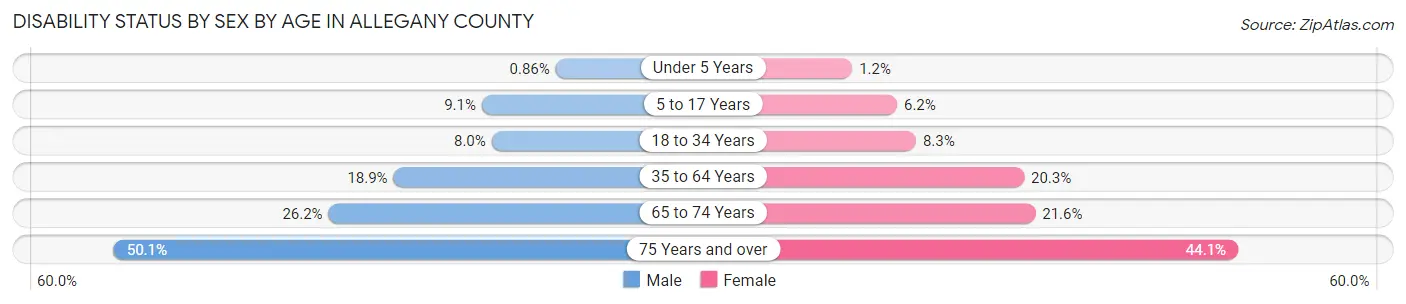
| Age Bracket | Male | Female |
| Under 5 Years | 10 (0.9%) | 14 (1.2%) |
| 5 to 17 Years | 327 (9.1%) | 203 (6.1%) |
| 18 to 34 Years | 520 (8.0%) | 486 (8.3%) |
| 35 to 64 Years | 1,543 (18.9%) | 1,649 (20.3%) |
| 65 to 74 Years | 699 (26.2%) | 568 (21.5%) |
| 75 Years and over | 806 (50.1%) | 839 (44.1%) |
Disability Class by Sex by Age in Allegany County
Disability Class: Hearing Difficulty
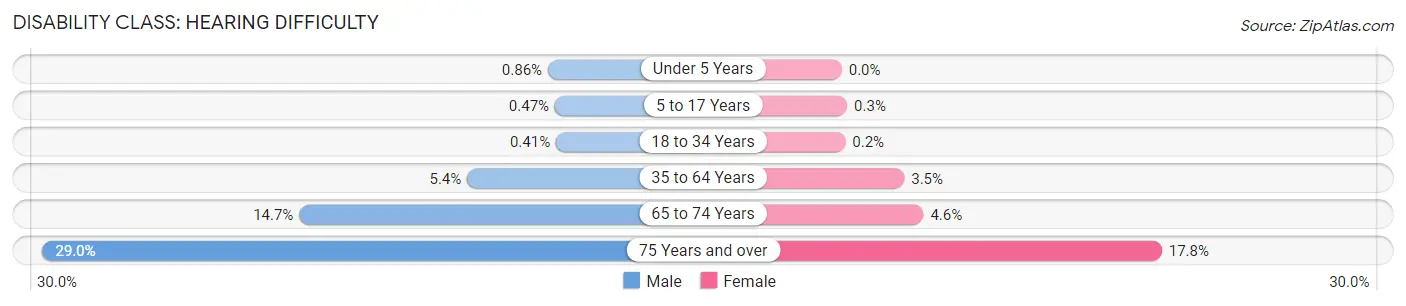
| Age Bracket | Male | Female |
| Under 5 Years | 10 (0.9%) | 0 (0.0%) |
| 5 to 17 Years | 17 (0.5%) | 10 (0.3%) |
| 18 to 34 Years | 27 (0.4%) | 12 (0.2%) |
| 35 to 64 Years | 437 (5.4%) | 283 (3.5%) |
| 65 to 74 Years | 393 (14.7%) | 120 (4.5%) |
| 75 Years and over | 467 (29.0%) | 339 (17.8%) |
Disability Class: Vision Difficulty
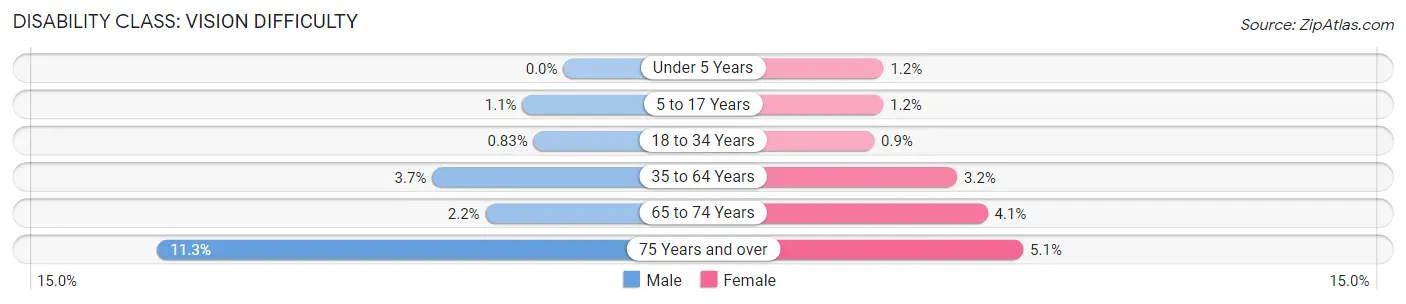
| Age Bracket | Male | Female |
| Under 5 Years | 0 (0.0%) | 14 (1.2%) |
| 5 to 17 Years | 41 (1.1%) | 38 (1.1%) |
| 18 to 34 Years | 54 (0.8%) | 53 (0.9%) |
| 35 to 64 Years | 298 (3.6%) | 261 (3.2%) |
| 65 to 74 Years | 58 (2.2%) | 107 (4.1%) |
| 75 Years and over | 182 (11.3%) | 96 (5.1%) |
Disability Class: Cognitive Difficulty
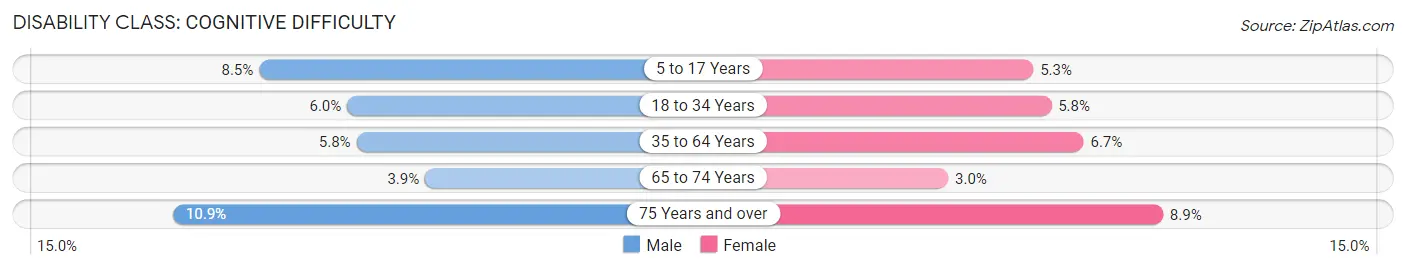
| Age Bracket | Male | Female |
| 5 to 17 Years | 305 (8.5%) | 176 (5.3%) |
| 18 to 34 Years | 392 (6.0%) | 343 (5.8%) |
| 35 to 64 Years | 470 (5.8%) | 547 (6.7%) |
| 65 to 74 Years | 103 (3.8%) | 78 (3.0%) |
| 75 Years and over | 175 (10.9%) | 170 (8.9%) |
Disability Class: Ambulatory Difficulty
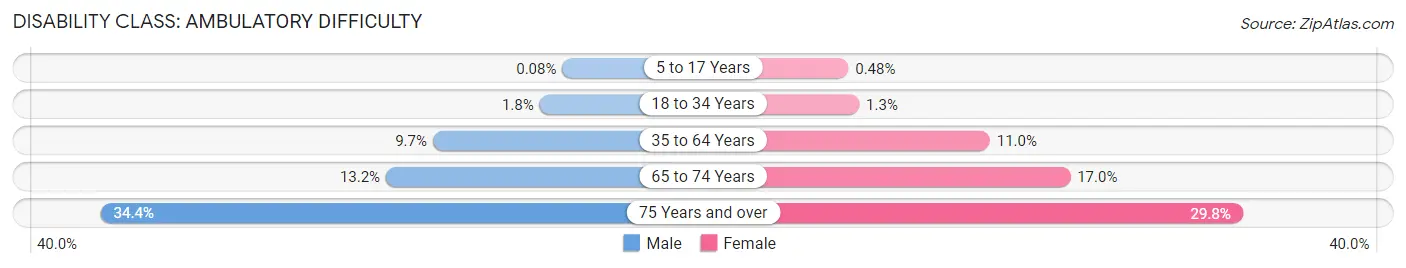
| Age Bracket | Male | Female |
| 5 to 17 Years | 3 (0.1%) | 16 (0.5%) |
| 18 to 34 Years | 115 (1.8%) | 76 (1.3%) |
| 35 to 64 Years | 790 (9.7%) | 893 (11.0%) |
| 65 to 74 Years | 352 (13.2%) | 447 (17.0%) |
| 75 Years and over | 553 (34.4%) | 566 (29.8%) |
Disability Class: Self-Care Difficulty
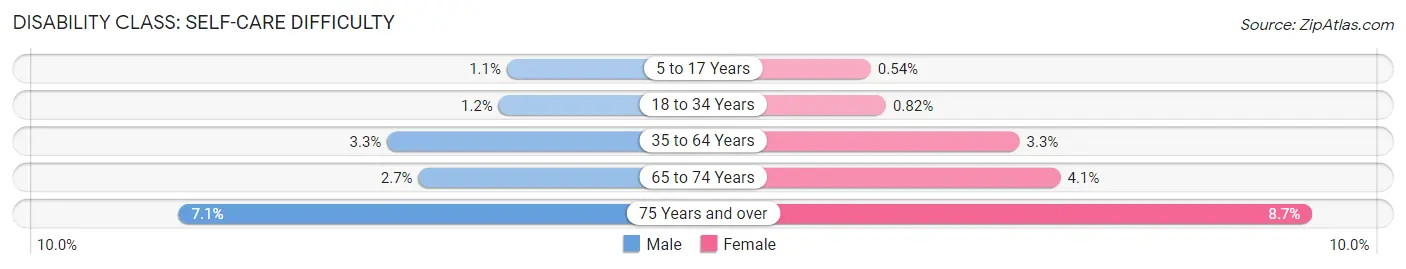
| Age Bracket | Male | Female |
| 5 to 17 Years | 38 (1.1%) | 18 (0.5%) |
| 18 to 34 Years | 78 (1.2%) | 48 (0.8%) |
| 35 to 64 Years | 267 (3.3%) | 268 (3.3%) |
| 65 to 74 Years | 72 (2.7%) | 107 (4.1%) |
| 75 Years and over | 115 (7.1%) | 166 (8.7%) |
Technology Access in Allegany County
Computing Device Access in Allegany County
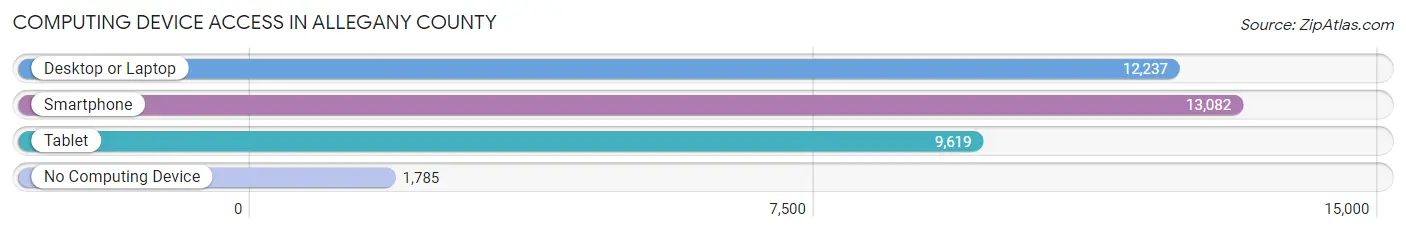
| Device Type | # Households | % Households |
| Desktop or Laptop | 12,237 | 72.8% |
| Smartphone | 13,082 | 77.8% |
| Tablet | 9,619 | 57.2% |
| No Computing Device | 1,785 | 10.6% |
| Total | 16,813 | 100.0% |
Internet Access in Allegany County
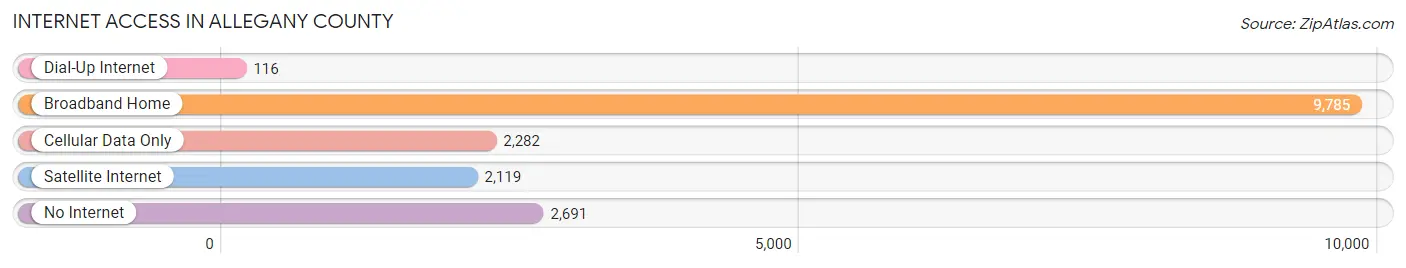
| Internet Type | # Households | % Households |
| Dial-Up Internet | 116 | 0.7% |
| Broadband Home | 9,785 | 58.2% |
| Cellular Data Only | 2,282 | 13.6% |
| Satellite Internet | 2,119 | 12.6% |
| No Internet | 2,691 | 16.0% |
| Total | 16,813 | 100.0% |
Allegany County Summary
Allegany County is located in the western part of New York State, and is part of the Southern Tier region. It is bordered by Cattaraugus County to the north, Chautauqua County to the west, and Steuben County to the south. The county seat is Belmont, and the largest city is Olean. The county has a total area of 1,034 square miles, and a population of 48,946 as of the 2010 census.
History
Allegany County was formed in 1806 from parts of Genesee County and Ontario County. It was named after a Native American word meaning “beautiful valley.” The county was originally part of the Holland Purchase, a large tract of land purchased by the Holland Land Company in 1792. The county was home to several Native American tribes, including the Seneca, Cayuga, and Onondaga.
The first settlers in the area were mostly of German and Dutch descent, and the county was largely agricultural. The first industry in the county was lumbering, which began in the early 19th century. The first railroad in the county was built in 1851, connecting Olean to Buffalo. This allowed for the development of the coal and oil industries in the area.
Geography
Allegany County is located in the western part of New York State, and is part of the Southern Tier region. It is bordered by Cattaraugus County to the north, Chautauqua County to the west, and Steuben County to the south. The county has a total area of 1,034 square miles, and is mostly rural. The terrain is mostly rolling hills, with the highest point being 2,622 feet at the summit of Mount Morris. The county is home to several rivers, including the Genesee River, which flows through the county from north to south.
Economy
Allegany County’s economy is largely based on agriculture and manufacturing. The county is home to several large farms, and is a major producer of dairy products, beef, and vegetables. The county is also home to several manufacturing companies, including a paper mill, a plastics plant, and a steel mill. The county is also home to several tourist attractions, including the Allegany State Park, which is the largest state park in New York.
Demographics
As of the 2010 census, Allegany County had a population of 48,946. The population was spread out with a median age of 41.7 years. The racial makeup of the county was 95.2% White, 1.7% African American, 0.5% Native American, 0.5% Asian, 0.2% Pacific Islander, 0.7% from other races, and 1.3% from two or more races. Hispanic or Latino of any race were 2.3% of the population.
The median income for a household in the county was $41,945, and the median income for a family was $50,945. The per capita income for the county was $20,845. About 11.2% of families and 15.2% of the population were below the poverty line, including 21.2% of those under age 18 and 8.2% of those age 65 or over.
Allegany County is a rural county with a rich history and a diverse economy. It is home to several large farms, manufacturing companies, and tourist attractions. The county has a population of nearly 50,000, and is a diverse mix of races and ethnicities. The county has a median income of $41,945, and a poverty rate of 11.2%.
Common Questions
What is Per Capita Income in Allegany County?
Per Capita income in Allegany County is $28,506.
What is the Median Family Income in Allegany County?
Median Family Income in Allegany County is $75,880.
What is the Median Household income in Allegany County?
Median Household Income in Allegany County is $58,725.
What is Income or Wage Gap in Allegany County?
Income or Wage Gap in Allegany County is 26.7%.
Women in Allegany County earn 73.3 cents for every dollar earned by a man.
What is Family Income Deficit in Allegany County?
Family Income Deficit in Allegany County is $12,292.
Families that are below poverty line in Allegany County earn $12,292 less on average than the poverty threshold level.
What is Inequality or Gini Index in Allegany County?
Inequality or Gini Index in Allegany County is 0.44.
What is the Total Population of Allegany County?
Total Population of Allegany County is 47,222.
What is the Total Male Population of Allegany County?
Total Male Population of Allegany County is 23,892.
What is the Total Female Population of Allegany County?
Total Female Population of Allegany County is 23,330.
What is the Ratio of Males per 100 Females in Allegany County?
There are 102.41 Males per 100 Females in Allegany County.
What is the Ratio of Females per 100 Males in Allegany County?
There are 97.65 Females per 100 Males in Allegany County.
What is the Median Population Age in Allegany County?
Median Population Age in Allegany County is 38.9 Years.
What is the Average Family Size in Allegany County
Average Family Size in Allegany County is 3.1 People.
What is the Average Household Size in Allegany County
Average Household Size in Allegany County is 2.5 People.
How Large is the Labor Force in Allegany County?
There are 21,162 People in the Labor Forcein in Allegany County.
What is the Percentage of People in the Labor Force in Allegany County?
54.2% of People are in the Labor Force in Allegany County.
What is the Unemployment Rate in Allegany County?
Unemployment Rate in Allegany County is 7.3%.