Albany County, NY Map & Demographics
Albany County Map
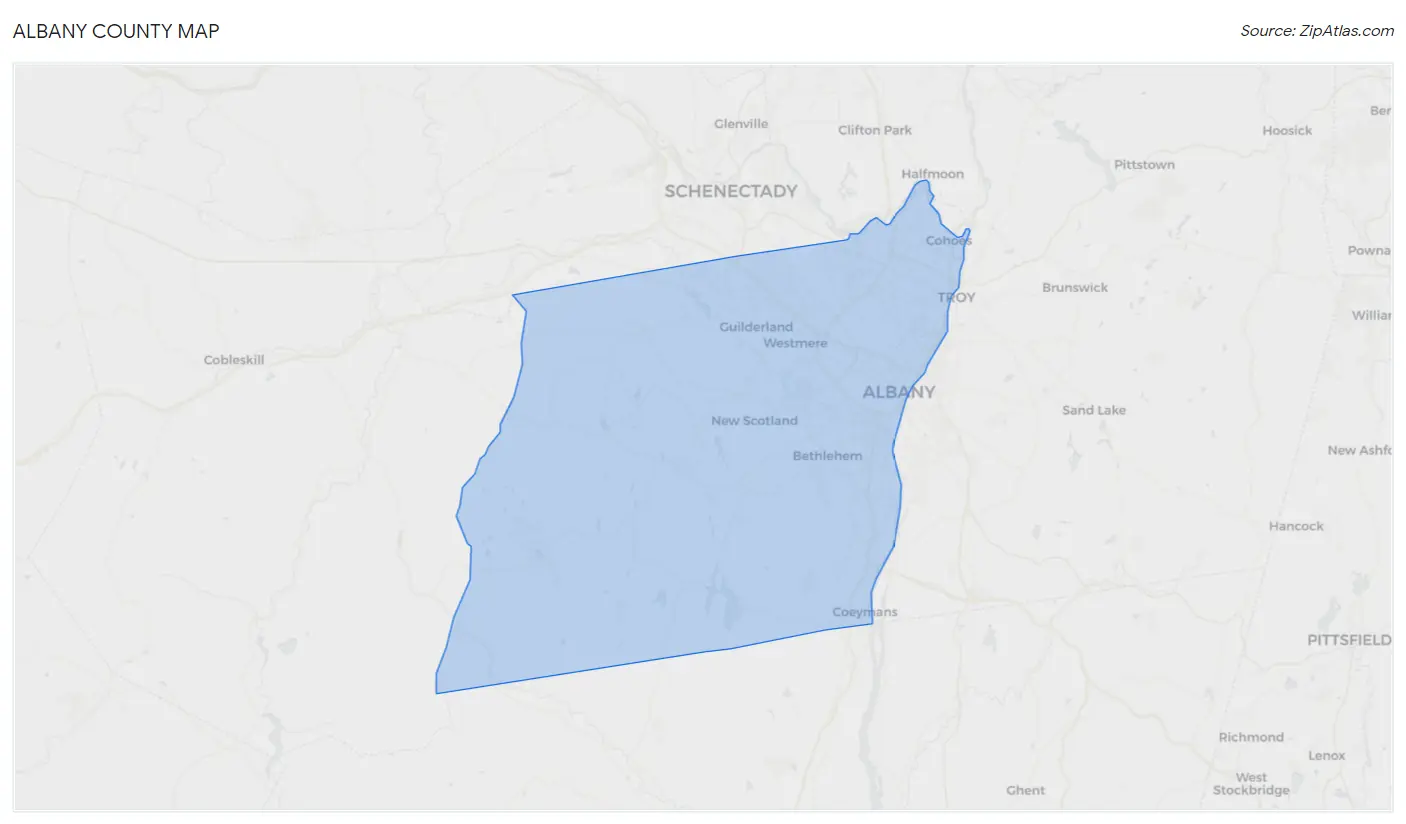
Albany County Overview
$44,101
PER CAPITA INCOME
$110,201
AVG FAMILY INCOME
$78,829
AVG HOUSEHOLD INCOME
23.6%
WAGE / INCOME GAP [ % ]
76.4¢/ $1
WAGE / INCOME GAP [ $ ]
$11,295
FAMILY INCOME DEFICIT
0.45
INEQUALITY / GINI INDEX
315,041
TOTAL POPULATION
153,405
MALE POPULATION
161,636
FEMALE POPULATION
94.91
MALES / 100 FEMALES
105.37
FEMALES / 100 MALES
38.1
MEDIAN AGE
2.9
AVG FAMILY SIZE
2.2
AVG HOUSEHOLD SIZE
170,171
LABOR FORCE [ PEOPLE ]
64.2%
PERCENT IN LABOR FORCE
5.2%
UNEMPLOYMENT RATE
Albany County Area Codes
Income in Albany County
Income Overview in Albany County
Per Capita Income in Albany County is $44,101, while median incomes of families and households are $110,201 and $78,829 respectively.
| Characteristic | Number | Measure |
| Per Capita Income | 315,041 | $44,101 |
| Median Family Income | 73,068 | $110,201 |
| Mean Family Income | 73,068 | $130,193 |
| Median Household Income | 132,175 | $78,829 |
| Mean Household Income | 132,175 | $103,137 |
| Income Deficit | 73,068 | $11,295 |
| Wage / Income Gap (%) | 315,041 | 23.61% |
| Wage / Income Gap ($) | 315,041 | 76.39¢ per $1 |
| Gini / Inequality Index | 315,041 | 0.45 |
Earnings by Sex in Albany County
Average Earnings in Albany County are $45,362, $52,032 for men and $39,747 for women, a difference of 23.6%.
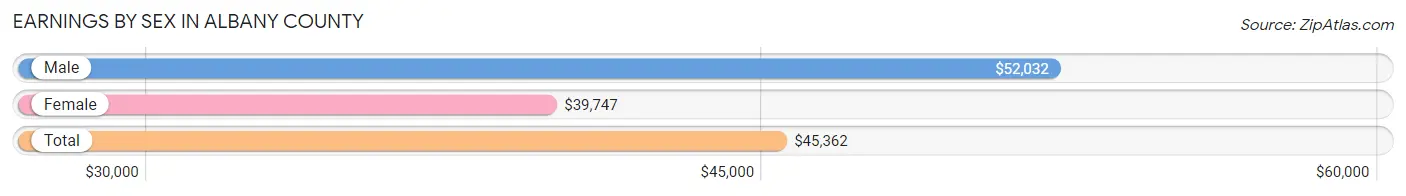
| Sex | Number | Average Earnings |
| Male | 90,527 (50.2%) | $52,032 |
| Female | 89,612 (49.7%) | $39,747 |
| Total | 180,139 (100.0%) | $45,362 |
Earnings by Sex by Income Bracket in Albany County
The most common earnings brackets in Albany County are $100,000+ for men (18,273 | 20.2%) and $75,000 to $99,999 for women (10,533 | 11.7%).
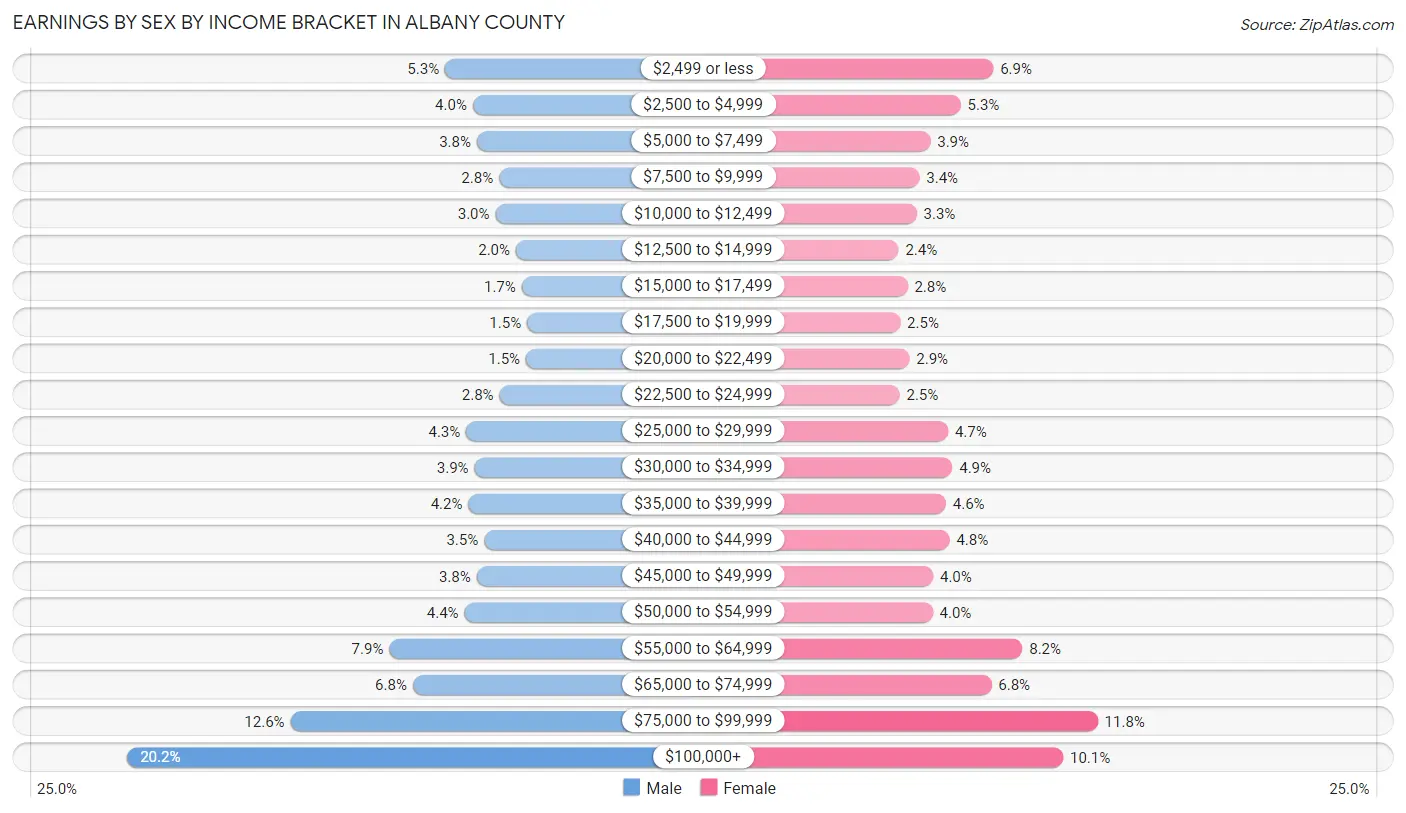
| Income | Male | Female |
| $2,499 or less | 4,804 (5.3%) | 6,147 (6.9%) |
| $2,500 to $4,999 | 3,630 (4.0%) | 4,772 (5.3%) |
| $5,000 to $7,499 | 3,458 (3.8%) | 3,504 (3.9%) |
| $7,500 to $9,999 | 2,521 (2.8%) | 3,051 (3.4%) |
| $10,000 to $12,499 | 2,675 (2.9%) | 2,933 (3.3%) |
| $12,500 to $14,999 | 1,798 (2.0%) | 2,169 (2.4%) |
| $15,000 to $17,499 | 1,557 (1.7%) | 2,549 (2.8%) |
| $17,500 to $19,999 | 1,330 (1.5%) | 2,243 (2.5%) |
| $20,000 to $22,499 | 1,372 (1.5%) | 2,627 (2.9%) |
| $22,500 to $24,999 | 2,500 (2.8%) | 2,216 (2.5%) |
| $25,000 to $29,999 | 3,908 (4.3%) | 4,251 (4.7%) |
| $30,000 to $34,999 | 3,560 (3.9%) | 4,423 (4.9%) |
| $35,000 to $39,999 | 3,822 (4.2%) | 4,161 (4.6%) |
| $40,000 to $44,999 | 3,154 (3.5%) | 4,307 (4.8%) |
| $45,000 to $49,999 | 3,470 (3.8%) | 3,617 (4.0%) |
| $50,000 to $54,999 | 3,987 (4.4%) | 3,599 (4.0%) |
| $55,000 to $64,999 | 7,172 (7.9%) | 7,367 (8.2%) |
| $65,000 to $74,999 | 6,175 (6.8%) | 6,067 (6.8%) |
| $75,000 to $99,999 | 11,361 (12.6%) | 10,533 (11.7%) |
| $100,000+ | 18,273 (20.2%) | 9,076 (10.1%) |
| Total | 90,527 (100.0%) | 89,612 (100.0%) |
Earnings by Sex by Educational Attainment in Albany County
Average earnings in Albany County are $63,756 for men and $51,300 for women, a difference of 19.5%. Men with an educational attainment of graduate degree enjoy the highest average annual earnings of $101,709, while those with less than high school education earn the least with $29,299. Women with an educational attainment of graduate degree earn the most with the average annual earnings of $75,407, while those with less than high school education have the smallest earnings of $20,582.
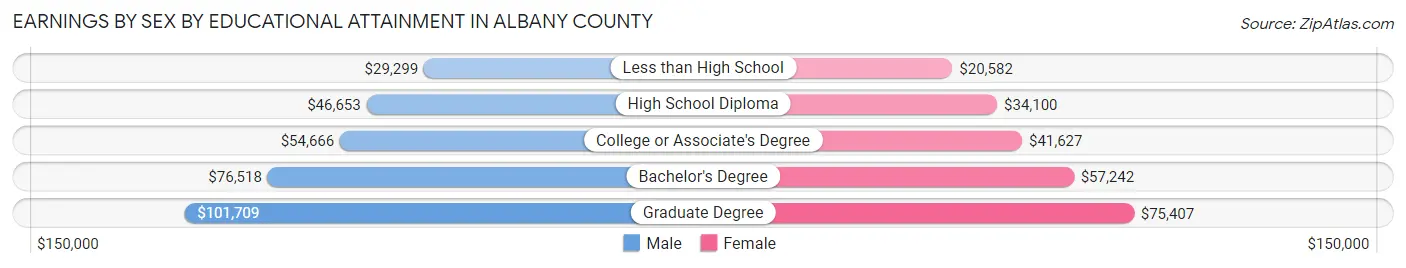
| Educational Attainment | Male Income | Female Income |
| Less than High School | $29,299 | $20,582 |
| High School Diploma | $46,653 | $34,100 |
| College or Associate's Degree | $54,666 | $41,627 |
| Bachelor's Degree | $76,518 | $57,242 |
| Graduate Degree | $101,709 | $75,407 |
| Total | $63,756 | $51,300 |
Family Income in Albany County
Family Income Brackets in Albany County
According to the Albany County family income data, there are 17,975 families falling into the $100,000 to $149,999 income range, which is the most common income bracket and makes up 24.6% of all families. Conversely, the $10,000 to $14,999 income bracket is the least frequent group with only 1,242 families (1.7%) belonging to this category.
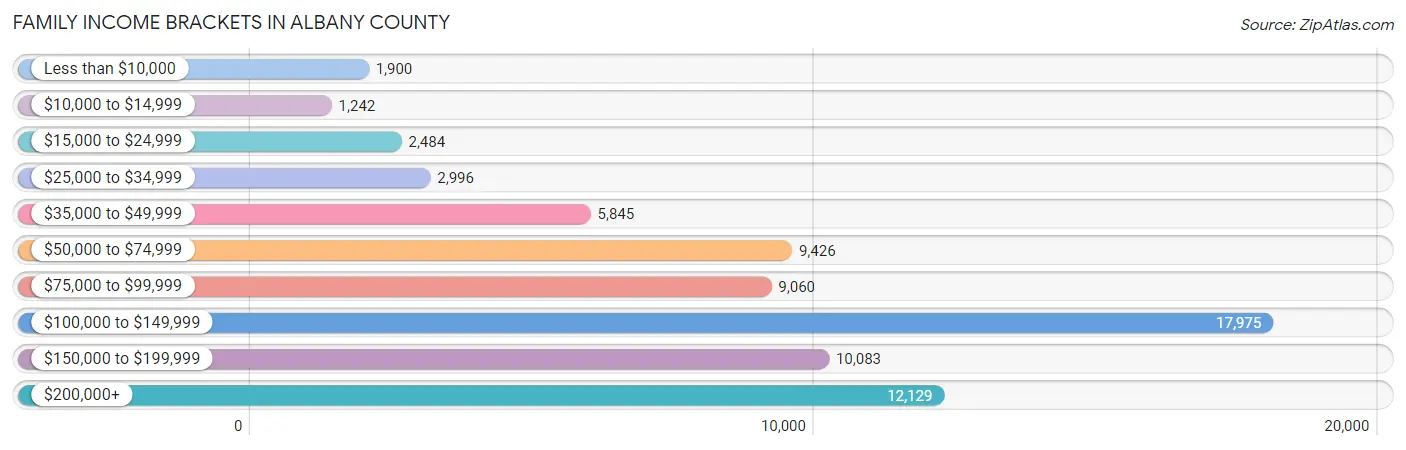
| Income Bracket | # Families | % Families |
| Less than $10,000 | 1,900 | 2.6% |
| $10,000 to $14,999 | 1,242 | 1.7% |
| $15,000 to $24,999 | 2,484 | 3.4% |
| $25,000 to $34,999 | 2,996 | 4.1% |
| $35,000 to $49,999 | 5,845 | 8.0% |
| $50,000 to $74,999 | 9,426 | 12.9% |
| $75,000 to $99,999 | 9,060 | 12.4% |
| $100,000 to $149,999 | 17,975 | 24.6% |
| $150,000 to $199,999 | 10,083 | 13.8% |
| $200,000+ | 12,129 | 16.6% |
Family Income by Famaliy Size in Albany County
4-person families (12,008 | 16.4%) account for the highest median family income in Albany County with $138,670 per family, while 2-person families (37,067 | 50.7%) have the highest median income of $49,028 per family member.
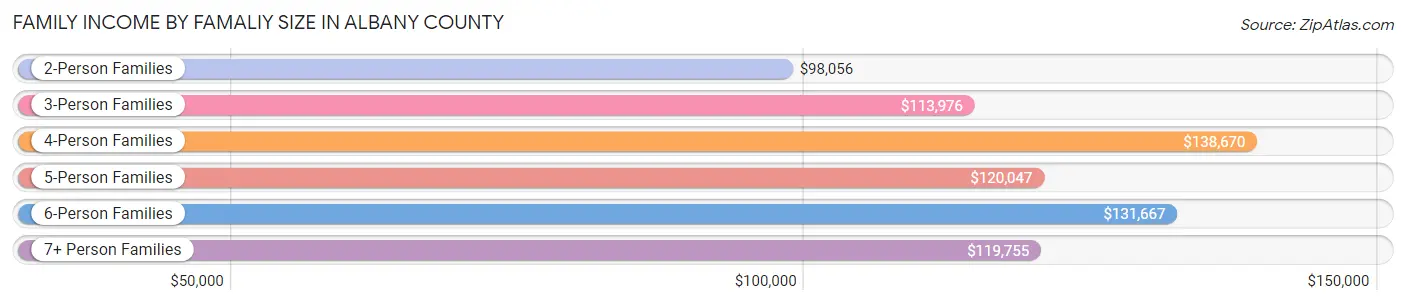
| Income Bracket | # Families | Median Income |
| 2-Person Families | 37,067 (50.7%) | $98,056 |
| 3-Person Families | 17,246 (23.6%) | $113,976 |
| 4-Person Families | 12,008 (16.4%) | $138,670 |
| 5-Person Families | 4,409 (6.0%) | $120,047 |
| 6-Person Families | 1,484 (2.0%) | $131,667 |
| 7+ Person Families | 854 (1.2%) | $119,755 |
| Total | 73,068 (100.0%) | $110,201 |
Family Income by Number of Earners in Albany County
The median family income in Albany County is $110,201, with families comprising 3+ earners (8,223) having the highest median family income of $150,169, while families with no earners (11,422) have the lowest median family income of $66,064, accounting for 11.3% and 15.6% of families, respectively.
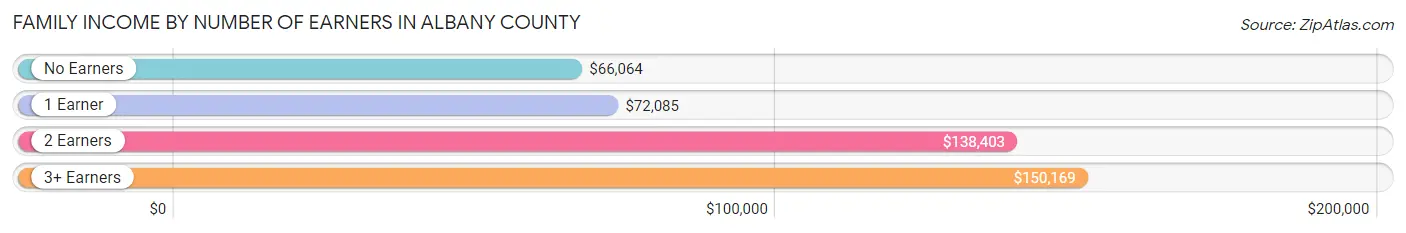
| Number of Earners | # Families | Median Income |
| No Earners | 11,422 (15.6%) | $66,064 |
| 1 Earner | 21,671 (29.7%) | $72,085 |
| 2 Earners | 31,752 (43.5%) | $138,403 |
| 3+ Earners | 8,223 (11.3%) | $150,169 |
| Total | 73,068 (100.0%) | $110,201 |
Household Income in Albany County
Household Income Brackets in Albany County
With 24,981 households falling in the category, the $100,000 to $149,999 income range is the most frequent in Albany County, accounting for 18.9% of all households. In contrast, only 5,023 households (3.8%) fall into the $10,000 to $14,999 income bracket, making it the least populous group.
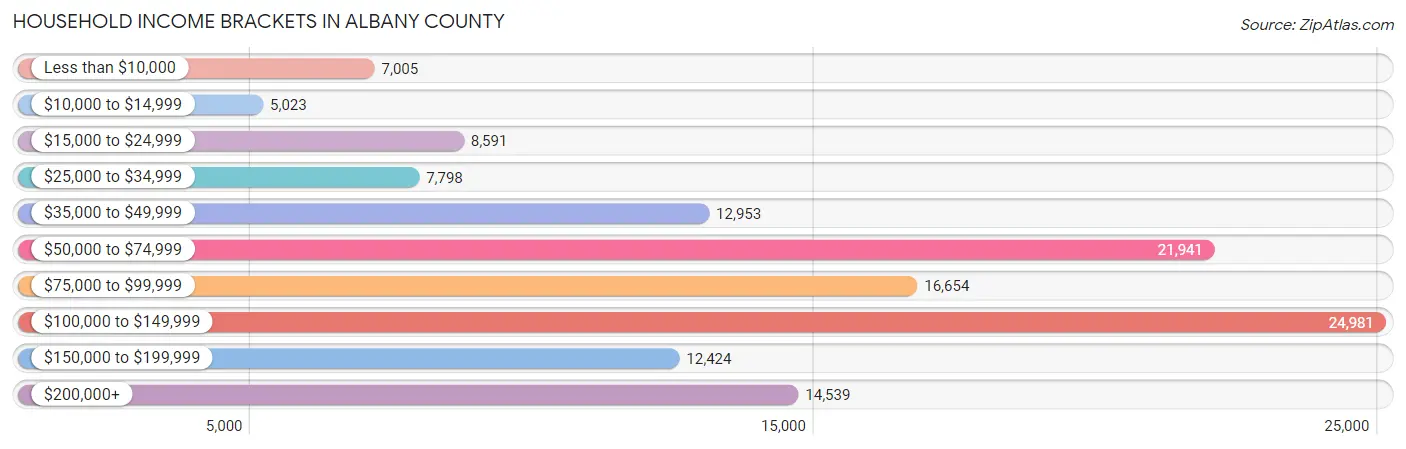
| Income Bracket | # Households | % Households |
| Less than $10,000 | 7,005 | 5.3% |
| $10,000 to $14,999 | 5,023 | 3.8% |
| $15,000 to $24,999 | 8,591 | 6.5% |
| $25,000 to $34,999 | 7,798 | 5.9% |
| $35,000 to $49,999 | 12,953 | 9.8% |
| $50,000 to $74,999 | 21,941 | 16.6% |
| $75,000 to $99,999 | 16,654 | 12.6% |
| $100,000 to $149,999 | 24,981 | 18.9% |
| $150,000 to $199,999 | 12,424 | 9.4% |
| $200,000+ | 14,539 | 11.0% |
Household Income by Householder Age in Albany County
The median household income in Albany County is $78,829, with the highest median household income of $99,009 found in the 45 to 64 years age bracket for the primary householder. A total of 46,662 households (35.3%) fall into this category. Meanwhile, the 15 to 24 years age bracket for the primary householder has the lowest median household income of $43,292, with 7,987 households (6.0%) in this group.
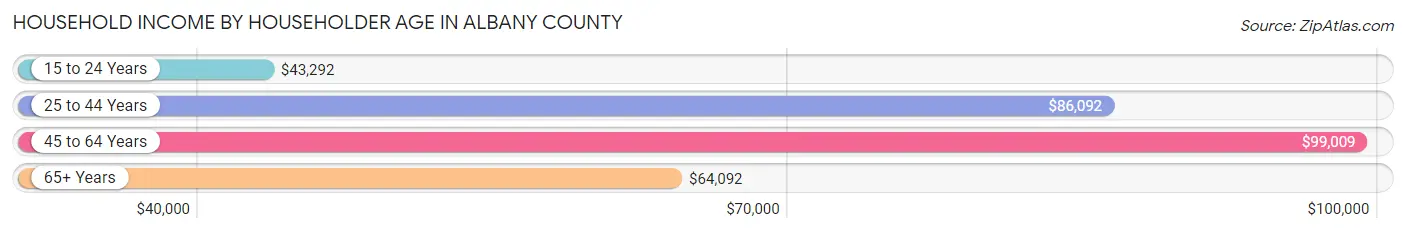
| Income Bracket | # Households | Median Income |
| 15 to 24 Years | 7,987 (6.0%) | $43,292 |
| 25 to 44 Years | 42,456 (32.1%) | $86,092 |
| 45 to 64 Years | 46,662 (35.3%) | $99,009 |
| 65+ Years | 35,070 (26.5%) | $64,092 |
| Total | 132,175 (100.0%) | $78,829 |
Poverty in Albany County
Income Below Poverty by Sex and Age in Albany County
With 11.8% poverty level for males and 13.2% for females among the residents of Albany County, 18 to 24 year old males and 18 to 24 year old females are the most vulnerable to poverty, with 3,740 males (21.2%) and 4,453 females (26.1%) in their respective age groups living below the poverty level.
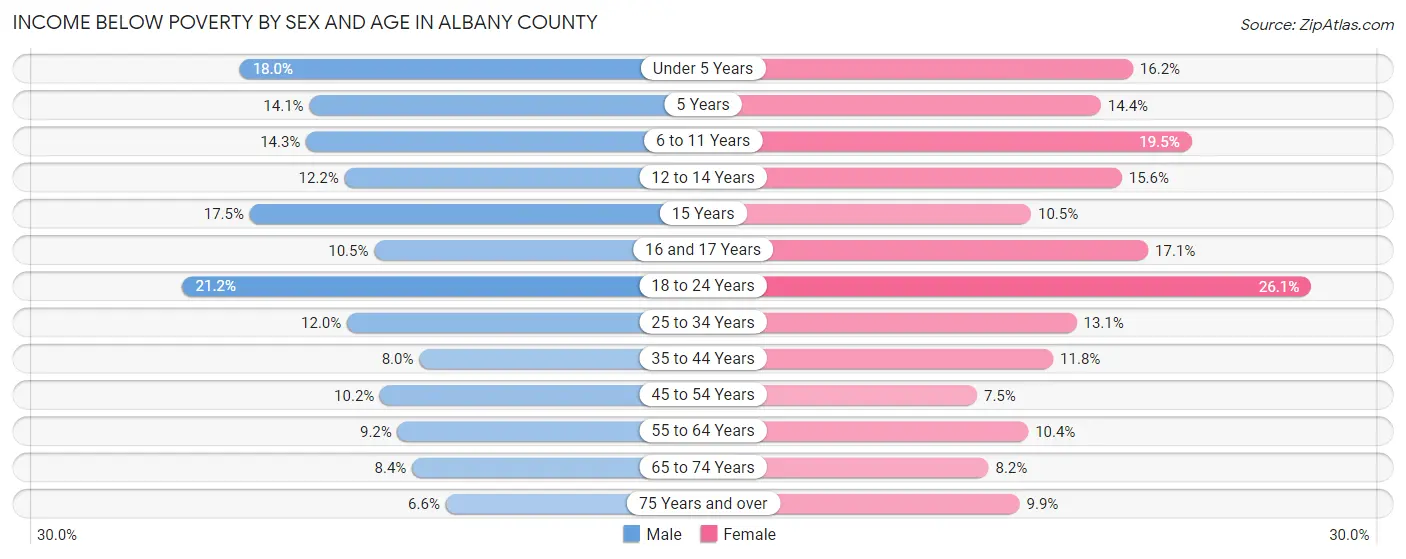
| Age Bracket | Male | Female |
| Under 5 Years | 1,370 (18.0%) | 1,191 (16.2%) |
| 5 Years | 261 (14.1%) | 180 (14.4%) |
| 6 to 11 Years | 1,300 (14.3%) | 1,736 (19.5%) |
| 12 to 14 Years | 645 (12.2%) | 798 (15.6%) |
| 15 Years | 289 (17.5%) | 138 (10.5%) |
| 16 and 17 Years | 343 (10.5%) | 593 (17.1%) |
| 18 to 24 Years | 3,740 (21.2%) | 4,453 (26.1%) |
| 25 to 34 Years | 2,504 (12.0%) | 2,701 (13.1%) |
| 35 to 44 Years | 1,496 (8.0%) | 2,203 (11.8%) |
| 45 to 54 Years | 1,842 (10.2%) | 1,382 (7.5%) |
| 55 to 64 Years | 1,832 (9.2%) | 2,168 (10.4%) |
| 65 to 74 Years | 1,252 (8.4%) | 1,383 (8.2%) |
| 75 Years and over | 556 (6.6%) | 1,252 (9.9%) |
| Total | 17,430 (11.8%) | 20,178 (13.2%) |
Income Above Poverty by Sex and Age in Albany County
According to the poverty statistics in Albany County, males aged 75 years and over and females aged 45 to 54 years are the age groups that are most secure financially, with 93.4% of males and 92.5% of females in these age groups living above the poverty line.
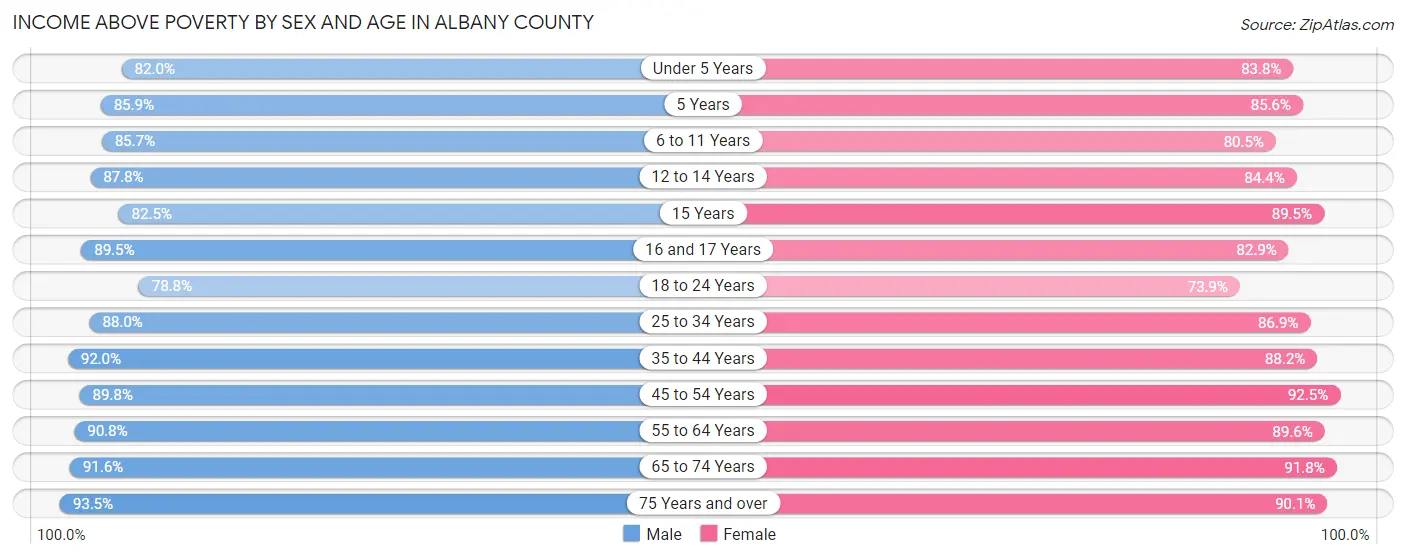
| Age Bracket | Male | Female |
| Under 5 Years | 6,233 (82.0%) | 6,157 (83.8%) |
| 5 Years | 1,585 (85.9%) | 1,067 (85.6%) |
| 6 to 11 Years | 7,777 (85.7%) | 7,178 (80.5%) |
| 12 to 14 Years | 4,649 (87.8%) | 4,322 (84.4%) |
| 15 Years | 1,366 (82.5%) | 1,171 (89.5%) |
| 16 and 17 Years | 2,913 (89.5%) | 2,882 (82.9%) |
| 18 to 24 Years | 13,899 (78.8%) | 12,591 (73.9%) |
| 25 to 34 Years | 18,300 (88.0%) | 17,971 (86.9%) |
| 35 to 44 Years | 17,160 (92.0%) | 16,510 (88.2%) |
| 45 to 54 Years | 16,212 (89.8%) | 16,968 (92.5%) |
| 55 to 64 Years | 18,008 (90.8%) | 18,722 (89.6%) |
| 65 to 74 Years | 13,626 (91.6%) | 15,542 (91.8%) |
| 75 Years and over | 7,937 (93.4%) | 11,396 (90.1%) |
| Total | 129,665 (88.1%) | 132,477 (86.8%) |
Income Below Poverty Among Married-Couple Families in Albany County
The poverty statistics for married-couple families in Albany County show that 2.6% or 1,372 of the total 53,021 families live below the poverty line. Families with 5 or more children have the highest poverty rate of 15.3%, comprising of 35 families. On the other hand, families with no children have the lowest poverty rate of 1.8%, which includes 594 families.
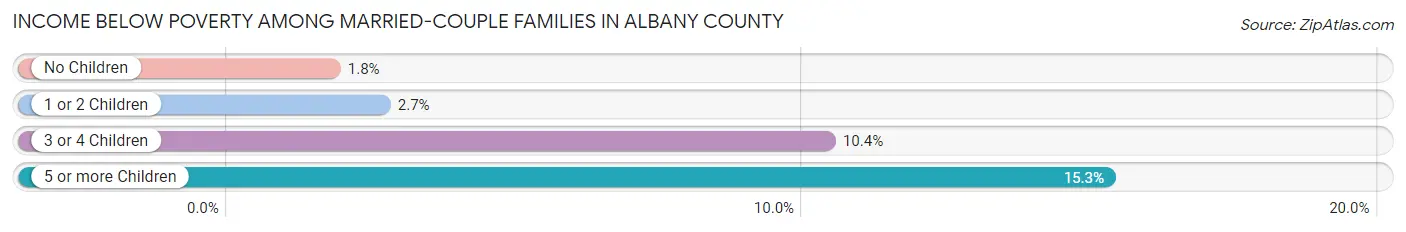
| Children | Above Poverty | Below Poverty |
| No Children | 32,634 (98.2%) | 594 (1.8%) |
| 1 or 2 Children | 16,249 (97.3%) | 444 (2.7%) |
| 3 or 4 Children | 2,572 (89.6%) | 299 (10.4%) |
| 5 or more Children | 194 (84.7%) | 35 (15.3%) |
| Total | 51,649 (97.4%) | 1,372 (2.6%) |
Income Below Poverty Among Single-Parent Households in Albany County
According to the poverty data in Albany County, 11.7% or 590 single-father households and 22.0% or 3,291 single-mother households are living below the poverty line. Among single-father households, those with 3 or 4 children have the highest poverty rate, with 80 households (40.4%) experiencing poverty. Likewise, among single-mother households, those with 5 or more children have the highest poverty rate, with 74 households (64.9%) falling below the poverty line.
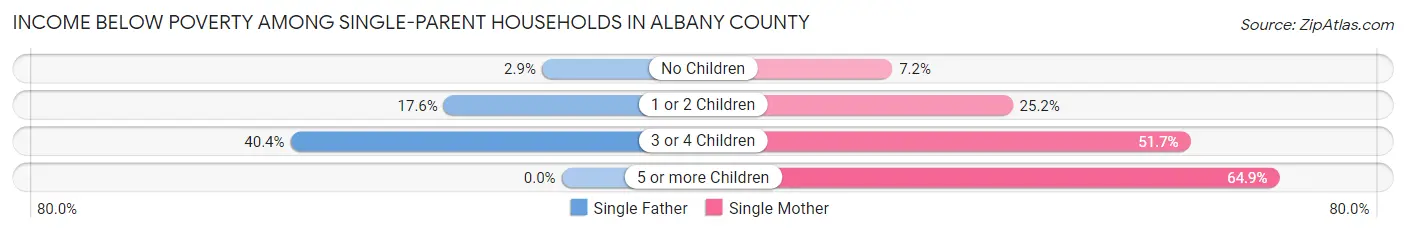
| Children | Single Father | Single Mother |
| No Children | 69 (2.9%) | 399 (7.2%) |
| 1 or 2 Children | 441 (17.6%) | 1,918 (25.2%) |
| 3 or 4 Children | 80 (40.4%) | 900 (51.7%) |
| 5 or more Children | 0 (0.0%) | 74 (64.9%) |
| Total | 590 (11.7%) | 3,291 (22.0%) |
Income Below Poverty Among Married-Couple vs Single-Parent Households in Albany County
The poverty data for Albany County shows that 1,372 of the married-couple family households (2.6%) and 3,881 of the single-parent households (19.4%) are living below the poverty level. Within the married-couple family households, those with 5 or more children have the highest poverty rate, with 35 households (15.3%) falling below the poverty line. Among the single-parent households, those with 5 or more children have the highest poverty rate, with 74 household (61.2%) living below poverty.
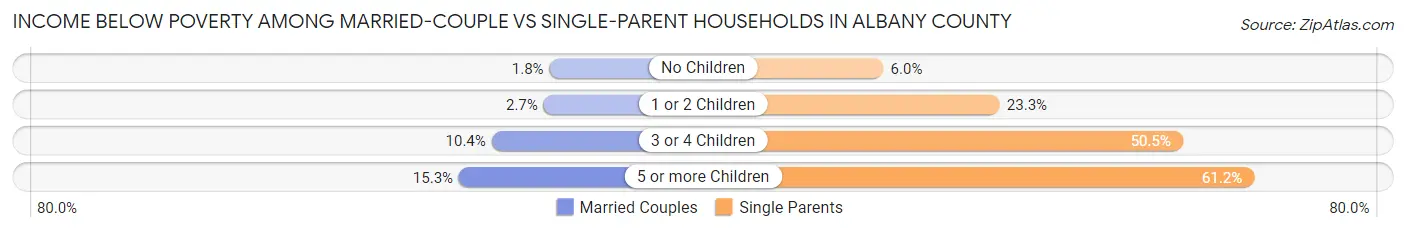
| Children | Married-Couple Families | Single-Parent Households |
| No Children | 594 (1.8%) | 468 (6.0%) |
| 1 or 2 Children | 444 (2.7%) | 2,359 (23.3%) |
| 3 or 4 Children | 299 (10.4%) | 980 (50.5%) |
| 5 or more Children | 35 (15.3%) | 74 (61.2%) |
| Total | 1,372 (2.6%) | 3,881 (19.4%) |
Race in Albany County
The most populous races in Albany County are White / Caucasian (227,136 | 72.1%), Black / African American (38,455 | 12.2%), and Asian (23,091 | 7.3%).
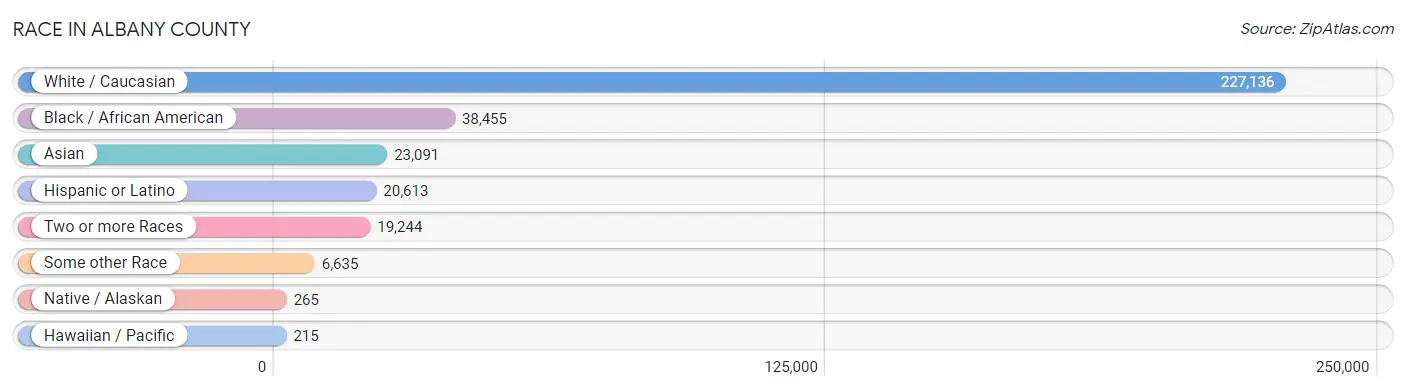
| Race | # Population | % Population |
| Asian | 23,091 | 7.3% |
| Black / African American | 38,455 | 12.2% |
| Hawaiian / Pacific | 215 | 0.1% |
| Hispanic or Latino | 20,613 | 6.5% |
| Native / Alaskan | 265 | 0.1% |
| White / Caucasian | 227,136 | 72.1% |
| Two or more Races | 19,244 | 6.1% |
| Some other Race | 6,635 | 2.1% |
| Total | 315,041 | 100.0% |
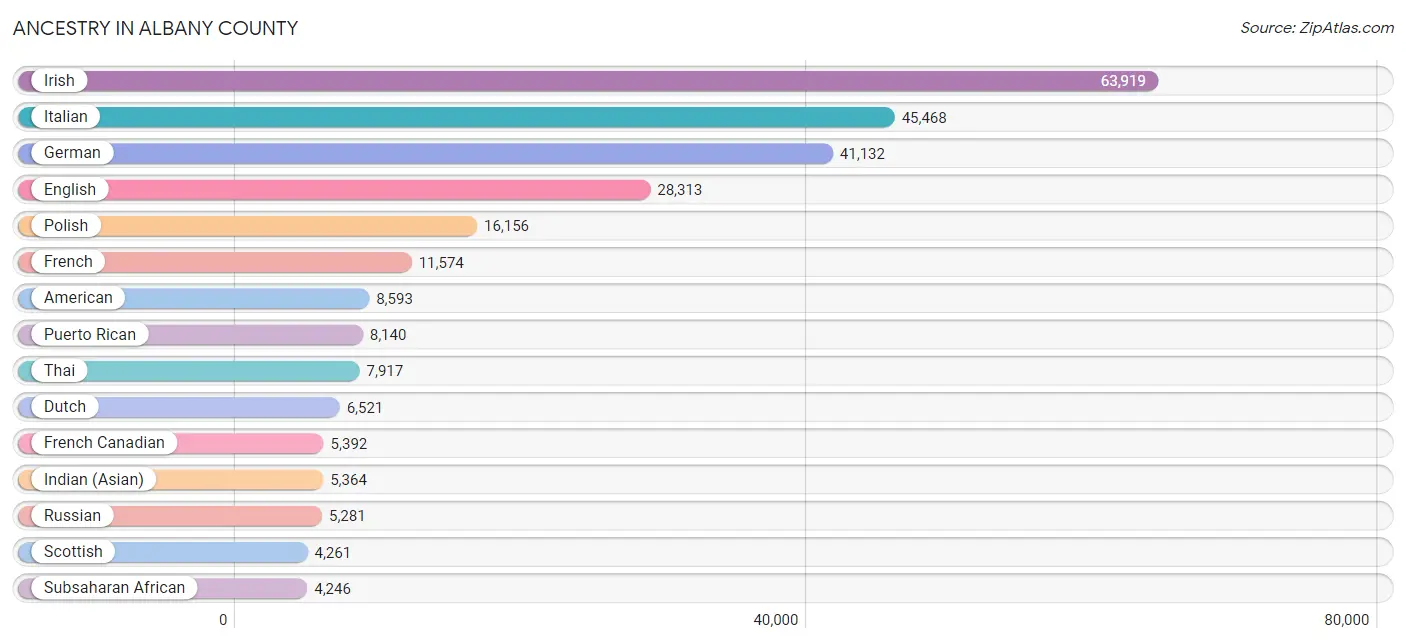
Ancestry in Albany County
The most populous ancestries reported in Albany County are Irish (63,919 | 20.3%), Italian (45,468 | 14.4%), German (41,132 | 13.1%), English (28,313 | 9.0%), and Polish (16,156 | 5.1%), together accounting for 61.9% of all Albany County residents.
| Ancestry | # Population | % Population |
| Afghan | 1,176 | 0.4% |
| African | 1,562 | 0.5% |
| Albanian | 1,234 | 0.4% |
| Alsatian | 5 | 0.0% |
| American | 8,593 | 2.7% |
| Arab | 2,745 | 0.9% |
| Argentinean | 357 | 0.1% |
| Armenian | 1,199 | 0.4% |
| Australian | 40 | 0.0% |
| Austrian | 722 | 0.2% |
| Bahamian | 9 | 0.0% |
| Barbadian | 110 | 0.0% |
| Basque | 24 | 0.0% |
| Belgian | 98 | 0.0% |
| Belizean | 1 | 0.0% |
| Bhutanese | 839 | 0.3% |
| Blackfeet | 146 | 0.1% |
| Bolivian | 125 | 0.0% |
| Brazilian | 223 | 0.1% |
| British | 1,377 | 0.4% |
| British West Indian | 131 | 0.0% |
| Bulgarian | 55 | 0.0% |
| Burmese | 1,695 | 0.5% |
| Cajun | 8 | 0.0% |
| Cambodian | 22 | 0.0% |
| Canadian | 523 | 0.2% |
| Carpatho Rusyn | 43 | 0.0% |
| Celtic | 175 | 0.1% |
| Central American | 1,566 | 0.5% |
| Central American Indian | 96 | 0.0% |
| Cherokee | 601 | 0.2% |
| Cheyenne | 6 | 0.0% |
| Chilean | 71 | 0.0% |
| Chippewa | 11 | 0.0% |
| Choctaw | 12 | 0.0% |
| Colombian | 633 | 0.2% |
| Costa Rican | 194 | 0.1% |
| Creek | 65 | 0.0% |
| Croatian | 285 | 0.1% |
| Cuban | 975 | 0.3% |
| Cypriot | 7 | 0.0% |
| Czech | 586 | 0.2% |
| Czechoslovakian | 325 | 0.1% |
| Danish | 830 | 0.3% |
| Delaware | 3 | 0.0% |
| Dominican | 2,981 | 0.9% |
| Dutch | 6,521 | 2.1% |
| Eastern European | 1,414 | 0.4% |
| Ecuadorian | 843 | 0.3% |
| Egyptian | 460 | 0.2% |
| English | 28,313 | 9.0% |
| Estonian | 17 | 0.0% |
| Ethiopian | 170 | 0.1% |
| European | 4,146 | 1.3% |
| Filipino | 173 | 0.1% |
| Finnish | 307 | 0.1% |
| French | 11,574 | 3.7% |
| French American Indian | 76 | 0.0% |
| French Canadian | 5,392 | 1.7% |
| German | 41,132 | 13.1% |
| German Russian | 46 | 0.0% |
| Ghanaian | 454 | 0.1% |
| Greek | 1,687 | 0.5% |
| Guatemalan | 147 | 0.1% |
| Guyanese | 839 | 0.3% |
| Haitian | 623 | 0.2% |
| Honduran | 144 | 0.1% |
| Hungarian | 1,493 | 0.5% |
| Icelander | 71 | 0.0% |
| Indian (Asian) | 5,364 | 1.7% |
| Indonesian | 1,042 | 0.3% |
| Inupiat | 6 | 0.0% |
| Iranian | 392 | 0.1% |
| Iraqi | 249 | 0.1% |
| Irish | 63,919 | 20.3% |
| Iroquois | 359 | 0.1% |
| Israeli | 110 | 0.0% |
| Italian | 45,468 | 14.4% |
| Jamaican | 2,776 | 0.9% |
| Japanese | 129 | 0.0% |
| Jordanian | 97 | 0.0% |
| Kenyan | 103 | 0.0% |
| Korean | 3,068 | 1.0% |
| Laotian | 40 | 0.0% |
| Latvian | 449 | 0.1% |
| Lebanese | 863 | 0.3% |
| Liberian | 23 | 0.0% |
| Lithuanian | 835 | 0.3% |
| Luxembourger | 41 | 0.0% |
| Macedonian | 110 | 0.0% |
| Maltese | 18 | 0.0% |
| Mexican | 2,396 | 0.8% |
| Mexican American Indian | 61 | 0.0% |
| Mongolian | 242 | 0.1% |
| Moroccan | 166 | 0.1% |
| Native Hawaiian | 44 | 0.0% |
| Navajo | 34 | 0.0% |
| Nicaraguan | 22 | 0.0% |
| Nigerian | 852 | 0.3% |
| Northern European | 309 | 0.1% |
| Norwegian | 1,259 | 0.4% |
| Ottawa | 38 | 0.0% |
| Pakistani | 388 | 0.1% |
| Palestinian | 3 | 0.0% |
| Panamanian | 146 | 0.1% |
| Paraguayan | 16 | 0.0% |
| Pennsylvania German | 22 | 0.0% |
| Peruvian | 400 | 0.1% |
| Polish | 16,156 | 5.1% |
| Portuguese | 708 | 0.2% |
| Potawatomi | 1 | 0.0% |
| Pueblo | 28 | 0.0% |
| Puerto Rican | 8,140 | 2.6% |
| Romanian | 361 | 0.1% |
| Russian | 5,281 | 1.7% |
| Salvadoran | 913 | 0.3% |
| Samoan | 36 | 0.0% |
| Scandinavian | 448 | 0.1% |
| Scotch-Irish | 1,889 | 0.6% |
| Scottish | 4,261 | 1.3% |
| Seminole | 5 | 0.0% |
| Senegalese | 315 | 0.1% |
| Serbian | 131 | 0.0% |
| Sioux | 22 | 0.0% |
| Slavic | 47 | 0.0% |
| Slovak | 537 | 0.2% |
| Slovene | 40 | 0.0% |
| South African | 166 | 0.1% |
| South American | 2,537 | 0.8% |
| South American Indian | 14 | 0.0% |
| Spaniard | 613 | 0.2% |
| Spanish | 365 | 0.1% |
| Spanish American | 154 | 0.1% |
| Sri Lankan | 1,458 | 0.5% |
| Subsaharan African | 4,246 | 1.3% |
| Sudanese | 262 | 0.1% |
| Swedish | 1,608 | 0.5% |
| Swiss | 510 | 0.2% |
| Syrian | 311 | 0.1% |
| Thai | 7,917 | 2.5% |
| Trinidadian and Tobagonian | 359 | 0.1% |
| Turkish | 322 | 0.1% |
| U.S. Virgin Islander | 14 | 0.0% |
| Ugandan | 125 | 0.0% |
| Ukrainian | 2,752 | 0.9% |
| Uruguayan | 36 | 0.0% |
| Venezuelan | 22 | 0.0% |
| Vietnamese | 381 | 0.1% |
| Welsh | 1,597 | 0.5% |
| West Indian | 401 | 0.1% |
| Yugoslavian | 762 | 0.2% |
| Zimbabwean | 4 | 0.0% | View All 152 Rows |
Immigrants in Albany County
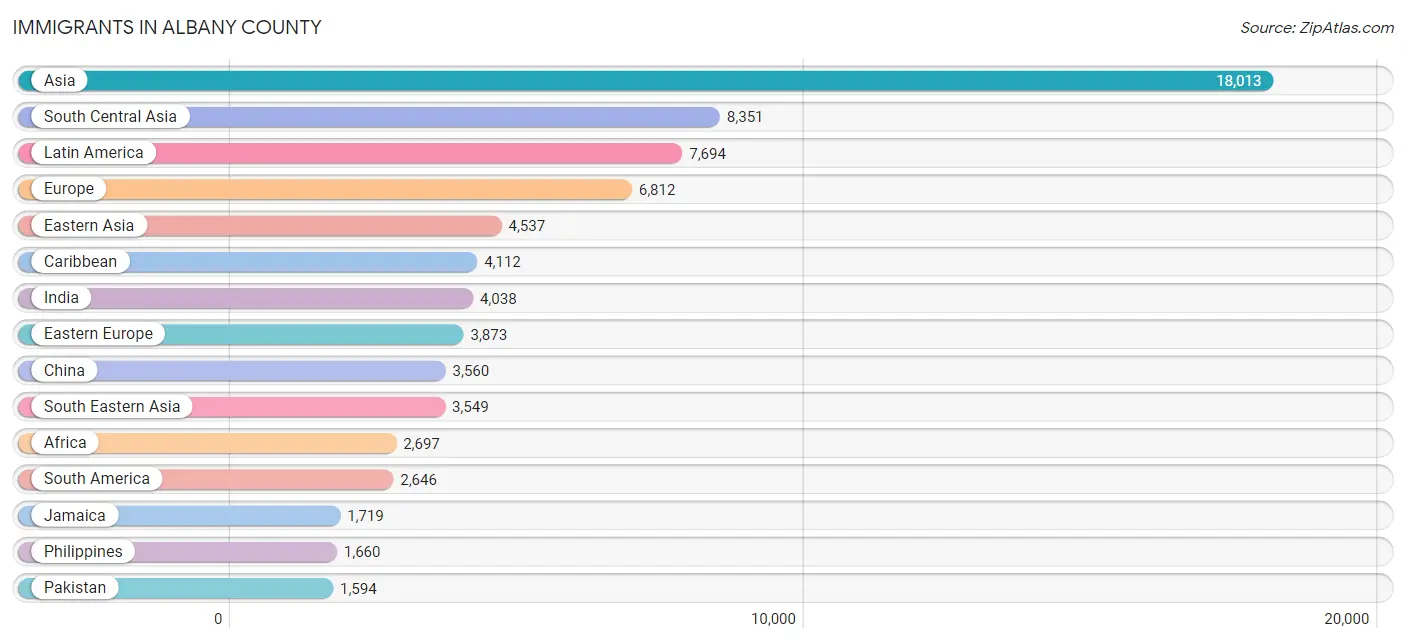
The most numerous immigrant groups reported in Albany County came from Asia (18,013 | 5.7%), South Central Asia (8,351 | 2.6%), Latin America (7,694 | 2.4%), Europe (6,812 | 2.2%), and Eastern Asia (4,537 | 1.4%), together accounting for 14.4% of all Albany County residents.
| Immigration Origin | # Population | % Population |
| Afghanistan | 920 | 0.3% |
| Africa | 2,697 | 0.9% |
| Albania | 871 | 0.3% |
| Argentina | 235 | 0.1% |
| Armenia | 26 | 0.0% |
| Asia | 18,013 | 5.7% |
| Australia | 29 | 0.0% |
| Austria | 12 | 0.0% |
| Bahamas | 9 | 0.0% |
| Bangladesh | 970 | 0.3% |
| Barbados | 72 | 0.0% |
| Belarus | 24 | 0.0% |
| Belgium | 38 | 0.0% |
| Bolivia | 28 | 0.0% |
| Bosnia and Herzegovina | 218 | 0.1% |
| Brazil | 234 | 0.1% |
| Bulgaria | 39 | 0.0% |
| Cambodia | 19 | 0.0% |
| Cameroon | 47 | 0.0% |
| Canada | 647 | 0.2% |
| Caribbean | 4,112 | 1.3% |
| Central America | 936 | 0.3% |
| Chile | 31 | 0.0% |
| China | 3,560 | 1.1% |
| Colombia | 261 | 0.1% |
| Congo | 25 | 0.0% |
| Costa Rica | 79 | 0.0% |
| Croatia | 145 | 0.1% |
| Cuba | 157 | 0.1% |
| Czechoslovakia | 19 | 0.0% |
| Denmark | 36 | 0.0% |
| Dominica | 13 | 0.0% |
| Dominican Republic | 1,363 | 0.4% |
| Eastern Africa | 782 | 0.3% |
| Eastern Asia | 4,537 | 1.4% |
| Eastern Europe | 3,873 | 1.2% |
| Ecuador | 439 | 0.1% |
| Egypt | 250 | 0.1% |
| El Salvador | 301 | 0.1% |
| England | 264 | 0.1% |
| Eritrea | 12 | 0.0% |
| Ethiopia | 120 | 0.0% |
| Europe | 6,812 | 2.2% |
| Fiji | 8 | 0.0% |
| France | 142 | 0.1% |
| Germany | 453 | 0.1% |
| Ghana | 383 | 0.1% |
| Greece | 161 | 0.1% |
| Grenada | 24 | 0.0% |
| Guatemala | 110 | 0.0% |
| Guyana | 1,093 | 0.4% |
| Haiti | 258 | 0.1% |
| Honduras | 26 | 0.0% |
| Hong Kong | 104 | 0.0% |
| Hungary | 65 | 0.0% |
| India | 4,038 | 1.3% |
| Indonesia | 5 | 0.0% |
| Iran | 211 | 0.1% |
| Iraq | 405 | 0.1% |
| Ireland | 183 | 0.1% |
| Israel | 61 | 0.0% |
| Italy | 795 | 0.3% |
| Jamaica | 1,719 | 0.5% |
| Japan | 202 | 0.1% |
| Jordan | 178 | 0.1% |
| Kazakhstan | 63 | 0.0% |
| Kenya | 51 | 0.0% |
| Korea | 753 | 0.2% |
| Kuwait | 26 | 0.0% |
| Laos | 16 | 0.0% |
| Latin America | 7,694 | 2.4% |
| Latvia | 52 | 0.0% |
| Lebanon | 106 | 0.0% |
| Malaysia | 134 | 0.0% |
| Mexico | 388 | 0.1% |
| Micronesia | 19 | 0.0% |
| Middle Africa | 197 | 0.1% |
| Moldova | 19 | 0.0% |
| Morocco | 71 | 0.0% |
| Nepal | 416 | 0.1% |
| Netherlands | 100 | 0.0% |
| Nigeria | 439 | 0.1% |
| Northern Africa | 426 | 0.1% |
| Northern Europe | 979 | 0.3% |
| Oceania | 98 | 0.0% |
| Pakistan | 1,594 | 0.5% |
| Panama | 32 | 0.0% |
| Peru | 251 | 0.1% |
| Philippines | 1,660 | 0.5% |
| Poland | 463 | 0.2% |
| Portugal | 17 | 0.0% |
| Romania | 92 | 0.0% |
| Russia | 742 | 0.2% |
| Saudi Arabia | 183 | 0.1% |
| Scotland | 140 | 0.0% |
| Senegal | 114 | 0.0% |
| Serbia | 35 | 0.0% |
| Sierra Leone | 32 | 0.0% |
| South Africa | 96 | 0.0% |
| South America | 2,646 | 0.8% |
| South Central Asia | 8,351 | 2.6% |
| South Eastern Asia | 3,549 | 1.1% |
| Southern Europe | 1,000 | 0.3% |
| Spain | 27 | 0.0% |
| Sri Lanka | 10 | 0.0% |
| St. Vincent and the Grenadines | 42 | 0.0% |
| Sudan | 101 | 0.0% |
| Sweden | 45 | 0.0% |
| Switzerland | 215 | 0.1% |
| Syria | 110 | 0.0% |
| Taiwan | 346 | 0.1% |
| Thailand | 341 | 0.1% |
| Trinidad and Tobago | 216 | 0.1% |
| Turkey | 318 | 0.1% |
| Uganda | 99 | 0.0% |
| Ukraine | 470 | 0.2% |
| Uruguay | 10 | 0.0% |
| Uzbekistan | 122 | 0.0% |
| Venezuela | 48 | 0.0% |
| Vietnam | 722 | 0.2% |
| West Indies | 87 | 0.0% |
| Western Africa | 1,081 | 0.3% |
| Western Asia | 1,530 | 0.5% |
| Western Europe | 960 | 0.3% |
| Yemen | 83 | 0.0% |
| Zaire | 125 | 0.0% |
| Zimbabwe | 4 | 0.0% | View All 127 Rows |
Sex and Age in Albany County
Sex and Age in Albany County
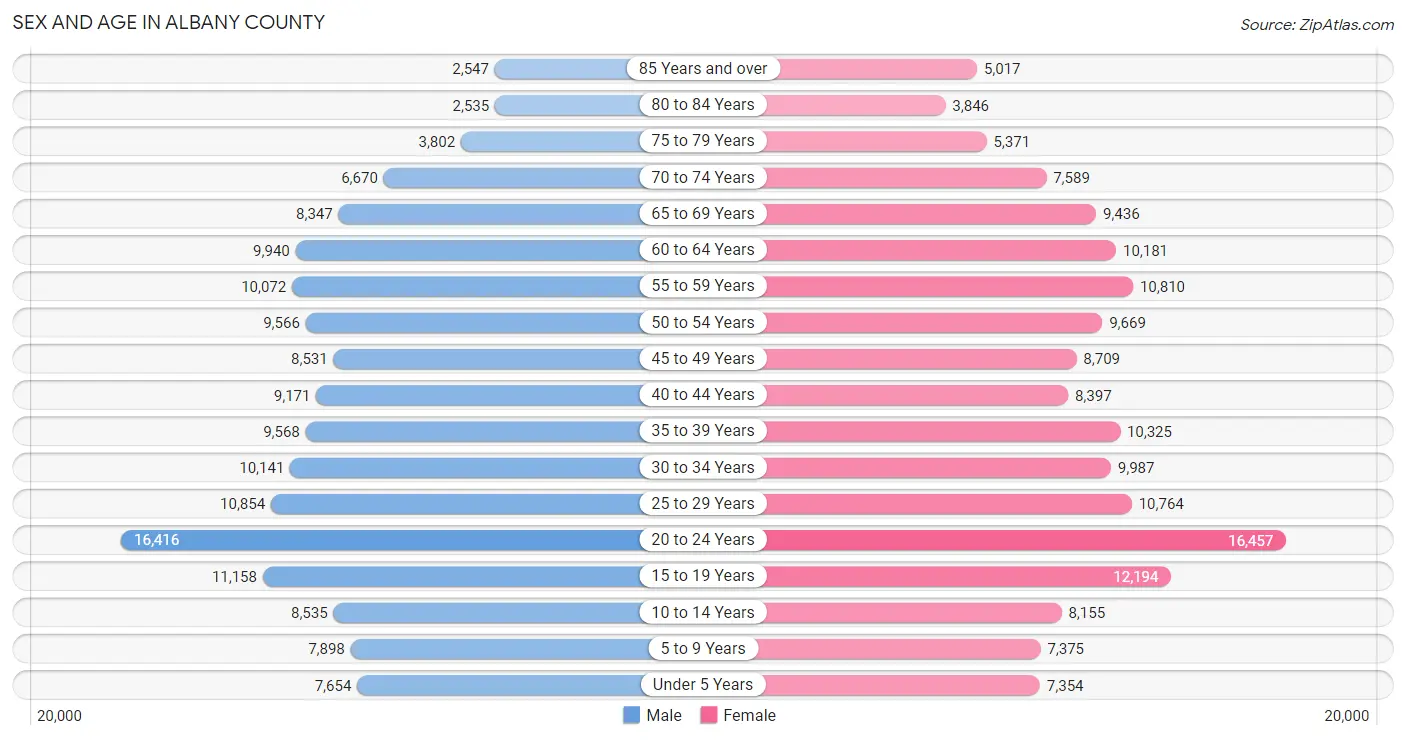
The most populous age groups in Albany County are 20 to 24 Years (16,416 | 10.7%) for men and 20 to 24 Years (16,457 | 10.2%) for women.
| Age Bracket | Male | Female |
| Under 5 Years | 7,654 (5.0%) | 7,354 (4.5%) |
| 5 to 9 Years | 7,898 (5.1%) | 7,375 (4.6%) |
| 10 to 14 Years | 8,535 (5.6%) | 8,155 (5.1%) |
| 15 to 19 Years | 11,158 (7.3%) | 12,194 (7.5%) |
| 20 to 24 Years | 16,416 (10.7%) | 16,457 (10.2%) |
| 25 to 29 Years | 10,854 (7.1%) | 10,764 (6.7%) |
| 30 to 34 Years | 10,141 (6.6%) | 9,987 (6.2%) |
| 35 to 39 Years | 9,568 (6.2%) | 10,325 (6.4%) |
| 40 to 44 Years | 9,171 (6.0%) | 8,397 (5.2%) |
| 45 to 49 Years | 8,531 (5.6%) | 8,709 (5.4%) |
| 50 to 54 Years | 9,566 (6.2%) | 9,669 (6.0%) |
| 55 to 59 Years | 10,072 (6.6%) | 10,810 (6.7%) |
| 60 to 64 Years | 9,940 (6.5%) | 10,181 (6.3%) |
| 65 to 69 Years | 8,347 (5.4%) | 9,436 (5.8%) |
| 70 to 74 Years | 6,670 (4.3%) | 7,589 (4.7%) |
| 75 to 79 Years | 3,802 (2.5%) | 5,371 (3.3%) |
| 80 to 84 Years | 2,535 (1.7%) | 3,846 (2.4%) |
| 85 Years and over | 2,547 (1.7%) | 5,017 (3.1%) |
| Total | 153,405 (100.0%) | 161,636 (100.0%) |
Families and Households in Albany County
Median Family Size in Albany County
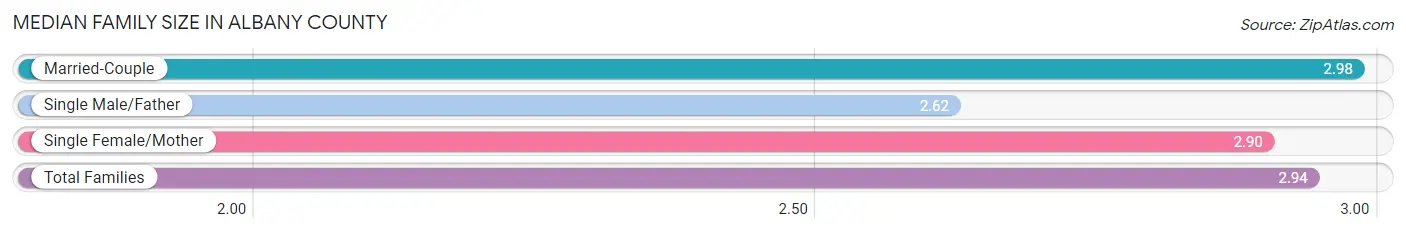
The median family size in Albany County is 2.94 persons per family, with married-couple families (53,021 | 72.6%) accounting for the largest median family size of 2.98 persons per family. On the other hand, single male/father families (5,062 | 6.9%) represent the smallest median family size with 2.62 persons per family.
| Family Type | # Families | Family Size |
| Married-Couple | 53,021 (72.6%) | 2.98 |
| Single Male/Father | 5,062 (6.9%) | 2.62 |
| Single Female/Mother | 14,985 (20.5%) | 2.90 |
| Total Families | 73,068 (100.0%) | 2.94 |
Median Household Size in Albany County
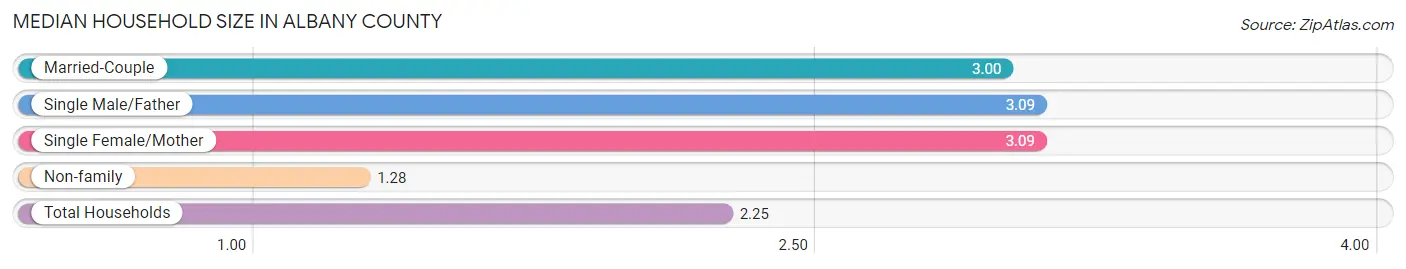
The median household size in Albany County is 2.25 persons per household, with single male/father households (5,062 | 3.8%) accounting for the largest median household size of 3.09 persons per household. non-family households (59,107 | 44.7%) represent the smallest median household size with 1.28 persons per household.
| Household Type | # Households | Household Size |
| Married-Couple | 53,021 (40.1%) | 3.00 |
| Single Male/Father | 5,062 (3.8%) | 3.09 |
| Single Female/Mother | 14,985 (11.3%) | 3.09 |
| Non-family | 59,107 (44.7%) | 1.28 |
| Total Households | 132,175 (100.0%) | 2.25 |
Household Size by Marriage Status in Albany County
Out of a total of 132,175 households in Albany County, 73,068 (55.3%) are family households, while 59,107 (44.7%) are nonfamily households. The most numerous type of family households are 2-person households, comprising 34,206, and the most common type of nonfamily households are 1-person households, comprising 45,731.
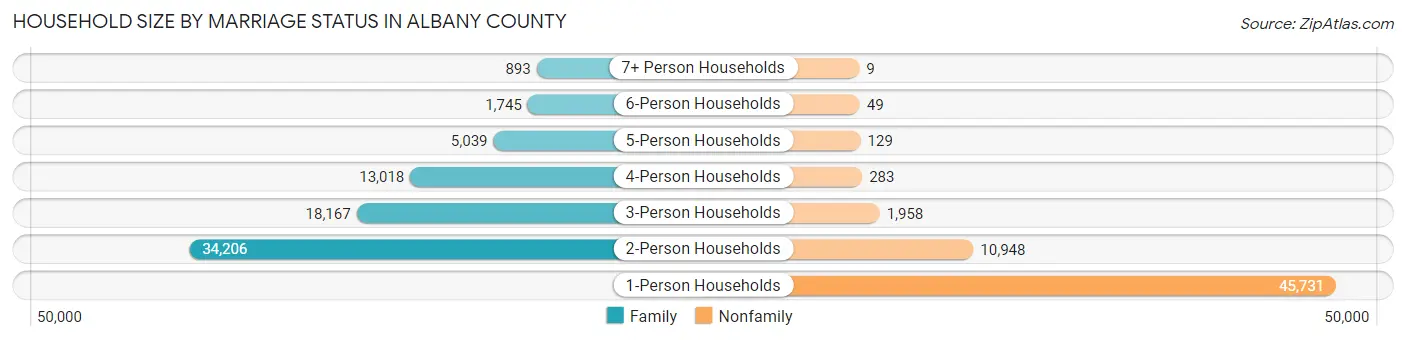
| Household Size | Family Households | Nonfamily Households |
| 1-Person Households | - | 45,731 (34.6%) |
| 2-Person Households | 34,206 (25.9%) | 10,948 (8.3%) |
| 3-Person Households | 18,167 (13.7%) | 1,958 (1.5%) |
| 4-Person Households | 13,018 (9.9%) | 283 (0.2%) |
| 5-Person Households | 5,039 (3.8%) | 129 (0.1%) |
| 6-Person Households | 1,745 (1.3%) | 49 (0.0%) |
| 7+ Person Households | 893 (0.7%) | 9 (0.0%) |
| Total | 73,068 (55.3%) | 59,107 (44.7%) |
Female Fertility in Albany County
Fertility by Age in Albany County
Average fertility rate in Albany County is 43.0 births per 1,000 women. Women in the age bracket of 20 to 34 years have the highest fertility rate with 69.0 births per 1,000 women. Women in the age bracket of 20 to 34 years acount for 75.2% of all women with births.
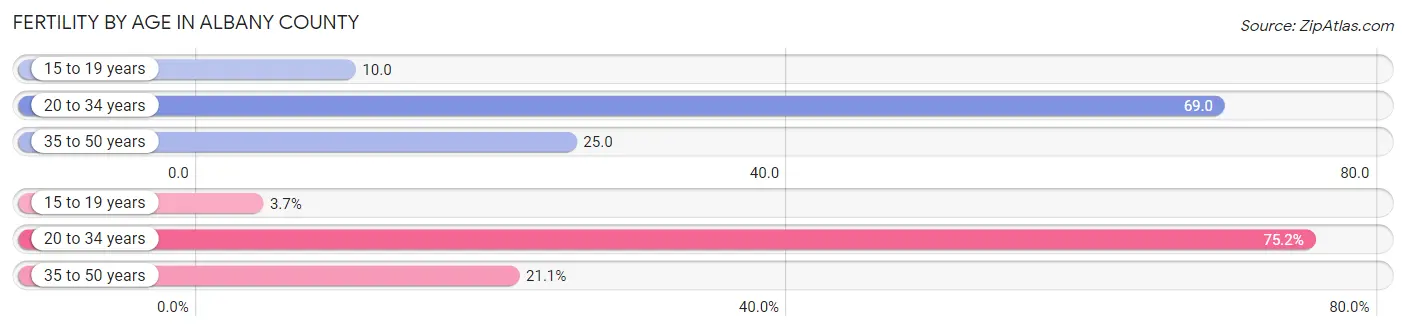
| Age Bracket | Women with Births | Births / 1,000 Women |
| 15 to 19 years | 127 (3.7%) | 10.0 |
| 20 to 34 years | 2,560 (75.2%) | 69.0 |
| 35 to 50 years | 719 (21.1%) | 25.0 |
| Total | 3,406 (100.0%) | 43.0 |
Fertility by Age by Marriage Status in Albany County
68.3% of women with births (3,406) in Albany County are married. The highest percentage of unmarried women with births falls into 15 to 19 years age bracket with 100.0% of them unmarried at the time of birth, while the lowest percentage of unmarried women with births belong to 20 to 34 years age bracket with 28.7% of them unmarried.
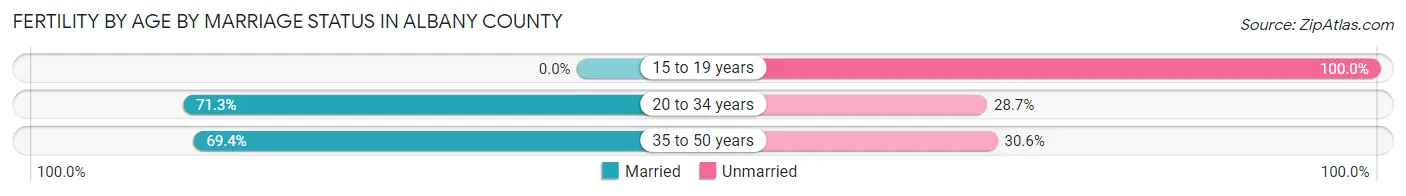
| Age Bracket | Married | Unmarried |
| 15 to 19 years | 0 (0.0%) | 127 (100.0%) |
| 20 to 34 years | 1,825 (71.3%) | 735 (28.7%) |
| 35 to 50 years | 499 (69.4%) | 220 (30.6%) |
| Total | 2,326 (68.3%) | 1,080 (31.7%) |
Fertility by Education in Albany County
Average fertility rate in Albany County is 43.0 births per 1,000 women. Women with the education attainment of less than high school have the highest fertility rate of 57.0 births per 1,000 women, while women with the education attainment of high school diploma have the lowest fertility at 31.0 births per 1,000 women. Women with the education attainment of graduate degree represent 27.2% of all women with births.
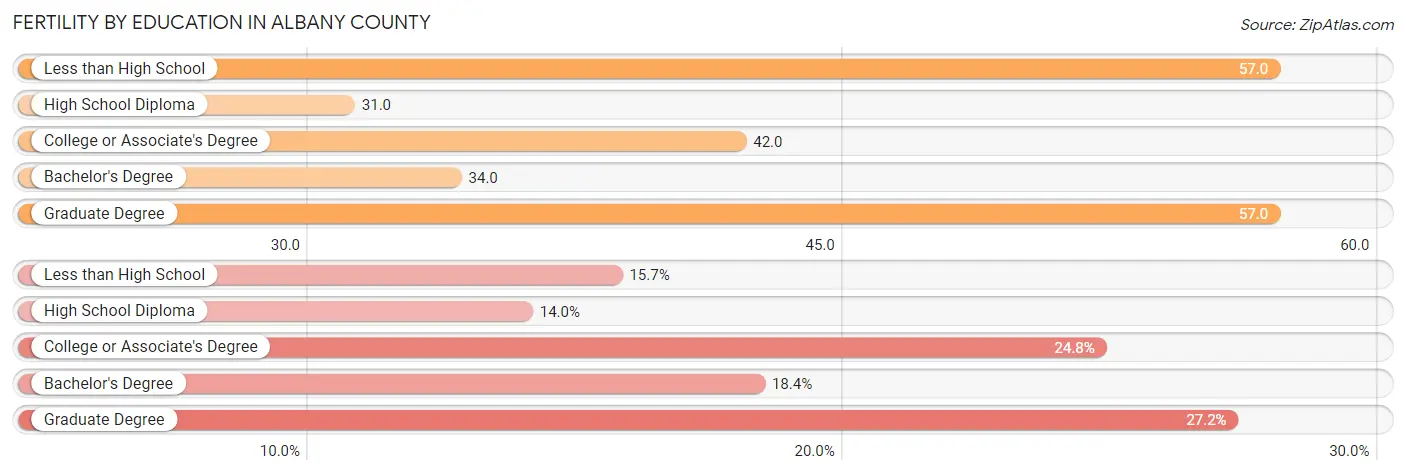
| Educational Attainment | Women with Births | Births / 1,000 Women |
| Less than High School | 534 (15.7%) | 57.0 |
| High School Diploma | 477 (14.0%) | 31.0 |
| College or Associate's Degree | 843 (24.7%) | 42.0 |
| Bachelor's Degree | 625 (18.3%) | 34.0 |
| Graduate Degree | 927 (27.2%) | 57.0 |
| Total | 3,406 (100.0%) | 43.0 |
Fertility by Education by Marriage Status in Albany County
31.7% of women with births in Albany County are unmarried. Women with the educational attainment of graduate degree are most likely to be married with 96.2% of them married at childbirth, while women with the educational attainment of high school diploma are least likely to be married with 65.6% of them unmarried at childbirth.
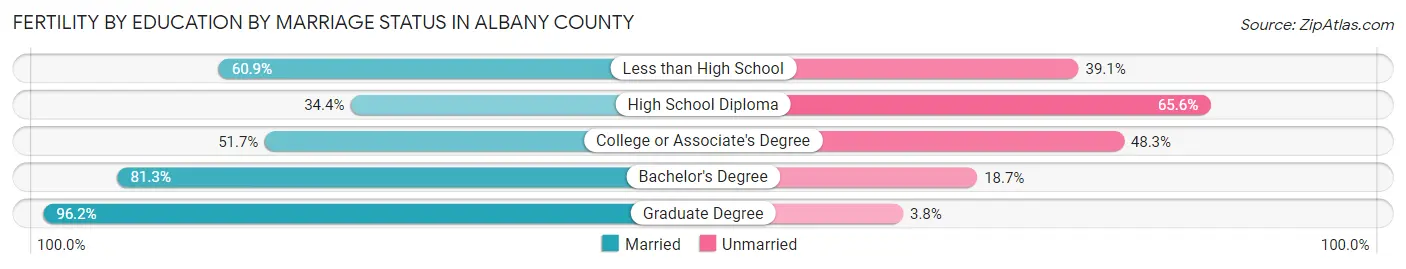
| Educational Attainment | Married | Unmarried |
| Less than High School | 325 (60.9%) | 209 (39.1%) |
| High School Diploma | 164 (34.4%) | 313 (65.6%) |
| College or Associate's Degree | 436 (51.7%) | 407 (48.3%) |
| Bachelor's Degree | 508 (81.3%) | 117 (18.7%) |
| Graduate Degree | 892 (96.2%) | 35 (3.8%) |
| Total | 2,326 (68.3%) | 1,080 (31.7%) |
Employment Characteristics in Albany County
Employment by Class of Employer in Albany County
Among the 157,506 employed individuals in Albany County, private company employees (85,973 | 54.6%), state government employees (23,329 | 14.8%), and not-for-profit organizations (21,062 | 13.4%) make up the most common classes of employment.
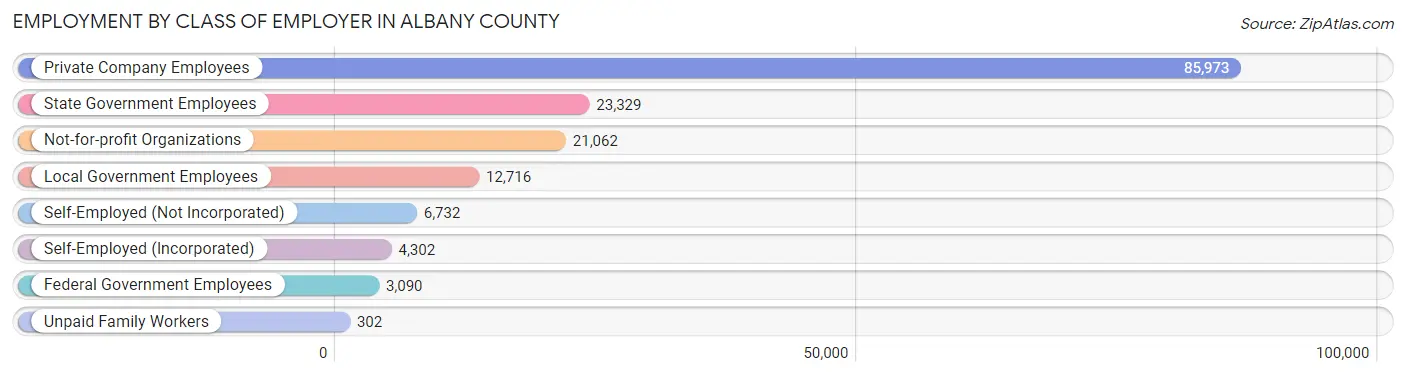
| Employer Class | # Employees | % Employees |
| Private Company Employees | 85,973 | 54.6% |
| Self-Employed (Incorporated) | 4,302 | 2.7% |
| Self-Employed (Not Incorporated) | 6,732 | 4.3% |
| Not-for-profit Organizations | 21,062 | 13.4% |
| Local Government Employees | 12,716 | 8.1% |
| State Government Employees | 23,329 | 14.8% |
| Federal Government Employees | 3,090 | 2.0% |
| Unpaid Family Workers | 302 | 0.2% |
| Total | 157,506 | 100.0% |
Employment Status by Age in Albany County
According to the labor force statistics for Albany County, out of the total population over 16 years of age (265,064), 64.2% or 170,171 individuals are in the labor force, with 5.2% or 8,849 of them unemployed. The age group with the highest labor force participation rate is 30 to 34 years, with 89.7% or 18,055 individuals in the labor force. Within the labor force, the 16 to 19 years age range has the highest percentage of unemployed individuals, with 18.4% or 1,580 of them being unemployed.
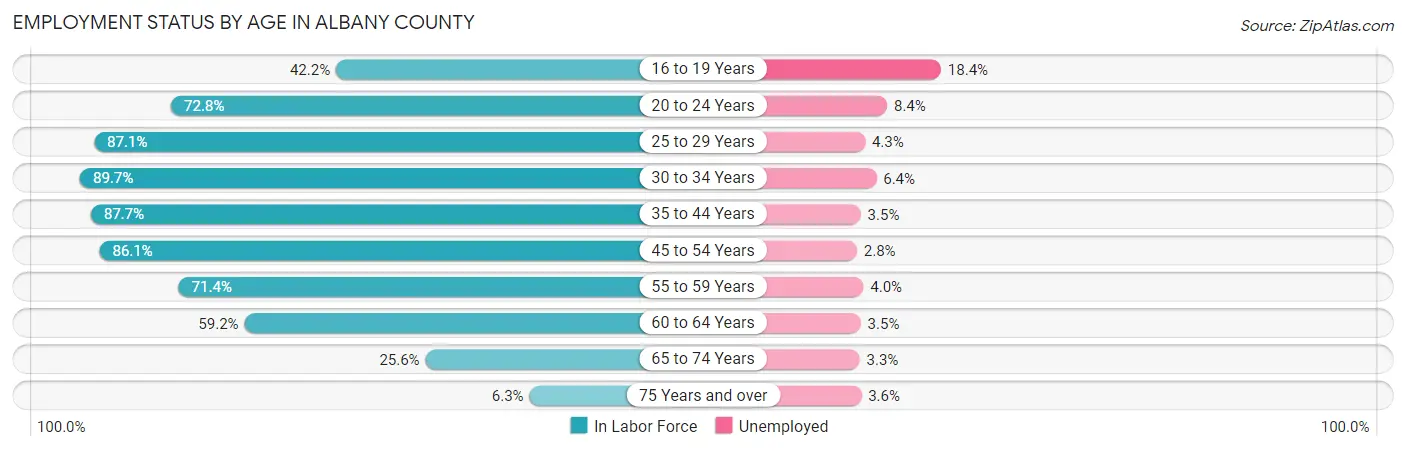
| Age Bracket | In Labor Force | Unemployed |
| 16 to 19 Years | 8,586 (42.2%) | 1,580 (18.4%) |
| 20 to 24 Years | 23,932 (72.8%) | 2,010 (8.4%) |
| 25 to 29 Years | 18,829 (87.1%) | 810 (4.3%) |
| 30 to 34 Years | 18,055 (89.7%) | 1,156 (6.4%) |
| 35 to 44 Years | 32,853 (87.7%) | 1,150 (3.5%) |
| 45 to 54 Years | 31,405 (86.1%) | 879 (2.8%) |
| 55 to 59 Years | 14,910 (71.4%) | 596 (4.0%) |
| 60 to 64 Years | 11,912 (59.2%) | 417 (3.5%) |
| 65 to 74 Years | 8,203 (25.6%) | 271 (3.3%) |
| 75 Years and over | 1,456 (6.3%) | 52 (3.6%) |
| Total | 170,171 (64.2%) | 8,849 (5.2%) |
Employment Status by Educational Attainment in Albany County
According to labor force statistics for Albany County, 81.7% of individuals (128,012) out of the total population between 25 and 64 years of age (156,685) are in the labor force, with 3.9% or 4,992 of them being unemployed. The group with the highest labor force participation rate are those with the educational attainment of bachelor's degree or higher, with 89.7% or 65,502 individuals in the labor force. Within the labor force, individuals with less than high school education have the highest percentage of unemployment, with 13.1% or 872 of them being unemployed.
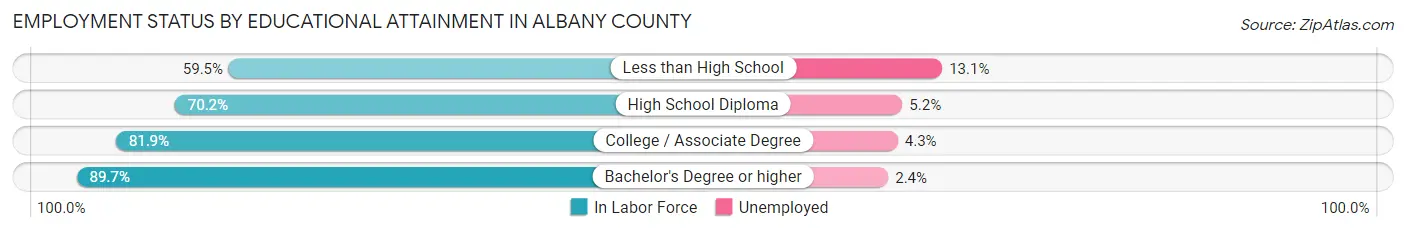
| Educational Attainment | In Labor Force | Unemployed |
| Less than High School | 6,657 (59.5%) | 1,466 (13.1%) |
| High School Diploma | 21,445 (70.2%) | 1,588 (5.2%) |
| College / Associate Degree | 34,337 (81.9%) | 1,803 (4.3%) |
| Bachelor's Degree or higher | 65,502 (89.7%) | 1,753 (2.4%) |
| Total | 128,012 (81.7%) | 6,111 (3.9%) |
Employment Occupations by Sex in Albany County
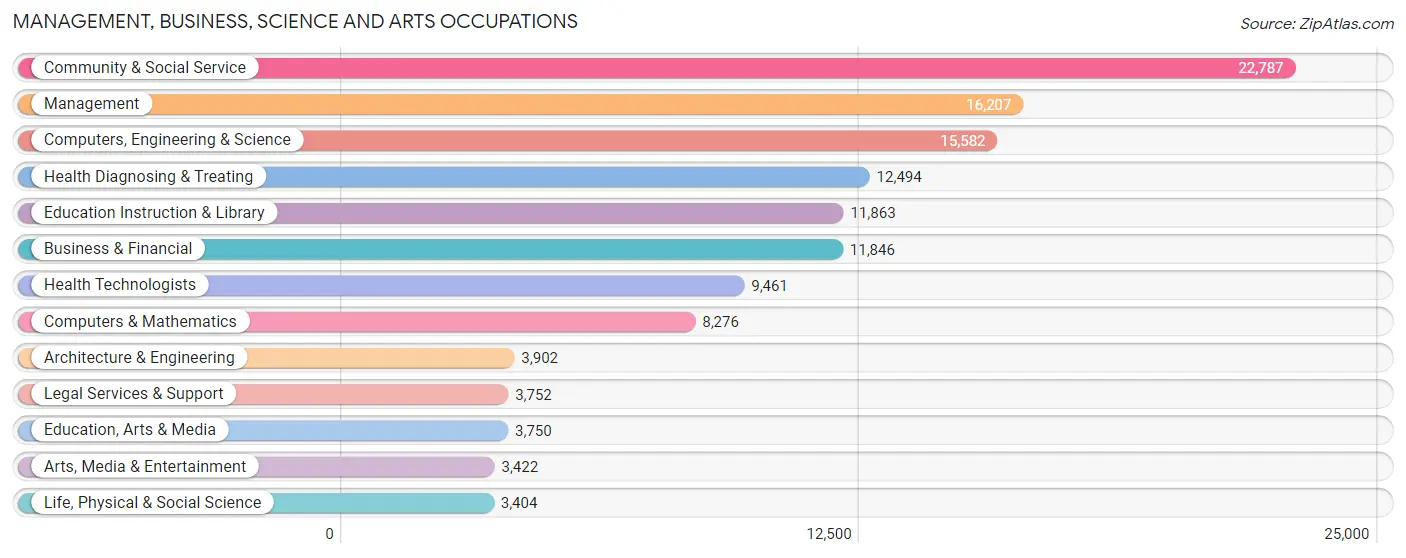
Management, Business, Science and Arts Occupations
The most common Management, Business, Science and Arts occupations in Albany County are Community & Social Service (22,787 | 14.2%), Management (16,207 | 10.1%), Computers, Engineering & Science (15,582 | 9.7%), Health Diagnosing & Treating (12,494 | 7.8%), and Education Instruction & Library (11,863 | 7.4%).
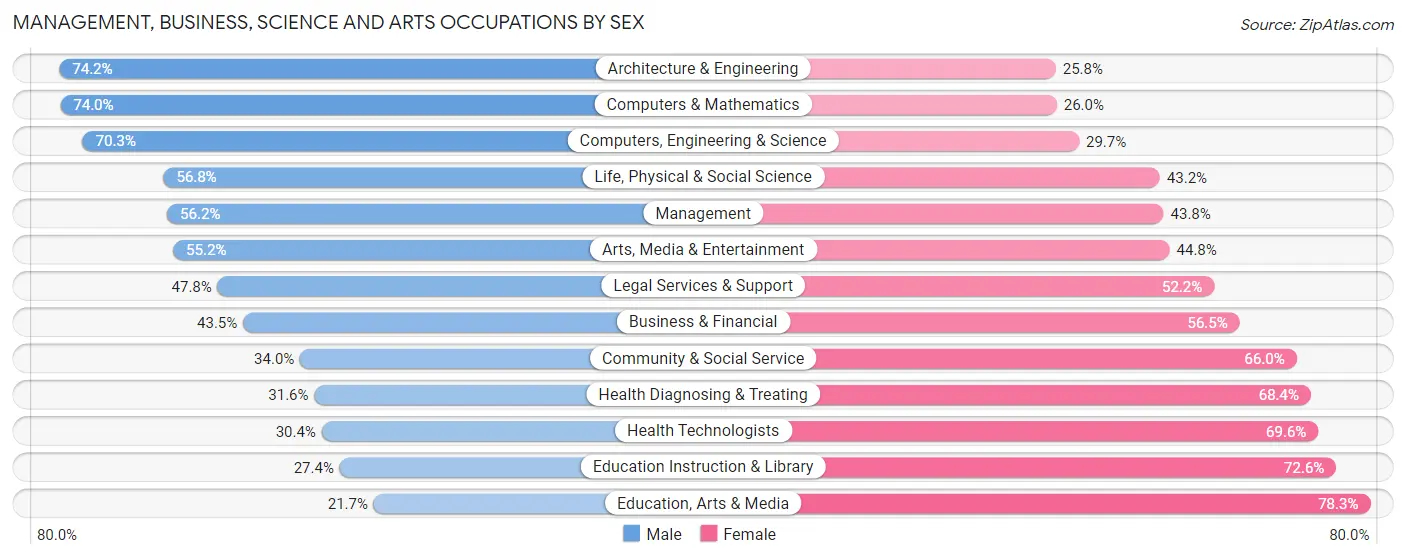
Management, Business, Science and Arts Occupations by Sex
Within the Management, Business, Science and Arts occupations in Albany County, the most male-oriented occupations are Architecture & Engineering (74.2%), Computers & Mathematics (74.0%), and Computers, Engineering & Science (70.3%), while the most female-oriented occupations are Education, Arts & Media (78.3%), Education Instruction & Library (72.6%), and Health Technologists (69.6%).
| Occupation | Male | Female |
| Management | 9,109 (56.2%) | 7,098 (43.8%) |
| Business & Financial | 5,156 (43.5%) | 6,690 (56.5%) |
| Computers, Engineering & Science | 10,956 (70.3%) | 4,626 (29.7%) |
| Computers & Mathematics | 6,127 (74.0%) | 2,149 (26.0%) |
| Architecture & Engineering | 2,895 (74.2%) | 1,007 (25.8%) |
| Life, Physical & Social Science | 1,934 (56.8%) | 1,470 (43.2%) |
| Community & Social Service | 7,749 (34.0%) | 15,038 (66.0%) |
| Education, Arts & Media | 815 (21.7%) | 2,935 (78.3%) |
| Legal Services & Support | 1,793 (47.8%) | 1,959 (52.2%) |
| Education Instruction & Library | 3,252 (27.4%) | 8,611 (72.6%) |
| Arts, Media & Entertainment | 1,889 (55.2%) | 1,533 (44.8%) |
| Health Diagnosing & Treating | 3,953 (31.6%) | 8,541 (68.4%) |
| Health Technologists | 2,878 (30.4%) | 6,583 (69.6%) |
| Total (Category) | 36,923 (46.8%) | 41,993 (53.2%) |
| Total (Overall) | 80,884 (50.3%) | 80,063 (49.7%) |
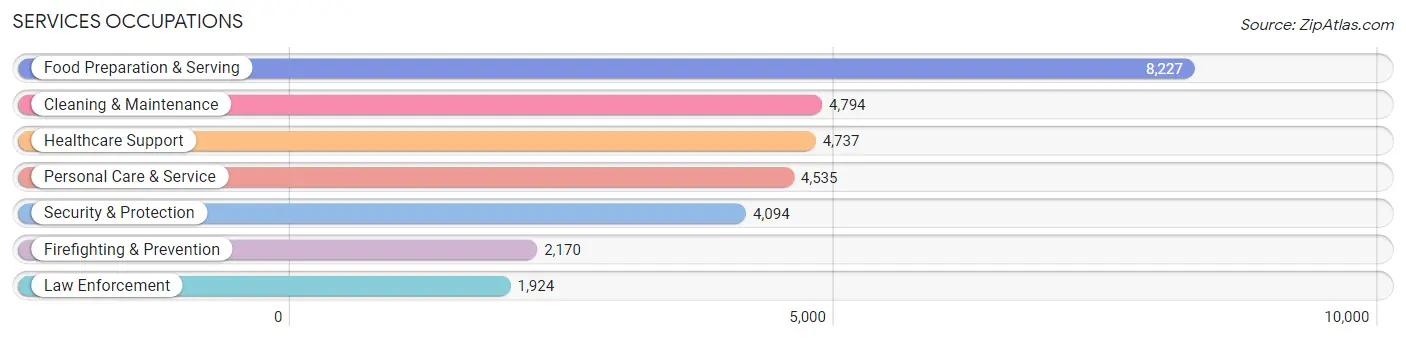
Services Occupations
The most common Services occupations in Albany County are Food Preparation & Serving (8,227 | 5.1%), Cleaning & Maintenance (4,794 | 3.0%), Healthcare Support (4,737 | 2.9%), Personal Care & Service (4,535 | 2.8%), and Security & Protection (4,094 | 2.5%).
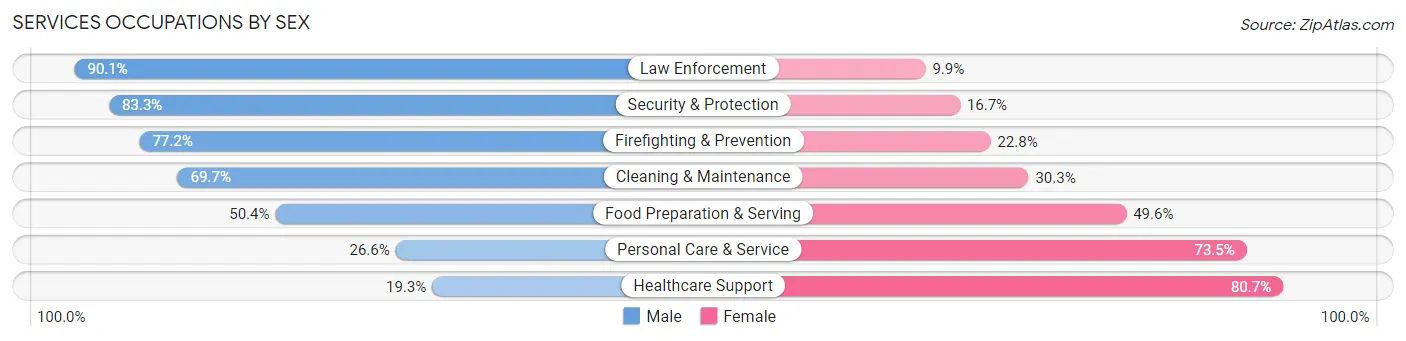
Services Occupations by Sex
Within the Services occupations in Albany County, the most male-oriented occupations are Law Enforcement (90.1%), Security & Protection (83.3%), and Firefighting & Prevention (77.2%), while the most female-oriented occupations are Healthcare Support (80.7%), Personal Care & Service (73.5%), and Food Preparation & Serving (49.6%).
| Occupation | Male | Female |
| Healthcare Support | 915 (19.3%) | 3,822 (80.7%) |
| Security & Protection | 3,410 (83.3%) | 684 (16.7%) |
| Firefighting & Prevention | 1,676 (77.2%) | 494 (22.8%) |
| Law Enforcement | 1,734 (90.1%) | 190 (9.9%) |
| Food Preparation & Serving | 4,143 (50.4%) | 4,084 (49.6%) |
| Cleaning & Maintenance | 3,342 (69.7%) | 1,452 (30.3%) |
| Personal Care & Service | 1,204 (26.6%) | 3,331 (73.5%) |
| Total (Category) | 13,014 (49.3%) | 13,373 (50.7%) |
| Total (Overall) | 80,884 (50.3%) | 80,063 (49.7%) |
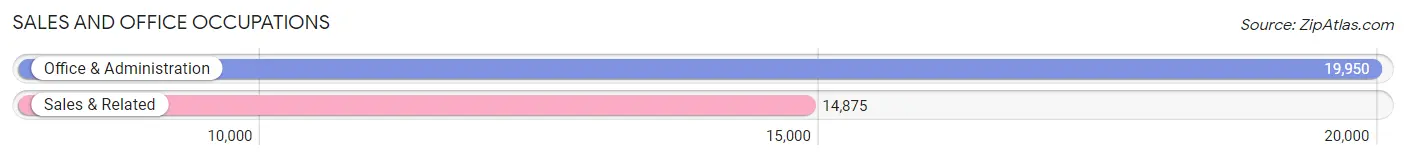
Sales and Office Occupations
The most common Sales and Office occupations in Albany County are Office & Administration (19,950 | 12.4%), and Sales & Related (14,875 | 9.2%).
Sales and Office Occupations by Sex
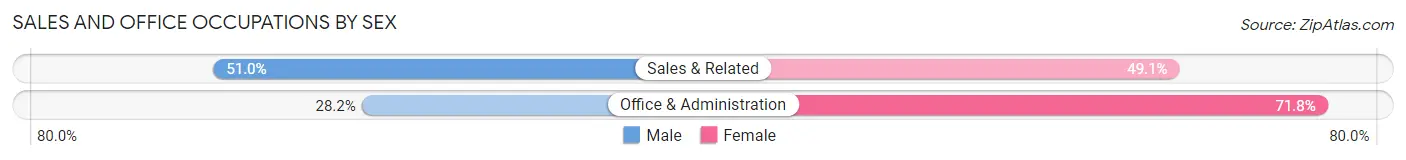
| Occupation | Male | Female |
| Sales & Related | 7,579 (50.9%) | 7,296 (49.0%) |
| Office & Administration | 5,617 (28.2%) | 14,333 (71.8%) |
| Total (Category) | 13,196 (37.9%) | 21,629 (62.1%) |
| Total (Overall) | 80,884 (50.3%) | 80,063 (49.7%) |
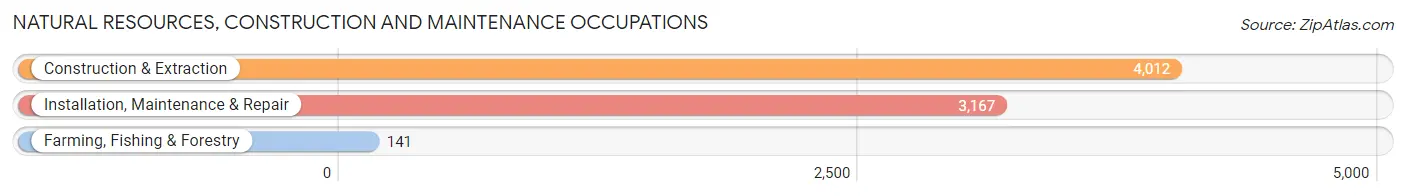
Natural Resources, Construction and Maintenance Occupations
The most common Natural Resources, Construction and Maintenance occupations in Albany County are Construction & Extraction (4,012 | 2.5%), Installation, Maintenance & Repair (3,167 | 2.0%), and Farming, Fishing & Forestry (141 | 0.1%).
Natural Resources, Construction and Maintenance Occupations by Sex
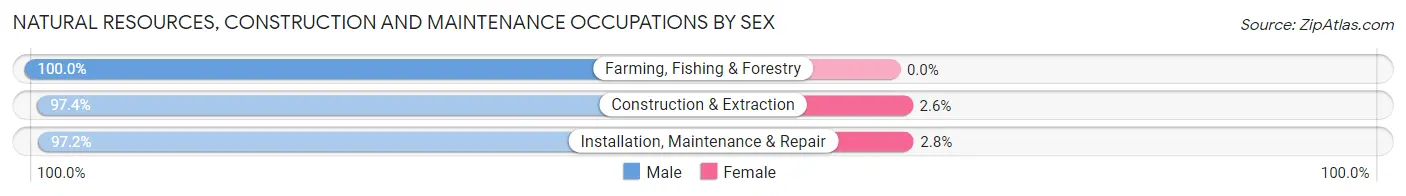
| Occupation | Male | Female |
| Farming, Fishing & Forestry | 141 (100.0%) | 0 (0.0%) |
| Construction & Extraction | 3,906 (97.4%) | 106 (2.6%) |
| Installation, Maintenance & Repair | 3,078 (97.2%) | 89 (2.8%) |
| Total (Category) | 7,125 (97.3%) | 195 (2.7%) |
| Total (Overall) | 80,884 (50.3%) | 80,063 (49.7%) |
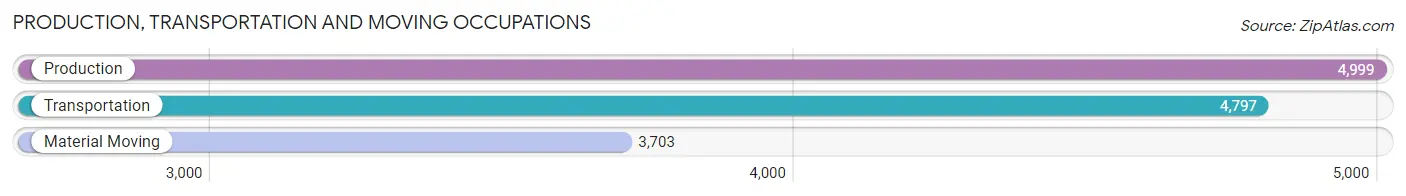
Production, Transportation and Moving Occupations
The most common Production, Transportation and Moving occupations in Albany County are Production (4,999 | 3.1%), Transportation (4,797 | 3.0%), and Material Moving (3,703 | 2.3%).
Production, Transportation and Moving Occupations by Sex
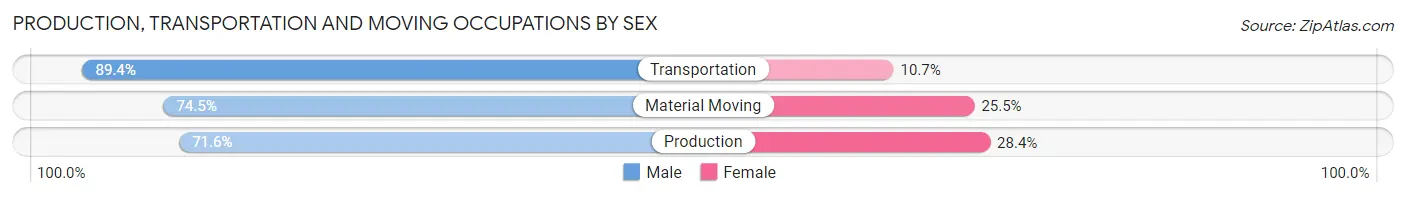
| Occupation | Male | Female |
| Production | 3,581 (71.6%) | 1,418 (28.4%) |
| Transportation | 4,286 (89.3%) | 511 (10.6%) |
| Material Moving | 2,759 (74.5%) | 944 (25.5%) |
| Total (Category) | 10,626 (78.7%) | 2,873 (21.3%) |
| Total (Overall) | 80,884 (50.3%) | 80,063 (49.7%) |
Employment Industries by Sex in Albany County
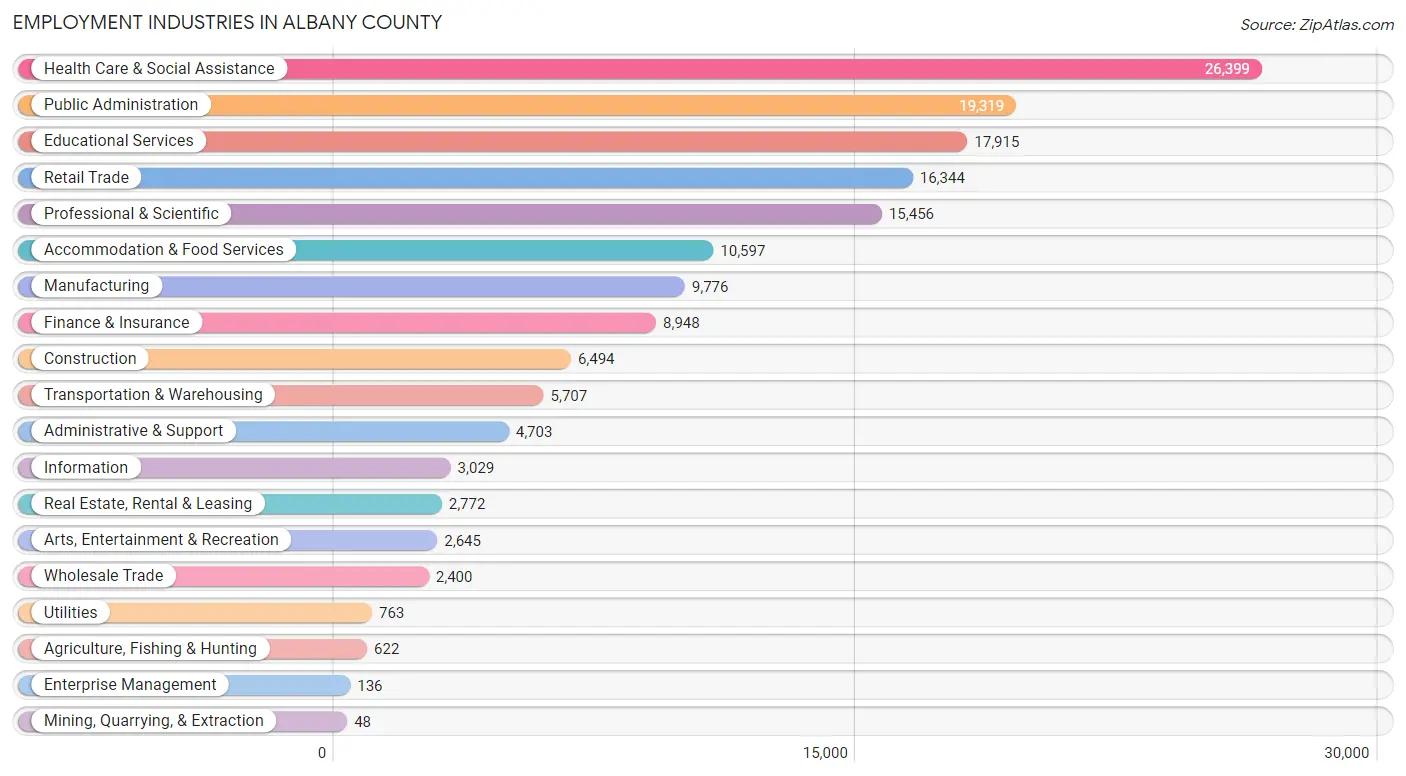
Employment Industries in Albany County
The major employment industries in Albany County include Health Care & Social Assistance (26,399 | 16.4%), Public Administration (19,319 | 12.0%), Educational Services (17,915 | 11.1%), Retail Trade (16,344 | 10.2%), and Professional & Scientific (15,456 | 9.6%).
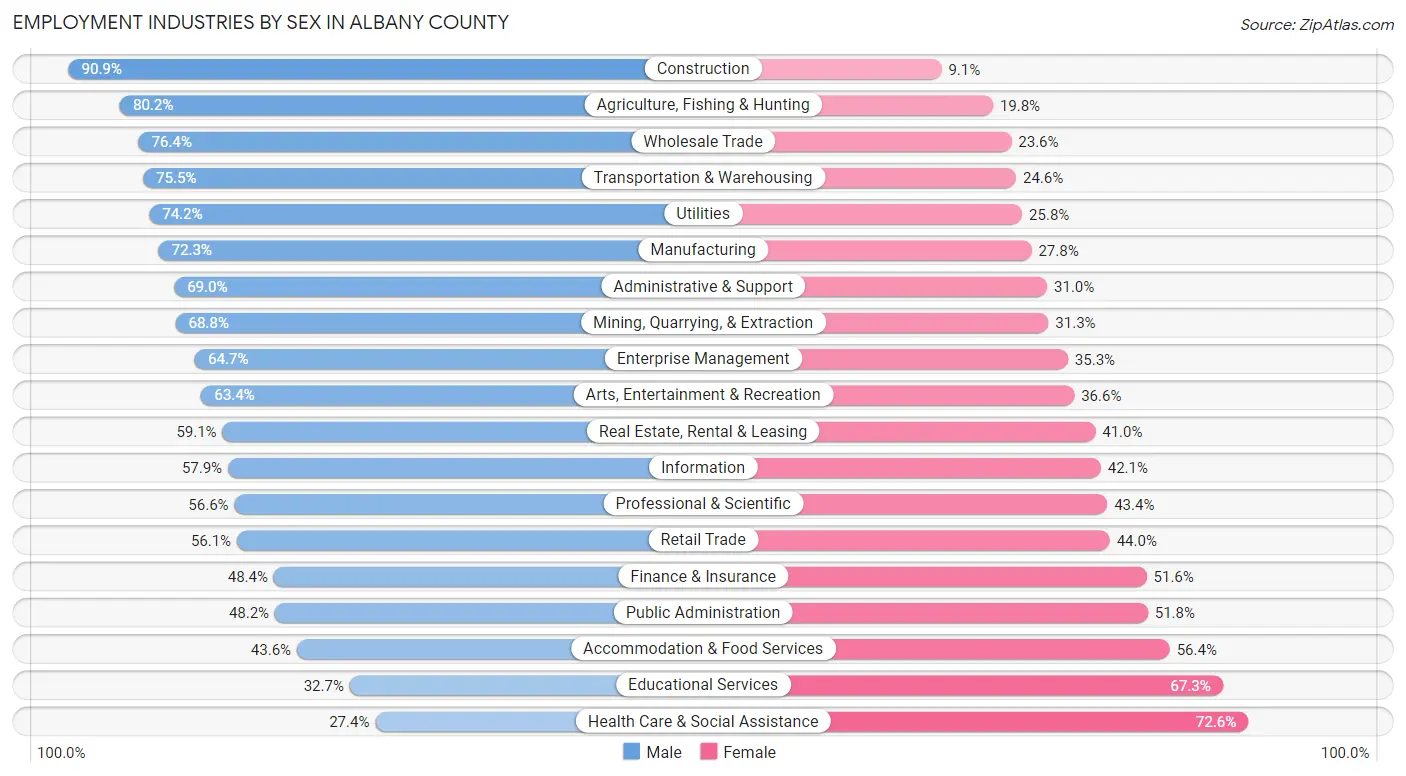
Employment Industries by Sex in Albany County
The Albany County industries that see more men than women are Construction (90.9%), Agriculture, Fishing & Hunting (80.2%), and Wholesale Trade (76.4%), whereas the industries that tend to have a higher number of women are Health Care & Social Assistance (72.6%), Educational Services (67.3%), and Accommodation & Food Services (56.4%).
| Industry | Male | Female |
| Agriculture, Fishing & Hunting | 499 (80.2%) | 123 (19.8%) |
| Mining, Quarrying, & Extraction | 33 (68.8%) | 15 (31.2%) |
| Construction | 5,902 (90.9%) | 592 (9.1%) |
| Manufacturing | 7,063 (72.3%) | 2,713 (27.8%) |
| Wholesale Trade | 1,834 (76.4%) | 566 (23.6%) |
| Retail Trade | 9,161 (56.0%) | 7,183 (44.0%) |
| Transportation & Warehousing | 4,306 (75.4%) | 1,401 (24.5%) |
| Utilities | 566 (74.2%) | 197 (25.8%) |
| Information | 1,754 (57.9%) | 1,275 (42.1%) |
| Finance & Insurance | 4,333 (48.4%) | 4,615 (51.6%) |
| Real Estate, Rental & Leasing | 1,637 (59.1%) | 1,135 (40.9%) |
| Professional & Scientific | 8,744 (56.6%) | 6,712 (43.4%) |
| Enterprise Management | 88 (64.7%) | 48 (35.3%) |
| Administrative & Support | 3,246 (69.0%) | 1,457 (31.0%) |
| Educational Services | 5,859 (32.7%) | 12,056 (67.3%) |
| Health Care & Social Assistance | 7,239 (27.4%) | 19,160 (72.6%) |
| Arts, Entertainment & Recreation | 1,677 (63.4%) | 968 (36.6%) |
| Accommodation & Food Services | 4,625 (43.6%) | 5,972 (56.4%) |
| Public Administration | 9,308 (48.2%) | 10,011 (51.8%) |
| Total | 80,884 (50.3%) | 80,063 (49.7%) |
Education in Albany County
School Enrollment in Albany County
The most common levels of schooling among the 81,541 students in Albany County are college / undergraduate (25,828 | 31.7%), high school (14,287 | 17.5%), and middle school (13,591 | 16.7%).
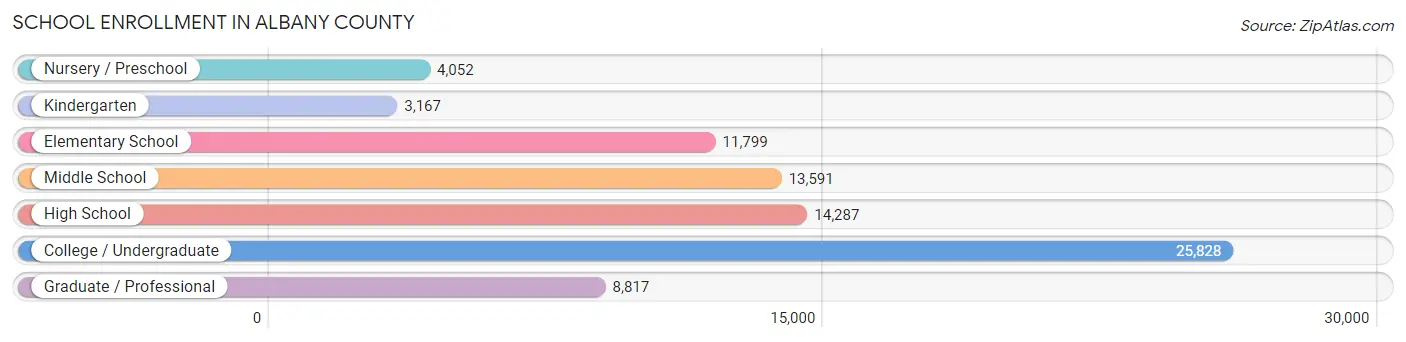
| School Level | # Students | % Students |
| Nursery / Preschool | 4,052 | 5.0% |
| Kindergarten | 3,167 | 3.9% |
| Elementary School | 11,799 | 14.5% |
| Middle School | 13,591 | 16.7% |
| High School | 14,287 | 17.5% |
| College / Undergraduate | 25,828 | 31.7% |
| Graduate / Professional | 8,817 | 10.8% |
| Total | 81,541 | 100.0% |
School Enrollment by Age by Funding Source in Albany County
Out of a total of 81,541 students who are enrolled in schools in Albany County, 18,021 (22.1%) attend a private institution, while the remaining 63,520 (77.9%) are enrolled in public schools. The age group of 3 to 4 year olds has the highest likelihood of being enrolled in private schools, with 1,436 (41.2% in the age bracket) enrolled. Conversely, the age group of 10 to 14 year olds has the lowest likelihood of being enrolled in a private school, with 15,200 (92.5% in the age bracket) attending a public institution.
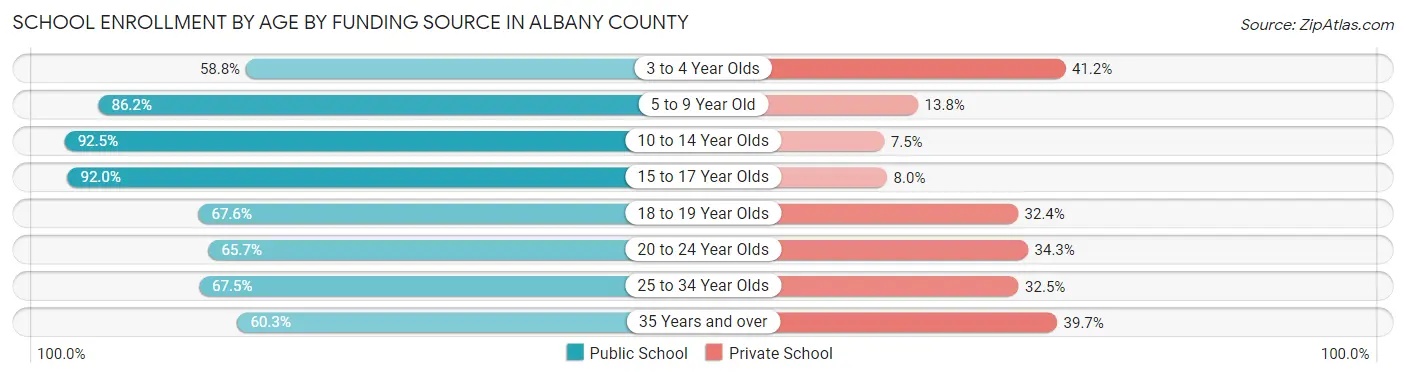
| Age Bracket | Public School | Private School |
| 3 to 4 Year Olds | 2,047 (58.8%) | 1,436 (41.2%) |
| 5 to 9 Year Old | 12,674 (86.2%) | 2,026 (13.8%) |
| 10 to 14 Year Olds | 15,200 (92.5%) | 1,229 (7.5%) |
| 15 to 17 Year Olds | 9,056 (92.0%) | 789 (8.0%) |
| 18 to 19 Year Olds | 7,664 (67.6%) | 3,674 (32.4%) |
| 20 to 24 Year Olds | 11,505 (65.7%) | 5,995 (34.3%) |
| 25 to 34 Year Olds | 3,406 (67.5%) | 1,640 (32.5%) |
| 35 Years and over | 1,931 (60.3%) | 1,269 (39.7%) |
| Total | 63,520 (77.9%) | 18,021 (22.1%) |
Educational Attainment by Field of Study in Albany County
Business (14,719 | 14.2%), social sciences (12,691 | 12.3%), education (10,321 | 10.0%), science & technology (9,290 | 9.0%), and bio, nature & agricultural (7,865 | 7.6%) are the most common fields of study among 103,418 individuals in Albany County who have obtained a bachelor's degree or higher.
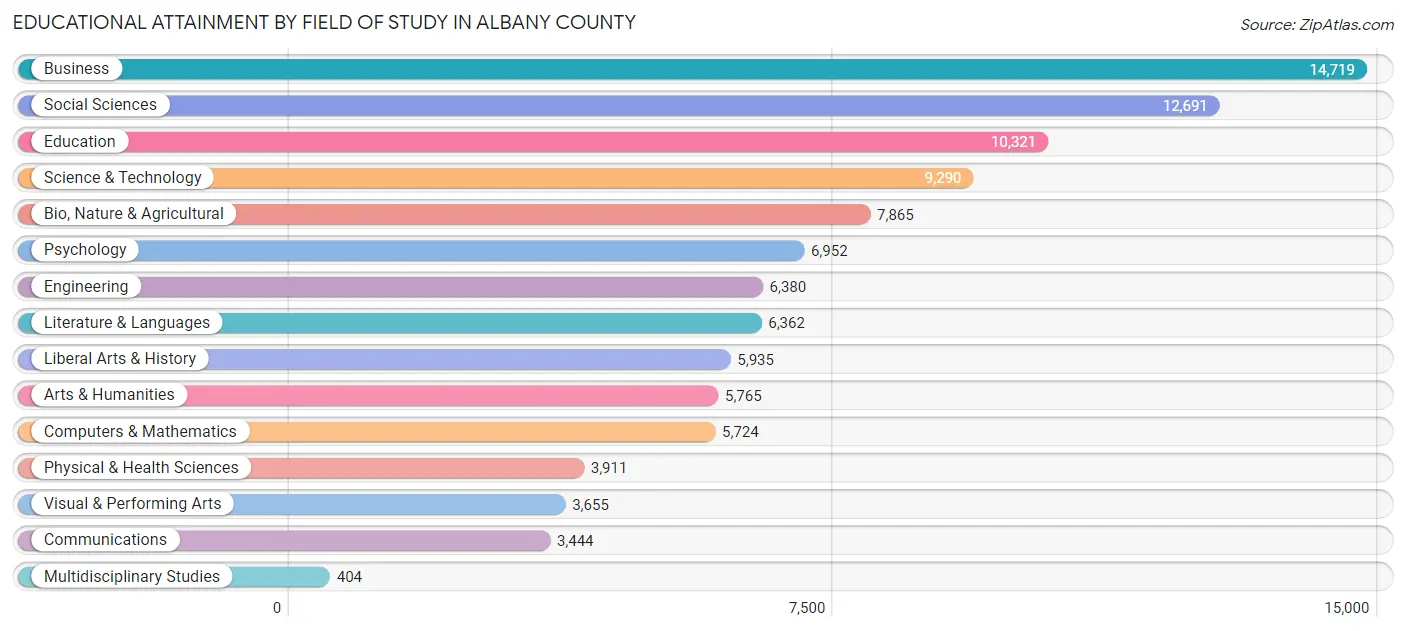
| Field of Study | # Graduates | % Graduates |
| Computers & Mathematics | 5,724 | 5.5% |
| Bio, Nature & Agricultural | 7,865 | 7.6% |
| Physical & Health Sciences | 3,911 | 3.8% |
| Psychology | 6,952 | 6.7% |
| Social Sciences | 12,691 | 12.3% |
| Engineering | 6,380 | 6.2% |
| Multidisciplinary Studies | 404 | 0.4% |
| Science & Technology | 9,290 | 9.0% |
| Business | 14,719 | 14.2% |
| Education | 10,321 | 10.0% |
| Literature & Languages | 6,362 | 6.1% |
| Liberal Arts & History | 5,935 | 5.7% |
| Visual & Performing Arts | 3,655 | 3.5% |
| Communications | 3,444 | 3.3% |
| Arts & Humanities | 5,765 | 5.6% |
| Total | 103,418 | 100.0% |
Transportation & Commute in Albany County
Vehicle Availability by Sex in Albany County
The most prevalent vehicle ownership categories in Albany County are males with 2 vehicles (36,150, accounting for 46.1%) and females with 2 vehicles (32,694, making up 48.0%).
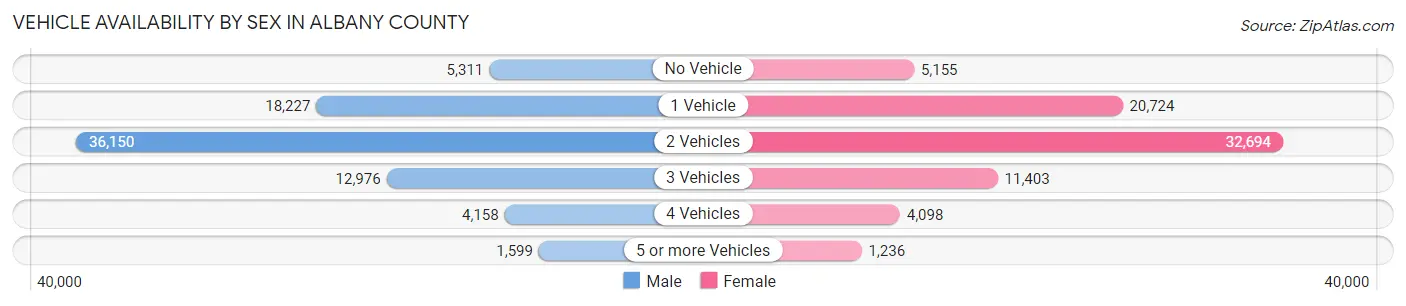
| Vehicles Available | Male | Female |
| No Vehicle | 5,311 (6.8%) | 5,155 (6.9%) |
| 1 Vehicle | 18,227 (23.2%) | 20,724 (27.5%) |
| 2 Vehicles | 36,150 (46.1%) | 32,694 (43.4%) |
| 3 Vehicles | 12,976 (16.6%) | 11,403 (15.1%) |
| 4 Vehicles | 4,158 (5.3%) | 4,098 (5.4%) |
| 5 or more Vehicles | 1,599 (2.0%) | 1,236 (1.6%) |
| Total | 78,421 (100.0%) | 75,310 (100.0%) |
Commute Time in Albany County
The most frequently occuring commute durations in Albany County are 15 to 19 minutes (30,637 commuters, 22.0%), 20 to 24 minutes (25,825 commuters, 18.6%), and 10 to 14 minutes (23,907 commuters, 17.2%).
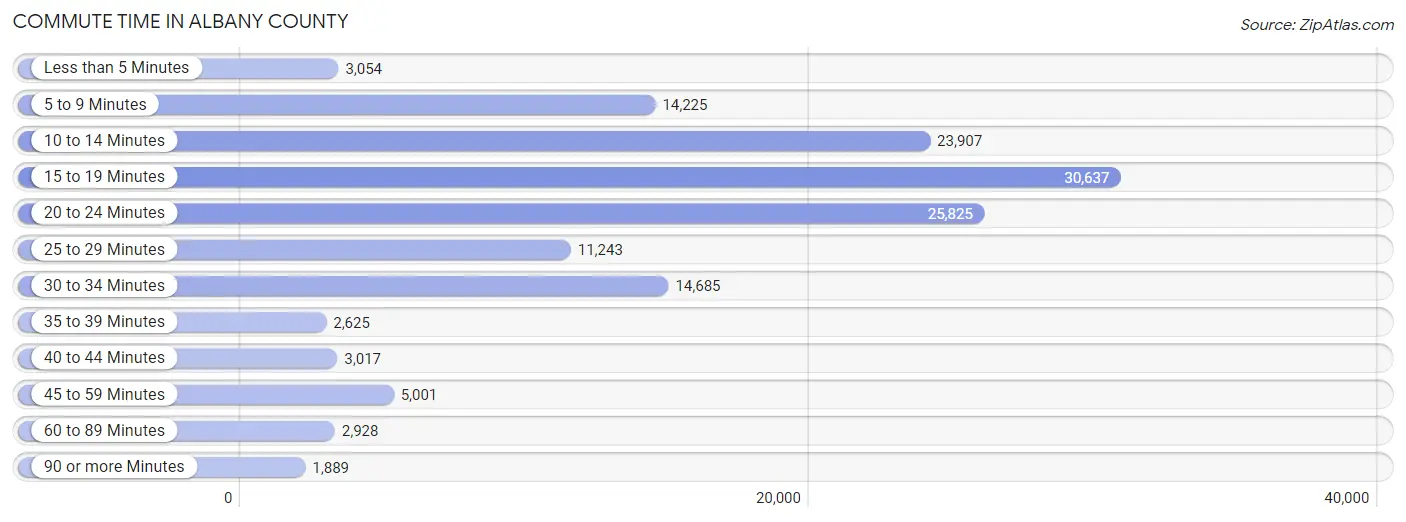
| Commute Time | # Commuters | % Commuters |
| Less than 5 Minutes | 3,054 | 2.2% |
| 5 to 9 Minutes | 14,225 | 10.2% |
| 10 to 14 Minutes | 23,907 | 17.2% |
| 15 to 19 Minutes | 30,637 | 22.0% |
| 20 to 24 Minutes | 25,825 | 18.6% |
| 25 to 29 Minutes | 11,243 | 8.1% |
| 30 to 34 Minutes | 14,685 | 10.6% |
| 35 to 39 Minutes | 2,625 | 1.9% |
| 40 to 44 Minutes | 3,017 | 2.2% |
| 45 to 59 Minutes | 5,001 | 3.6% |
| 60 to 89 Minutes | 2,928 | 2.1% |
| 90 or more Minutes | 1,889 | 1.4% |
Commute Time by Sex in Albany County
The most common commute times in Albany County are 15 to 19 minutes (16,538 commuters, 23.4%) for males and 15 to 19 minutes (14,099 commuters, 20.6%) for females.
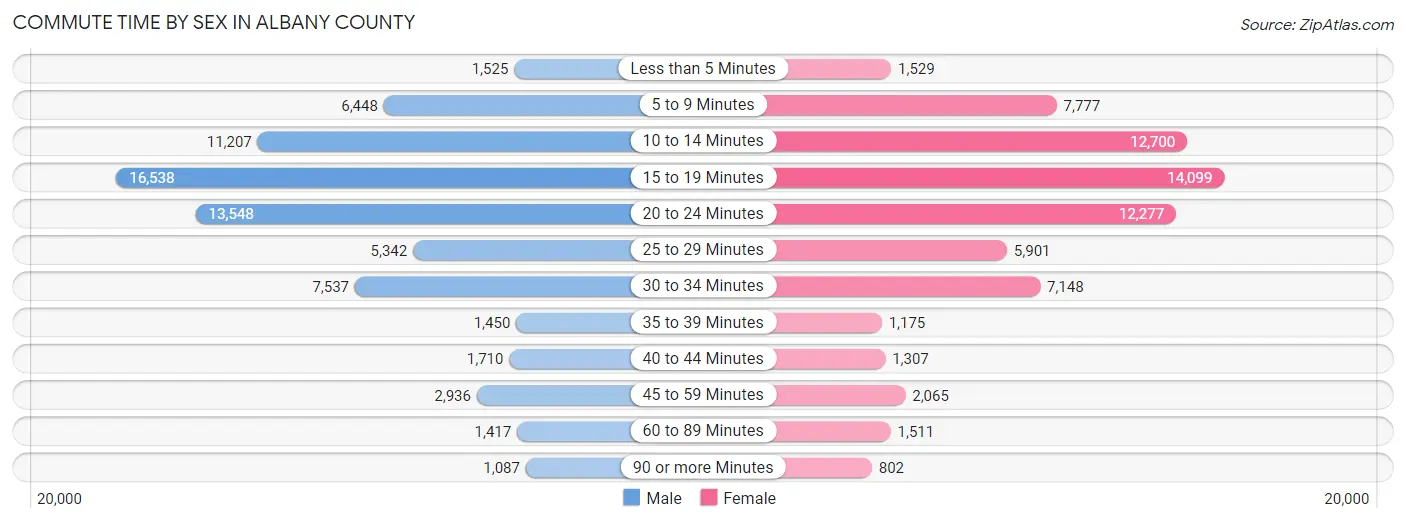
| Commute Time | Male | Female |
| Less than 5 Minutes | 1,525 (2.2%) | 1,529 (2.2%) |
| 5 to 9 Minutes | 6,448 (9.1%) | 7,777 (11.4%) |
| 10 to 14 Minutes | 11,207 (15.8%) | 12,700 (18.6%) |
| 15 to 19 Minutes | 16,538 (23.4%) | 14,099 (20.6%) |
| 20 to 24 Minutes | 13,548 (19.2%) | 12,277 (18.0%) |
| 25 to 29 Minutes | 5,342 (7.5%) | 5,901 (8.6%) |
| 30 to 34 Minutes | 7,537 (10.6%) | 7,148 (10.5%) |
| 35 to 39 Minutes | 1,450 (2.1%) | 1,175 (1.7%) |
| 40 to 44 Minutes | 1,710 (2.4%) | 1,307 (1.9%) |
| 45 to 59 Minutes | 2,936 (4.2%) | 2,065 (3.0%) |
| 60 to 89 Minutes | 1,417 (2.0%) | 1,511 (2.2%) |
| 90 or more Minutes | 1,087 (1.5%) | 802 (1.2%) |
Time of Departure to Work by Sex in Albany County
The most frequent times of departure to work in Albany County are 8:00 AM to 8:29 AM (10,043, 14.2%) for males and 7:30 AM to 7:59 AM (11,420, 16.7%) for females.
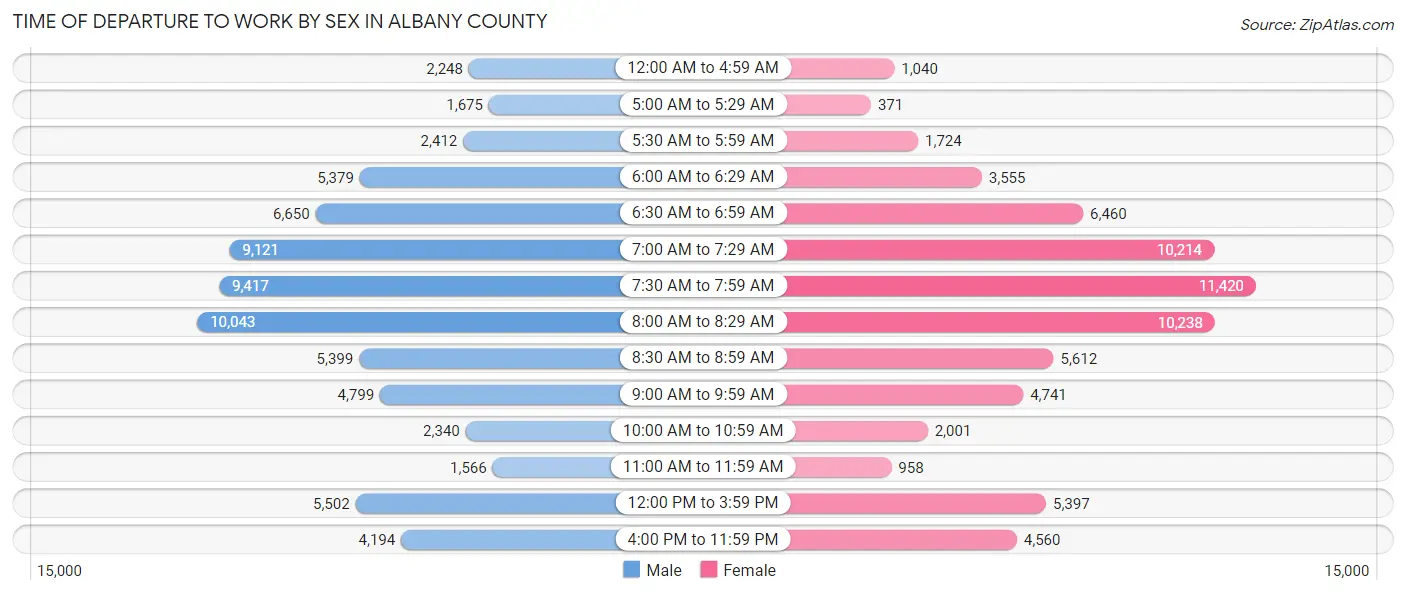
| Time of Departure | Male | Female |
| 12:00 AM to 4:59 AM | 2,248 (3.2%) | 1,040 (1.5%) |
| 5:00 AM to 5:29 AM | 1,675 (2.4%) | 371 (0.5%) |
| 5:30 AM to 5:59 AM | 2,412 (3.4%) | 1,724 (2.5%) |
| 6:00 AM to 6:29 AM | 5,379 (7.6%) | 3,555 (5.2%) |
| 6:30 AM to 6:59 AM | 6,650 (9.4%) | 6,460 (9.5%) |
| 7:00 AM to 7:29 AM | 9,121 (12.9%) | 10,214 (15.0%) |
| 7:30 AM to 7:59 AM | 9,417 (13.3%) | 11,420 (16.7%) |
| 8:00 AM to 8:29 AM | 10,043 (14.2%) | 10,238 (15.0%) |
| 8:30 AM to 8:59 AM | 5,399 (7.6%) | 5,612 (8.2%) |
| 9:00 AM to 9:59 AM | 4,799 (6.8%) | 4,741 (6.9%) |
| 10:00 AM to 10:59 AM | 2,340 (3.3%) | 2,001 (2.9%) |
| 11:00 AM to 11:59 AM | 1,566 (2.2%) | 958 (1.4%) |
| 12:00 PM to 3:59 PM | 5,502 (7.8%) | 5,397 (7.9%) |
| 4:00 PM to 11:59 PM | 4,194 (5.9%) | 4,560 (6.7%) |
| Total | 70,745 (100.0%) | 68,291 (100.0%) |
Housing Occupancy in Albany County
Occupancy by Ownership in Albany County
Of the total 132,175 dwellings in Albany County, owner-occupied units account for 74,707 (56.5%), while renter-occupied units make up 57,468 (43.5%).
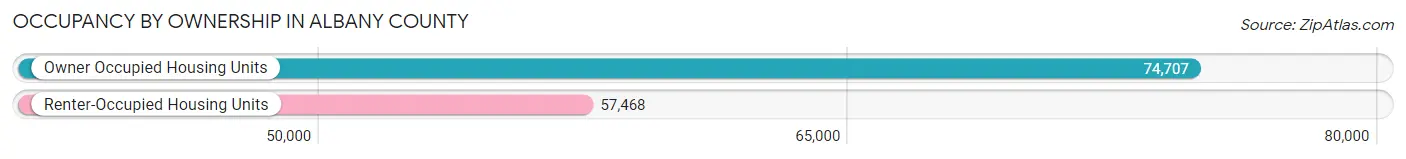
| Occupancy | # Housing Units | % Housing Units |
| Owner Occupied Housing Units | 74,707 | 56.5% |
| Renter-Occupied Housing Units | 57,468 | 43.5% |
| Total Occupied Housing Units | 132,175 | 100.0% |
Occupancy by Household Size in Albany County
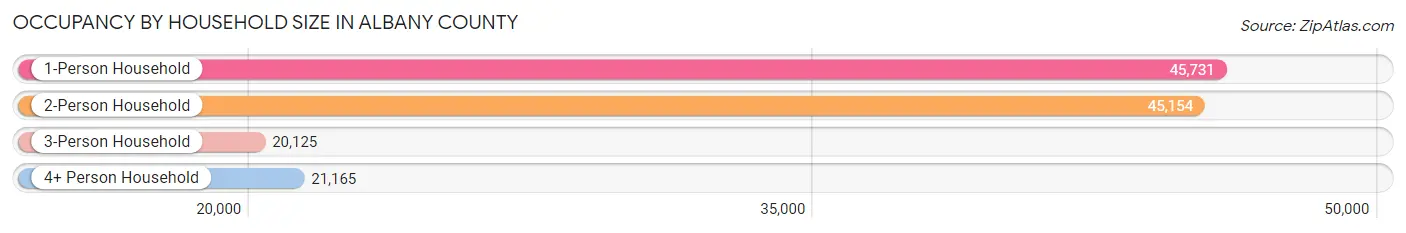
| Household Size | # Housing Units | % Housing Units |
| 1-Person Household | 45,731 | 34.6% |
| 2-Person Household | 45,154 | 34.2% |
| 3-Person Household | 20,125 | 15.2% |
| 4+ Person Household | 21,165 | 16.0% |
| Total Housing Units | 132,175 | 100.0% |
Occupancy by Ownership by Household Size in Albany County
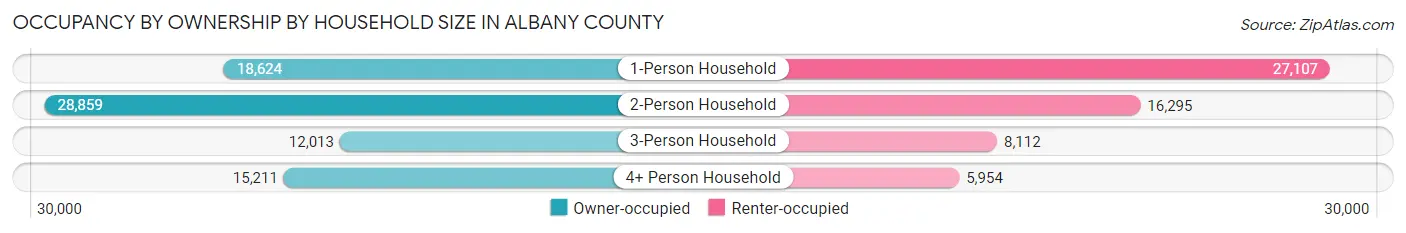
| Household Size | Owner-occupied | Renter-occupied |
| 1-Person Household | 18,624 (40.7%) | 27,107 (59.3%) |
| 2-Person Household | 28,859 (63.9%) | 16,295 (36.1%) |
| 3-Person Household | 12,013 (59.7%) | 8,112 (40.3%) |
| 4+ Person Household | 15,211 (71.9%) | 5,954 (28.1%) |
| Total Housing Units | 74,707 (56.5%) | 57,468 (43.5%) |
Occupancy by Educational Attainment in Albany County
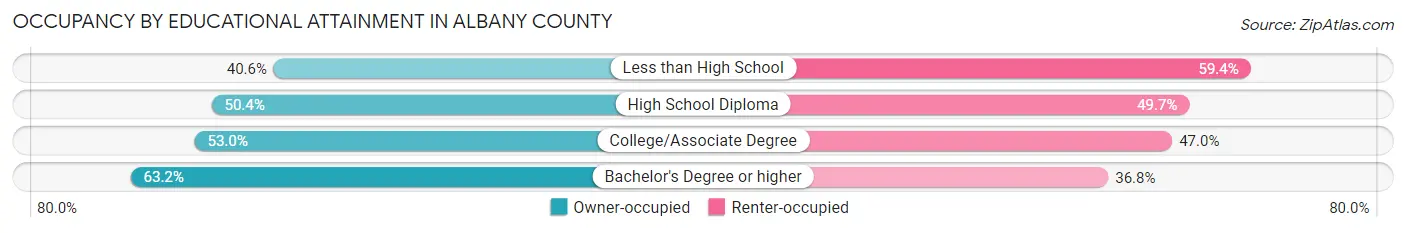
| Household Size | Owner-occupied | Renter-occupied |
| Less than High School | 3,274 (40.6%) | 4,785 (59.4%) |
| High School Diploma | 13,164 (50.3%) | 12,980 (49.6%) |
| College/Associate Degree | 18,964 (53.0%) | 16,793 (47.0%) |
| Bachelor's Degree or higher | 39,305 (63.2%) | 22,910 (36.8%) |
Occupancy by Age of Householder in Albany County
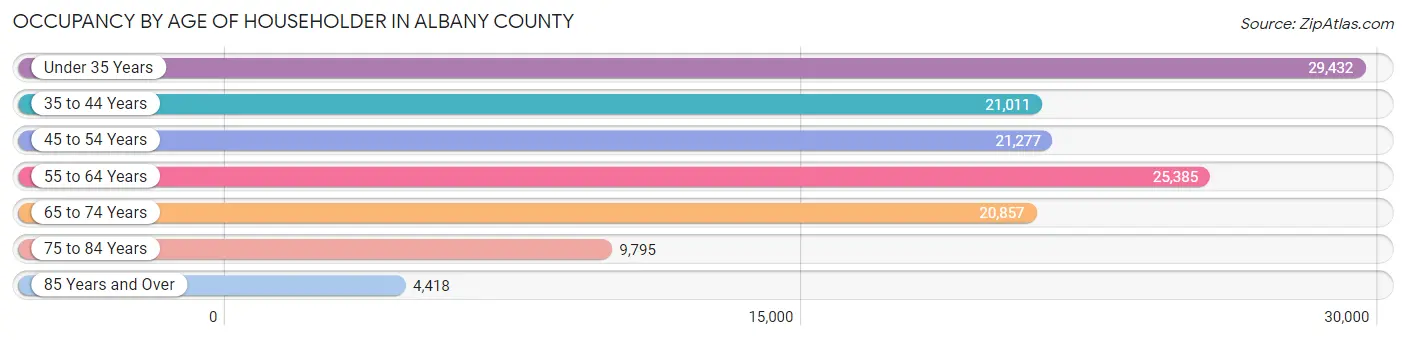
| Age Bracket | # Households | % Households |
| Under 35 Years | 29,432 | 22.3% |
| 35 to 44 Years | 21,011 | 15.9% |
| 45 to 54 Years | 21,277 | 16.1% |
| 55 to 64 Years | 25,385 | 19.2% |
| 65 to 74 Years | 20,857 | 15.8% |
| 75 to 84 Years | 9,795 | 7.4% |
| 85 Years and Over | 4,418 | 3.3% |
| Total | 132,175 | 100.0% |
Housing Finances in Albany County
Median Income by Occupancy in Albany County
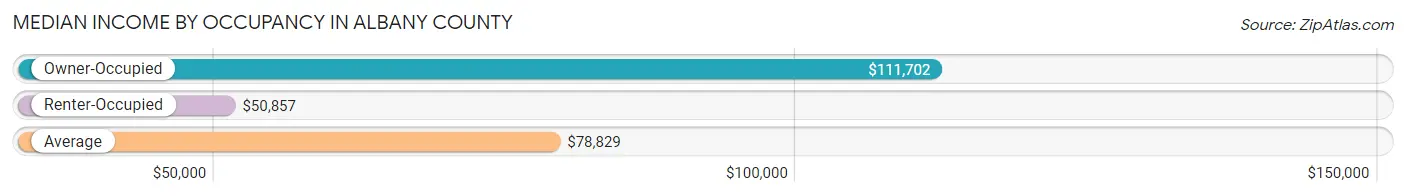
| Occupancy Type | # Households | Median Income |
| Owner-Occupied | 74,707 (56.5%) | $111,702 |
| Renter-Occupied | 57,468 (43.5%) | $50,857 |
| Average | 132,175 (100.0%) | $78,829 |
Occupancy by Householder Income Bracket in Albany County
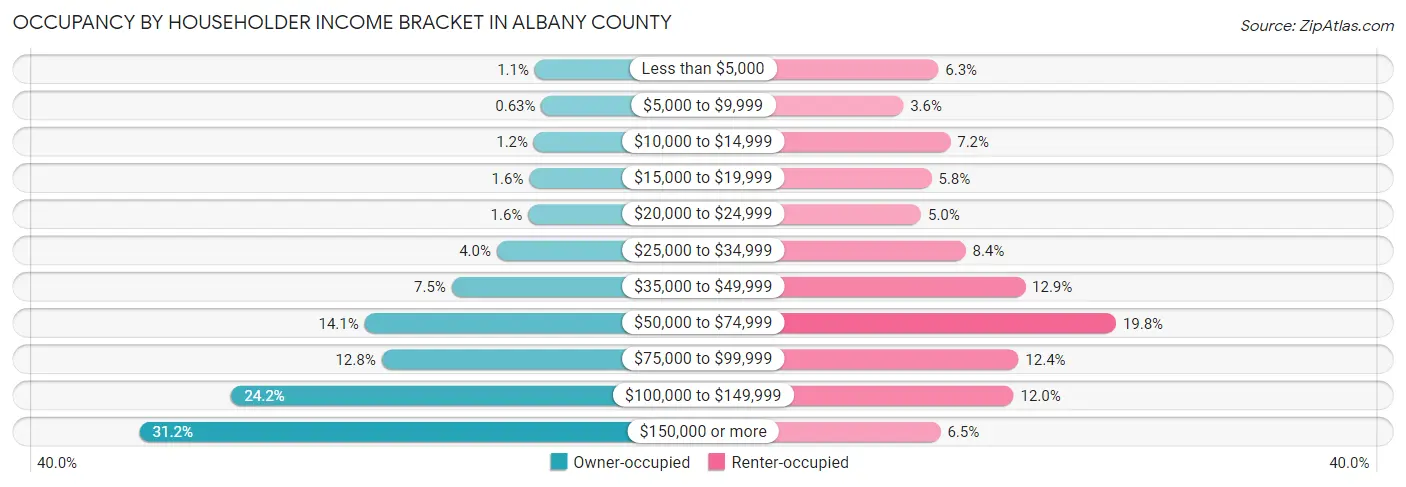
| Income Bracket | Owner-occupied | Renter-occupied |
| Less than $5,000 | 847 (1.1%) | 3,627 (6.3%) |
| $5,000 to $9,999 | 473 (0.6%) | 2,085 (3.6%) |
| $10,000 to $14,999 | 898 (1.2%) | 4,147 (7.2%) |
| $15,000 to $19,999 | 1,158 (1.5%) | 3,328 (5.8%) |
| $20,000 to $24,999 | 1,214 (1.6%) | 2,868 (5.0%) |
| $25,000 to $34,999 | 3,001 (4.0%) | 4,814 (8.4%) |
| $35,000 to $49,999 | 5,573 (7.5%) | 7,427 (12.9%) |
| $50,000 to $74,999 | 10,530 (14.1%) | 11,403 (19.8%) |
| $75,000 to $99,999 | 9,570 (12.8%) | 7,131 (12.4%) |
| $100,000 to $149,999 | 18,109 (24.2%) | 6,921 (12.0%) |
| $150,000 or more | 23,334 (31.2%) | 3,717 (6.5%) |
| Total | 74,707 (100.0%) | 57,468 (100.0%) |
Monthly Housing Cost Tiers in Albany County
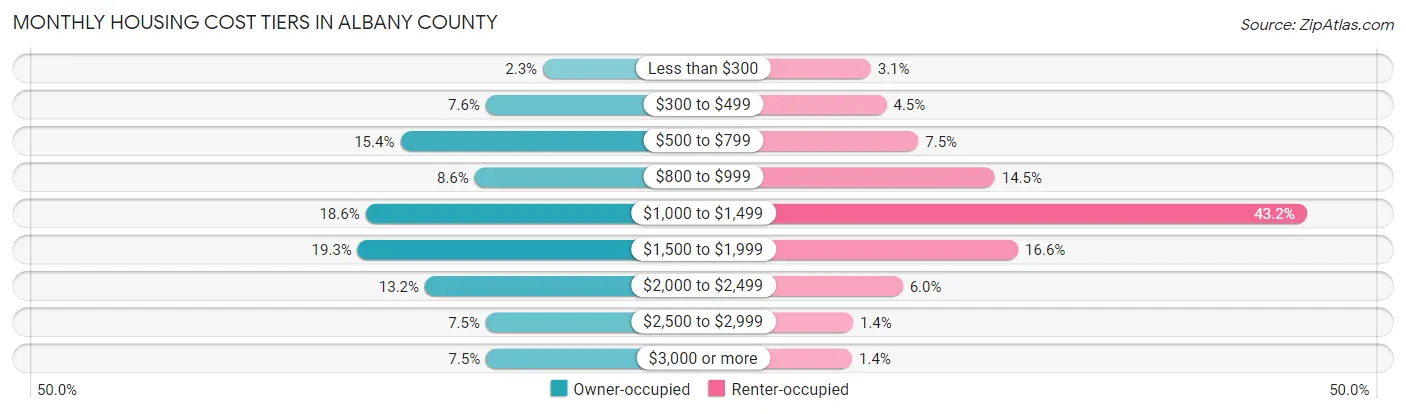
| Monthly Cost | Owner-occupied | Renter-occupied |
| Less than $300 | 1,705 (2.3%) | 1,762 (3.1%) |
| $300 to $499 | 5,644 (7.5%) | 2,595 (4.5%) |
| $500 to $799 | 11,517 (15.4%) | 4,281 (7.4%) |
| $800 to $999 | 6,413 (8.6%) | 8,325 (14.5%) |
| $1,000 to $1,499 | 13,909 (18.6%) | 24,814 (43.2%) |
| $1,500 to $1,999 | 14,445 (19.3%) | 9,562 (16.6%) |
| $2,000 to $2,499 | 9,826 (13.2%) | 3,455 (6.0%) |
| $2,500 to $2,999 | 5,636 (7.5%) | 819 (1.4%) |
| $3,000 or more | 5,612 (7.5%) | 775 (1.3%) |
| Total | 74,707 (100.0%) | 57,468 (100.0%) |
Physical Housing Characteristics in Albany County
Housing Structures in Albany County
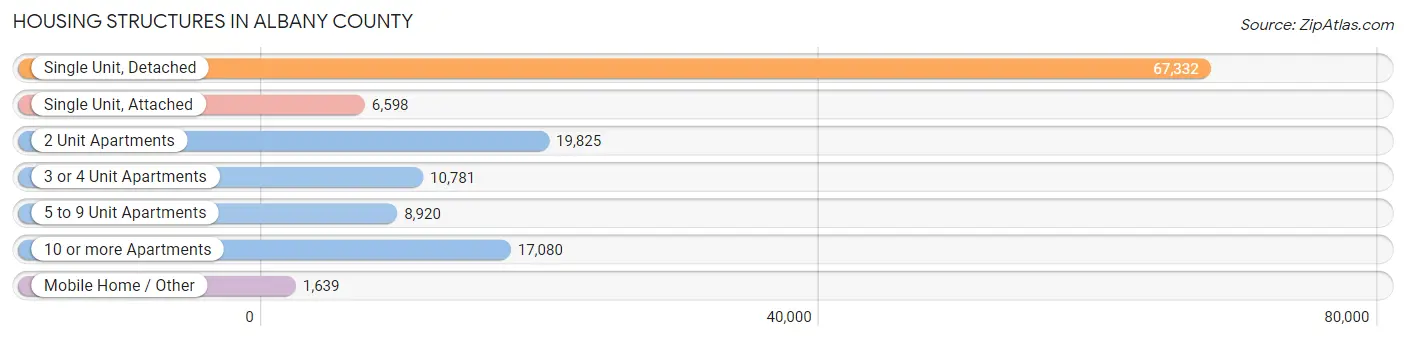
| Structure Type | # Housing Units | % Housing Units |
| Single Unit, Detached | 67,332 | 50.9% |
| Single Unit, Attached | 6,598 | 5.0% |
| 2 Unit Apartments | 19,825 | 15.0% |
| 3 or 4 Unit Apartments | 10,781 | 8.2% |
| 5 to 9 Unit Apartments | 8,920 | 6.8% |
| 10 or more Apartments | 17,080 | 12.9% |
| Mobile Home / Other | 1,639 | 1.2% |
| Total | 132,175 | 100.0% |
Housing Structures by Occupancy in Albany County
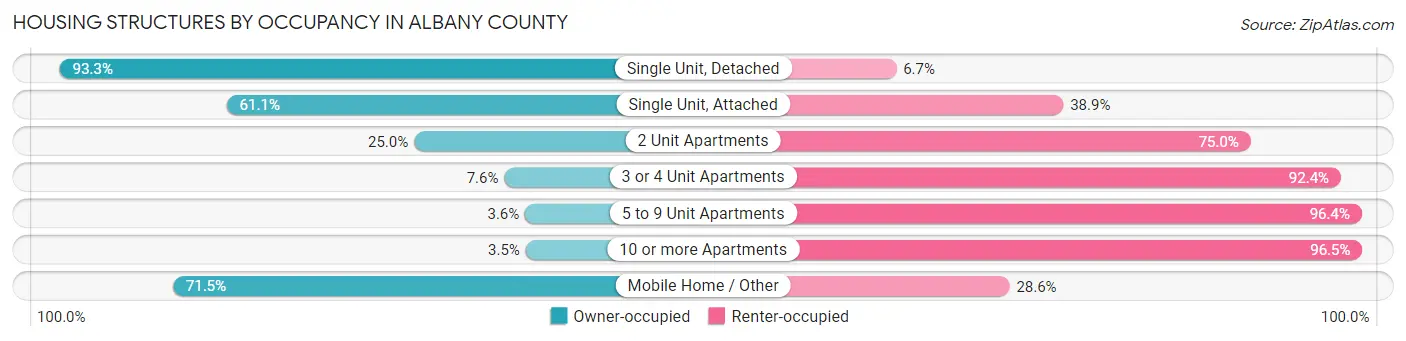
| Structure Type | Owner-occupied | Renter-occupied |
| Single Unit, Detached | 62,796 (93.3%) | 4,536 (6.7%) |
| Single Unit, Attached | 4,031 (61.1%) | 2,567 (38.9%) |
| 2 Unit Apartments | 4,959 (25.0%) | 14,866 (75.0%) |
| 3 or 4 Unit Apartments | 824 (7.6%) | 9,957 (92.4%) |
| 5 to 9 Unit Apartments | 324 (3.6%) | 8,596 (96.4%) |
| 10 or more Apartments | 602 (3.5%) | 16,478 (96.5%) |
| Mobile Home / Other | 1,171 (71.5%) | 468 (28.5%) |
| Total | 74,707 (56.5%) | 57,468 (43.5%) |
Housing Structures by Number of Rooms in Albany County
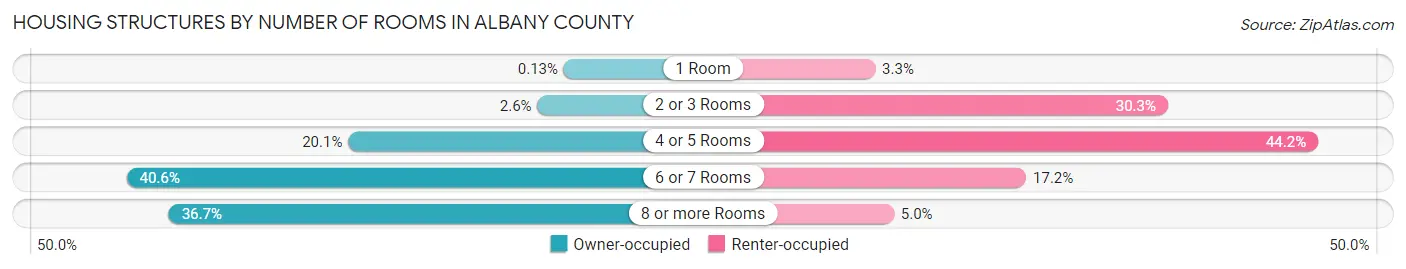
| Number of Rooms | Owner-occupied | Renter-occupied |
| 1 Room | 95 (0.1%) | 1,873 (3.3%) |
| 2 or 3 Rooms | 1,917 (2.6%) | 17,422 (30.3%) |
| 4 or 5 Rooms | 14,992 (20.1%) | 25,406 (44.2%) |
| 6 or 7 Rooms | 30,305 (40.6%) | 9,897 (17.2%) |
| 8 or more Rooms | 27,398 (36.7%) | 2,870 (5.0%) |
| Total | 74,707 (100.0%) | 57,468 (100.0%) |
Housing Structure by Heating Type in Albany County
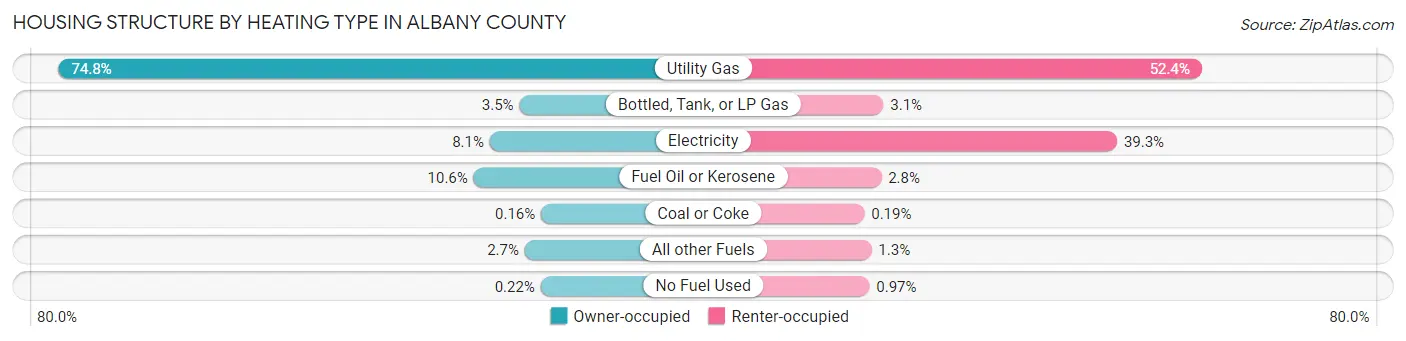
| Heating Type | Owner-occupied | Renter-occupied |
| Utility Gas | 55,856 (74.8%) | 30,082 (52.3%) |
| Bottled, Tank, or LP Gas | 2,618 (3.5%) | 1,806 (3.1%) |
| Electricity | 6,043 (8.1%) | 22,558 (39.3%) |
| Fuel Oil or Kerosene | 7,909 (10.6%) | 1,613 (2.8%) |
| Coal or Coke | 117 (0.2%) | 111 (0.2%) |
| All other Fuels | 1,998 (2.7%) | 739 (1.3%) |
| No Fuel Used | 166 (0.2%) | 559 (1.0%) |
| Total | 74,707 (100.0%) | 57,468 (100.0%) |
Household Vehicle Usage in Albany County
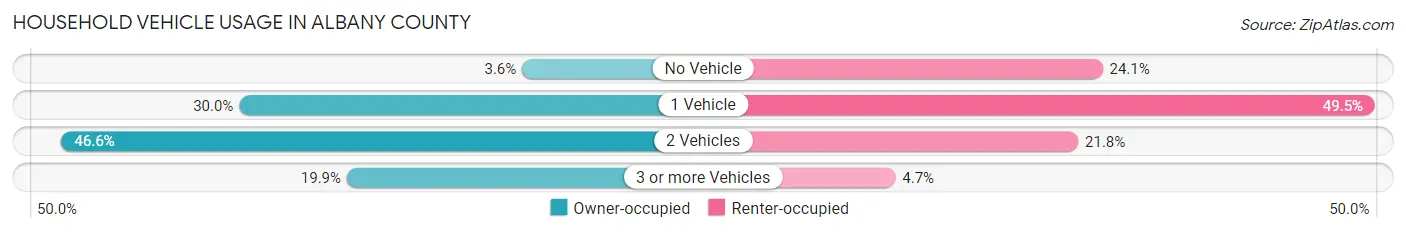
| Vehicles per Household | Owner-occupied | Renter-occupied |
| No Vehicle | 2,656 (3.6%) | 13,821 (24.0%) |
| 1 Vehicle | 22,386 (30.0%) | 28,432 (49.5%) |
| 2 Vehicles | 34,782 (46.6%) | 12,509 (21.8%) |
| 3 or more Vehicles | 14,883 (19.9%) | 2,706 (4.7%) |
| Total | 74,707 (100.0%) | 57,468 (100.0%) |
Real Estate & Mortgages in Albany County
Real Estate and Mortgage Overview in Albany County
| Characteristic | Without Mortgage | With Mortgage |
| Housing Units | 28,710 | 45,997 |
| Median Property Value | $254,900 | $269,300 |
| Median Household Income | $87,324 | $16,417 |
| Monthly Housing Costs | $717 | $5,490 |
| Real Estate Taxes | $4,419 | $1,175 |
Property Value by Mortgage Status in Albany County
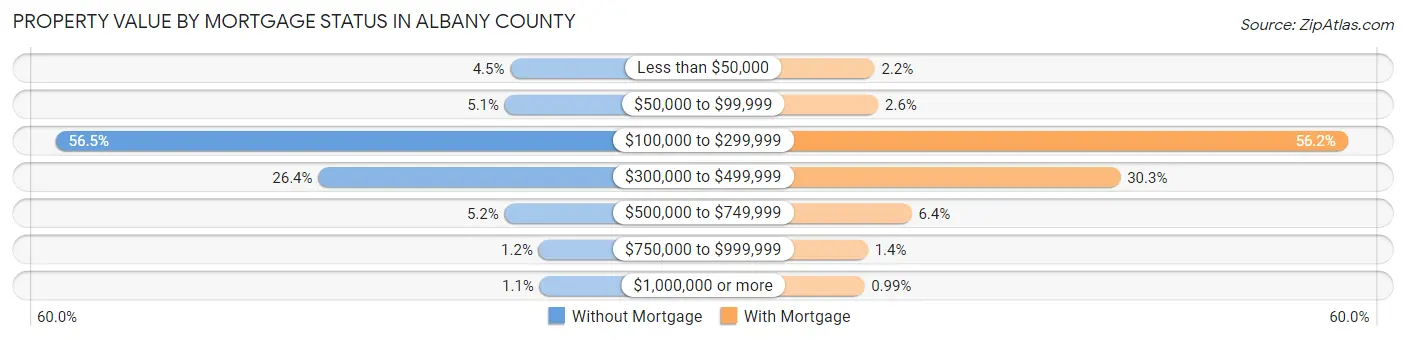
| Property Value | Without Mortgage | With Mortgage |
| Less than $50,000 | 1,289 (4.5%) | 995 (2.2%) |
| $50,000 to $99,999 | 1,468 (5.1%) | 1,185 (2.6%) |
| $100,000 to $299,999 | 16,208 (56.5%) | 25,870 (56.2%) |
| $300,000 to $499,999 | 7,587 (26.4%) | 13,916 (30.2%) |
| $500,000 to $749,999 | 1,479 (5.1%) | 2,939 (6.4%) |
| $750,000 to $999,999 | 355 (1.2%) | 638 (1.4%) |
| $1,000,000 or more | 324 (1.1%) | 454 (1.0%) |
| Total | 28,710 (100.0%) | 45,997 (100.0%) |
Household Income by Mortgage Status in Albany County
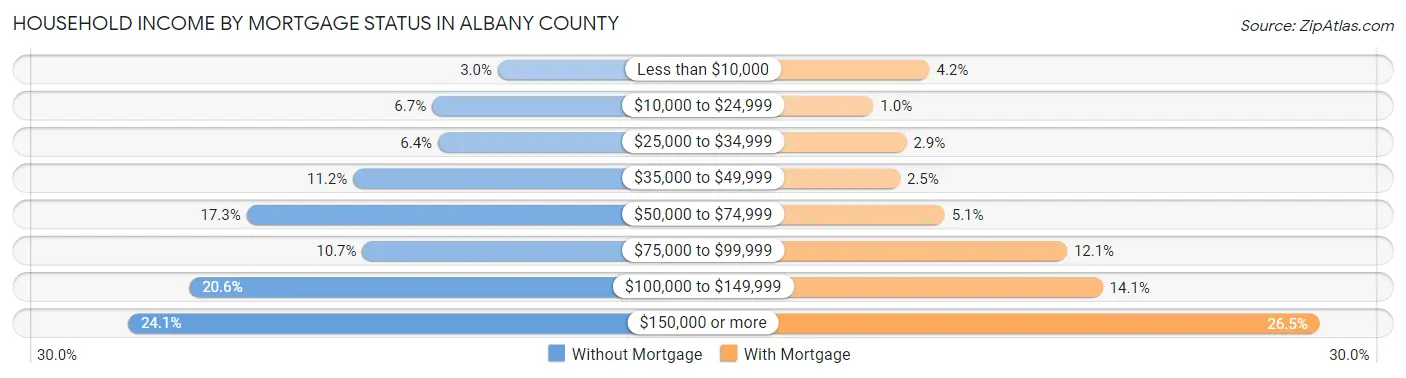
| Household Income | Without Mortgage | With Mortgage |
| Less than $10,000 | 849 (3.0%) | 1,944 (4.2%) |
| $10,000 to $24,999 | 1,930 (6.7%) | 471 (1.0%) |
| $25,000 to $34,999 | 1,832 (6.4%) | 1,340 (2.9%) |
| $35,000 to $49,999 | 3,225 (11.2%) | 1,169 (2.5%) |
| $50,000 to $74,999 | 4,973 (17.3%) | 2,348 (5.1%) |
| $75,000 to $99,999 | 3,073 (10.7%) | 5,557 (12.1%) |
| $100,000 to $149,999 | 5,911 (20.6%) | 6,497 (14.1%) |
| $150,000 or more | 6,917 (24.1%) | 12,198 (26.5%) |
| Total | 28,710 (100.0%) | 45,997 (100.0%) |
Property Value to Household Income Ratio in Albany County
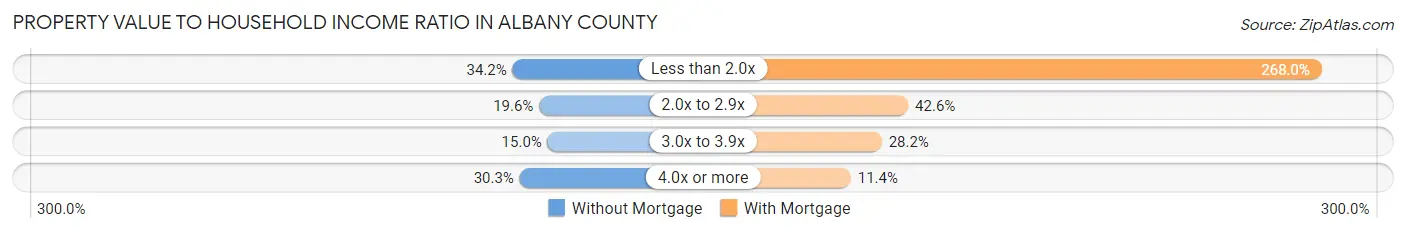
| Value-to-Income Ratio | Without Mortgage | With Mortgage |
| Less than 2.0x | 9,804 (34.2%) | 123,269 (268.0%) |
| 2.0x to 2.9x | 5,638 (19.6%) | 19,605 (42.6%) |
| 3.0x to 3.9x | 4,312 (15.0%) | 12,974 (28.2%) |
| 4.0x or more | 8,688 (30.3%) | 5,233 (11.4%) |
| Total | 28,710 (100.0%) | 45,997 (100.0%) |
Real Estate Taxes by Mortgage Status in Albany County
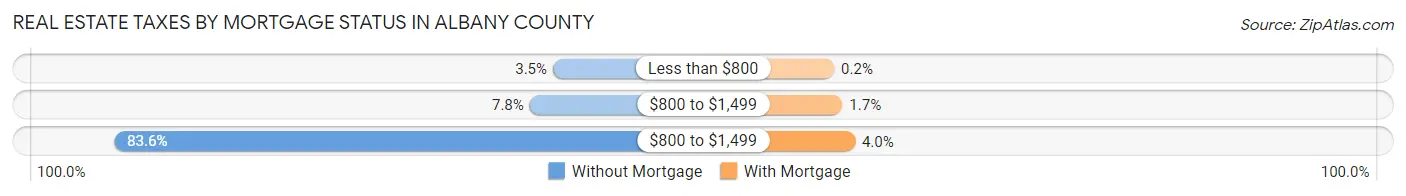
| Property Taxes | Without Mortgage | With Mortgage |
| Less than $800 | 1,009 (3.5%) | 90 (0.2%) |
| $800 to $1,499 | 2,229 (7.8%) | 787 (1.7%) |
| $800 to $1,499 | 24,013 (83.6%) | 1,842 (4.0%) |
| Total | 28,710 (100.0%) | 45,997 (100.0%) |
Health & Disability in Albany County
Health Insurance Coverage by Age in Albany County
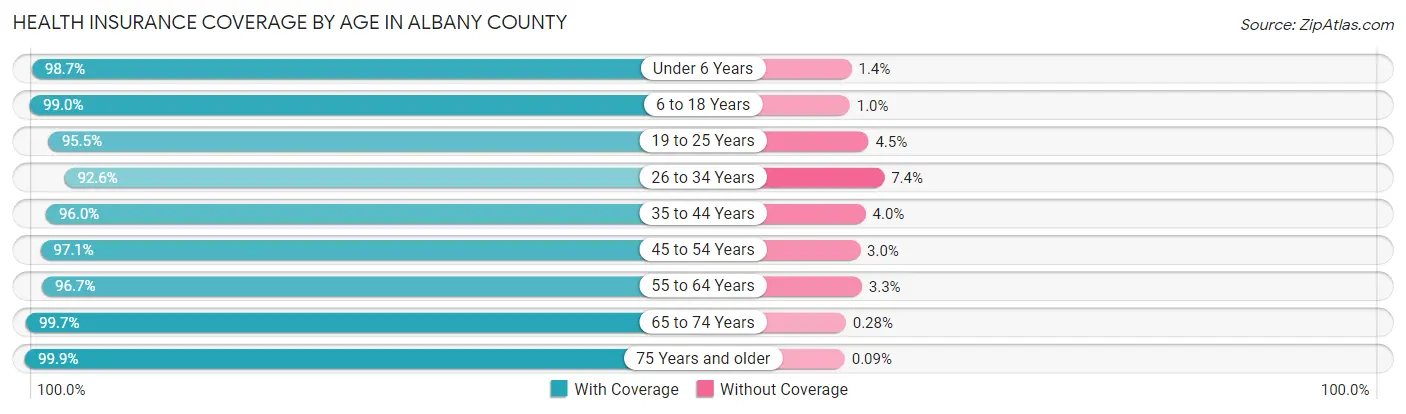
| Age Bracket | With Coverage | Without Coverage |
| Under 6 Years | 17,864 (98.7%) | 244 (1.3%) |
| 6 to 18 Years | 45,595 (99.0%) | 471 (1.0%) |
| 19 to 25 Years | 41,406 (95.5%) | 1,955 (4.5%) |
| 26 to 34 Years | 34,060 (92.6%) | 2,739 (7.4%) |
| 35 to 44 Years | 35,749 (96.0%) | 1,481 (4.0%) |
| 45 to 54 Years | 35,314 (97.1%) | 1,074 (2.9%) |
| 55 to 64 Years | 39,399 (96.7%) | 1,331 (3.3%) |
| 65 to 74 Years | 31,713 (99.7%) | 90 (0.3%) |
| 75 Years and older | 21,121 (99.9%) | 20 (0.1%) |
| Total | 302,221 (97.0%) | 9,405 (3.0%) |
Health Insurance Coverage by Citizenship Status in Albany County
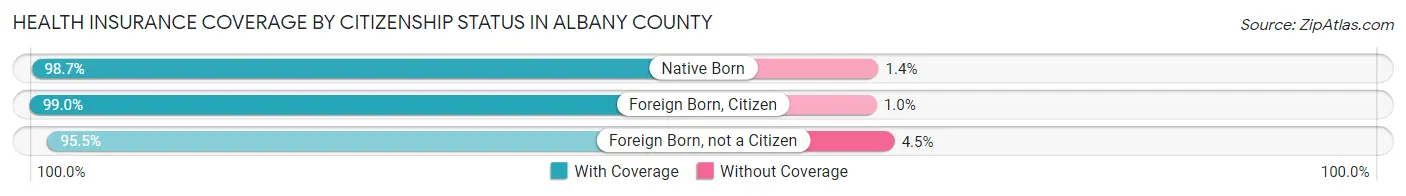
| Citizenship Status | With Coverage | Without Coverage |
| Native Born | 17,864 (98.7%) | 244 (1.3%) |
| Foreign Born, Citizen | 45,595 (99.0%) | 471 (1.0%) |
| Foreign Born, not a Citizen | 41,406 (95.5%) | 1,955 (4.5%) |
Health Insurance Coverage by Household Income in Albany County
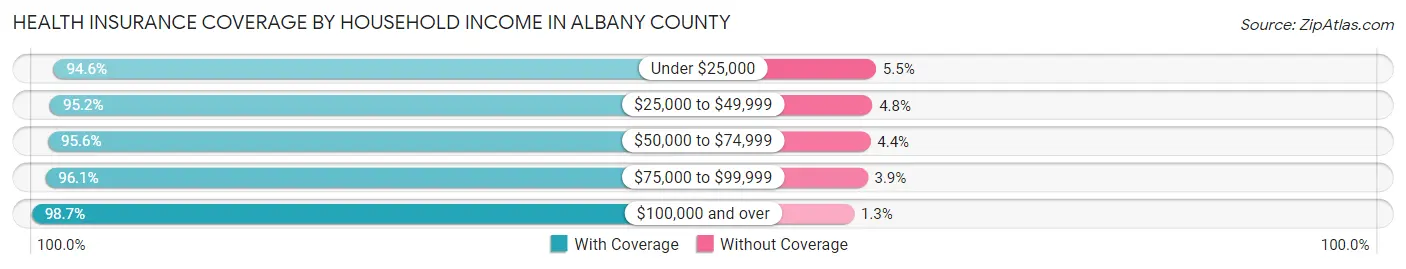
| Household Income | With Coverage | Without Coverage |
| Under $25,000 | 31,074 (94.6%) | 1,792 (5.4%) |
| $25,000 to $49,999 | 35,759 (95.2%) | 1,791 (4.8%) |
| $50,000 to $74,999 | 39,450 (95.6%) | 1,822 (4.4%) |
| $75,000 to $99,999 | 36,404 (96.1%) | 1,471 (3.9%) |
| $100,000 and over | 145,189 (98.7%) | 1,976 (1.3%) |
Public vs Private Health Insurance Coverage by Age in Albany County
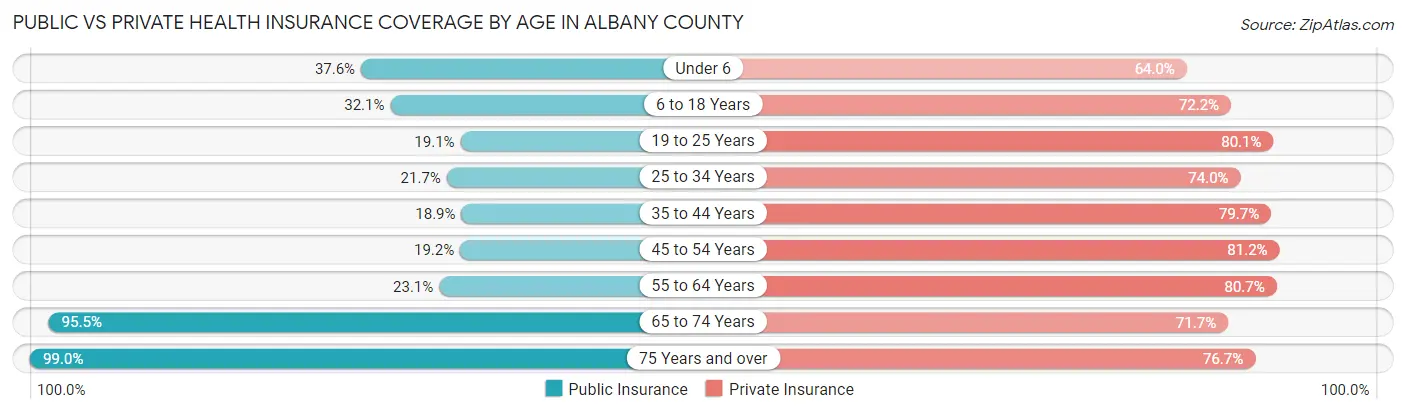
| Age Bracket | Public Insurance | Private Insurance |
| Under 6 | 6,804 (37.6%) | 11,591 (64.0%) |
| 6 to 18 Years | 14,796 (32.1%) | 33,275 (72.2%) |
| 19 to 25 Years | 8,287 (19.1%) | 34,723 (80.1%) |
| 25 to 34 Years | 7,972 (21.7%) | 27,225 (74.0%) |
| 35 to 44 Years | 7,049 (18.9%) | 29,660 (79.7%) |
| 45 to 54 Years | 6,977 (19.2%) | 29,555 (81.2%) |
| 55 to 64 Years | 9,391 (23.1%) | 32,866 (80.7%) |
| 65 to 74 Years | 30,380 (95.5%) | 22,801 (71.7%) |
| 75 Years and over | 20,927 (99.0%) | 16,216 (76.7%) |
| Total | 112,583 (36.1%) | 237,912 (76.3%) |
Disability Status by Sex by Age in Albany County
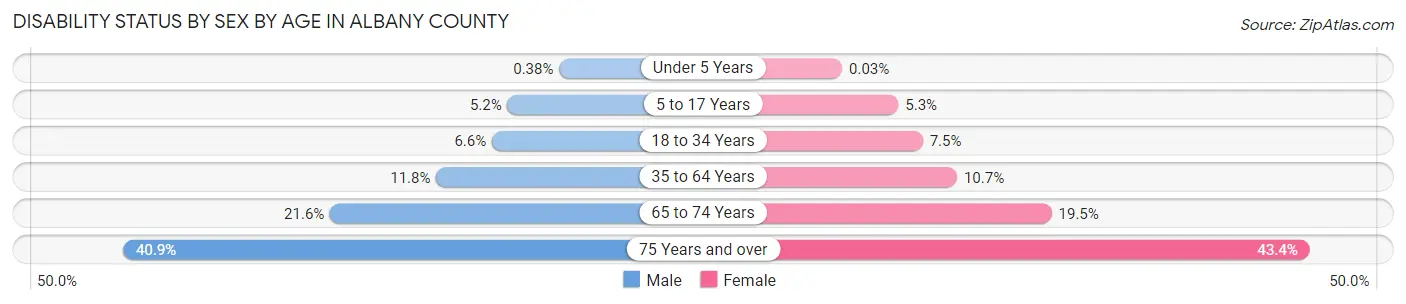
| Age Bracket | Male | Female |
| Under 5 Years | 29 (0.4%) | 2 (0.0%) |
| 5 to 17 Years | 1,107 (5.2%) | 1,077 (5.2%) |
| 18 to 34 Years | 2,858 (6.6%) | 3,325 (7.5%) |
| 35 to 64 Years | 6,652 (11.8%) | 6,194 (10.7%) |
| 65 to 74 Years | 3,219 (21.6%) | 3,295 (19.5%) |
| 75 Years and over | 3,471 (40.9%) | 5,492 (43.4%) |
Disability Class by Sex by Age in Albany County
Disability Class: Hearing Difficulty
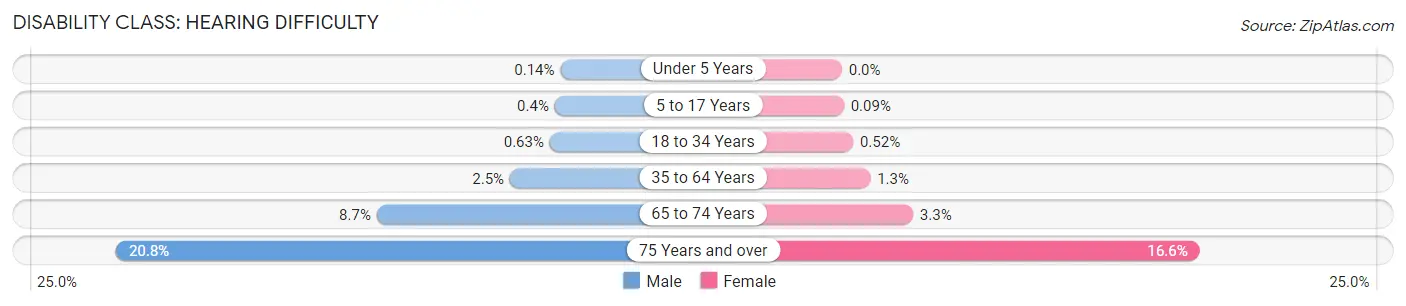
| Age Bracket | Male | Female |
| Under 5 Years | 11 (0.1%) | 0 (0.0%) |
| 5 to 17 Years | 86 (0.4%) | 18 (0.1%) |
| 18 to 34 Years | 272 (0.6%) | 228 (0.5%) |
| 35 to 64 Years | 1,399 (2.5%) | 766 (1.3%) |
| 65 to 74 Years | 1,288 (8.7%) | 558 (3.3%) |
| 75 Years and over | 1,763 (20.8%) | 2,099 (16.6%) |
Disability Class: Vision Difficulty
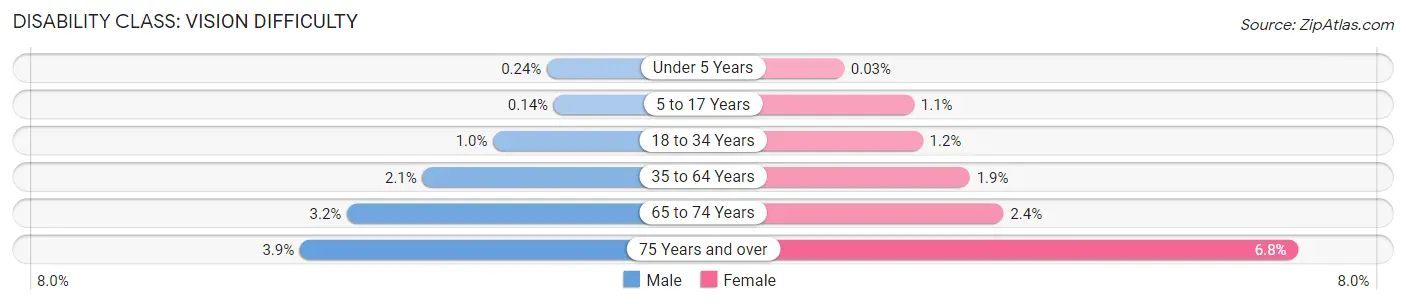
| Age Bracket | Male | Female |
| Under 5 Years | 18 (0.2%) | 2 (0.0%) |
| 5 to 17 Years | 29 (0.1%) | 219 (1.1%) |
| 18 to 34 Years | 451 (1.0%) | 529 (1.2%) |
| 35 to 64 Years | 1,181 (2.1%) | 1,099 (1.9%) |
| 65 to 74 Years | 477 (3.2%) | 406 (2.4%) |
| 75 Years and over | 332 (3.9%) | 858 (6.8%) |
Disability Class: Cognitive Difficulty
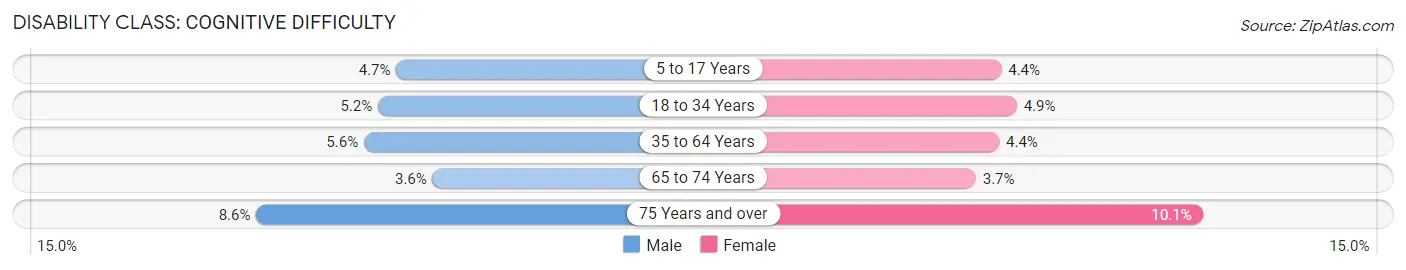
| Age Bracket | Male | Female |
| 5 to 17 Years | 993 (4.6%) | 912 (4.4%) |
| 18 to 34 Years | 2,228 (5.2%) | 2,155 (4.9%) |
| 35 to 64 Years | 3,129 (5.6%) | 2,536 (4.4%) |
| 65 to 74 Years | 541 (3.6%) | 632 (3.7%) |
| 75 Years and over | 726 (8.6%) | 1,274 (10.1%) |
Disability Class: Ambulatory Difficulty
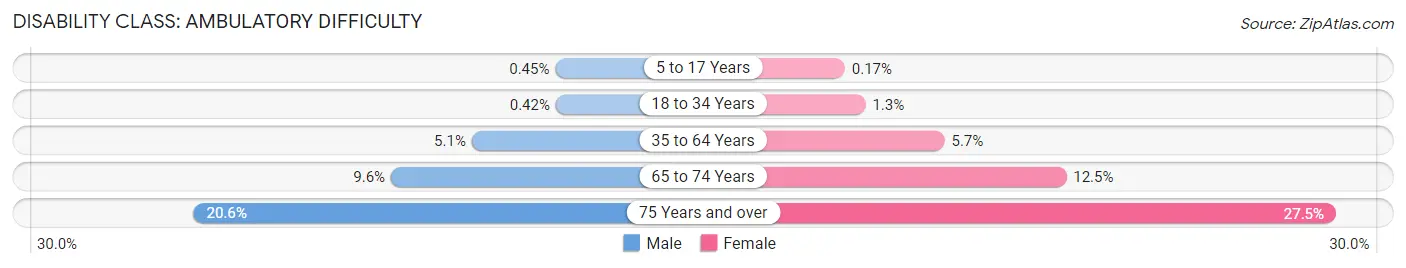
| Age Bracket | Male | Female |
| 5 to 17 Years | 97 (0.4%) | 35 (0.2%) |
| 18 to 34 Years | 181 (0.4%) | 586 (1.3%) |
| 35 to 64 Years | 2,877 (5.1%) | 3,314 (5.7%) |
| 65 to 74 Years | 1,429 (9.6%) | 2,115 (12.5%) |
| 75 Years and over | 1,749 (20.6%) | 3,479 (27.5%) |
Disability Class: Self-Care Difficulty
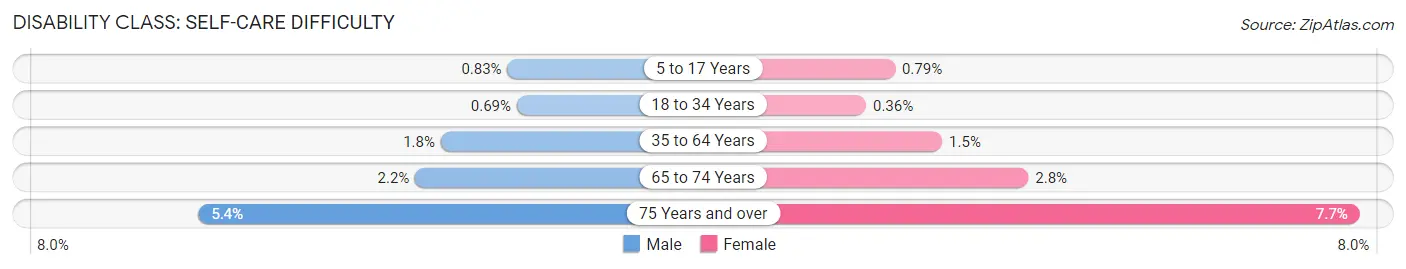
| Age Bracket | Male | Female |
| 5 to 17 Years | 178 (0.8%) | 162 (0.8%) |
| 18 to 34 Years | 296 (0.7%) | 159 (0.4%) |
| 35 to 64 Years | 1,028 (1.8%) | 861 (1.5%) |
| 65 to 74 Years | 327 (2.2%) | 469 (2.8%) |
| 75 Years and over | 460 (5.4%) | 972 (7.7%) |
Technology Access in Albany County
Computing Device Access in Albany County
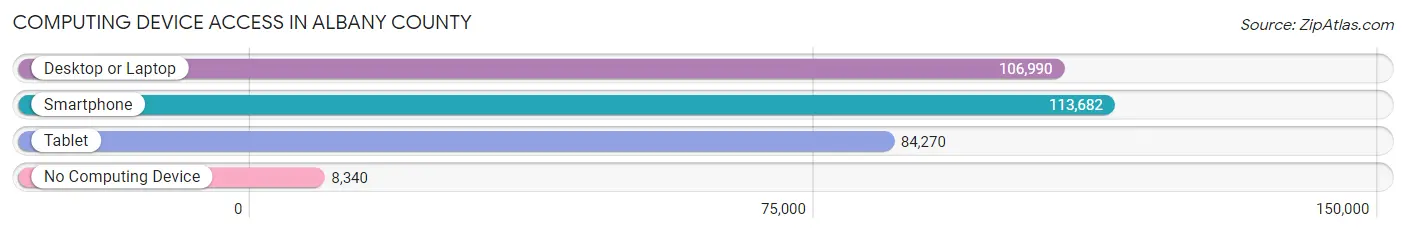
| Device Type | # Households | % Households |
| Desktop or Laptop | 106,990 | 80.9% |
| Smartphone | 113,682 | 86.0% |
| Tablet | 84,270 | 63.8% |
| No Computing Device | 8,340 | 6.3% |
| Total | 132,175 | 100.0% |
Internet Access in Albany County
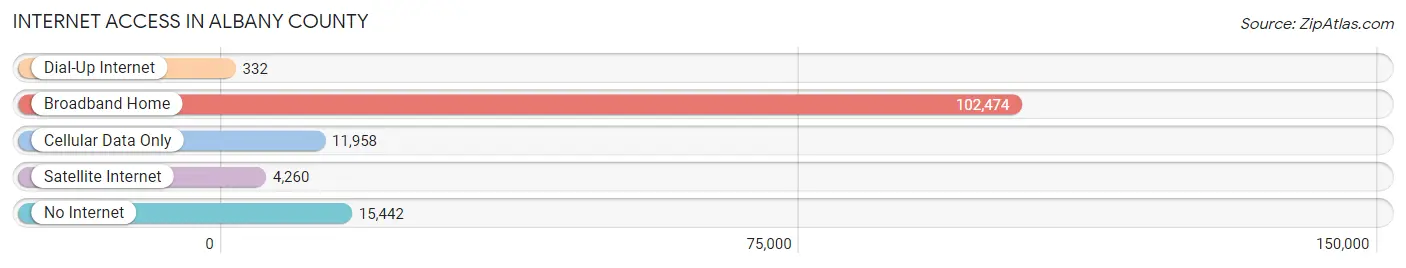
| Internet Type | # Households | % Households |
| Dial-Up Internet | 332 | 0.3% |
| Broadband Home | 102,474 | 77.5% |
| Cellular Data Only | 11,958 | 9.0% |
| Satellite Internet | 4,260 | 3.2% |
| No Internet | 15,442 | 11.7% |
| Total | 132,175 | 100.0% |
Albany County Summary
Albany County is located in the state of New York and is the most populous county in the state. It is located in the eastern part of the state and is bordered by Rensselaer, Saratoga, Schenectady, and Schoharie counties. The county seat is the city of Albany, which is also the state capital. The county has a population of 304,204 as of the 2010 census, making it the fifth most populous county in the state.
Geography
Albany County is located in the eastern part of New York State, and is bordered by Rensselaer, Saratoga, Schenectady, and Schoharie counties. The county has a total area of 645 square miles, of which 635 square miles is land and 10 square miles is water. The terrain of the county is generally flat, with some rolling hills in the northern and eastern parts of the county. The highest point in the county is the summit of Vroman's Nose, located in the town of Wright, which has an elevation of 1,903 feet. The county is drained by the Mohawk River, which flows through the center of the county, and the Hudson River, which forms the western border of the county.
History
Albany County was established in 1683, when the Province of New York was divided into twelve counties. It was named after the Duke of York and Albany, who later became King James II of England. The county was originally much larger than it is today, encompassing much of what is now Rensselaer, Saratoga, Schenectady, and Schoharie counties. The county was reduced in size in 1772, when Rensselaer and Saratoga counties were created.
The county was the site of several battles during the American Revolution, including the Battle of Saratoga in 1777. The county was also the site of the Albany Congress in 1754, which was a meeting of representatives from seven colonies to discuss issues of colonial unity.
Economy
Albany County has a diverse economy, with a mix of manufacturing, technology, healthcare, education, and government. The county is home to several major employers, including the State University of New York at Albany, Albany Medical Center, Albany International Airport, and the New York State Department of Taxation and Finance.
The county is also home to several major manufacturing companies, including General Electric, Knolls Atomic Power Laboratory, and Albany Molecular Research, Inc. The county is also home to several technology companies, including GlobalFoundries, IBM, and Intel.
Demographics
As of the 2010 census, Albany County had a population of 304,204. The racial makeup of the county was 79.2% White, 11.3% African American, 0.3% Native American, 3.2% Asian, 0.1% Pacific Islander, 3.2% from other races, and 2.9% from two or more races. Hispanic or Latino of any race were 8.7% of the population.
The median income for a household in the county was $50,895, and the median income for a family was $63,867. The per capita income for the county was $27,837. About 11.2% of families and 15.7% of the population were below the poverty line, including 22.2% of those under age 18 and 8.2% of those age 65 or over.
Albany County is home to several major universities, including the State University of New York at Albany, Albany Law School, and Albany College of Pharmacy and Health Sciences. The county is also home to several major cultural institutions, including the Albany Institute of History and Art, the Albany Symphony Orchestra, and the New York State Museum.
Common Questions
What is Per Capita Income in Albany County?
Per Capita income in Albany County is $44,101.
What is the Median Family Income in Albany County?
Median Family Income in Albany County is $110,201.
What is the Median Household income in Albany County?
Median Household Income in Albany County is $78,829.
What is Income or Wage Gap in Albany County?
Income or Wage Gap in Albany County is 23.6%.
Women in Albany County earn 76.4 cents for every dollar earned by a man.
What is Family Income Deficit in Albany County?
Family Income Deficit in Albany County is $11,295.
Families that are below poverty line in Albany County earn $11,295 less on average than the poverty threshold level.
What is Inequality or Gini Index in Albany County?
Inequality or Gini Index in Albany County is 0.45.
What is the Total Population of Albany County?
Total Population of Albany County is 315,041.
What is the Total Male Population of Albany County?
Total Male Population of Albany County is 153,405.
What is the Total Female Population of Albany County?
Total Female Population of Albany County is 161,636.
What is the Ratio of Males per 100 Females in Albany County?
There are 94.91 Males per 100 Females in Albany County.
What is the Ratio of Females per 100 Males in Albany County?
There are 105.37 Females per 100 Males in Albany County.
What is the Median Population Age in Albany County?
Median Population Age in Albany County is 38.1 Years.
What is the Average Family Size in Albany County
Average Family Size in Albany County is 2.9 People.
What is the Average Household Size in Albany County
Average Household Size in Albany County is 2.2 People.
How Large is the Labor Force in Albany County?
There are 170,171 People in the Labor Forcein in Albany County.
What is the Percentage of People in the Labor Force in Albany County?
64.2% of People are in the Labor Force in Albany County.
What is the Unemployment Rate in Albany County?
Unemployment Rate in Albany County is 5.2%.