Zip Codes with the Highest Percentage of Population Employed in Legal Services & Support in Kentucky
RELATED REPORTS & OPTIONS
Legal Services & Support
Kentucky
Compare Zip Codes
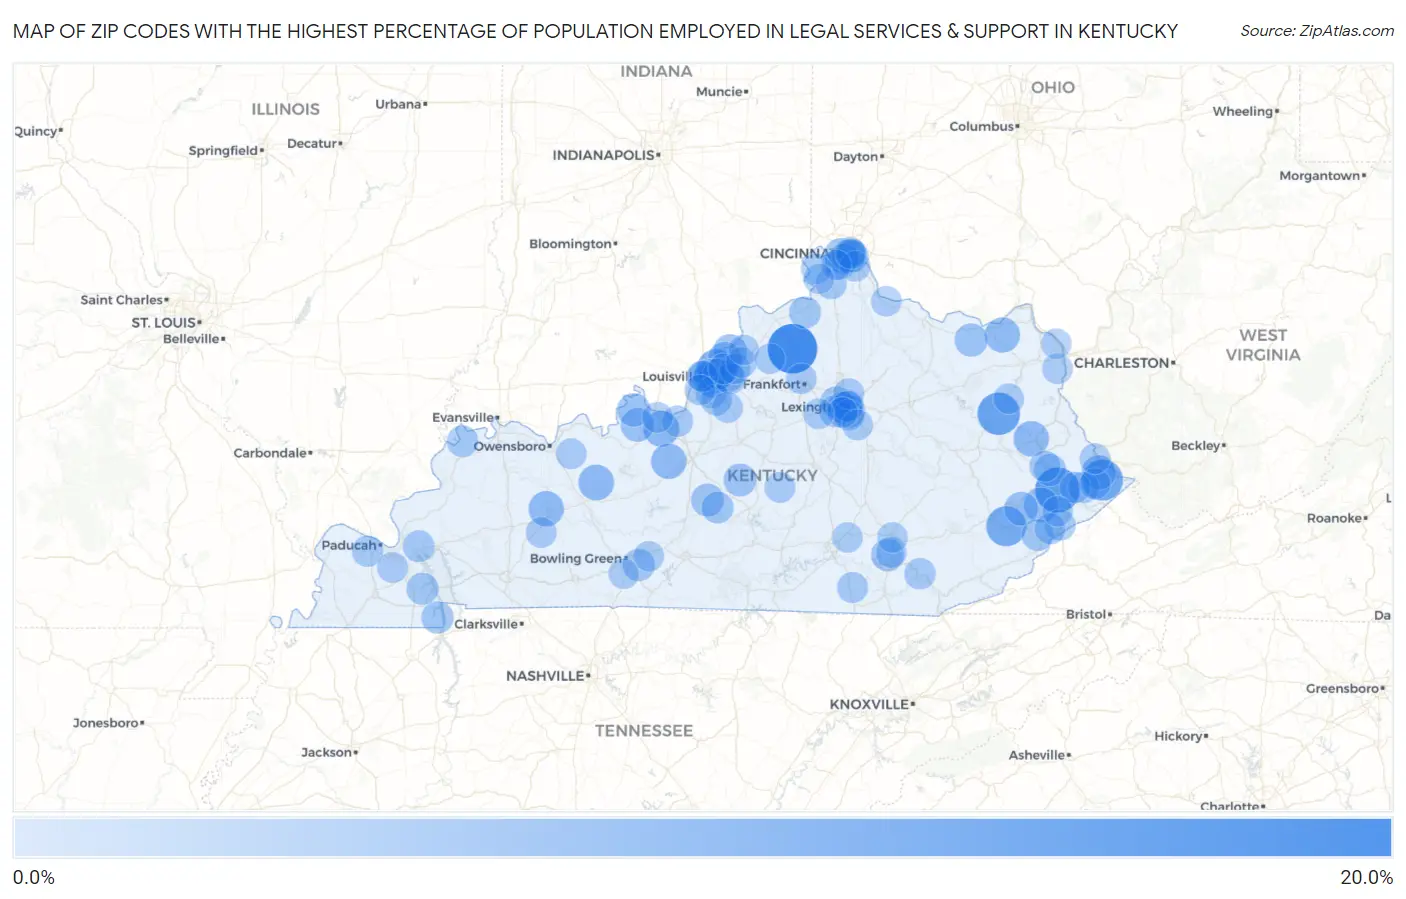
Map of Zip Codes with the Highest Percentage of Population Employed in Legal Services & Support in Kentucky
0.0%
20.0%
Zip Codes with the Highest Percentage of Population Employed in Legal Services & Support in Kentucky
| Zip Code | % Employed | vs State | vs National | |
| 1. | 40036 | 20.0% | 0.95%(+19.1)#1 | 1.2%(+18.8)#48 |
| 2. | 41631 | 15.2% | 0.95%(+14.3)#2 | 1.2%(+14.1)#79 |
| 3. | 41421 | 12.9% | 0.95%(+12.0)#3 | 1.2%(+11.7)#108 |
| 4. | 41555 | 11.5% | 0.95%(+10.6)#4 | 1.2%(+10.4)#124 |
| 5. | 41746 | 10.6% | 0.95%(+9.61)#5 | 1.2%(+9.37)#139 |
| 6. | 40025 | 9.4% | 0.95%(+8.42)#6 | 1.2%(+8.18)#177 |
| 7. | 40117 | 6.5% | 0.95%(+5.51)#7 | 1.2%(+5.27)#402 |
| 8. | 42361 | 6.3% | 0.95%(+5.33)#8 | 1.2%(+5.09)#430 |
| 9. | 41256 | 6.0% | 0.95%(+5.04)#9 | 1.2%(+4.81)#483 |
| 10. | 42724 | 5.9% | 0.95%(+4.94)#10 | 1.2%(+4.70)#505 |
| 11. | 42374 | 5.9% | 0.95%(+4.94)#11 | 1.2%(+4.70)#508 |
| 12. | 41141 | 5.8% | 0.95%(+4.84)#12 | 1.2%(+4.60)#531 |
| 13. | 41862 | 5.5% | 0.95%(+4.54)#13 | 1.2%(+4.30)#603 |
| 14. | 41535 | 4.9% | 0.95%(+3.92)#14 | 1.2%(+3.68)#757 |
| 15. | 40026 | 4.6% | 0.95%(+3.66)#15 | 1.2%(+3.42)#852 |
| 16. | 40059 | 4.5% | 0.95%(+3.53)#16 | 1.2%(+3.29)#905 |
| 17. | 41822 | 4.5% | 0.95%(+3.51)#17 | 1.2%(+3.27)#916 |
| 18. | 41016 | 4.3% | 0.95%(+3.37)#18 | 1.2%(+3.13)#972 |
| 19. | 40176 | 4.2% | 0.95%(+3.26)#19 | 1.2%(+3.02)#1,018 |
| 20. | 40157 | 3.9% | 0.95%(+2.99)#20 | 1.2%(+2.75)#1,160 |
| 21. | 41179 | 3.9% | 0.95%(+2.90)#21 | 1.2%(+2.67)#1,203 |
| 22. | 41071 | 3.8% | 0.95%(+2.90)#22 | 1.2%(+2.66)#1,209 |
| 23. | 40502 | 3.8% | 0.95%(+2.81)#23 | 1.2%(+2.57)#1,253 |
| 24. | 40507 | 3.7% | 0.95%(+2.78)#24 | 1.2%(+2.54)#1,270 |
| 25. | 42757 | 3.5% | 0.95%(+2.57)#25 | 1.2%(+2.33)#1,416 |
| 26. | 40060 | 3.5% | 0.95%(+2.56)#26 | 1.2%(+2.32)#1,432 |
| 27. | 40207 | 3.4% | 0.95%(+2.46)#27 | 1.2%(+2.22)#1,499 |
| 28. | 40737 | 3.4% | 0.95%(+2.41)#28 | 1.2%(+2.17)#1,533 |
| 29. | 40205 | 3.3% | 0.95%(+2.37)#29 | 1.2%(+2.14)#1,561 |
| 30. | 40223 | 3.2% | 0.95%(+2.28)#30 | 1.2%(+2.04)#1,632 |
| 31. | 42103 | 3.2% | 0.95%(+2.21)#31 | 1.2%(+1.97)#1,694 |
| 32. | 40204 | 3.2% | 0.95%(+2.21)#32 | 1.2%(+1.97)#1,696 |
| 33. | 42076 | 3.0% | 0.95%(+2.08)#33 | 1.2%(+1.85)#1,818 |
| 34. | 41601 | 2.9% | 0.95%(+1.94)#34 | 1.2%(+1.71)#1,981 |
| 35. | 42048 | 2.8% | 0.95%(+1.85)#35 | 1.2%(+1.61)#2,092 |
| 36. | 40206 | 2.8% | 0.95%(+1.83)#36 | 1.2%(+1.59)#2,106 |
| 37. | 40510 | 2.8% | 0.95%(+1.81)#37 | 1.2%(+1.57)#2,130 |
| 38. | 41075 | 2.7% | 0.95%(+1.79)#38 | 1.2%(+1.55)#2,152 |
| 39. | 41086 | 2.7% | 0.95%(+1.73)#39 | 1.2%(+1.50)#2,234 |
| 40. | 40513 | 2.7% | 0.95%(+1.73)#40 | 1.2%(+1.49)#2,242 |
| 41. | 40202 | 2.6% | 0.95%(+1.70)#41 | 1.2%(+1.46)#2,273 |
| 42. | 42782 | 2.6% | 0.95%(+1.68)#42 | 1.2%(+1.44)#2,315 |
| 43. | 41858 | 2.6% | 0.95%(+1.67)#43 | 1.2%(+1.43)#2,336 |
| 44. | 42045 | 2.4% | 0.95%(+1.42)#44 | 1.2%(+1.19)#2,722 |
| 45. | 40504 | 2.4% | 0.95%(+1.41)#45 | 1.2%(+1.17)#2,745 |
| 46. | 41017 | 2.3% | 0.95%(+1.32)#46 | 1.2%(+1.08)#2,910 |
| 47. | 42461 | 2.2% | 0.95%(+1.21)#47 | 1.2%(+0.976)#3,116 |
| 48. | 41557 | 2.1% | 0.95%(+1.17)#48 | 1.2%(+0.931)#3,203 |
| 49. | 40906 | 2.1% | 0.95%(+1.12)#49 | 1.2%(+0.878)#3,307 |
| 50. | 40219 | 2.0% | 0.95%(+1.06)#50 | 1.2%(+0.823)#3,465 |
| 51. | 40222 | 2.0% | 0.95%(+1.06)#51 | 1.2%(+0.822)#3,468 |
| 52. | 41537 | 2.0% | 0.95%(+1.01)#52 | 1.2%(+0.777)#3,574 |
| 53. | 42001 | 2.0% | 0.95%(+1.01)#53 | 1.2%(+0.772)#3,586 |
| 54. | 40155 | 1.9% | 0.95%(+0.977)#54 | 1.2%(+0.739)#3,667 |
| 55. | 41501 | 1.9% | 0.95%(+0.956)#55 | 1.2%(+0.718)#3,727 |
| 56. | 42653 | 1.8% | 0.95%(+0.863)#56 | 1.2%(+0.625)#3,981 |
| 57. | 40229 | 1.8% | 0.95%(+0.849)#57 | 1.2%(+0.611)#4,021 |
| 58. | 41840 | 1.8% | 0.95%(+0.844)#58 | 1.2%(+0.606)#4,032 |
| 59. | 41011 | 1.8% | 0.95%(+0.838)#59 | 1.2%(+0.600)#4,046 |
| 60. | 41539 | 1.8% | 0.95%(+0.826)#60 | 1.2%(+0.588)#4,074 |
| 61. | 41653 | 1.8% | 0.95%(+0.805)#61 | 1.2%(+0.567)#4,137 |
| 62. | 40243 | 1.7% | 0.95%(+0.804)#62 | 1.2%(+0.566)#4,144 |
| 63. | 41094 | 1.7% | 0.95%(+0.778)#63 | 1.2%(+0.540)#4,234 |
| 64. | 41073 | 1.7% | 0.95%(+0.730)#64 | 1.2%(+0.492)#4,399 |
| 65. | 40047 | 1.7% | 0.95%(+0.721)#65 | 1.2%(+0.483)#4,445 |
| 66. | 40517 | 1.6% | 0.95%(+0.701)#66 | 1.2%(+0.463)#4,497 |
| 67. | 40511 | 1.6% | 0.95%(+0.658)#67 | 1.2%(+0.420)#4,659 |
| 68. | 40056 | 1.6% | 0.95%(+0.636)#68 | 1.2%(+0.398)#4,742 |
| 69. | 42082 | 1.6% | 0.95%(+0.621)#69 | 1.2%(+0.383)#4,790 |
| 70. | 40508 | 1.6% | 0.95%(+0.606)#70 | 1.2%(+0.368)#4,837 |
| 71. | 40515 | 1.5% | 0.95%(+0.599)#71 | 1.2%(+0.361)#4,869 |
| 72. | 40009 | 1.5% | 0.95%(+0.593)#72 | 1.2%(+0.355)#4,891 |
| 73. | 40601 | 1.5% | 0.95%(+0.574)#73 | 1.2%(+0.336)#4,962 |
| 74. | 41514 | 1.5% | 0.95%(+0.571)#74 | 1.2%(+0.333)#4,974 |
| 75. | 40203 | 1.5% | 0.95%(+0.562)#75 | 1.2%(+0.324)#5,017 |
| 76. | 42366 | 1.5% | 0.95%(+0.553)#76 | 1.2%(+0.315)#5,060 |
| 77. | 42345 | 1.5% | 0.95%(+0.550)#77 | 1.2%(+0.312)#5,069 |
| 78. | 40241 | 1.5% | 0.95%(+0.543)#78 | 1.2%(+0.305)#5,092 |
| 79. | 40108 | 1.5% | 0.95%(+0.517)#79 | 1.2%(+0.279)#5,199 |
| 80. | 40503 | 1.4% | 0.95%(+0.476)#80 | 1.2%(+0.238)#5,364 |
| 81. | 40744 | 1.4% | 0.95%(+0.440)#81 | 1.2%(+0.202)#5,539 |
| 82. | 40014 | 1.4% | 0.95%(+0.431)#82 | 1.2%(+0.193)#5,579 |
| 83. | 40383 | 1.4% | 0.95%(+0.419)#83 | 1.2%(+0.181)#5,630 |
| 84. | 41171 | 1.4% | 0.95%(+0.408)#84 | 1.2%(+0.170)#5,676 |
| 85. | 41076 | 1.3% | 0.95%(+0.398)#85 | 1.2%(+0.160)#5,714 |
| 86. | 42159 | 1.3% | 0.95%(+0.389)#86 | 1.2%(+0.151)#5,762 |
| 87. | 41074 | 1.3% | 0.95%(+0.372)#87 | 1.2%(+0.134)#5,847 |
| 88. | 40214 | 1.3% | 0.95%(+0.304)#88 | 1.2%(+0.066)#6,205 |
| 89. | 41572 | 1.3% | 0.95%(+0.304)#89 | 1.2%(+0.066)#6,209 |
| 90. | 40741 | 1.2% | 0.95%(+0.298)#90 | 1.2%(+0.060)#6,247 |
| 91. | 41129 | 1.2% | 0.95%(+0.295)#91 | 1.2%(+0.057)#6,262 |
| 92. | 42503 | 1.2% | 0.95%(+0.289)#92 | 1.2%(+0.051)#6,296 |
| 93. | 40031 | 1.2% | 0.95%(+0.283)#93 | 1.2%(+0.045)#6,327 |
| 94. | 41018 | 1.2% | 0.95%(+0.253)#94 | 1.2%(+0.015)#6,507 |
| 95. | 41005 | 1.2% | 0.95%(+0.241)#95 | 1.2%(+0.003)#6,593 |
| 96. | 41091 | 1.2% | 0.95%(+0.235)#96 | 1.2%(-0.003)#6,642 |
| 97. | 42104 | 1.2% | 0.95%(+0.228)#97 | 1.2%(-0.010)#6,686 |
| 98. | 40019 | 1.2% | 0.95%(+0.228)#98 | 1.2%(-0.010)#6,687 |
| 99. | 41101 | 1.2% | 0.95%(+0.219)#99 | 1.2%(-0.019)#6,743 |
| 100. | 41043 | 1.2% | 0.95%(+0.212)#100 | 1.2%(-0.026)#6,779 |
Common Questions
What are the Top 10 Zip Codes with the Highest Percentage of Population Employed in Legal Services & Support in Kentucky?
Top 10 Zip Codes with the Highest Percentage of Population Employed in Legal Services & Support in Kentucky are:
What zip code has the Highest Percentage of Population Employed in Legal Services & Support in Kentucky?
40036 has the Highest Percentage of Population Employed in Legal Services & Support in Kentucky with 20.0%.
What is the Percentage of Population Employed in Legal Services & Support in the State of Kentucky?
Percentage of Population Employed in Legal Services & Support in Kentucky is 0.95%.
What is the Percentage of Population Employed in Legal Services & Support in the United States?
Percentage of Population Employed in Legal Services & Support in the United States is 1.2%.