Zip Codes with the Highest Percentage of Population Employed in Legal Services & Support in Louisville, KY
RELATED REPORTS & OPTIONS
Legal Services & Support
Louisville
Compare Zip Codes
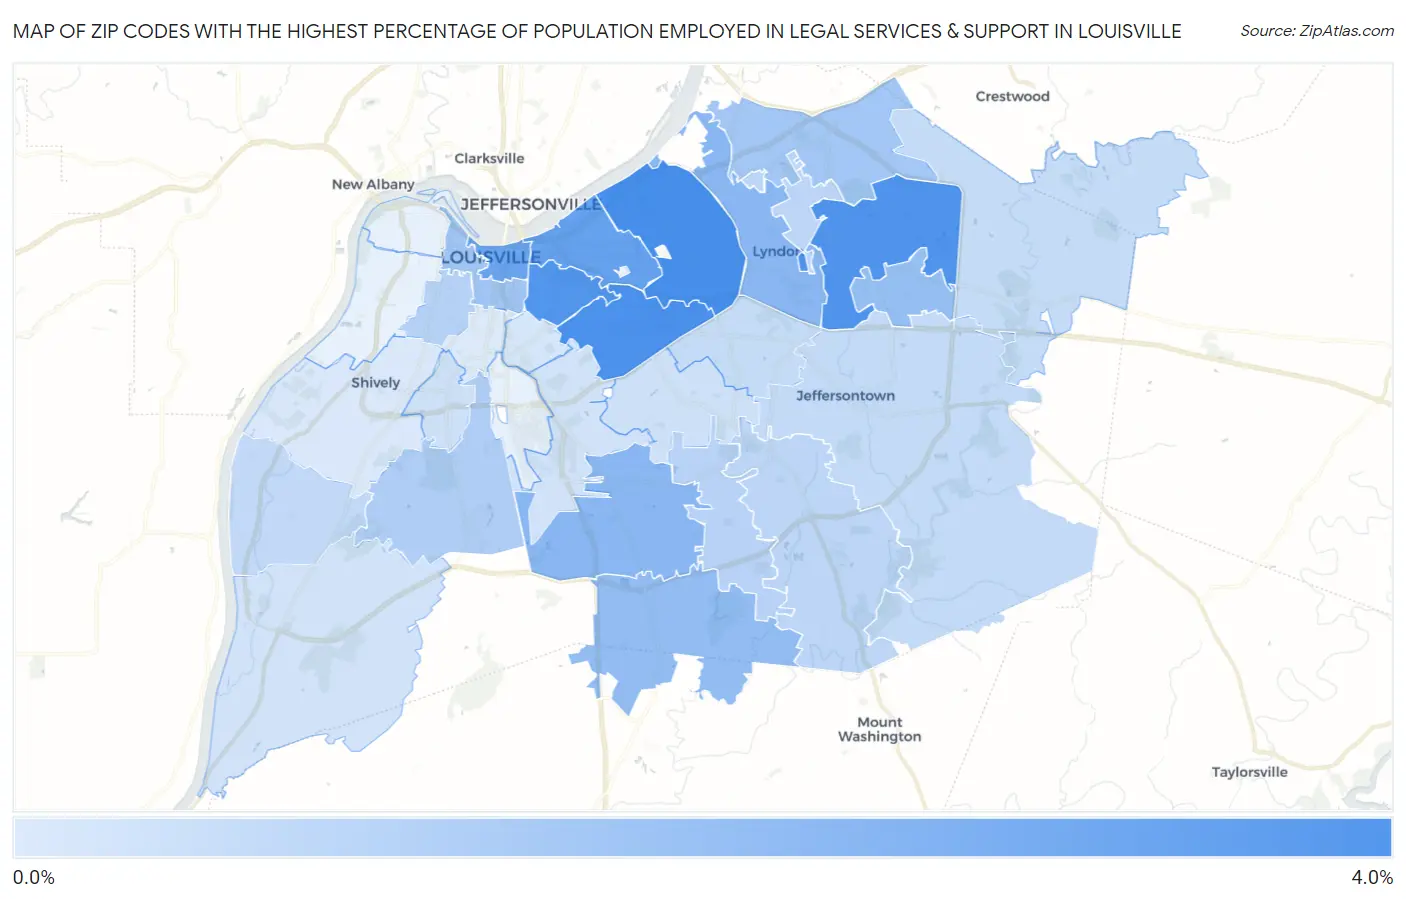
Map of Zip Codes with the Highest Percentage of Population Employed in Legal Services & Support in Louisville
0.29%
3.4%
Zip Codes with the Highest Percentage of Population Employed in Legal Services & Support in Louisville, KY
| Zip Code | % Employed | vs State | vs National | |
| 1. | 40207 | 3.4% | 0.95%(+2.46)#27 | 1.2%(+2.22)#1,499 |
| 2. | 40205 | 3.3% | 0.95%(+2.37)#29 | 1.2%(+2.14)#1,561 |
| 3. | 40223 | 3.2% | 0.95%(+2.28)#30 | 1.2%(+2.04)#1,632 |
| 4. | 40204 | 3.2% | 0.95%(+2.21)#32 | 1.2%(+1.97)#1,696 |
| 5. | 40206 | 2.8% | 0.95%(+1.83)#36 | 1.2%(+1.59)#2,106 |
| 6. | 40202 | 2.6% | 0.95%(+1.70)#41 | 1.2%(+1.46)#2,273 |
| 7. | 40219 | 2.0% | 0.95%(+1.06)#50 | 1.2%(+0.823)#3,465 |
| 8. | 40222 | 2.0% | 0.95%(+1.06)#51 | 1.2%(+0.822)#3,468 |
| 9. | 40229 | 1.8% | 0.95%(+0.849)#57 | 1.2%(+0.611)#4,021 |
| 10. | 40243 | 1.7% | 0.95%(+0.804)#62 | 1.2%(+0.566)#4,144 |
| 11. | 40203 | 1.5% | 0.95%(+0.562)#75 | 1.2%(+0.324)#5,017 |
| 12. | 40241 | 1.5% | 0.95%(+0.543)#78 | 1.2%(+0.305)#5,092 |
| 13. | 40214 | 1.3% | 0.95%(+0.304)#88 | 1.2%(+0.066)#6,205 |
| 14. | 40210 | 1.1% | 0.95%(+0.158)#101 | 1.2%(-0.080)#7,146 |
| 15. | 40228 | 1.0% | 0.95%(+0.098)#107 | 1.2%(-0.140)#7,528 |
| 16. | 40291 | 0.97% | 0.95%(+0.021)#114 | 1.2%(-0.217)#8,061 |
| 17. | 40242 | 0.97% | 0.95%(+0.021)#115 | 1.2%(-0.217)#8,065 |
| 18. | 40258 | 0.84% | 0.95%(-0.104)#125 | 1.2%(-0.342)#9,089 |
| 19. | 40299 | 0.83% | 0.95%(-0.116)#127 | 1.2%(-0.354)#9,187 |
| 20. | 40245 | 0.79% | 0.95%(-0.157)#131 | 1.2%(-0.395)#9,563 |
| 21. | 40220 | 0.78% | 0.95%(-0.169)#133 | 1.2%(-0.407)#9,672 |
| 22. | 40218 | 0.58% | 0.95%(-0.368)#159 | 1.2%(-0.606)#11,715 |
| 23. | 40215 | 0.57% | 0.95%(-0.375)#161 | 1.2%(-0.613)#11,797 |
| 24. | 40213 | 0.55% | 0.95%(-0.397)#166 | 1.2%(-0.635)#12,065 |
| 25. | 40272 | 0.52% | 0.95%(-0.423)#169 | 1.2%(-0.661)#12,338 |
| 26. | 40217 | 0.44% | 0.95%(-0.510)#181 | 1.2%(-0.748)#13,407 |
| 27. | 40216 | 0.35% | 0.95%(-0.594)#200 | 1.2%(-0.832)#14,428 |
| 28. | 40208 | 0.29% | 0.95%(-0.653)#213 | 1.2%(-0.891)#15,124 |
1
Common Questions
What are the Top 10 Zip Codes with the Highest Percentage of Population Employed in Legal Services & Support in Louisville, KY?
Top 10 Zip Codes with the Highest Percentage of Population Employed in Legal Services & Support in Louisville, KY are:
What zip code has the Highest Percentage of Population Employed in Legal Services & Support in Louisville, KY?
40207 has the Highest Percentage of Population Employed in Legal Services & Support in Louisville, KY with 3.4%.
What is the Percentage of Population Employed in Legal Services & Support in Louisville, KY?
Percentage of Population Employed in Legal Services & Support in Louisville is 1.3%.
What is the Percentage of Population Employed in Legal Services & Support in Kentucky?
Percentage of Population Employed in Legal Services & Support in Kentucky is 0.95%.
What is the Percentage of Population Employed in Legal Services & Support in the United States?
Percentage of Population Employed in Legal Services & Support in the United States is 1.2%.