Zip Codes with the Highest Percentage of Population Employed in Legal Services & Support in Covington, KY
RELATED REPORTS & OPTIONS
Legal Services & Support
Covington
Compare Zip Codes
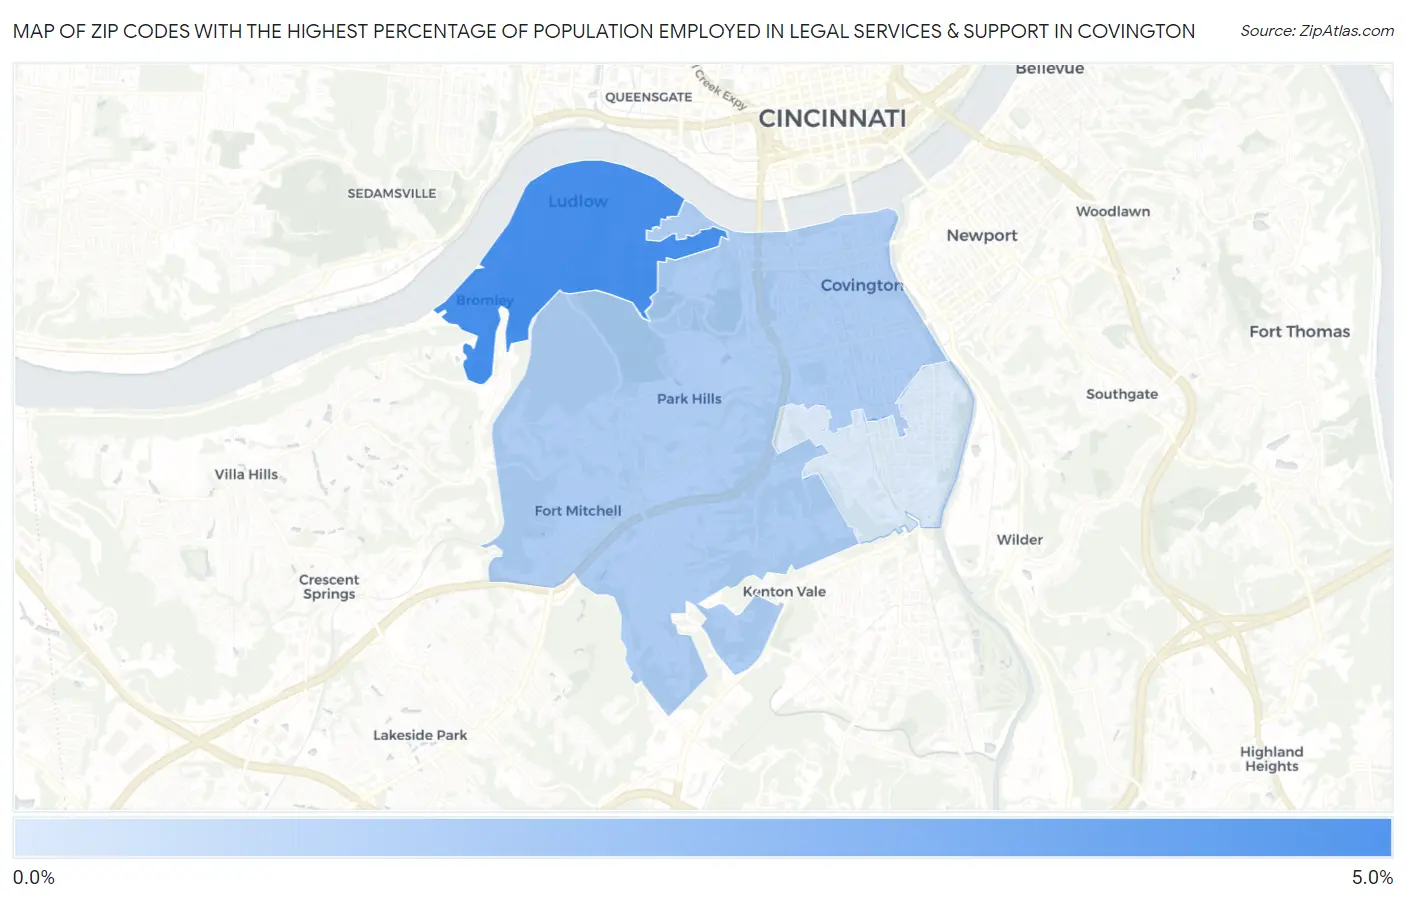
Map of Zip Codes with the Highest Percentage of Population Employed in Legal Services & Support in Covington
0.71%
4.3%
Zip Codes with the Highest Percentage of Population Employed in Legal Services & Support in Covington, KY
| Zip Code | % Employed | vs State | vs National | |
| 1. | 41016 | 4.3% | 0.95%(+3.37)#18 | 1.2%(+3.13)#972 |
| 2. | 41011 | 1.8% | 0.95%(+0.838)#59 | 1.2%(+0.600)#4,046 |
| 3. | 41014 | 0.71% | 0.95%(-0.232)#142 | 1.2%(-0.470)#10,285 |
1
Common Questions
What are the Top Zip Codes with the Highest Percentage of Population Employed in Legal Services & Support in Covington, KY?
Top Zip Codes with the Highest Percentage of Population Employed in Legal Services & Support in Covington, KY are:
What zip code has the Highest Percentage of Population Employed in Legal Services & Support in Covington, KY?
41016 has the Highest Percentage of Population Employed in Legal Services & Support in Covington, KY with 4.3%.
What is the Percentage of Population Employed in Legal Services & Support in Covington, KY?
Percentage of Population Employed in Legal Services & Support in Covington is 2.1%.
What is the Percentage of Population Employed in Legal Services & Support in Kentucky?
Percentage of Population Employed in Legal Services & Support in Kentucky is 0.95%.
What is the Percentage of Population Employed in Legal Services & Support in the United States?
Percentage of Population Employed in Legal Services & Support in the United States is 1.2%.