Ludlow, KY Map & Demographics
Ludlow Map
Ludlow Overview
$31,570
PER CAPITA INCOME
$71,971
AVG FAMILY INCOME
$59,089
AVG HOUSEHOLD INCOME
29.9%
WAGE / INCOME GAP [ % ]
70.1¢/ $1
WAGE / INCOME GAP [ $ ]
0.43
INEQUALITY / GINI INDEX
4,384
TOTAL POPULATION
1,947
MALE POPULATION
2,437
FEMALE POPULATION
79.89
MALES / 100 FEMALES
125.17
FEMALES / 100 MALES
37.5
MEDIAN AGE
3.3
AVG FAMILY SIZE
2.3
AVG HOUSEHOLD SIZE
2,398
LABOR FORCE [ PEOPLE ]
67.0%
PERCENT IN LABOR FORCE
7.0%
UNEMPLOYMENT RATE
Ludlow Area Codes
Income in Ludlow
Income Overview in Ludlow
Per Capita Income in Ludlow is $31,570, while median incomes of families and households are $71,971 and $59,089 respectively.
| Characteristic | Number | Measure |
| Per Capita Income | 4,384 | $31,570 |
| Median Family Income | 916 | $71,971 |
| Mean Family Income | 916 | $84,183 |
| Median Household Income | 1,914 | $59,089 |
| Mean Household Income | 1,914 | $69,681 |
| Income Deficit | 916 | $0 |
| Wage / Income Gap (%) | 4,384 | 29.89% |
| Wage / Income Gap ($) | 4,384 | 70.11¢ per $1 |
| Gini / Inequality Index | 4,384 | 0.43 |
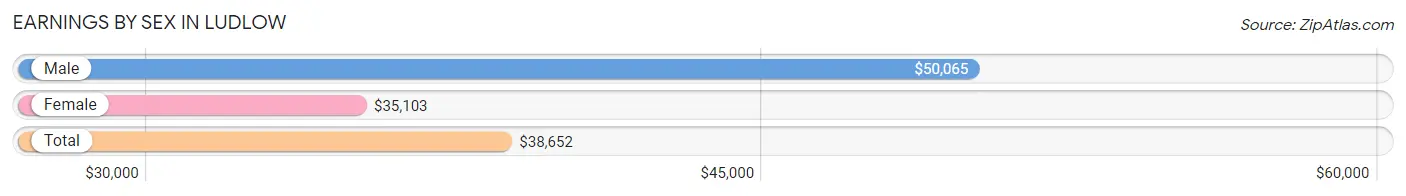
Earnings by Sex in Ludlow
Average Earnings in Ludlow are $38,652, $50,065 for men and $35,103 for women, a difference of 29.9%.
| Sex | Number | Average Earnings |
| Male | 1,239 (51.9%) | $50,065 |
| Female | 1,150 (48.1%) | $35,103 |
| Total | 2,389 (100.0%) | $38,652 |
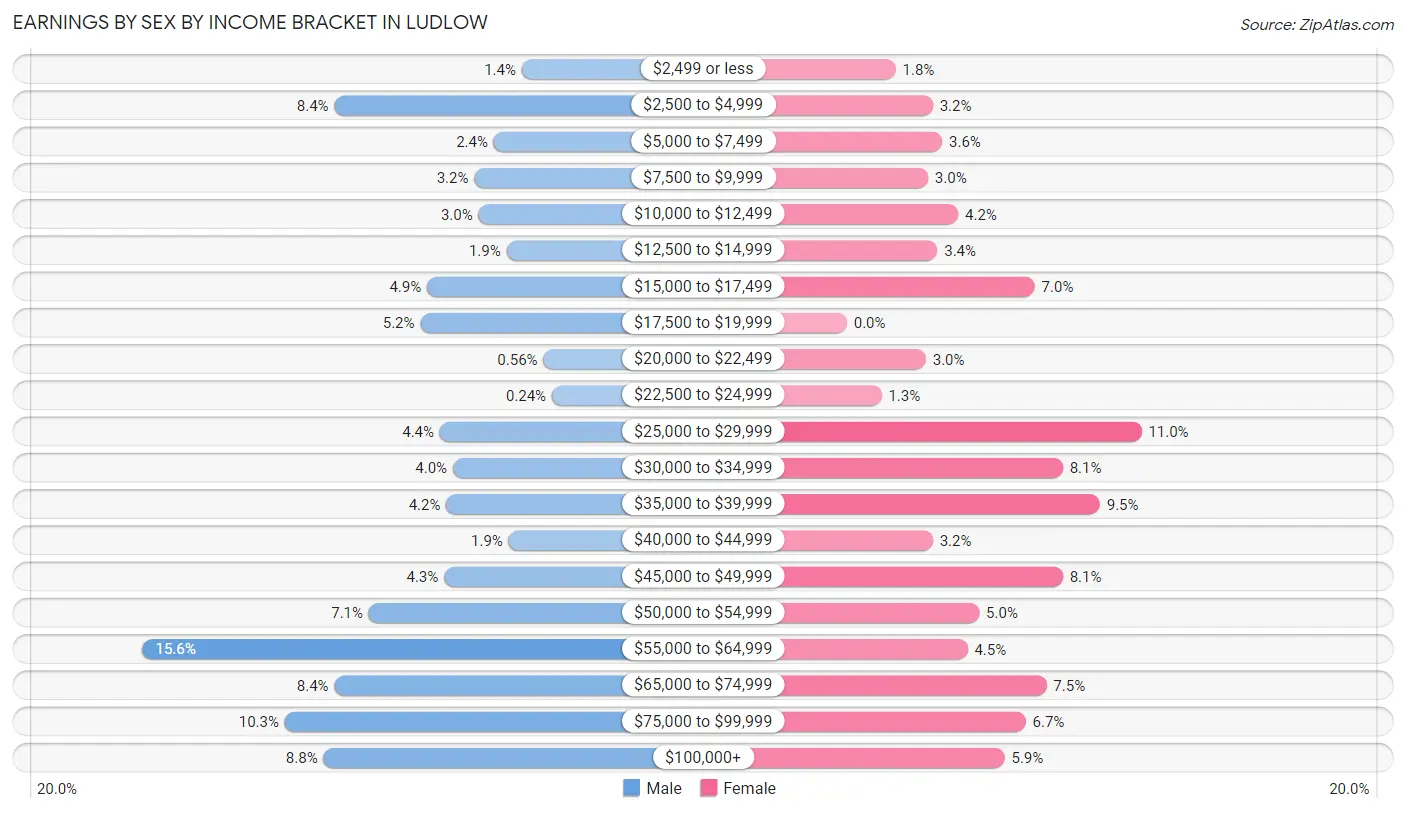
Earnings by Sex by Income Bracket in Ludlow
The most common earnings brackets in Ludlow are $55,000 to $64,999 for men (193 | 15.6%) and $25,000 to $29,999 for women (127 | 11.0%).
| Income | Male | Female |
| $2,499 or less | 17 (1.4%) | 21 (1.8%) |
| $2,500 to $4,999 | 104 (8.4%) | 37 (3.2%) |
| $5,000 to $7,499 | 30 (2.4%) | 41 (3.6%) |
| $7,500 to $9,999 | 39 (3.2%) | 35 (3.0%) |
| $10,000 to $12,499 | 37 (3.0%) | 48 (4.2%) |
| $12,500 to $14,999 | 24 (1.9%) | 39 (3.4%) |
| $15,000 to $17,499 | 61 (4.9%) | 81 (7.0%) |
| $17,500 to $19,999 | 64 (5.2%) | 0 (0.0%) |
| $20,000 to $22,499 | 7 (0.6%) | 34 (3.0%) |
| $22,500 to $24,999 | 3 (0.2%) | 15 (1.3%) |
| $25,000 to $29,999 | 55 (4.4%) | 127 (11.0%) |
| $30,000 to $34,999 | 49 (4.0%) | 93 (8.1%) |
| $35,000 to $39,999 | 52 (4.2%) | 109 (9.5%) |
| $40,000 to $44,999 | 23 (1.9%) | 37 (3.2%) |
| $45,000 to $49,999 | 53 (4.3%) | 93 (8.1%) |
| $50,000 to $54,999 | 88 (7.1%) | 57 (5.0%) |
| $55,000 to $64,999 | 193 (15.6%) | 52 (4.5%) |
| $65,000 to $74,999 | 104 (8.4%) | 86 (7.5%) |
| $75,000 to $99,999 | 127 (10.2%) | 77 (6.7%) |
| $100,000+ | 109 (8.8%) | 68 (5.9%) |
| Total | 1,239 (100.0%) | 1,150 (100.0%) |
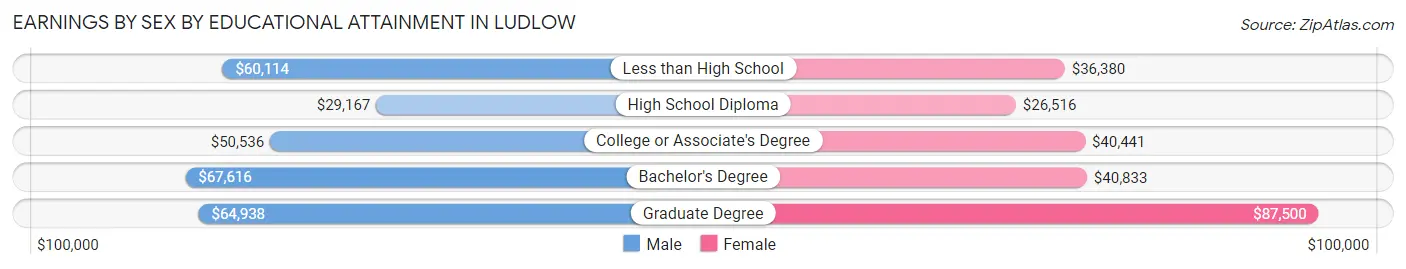
Earnings by Sex by Educational Attainment in Ludlow
Average earnings in Ludlow are $55,261 for men and $38,542 for women, a difference of 30.2%. Men with an educational attainment of bachelor's degree enjoy the highest average annual earnings of $67,616, while those with high school diploma education earn the least with $29,167. Women with an educational attainment of graduate degree earn the most with the average annual earnings of $87,500, while those with high school diploma education have the smallest earnings of $26,516.
| Educational Attainment | Male Income | Female Income |
| Less than High School | $60,114 | $36,380 |
| High School Diploma | $29,167 | $26,516 |
| College or Associate's Degree | $50,536 | $40,441 |
| Bachelor's Degree | $67,616 | $40,833 |
| Graduate Degree | $64,938 | $87,500 |
| Total | $55,261 | $38,542 |
Family Income in Ludlow
Family Income Brackets in Ludlow
According to the Ludlow family income data, there are 219 families falling into the $100,000 to $149,999 income range, which is the most common income bracket and makes up 23.9% of all families. Conversely, the $15,000 to $24,999 income bracket is the least frequent group with only 10 families (1.1%) belonging to this category.
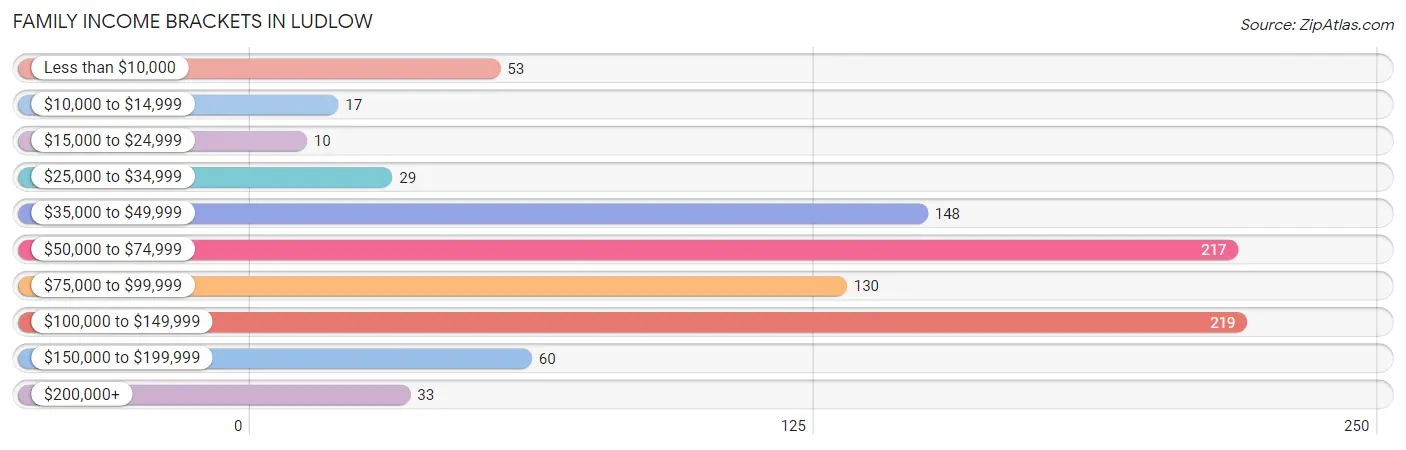
| Income Bracket | # Families | % Families |
| Less than $10,000 | 53 | 5.8% |
| $10,000 to $14,999 | 17 | 1.9% |
| $15,000 to $24,999 | 10 | 1.1% |
| $25,000 to $34,999 | 29 | 3.2% |
| $35,000 to $49,999 | 148 | 16.2% |
| $50,000 to $74,999 | 217 | 23.7% |
| $75,000 to $99,999 | 130 | 14.2% |
| $100,000 to $149,999 | 219 | 23.9% |
| $150,000 to $199,999 | 60 | 6.6% |
| $200,000+ | 33 | 3.6% |
Family Income by Famaliy Size in Ludlow
5-person families (69 | 7.5%) account for the highest median family income in Ludlow with $113,625 per family, while 2-person families (501 | 54.7%) have the highest median income of $40,312 per family member.
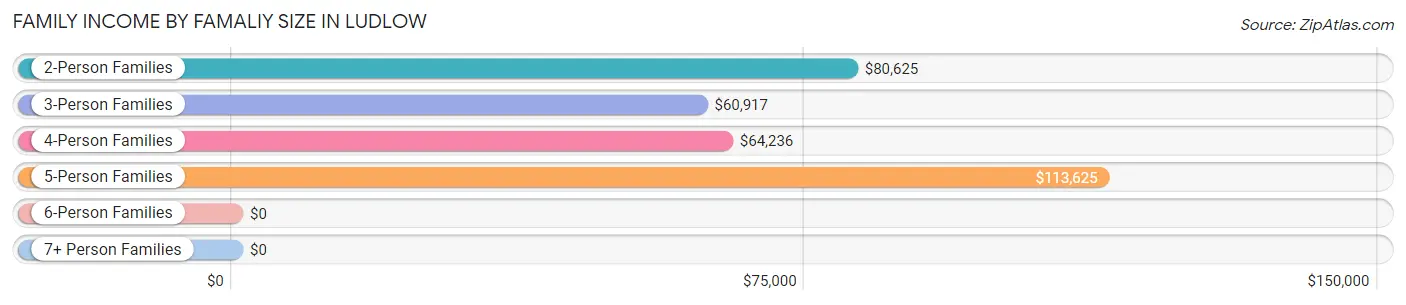
| Income Bracket | # Families | Median Income |
| 2-Person Families | 501 (54.7%) | $80,625 |
| 3-Person Families | 153 (16.7%) | $60,917 |
| 4-Person Families | 91 (9.9%) | $64,236 |
| 5-Person Families | 69 (7.5%) | $113,625 |
| 6-Person Families | 58 (6.3%) | $0 |
| 7+ Person Families | 44 (4.8%) | $0 |
| Total | 916 (100.0%) | $71,971 |
Family Income by Number of Earners in Ludlow
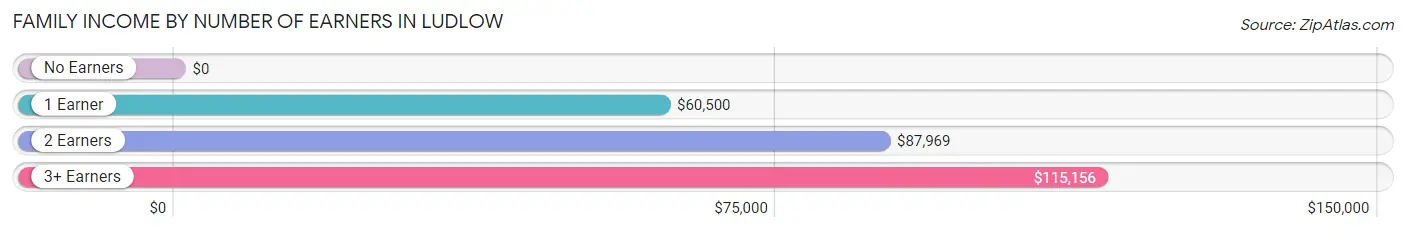
| Number of Earners | # Families | Median Income |
| No Earners | 133 (14.5%) | $0 |
| 1 Earner | 292 (31.9%) | $60,500 |
| 2 Earners | 417 (45.5%) | $87,969 |
| 3+ Earners | 74 (8.1%) | $115,156 |
| Total | 916 (100.0%) | $71,971 |
Household Income in Ludlow
Household Income Brackets in Ludlow
With 389 households falling in the category, the $50,000 to $74,999 income range is the most frequent in Ludlow, accounting for 20.3% of all households. In contrast, only 52 households (2.7%) fall into the $200,000+ income bracket, making it the least populous group.
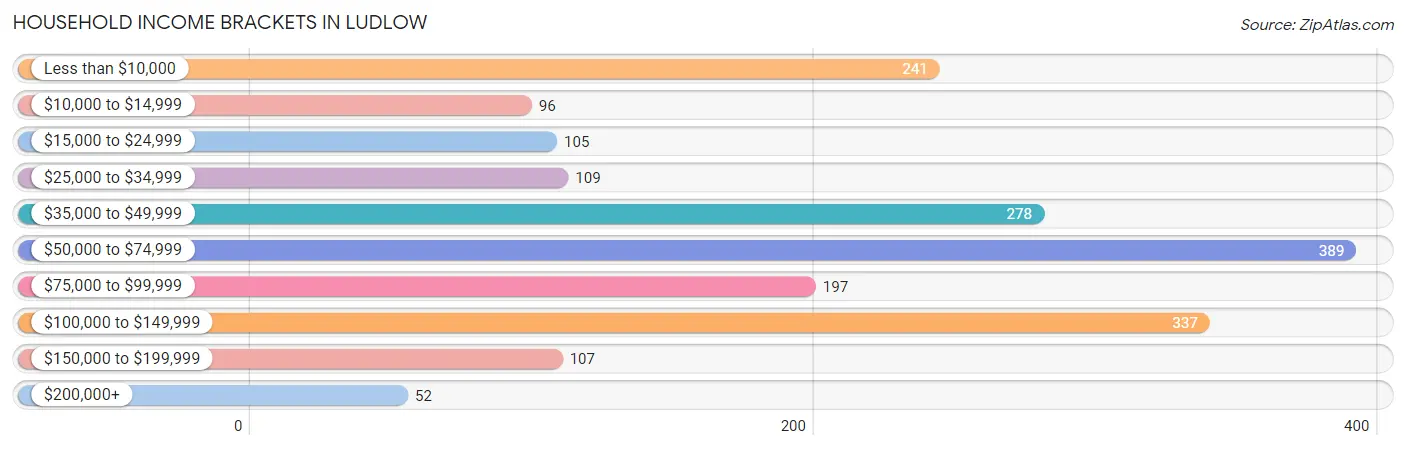
| Income Bracket | # Households | % Households |
| Less than $10,000 | 241 | 12.6% |
| $10,000 to $14,999 | 96 | 5.0% |
| $15,000 to $24,999 | 105 | 5.5% |
| $25,000 to $34,999 | 109 | 5.7% |
| $35,000 to $49,999 | 278 | 14.5% |
| $50,000 to $74,999 | 389 | 20.3% |
| $75,000 to $99,999 | 197 | 10.3% |
| $100,000 to $149,999 | 337 | 17.6% |
| $150,000 to $199,999 | 107 | 5.6% |
| $200,000+ | 52 | 2.7% |
Household Income by Householder Age in Ludlow
The median household income in Ludlow is $59,089, with the highest median household income of $71,362 found in the 25 to 44 years age bracket for the primary householder. A total of 777 households (40.6%) fall into this category. Meanwhile, the 65+ years age bracket for the primary householder has the lowest median household income of $28,152, with 648 households (33.9%) in this group.
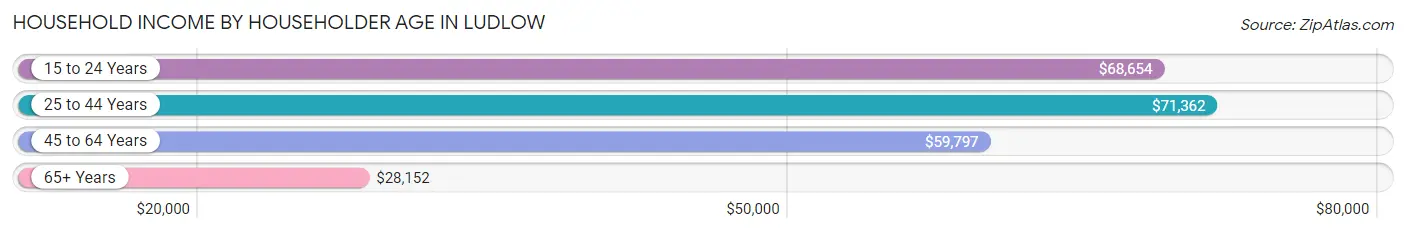
| Income Bracket | # Households | Median Income |
| 15 to 24 Years | 48 (2.5%) | $68,654 |
| 25 to 44 Years | 777 (40.6%) | $71,362 |
| 45 to 64 Years | 441 (23.0%) | $59,797 |
| 65+ Years | 648 (33.9%) | $28,152 |
| Total | 1,914 (100.0%) | $59,089 |
Poverty in Ludlow
Income Below Poverty by Sex and Age in Ludlow
With 9.2% poverty level for males and 28.1% for females among the residents of Ludlow, 6 to 11 year old males and 16 and 17 year old females are the most vulnerable to poverty, with 55 males (45.5%) and 108 females (100.0%) in their respective age groups living below the poverty level.
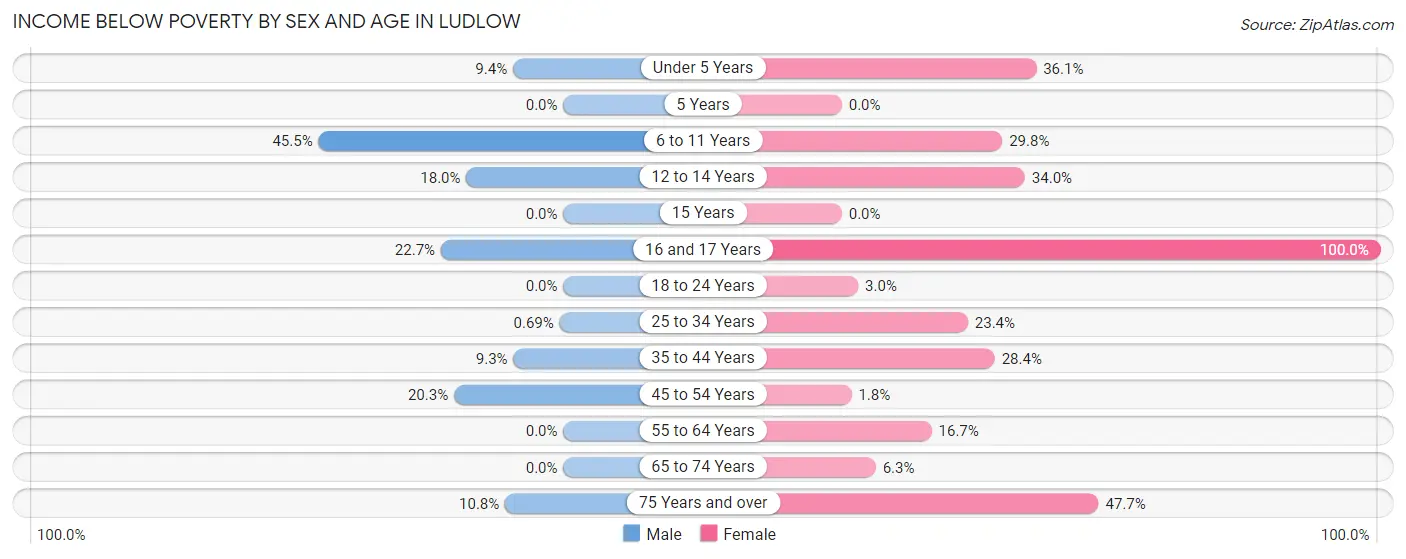
| Age Bracket | Male | Female |
| Under 5 Years | 10 (9.3%) | 48 (36.1%) |
| 5 Years | 0 (0.0%) | 0 (0.0%) |
| 6 to 11 Years | 55 (45.5%) | 53 (29.8%) |
| 12 to 14 Years | 9 (18.0%) | 52 (34.0%) |
| 15 Years | 0 (0.0%) | 0 (0.0%) |
| 16 and 17 Years | 20 (22.7%) | 108 (100.0%) |
| 18 to 24 Years | 0 (0.0%) | 7 (3.0%) |
| 25 to 34 Years | 2 (0.7%) | 55 (23.4%) |
| 35 to 44 Years | 35 (9.3%) | 113 (28.4%) |
| 45 to 54 Years | 40 (20.3%) | 2 (1.8%) |
| 55 to 64 Years | 0 (0.0%) | 54 (16.7%) |
| 65 to 74 Years | 0 (0.0%) | 10 (6.3%) |
| 75 Years and over | 8 (10.8%) | 183 (47.7%) |
| Total | 179 (9.2%) | 685 (28.1%) |
Income Above Poverty by Sex and Age in Ludlow
According to the poverty statistics in Ludlow, males aged 5 years and females aged 5 years are the age groups that are most secure financially, with 100.0% of males and 100.0% of females in these age groups living above the poverty line.
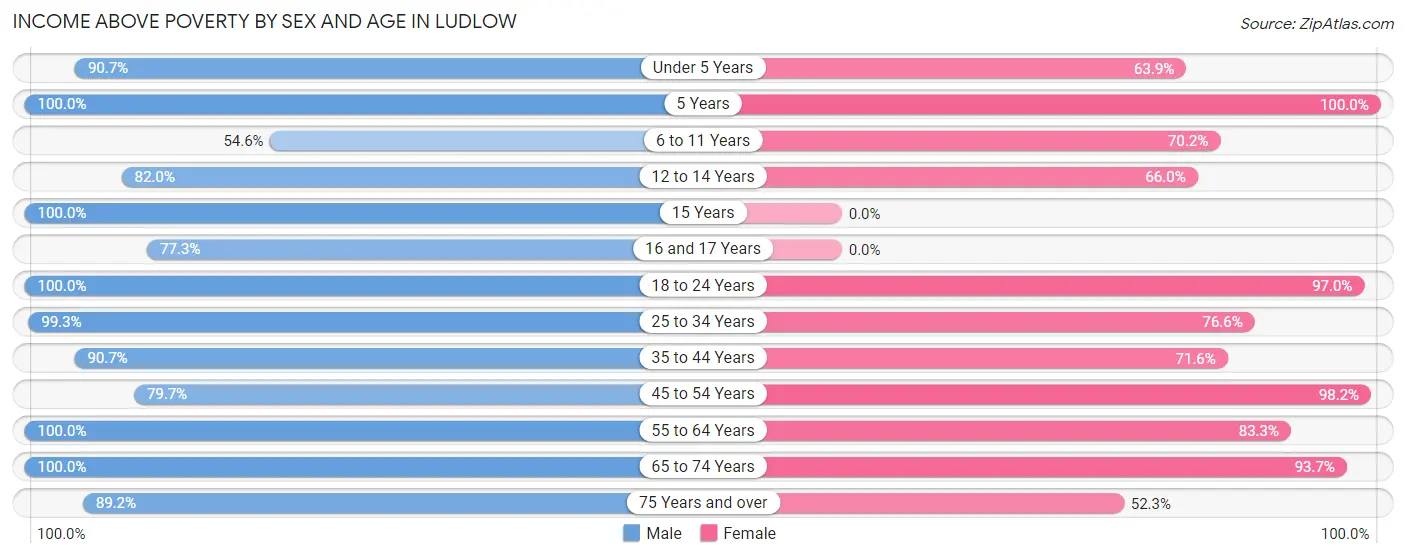
| Age Bracket | Male | Female |
| Under 5 Years | 97 (90.6%) | 85 (63.9%) |
| 5 Years | 30 (100.0%) | 23 (100.0%) |
| 6 to 11 Years | 66 (54.5%) | 125 (70.2%) |
| 12 to 14 Years | 41 (82.0%) | 101 (66.0%) |
| 15 Years | 10 (100.0%) | 0 (0.0%) |
| 16 and 17 Years | 68 (77.3%) | 0 (0.0%) |
| 18 to 24 Years | 192 (100.0%) | 223 (97.0%) |
| 25 to 34 Years | 288 (99.3%) | 180 (76.6%) |
| 35 to 44 Years | 343 (90.7%) | 285 (71.6%) |
| 45 to 54 Years | 157 (79.7%) | 110 (98.2%) |
| 55 to 64 Years | 205 (100.0%) | 270 (83.3%) |
| 65 to 74 Years | 205 (100.0%) | 149 (93.7%) |
| 75 Years and over | 66 (89.2%) | 201 (52.3%) |
| Total | 1,768 (90.8%) | 1,752 (71.9%) |
Income Below Poverty Among Married-Couple Families in Ludlow
The poverty statistics for married-couple families in Ludlow show that 1.6% or 8 of the total 509 families live below the poverty line. Families with no children have the highest poverty rate of 2.2%, comprising of 8 families. On the other hand, families with 1 or 2 children have the lowest poverty rate of 0.0%, which includes 0 families.
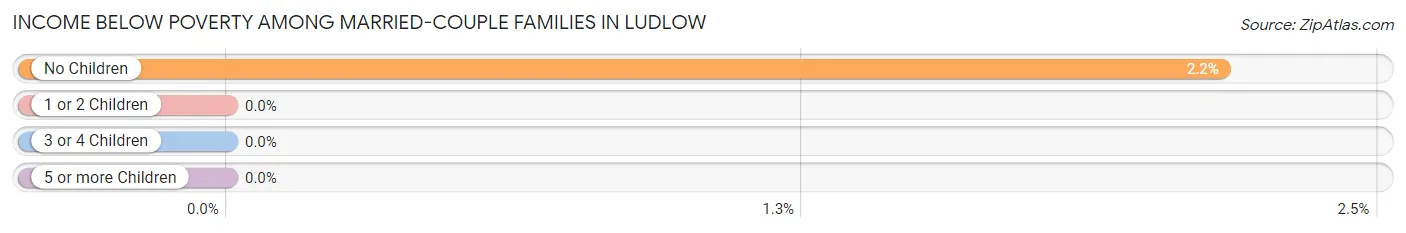
| Children | Above Poverty | Below Poverty |
| No Children | 363 (97.8%) | 8 (2.2%) |
| 1 or 2 Children | 94 (100.0%) | 0 (0.0%) |
| 3 or 4 Children | 0 (0.0%) | 0 (0.0%) |
| 5 or more Children | 44 (100.0%) | 0 (0.0%) |
| Total | 501 (98.4%) | 8 (1.6%) |
Income Below Poverty Among Single-Parent Households in Ludlow
According to the poverty data in Ludlow, 15.9% or 20 single-father households and 35.6% or 100 single-mother households are living below the poverty line. Among single-father households, those with 1 or 2 children have the highest poverty rate, with 20 households (48.8%) experiencing poverty. Likewise, among single-mother households, those with 5 or more children have the highest poverty rate, with 58 households (100.0%) falling below the poverty line.

| Children | Single Father | Single Mother |
| No Children | 0 (0.0%) | 9 (7.7%) |
| 1 or 2 Children | 20 (48.8%) | 33 (33.0%) |
| 3 or 4 Children | 0 (0.0%) | 0 (0.0%) |
| 5 or more Children | 0 (0.0%) | 58 (100.0%) |
| Total | 20 (15.9%) | 100 (35.6%) |
Income Below Poverty Among Married-Couple vs Single-Parent Households in Ludlow
The poverty data for Ludlow shows that 8 of the married-couple family households (1.6%) and 120 of the single-parent households (29.5%) are living below the poverty level. Within the married-couple family households, those with no children have the highest poverty rate, with 8 households (2.2%) falling below the poverty line. Among the single-parent households, those with 5 or more children have the highest poverty rate, with 58 household (100.0%) living below poverty.
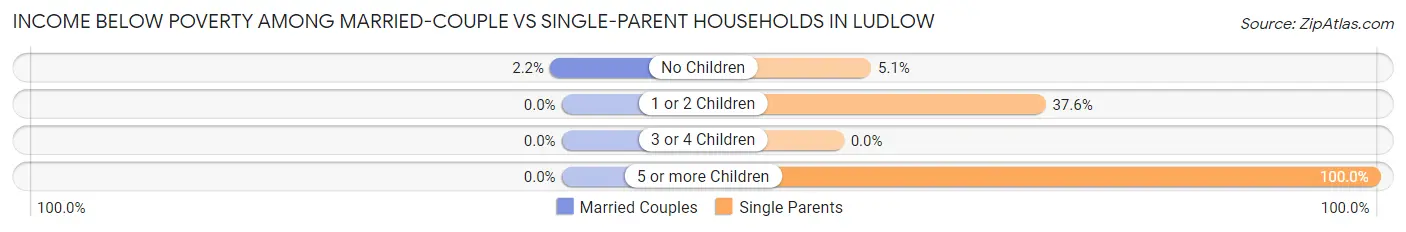
| Children | Married-Couple Families | Single-Parent Households |
| No Children | 8 (2.2%) | 9 (5.1%) |
| 1 or 2 Children | 0 (0.0%) | 53 (37.6%) |
| 3 or 4 Children | 0 (0.0%) | 0 (0.0%) |
| 5 or more Children | 0 (0.0%) | 58 (100.0%) |
| Total | 8 (1.6%) | 120 (29.5%) |
Race in Ludlow
The most populous races in Ludlow are White / Caucasian (3,880 | 88.5%), Two or more Races (386 | 8.8%), and Hispanic or Latino (301 | 6.9%).
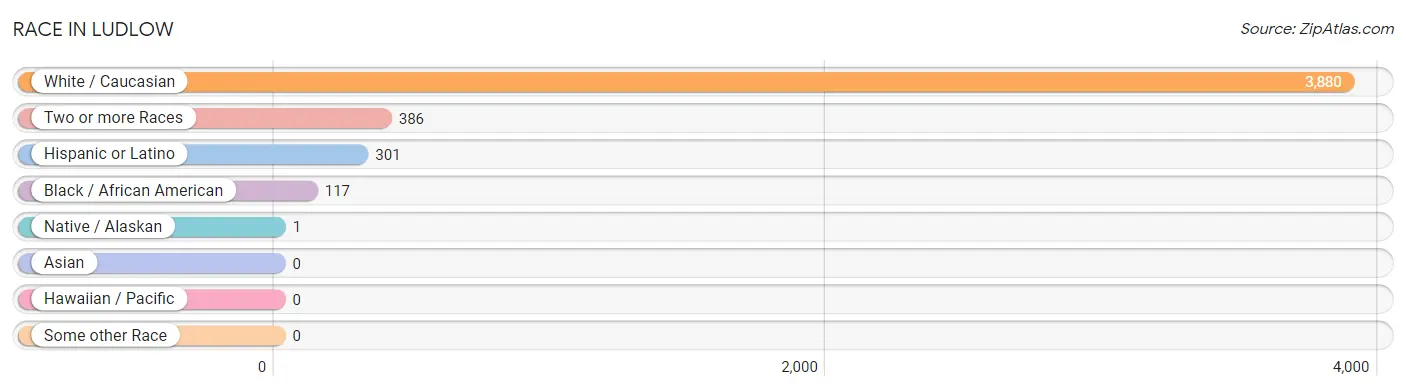
| Race | # Population | % Population |
| Asian | 0 | 0.0% |
| Black / African American | 117 | 2.7% |
| Hawaiian / Pacific | 0 | 0.0% |
| Hispanic or Latino | 301 | 6.9% |
| Native / Alaskan | 1 | 0.0% |
| White / Caucasian | 3,880 | 88.5% |
| Two or more Races | 386 | 8.8% |
| Some other Race | 0 | 0.0% |
| Total | 4,384 | 100.0% |
Ancestry in Ludlow
The most populous ancestries reported in Ludlow are German (1,390 | 31.7%), Irish (841 | 19.2%), American (431 | 9.8%), Italian (395 | 9.0%), and English (392 | 8.9%), together accounting for 78.7% of all Ludlow residents.

| Ancestry | # Population | % Population |
| American | 431 | 9.8% |
| British | 13 | 0.3% |
| Cherokee | 24 | 0.5% |
| Choctaw | 3 | 0.1% |
| Colombian | 8 | 0.2% |
| Croatian | 15 | 0.3% |
| Cuban | 14 | 0.3% |
| Dutch | 28 | 0.6% |
| Eastern European | 19 | 0.4% |
| English | 392 | 8.9% |
| European | 76 | 1.7% |
| Finnish | 11 | 0.3% |
| French | 25 | 0.6% |
| German | 1,390 | 31.7% |
| German Russian | 13 | 0.3% |
| Irish | 841 | 19.2% |
| Israeli | 15 | 0.3% |
| Italian | 395 | 9.0% |
| Lithuanian | 53 | 1.2% |
| Mexican | 207 | 4.7% |
| Northern European | 16 | 0.4% |
| Norwegian | 16 | 0.4% |
| Polish | 48 | 1.1% |
| Scotch-Irish | 92 | 2.1% |
| Scottish | 21 | 0.5% |
| South American | 8 | 0.2% |
| Spaniard | 72 | 1.6% |
| Swedish | 23 | 0.5% |
| Swiss | 53 | 1.2% |
| Thai | 10 | 0.2% |
| Welsh | 39 | 0.9% | View All 31 Rows |
Immigrants in Ludlow
The most numerous immigrant groups reported in Ludlow came from Africa (22 | 0.5%), Ghana (22 | 0.5%), Western Africa (22 | 0.5%), Asia (15 | 0.3%), and Israel (15 | 0.3%), together accounting for 2.2% of all Ludlow residents.
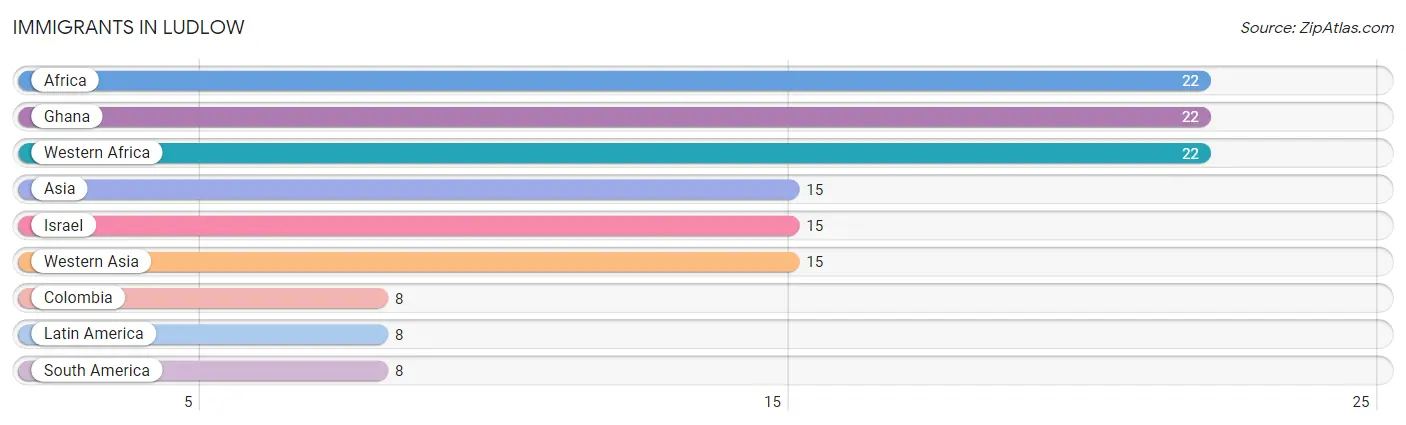
| Immigration Origin | # Population | % Population |
| Africa | 22 | 0.5% |
| Asia | 15 | 0.3% |
| Colombia | 8 | 0.2% |
| Ghana | 22 | 0.5% |
| Israel | 15 | 0.3% |
| Latin America | 8 | 0.2% |
| South America | 8 | 0.2% |
| Western Africa | 22 | 0.5% |
| Western Asia | 15 | 0.3% | View All 9 Rows |
Sex and Age in Ludlow
Sex and Age in Ludlow
The most populous age groups in Ludlow are 35 to 39 Years (221 | 11.4%) for men and 35 to 39 Years (224 | 9.2%) for women.
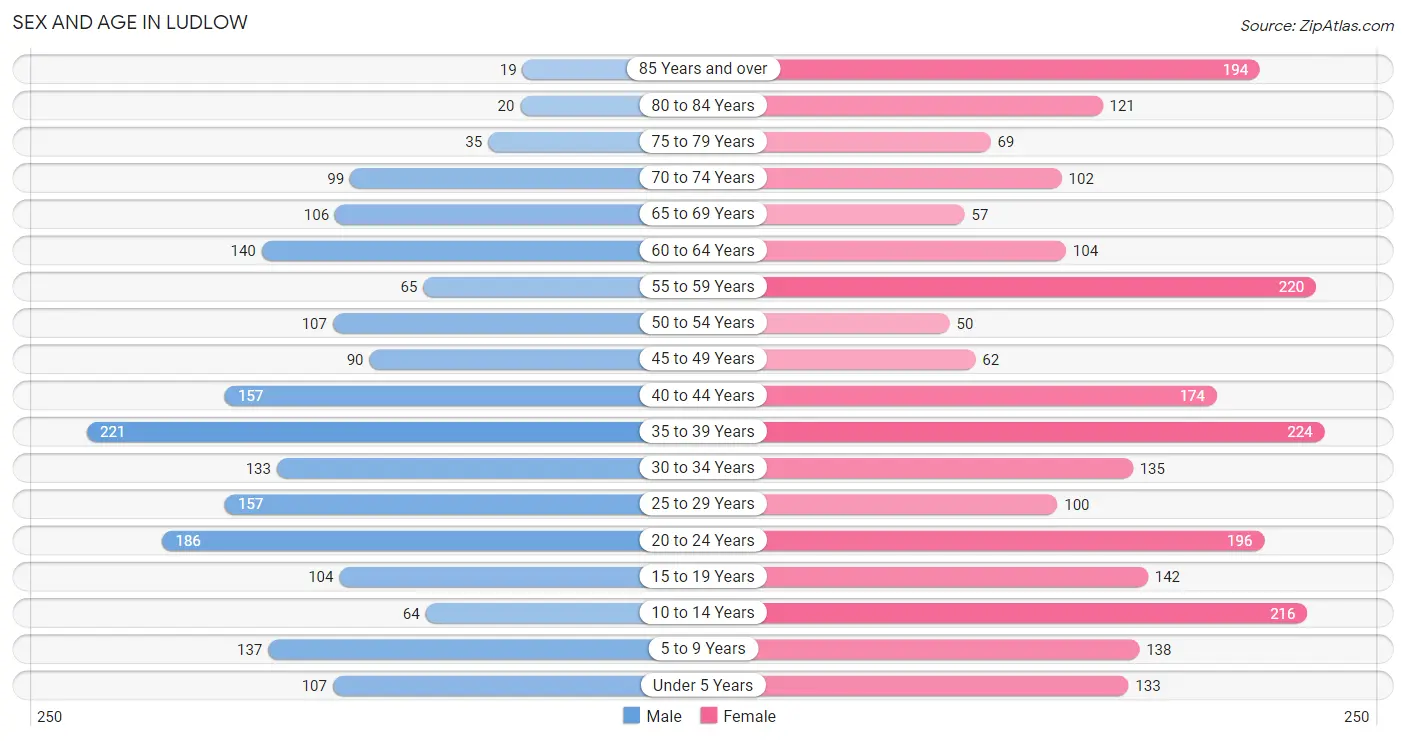
| Age Bracket | Male | Female |
| Under 5 Years | 107 (5.5%) | 133 (5.5%) |
| 5 to 9 Years | 137 (7.0%) | 138 (5.7%) |
| 10 to 14 Years | 64 (3.3%) | 216 (8.9%) |
| 15 to 19 Years | 104 (5.3%) | 142 (5.8%) |
| 20 to 24 Years | 186 (9.6%) | 196 (8.0%) |
| 25 to 29 Years | 157 (8.1%) | 100 (4.1%) |
| 30 to 34 Years | 133 (6.8%) | 135 (5.5%) |
| 35 to 39 Years | 221 (11.4%) | 224 (9.2%) |
| 40 to 44 Years | 157 (8.1%) | 174 (7.1%) |
| 45 to 49 Years | 90 (4.6%) | 62 (2.5%) |
| 50 to 54 Years | 107 (5.5%) | 50 (2.1%) |
| 55 to 59 Years | 65 (3.3%) | 220 (9.0%) |
| 60 to 64 Years | 140 (7.2%) | 104 (4.3%) |
| 65 to 69 Years | 106 (5.4%) | 57 (2.3%) |
| 70 to 74 Years | 99 (5.1%) | 102 (4.2%) |
| 75 to 79 Years | 35 (1.8%) | 69 (2.8%) |
| 80 to 84 Years | 20 (1.0%) | 121 (5.0%) |
| 85 Years and over | 19 (1.0%) | 194 (8.0%) |
| Total | 1,947 (100.0%) | 2,437 (100.0%) |
Families and Households in Ludlow
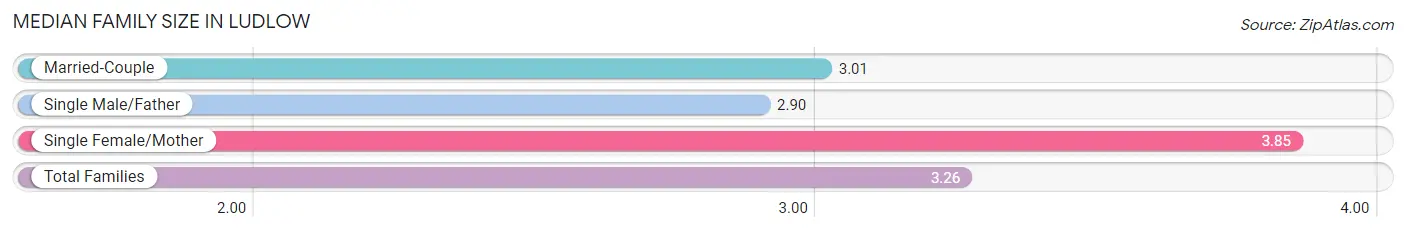
Median Family Size in Ludlow
The median family size in Ludlow is 3.26 persons per family, with single female/mother families (281 | 30.7%) accounting for the largest median family size of 3.85 persons per family. On the other hand, single male/father families (126 | 13.8%) represent the smallest median family size with 2.90 persons per family.
| Family Type | # Families | Family Size |
| Married-Couple | 509 (55.6%) | 3.01 |
| Single Male/Father | 126 (13.8%) | 2.90 |
| Single Female/Mother | 281 (30.7%) | 3.85 |
| Total Families | 916 (100.0%) | 3.26 |
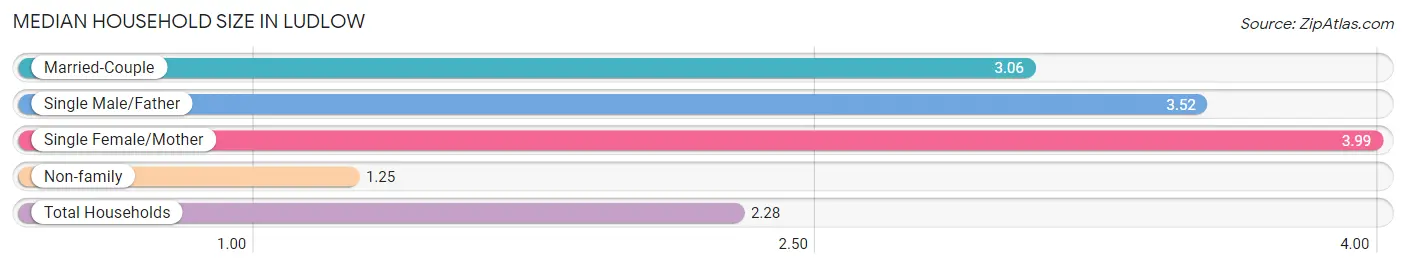
Median Household Size in Ludlow
The median household size in Ludlow is 2.28 persons per household, with single female/mother households (281 | 14.7%) accounting for the largest median household size of 3.99 persons per household. non-family households (998 | 52.1%) represent the smallest median household size with 1.25 persons per household.
| Household Type | # Households | Household Size |
| Married-Couple | 509 (26.6%) | 3.06 |
| Single Male/Father | 126 (6.6%) | 3.52 |
| Single Female/Mother | 281 (14.7%) | 3.99 |
| Non-family | 998 (52.1%) | 1.25 |
| Total Households | 1,914 (100.0%) | 2.28 |
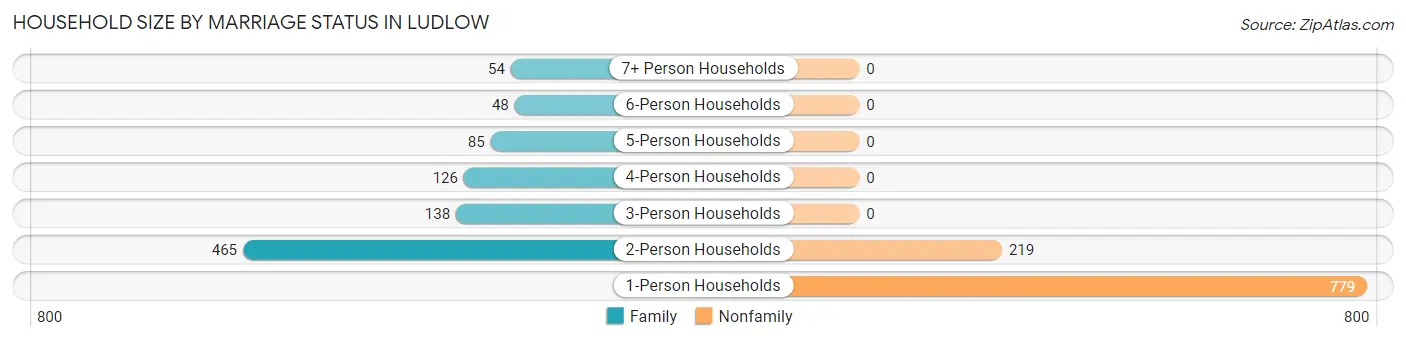
Household Size by Marriage Status in Ludlow
Out of a total of 1,914 households in Ludlow, 916 (47.9%) are family households, while 998 (52.1%) are nonfamily households. The most numerous type of family households are 2-person households, comprising 465, and the most common type of nonfamily households are 1-person households, comprising 779.
| Household Size | Family Households | Nonfamily Households |
| 1-Person Households | - | 779 (40.7%) |
| 2-Person Households | 465 (24.3%) | 219 (11.4%) |
| 3-Person Households | 138 (7.2%) | 0 (0.0%) |
| 4-Person Households | 126 (6.6%) | 0 (0.0%) |
| 5-Person Households | 85 (4.4%) | 0 (0.0%) |
| 6-Person Households | 48 (2.5%) | 0 (0.0%) |
| 7+ Person Households | 54 (2.8%) | 0 (0.0%) |
| Total | 916 (47.9%) | 998 (52.1%) |
Female Fertility in Ludlow
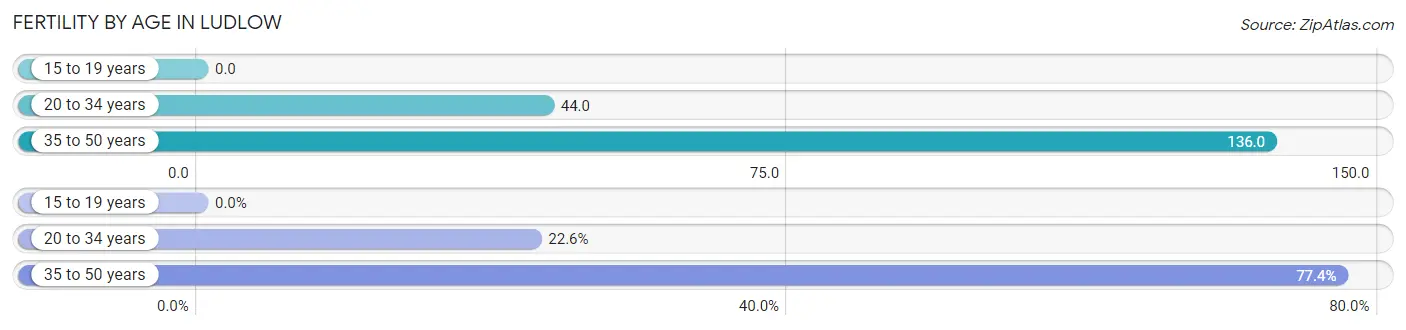
Fertility by Age in Ludlow
Average fertility rate in Ludlow is 80.0 births per 1,000 women. Women in the age bracket of 35 to 50 years have the highest fertility rate with 136.0 births per 1,000 women. Women in the age bracket of 35 to 50 years acount for 77.4% of all women with births.
| Age Bracket | Women with Births | Births / 1,000 Women |
| 15 to 19 years | 0 (0.0%) | 0.0 |
| 20 to 34 years | 19 (22.6%) | 44.0 |
| 35 to 50 years | 65 (77.4%) | 136.0 |
| Total | 84 (100.0%) | 80.0 |
Fertility by Age by Marriage Status in Ludlow
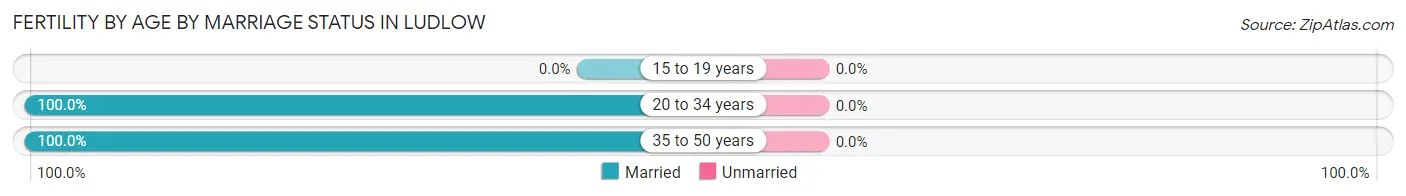
| Age Bracket | Married | Unmarried |
| 15 to 19 years | 0 (0.0%) | 0 (0.0%) |
| 20 to 34 years | 19 (100.0%) | 0 (0.0%) |
| 35 to 50 years | 65 (100.0%) | 0 (0.0%) |
| Total | 84 (100.0%) | 0 (0.0%) |
Fertility by Education in Ludlow
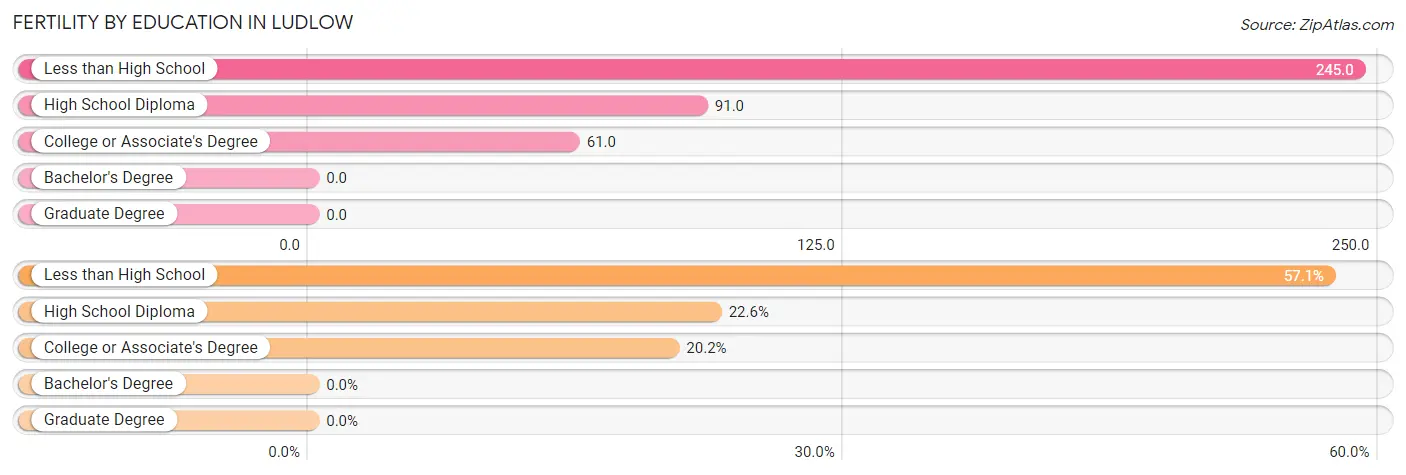
| Educational Attainment | Women with Births | Births / 1,000 Women |
| Less than High School | 48 (57.1%) | 245.0 |
| High School Diploma | 19 (22.6%) | 91.0 |
| College or Associate's Degree | 17 (20.2%) | 61.0 |
| Bachelor's Degree | 0 (0.0%) | 0.0 |
| Graduate Degree | 0 (0.0%) | 0.0 |
| Total | 84 (100.0%) | 80.0 |
Fertility by Education by Marriage Status in Ludlow
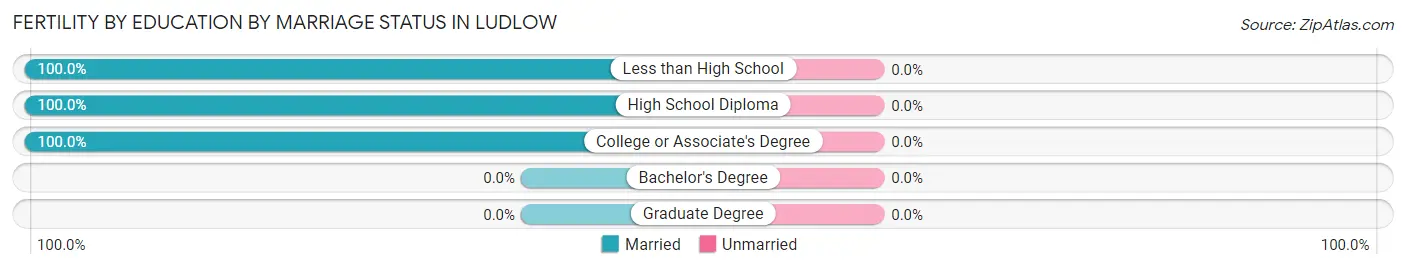
| Educational Attainment | Married | Unmarried |
| Less than High School | 48 (100.0%) | 0 (0.0%) |
| High School Diploma | 19 (100.0%) | 0 (0.0%) |
| College or Associate's Degree | 17 (100.0%) | 0 (0.0%) |
| Bachelor's Degree | 0 (0.0%) | 0 (0.0%) |
| Graduate Degree | 0 (0.0%) | 0 (0.0%) |
| Total | 84 (100.0%) | 0 (0.0%) |
Employment Characteristics in Ludlow
Employment by Class of Employer in Ludlow
Among the 2,180 employed individuals in Ludlow, private company employees (1,625 | 74.5%), not-for-profit organizations (165 | 7.6%), and local government employees (161 | 7.4%) make up the most common classes of employment.
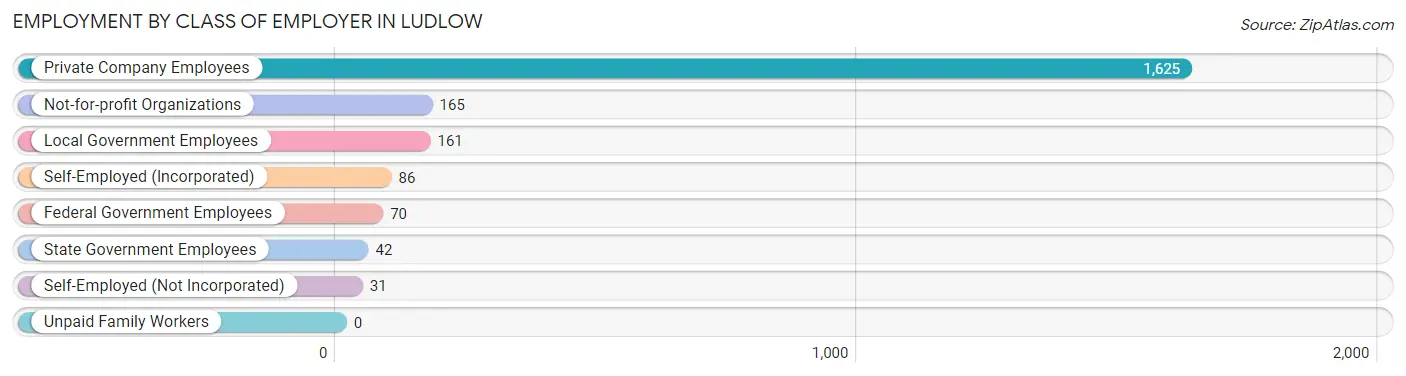
| Employer Class | # Employees | % Employees |
| Private Company Employees | 1,625 | 74.5% |
| Self-Employed (Incorporated) | 86 | 3.9% |
| Self-Employed (Not Incorporated) | 31 | 1.4% |
| Not-for-profit Organizations | 165 | 7.6% |
| Local Government Employees | 161 | 7.4% |
| State Government Employees | 42 | 1.9% |
| Federal Government Employees | 70 | 3.2% |
| Unpaid Family Workers | 0 | 0.0% |
| Total | 2,180 | 100.0% |
Employment Status by Age in Ludlow
According to the labor force statistics for Ludlow, out of the total population over 16 years of age (3,579), 67.0% or 2,398 individuals are in the labor force, with 7.0% or 168 of them unemployed. The age group with the highest labor force participation rate is 35 to 44 years, with 94.6% or 734 individuals in the labor force. Within the labor force, the 16 to 19 years age range has the highest percentage of unemployed individuals, with 22.2% or 24 of them being unemployed.
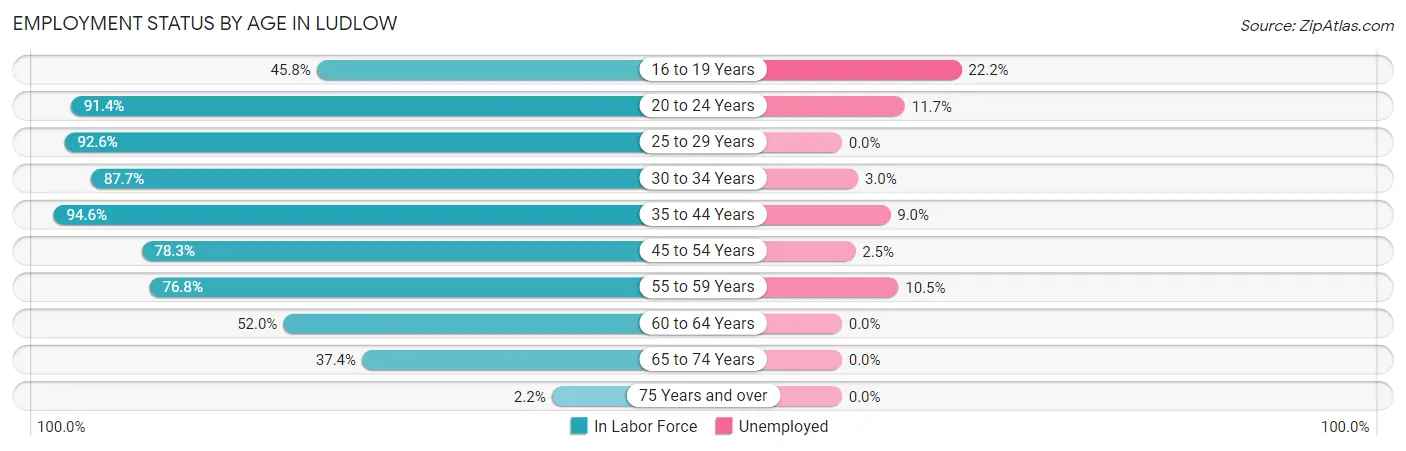
| Age Bracket | In Labor Force | Unemployed |
| 16 to 19 Years | 108 (45.8%) | 24 (22.2%) |
| 20 to 24 Years | 349 (91.4%) | 41 (11.7%) |
| 25 to 29 Years | 238 (92.6%) | 0 (0.0%) |
| 30 to 34 Years | 235 (87.7%) | 7 (3.0%) |
| 35 to 44 Years | 734 (94.6%) | 66 (9.0%) |
| 45 to 54 Years | 242 (78.3%) | 6 (2.5%) |
| 55 to 59 Years | 219 (76.8%) | 23 (10.5%) |
| 60 to 64 Years | 127 (52.0%) | 0 (0.0%) |
| 65 to 74 Years | 136 (37.4%) | 0 (0.0%) |
| 75 Years and over | 10 (2.2%) | 0 (0.0%) |
| Total | 2,398 (67.0%) | 168 (7.0%) |
Employment Status by Educational Attainment in Ludlow
According to labor force statistics for Ludlow, 83.9% of individuals (1,795) out of the total population between 25 and 64 years of age (2,139) are in the labor force, with 5.7% or 102 of them being unemployed. The group with the highest labor force participation rate are those with the educational attainment of less than high school, with 96.4% or 133 individuals in the labor force. Within the labor force, individuals with high school diploma education have the highest percentage of unemployment, with 13.0% or 50 of them being unemployed.
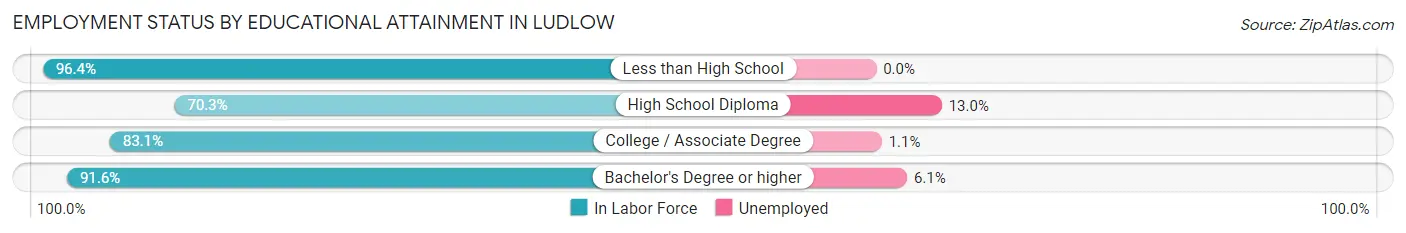
| Educational Attainment | In Labor Force | Unemployed |
| Less than High School | 133 (96.4%) | 0 (0.0%) |
| High School Diploma | 385 (70.3%) | 71 (13.0%) |
| College / Associate Degree | 525 (83.1%) | 7 (1.1%) |
| Bachelor's Degree or higher | 752 (91.6%) | 50 (6.1%) |
| Total | 1,795 (83.9%) | 122 (5.7%) |
Employment Occupations by Sex in Ludlow
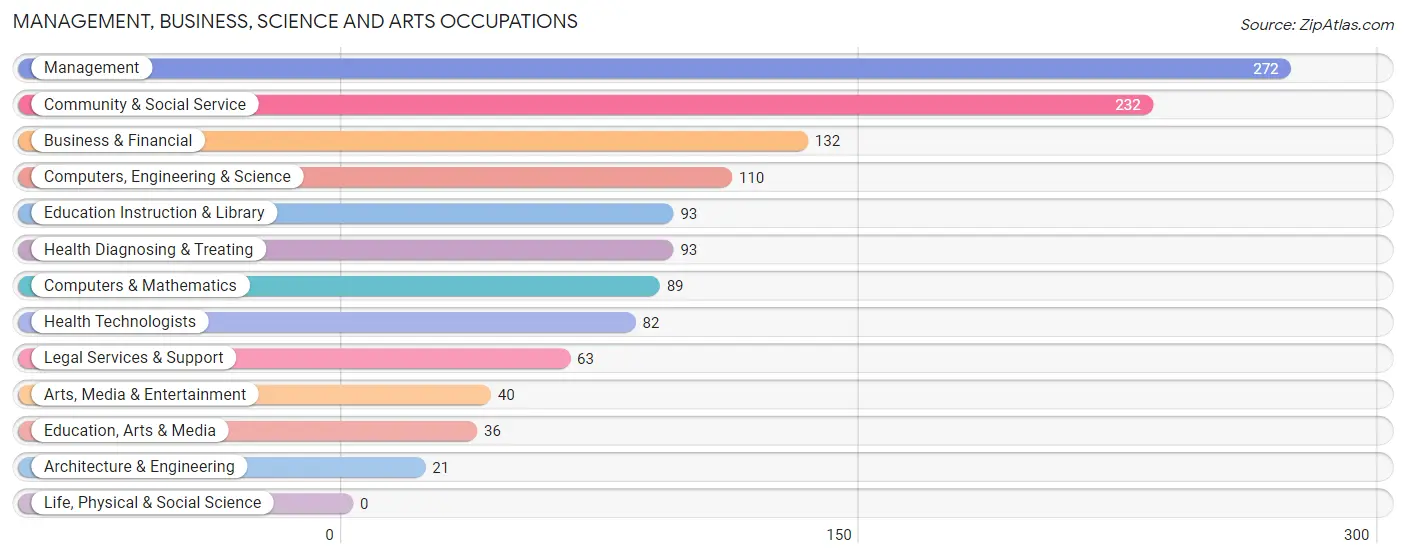
Management, Business, Science and Arts Occupations
The most common Management, Business, Science and Arts occupations in Ludlow are Management (272 | 12.2%), Community & Social Service (232 | 10.4%), Business & Financial (132 | 5.9%), Computers, Engineering & Science (110 | 4.9%), and Education Instruction & Library (93 | 4.2%).
Management, Business, Science and Arts Occupations by Sex
Within the Management, Business, Science and Arts occupations in Ludlow, the most male-oriented occupations are Architecture & Engineering (100.0%), Computers, Engineering & Science (92.7%), and Computers & Mathematics (91.0%), while the most female-oriented occupations are Health Diagnosing & Treating (88.2%), Health Technologists (86.6%), and Legal Services & Support (82.5%).
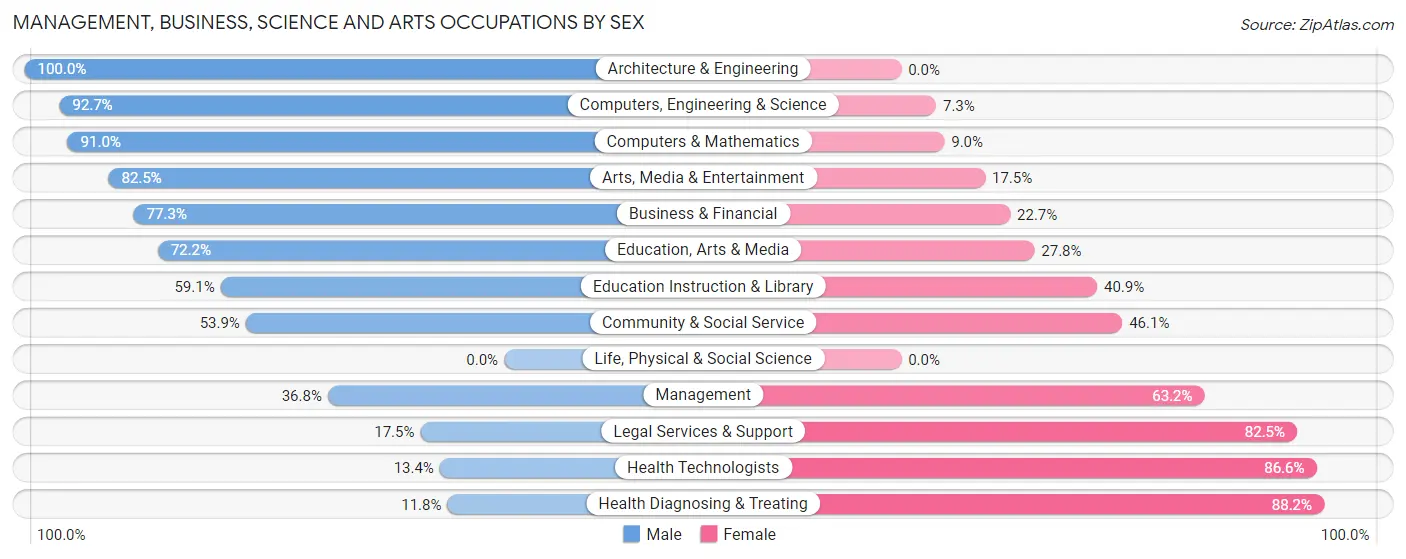
| Occupation | Male | Female |
| Management | 100 (36.8%) | 172 (63.2%) |
| Business & Financial | 102 (77.3%) | 30 (22.7%) |
| Computers, Engineering & Science | 102 (92.7%) | 8 (7.3%) |
| Computers & Mathematics | 81 (91.0%) | 8 (9.0%) |
| Architecture & Engineering | 21 (100.0%) | 0 (0.0%) |
| Life, Physical & Social Science | 0 (0.0%) | 0 (0.0%) |
| Community & Social Service | 125 (53.9%) | 107 (46.1%) |
| Education, Arts & Media | 26 (72.2%) | 10 (27.8%) |
| Legal Services & Support | 11 (17.5%) | 52 (82.5%) |
| Education Instruction & Library | 55 (59.1%) | 38 (40.9%) |
| Arts, Media & Entertainment | 33 (82.5%) | 7 (17.5%) |
| Health Diagnosing & Treating | 11 (11.8%) | 82 (88.2%) |
| Health Technologists | 11 (13.4%) | 71 (86.6%) |
| Total (Category) | 440 (52.4%) | 399 (47.6%) |
| Total (Overall) | 1,180 (52.9%) | 1,051 (47.1%) |
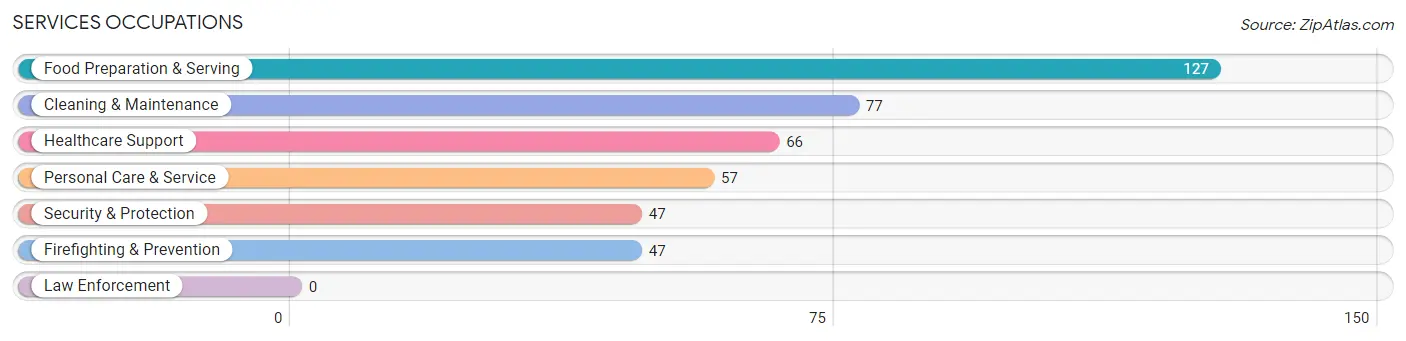
Services Occupations
The most common Services occupations in Ludlow are Food Preparation & Serving (127 | 5.7%), Cleaning & Maintenance (77 | 3.5%), Healthcare Support (66 | 3.0%), Personal Care & Service (57 | 2.5%), and Security & Protection (47 | 2.1%).
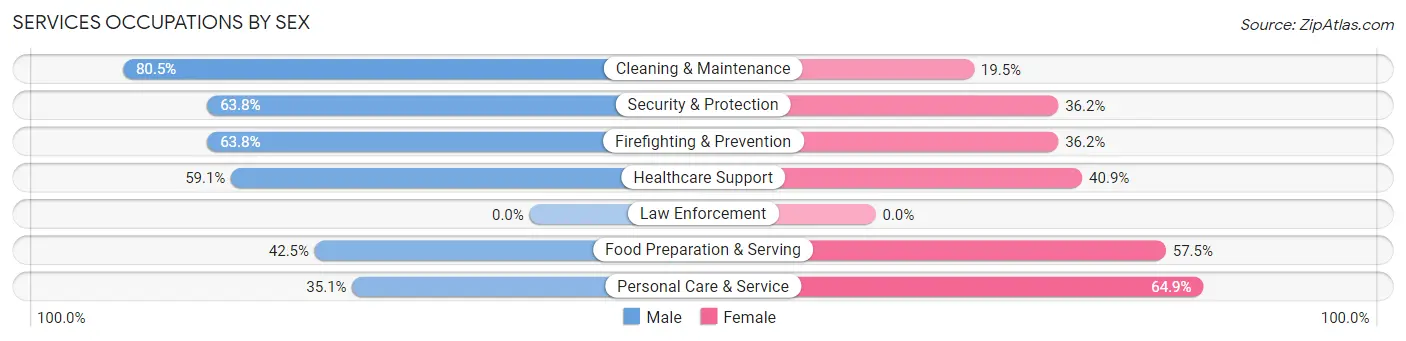
Services Occupations by Sex
Within the Services occupations in Ludlow, the most male-oriented occupations are Cleaning & Maintenance (80.5%), Security & Protection (63.8%), and Firefighting & Prevention (63.8%), while the most female-oriented occupations are Personal Care & Service (64.9%), Food Preparation & Serving (57.5%), and Healthcare Support (40.9%).
| Occupation | Male | Female |
| Healthcare Support | 39 (59.1%) | 27 (40.9%) |
| Security & Protection | 30 (63.8%) | 17 (36.2%) |
| Firefighting & Prevention | 30 (63.8%) | 17 (36.2%) |
| Law Enforcement | 0 (0.0%) | 0 (0.0%) |
| Food Preparation & Serving | 54 (42.5%) | 73 (57.5%) |
| Cleaning & Maintenance | 62 (80.5%) | 15 (19.5%) |
| Personal Care & Service | 20 (35.1%) | 37 (64.9%) |
| Total (Category) | 205 (54.8%) | 169 (45.2%) |
| Total (Overall) | 1,180 (52.9%) | 1,051 (47.1%) |
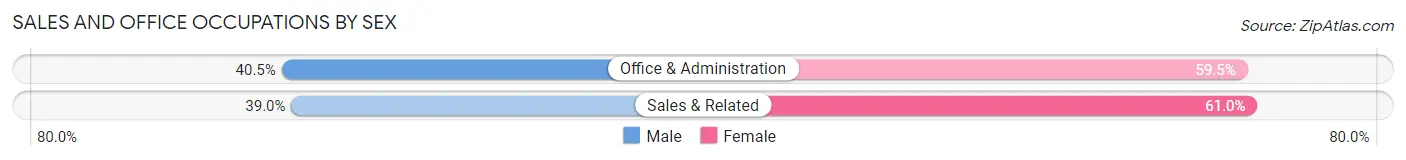
Sales and Office Occupations
The most common Sales and Office occupations in Ludlow are Office & Administration (351 | 15.7%), and Sales & Related (154 | 6.9%).

Sales and Office Occupations by Sex
| Occupation | Male | Female |
| Sales & Related | 60 (39.0%) | 94 (61.0%) |
| Office & Administration | 142 (40.5%) | 209 (59.5%) |
| Total (Category) | 202 (40.0%) | 303 (60.0%) |
| Total (Overall) | 1,180 (52.9%) | 1,051 (47.1%) |
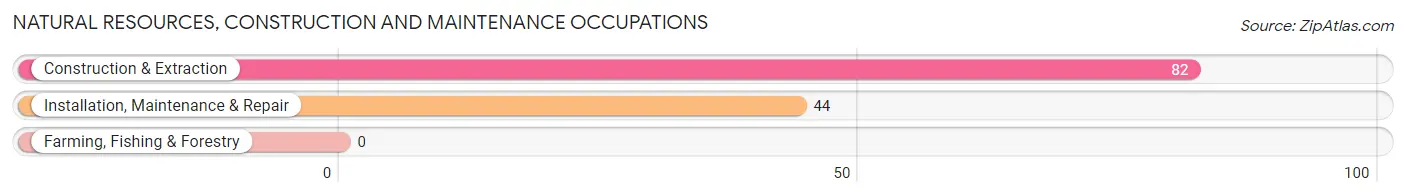
Natural Resources, Construction and Maintenance Occupations
The most common Natural Resources, Construction and Maintenance occupations in Ludlow are Construction & Extraction (82 | 3.7%), and Installation, Maintenance & Repair (44 | 2.0%).
Natural Resources, Construction and Maintenance Occupations by Sex
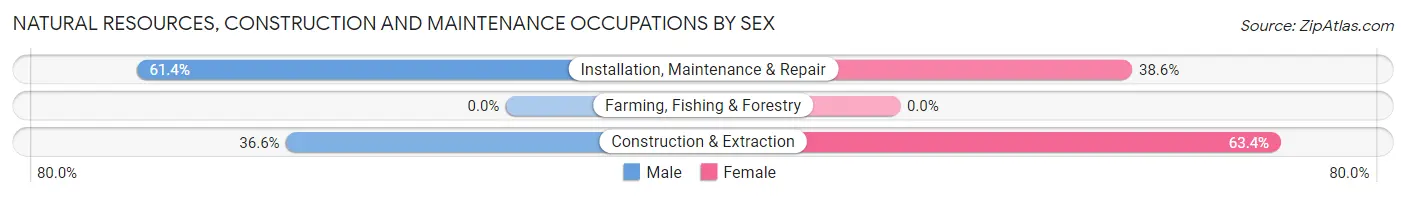
| Occupation | Male | Female |
| Farming, Fishing & Forestry | 0 (0.0%) | 0 (0.0%) |
| Construction & Extraction | 30 (36.6%) | 52 (63.4%) |
| Installation, Maintenance & Repair | 27 (61.4%) | 17 (38.6%) |
| Total (Category) | 57 (45.2%) | 69 (54.8%) |
| Total (Overall) | 1,180 (52.9%) | 1,051 (47.1%) |
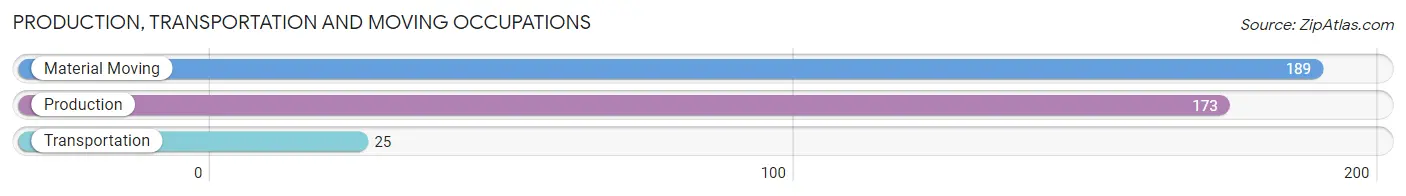
Production, Transportation and Moving Occupations
The most common Production, Transportation and Moving occupations in Ludlow are Material Moving (189 | 8.5%), Production (173 | 7.7%), and Transportation (25 | 1.1%).
Production, Transportation and Moving Occupations by Sex
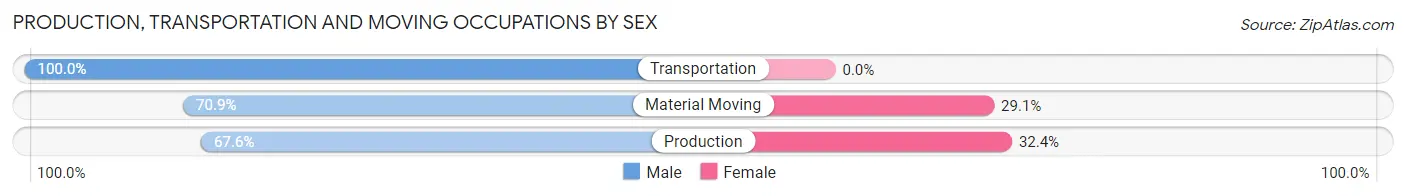
| Occupation | Male | Female |
| Production | 117 (67.6%) | 56 (32.4%) |
| Transportation | 25 (100.0%) | 0 (0.0%) |
| Material Moving | 134 (70.9%) | 55 (29.1%) |
| Total (Category) | 276 (71.3%) | 111 (28.7%) |
| Total (Overall) | 1,180 (52.9%) | 1,051 (47.1%) |
Employment Industries by Sex in Ludlow
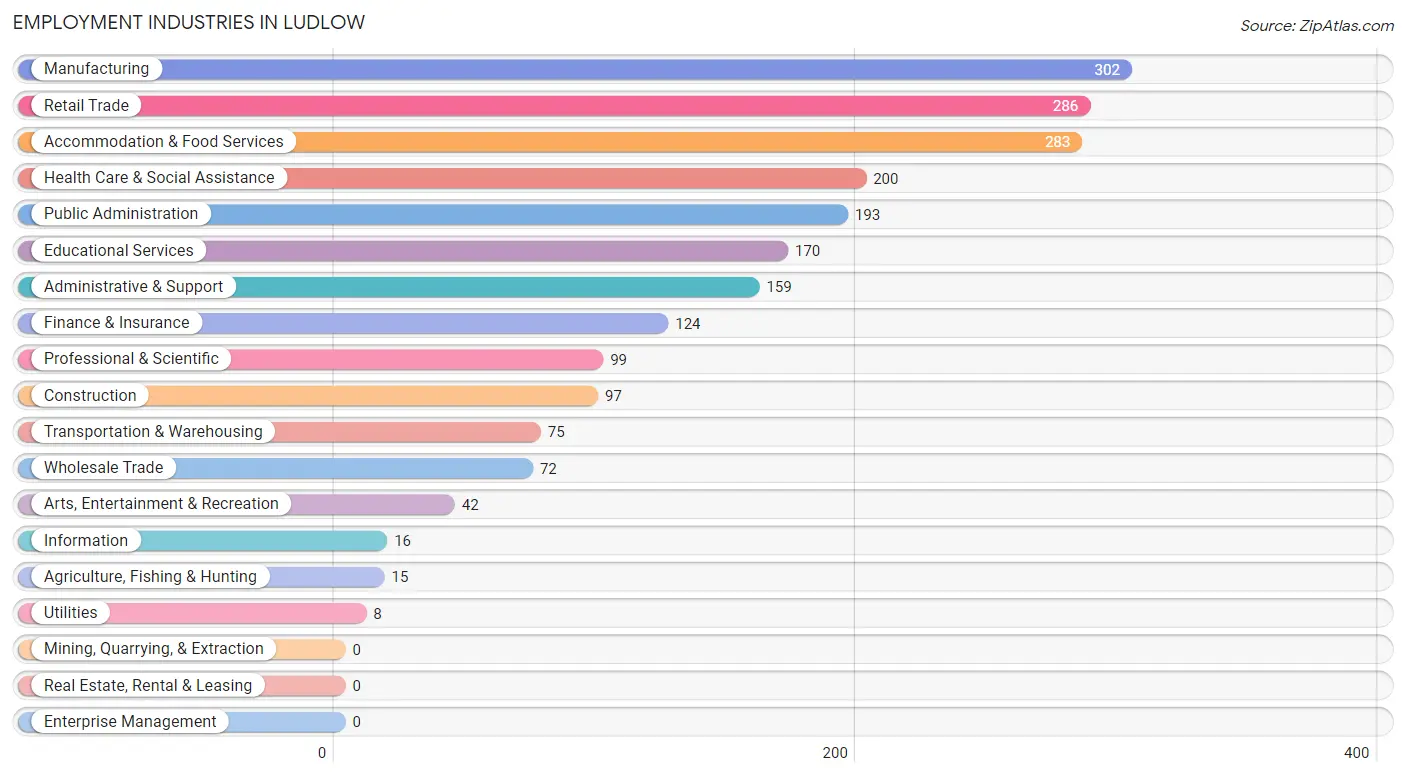
Employment Industries in Ludlow
The major employment industries in Ludlow include Manufacturing (302 | 13.5%), Retail Trade (286 | 12.8%), Accommodation & Food Services (283 | 12.7%), Health Care & Social Assistance (200 | 9.0%), and Public Administration (193 | 8.6%).
Employment Industries by Sex in Ludlow
The Ludlow industries that see more men than women are Wholesale Trade (100.0%), Information (100.0%), and Transportation & Warehousing (89.3%), whereas the industries that tend to have a higher number of women are Agriculture, Fishing & Hunting (100.0%), Utilities (100.0%), and Arts, Entertainment & Recreation (76.2%).
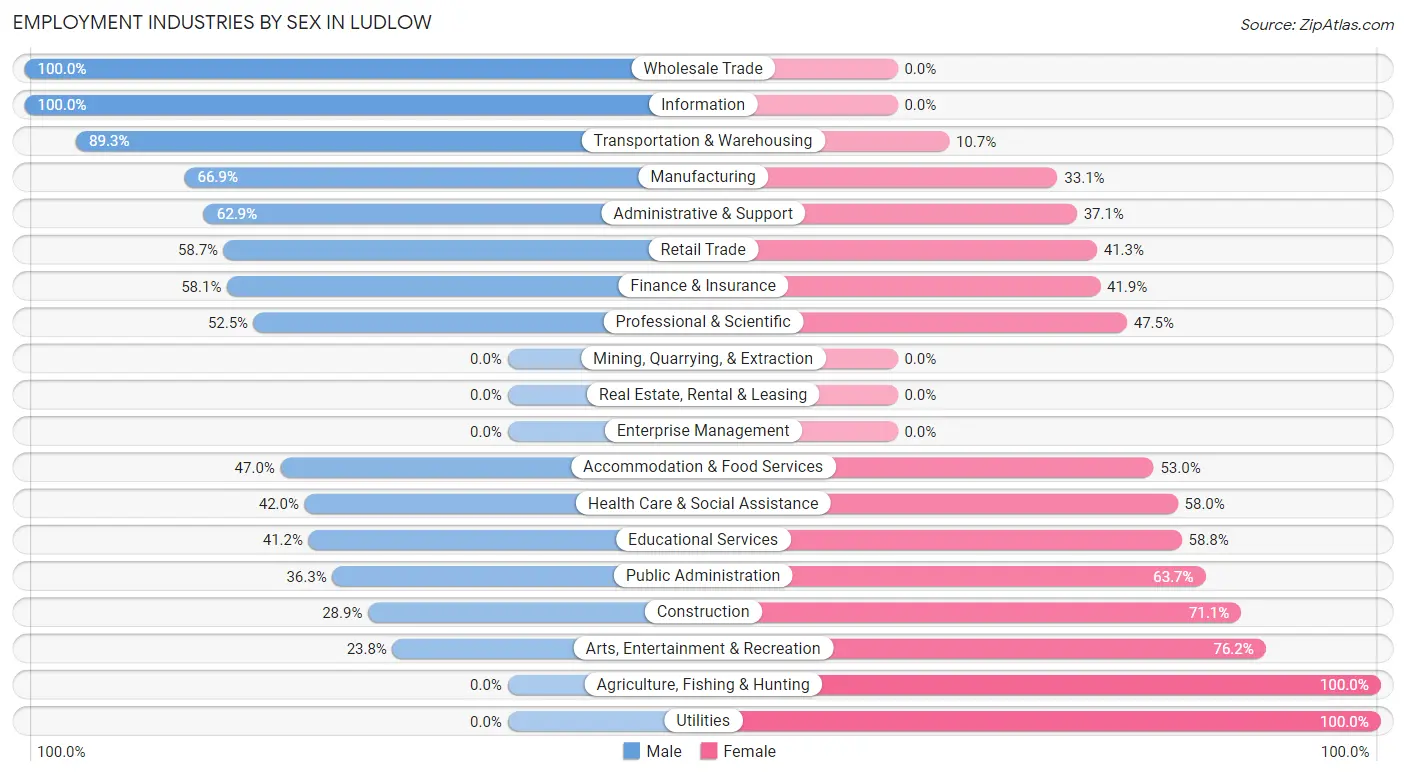
| Industry | Male | Female |
| Agriculture, Fishing & Hunting | 0 (0.0%) | 15 (100.0%) |
| Mining, Quarrying, & Extraction | 0 (0.0%) | 0 (0.0%) |
| Construction | 28 (28.9%) | 69 (71.1%) |
| Manufacturing | 202 (66.9%) | 100 (33.1%) |
| Wholesale Trade | 72 (100.0%) | 0 (0.0%) |
| Retail Trade | 168 (58.7%) | 118 (41.3%) |
| Transportation & Warehousing | 67 (89.3%) | 8 (10.7%) |
| Utilities | 0 (0.0%) | 8 (100.0%) |
| Information | 16 (100.0%) | 0 (0.0%) |
| Finance & Insurance | 72 (58.1%) | 52 (41.9%) |
| Real Estate, Rental & Leasing | 0 (0.0%) | 0 (0.0%) |
| Professional & Scientific | 52 (52.5%) | 47 (47.5%) |
| Enterprise Management | 0 (0.0%) | 0 (0.0%) |
| Administrative & Support | 100 (62.9%) | 59 (37.1%) |
| Educational Services | 70 (41.2%) | 100 (58.8%) |
| Health Care & Social Assistance | 84 (42.0%) | 116 (58.0%) |
| Arts, Entertainment & Recreation | 10 (23.8%) | 32 (76.2%) |
| Accommodation & Food Services | 133 (47.0%) | 150 (53.0%) |
| Public Administration | 70 (36.3%) | 123 (63.7%) |
| Total | 1,180 (52.9%) | 1,051 (47.1%) |
Education in Ludlow
School Enrollment in Ludlow
The most common levels of schooling among the 941 students in Ludlow are elementary school (252 | 26.8%), high school (252 | 26.8%), and middle school (209 | 22.2%).
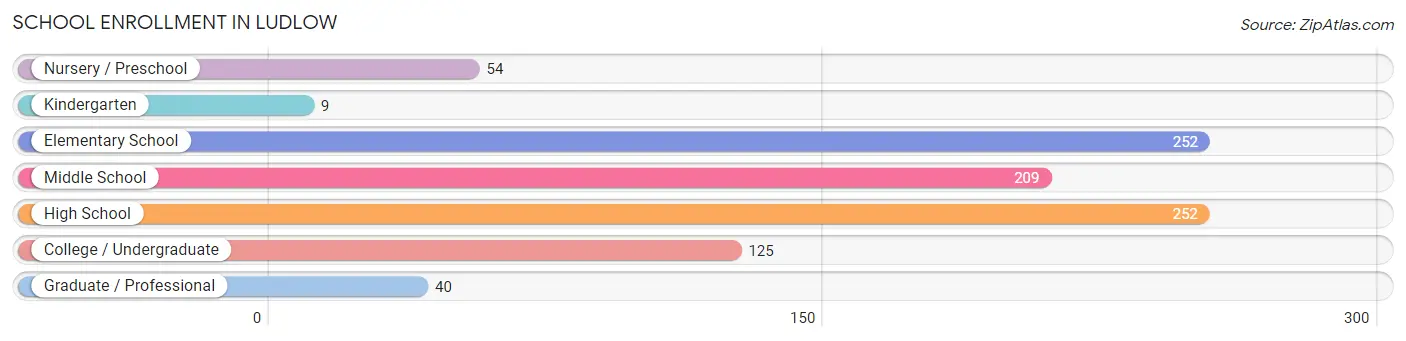
| School Level | # Students | % Students |
| Nursery / Preschool | 54 | 5.7% |
| Kindergarten | 9 | 1.0% |
| Elementary School | 252 | 26.8% |
| Middle School | 209 | 22.2% |
| High School | 252 | 26.8% |
| College / Undergraduate | 125 | 13.3% |
| Graduate / Professional | 40 | 4.3% |
| Total | 941 | 100.0% |
School Enrollment by Age by Funding Source in Ludlow
Out of a total of 941 students who are enrolled in schools in Ludlow, 150 (15.9%) attend a private institution, while the remaining 791 (84.1%) are enrolled in public schools. The age group of 20 to 24 year olds has the highest likelihood of being enrolled in private schools, with 36 (41.9% in the age bracket) enrolled. Conversely, the age group of 25 to 34 year olds has the lowest likelihood of being enrolled in a private school, with 40 (100.0% in the age bracket) attending a public institution.
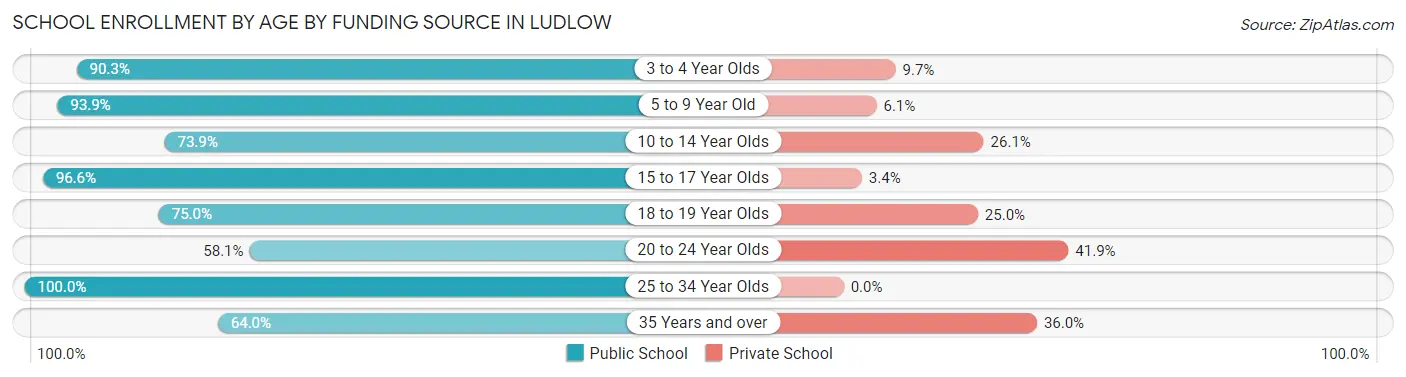
| Age Bracket | Public School | Private School |
| 3 to 4 Year Olds | 28 (90.3%) | 3 (9.7%) |
| 5 to 9 Year Old | 230 (93.9%) | 15 (6.1%) |
| 10 to 14 Year Olds | 207 (73.9%) | 73 (26.1%) |
| 15 to 17 Year Olds | 199 (96.6%) | 7 (3.4%) |
| 18 to 19 Year Olds | 21 (75.0%) | 7 (25.0%) |
| 20 to 24 Year Olds | 50 (58.1%) | 36 (41.9%) |
| 25 to 34 Year Olds | 40 (100.0%) | 0 (0.0%) |
| 35 Years and over | 16 (64.0%) | 9 (36.0%) |
| Total | 791 (84.1%) | 150 (15.9%) |
Educational Attainment by Field of Study in Ludlow
Business (311 | 26.6%), arts & humanities (267 | 22.8%), science & technology (125 | 10.7%), visual & performing arts (96 | 8.2%), and social sciences (79 | 6.8%) are the most common fields of study among 1,171 individuals in Ludlow who have obtained a bachelor's degree or higher.
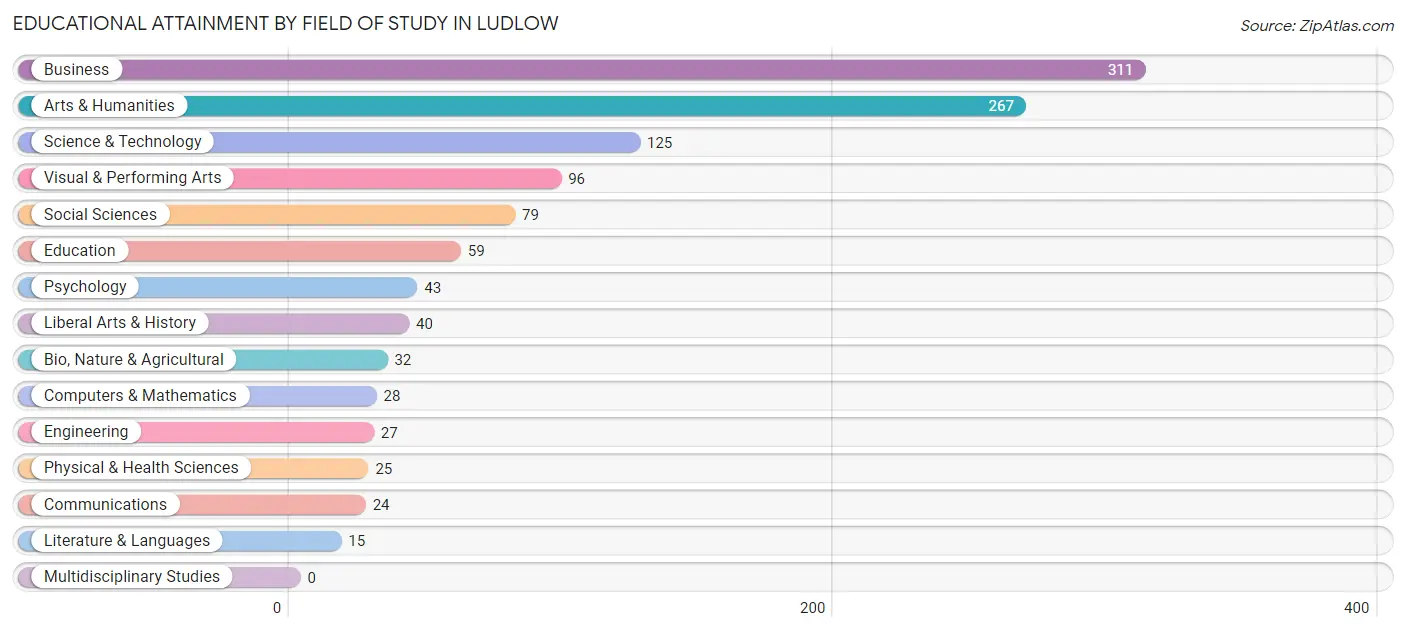
| Field of Study | # Graduates | % Graduates |
| Computers & Mathematics | 28 | 2.4% |
| Bio, Nature & Agricultural | 32 | 2.7% |
| Physical & Health Sciences | 25 | 2.1% |
| Psychology | 43 | 3.7% |
| Social Sciences | 79 | 6.8% |
| Engineering | 27 | 2.3% |
| Multidisciplinary Studies | 0 | 0.0% |
| Science & Technology | 125 | 10.7% |
| Business | 311 | 26.6% |
| Education | 59 | 5.0% |
| Literature & Languages | 15 | 1.3% |
| Liberal Arts & History | 40 | 3.4% |
| Visual & Performing Arts | 96 | 8.2% |
| Communications | 24 | 2.1% |
| Arts & Humanities | 267 | 22.8% |
| Total | 1,171 | 100.0% |
Transportation & Commute in Ludlow
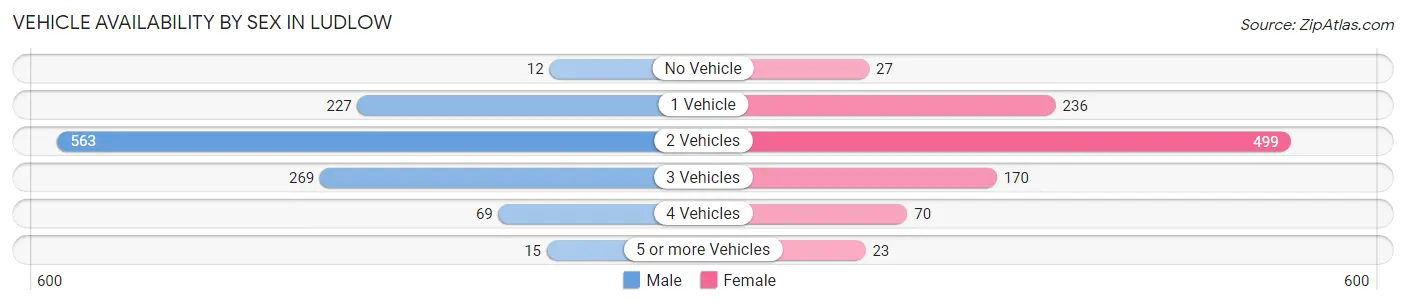
Vehicle Availability by Sex in Ludlow
The most prevalent vehicle ownership categories in Ludlow are males with 2 vehicles (563, accounting for 48.7%) and females with 2 vehicles (499, making up 54.9%).
| Vehicles Available | Male | Female |
| No Vehicle | 12 (1.0%) | 27 (2.6%) |
| 1 Vehicle | 227 (19.7%) | 236 (23.0%) |
| 2 Vehicles | 563 (48.7%) | 499 (48.7%) |
| 3 Vehicles | 269 (23.3%) | 170 (16.6%) |
| 4 Vehicles | 69 (6.0%) | 70 (6.8%) |
| 5 or more Vehicles | 15 (1.3%) | 23 (2.2%) |
| Total | 1,155 (100.0%) | 1,025 (100.0%) |
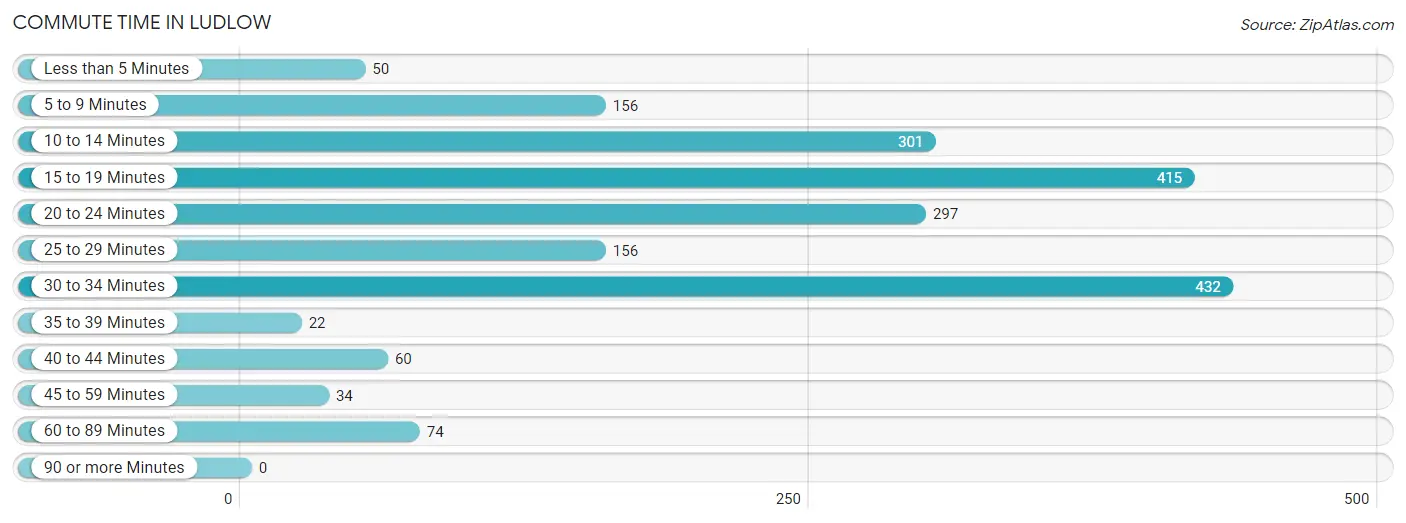
Commute Time in Ludlow
The most frequently occuring commute durations in Ludlow are 30 to 34 minutes (432 commuters, 21.6%), 15 to 19 minutes (415 commuters, 20.8%), and 10 to 14 minutes (301 commuters, 15.1%).
| Commute Time | # Commuters | % Commuters |
| Less than 5 Minutes | 50 | 2.5% |
| 5 to 9 Minutes | 156 | 7.8% |
| 10 to 14 Minutes | 301 | 15.1% |
| 15 to 19 Minutes | 415 | 20.8% |
| 20 to 24 Minutes | 297 | 14.9% |
| 25 to 29 Minutes | 156 | 7.8% |
| 30 to 34 Minutes | 432 | 21.6% |
| 35 to 39 Minutes | 22 | 1.1% |
| 40 to 44 Minutes | 60 | 3.0% |
| 45 to 59 Minutes | 34 | 1.7% |
| 60 to 89 Minutes | 74 | 3.7% |
| 90 or more Minutes | 0 | 0.0% |
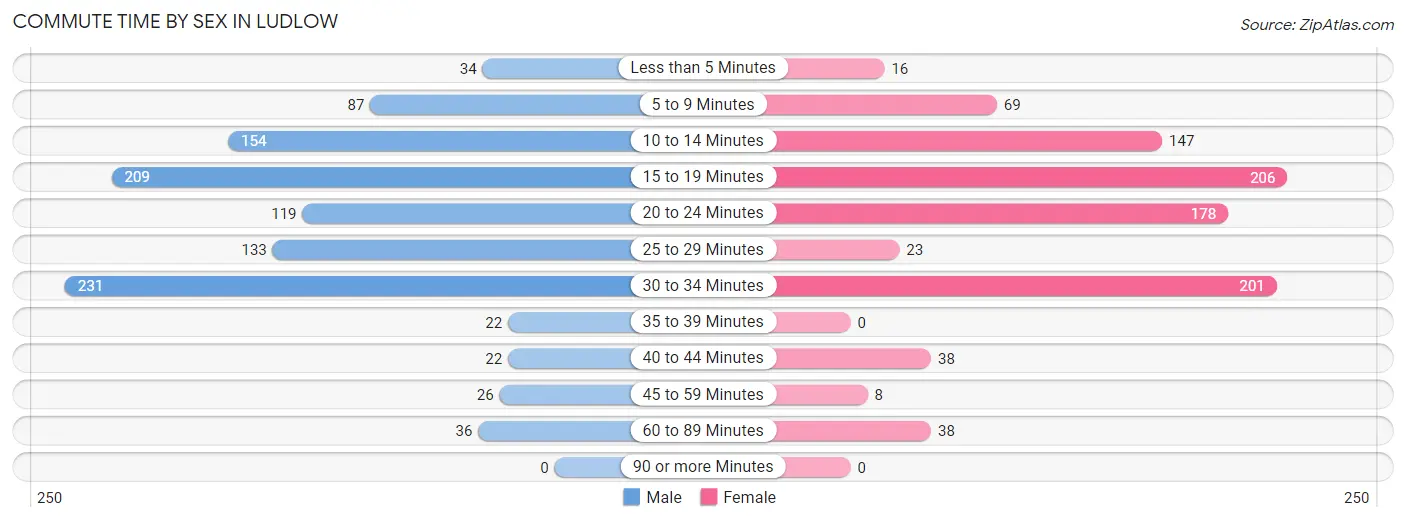
Commute Time by Sex in Ludlow
The most common commute times in Ludlow are 30 to 34 minutes (231 commuters, 21.5%) for males and 15 to 19 minutes (206 commuters, 22.3%) for females.
| Commute Time | Male | Female |
| Less than 5 Minutes | 34 (3.2%) | 16 (1.7%) |
| 5 to 9 Minutes | 87 (8.1%) | 69 (7.5%) |
| 10 to 14 Minutes | 154 (14.3%) | 147 (15.9%) |
| 15 to 19 Minutes | 209 (19.5%) | 206 (22.3%) |
| 20 to 24 Minutes | 119 (11.1%) | 178 (19.3%) |
| 25 to 29 Minutes | 133 (12.4%) | 23 (2.5%) |
| 30 to 34 Minutes | 231 (21.5%) | 201 (21.7%) |
| 35 to 39 Minutes | 22 (2.1%) | 0 (0.0%) |
| 40 to 44 Minutes | 22 (2.1%) | 38 (4.1%) |
| 45 to 59 Minutes | 26 (2.4%) | 8 (0.9%) |
| 60 to 89 Minutes | 36 (3.4%) | 38 (4.1%) |
| 90 or more Minutes | 0 (0.0%) | 0 (0.0%) |
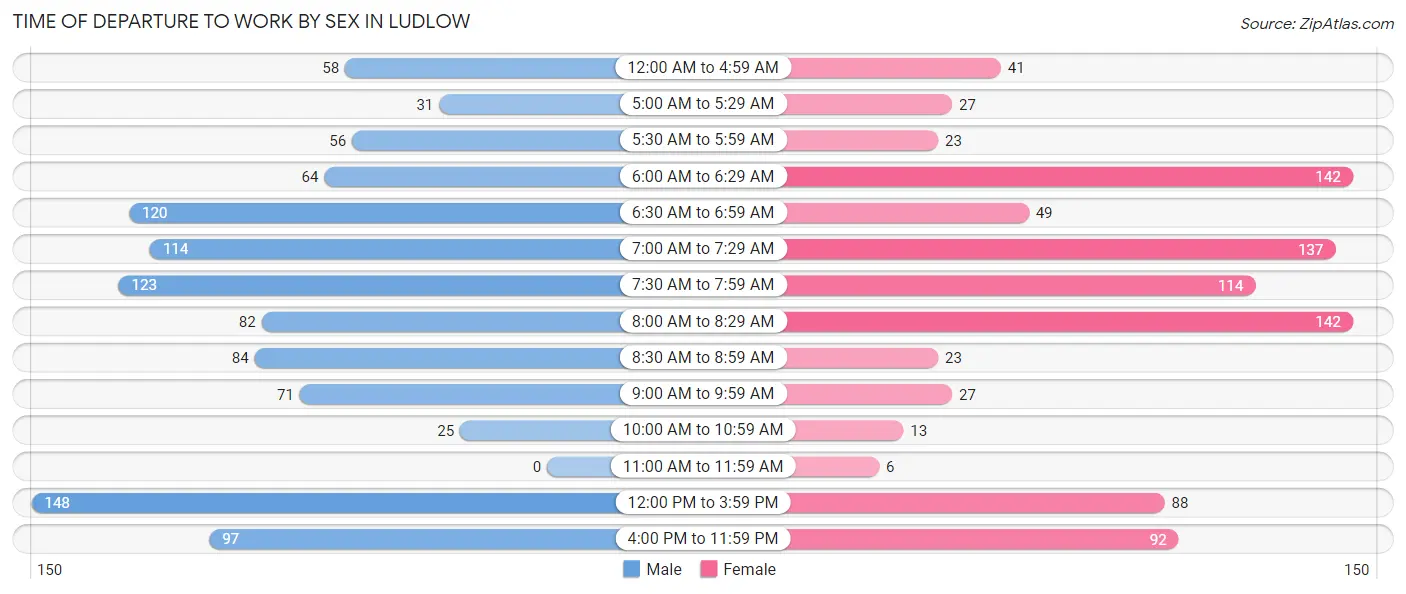
Time of Departure to Work by Sex in Ludlow
The most frequent times of departure to work in Ludlow are 12:00 PM to 3:59 PM (148, 13.8%) for males and 6:00 AM to 6:29 AM (142, 15.4%) for females.
| Time of Departure | Male | Female |
| 12:00 AM to 4:59 AM | 58 (5.4%) | 41 (4.4%) |
| 5:00 AM to 5:29 AM | 31 (2.9%) | 27 (2.9%) |
| 5:30 AM to 5:59 AM | 56 (5.2%) | 23 (2.5%) |
| 6:00 AM to 6:29 AM | 64 (6.0%) | 142 (15.4%) |
| 6:30 AM to 6:59 AM | 120 (11.2%) | 49 (5.3%) |
| 7:00 AM to 7:29 AM | 114 (10.6%) | 137 (14.8%) |
| 7:30 AM to 7:59 AM | 123 (11.5%) | 114 (12.3%) |
| 8:00 AM to 8:29 AM | 82 (7.6%) | 142 (15.4%) |
| 8:30 AM to 8:59 AM | 84 (7.8%) | 23 (2.5%) |
| 9:00 AM to 9:59 AM | 71 (6.6%) | 27 (2.9%) |
| 10:00 AM to 10:59 AM | 25 (2.3%) | 13 (1.4%) |
| 11:00 AM to 11:59 AM | 0 (0.0%) | 6 (0.6%) |
| 12:00 PM to 3:59 PM | 148 (13.8%) | 88 (9.5%) |
| 4:00 PM to 11:59 PM | 97 (9.0%) | 92 (10.0%) |
| Total | 1,073 (100.0%) | 924 (100.0%) |
Housing Occupancy in Ludlow
Occupancy by Ownership in Ludlow
Of the total 1,914 dwellings in Ludlow, owner-occupied units account for 1,513 (79.0%), while renter-occupied units make up 401 (20.9%).
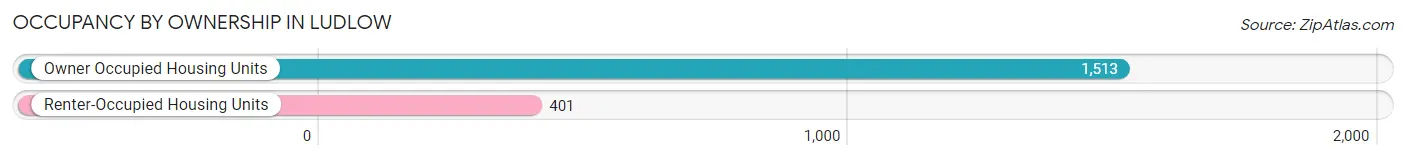
| Occupancy | # Housing Units | % Housing Units |
| Owner Occupied Housing Units | 1,513 | 79.0% |
| Renter-Occupied Housing Units | 401 | 20.9% |
| Total Occupied Housing Units | 1,914 | 100.0% |
Occupancy by Household Size in Ludlow
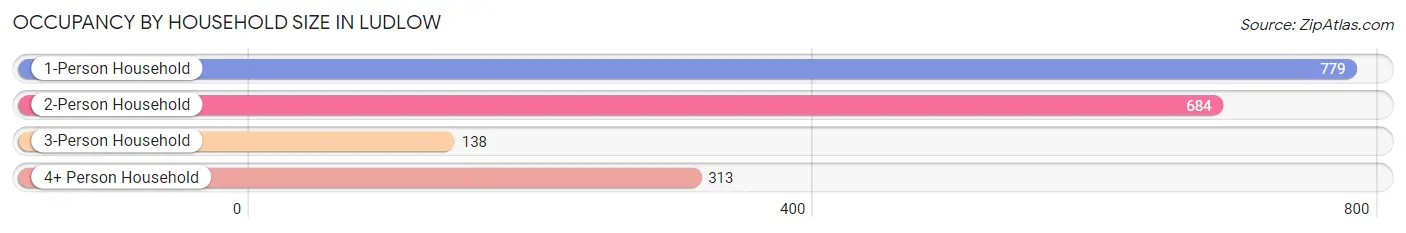
| Household Size | # Housing Units | % Housing Units |
| 1-Person Household | 779 | 40.7% |
| 2-Person Household | 684 | 35.7% |
| 3-Person Household | 138 | 7.2% |
| 4+ Person Household | 313 | 16.4% |
| Total Housing Units | 1,914 | 100.0% |
Occupancy by Ownership by Household Size in Ludlow
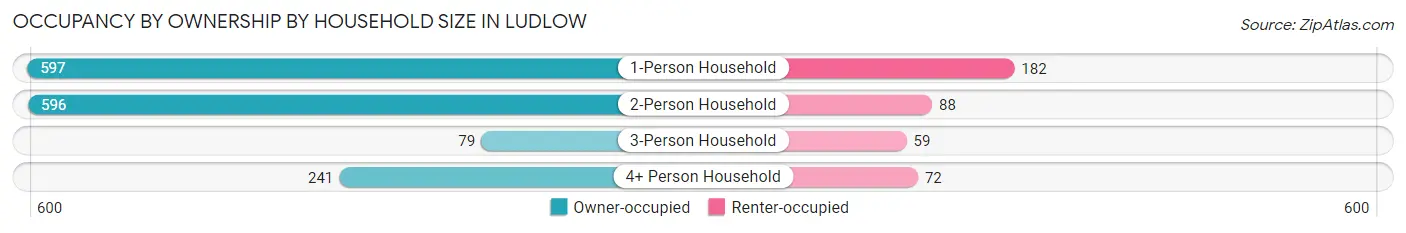
| Household Size | Owner-occupied | Renter-occupied |
| 1-Person Household | 597 (76.6%) | 182 (23.4%) |
| 2-Person Household | 596 (87.1%) | 88 (12.9%) |
| 3-Person Household | 79 (57.3%) | 59 (42.7%) |
| 4+ Person Household | 241 (77.0%) | 72 (23.0%) |
| Total Housing Units | 1,513 (79.0%) | 401 (20.9%) |
Occupancy by Educational Attainment in Ludlow
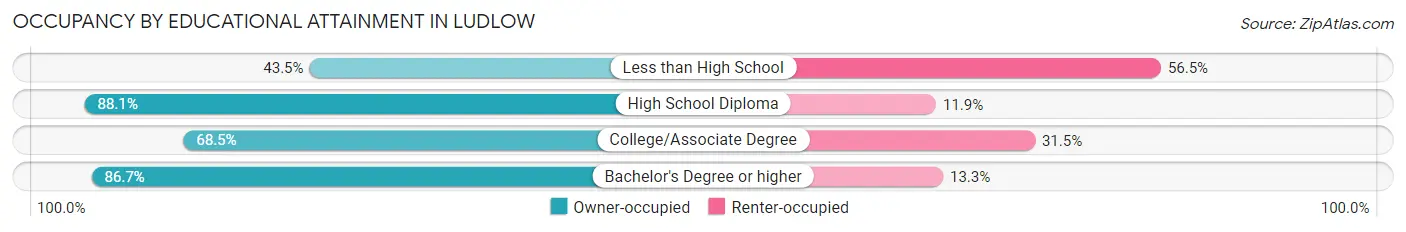
| Household Size | Owner-occupied | Renter-occupied |
| Less than High School | 64 (43.5%) | 83 (56.5%) |
| High School Diploma | 534 (88.1%) | 72 (11.9%) |
| College/Associate Degree | 346 (68.5%) | 159 (31.5%) |
| Bachelor's Degree or higher | 569 (86.7%) | 87 (13.3%) |
Occupancy by Age of Householder in Ludlow
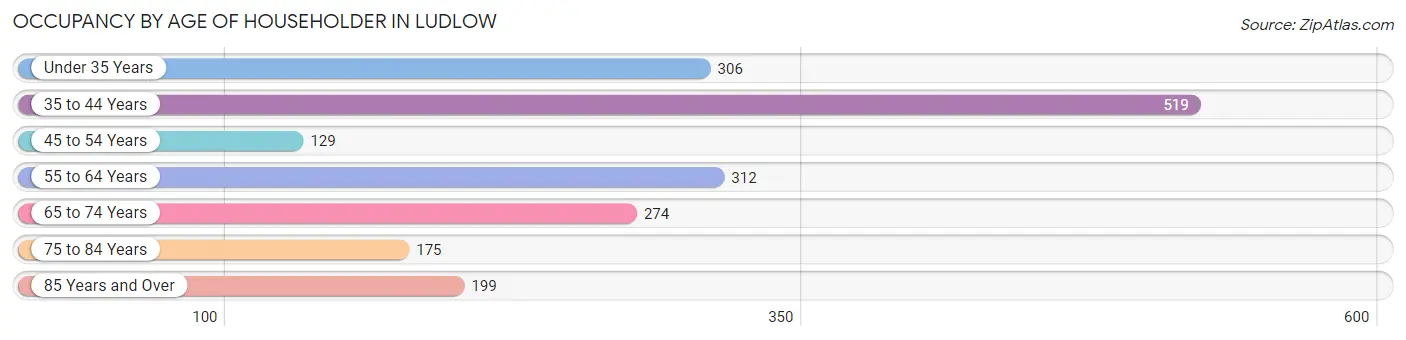
| Age Bracket | # Households | % Households |
| Under 35 Years | 306 | 16.0% |
| 35 to 44 Years | 519 | 27.1% |
| 45 to 54 Years | 129 | 6.7% |
| 55 to 64 Years | 312 | 16.3% |
| 65 to 74 Years | 274 | 14.3% |
| 75 to 84 Years | 175 | 9.1% |
| 85 Years and Over | 199 | 10.4% |
| Total | 1,914 | 100.0% |
Housing Finances in Ludlow
Median Income by Occupancy in Ludlow
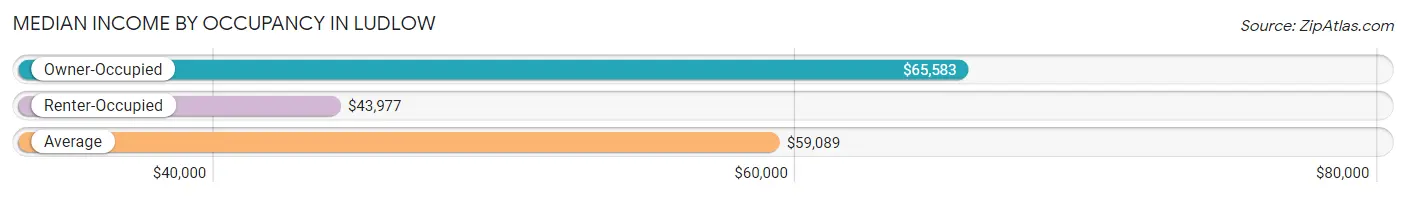
| Occupancy Type | # Households | Median Income |
| Owner-Occupied | 1,513 (79.0%) | $65,583 |
| Renter-Occupied | 401 (20.9%) | $43,977 |
| Average | 1,914 (100.0%) | $59,089 |
Occupancy by Householder Income Bracket in Ludlow
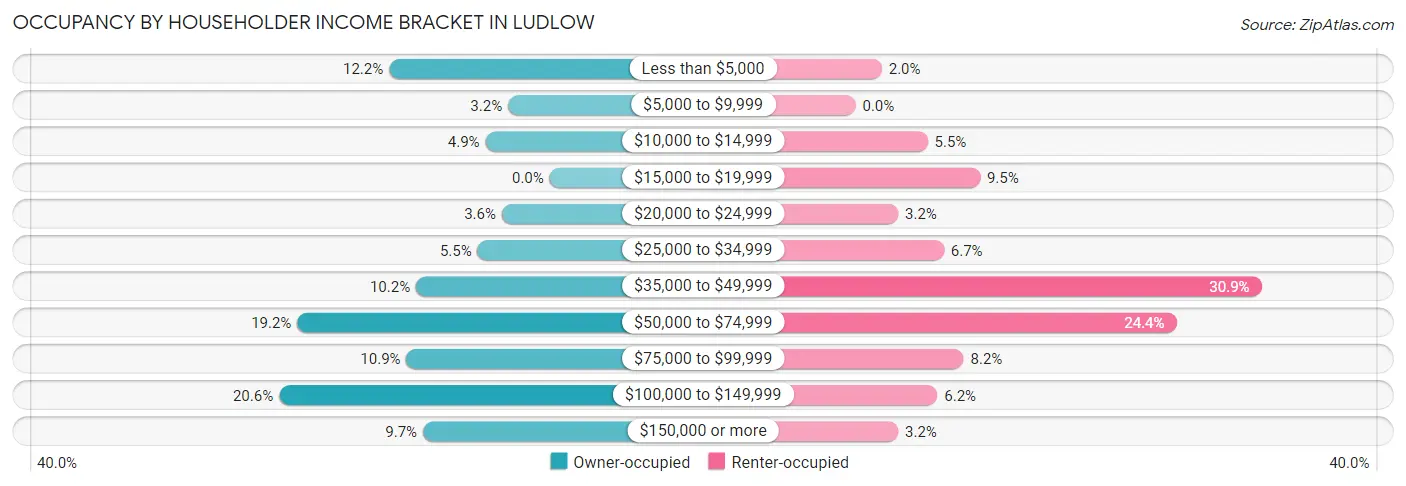
| Income Bracket | Owner-occupied | Renter-occupied |
| Less than $5,000 | 185 (12.2%) | 8 (2.0%) |
| $5,000 to $9,999 | 48 (3.2%) | 0 (0.0%) |
| $10,000 to $14,999 | 74 (4.9%) | 22 (5.5%) |
| $15,000 to $19,999 | 0 (0.0%) | 38 (9.5%) |
| $20,000 to $24,999 | 55 (3.6%) | 13 (3.2%) |
| $25,000 to $34,999 | 83 (5.5%) | 27 (6.7%) |
| $35,000 to $49,999 | 154 (10.2%) | 124 (30.9%) |
| $50,000 to $74,999 | 291 (19.2%) | 98 (24.4%) |
| $75,000 to $99,999 | 165 (10.9%) | 33 (8.2%) |
| $100,000 to $149,999 | 312 (20.6%) | 25 (6.2%) |
| $150,000 or more | 146 (9.7%) | 13 (3.2%) |
| Total | 1,513 (100.0%) | 401 (100.0%) |
Monthly Housing Cost Tiers in Ludlow
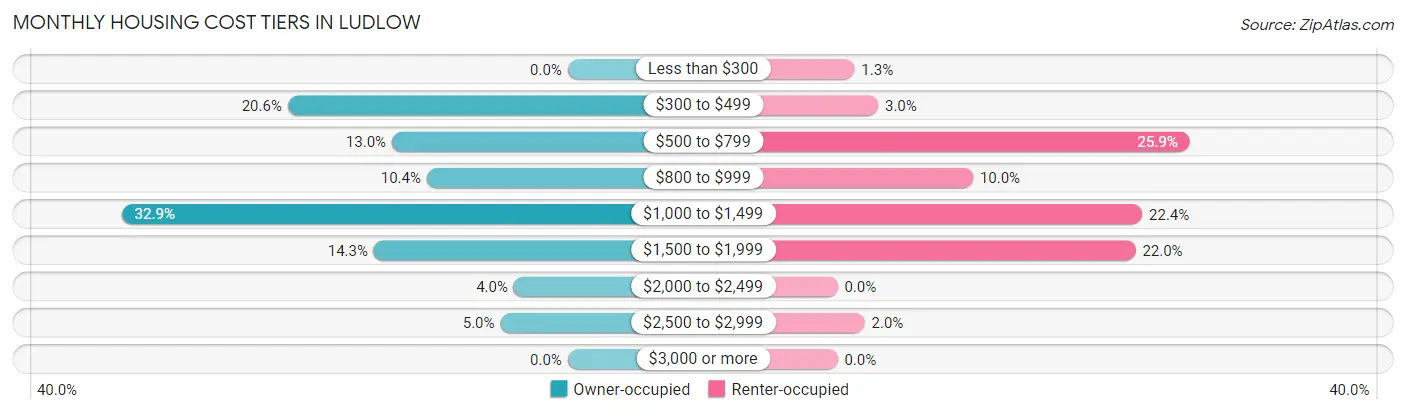
| Monthly Cost | Owner-occupied | Renter-occupied |
| Less than $300 | 0 (0.0%) | 5 (1.3%) |
| $300 to $499 | 312 (20.6%) | 12 (3.0%) |
| $500 to $799 | 196 (13.0%) | 104 (25.9%) |
| $800 to $999 | 157 (10.4%) | 40 (10.0%) |
| $1,000 to $1,499 | 497 (32.9%) | 90 (22.4%) |
| $1,500 to $1,999 | 216 (14.3%) | 88 (22.0%) |
| $2,000 to $2,499 | 60 (4.0%) | 0 (0.0%) |
| $2,500 to $2,999 | 75 (5.0%) | 8 (2.0%) |
| $3,000 or more | 0 (0.0%) | 0 (0.0%) |
| Total | 1,513 (100.0%) | 401 (100.0%) |
Physical Housing Characteristics in Ludlow
Housing Structures in Ludlow
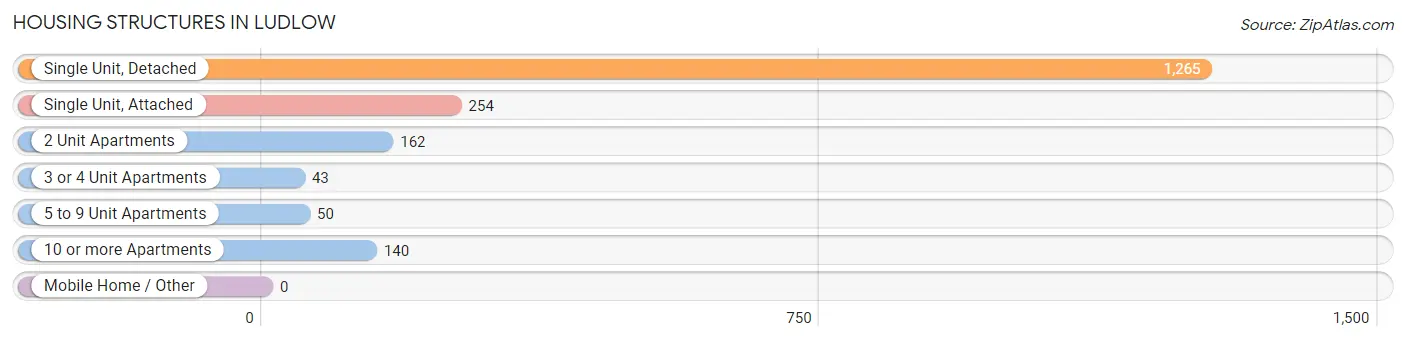
| Structure Type | # Housing Units | % Housing Units |
| Single Unit, Detached | 1,265 | 66.1% |
| Single Unit, Attached | 254 | 13.3% |
| 2 Unit Apartments | 162 | 8.5% |
| 3 or 4 Unit Apartments | 43 | 2.2% |
| 5 to 9 Unit Apartments | 50 | 2.6% |
| 10 or more Apartments | 140 | 7.3% |
| Mobile Home / Other | 0 | 0.0% |
| Total | 1,914 | 100.0% |
Housing Structures by Occupancy in Ludlow
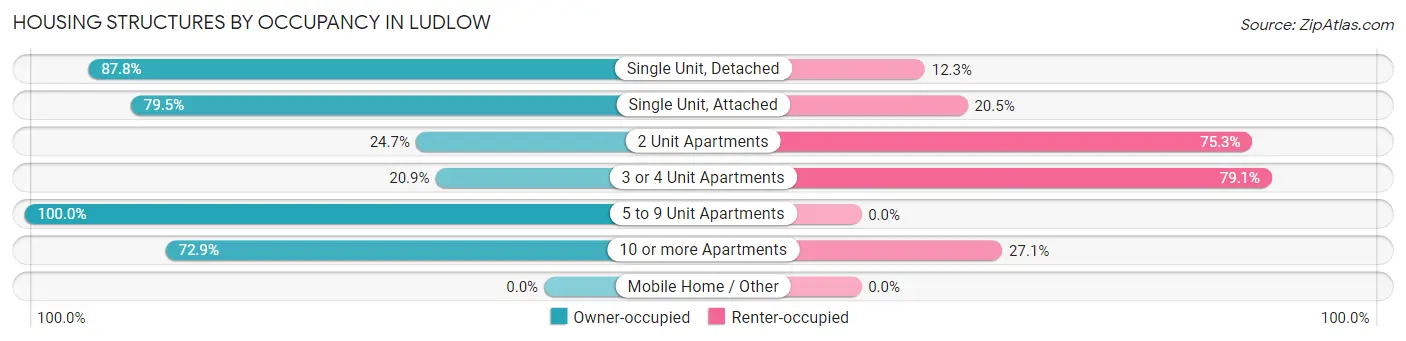
| Structure Type | Owner-occupied | Renter-occupied |
| Single Unit, Detached | 1,110 (87.7%) | 155 (12.2%) |
| Single Unit, Attached | 202 (79.5%) | 52 (20.5%) |
| 2 Unit Apartments | 40 (24.7%) | 122 (75.3%) |
| 3 or 4 Unit Apartments | 9 (20.9%) | 34 (79.1%) |
| 5 to 9 Unit Apartments | 50 (100.0%) | 0 (0.0%) |
| 10 or more Apartments | 102 (72.9%) | 38 (27.1%) |
| Mobile Home / Other | 0 (0.0%) | 0 (0.0%) |
| Total | 1,513 (79.0%) | 401 (20.9%) |
Housing Structures by Number of Rooms in Ludlow
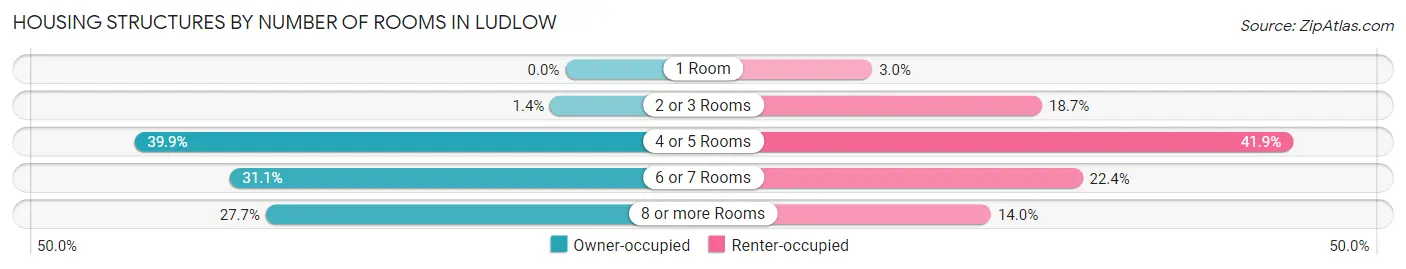
| Number of Rooms | Owner-occupied | Renter-occupied |
| 1 Room | 0 (0.0%) | 12 (3.0%) |
| 2 or 3 Rooms | 21 (1.4%) | 75 (18.7%) |
| 4 or 5 Rooms | 603 (39.9%) | 168 (41.9%) |
| 6 or 7 Rooms | 470 (31.1%) | 90 (22.4%) |
| 8 or more Rooms | 419 (27.7%) | 56 (14.0%) |
| Total | 1,513 (100.0%) | 401 (100.0%) |
Housing Structure by Heating Type in Ludlow
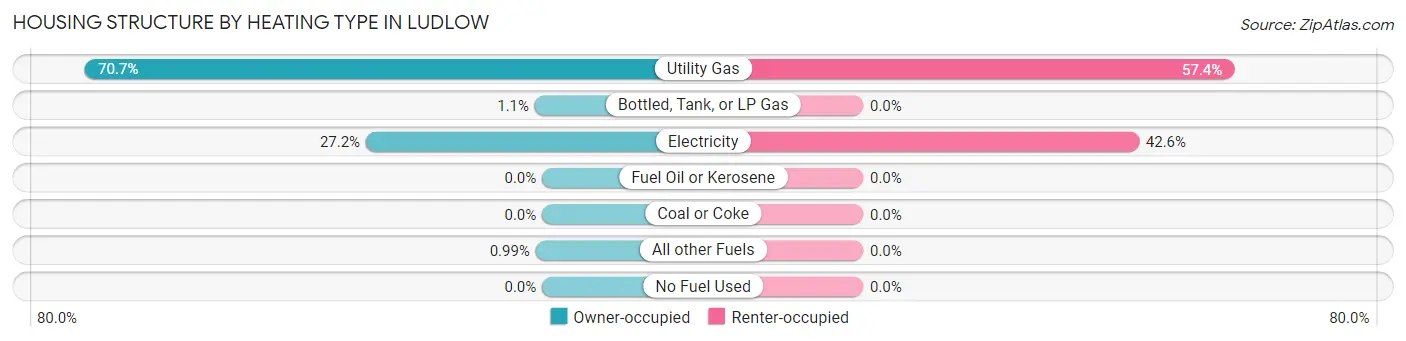
| Heating Type | Owner-occupied | Renter-occupied |
| Utility Gas | 1,069 (70.7%) | 230 (57.4%) |
| Bottled, Tank, or LP Gas | 17 (1.1%) | 0 (0.0%) |
| Electricity | 412 (27.2%) | 171 (42.6%) |
| Fuel Oil or Kerosene | 0 (0.0%) | 0 (0.0%) |
| Coal or Coke | 0 (0.0%) | 0 (0.0%) |
| All other Fuels | 15 (1.0%) | 0 (0.0%) |
| No Fuel Used | 0 (0.0%) | 0 (0.0%) |
| Total | 1,513 (100.0%) | 401 (100.0%) |
Household Vehicle Usage in Ludlow
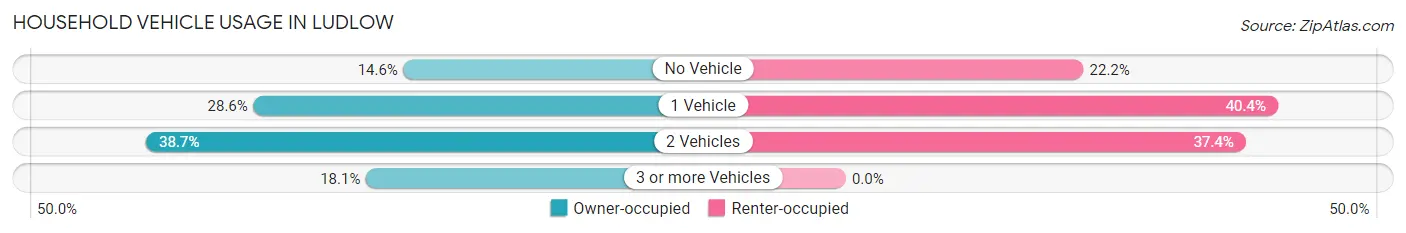
| Vehicles per Household | Owner-occupied | Renter-occupied |
| No Vehicle | 221 (14.6%) | 89 (22.2%) |
| 1 Vehicle | 433 (28.6%) | 162 (40.4%) |
| 2 Vehicles | 585 (38.7%) | 150 (37.4%) |
| 3 or more Vehicles | 274 (18.1%) | 0 (0.0%) |
| Total | 1,513 (100.0%) | 401 (100.0%) |
Real Estate & Mortgages in Ludlow
Real Estate and Mortgage Overview in Ludlow
| Characteristic | Without Mortgage | With Mortgage |
| Housing Units | 436 | 1,077 |
| Median Property Value | $142,500 | $170,000 |
| Median Household Income | $32,917 | $123 |
| Monthly Housing Costs | $382 | $0 |
| Real Estate Taxes | $1,719 | $77 |
Property Value by Mortgage Status in Ludlow
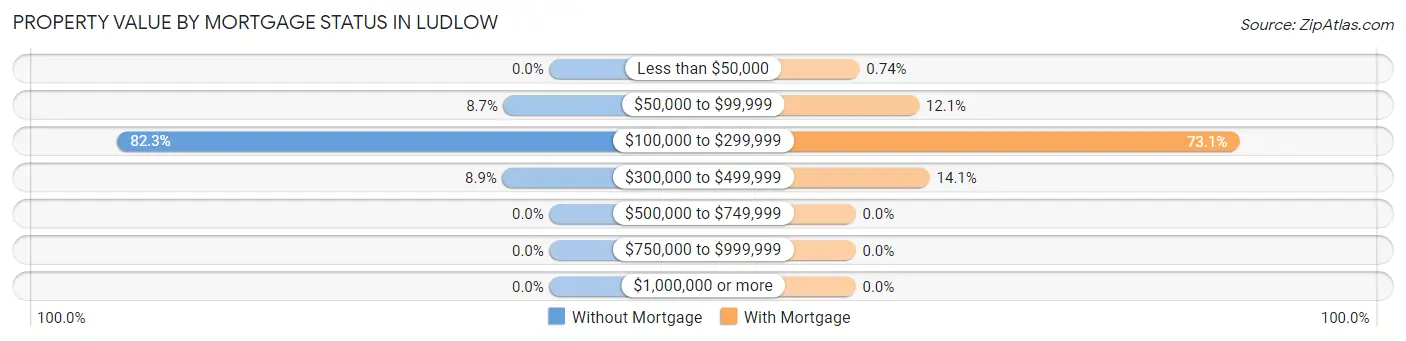
| Property Value | Without Mortgage | With Mortgage |
| Less than $50,000 | 0 (0.0%) | 8 (0.7%) |
| $50,000 to $99,999 | 38 (8.7%) | 130 (12.1%) |
| $100,000 to $299,999 | 359 (82.3%) | 787 (73.1%) |
| $300,000 to $499,999 | 39 (8.9%) | 152 (14.1%) |
| $500,000 to $749,999 | 0 (0.0%) | 0 (0.0%) |
| $750,000 to $999,999 | 0 (0.0%) | 0 (0.0%) |
| $1,000,000 or more | 0 (0.0%) | 0 (0.0%) |
| Total | 436 (100.0%) | 1,077 (100.0%) |
Household Income by Mortgage Status in Ludlow
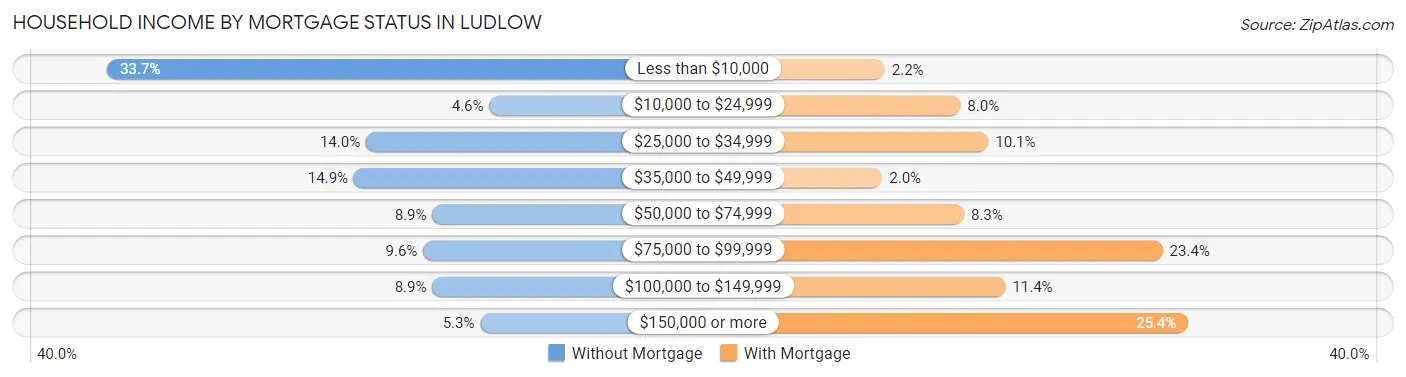
| Household Income | Without Mortgage | With Mortgage |
| Less than $10,000 | 147 (33.7%) | 24 (2.2%) |
| $10,000 to $24,999 | 20 (4.6%) | 86 (8.0%) |
| $25,000 to $34,999 | 61 (14.0%) | 109 (10.1%) |
| $35,000 to $49,999 | 65 (14.9%) | 22 (2.0%) |
| $50,000 to $74,999 | 39 (8.9%) | 89 (8.3%) |
| $75,000 to $99,999 | 42 (9.6%) | 252 (23.4%) |
| $100,000 to $149,999 | 39 (8.9%) | 123 (11.4%) |
| $150,000 or more | 23 (5.3%) | 273 (25.4%) |
| Total | 436 (100.0%) | 1,077 (100.0%) |
Property Value to Household Income Ratio in Ludlow
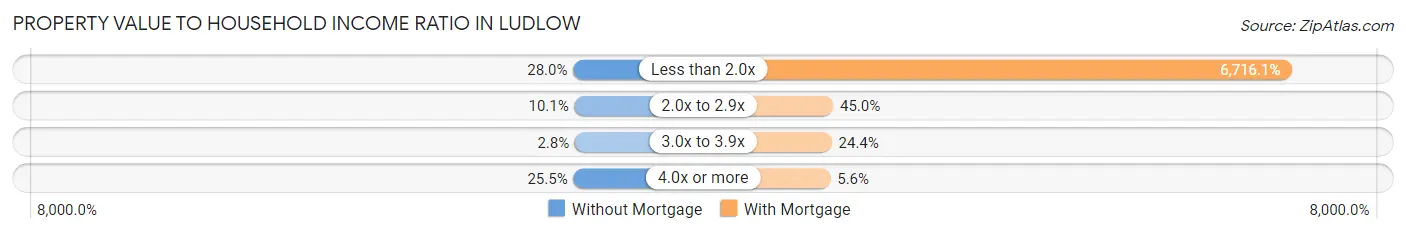
| Value-to-Income Ratio | Without Mortgage | With Mortgage |
| Less than 2.0x | 122 (28.0%) | 72,332 (6,716.1%) |
| 2.0x to 2.9x | 44 (10.1%) | 485 (45.0%) |
| 3.0x to 3.9x | 12 (2.8%) | 263 (24.4%) |
| 4.0x or more | 111 (25.5%) | 60 (5.6%) |
| Total | 436 (100.0%) | 1,077 (100.0%) |
Real Estate Taxes by Mortgage Status in Ludlow

| Property Taxes | Without Mortgage | With Mortgage |
| Less than $800 | 54 (12.4%) | 10 (0.9%) |
| $800 to $1,499 | 68 (15.6%) | 73 (6.8%) |
| $800 to $1,499 | 300 (68.8%) | 235 (21.8%) |
| Total | 436 (100.0%) | 1,077 (100.0%) |
Health & Disability in Ludlow
Health Insurance Coverage by Age in Ludlow
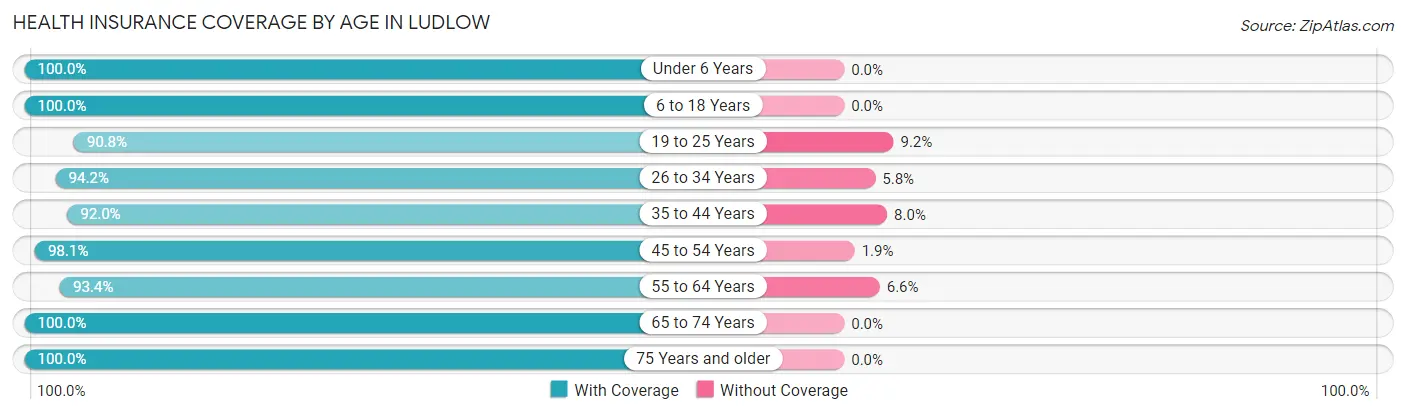
| Age Bracket | With Coverage | Without Coverage |
| Under 6 Years | 293 (100.0%) | 0 (0.0%) |
| 6 to 18 Years | 722 (100.0%) | 0 (0.0%) |
| 19 to 25 Years | 455 (90.8%) | 46 (9.2%) |
| 26 to 34 Years | 407 (94.2%) | 25 (5.8%) |
| 35 to 44 Years | 714 (92.0%) | 62 (8.0%) |
| 45 to 54 Years | 303 (98.1%) | 6 (1.9%) |
| 55 to 64 Years | 494 (93.4%) | 35 (6.6%) |
| 65 to 74 Years | 364 (100.0%) | 0 (0.0%) |
| 75 Years and older | 458 (100.0%) | 0 (0.0%) |
| Total | 4,210 (96.0%) | 174 (4.0%) |
Health Insurance Coverage by Citizenship Status in Ludlow
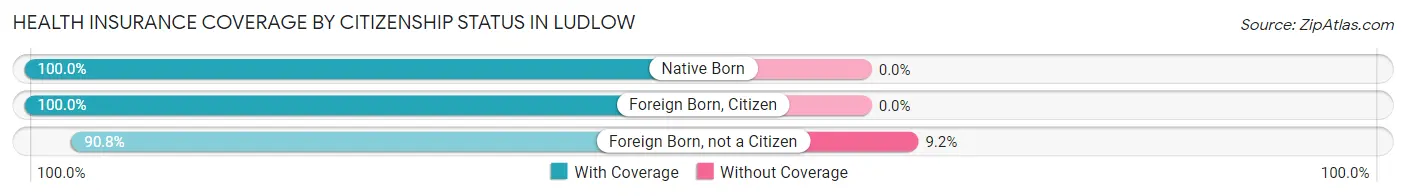
| Citizenship Status | With Coverage | Without Coverage |
| Native Born | 293 (100.0%) | 0 (0.0%) |
| Foreign Born, Citizen | 722 (100.0%) | 0 (0.0%) |
| Foreign Born, not a Citizen | 455 (90.8%) | 46 (9.2%) |
Health Insurance Coverage by Household Income in Ludlow
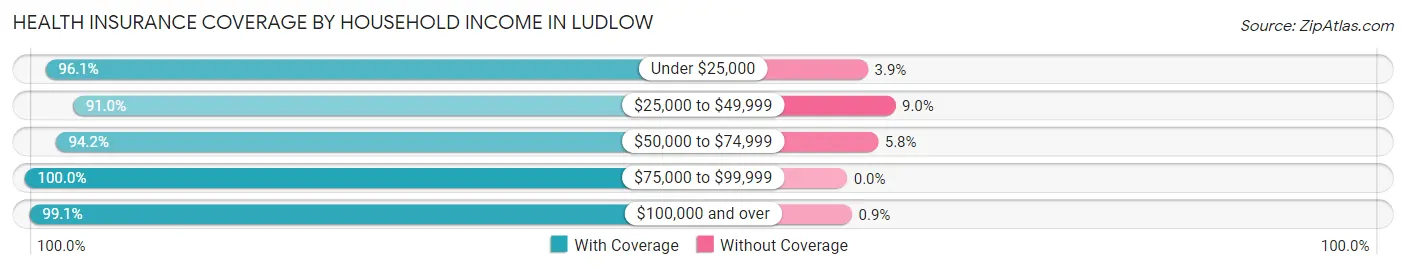
| Household Income | With Coverage | Without Coverage |
| Under $25,000 | 566 (96.1%) | 23 (3.9%) |
| $25,000 to $49,999 | 845 (91.0%) | 84 (9.0%) |
| $50,000 to $74,999 | 893 (94.2%) | 55 (5.8%) |
| $75,000 to $99,999 | 569 (100.0%) | 0 (0.0%) |
| $100,000 and over | 1,320 (99.1%) | 12 (0.9%) |
Public vs Private Health Insurance Coverage by Age in Ludlow
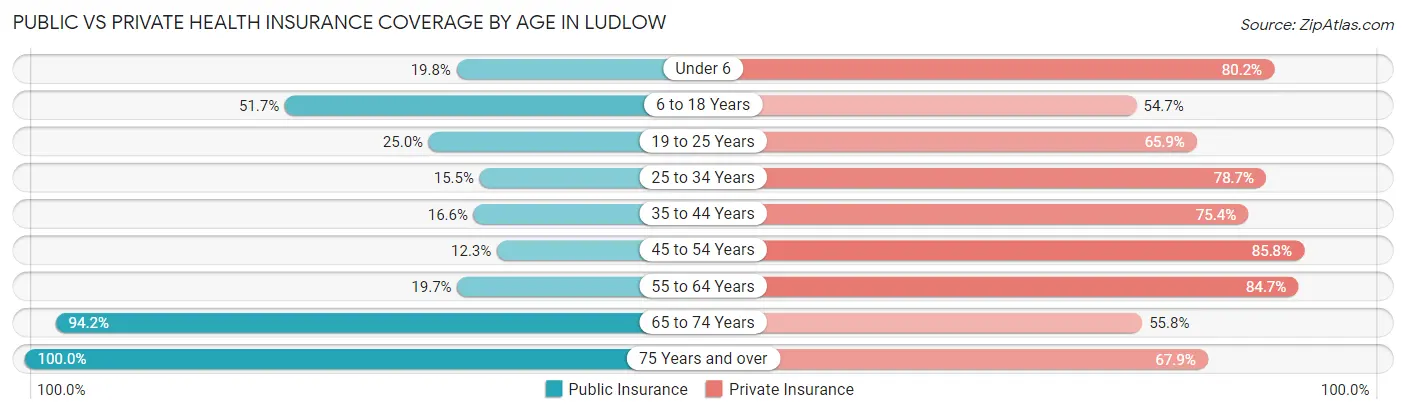
| Age Bracket | Public Insurance | Private Insurance |
| Under 6 | 58 (19.8%) | 235 (80.2%) |
| 6 to 18 Years | 373 (51.7%) | 395 (54.7%) |
| 19 to 25 Years | 125 (24.9%) | 330 (65.9%) |
| 25 to 34 Years | 67 (15.5%) | 340 (78.7%) |
| 35 to 44 Years | 129 (16.6%) | 585 (75.4%) |
| 45 to 54 Years | 38 (12.3%) | 265 (85.8%) |
| 55 to 64 Years | 104 (19.7%) | 448 (84.7%) |
| 65 to 74 Years | 343 (94.2%) | 203 (55.8%) |
| 75 Years and over | 458 (100.0%) | 311 (67.9%) |
| Total | 1,695 (38.7%) | 3,112 (71.0%) |
Disability Status by Sex by Age in Ludlow
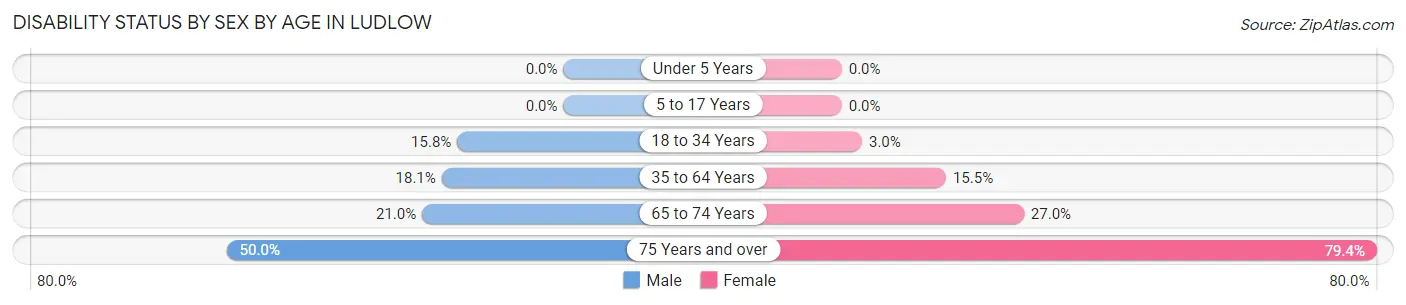
| Age Bracket | Male | Female |
| Under 5 Years | 0 (0.0%) | 0 (0.0%) |
| 5 to 17 Years | 0 (0.0%) | 0 (0.0%) |
| 18 to 34 Years | 76 (15.8%) | 14 (3.0%) |
| 35 to 64 Years | 141 (18.1%) | 129 (15.5%) |
| 65 to 74 Years | 43 (21.0%) | 43 (27.0%) |
| 75 Years and over | 37 (50.0%) | 305 (79.4%) |
Disability Class by Sex by Age in Ludlow
Disability Class: Hearing Difficulty
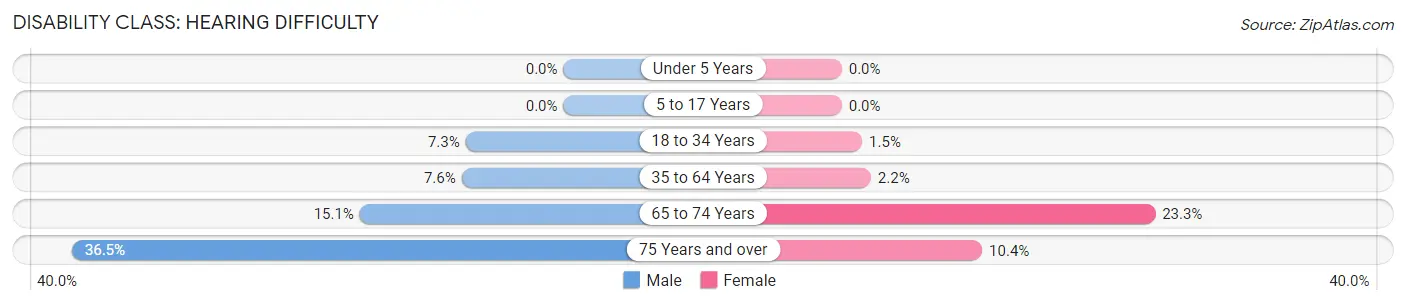
| Age Bracket | Male | Female |
| Under 5 Years | 0 (0.0%) | 0 (0.0%) |
| 5 to 17 Years | 0 (0.0%) | 0 (0.0%) |
| 18 to 34 Years | 35 (7.3%) | 7 (1.5%) |
| 35 to 64 Years | 59 (7.6%) | 18 (2.2%) |
| 65 to 74 Years | 31 (15.1%) | 37 (23.3%) |
| 75 Years and over | 27 (36.5%) | 40 (10.4%) |
Disability Class: Vision Difficulty
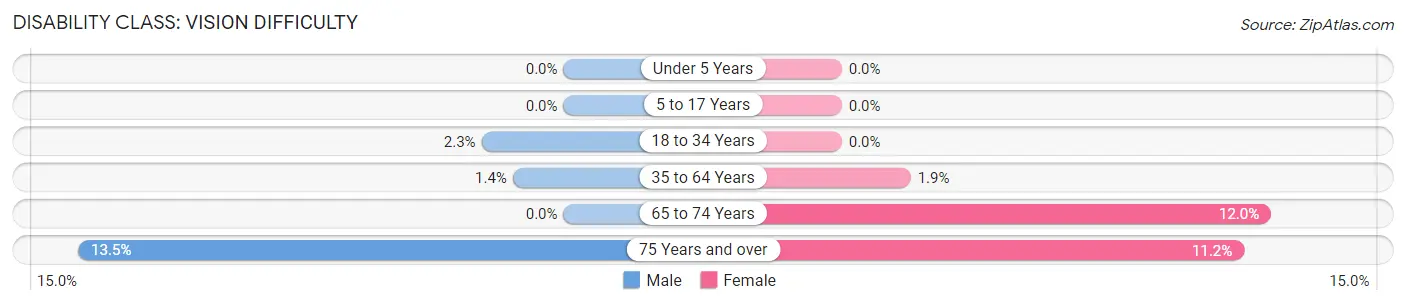
| Age Bracket | Male | Female |
| Under 5 Years | 0 (0.0%) | 0 (0.0%) |
| 5 to 17 Years | 0 (0.0%) | 0 (0.0%) |
| 18 to 34 Years | 11 (2.3%) | 0 (0.0%) |
| 35 to 64 Years | 11 (1.4%) | 16 (1.9%) |
| 65 to 74 Years | 0 (0.0%) | 19 (11.9%) |
| 75 Years and over | 10 (13.5%) | 43 (11.2%) |
Disability Class: Cognitive Difficulty
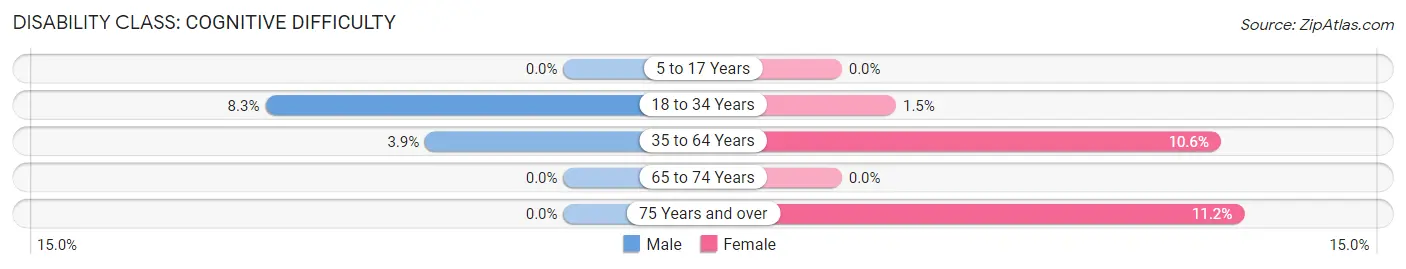
| Age Bracket | Male | Female |
| 5 to 17 Years | 0 (0.0%) | 0 (0.0%) |
| 18 to 34 Years | 40 (8.3%) | 7 (1.5%) |
| 35 to 64 Years | 30 (3.8%) | 88 (10.5%) |
| 65 to 74 Years | 0 (0.0%) | 0 (0.0%) |
| 75 Years and over | 0 (0.0%) | 43 (11.2%) |
Disability Class: Ambulatory Difficulty
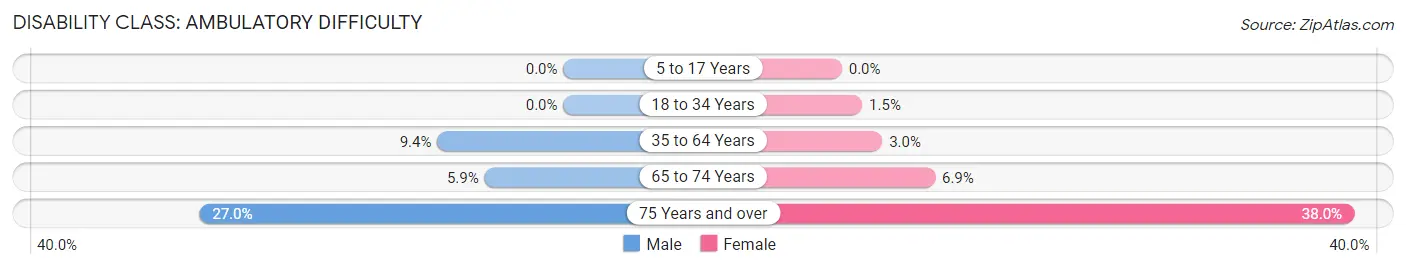
| Age Bracket | Male | Female |
| 5 to 17 Years | 0 (0.0%) | 0 (0.0%) |
| 18 to 34 Years | 0 (0.0%) | 7 (1.5%) |
| 35 to 64 Years | 73 (9.4%) | 25 (3.0%) |
| 65 to 74 Years | 12 (5.9%) | 11 (6.9%) |
| 75 Years and over | 20 (27.0%) | 146 (38.0%) |
Disability Class: Self-Care Difficulty
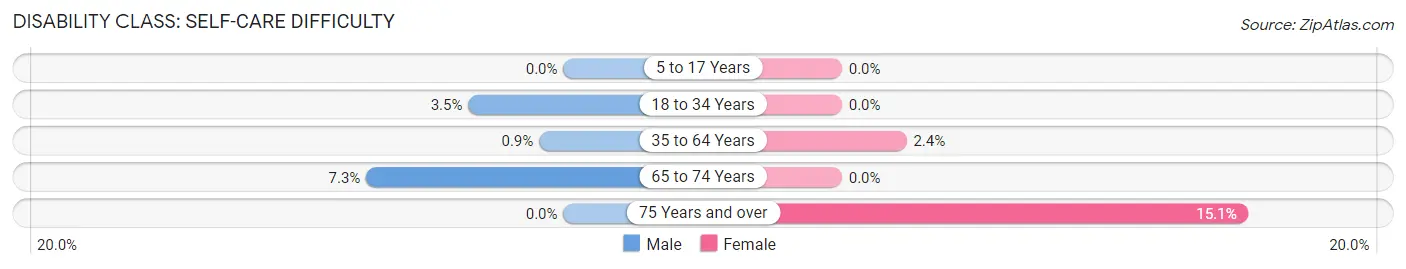
| Age Bracket | Male | Female |
| 5 to 17 Years | 0 (0.0%) | 0 (0.0%) |
| 18 to 34 Years | 17 (3.5%) | 0 (0.0%) |
| 35 to 64 Years | 7 (0.9%) | 20 (2.4%) |
| 65 to 74 Years | 15 (7.3%) | 0 (0.0%) |
| 75 Years and over | 0 (0.0%) | 58 (15.1%) |
Technology Access in Ludlow
Computing Device Access in Ludlow
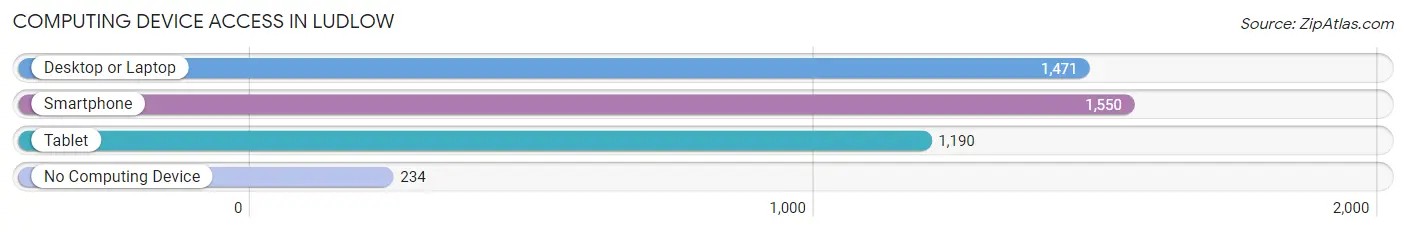
| Device Type | # Households | % Households |
| Desktop or Laptop | 1,471 | 76.8% |
| Smartphone | 1,550 | 81.0% |
| Tablet | 1,190 | 62.2% |
| No Computing Device | 234 | 12.2% |
| Total | 1,914 | 100.0% |
Internet Access in Ludlow
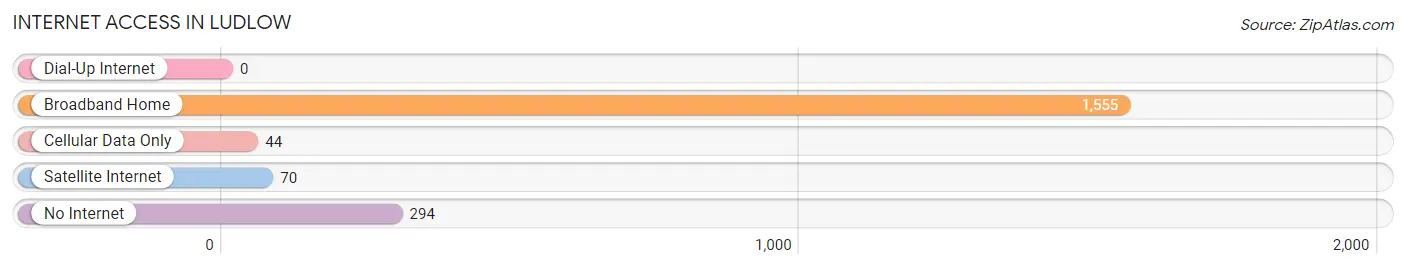
| Internet Type | # Households | % Households |
| Dial-Up Internet | 0 | 0.0% |
| Broadband Home | 1,555 | 81.2% |
| Cellular Data Only | 44 | 2.3% |
| Satellite Internet | 70 | 3.7% |
| No Internet | 294 | 15.4% |
| Total | 1,914 | 100.0% |
Ludlow Summary
Ludlow, Kentucky is a small city located in Kenton County, in the northern part of the state. It is situated on the banks of the Ohio River, just south of Cincinnati, Ohio. The city has a population of approximately 4,000 people, and is part of the Cincinnati metropolitan area.
History
Ludlow was founded in 1864 by a group of German immigrants who had settled in the area. The city was named after the Ludlow family, who had owned the land on which the city was built. The city was incorporated in 1867, and the first mayor was elected in 1868.
The city grew rapidly in the late 19th century, and by the early 20th century, it had become a major industrial center. The city was home to several factories, including a steel mill, a paper mill, and a glass factory. The city also had a thriving riverboat industry, and was a major port for the Ohio River.
In the mid-20th century, the city began to decline as the factories closed and the riverboat industry declined. The city has since become a bedroom community for Cincinnati, and its economy is now largely based on tourism and retail.
Geography
Ludlow is located in northern Kentucky, on the banks of the Ohio River. The city is situated at the intersection of Interstate 75 and US Route 25. The city is bordered by the cities of Covington and Newport to the east, and by the city of Cincinnati to the north.
The city has a total area of 2.2 square miles, all of which is land. The city is located in a hilly region, and the terrain is mostly flat. The climate is humid subtropical, with hot, humid summers and cold, wet winters.
Economy
The economy of Ludlow is largely based on tourism and retail. The city is home to several tourist attractions, including the Ludlow Historic District, the Ludlow Riverwalk, and the Ludlow Arts Center. The city is also home to several retail stores, including a Walmart Supercenter, a Kroger grocery store, and several restaurants.
The city is also home to several manufacturing companies, including a steel mill, a paper mill, and a glass factory. The city is also home to several small businesses, including a number of auto repair shops, a printing company, and a number of other small businesses.
Demographics
As of the 2010 census, the population of Ludlow was 4,000. The racial makeup of the city was 95.3% White, 1.7% African American, 0.3% Native American, 0.7% Asian, 0.1% Pacific Islander, 0.7% from other races, and 1.6% from two or more races. Hispanic or Latino of any race were 2.2% of the population.
The median household income in Ludlow was $41,250, and the median family income was $50,000. The per capita income in the city was $20,000. About 11.3% of the population was below the poverty line.
Conclusion
Ludlow, Kentucky is a small city located in Kenton County, in the northern part of the state. It is situated on the banks of the Ohio River, just south of Cincinnati, Ohio. The city has a population of approximately 4,000 people, and is part of the Cincinnati metropolitan area. The city has a long history, and its economy is largely based on tourism and retail. The city is also home to several manufacturing companies, and a number of small businesses. The population of Ludlow is mostly white, with a small percentage of African Americans, Native Americans, Asians, and other races. The median household income in the city is $41,250, and the per capita income is $20,000.
Common Questions
What is Per Capita Income in Ludlow?
Per Capita income in Ludlow is $31,570.
What is the Median Family Income in Ludlow?
Median Family Income in Ludlow is $71,971.
What is the Median Household income in Ludlow?
Median Household Income in Ludlow is $59,089.
What is Income or Wage Gap in Ludlow?
Income or Wage Gap in Ludlow is 29.9%.
Women in Ludlow earn 70.1 cents for every dollar earned by a man.
What is Inequality or Gini Index in Ludlow?
Inequality or Gini Index in Ludlow is 0.43.
What is the Total Population of Ludlow?
Total Population of Ludlow is 4,384.
What is the Total Male Population of Ludlow?
Total Male Population of Ludlow is 1,947.
What is the Total Female Population of Ludlow?
Total Female Population of Ludlow is 2,437.
What is the Ratio of Males per 100 Females in Ludlow?
There are 79.89 Males per 100 Females in Ludlow.
What is the Ratio of Females per 100 Males in Ludlow?
There are 125.17 Females per 100 Males in Ludlow.
What is the Median Population Age in Ludlow?
Median Population Age in Ludlow is 37.5 Years.
What is the Average Family Size in Ludlow
Average Family Size in Ludlow is 3.3 People.
What is the Average Household Size in Ludlow
Average Household Size in Ludlow is 2.3 People.
How Large is the Labor Force in Ludlow?
There are 2,398 People in the Labor Forcein in Ludlow.
What is the Percentage of People in the Labor Force in Ludlow?
67.0% of People are in the Labor Force in Ludlow.
What is the Unemployment Rate in Ludlow?
Unemployment Rate in Ludlow is 7.0%.