Woodlawn, KY Map & Demographics
Woodlawn Map
Woodlawn Overview
$40,702
PER CAPITA INCOME
$102,500
AVG FAMILY INCOME
$88,125
AVG HOUSEHOLD INCOME
4.9%
WAGE / INCOME GAP [ % ]
95.1¢/ $1
WAGE / INCOME GAP [ $ ]
0.33
INEQUALITY / GINI INDEX
179
TOTAL POPULATION
90
MALE POPULATION
89
FEMALE POPULATION
101.12
MALES / 100 FEMALES
98.89
FEMALES / 100 MALES
39.2
MEDIAN AGE
2.8
AVG FAMILY SIZE
2.5
AVG HOUSEHOLD SIZE
114
LABOR FORCE [ PEOPLE ]
75.5%
PERCENT IN LABOR FORCE
4.4%
UNEMPLOYMENT RATE
Income in Woodlawn
Income Overview in Woodlawn
Per Capita Income in Woodlawn is $40,702, while median incomes of families and households are $102,500 and $88,125 respectively.
| Characteristic | Number | Measure |
| Per Capita Income | 179 | $40,702 |
| Median Family Income | 52 | $102,500 |
| Mean Family Income | 52 | $116,721 |
| Median Household Income | 69 | $88,125 |
| Mean Household Income | 69 | $105,246 |
| Income Deficit | 52 | $0 |
| Wage / Income Gap (%) | 179 | 4.93% |
| Wage / Income Gap ($) | 179 | 95.07¢ per $1 |
| Gini / Inequality Index | 179 | 0.33 |
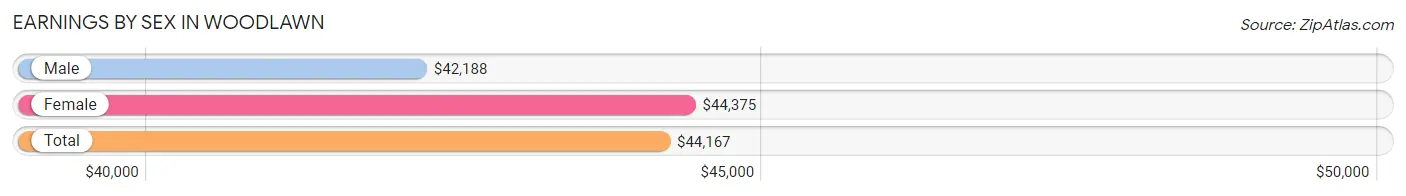
Earnings by Sex in Woodlawn
Average Earnings in Woodlawn are $44,167, $42,188 for men and $44,375 for women, a difference of 4.9%.
| Sex | Number | Average Earnings |
| Male | 63 (54.3%) | $42,188 |
| Female | 53 (45.7%) | $44,375 |
| Total | 116 (100.0%) | $44,167 |
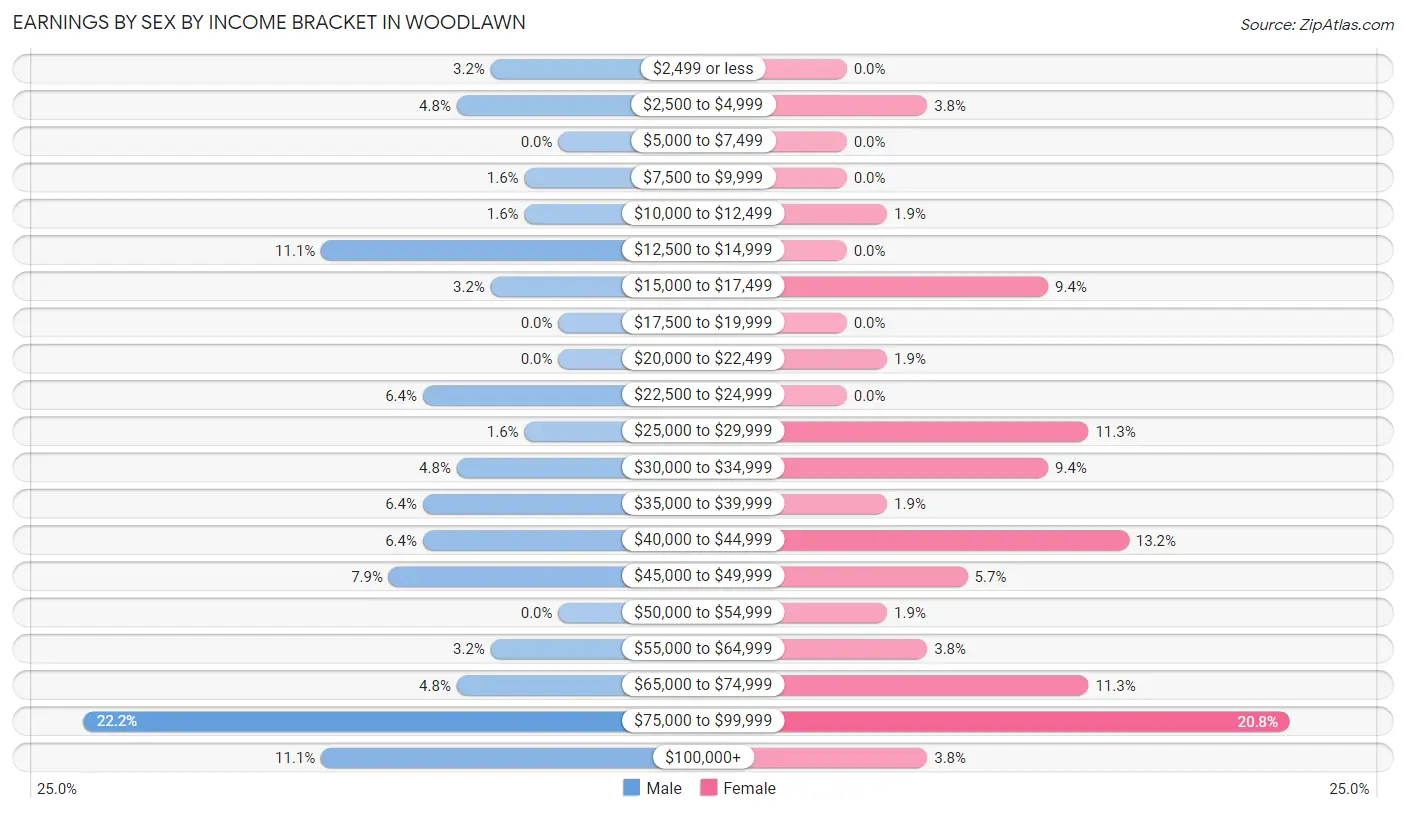
Earnings by Sex by Income Bracket in Woodlawn
The most common earnings brackets in Woodlawn are $75,000 to $99,999 for men (14 | 22.2%) and $75,000 to $99,999 for women (11 | 20.7%).
| Income | Male | Female |
| $2,499 or less | 2 (3.2%) | 0 (0.0%) |
| $2,500 to $4,999 | 3 (4.8%) | 2 (3.8%) |
| $5,000 to $7,499 | 0 (0.0%) | 0 (0.0%) |
| $7,500 to $9,999 | 1 (1.6%) | 0 (0.0%) |
| $10,000 to $12,499 | 1 (1.6%) | 1 (1.9%) |
| $12,500 to $14,999 | 7 (11.1%) | 0 (0.0%) |
| $15,000 to $17,499 | 2 (3.2%) | 5 (9.4%) |
| $17,500 to $19,999 | 0 (0.0%) | 0 (0.0%) |
| $20,000 to $22,499 | 0 (0.0%) | 1 (1.9%) |
| $22,500 to $24,999 | 4 (6.4%) | 0 (0.0%) |
| $25,000 to $29,999 | 1 (1.6%) | 6 (11.3%) |
| $30,000 to $34,999 | 3 (4.8%) | 5 (9.4%) |
| $35,000 to $39,999 | 4 (6.4%) | 1 (1.9%) |
| $40,000 to $44,999 | 4 (6.4%) | 7 (13.2%) |
| $45,000 to $49,999 | 5 (7.9%) | 3 (5.7%) |
| $50,000 to $54,999 | 0 (0.0%) | 1 (1.9%) |
| $55,000 to $64,999 | 2 (3.2%) | 2 (3.8%) |
| $65,000 to $74,999 | 3 (4.8%) | 6 (11.3%) |
| $75,000 to $99,999 | 14 (22.2%) | 11 (20.7%) |
| $100,000+ | 7 (11.1%) | 2 (3.8%) |
| Total | 63 (100.0%) | 53 (100.0%) |
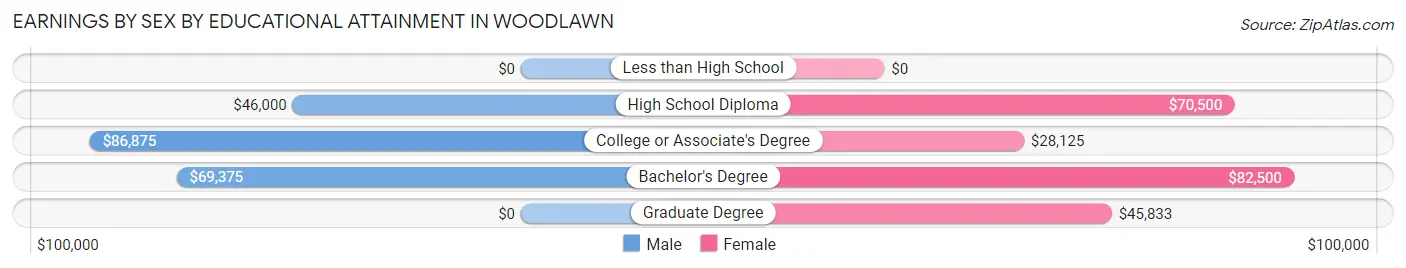
Earnings by Sex by Educational Attainment in Woodlawn
Average earnings in Woodlawn are $47,250 for men and $46,667 for women, a difference of 1.2%. Men with an educational attainment of college or associate's degree enjoy the highest average annual earnings of $86,875, while those with high school diploma education earn the least with $46,000. Women with an educational attainment of bachelor's degree earn the most with the average annual earnings of $82,500, while those with college or associate's degree education have the smallest earnings of $28,125.
| Educational Attainment | Male Income | Female Income |
| Less than High School | - | - |
| High School Diploma | $46,000 | $70,500 |
| College or Associate's Degree | $86,875 | $28,125 |
| Bachelor's Degree | $69,375 | $82,500 |
| Graduate Degree | - | - |
| Total | $47,250 | $46,667 |
Family Income in Woodlawn
Family Income Brackets in Woodlawn
According to the Woodlawn family income data, there are 15 families falling into the $75,000 to $99,999 income range, which is the most common income bracket and makes up 28.8% of all families.
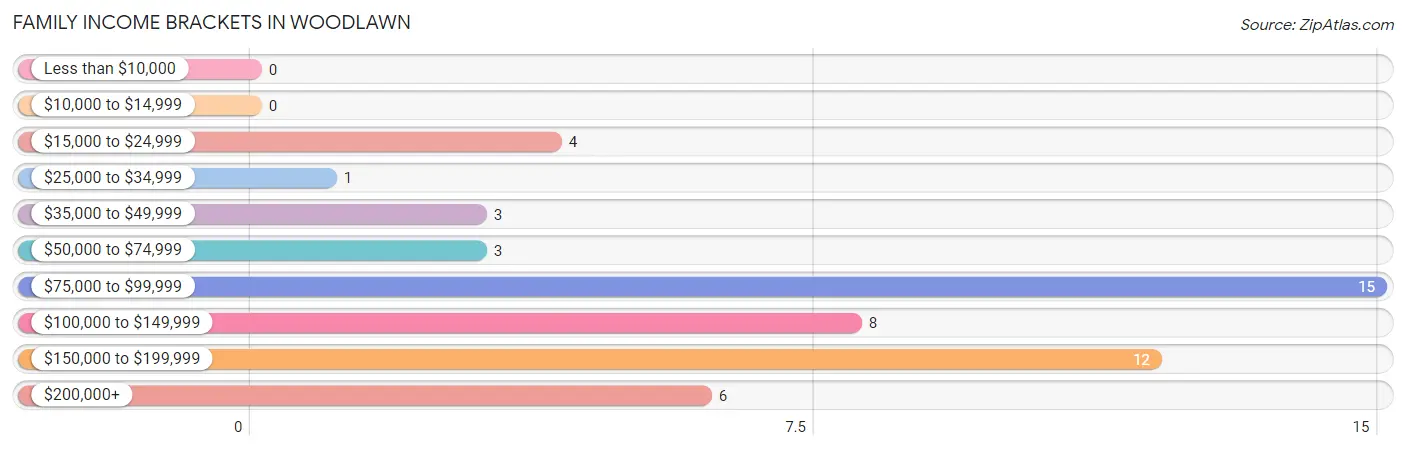
| Income Bracket | # Families | % Families |
| Less than $10,000 | 0 | 0.0% |
| $10,000 to $14,999 | 0 | 0.0% |
| $15,000 to $24,999 | 4 | 7.7% |
| $25,000 to $34,999 | 1 | 1.9% |
| $35,000 to $49,999 | 3 | 5.8% |
| $50,000 to $74,999 | 3 | 5.8% |
| $75,000 to $99,999 | 15 | 28.8% |
| $100,000 to $149,999 | 8 | 15.4% |
| $150,000 to $199,999 | 12 | 23.1% |
| $200,000+ | 6 | 11.5% |
Family Income by Famaliy Size in Woodlawn
3-person families (7 | 13.5%) account for the highest median family income in Woodlawn with $118,125 per family, while 2-person families (32 | 61.5%) have the highest median income of $48,750 per family member.
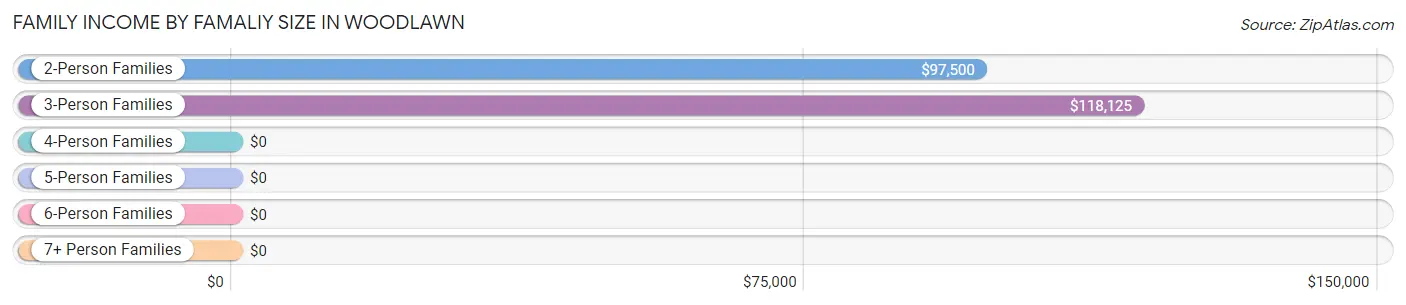
| Income Bracket | # Families | Median Income |
| 2-Person Families | 32 (61.5%) | $97,500 |
| 3-Person Families | 7 (13.5%) | $118,125 |
| 4-Person Families | 2 (3.8%) | $0 |
| 5-Person Families | 11 (21.1%) | $0 |
| 6-Person Families | 0 (0.0%) | $0 |
| 7+ Person Families | 0 (0.0%) | $0 |
| Total | 52 (100.0%) | $102,500 |
Family Income by Number of Earners in Woodlawn
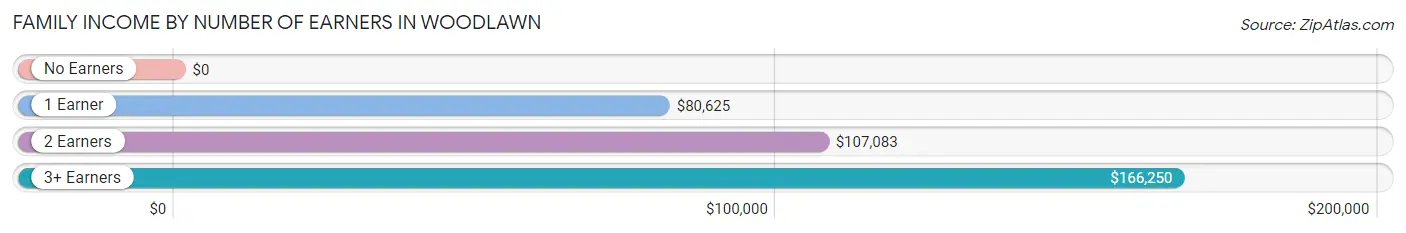
| Number of Earners | # Families | Median Income |
| No Earners | 7 (13.5%) | $0 |
| 1 Earner | 13 (25.0%) | $80,625 |
| 2 Earners | 25 (48.1%) | $107,083 |
| 3+ Earners | 7 (13.5%) | $166,250 |
| Total | 52 (100.0%) | $102,500 |
Household Income in Woodlawn
Household Income Brackets in Woodlawn
With 20 households falling in the category, the $75,000 to $99,999 income range is the most frequent in Woodlawn, accounting for 29.0% of all households.
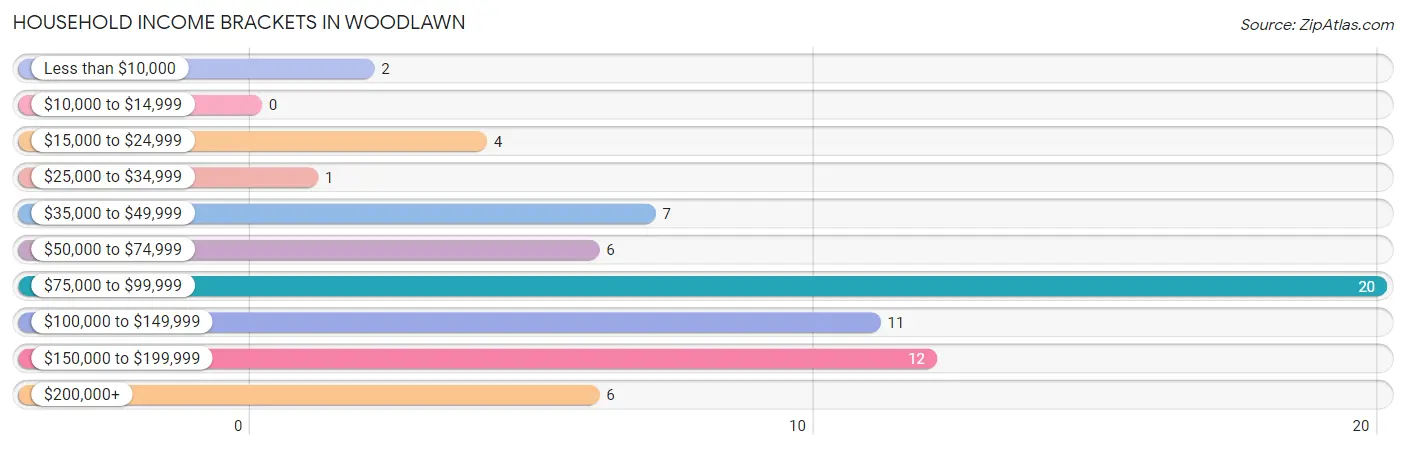
| Income Bracket | # Households | % Households |
| Less than $10,000 | 2 | 2.9% |
| $10,000 to $14,999 | 0 | 0.0% |
| $15,000 to $24,999 | 4 | 5.8% |
| $25,000 to $34,999 | 1 | 1.4% |
| $35,000 to $49,999 | 7 | 10.1% |
| $50,000 to $74,999 | 6 | 8.7% |
| $75,000 to $99,999 | 20 | 29.0% |
| $100,000 to $149,999 | 11 | 15.9% |
| $150,000 to $199,999 | 12 | 17.4% |
| $200,000+ | 6 | 8.7% |
Household Income by Householder Age in Woodlawn
The median household income in Woodlawn is $88,125, with the highest median household income of $105,833 found in the 45 to 64 years age bracket for the primary householder. A total of 32 households (46.4%) fall into this category. Meanwhile, the 15 to 24 years age bracket for the primary householder has the lowest median household income of $0, with 3 households (4.3%) in this group.
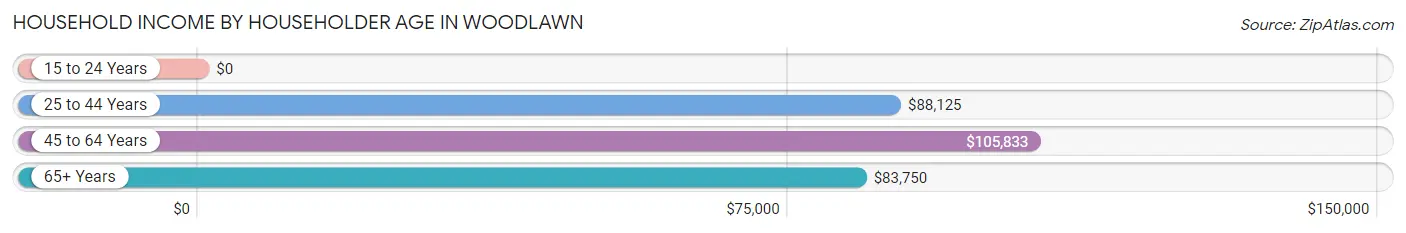
| Income Bracket | # Households | Median Income |
| 15 to 24 Years | 3 (4.3%) | $0 |
| 25 to 44 Years | 21 (30.4%) | $88,125 |
| 45 to 64 Years | 32 (46.4%) | $105,833 |
| 65+ Years | 13 (18.8%) | $83,750 |
| Total | 69 (100.0%) | $88,125 |
Poverty in Woodlawn
Income Below Poverty by Sex and Age in Woodlawn
With 5.6% poverty level for males and 14.6% for females among the residents of Woodlawn, 45 to 54 year old males and under 5 year old females are the most vulnerable to poverty, with 3 males (20.0%) and 2 females (40.0%) in their respective age groups living below the poverty level.
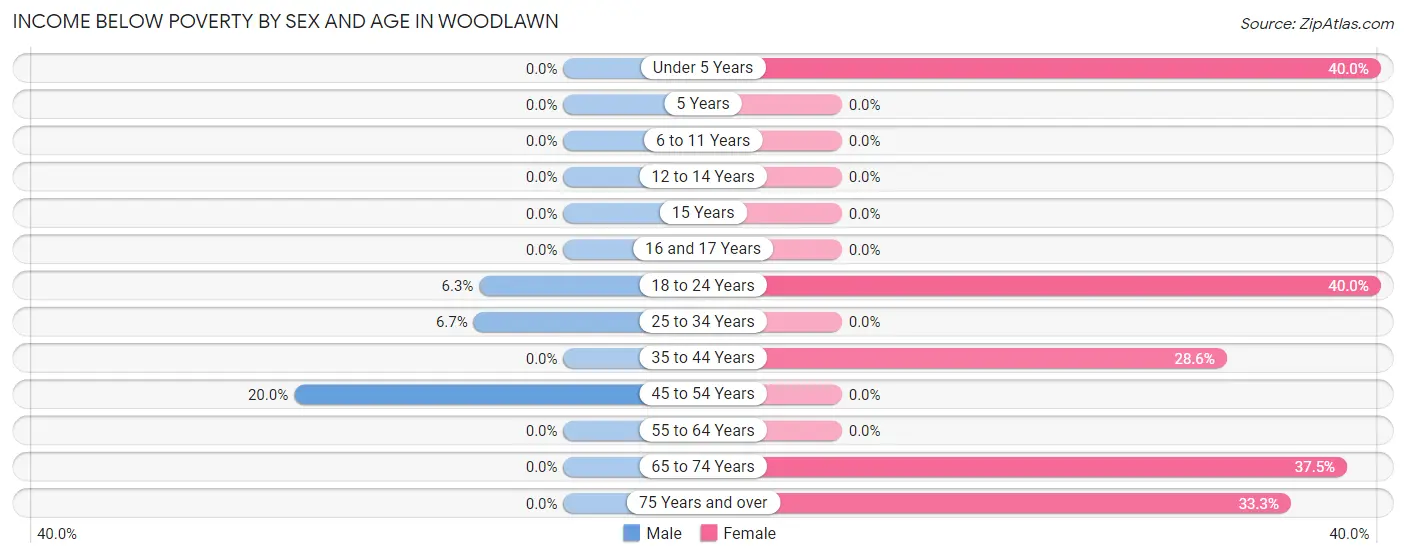
| Age Bracket | Male | Female |
| Under 5 Years | 0 (0.0%) | 2 (40.0%) |
| 5 Years | 0 (0.0%) | 0 (0.0%) |
| 6 to 11 Years | 0 (0.0%) | 0 (0.0%) |
| 12 to 14 Years | 0 (0.0%) | 0 (0.0%) |
| 15 Years | 0 (0.0%) | 0 (0.0%) |
| 16 and 17 Years | 0 (0.0%) | 0 (0.0%) |
| 18 to 24 Years | 1 (6.2%) | 2 (40.0%) |
| 25 to 34 Years | 1 (6.7%) | 0 (0.0%) |
| 35 to 44 Years | 0 (0.0%) | 4 (28.6%) |
| 45 to 54 Years | 3 (20.0%) | 0 (0.0%) |
| 55 to 64 Years | 0 (0.0%) | 0 (0.0%) |
| 65 to 74 Years | 0 (0.0%) | 3 (37.5%) |
| 75 Years and over | 0 (0.0%) | 2 (33.3%) |
| Total | 5 (5.6%) | 13 (14.6%) |
Income Above Poverty by Sex and Age in Woodlawn
According to the poverty statistics in Woodlawn, males aged under 5 years and females aged 6 to 11 years are the age groups that are most secure financially, with 100.0% of males and 100.0% of females in these age groups living above the poverty line.
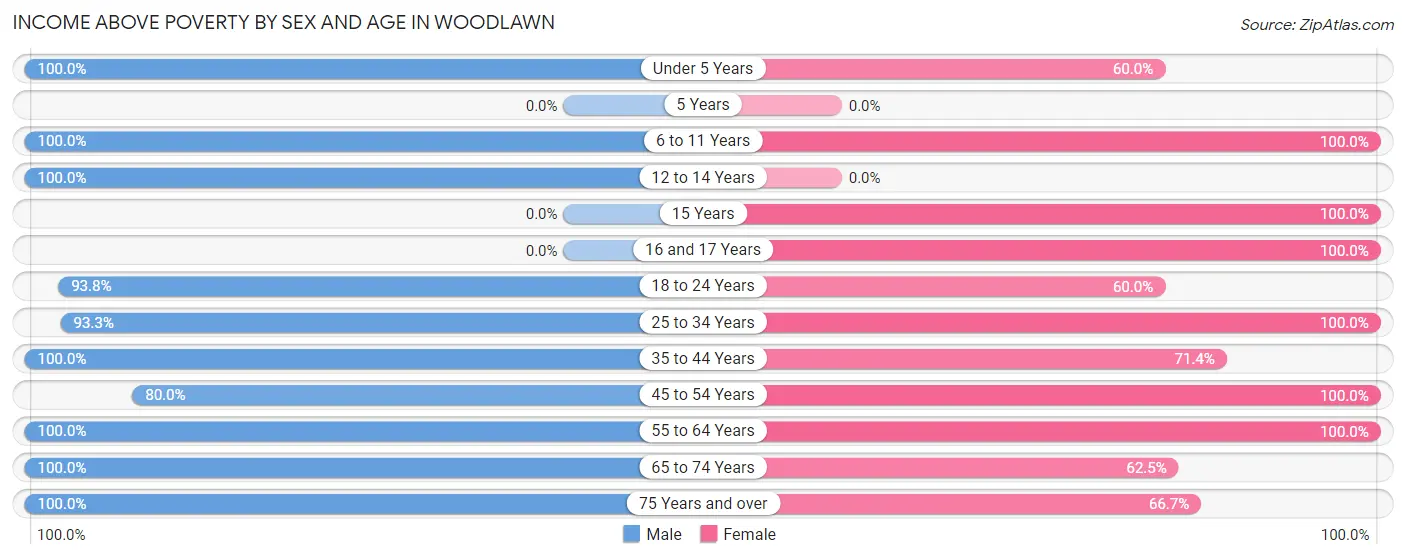
| Age Bracket | Male | Female |
| Under 5 Years | 2 (100.0%) | 3 (60.0%) |
| 5 Years | 0 (0.0%) | 0 (0.0%) |
| 6 to 11 Years | 13 (100.0%) | 5 (100.0%) |
| 12 to 14 Years | 1 (100.0%) | 0 (0.0%) |
| 15 Years | 0 (0.0%) | 2 (100.0%) |
| 16 and 17 Years | 0 (0.0%) | 2 (100.0%) |
| 18 to 24 Years | 15 (93.8%) | 3 (60.0%) |
| 25 to 34 Years | 14 (93.3%) | 16 (100.0%) |
| 35 to 44 Years | 6 (100.0%) | 10 (71.4%) |
| 45 to 54 Years | 12 (80.0%) | 15 (100.0%) |
| 55 to 64 Years | 13 (100.0%) | 11 (100.0%) |
| 65 to 74 Years | 5 (100.0%) | 5 (62.5%) |
| 75 Years and over | 4 (100.0%) | 4 (66.7%) |
| Total | 85 (94.4%) | 76 (85.4%) |
Income Below Poverty Among Married-Couple Families in Woodlawn
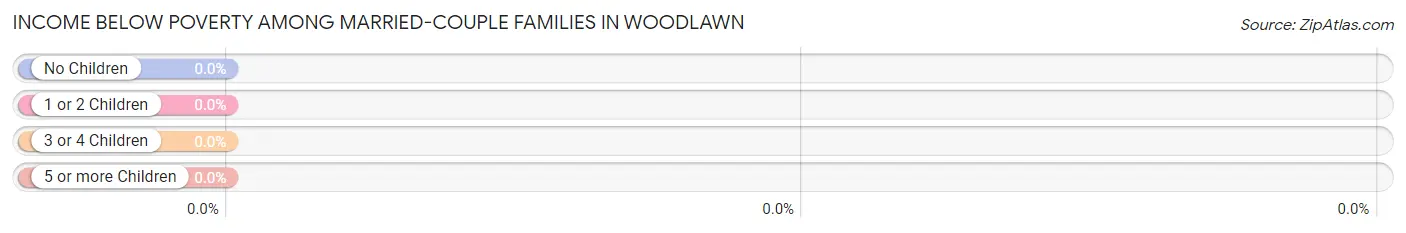
| Children | Above Poverty | Below Poverty |
| No Children | 31 (100.0%) | 0 (0.0%) |
| 1 or 2 Children | 5 (100.0%) | 0 (0.0%) |
| 3 or 4 Children | 0 (0.0%) | 0 (0.0%) |
| 5 or more Children | 0 (0.0%) | 0 (0.0%) |
| Total | 36 (100.0%) | 0 (0.0%) |
Income Below Poverty Among Single-Parent Households in Woodlawn
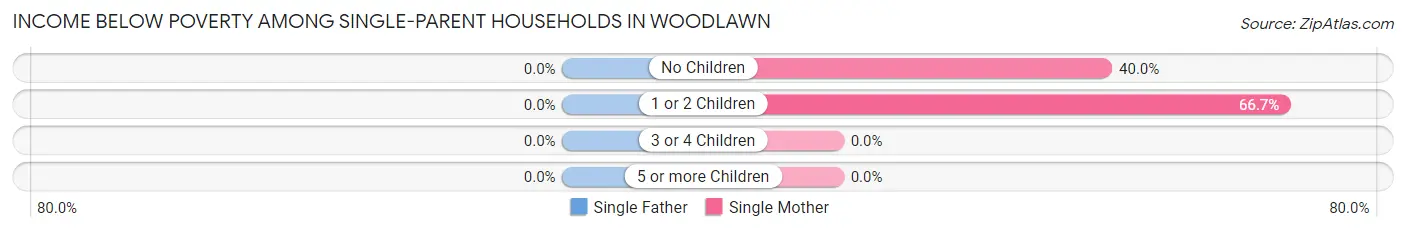
| Children | Single Father | Single Mother |
| No Children | 0 (0.0%) | 2 (40.0%) |
| 1 or 2 Children | 0 (0.0%) | 2 (66.7%) |
| 3 or 4 Children | 0 (0.0%) | 0 (0.0%) |
| 5 or more Children | 0 (0.0%) | 0 (0.0%) |
| Total | 0 (0.0%) | 4 (28.6%) |
Income Below Poverty Among Married-Couple vs Single-Parent Households in Woodlawn
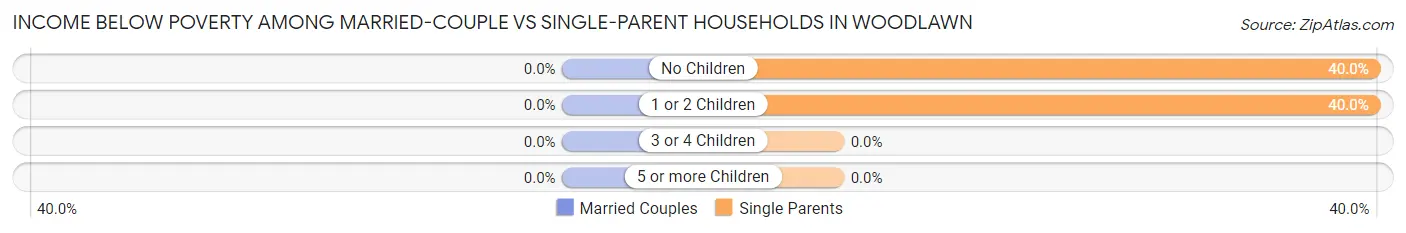
| Children | Married-Couple Families | Single-Parent Households |
| No Children | 0 (0.0%) | 2 (40.0%) |
| 1 or 2 Children | 0 (0.0%) | 2 (40.0%) |
| 3 or 4 Children | 0 (0.0%) | 0 (0.0%) |
| 5 or more Children | 0 (0.0%) | 0 (0.0%) |
| Total | 0 (0.0%) | 4 (25.0%) |
Race in Woodlawn
The most populous races in Woodlawn are White / Caucasian (164 | 91.6%), Two or more Races (6 | 3.4%), and Asian (5 | 2.8%).
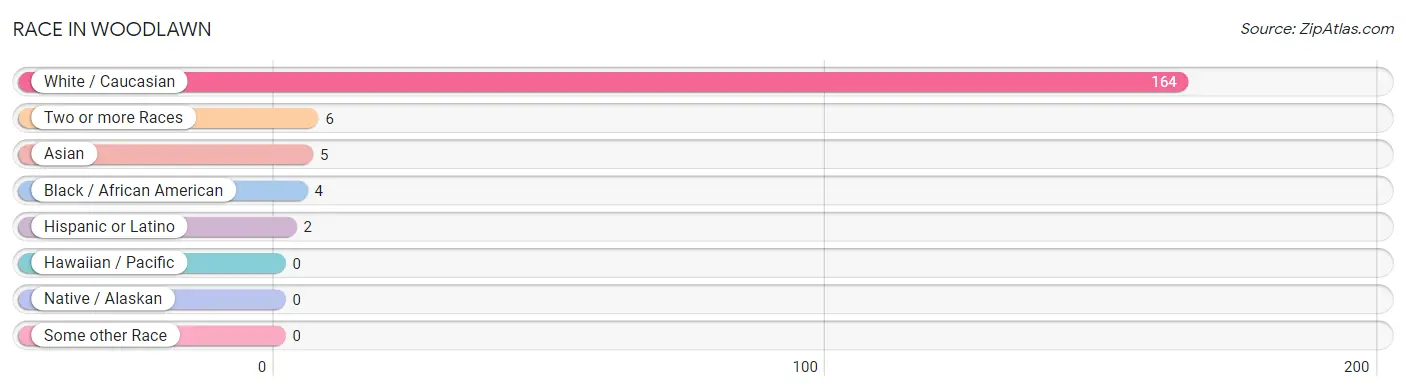
| Race | # Population | % Population |
| Asian | 5 | 2.8% |
| Black / African American | 4 | 2.2% |
| Hawaiian / Pacific | 0 | 0.0% |
| Hispanic or Latino | 2 | 1.1% |
| Native / Alaskan | 0 | 0.0% |
| White / Caucasian | 164 | 91.6% |
| Two or more Races | 6 | 3.4% |
| Some other Race | 0 | 0.0% |
| Total | 179 | 100.0% |
Ancestry in Woodlawn
The most populous ancestries reported in Woodlawn are German (52 | 29.0%), Irish (32 | 17.9%), English (19 | 10.6%), American (14 | 7.8%), and Polish (8 | 4.5%), together accounting for 69.8% of all Woodlawn residents.
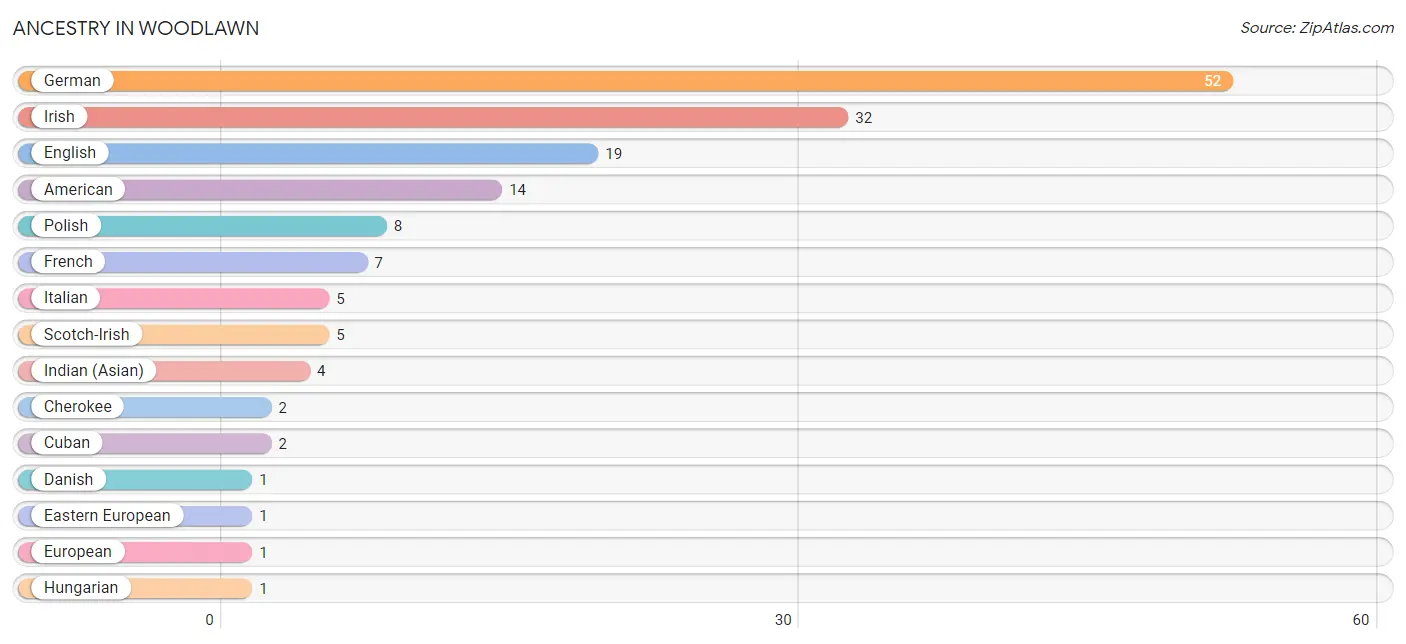
| Ancestry | # Population | % Population |
| American | 14 | 7.8% |
| Cherokee | 2 | 1.1% |
| Cuban | 2 | 1.1% |
| Danish | 1 | 0.6% |
| Eastern European | 1 | 0.6% |
| English | 19 | 10.6% |
| European | 1 | 0.6% |
| French | 7 | 3.9% |
| German | 52 | 29.0% |
| Hungarian | 1 | 0.6% |
| Indian (Asian) | 4 | 2.2% |
| Irish | 32 | 17.9% |
| Italian | 5 | 2.8% |
| Pakistani | 1 | 0.6% |
| Polish | 8 | 4.5% |
| Scotch-Irish | 5 | 2.8% | View All 16 Rows |
Immigrants in Woodlawn
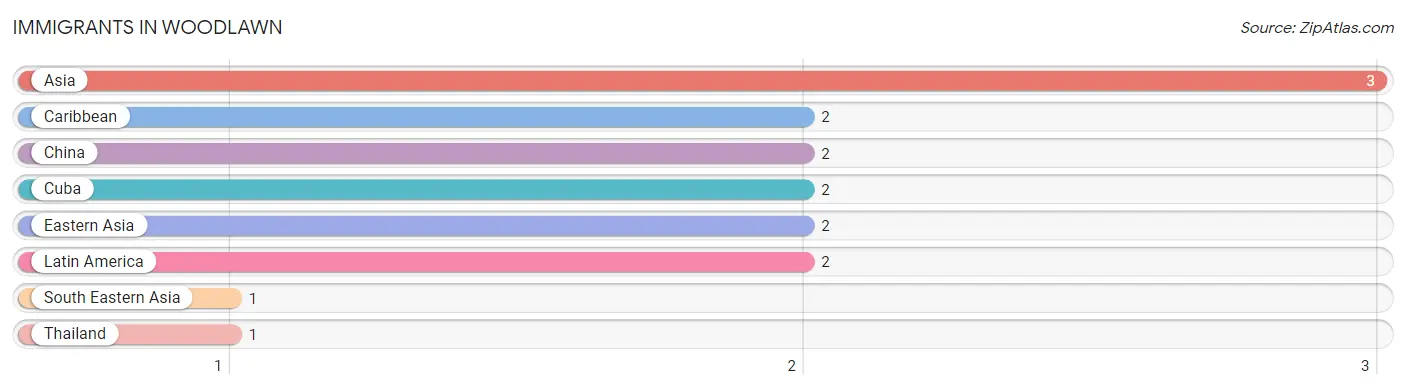
The most numerous immigrant groups reported in Woodlawn came from Asia (3 | 1.7%), Caribbean (2 | 1.1%), China (2 | 1.1%), Cuba (2 | 1.1%), and Eastern Asia (2 | 1.1%), together accounting for 6.2% of all Woodlawn residents.
| Immigration Origin | # Population | % Population |
| Asia | 3 | 1.7% |
| Caribbean | 2 | 1.1% |
| China | 2 | 1.1% |
| Cuba | 2 | 1.1% |
| Eastern Asia | 2 | 1.1% |
| Latin America | 2 | 1.1% |
| South Eastern Asia | 1 | 0.6% |
| Thailand | 1 | 0.6% | View All 8 Rows |
Sex and Age in Woodlawn
Sex and Age in Woodlawn
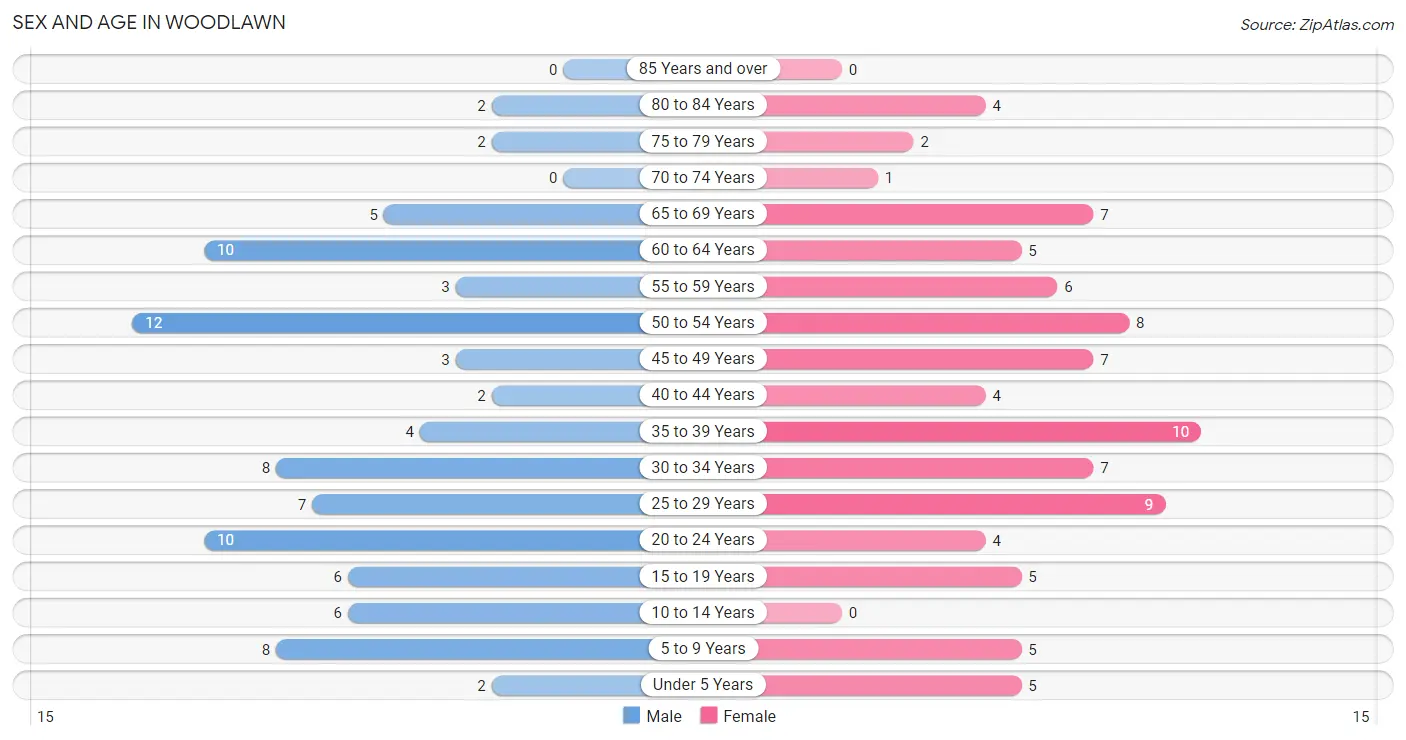
The most populous age groups in Woodlawn are 50 to 54 Years (12 | 13.3%) for men and 35 to 39 Years (10 | 11.2%) for women.
| Age Bracket | Male | Female |
| Under 5 Years | 2 (2.2%) | 5 (5.6%) |
| 5 to 9 Years | 8 (8.9%) | 5 (5.6%) |
| 10 to 14 Years | 6 (6.7%) | 0 (0.0%) |
| 15 to 19 Years | 6 (6.7%) | 5 (5.6%) |
| 20 to 24 Years | 10 (11.1%) | 4 (4.5%) |
| 25 to 29 Years | 7 (7.8%) | 9 (10.1%) |
| 30 to 34 Years | 8 (8.9%) | 7 (7.9%) |
| 35 to 39 Years | 4 (4.4%) | 10 (11.2%) |
| 40 to 44 Years | 2 (2.2%) | 4 (4.5%) |
| 45 to 49 Years | 3 (3.3%) | 7 (7.9%) |
| 50 to 54 Years | 12 (13.3%) | 8 (9.0%) |
| 55 to 59 Years | 3 (3.3%) | 6 (6.7%) |
| 60 to 64 Years | 10 (11.1%) | 5 (5.6%) |
| 65 to 69 Years | 5 (5.6%) | 7 (7.9%) |
| 70 to 74 Years | 0 (0.0%) | 1 (1.1%) |
| 75 to 79 Years | 2 (2.2%) | 2 (2.2%) |
| 80 to 84 Years | 2 (2.2%) | 4 (4.5%) |
| 85 Years and over | 0 (0.0%) | 0 (0.0%) |
| Total | 90 (100.0%) | 89 (100.0%) |
Families and Households in Woodlawn
Median Family Size in Woodlawn
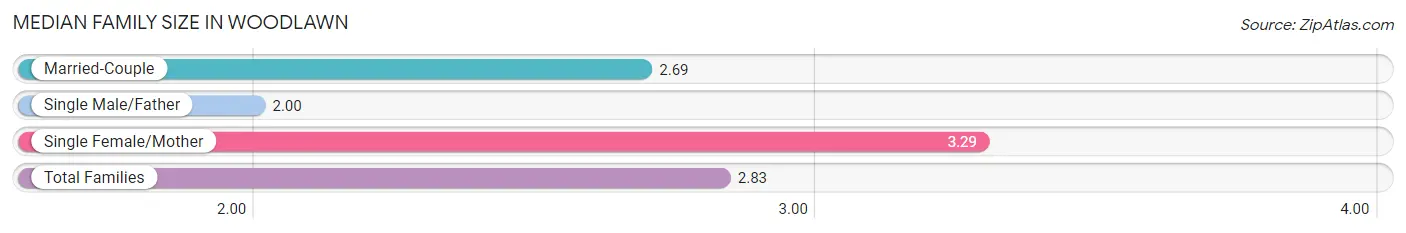
The median family size in Woodlawn is 2.83 persons per family, with single female/mother families (14 | 26.9%) accounting for the largest median family size of 3.29 persons per family. On the other hand, single male/father families (2 | 3.8%) represent the smallest median family size with 2.00 persons per family.
| Family Type | # Families | Family Size |
| Married-Couple | 36 (69.2%) | 2.69 |
| Single Male/Father | 2 (3.8%) | 2.00 |
| Single Female/Mother | 14 (26.9%) | 3.29 |
| Total Families | 52 (100.0%) | 2.83 |
Median Household Size in Woodlawn
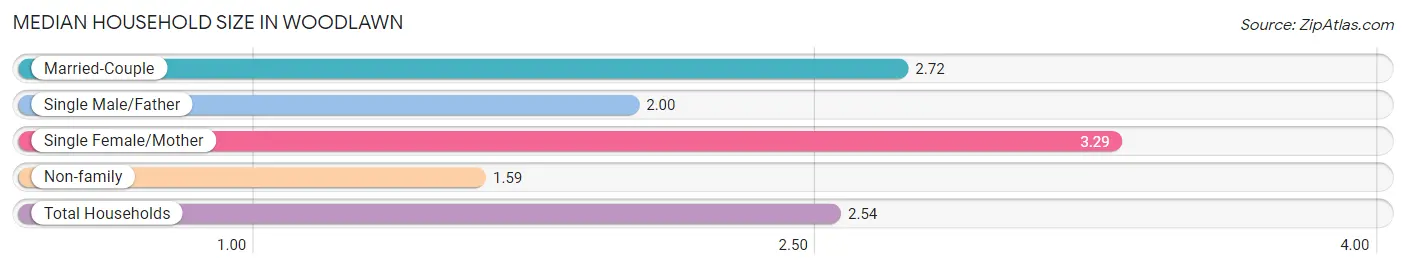
The median household size in Woodlawn is 2.54 persons per household, with single female/mother households (14 | 20.3%) accounting for the largest median household size of 3.29 persons per household. non-family households (17 | 24.6%) represent the smallest median household size with 1.59 persons per household.
| Household Type | # Households | Household Size |
| Married-Couple | 36 (52.2%) | 2.72 |
| Single Male/Father | 2 (2.9%) | 2.00 |
| Single Female/Mother | 14 (20.3%) | 3.29 |
| Non-family | 17 (24.6%) | 1.59 |
| Total Households | 69 (100.0%) | 2.54 |
Household Size by Marriage Status in Woodlawn
Out of a total of 69 households in Woodlawn, 52 (75.4%) are family households, while 17 (24.6%) are nonfamily households. The most numerous type of family households are 2-person households, comprising 32, and the most common type of nonfamily households are 2-person households, comprising 10.
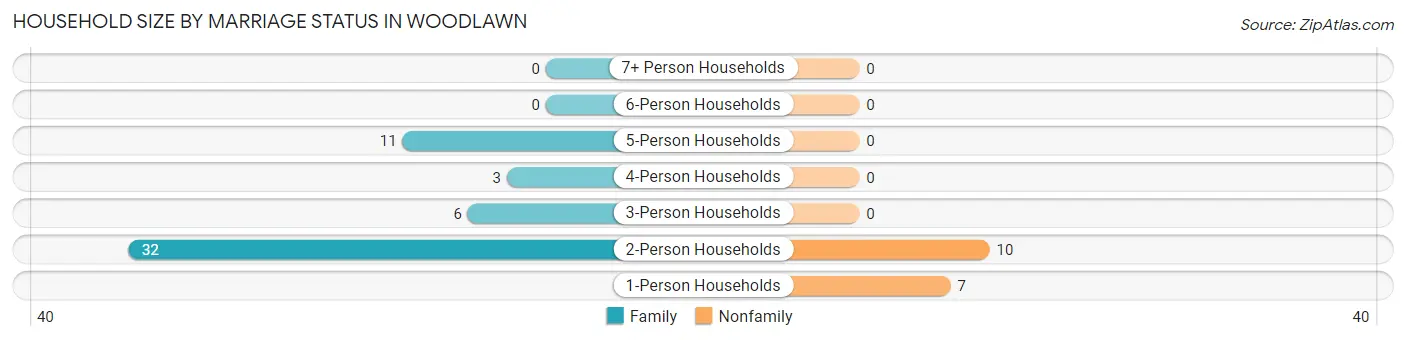
| Household Size | Family Households | Nonfamily Households |
| 1-Person Households | - | 7 (10.1%) |
| 2-Person Households | 32 (46.4%) | 10 (14.5%) |
| 3-Person Households | 6 (8.7%) | 0 (0.0%) |
| 4-Person Households | 3 (4.3%) | 0 (0.0%) |
| 5-Person Households | 11 (15.9%) | 0 (0.0%) |
| 6-Person Households | 0 (0.0%) | 0 (0.0%) |
| 7+ Person Households | 0 (0.0%) | 0 (0.0%) |
| Total | 52 (75.4%) | 17 (24.6%) |
Female Fertility in Woodlawn
Fertility by Age in Woodlawn
Average fertility rate in Woodlawn is 87.0 births per 1,000 women. Women in the age bracket of 20 to 34 years have the highest fertility rate with 100.0 births per 1,000 women. Women in the age bracket of 20 to 34 years acount for 50.0% of all women with births.
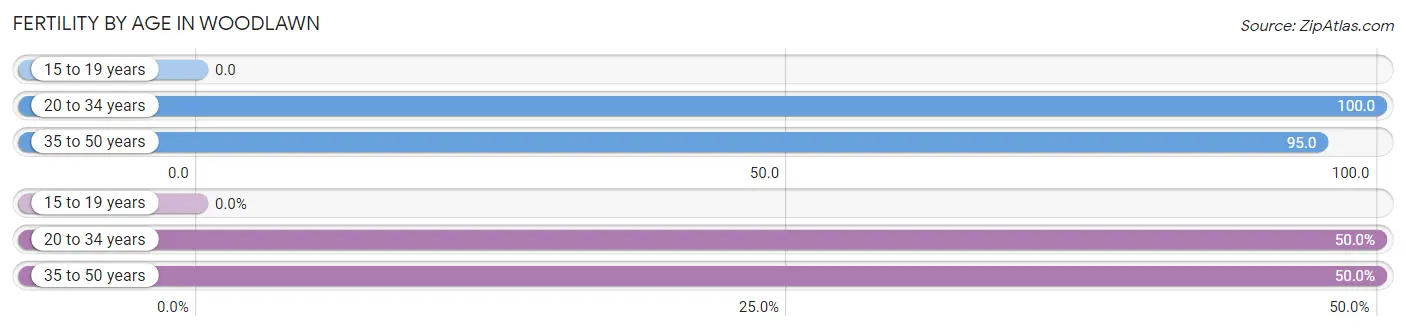
| Age Bracket | Women with Births | Births / 1,000 Women |
| 15 to 19 years | 0 (0.0%) | 0.0 |
| 20 to 34 years | 2 (50.0%) | 100.0 |
| 35 to 50 years | 2 (50.0%) | 95.0 |
| Total | 4 (100.0%) | 87.0 |
Fertility by Age by Marriage Status in Woodlawn
50.0% of women with births (4) in Woodlawn are married. The highest percentage of unmarried women with births falls into 20 to 34 years age bracket with 100.0% of them unmarried at the time of birth, while the lowest percentage of unmarried women with births belong to 35 to 50 years age bracket with 0.0% of them unmarried.
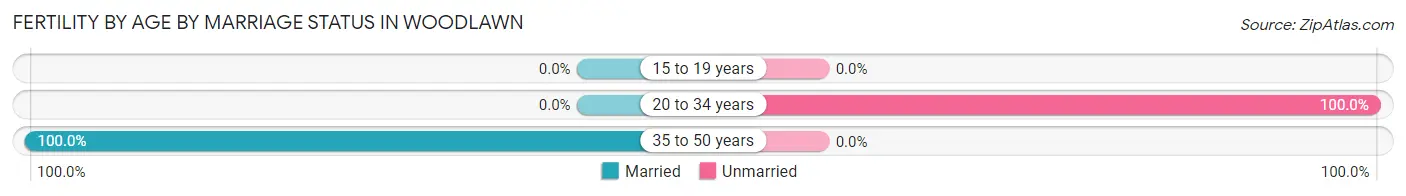
| Age Bracket | Married | Unmarried |
| 15 to 19 years | 0 (0.0%) | 0 (0.0%) |
| 20 to 34 years | 0 (0.0%) | 2 (100.0%) |
| 35 to 50 years | 2 (100.0%) | 0 (0.0%) |
| Total | 2 (50.0%) | 2 (50.0%) |
Fertility by Education in Woodlawn
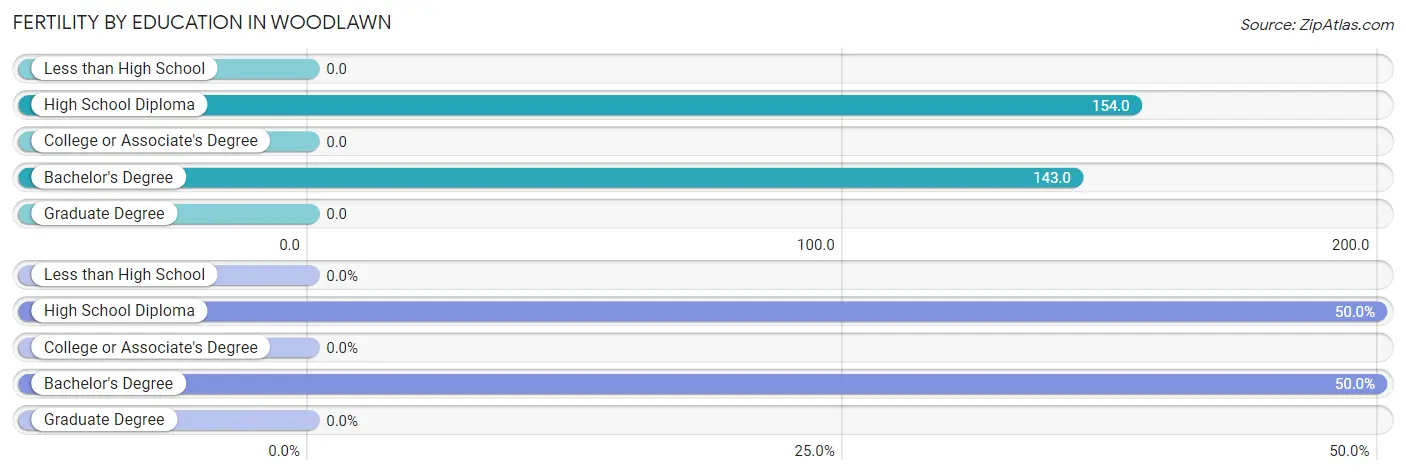
| Educational Attainment | Women with Births | Births / 1,000 Women |
| Less than High School | 0 (0.0%) | 0.0 |
| High School Diploma | 2 (50.0%) | 154.0 |
| College or Associate's Degree | 0 (0.0%) | 0.0 |
| Bachelor's Degree | 2 (50.0%) | 143.0 |
| Graduate Degree | 0 (0.0%) | 0.0 |
| Total | 4 (100.0%) | 87.0 |
Fertility by Education by Marriage Status in Woodlawn
50.0% of women with births in Woodlawn are unmarried. Women with the educational attainment of bachelor's degree are most likely to be married with 100.0% of them married at childbirth, while women with the educational attainment of high school diploma are least likely to be married with 100.0% of them unmarried at childbirth.
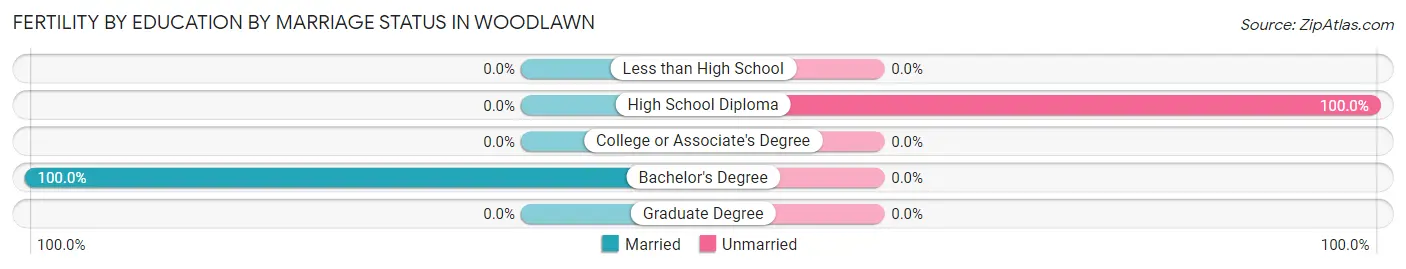
| Educational Attainment | Married | Unmarried |
| Less than High School | 0 (0.0%) | 0 (0.0%) |
| High School Diploma | 0 (0.0%) | 2 (100.0%) |
| College or Associate's Degree | 0 (0.0%) | 0 (0.0%) |
| Bachelor's Degree | 2 (100.0%) | 0 (0.0%) |
| Graduate Degree | 0 (0.0%) | 0 (0.0%) |
| Total | 2 (50.0%) | 2 (50.0%) |
Employment Characteristics in Woodlawn
Employment by Class of Employer in Woodlawn
Among the 106 employed individuals in Woodlawn, private company employees (78 | 73.6%), not-for-profit organizations (14 | 13.2%), and local government employees (9 | 8.5%) make up the most common classes of employment.
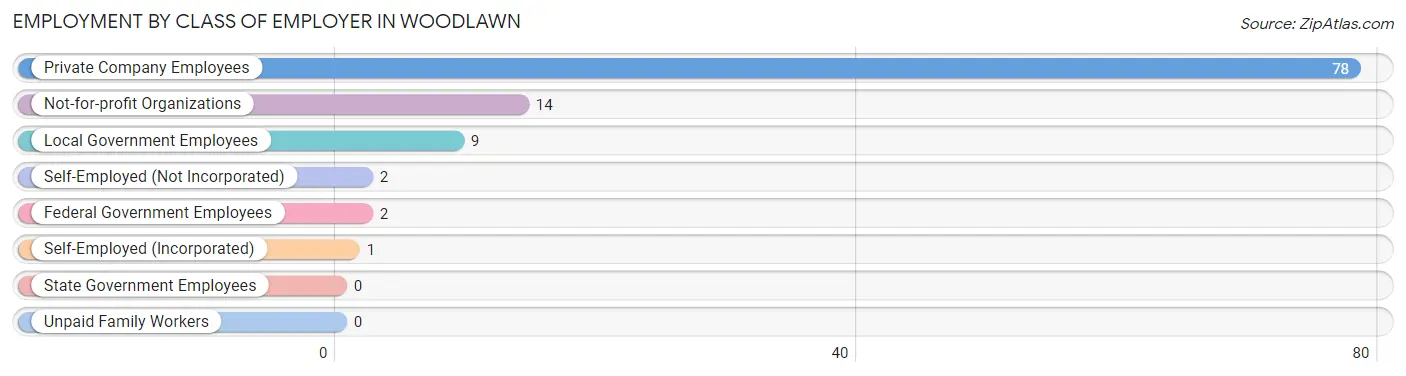
| Employer Class | # Employees | % Employees |
| Private Company Employees | 78 | 73.6% |
| Self-Employed (Incorporated) | 1 | 0.9% |
| Self-Employed (Not Incorporated) | 2 | 1.9% |
| Not-for-profit Organizations | 14 | 13.2% |
| Local Government Employees | 9 | 8.5% |
| State Government Employees | 0 | 0.0% |
| Federal Government Employees | 2 | 1.9% |
| Unpaid Family Workers | 0 | 0.0% |
| Total | 106 | 100.0% |
Employment Status by Age in Woodlawn
According to the labor force statistics for Woodlawn, out of the total population over 16 years of age (151), 75.5% or 114 individuals are in the labor force, with 4.4% or 5 of them unemployed. The age group with the highest labor force participation rate is 16 to 19 years, with 100.0% or 9 individuals in the labor force. Within the labor force, the 60 to 64 years age range has the highest percentage of unemployed individuals, with 21.4% or 3 of them being unemployed.
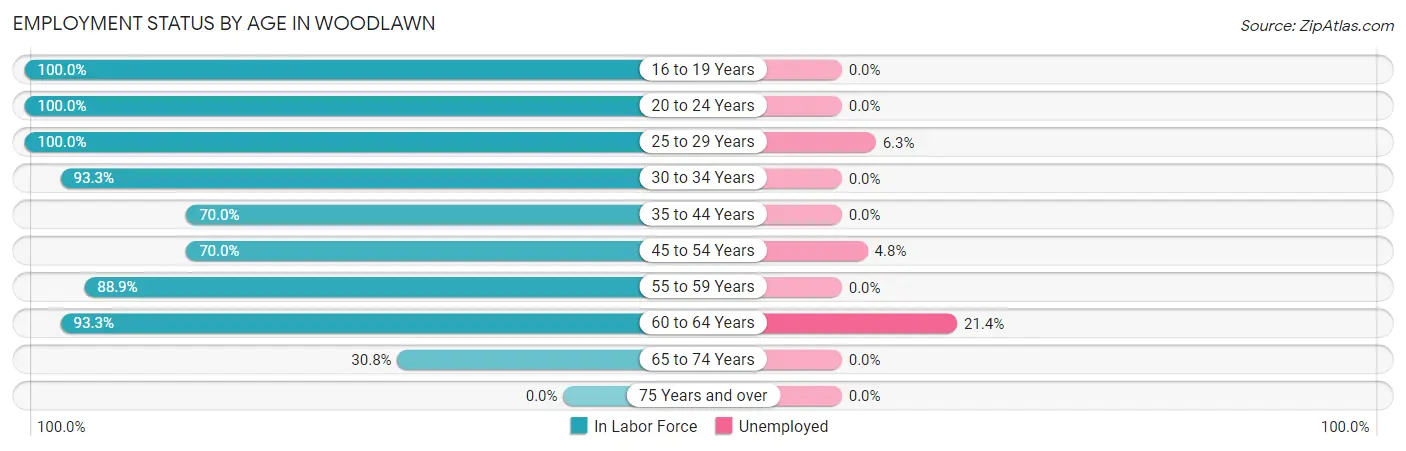
| Age Bracket | In Labor Force | Unemployed |
| 16 to 19 Years | 9 (100.0%) | 0 (0.0%) |
| 20 to 24 Years | 14 (100.0%) | 0 (0.0%) |
| 25 to 29 Years | 16 (100.0%) | 1 (6.3%) |
| 30 to 34 Years | 14 (93.3%) | 0 (0.0%) |
| 35 to 44 Years | 14 (70.0%) | 0 (0.0%) |
| 45 to 54 Years | 21 (70.0%) | 1 (4.8%) |
| 55 to 59 Years | 8 (88.9%) | 0 (0.0%) |
| 60 to 64 Years | 14 (93.3%) | 3 (21.4%) |
| 65 to 74 Years | 4 (30.8%) | 0 (0.0%) |
| 75 Years and over | 0 (0.0%) | 0 (0.0%) |
| Total | 114 (75.5%) | 5 (4.4%) |
Employment Status by Educational Attainment in Woodlawn
According to labor force statistics for Woodlawn, 82.9% of individuals (87) out of the total population between 25 and 64 years of age (105) are in the labor force, with 5.7% or 5 of them being unemployed. The group with the highest labor force participation rate are those with the educational attainment of college / associate degree, with 95.2% or 20 individuals in the labor force. Within the labor force, individuals with less than high school education have the highest percentage of unemployment, with 50.0% or 1 of them being unemployed.
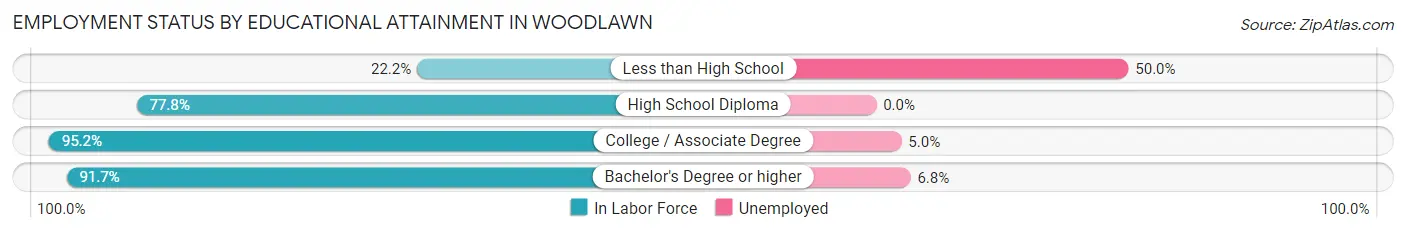
| Educational Attainment | In Labor Force | Unemployed |
| Less than High School | 2 (22.2%) | 4 (50.0%) |
| High School Diploma | 21 (77.8%) | 0 (0.0%) |
| College / Associate Degree | 20 (95.2%) | 1 (5.0%) |
| Bachelor's Degree or higher | 44 (91.7%) | 3 (6.8%) |
| Total | 87 (82.9%) | 6 (5.7%) |
Employment Occupations by Sex in Woodlawn
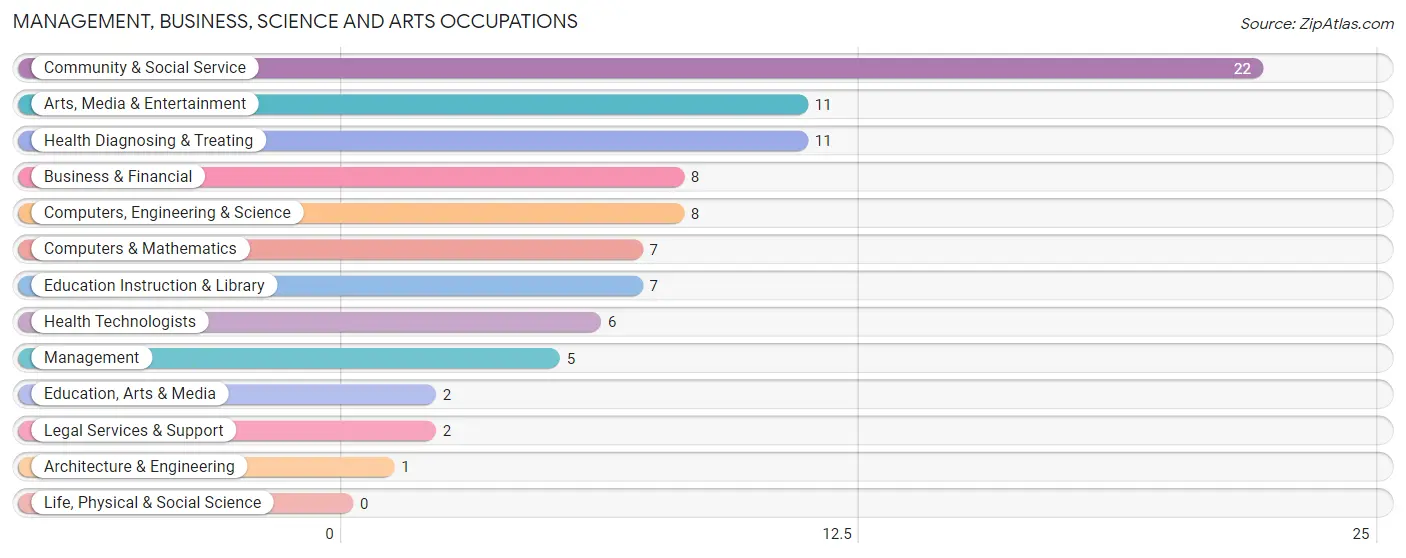
Management, Business, Science and Arts Occupations
The most common Management, Business, Science and Arts occupations in Woodlawn are Community & Social Service (22 | 20.2%), Arts, Media & Entertainment (11 | 10.1%), Health Diagnosing & Treating (11 | 10.1%), Business & Financial (8 | 7.3%), and Computers, Engineering & Science (8 | 7.3%).
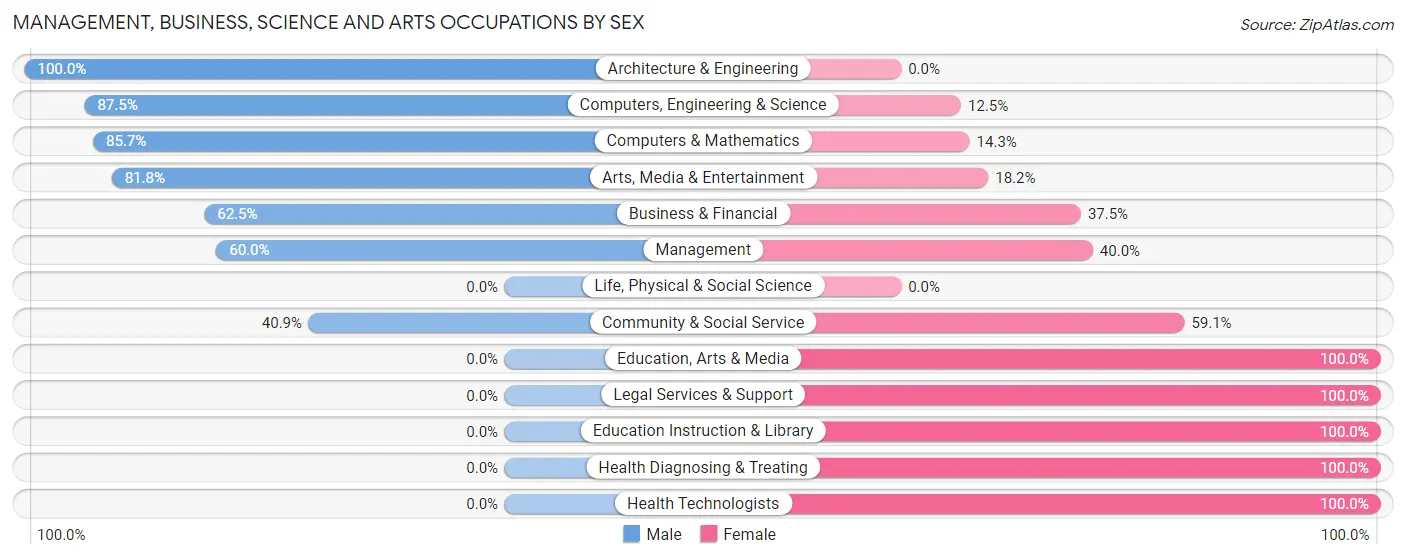
Management, Business, Science and Arts Occupations by Sex
Within the Management, Business, Science and Arts occupations in Woodlawn, the most male-oriented occupations are Architecture & Engineering (100.0%), Computers, Engineering & Science (87.5%), and Computers & Mathematics (85.7%), while the most female-oriented occupations are Education, Arts & Media (100.0%), Legal Services & Support (100.0%), and Education Instruction & Library (100.0%).
| Occupation | Male | Female |
| Management | 3 (60.0%) | 2 (40.0%) |
| Business & Financial | 5 (62.5%) | 3 (37.5%) |
| Computers, Engineering & Science | 7 (87.5%) | 1 (12.5%) |
| Computers & Mathematics | 6 (85.7%) | 1 (14.3%) |
| Architecture & Engineering | 1 (100.0%) | 0 (0.0%) |
| Life, Physical & Social Science | 0 (0.0%) | 0 (0.0%) |
| Community & Social Service | 9 (40.9%) | 13 (59.1%) |
| Education, Arts & Media | 0 (0.0%) | 2 (100.0%) |
| Legal Services & Support | 0 (0.0%) | 2 (100.0%) |
| Education Instruction & Library | 0 (0.0%) | 7 (100.0%) |
| Arts, Media & Entertainment | 9 (81.8%) | 2 (18.2%) |
| Health Diagnosing & Treating | 0 (0.0%) | 11 (100.0%) |
| Health Technologists | 0 (0.0%) | 6 (100.0%) |
| Total (Category) | 24 (44.4%) | 30 (55.6%) |
| Total (Overall) | 57 (52.3%) | 52 (47.7%) |
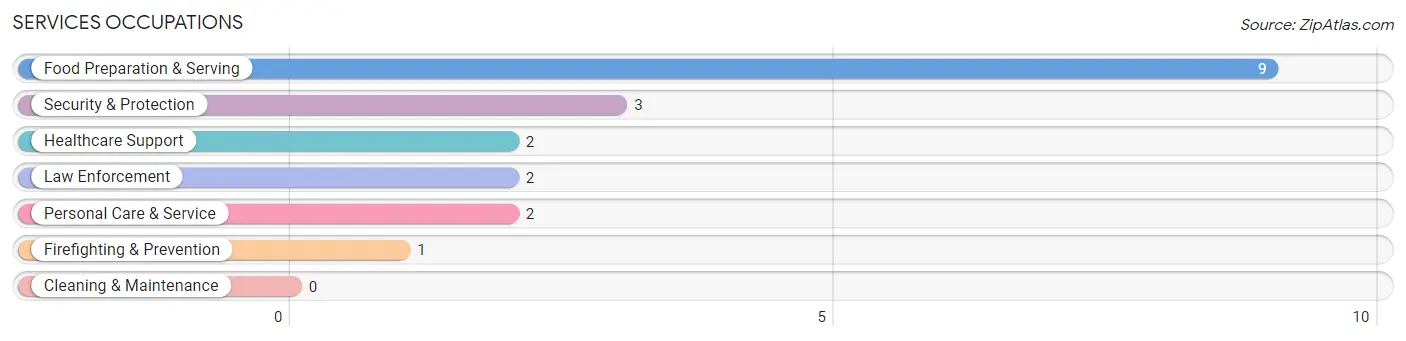
Services Occupations
The most common Services occupations in Woodlawn are Food Preparation & Serving (9 | 8.3%), Security & Protection (3 | 2.8%), Healthcare Support (2 | 1.8%), Law Enforcement (2 | 1.8%), and Personal Care & Service (2 | 1.8%).
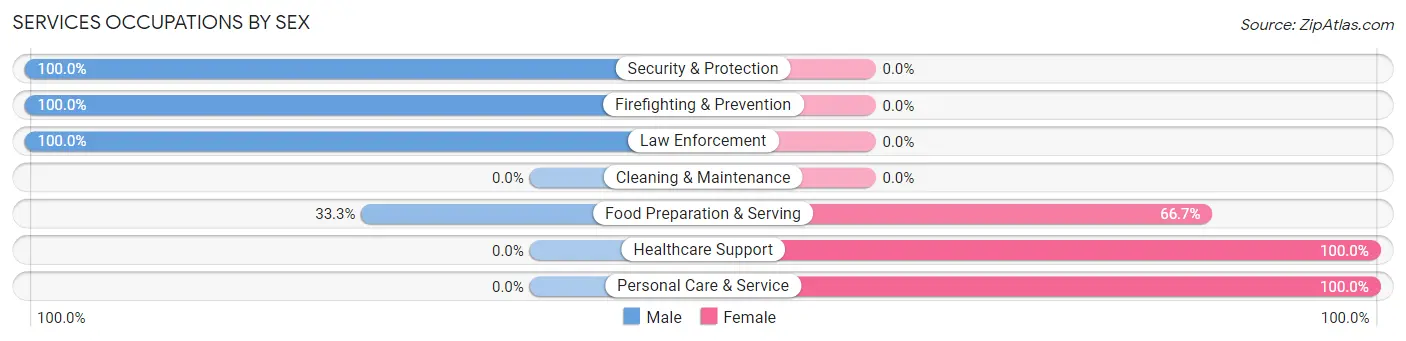
Services Occupations by Sex
Within the Services occupations in Woodlawn, the most male-oriented occupations are Security & Protection (100.0%), Firefighting & Prevention (100.0%), and Law Enforcement (100.0%), while the most female-oriented occupations are Healthcare Support (100.0%), Personal Care & Service (100.0%), and Food Preparation & Serving (66.7%).
| Occupation | Male | Female |
| Healthcare Support | 0 (0.0%) | 2 (100.0%) |
| Security & Protection | 3 (100.0%) | 0 (0.0%) |
| Firefighting & Prevention | 1 (100.0%) | 0 (0.0%) |
| Law Enforcement | 2 (100.0%) | 0 (0.0%) |
| Food Preparation & Serving | 3 (33.3%) | 6 (66.7%) |
| Cleaning & Maintenance | 0 (0.0%) | 0 (0.0%) |
| Personal Care & Service | 0 (0.0%) | 2 (100.0%) |
| Total (Category) | 6 (37.5%) | 10 (62.5%) |
| Total (Overall) | 57 (52.3%) | 52 (47.7%) |
Sales and Office Occupations
The most common Sales and Office occupations in Woodlawn are Office & Administration (7 | 6.4%), and Sales & Related (5 | 4.6%).
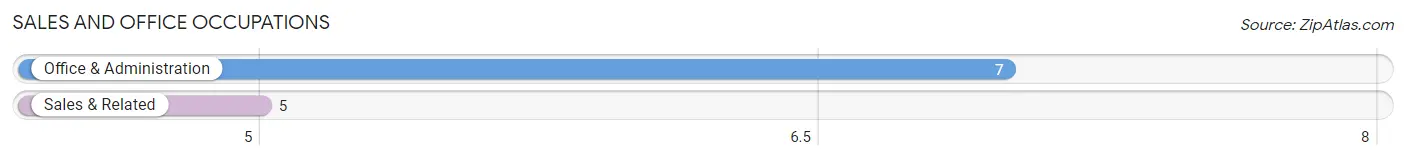
Sales and Office Occupations by Sex
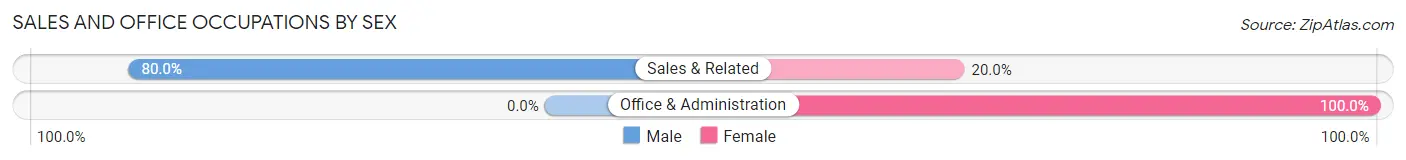
| Occupation | Male | Female |
| Sales & Related | 4 (80.0%) | 1 (20.0%) |
| Office & Administration | 0 (0.0%) | 7 (100.0%) |
| Total (Category) | 4 (33.3%) | 8 (66.7%) |
| Total (Overall) | 57 (52.3%) | 52 (47.7%) |
Natural Resources, Construction and Maintenance Occupations
The most common Natural Resources, Construction and Maintenance occupations in Woodlawn are Construction & Extraction (2 | 1.8%), and Installation, Maintenance & Repair (2 | 1.8%).
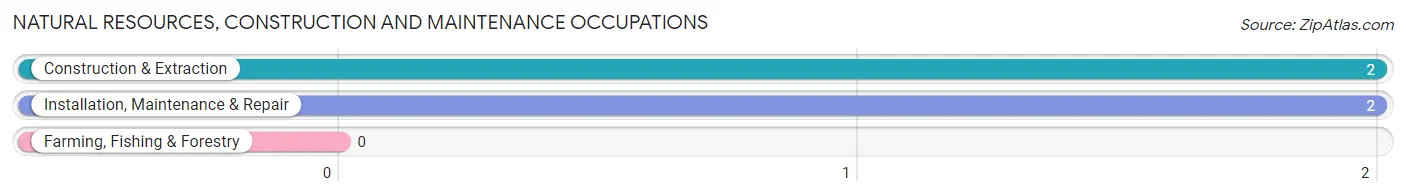
Natural Resources, Construction and Maintenance Occupations by Sex
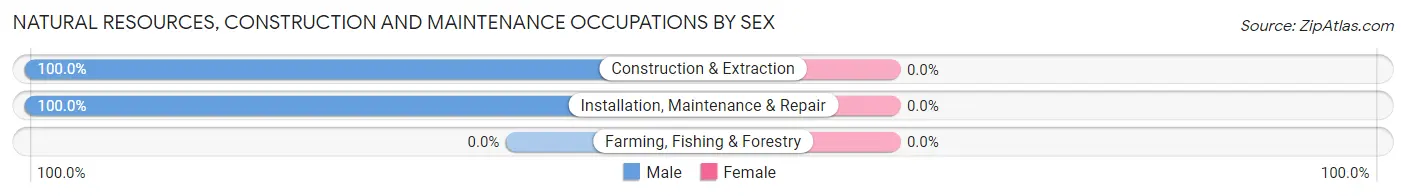
| Occupation | Male | Female |
| Farming, Fishing & Forestry | 0 (0.0%) | 0 (0.0%) |
| Construction & Extraction | 2 (100.0%) | 0 (0.0%) |
| Installation, Maintenance & Repair | 2 (100.0%) | 0 (0.0%) |
| Total (Category) | 4 (100.0%) | 0 (0.0%) |
| Total (Overall) | 57 (52.3%) | 52 (47.7%) |
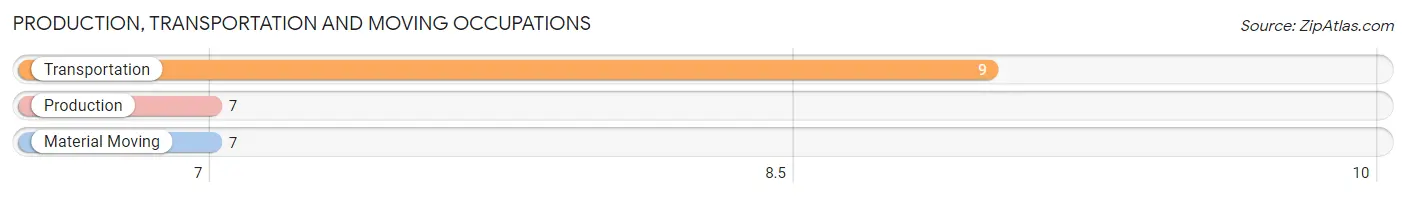
Production, Transportation and Moving Occupations
The most common Production, Transportation and Moving occupations in Woodlawn are Transportation (9 | 8.3%), Production (7 | 6.4%), and Material Moving (7 | 6.4%).
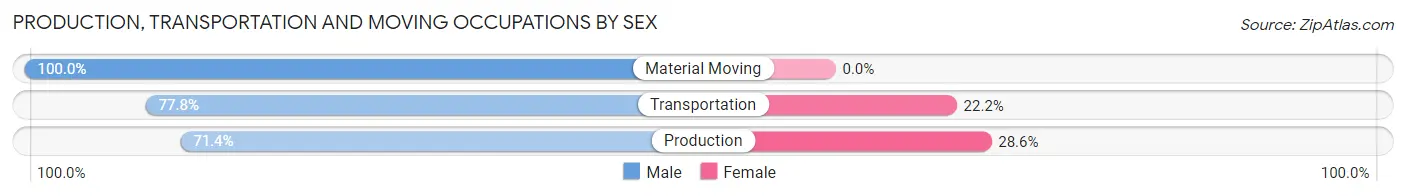
Production, Transportation and Moving Occupations by Sex
| Occupation | Male | Female |
| Production | 5 (71.4%) | 2 (28.6%) |
| Transportation | 7 (77.8%) | 2 (22.2%) |
| Material Moving | 7 (100.0%) | 0 (0.0%) |
| Total (Category) | 19 (82.6%) | 4 (17.4%) |
| Total (Overall) | 57 (52.3%) | 52 (47.7%) |
Employment Industries by Sex in Woodlawn
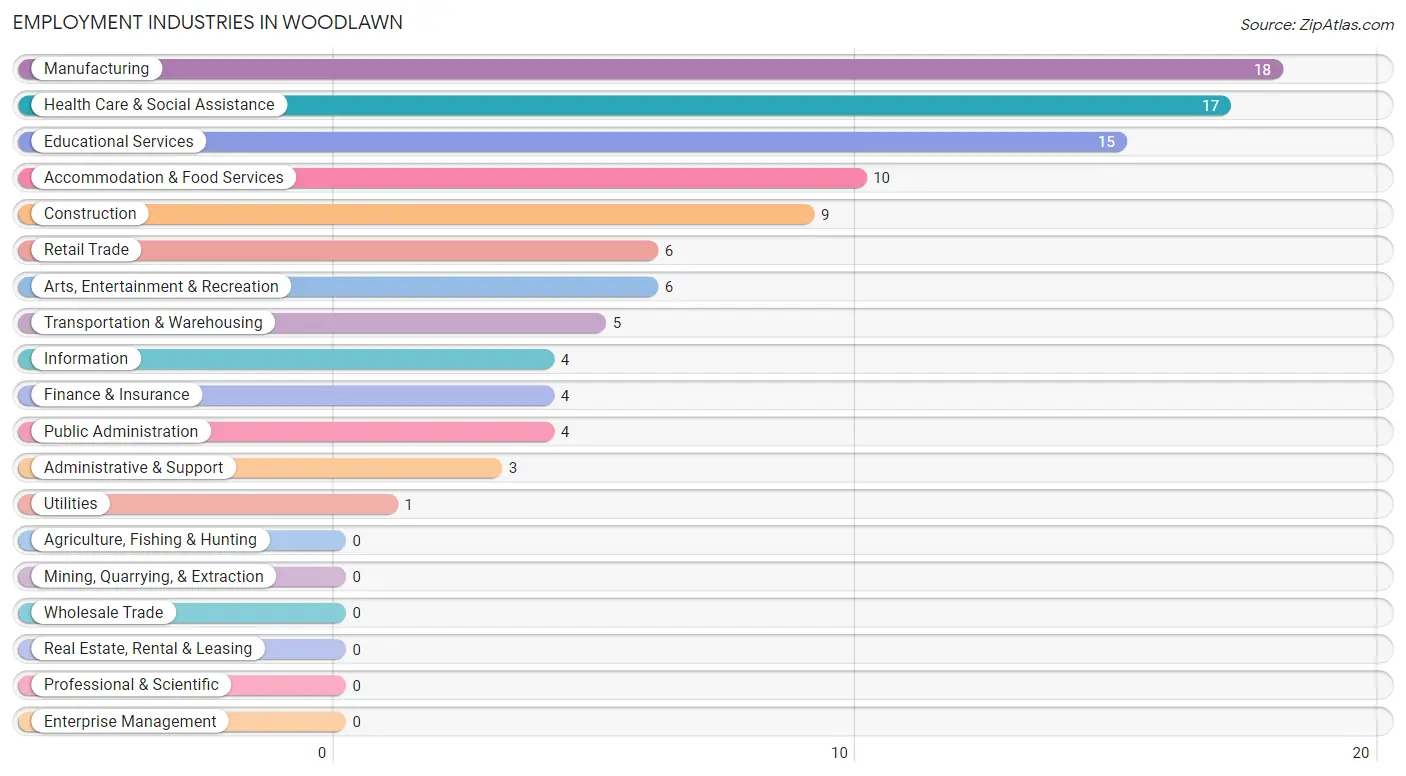
Employment Industries in Woodlawn
The major employment industries in Woodlawn include Manufacturing (18 | 16.5%), Health Care & Social Assistance (17 | 15.6%), Educational Services (15 | 13.8%), Accommodation & Food Services (10 | 9.2%), and Construction (9 | 8.3%).
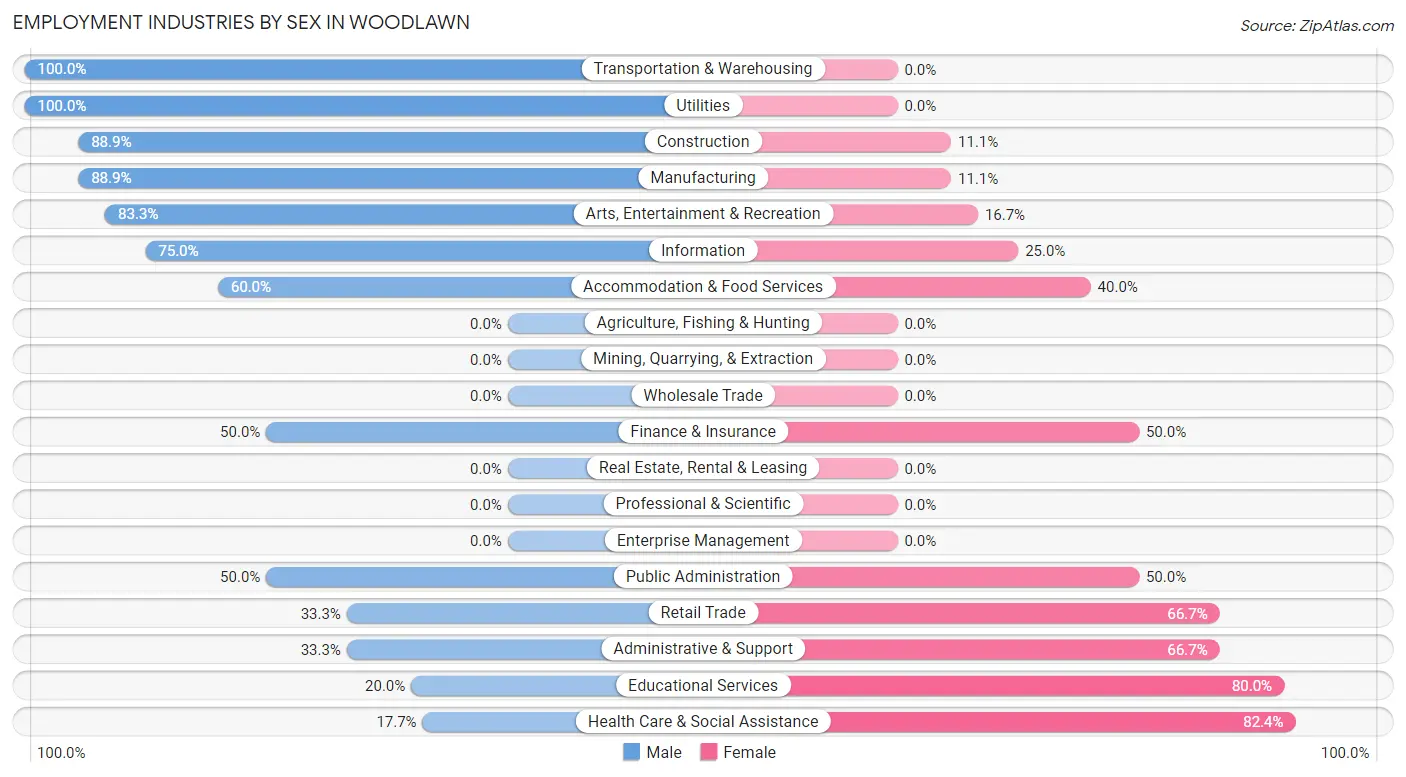
Employment Industries by Sex in Woodlawn
The Woodlawn industries that see more men than women are Transportation & Warehousing (100.0%), Utilities (100.0%), and Construction (88.9%), whereas the industries that tend to have a higher number of women are Health Care & Social Assistance (82.4%), Educational Services (80.0%), and Retail Trade (66.7%).
| Industry | Male | Female |
| Agriculture, Fishing & Hunting | 0 (0.0%) | 0 (0.0%) |
| Mining, Quarrying, & Extraction | 0 (0.0%) | 0 (0.0%) |
| Construction | 8 (88.9%) | 1 (11.1%) |
| Manufacturing | 16 (88.9%) | 2 (11.1%) |
| Wholesale Trade | 0 (0.0%) | 0 (0.0%) |
| Retail Trade | 2 (33.3%) | 4 (66.7%) |
| Transportation & Warehousing | 5 (100.0%) | 0 (0.0%) |
| Utilities | 1 (100.0%) | 0 (0.0%) |
| Information | 3 (75.0%) | 1 (25.0%) |
| Finance & Insurance | 2 (50.0%) | 2 (50.0%) |
| Real Estate, Rental & Leasing | 0 (0.0%) | 0 (0.0%) |
| Professional & Scientific | 0 (0.0%) | 0 (0.0%) |
| Enterprise Management | 0 (0.0%) | 0 (0.0%) |
| Administrative & Support | 1 (33.3%) | 2 (66.7%) |
| Educational Services | 3 (20.0%) | 12 (80.0%) |
| Health Care & Social Assistance | 3 (17.6%) | 14 (82.4%) |
| Arts, Entertainment & Recreation | 5 (83.3%) | 1 (16.7%) |
| Accommodation & Food Services | 6 (60.0%) | 4 (40.0%) |
| Public Administration | 2 (50.0%) | 2 (50.0%) |
| Total | 57 (52.3%) | 52 (47.7%) |
Education in Woodlawn
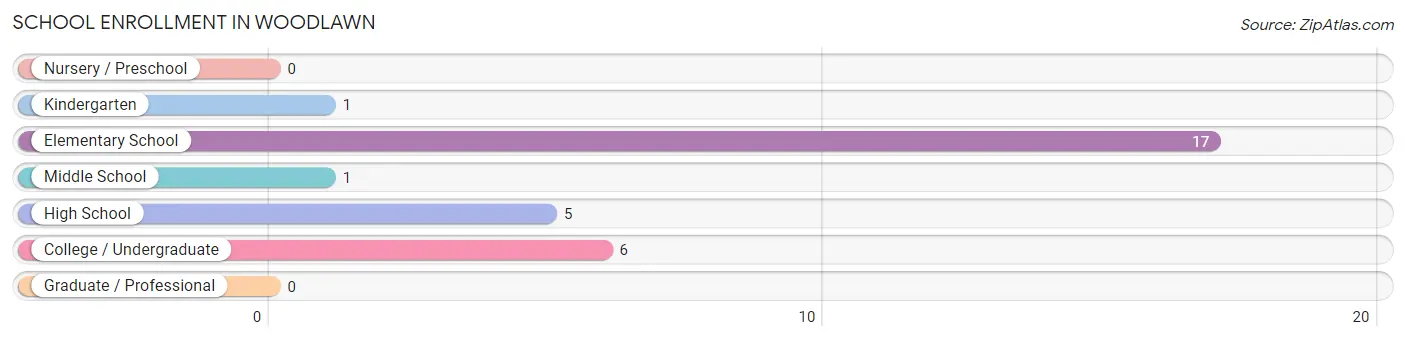
School Enrollment in Woodlawn
The most common levels of schooling among the 30 students in Woodlawn are elementary school (17 | 56.7%), college / undergraduate (6 | 20.0%), and high school (5 | 16.7%).
| School Level | # Students | % Students |
| Nursery / Preschool | 0 | 0.0% |
| Kindergarten | 1 | 3.3% |
| Elementary School | 17 | 56.7% |
| Middle School | 1 | 3.3% |
| High School | 5 | 16.7% |
| College / Undergraduate | 6 | 20.0% |
| Graduate / Professional | 0 | 0.0% |
| Total | 30 | 100.0% |
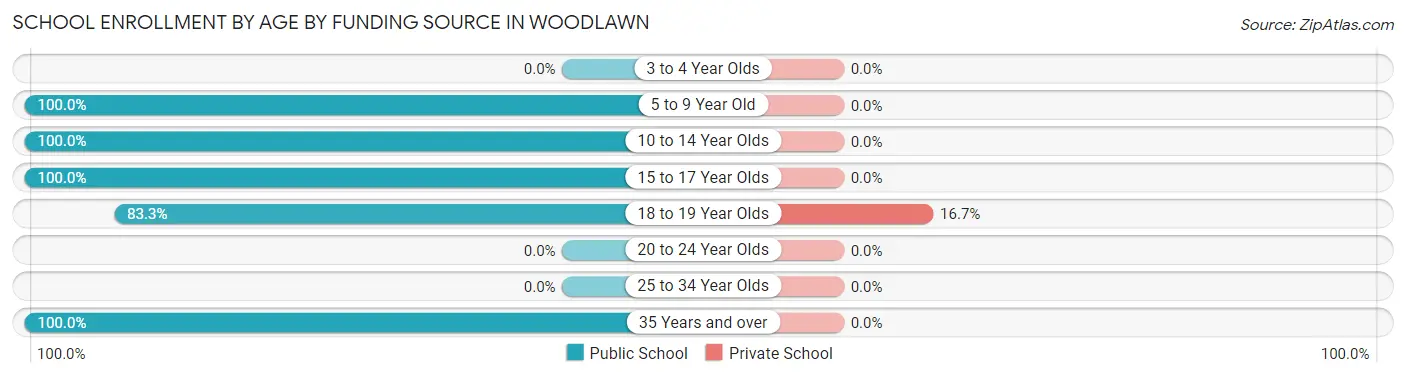
School Enrollment by Age by Funding Source in Woodlawn
Out of a total of 30 students who are enrolled in schools in Woodlawn, 1 (3.3%) attend a private institution, while the remaining 29 (96.7%) are enrolled in public schools. The age group of 18 to 19 year olds has the highest likelihood of being enrolled in private schools, with 1 (16.7% in the age bracket) enrolled. Conversely, the age group of 5 to 9 year old has the lowest likelihood of being enrolled in a private school, with 13 (100.0% in the age bracket) attending a public institution.
| Age Bracket | Public School | Private School |
| 3 to 4 Year Olds | 0 (0.0%) | 0 (0.0%) |
| 5 to 9 Year Old | 13 (100.0%) | 0 (0.0%) |
| 10 to 14 Year Olds | 6 (100.0%) | 0 (0.0%) |
| 15 to 17 Year Olds | 4 (100.0%) | 0 (0.0%) |
| 18 to 19 Year Olds | 5 (83.3%) | 1 (16.7%) |
| 20 to 24 Year Olds | 0 (0.0%) | 0 (0.0%) |
| 25 to 34 Year Olds | 0 (0.0%) | 0 (0.0%) |
| 35 Years and over | 1 (100.0%) | 0 (0.0%) |
| Total | 29 (96.7%) | 1 (3.3%) |
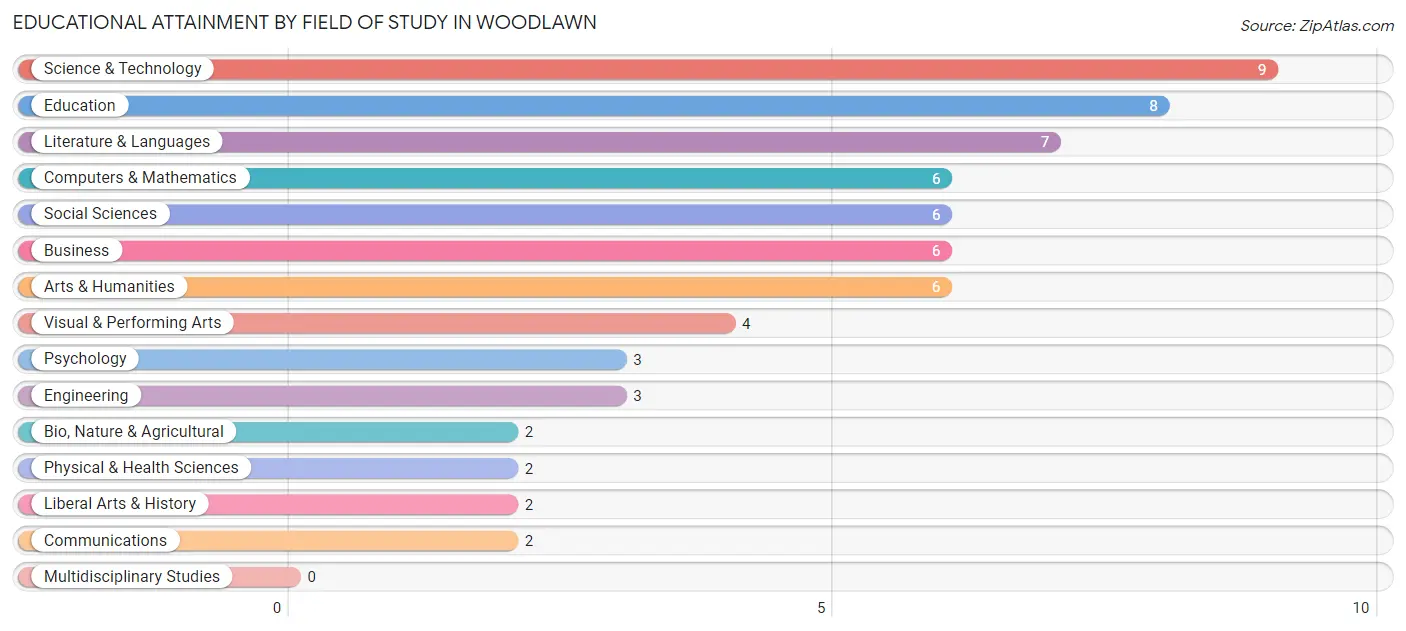
Educational Attainment by Field of Study in Woodlawn
Science & technology (9 | 13.6%), education (8 | 12.1%), literature & languages (7 | 10.6%), computers & mathematics (6 | 9.1%), and social sciences (6 | 9.1%) are the most common fields of study among 66 individuals in Woodlawn who have obtained a bachelor's degree or higher.
| Field of Study | # Graduates | % Graduates |
| Computers & Mathematics | 6 | 9.1% |
| Bio, Nature & Agricultural | 2 | 3.0% |
| Physical & Health Sciences | 2 | 3.0% |
| Psychology | 3 | 4.5% |
| Social Sciences | 6 | 9.1% |
| Engineering | 3 | 4.5% |
| Multidisciplinary Studies | 0 | 0.0% |
| Science & Technology | 9 | 13.6% |
| Business | 6 | 9.1% |
| Education | 8 | 12.1% |
| Literature & Languages | 7 | 10.6% |
| Liberal Arts & History | 2 | 3.0% |
| Visual & Performing Arts | 4 | 6.1% |
| Communications | 2 | 3.0% |
| Arts & Humanities | 6 | 9.1% |
| Total | 66 | 100.0% |
Transportation & Commute in Woodlawn
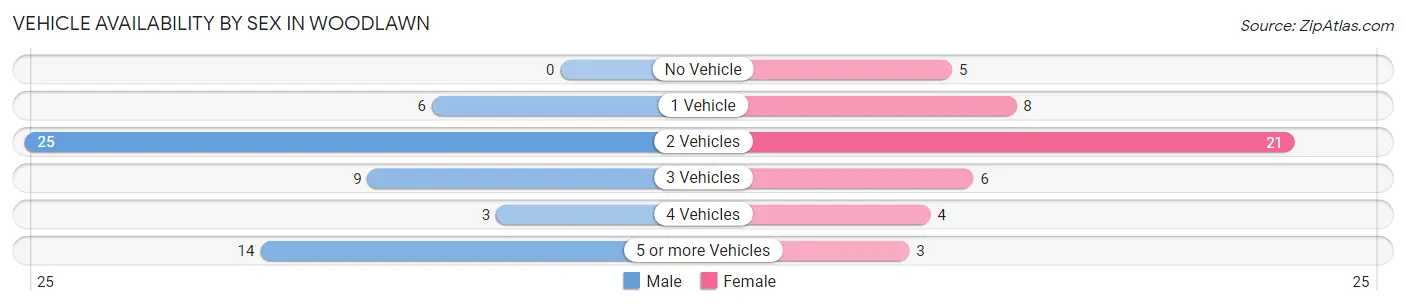
Vehicle Availability by Sex in Woodlawn
The most prevalent vehicle ownership categories in Woodlawn are males with 2 vehicles (25, accounting for 43.9%) and females with 2 vehicles (21, making up 53.2%).
| Vehicles Available | Male | Female |
| No Vehicle | 0 (0.0%) | 5 (10.6%) |
| 1 Vehicle | 6 (10.5%) | 8 (17.0%) |
| 2 Vehicles | 25 (43.9%) | 21 (44.7%) |
| 3 Vehicles | 9 (15.8%) | 6 (12.8%) |
| 4 Vehicles | 3 (5.3%) | 4 (8.5%) |
| 5 or more Vehicles | 14 (24.6%) | 3 (6.4%) |
| Total | 57 (100.0%) | 47 (100.0%) |
Commute Time in Woodlawn
The most frequently occuring commute durations in Woodlawn are 30 to 34 minutes (22 commuters, 22.9%), 15 to 19 minutes (19 commuters, 19.8%), and 20 to 24 minutes (17 commuters, 17.7%).
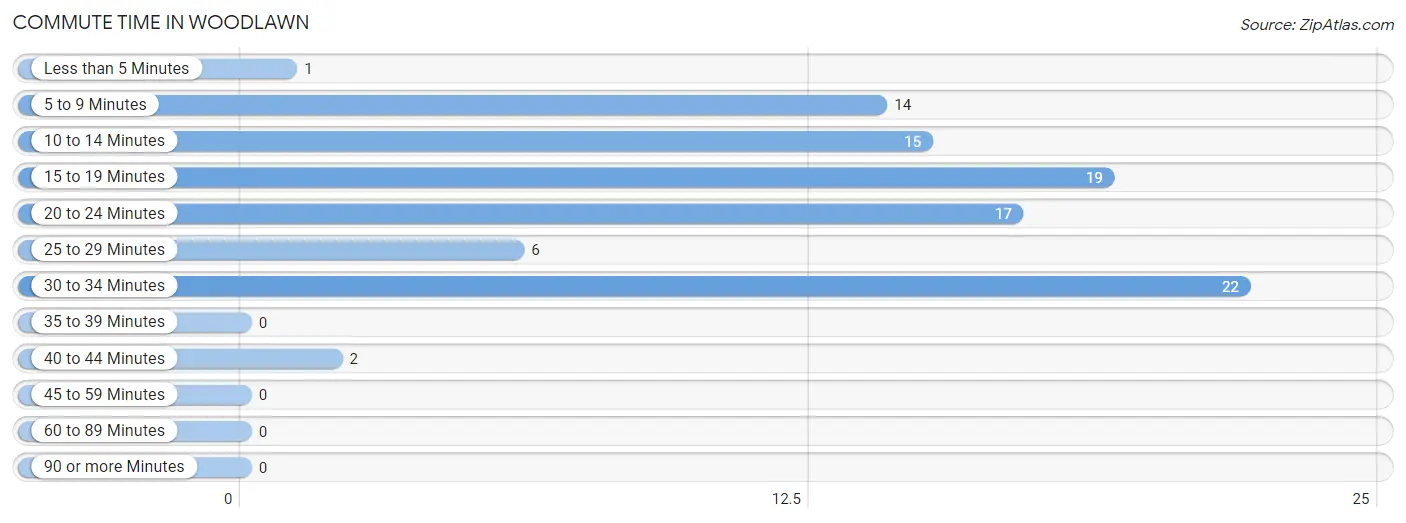
| Commute Time | # Commuters | % Commuters |
| Less than 5 Minutes | 1 | 1.0% |
| 5 to 9 Minutes | 14 | 14.6% |
| 10 to 14 Minutes | 15 | 15.6% |
| 15 to 19 Minutes | 19 | 19.8% |
| 20 to 24 Minutes | 17 | 17.7% |
| 25 to 29 Minutes | 6 | 6.2% |
| 30 to 34 Minutes | 22 | 22.9% |
| 35 to 39 Minutes | 0 | 0.0% |
| 40 to 44 Minutes | 2 | 2.1% |
| 45 to 59 Minutes | 0 | 0.0% |
| 60 to 89 Minutes | 0 | 0.0% |
| 90 or more Minutes | 0 | 0.0% |
Commute Time by Sex in Woodlawn
The most common commute times in Woodlawn are 30 to 34 minutes (14 commuters, 26.9%) for males and 10 to 14 minutes (10 commuters, 22.7%) for females.
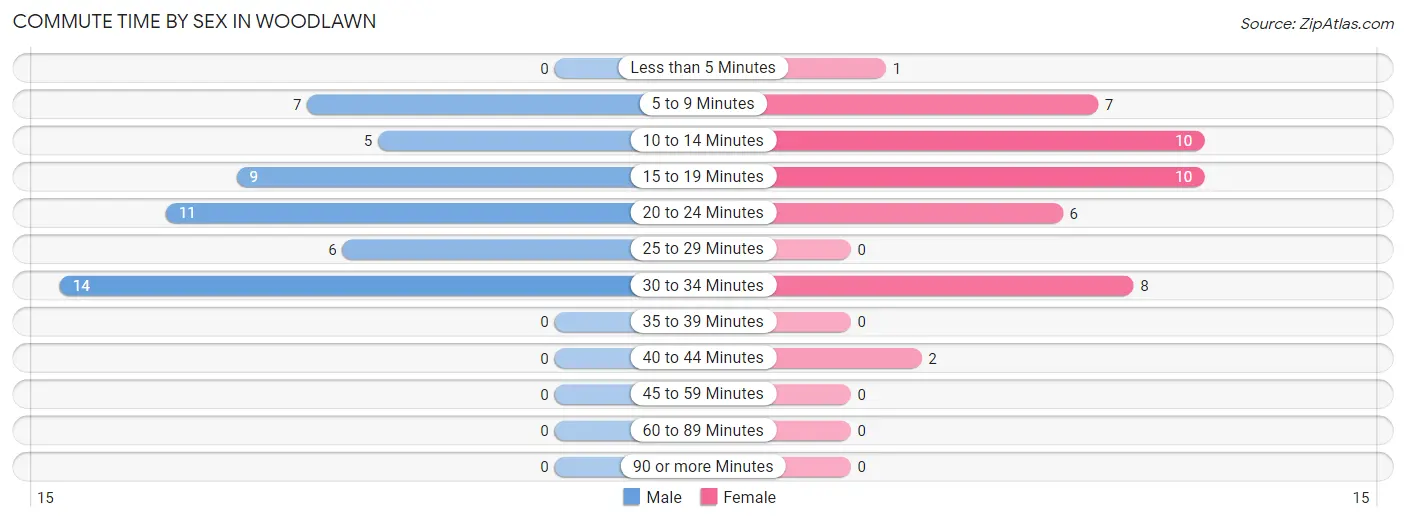
| Commute Time | Male | Female |
| Less than 5 Minutes | 0 (0.0%) | 1 (2.3%) |
| 5 to 9 Minutes | 7 (13.5%) | 7 (15.9%) |
| 10 to 14 Minutes | 5 (9.6%) | 10 (22.7%) |
| 15 to 19 Minutes | 9 (17.3%) | 10 (22.7%) |
| 20 to 24 Minutes | 11 (21.1%) | 6 (13.6%) |
| 25 to 29 Minutes | 6 (11.5%) | 0 (0.0%) |
| 30 to 34 Minutes | 14 (26.9%) | 8 (18.2%) |
| 35 to 39 Minutes | 0 (0.0%) | 0 (0.0%) |
| 40 to 44 Minutes | 0 (0.0%) | 2 (4.5%) |
| 45 to 59 Minutes | 0 (0.0%) | 0 (0.0%) |
| 60 to 89 Minutes | 0 (0.0%) | 0 (0.0%) |
| 90 or more Minutes | 0 (0.0%) | 0 (0.0%) |
Time of Departure to Work by Sex in Woodlawn
The most frequent times of departure to work in Woodlawn are 12:00 PM to 3:59 PM (10, 19.2%) for males and 6:00 AM to 6:29 AM (10, 22.7%) for females.
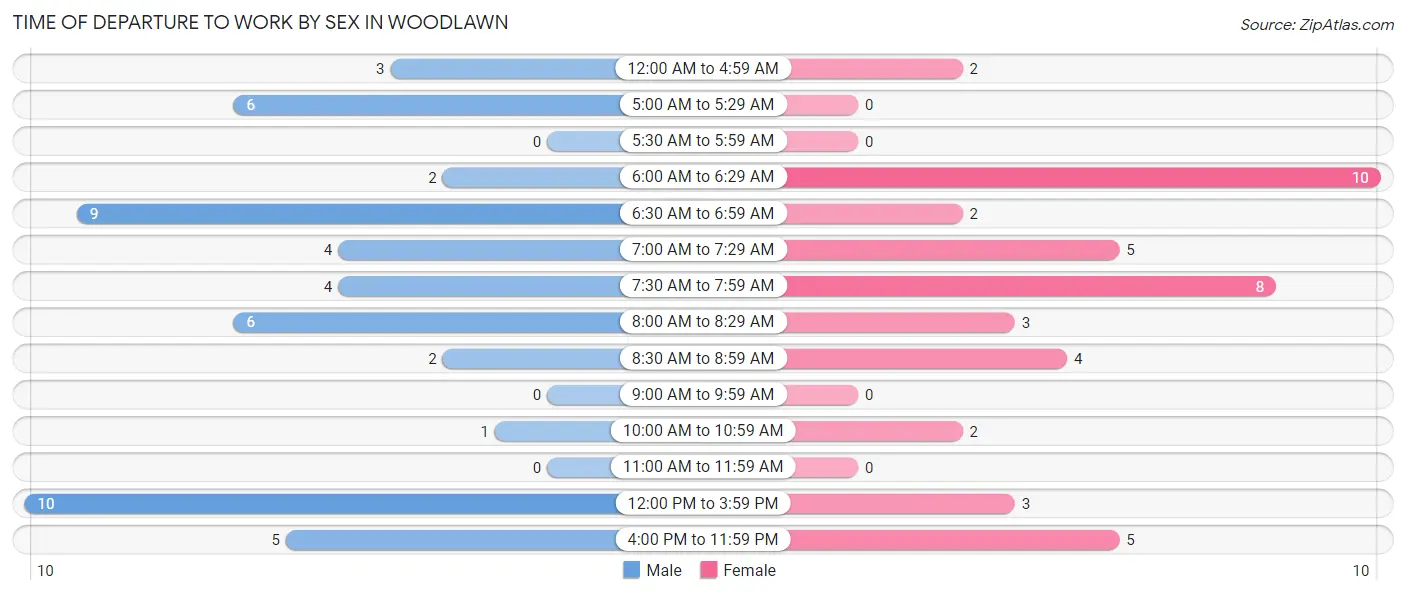
| Time of Departure | Male | Female |
| 12:00 AM to 4:59 AM | 3 (5.8%) | 2 (4.5%) |
| 5:00 AM to 5:29 AM | 6 (11.5%) | 0 (0.0%) |
| 5:30 AM to 5:59 AM | 0 (0.0%) | 0 (0.0%) |
| 6:00 AM to 6:29 AM | 2 (3.8%) | 10 (22.7%) |
| 6:30 AM to 6:59 AM | 9 (17.3%) | 2 (4.5%) |
| 7:00 AM to 7:29 AM | 4 (7.7%) | 5 (11.4%) |
| 7:30 AM to 7:59 AM | 4 (7.7%) | 8 (18.2%) |
| 8:00 AM to 8:29 AM | 6 (11.5%) | 3 (6.8%) |
| 8:30 AM to 8:59 AM | 2 (3.8%) | 4 (9.1%) |
| 9:00 AM to 9:59 AM | 0 (0.0%) | 0 (0.0%) |
| 10:00 AM to 10:59 AM | 1 (1.9%) | 2 (4.5%) |
| 11:00 AM to 11:59 AM | 0 (0.0%) | 0 (0.0%) |
| 12:00 PM to 3:59 PM | 10 (19.2%) | 3 (6.8%) |
| 4:00 PM to 11:59 PM | 5 (9.6%) | 5 (11.4%) |
| Total | 52 (100.0%) | 44 (100.0%) |
Housing Occupancy in Woodlawn
Occupancy by Ownership in Woodlawn
Of the total 69 dwellings in Woodlawn, owner-occupied units account for 56 (81.2%), while renter-occupied units make up 13 (18.8%).
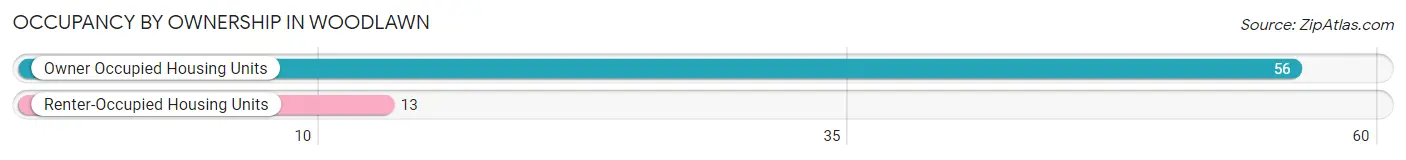
| Occupancy | # Housing Units | % Housing Units |
| Owner Occupied Housing Units | 56 | 81.2% |
| Renter-Occupied Housing Units | 13 | 18.8% |
| Total Occupied Housing Units | 69 | 100.0% |
Occupancy by Household Size in Woodlawn
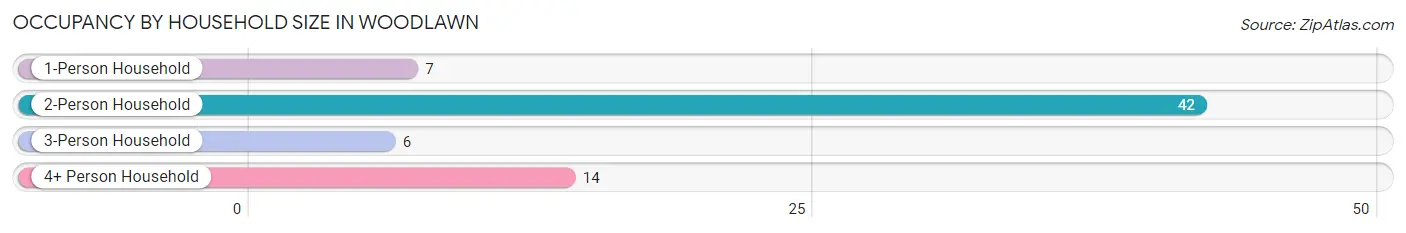
| Household Size | # Housing Units | % Housing Units |
| 1-Person Household | 7 | 10.1% |
| 2-Person Household | 42 | 60.9% |
| 3-Person Household | 6 | 8.7% |
| 4+ Person Household | 14 | 20.3% |
| Total Housing Units | 69 | 100.0% |
Occupancy by Ownership by Household Size in Woodlawn
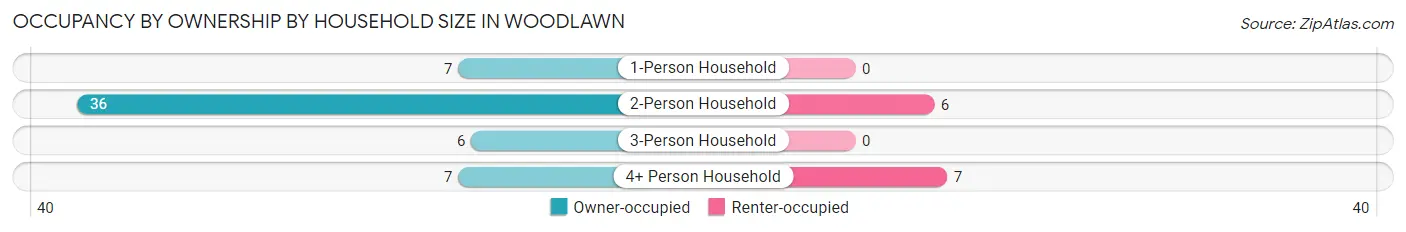
| Household Size | Owner-occupied | Renter-occupied |
| 1-Person Household | 7 (100.0%) | 0 (0.0%) |
| 2-Person Household | 36 (85.7%) | 6 (14.3%) |
| 3-Person Household | 6 (100.0%) | 0 (0.0%) |
| 4+ Person Household | 7 (50.0%) | 7 (50.0%) |
| Total Housing Units | 56 (81.2%) | 13 (18.8%) |
Occupancy by Educational Attainment in Woodlawn
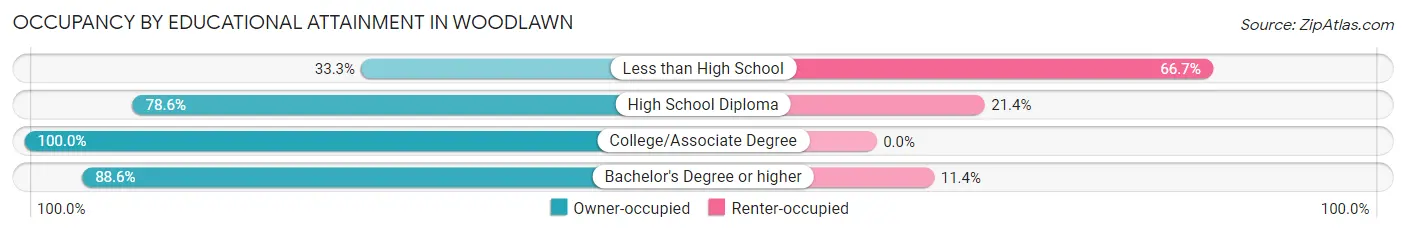
| Household Size | Owner-occupied | Renter-occupied |
| Less than High School | 3 (33.3%) | 6 (66.7%) |
| High School Diploma | 11 (78.6%) | 3 (21.4%) |
| College/Associate Degree | 11 (100.0%) | 0 (0.0%) |
| Bachelor's Degree or higher | 31 (88.6%) | 4 (11.4%) |
Occupancy by Age of Householder in Woodlawn
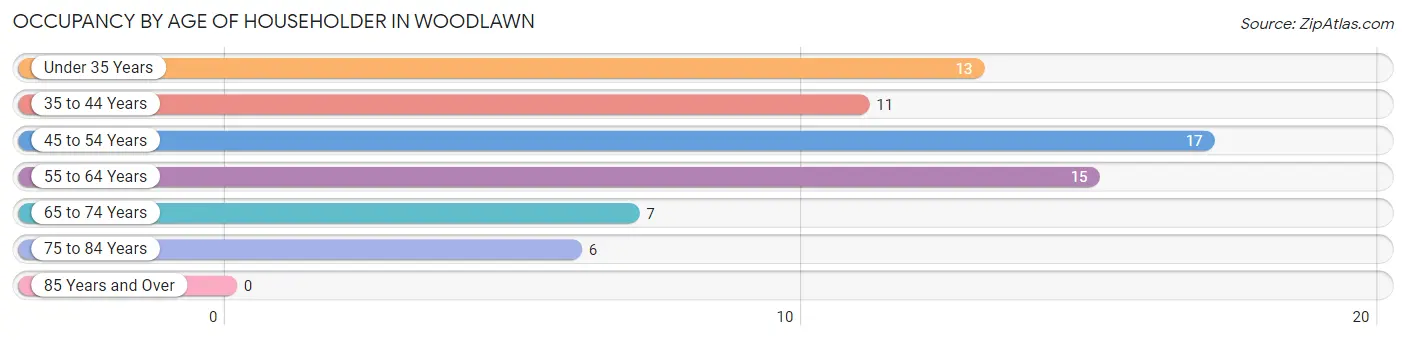
| Age Bracket | # Households | % Households |
| Under 35 Years | 13 | 18.8% |
| 35 to 44 Years | 11 | 15.9% |
| 45 to 54 Years | 17 | 24.6% |
| 55 to 64 Years | 15 | 21.7% |
| 65 to 74 Years | 7 | 10.1% |
| 75 to 84 Years | 6 | 8.7% |
| 85 Years and Over | 0 | 0.0% |
| Total | 69 | 100.0% |
Housing Finances in Woodlawn
Median Income by Occupancy in Woodlawn
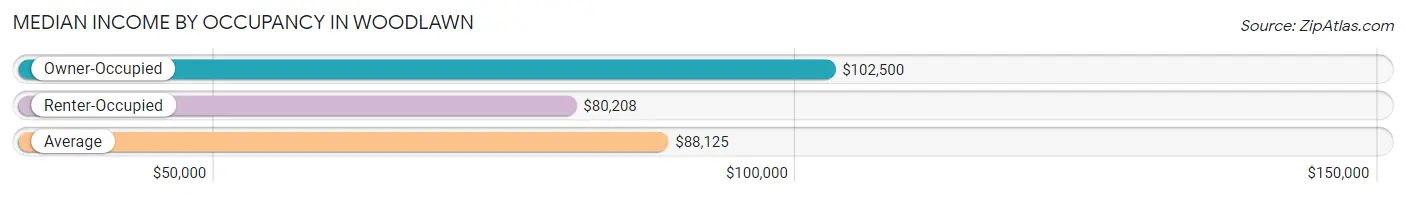
| Occupancy Type | # Households | Median Income |
| Owner-Occupied | 56 (81.2%) | $102,500 |
| Renter-Occupied | 13 (18.8%) | $80,208 |
| Average | 69 (100.0%) | $88,125 |
Occupancy by Householder Income Bracket in Woodlawn
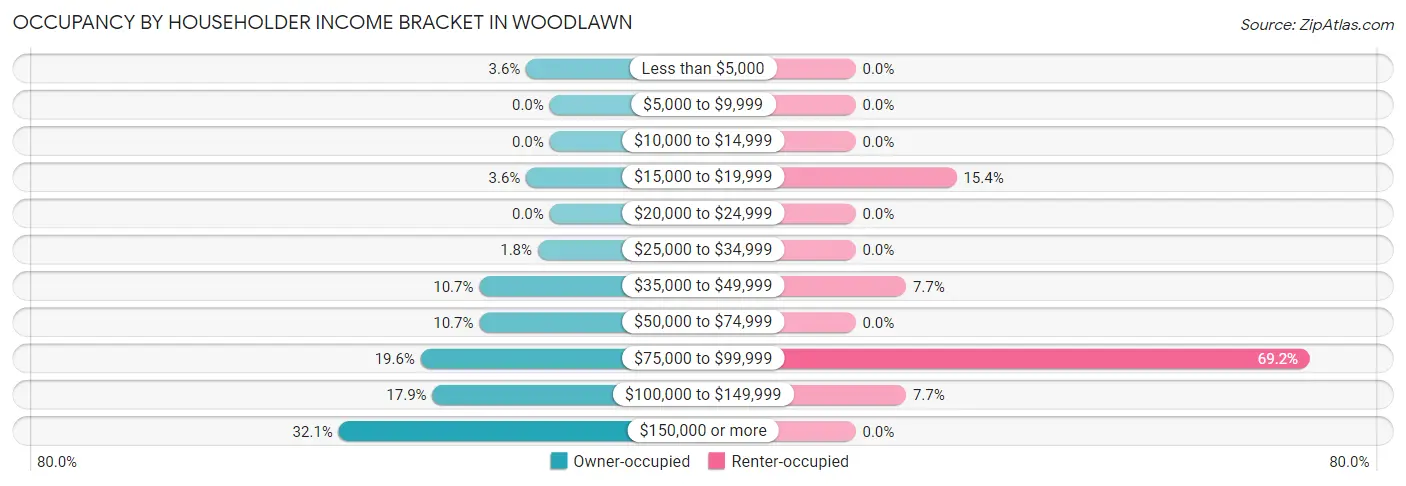
| Income Bracket | Owner-occupied | Renter-occupied |
| Less than $5,000 | 2 (3.6%) | 0 (0.0%) |
| $5,000 to $9,999 | 0 (0.0%) | 0 (0.0%) |
| $10,000 to $14,999 | 0 (0.0%) | 0 (0.0%) |
| $15,000 to $19,999 | 2 (3.6%) | 2 (15.4%) |
| $20,000 to $24,999 | 0 (0.0%) | 0 (0.0%) |
| $25,000 to $34,999 | 1 (1.8%) | 0 (0.0%) |
| $35,000 to $49,999 | 6 (10.7%) | 1 (7.7%) |
| $50,000 to $74,999 | 6 (10.7%) | 0 (0.0%) |
| $75,000 to $99,999 | 11 (19.6%) | 9 (69.2%) |
| $100,000 to $149,999 | 10 (17.9%) | 1 (7.7%) |
| $150,000 or more | 18 (32.1%) | 0 (0.0%) |
| Total | 56 (100.0%) | 13 (100.0%) |
Monthly Housing Cost Tiers in Woodlawn
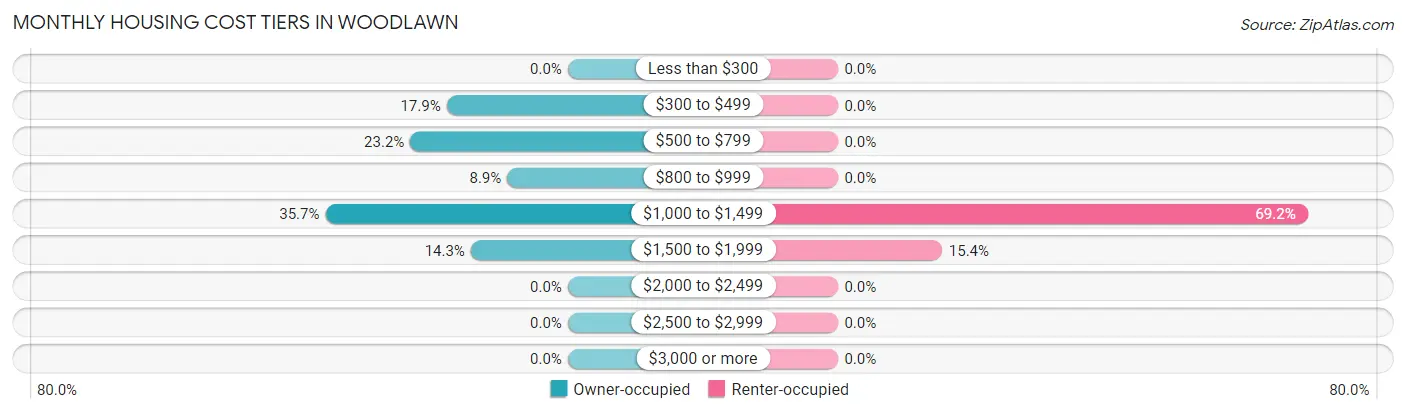
| Monthly Cost | Owner-occupied | Renter-occupied |
| Less than $300 | 0 (0.0%) | 0 (0.0%) |
| $300 to $499 | 10 (17.9%) | 0 (0.0%) |
| $500 to $799 | 13 (23.2%) | 0 (0.0%) |
| $800 to $999 | 5 (8.9%) | 0 (0.0%) |
| $1,000 to $1,499 | 20 (35.7%) | 9 (69.2%) |
| $1,500 to $1,999 | 8 (14.3%) | 2 (15.4%) |
| $2,000 to $2,499 | 0 (0.0%) | 0 (0.0%) |
| $2,500 to $2,999 | 0 (0.0%) | 0 (0.0%) |
| $3,000 or more | 0 (0.0%) | 0 (0.0%) |
| Total | 56 (100.0%) | 13 (100.0%) |
Physical Housing Characteristics in Woodlawn
Housing Structures in Woodlawn
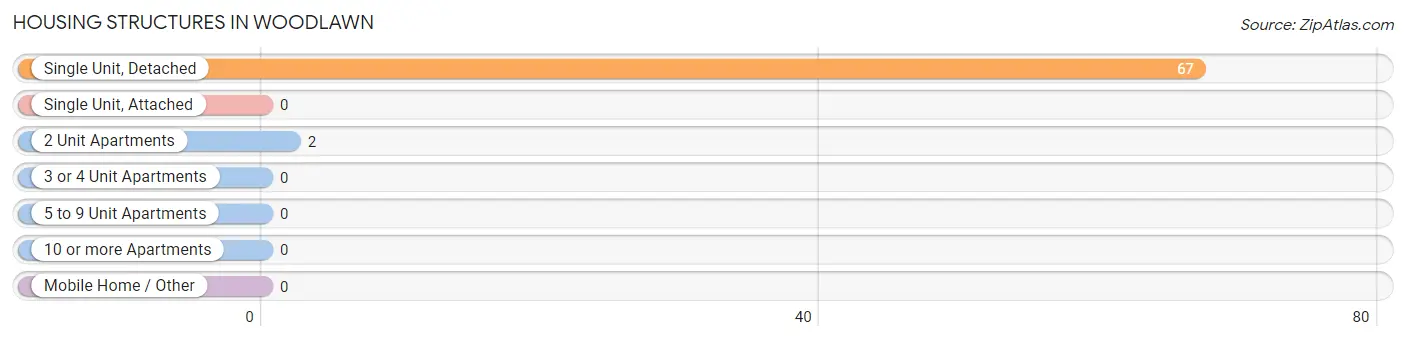
| Structure Type | # Housing Units | % Housing Units |
| Single Unit, Detached | 67 | 97.1% |
| Single Unit, Attached | 0 | 0.0% |
| 2 Unit Apartments | 2 | 2.9% |
| 3 or 4 Unit Apartments | 0 | 0.0% |
| 5 to 9 Unit Apartments | 0 | 0.0% |
| 10 or more Apartments | 0 | 0.0% |
| Mobile Home / Other | 0 | 0.0% |
| Total | 69 | 100.0% |
Housing Structures by Occupancy in Woodlawn
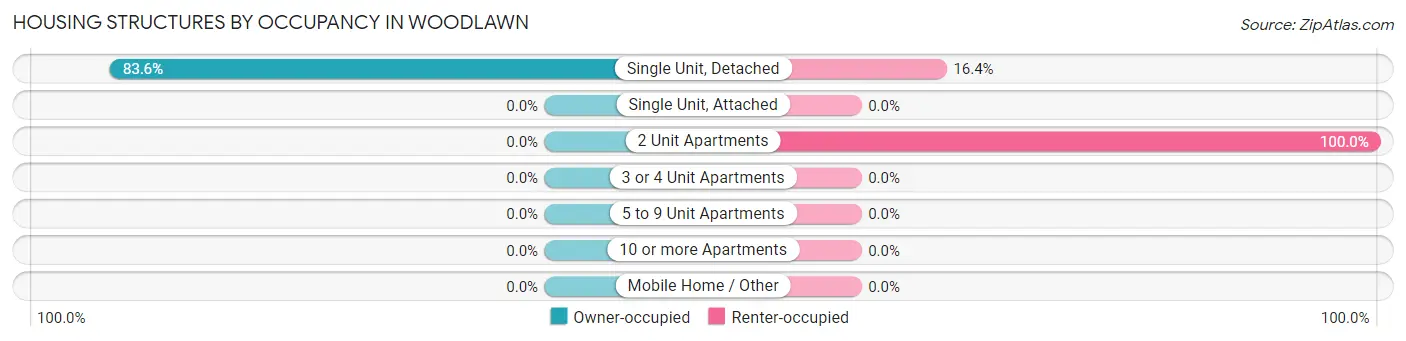
| Structure Type | Owner-occupied | Renter-occupied |
| Single Unit, Detached | 56 (83.6%) | 11 (16.4%) |
| Single Unit, Attached | 0 (0.0%) | 0 (0.0%) |
| 2 Unit Apartments | 0 (0.0%) | 2 (100.0%) |
| 3 or 4 Unit Apartments | 0 (0.0%) | 0 (0.0%) |
| 5 to 9 Unit Apartments | 0 (0.0%) | 0 (0.0%) |
| 10 or more Apartments | 0 (0.0%) | 0 (0.0%) |
| Mobile Home / Other | 0 (0.0%) | 0 (0.0%) |
| Total | 56 (81.2%) | 13 (18.8%) |
Housing Structures by Number of Rooms in Woodlawn
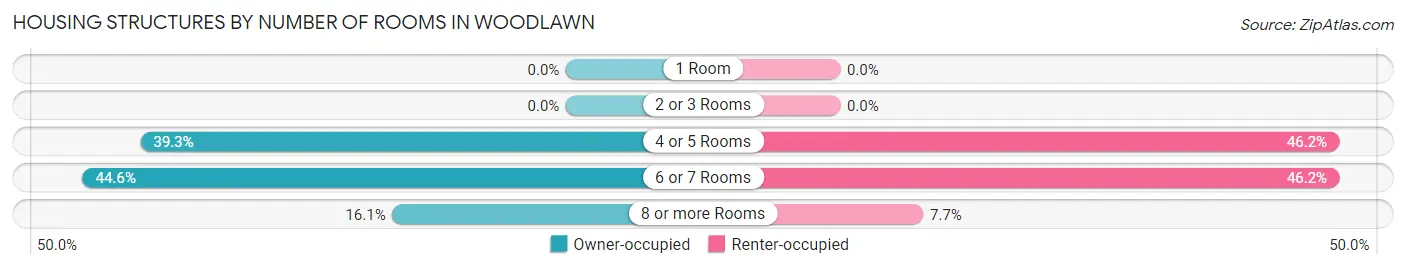
| Number of Rooms | Owner-occupied | Renter-occupied |
| 1 Room | 0 (0.0%) | 0 (0.0%) |
| 2 or 3 Rooms | 0 (0.0%) | 0 (0.0%) |
| 4 or 5 Rooms | 22 (39.3%) | 6 (46.2%) |
| 6 or 7 Rooms | 25 (44.6%) | 6 (46.2%) |
| 8 or more Rooms | 9 (16.1%) | 1 (7.7%) |
| Total | 56 (100.0%) | 13 (100.0%) |
Housing Structure by Heating Type in Woodlawn
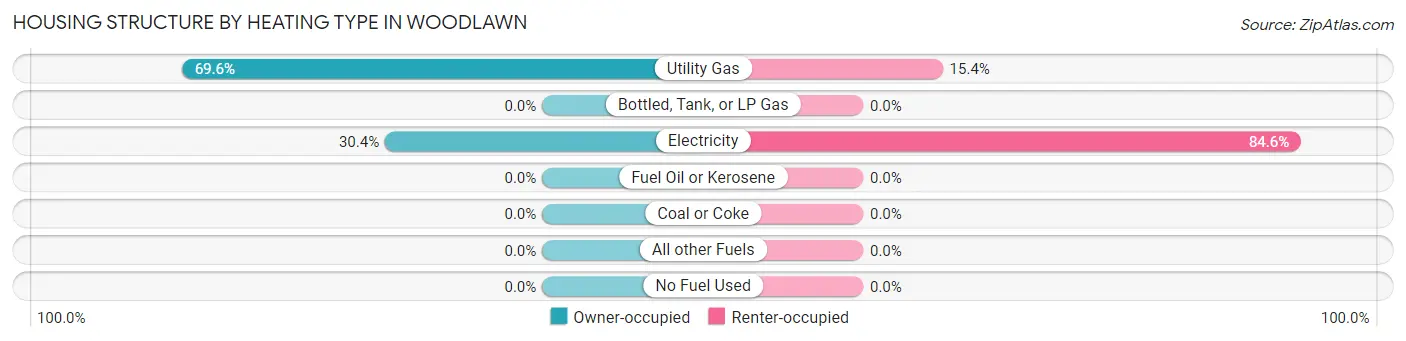
| Heating Type | Owner-occupied | Renter-occupied |
| Utility Gas | 39 (69.6%) | 2 (15.4%) |
| Bottled, Tank, or LP Gas | 0 (0.0%) | 0 (0.0%) |
| Electricity | 17 (30.4%) | 11 (84.6%) |
| Fuel Oil or Kerosene | 0 (0.0%) | 0 (0.0%) |
| Coal or Coke | 0 (0.0%) | 0 (0.0%) |
| All other Fuels | 0 (0.0%) | 0 (0.0%) |
| No Fuel Used | 0 (0.0%) | 0 (0.0%) |
| Total | 56 (100.0%) | 13 (100.0%) |
Household Vehicle Usage in Woodlawn
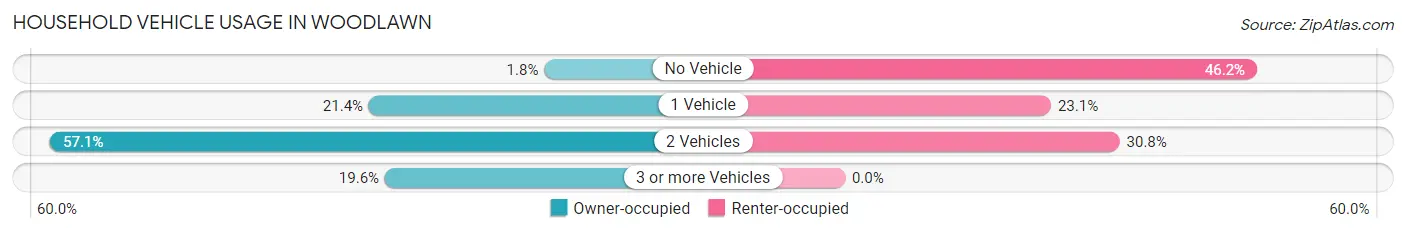
| Vehicles per Household | Owner-occupied | Renter-occupied |
| No Vehicle | 1 (1.8%) | 6 (46.2%) |
| 1 Vehicle | 12 (21.4%) | 3 (23.1%) |
| 2 Vehicles | 32 (57.1%) | 4 (30.8%) |
| 3 or more Vehicles | 11 (19.6%) | 0 (0.0%) |
| Total | 56 (100.0%) | 13 (100.0%) |
Real Estate & Mortgages in Woodlawn
Real Estate and Mortgage Overview in Woodlawn
| Characteristic | Without Mortgage | With Mortgage |
| Housing Units | 19 | 37 |
| Median Property Value | $218,800 | $165,300 |
| Median Household Income | $106,250 | $12 |
| Monthly Housing Costs | $494 | $0 |
| Real Estate Taxes | $2,083 | $1 |
Property Value by Mortgage Status in Woodlawn
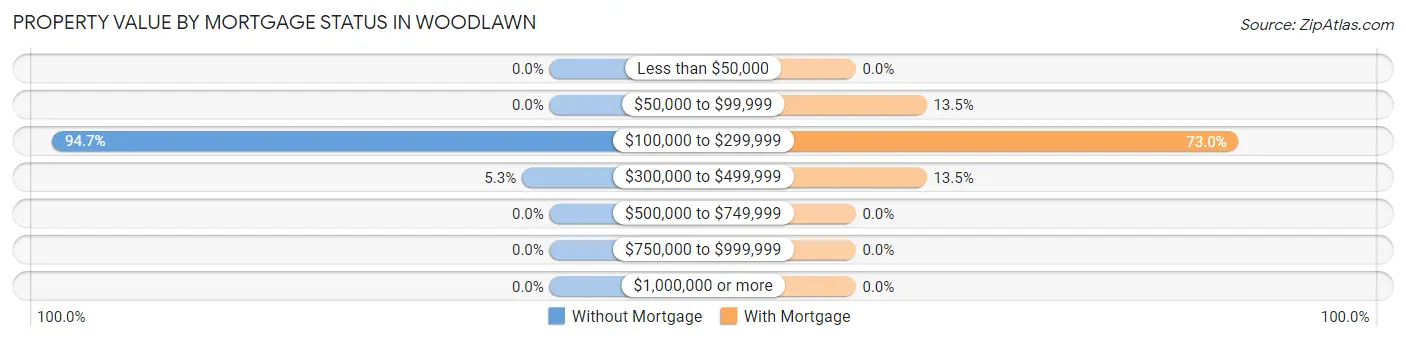
| Property Value | Without Mortgage | With Mortgage |
| Less than $50,000 | 0 (0.0%) | 0 (0.0%) |
| $50,000 to $99,999 | 0 (0.0%) | 5 (13.5%) |
| $100,000 to $299,999 | 18 (94.7%) | 27 (73.0%) |
| $300,000 to $499,999 | 1 (5.3%) | 5 (13.5%) |
| $500,000 to $749,999 | 0 (0.0%) | 0 (0.0%) |
| $750,000 to $999,999 | 0 (0.0%) | 0 (0.0%) |
| $1,000,000 or more | 0 (0.0%) | 0 (0.0%) |
| Total | 19 (100.0%) | 37 (100.0%) |
Household Income by Mortgage Status in Woodlawn
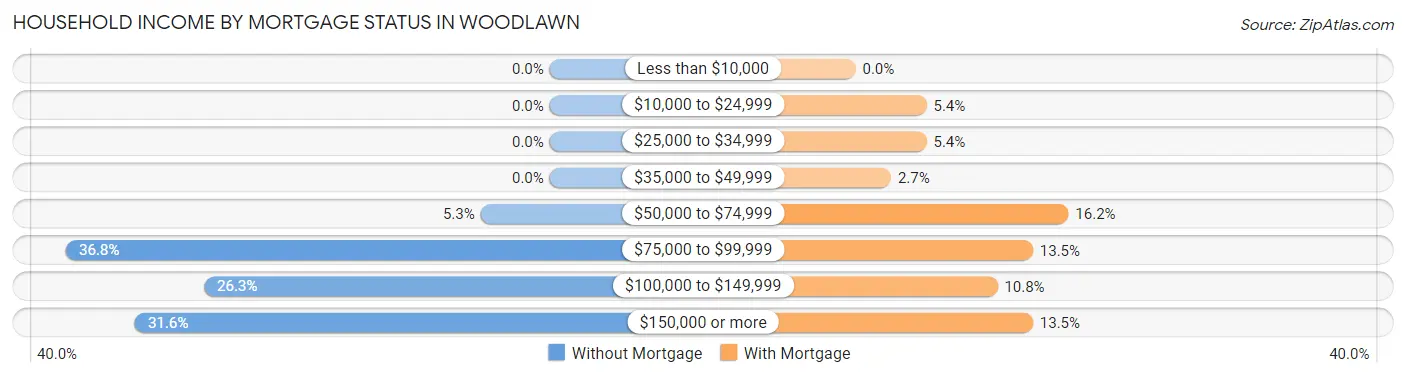
| Household Income | Without Mortgage | With Mortgage |
| Less than $10,000 | 0 (0.0%) | 0 (0.0%) |
| $10,000 to $24,999 | 0 (0.0%) | 2 (5.4%) |
| $25,000 to $34,999 | 0 (0.0%) | 2 (5.4%) |
| $35,000 to $49,999 | 0 (0.0%) | 1 (2.7%) |
| $50,000 to $74,999 | 1 (5.3%) | 6 (16.2%) |
| $75,000 to $99,999 | 7 (36.8%) | 5 (13.5%) |
| $100,000 to $149,999 | 5 (26.3%) | 4 (10.8%) |
| $150,000 or more | 6 (31.6%) | 5 (13.5%) |
| Total | 19 (100.0%) | 37 (100.0%) |
Property Value to Household Income Ratio in Woodlawn
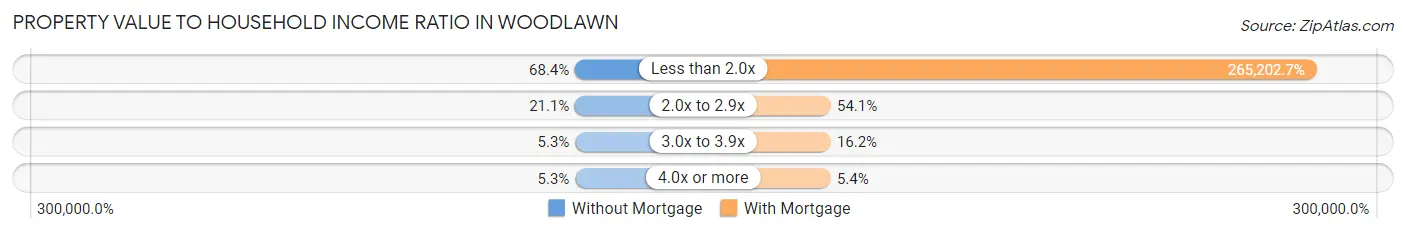
| Value-to-Income Ratio | Without Mortgage | With Mortgage |
| Less than 2.0x | 13 (68.4%) | 98,125 (265,202.7%) |
| 2.0x to 2.9x | 4 (21.0%) | 20 (54.0%) |
| 3.0x to 3.9x | 1 (5.3%) | 6 (16.2%) |
| 4.0x or more | 1 (5.3%) | 2 (5.4%) |
| Total | 19 (100.0%) | 37 (100.0%) |
Real Estate Taxes by Mortgage Status in Woodlawn
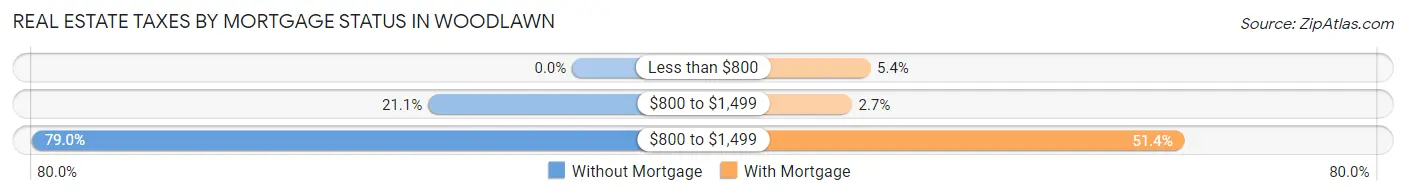
| Property Taxes | Without Mortgage | With Mortgage |
| Less than $800 | 0 (0.0%) | 2 (5.4%) |
| $800 to $1,499 | 4 (21.0%) | 1 (2.7%) |
| $800 to $1,499 | 15 (78.9%) | 19 (51.3%) |
| Total | 19 (100.0%) | 37 (100.0%) |
Health & Disability in Woodlawn
Health Insurance Coverage by Age in Woodlawn
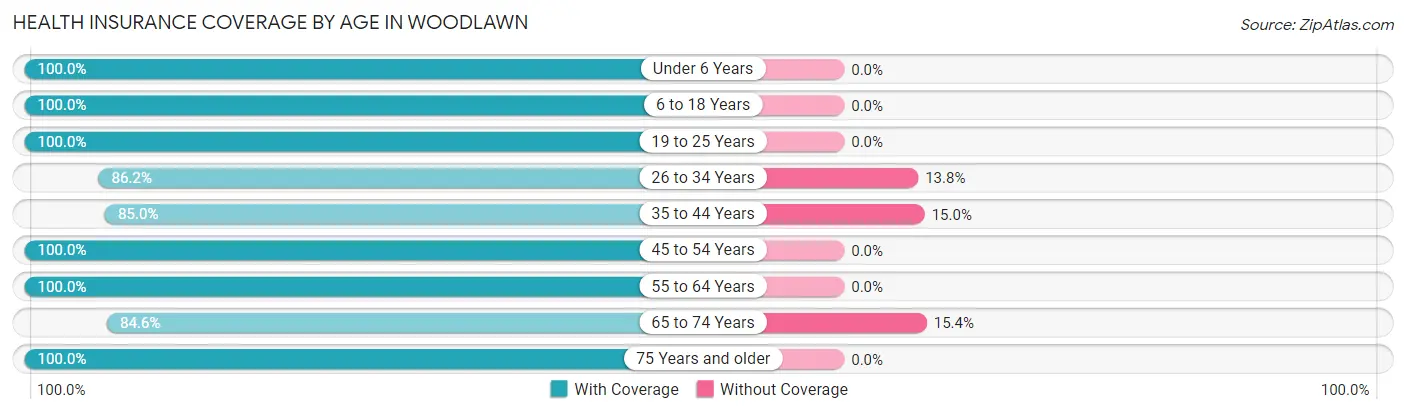
| Age Bracket | With Coverage | Without Coverage |
| Under 6 Years | 7 (100.0%) | 0 (0.0%) |
| 6 to 18 Years | 26 (100.0%) | 0 (0.0%) |
| 19 to 25 Years | 20 (100.0%) | 0 (0.0%) |
| 26 to 34 Years | 25 (86.2%) | 4 (13.8%) |
| 35 to 44 Years | 17 (85.0%) | 3 (15.0%) |
| 45 to 54 Years | 30 (100.0%) | 0 (0.0%) |
| 55 to 64 Years | 24 (100.0%) | 0 (0.0%) |
| 65 to 74 Years | 11 (84.6%) | 2 (15.4%) |
| 75 Years and older | 10 (100.0%) | 0 (0.0%) |
| Total | 170 (95.0%) | 9 (5.0%) |
Health Insurance Coverage by Citizenship Status in Woodlawn
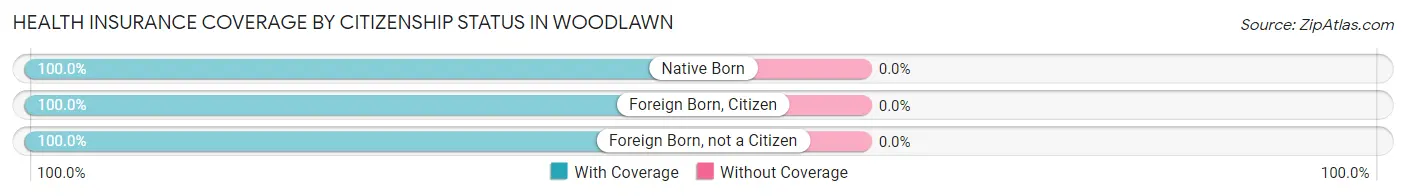
| Citizenship Status | With Coverage | Without Coverage |
| Native Born | 7 (100.0%) | 0 (0.0%) |
| Foreign Born, Citizen | 26 (100.0%) | 0 (0.0%) |
| Foreign Born, not a Citizen | 20 (100.0%) | 0 (0.0%) |
Health Insurance Coverage by Household Income in Woodlawn
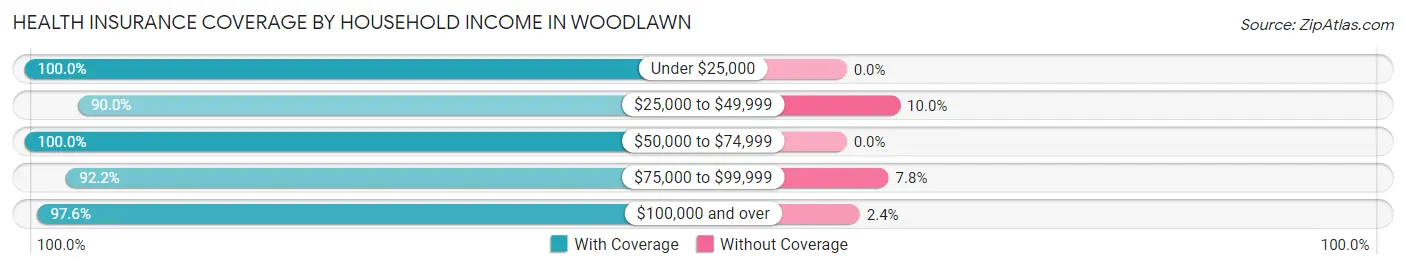
| Household Income | With Coverage | Without Coverage |
| Under $25,000 | 11 (100.0%) | 0 (0.0%) |
| $25,000 to $49,999 | 18 (90.0%) | 2 (10.0%) |
| $50,000 to $74,999 | 11 (100.0%) | 0 (0.0%) |
| $75,000 to $99,999 | 47 (92.2%) | 4 (7.8%) |
| $100,000 and over | 80 (97.6%) | 2 (2.4%) |
Public vs Private Health Insurance Coverage by Age in Woodlawn
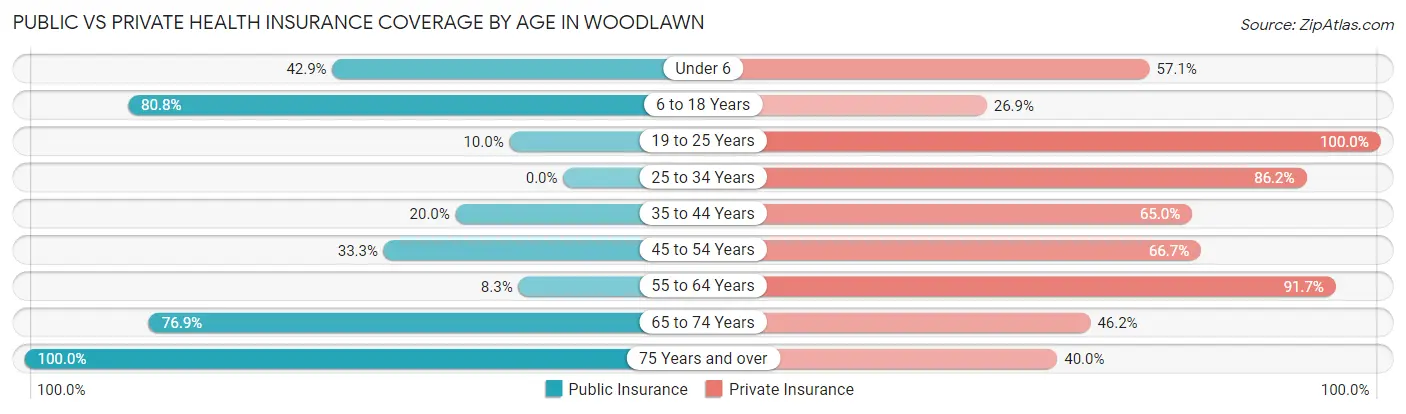
| Age Bracket | Public Insurance | Private Insurance |
| Under 6 | 3 (42.9%) | 4 (57.1%) |
| 6 to 18 Years | 21 (80.8%) | 7 (26.9%) |
| 19 to 25 Years | 2 (10.0%) | 20 (100.0%) |
| 25 to 34 Years | 0 (0.0%) | 25 (86.2%) |
| 35 to 44 Years | 4 (20.0%) | 13 (65.0%) |
| 45 to 54 Years | 10 (33.3%) | 20 (66.7%) |
| 55 to 64 Years | 2 (8.3%) | 22 (91.7%) |
| 65 to 74 Years | 10 (76.9%) | 6 (46.2%) |
| 75 Years and over | 10 (100.0%) | 4 (40.0%) |
| Total | 62 (34.6%) | 121 (67.6%) |
Disability Status by Sex by Age in Woodlawn
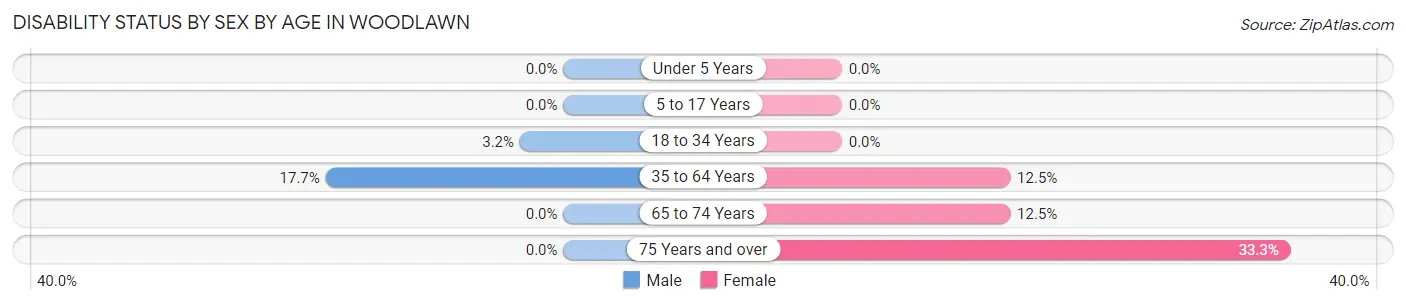
| Age Bracket | Male | Female |
| Under 5 Years | 0 (0.0%) | 0 (0.0%) |
| 5 to 17 Years | 0 (0.0%) | 0 (0.0%) |
| 18 to 34 Years | 1 (3.2%) | 0 (0.0%) |
| 35 to 64 Years | 6 (17.6%) | 5 (12.5%) |
| 65 to 74 Years | 0 (0.0%) | 1 (12.5%) |
| 75 Years and over | 0 (0.0%) | 2 (33.3%) |
Disability Class by Sex by Age in Woodlawn
Disability Class: Hearing Difficulty
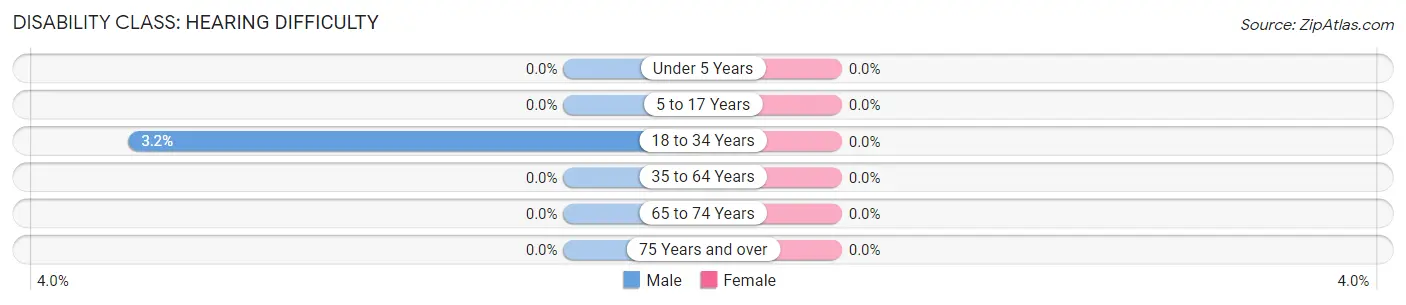
| Age Bracket | Male | Female |
| Under 5 Years | 0 (0.0%) | 0 (0.0%) |
| 5 to 17 Years | 0 (0.0%) | 0 (0.0%) |
| 18 to 34 Years | 1 (3.2%) | 0 (0.0%) |
| 35 to 64 Years | 0 (0.0%) | 0 (0.0%) |
| 65 to 74 Years | 0 (0.0%) | 0 (0.0%) |
| 75 Years and over | 0 (0.0%) | 0 (0.0%) |
Disability Class: Vision Difficulty
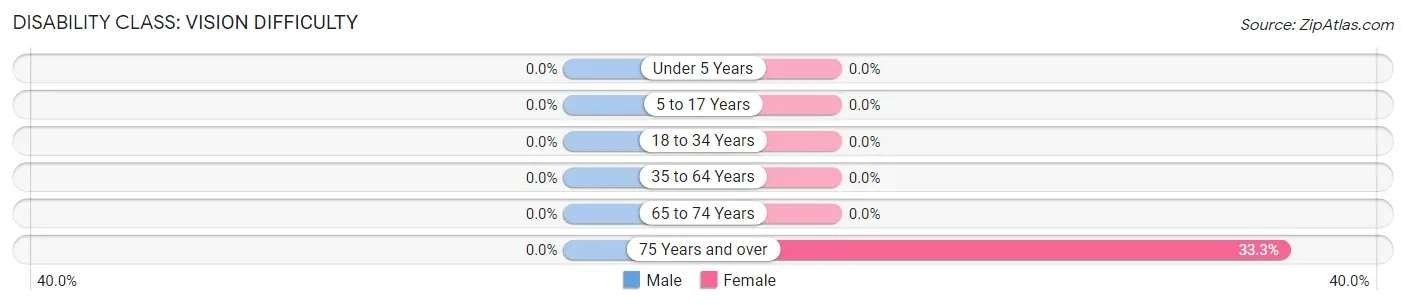
| Age Bracket | Male | Female |
| Under 5 Years | 0 (0.0%) | 0 (0.0%) |
| 5 to 17 Years | 0 (0.0%) | 0 (0.0%) |
| 18 to 34 Years | 0 (0.0%) | 0 (0.0%) |
| 35 to 64 Years | 0 (0.0%) | 0 (0.0%) |
| 65 to 74 Years | 0 (0.0%) | 0 (0.0%) |
| 75 Years and over | 0 (0.0%) | 2 (33.3%) |
Disability Class: Cognitive Difficulty
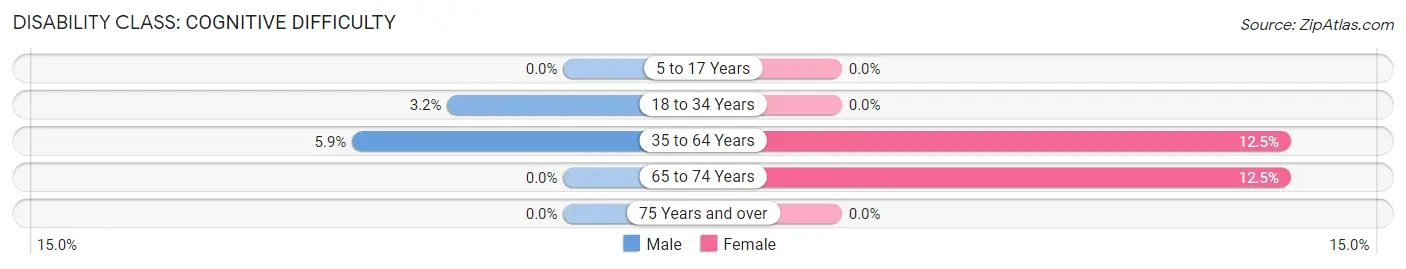
| Age Bracket | Male | Female |
| 5 to 17 Years | 0 (0.0%) | 0 (0.0%) |
| 18 to 34 Years | 1 (3.2%) | 0 (0.0%) |
| 35 to 64 Years | 2 (5.9%) | 5 (12.5%) |
| 65 to 74 Years | 0 (0.0%) | 1 (12.5%) |
| 75 Years and over | 0 (0.0%) | 0 (0.0%) |
Disability Class: Ambulatory Difficulty
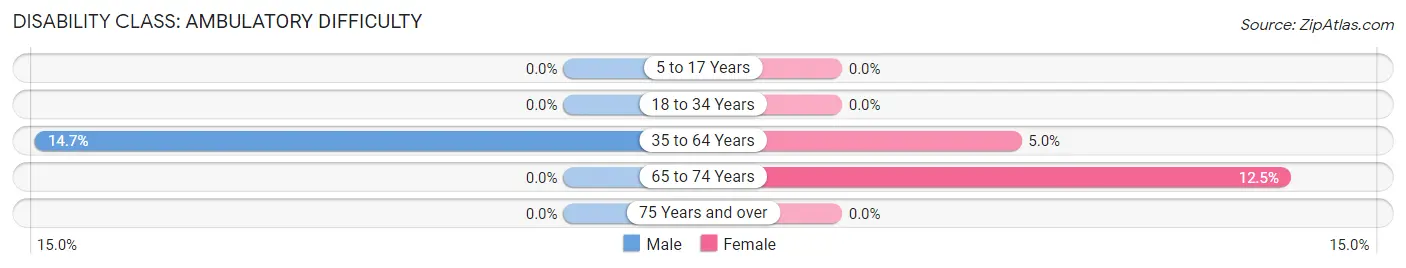
| Age Bracket | Male | Female |
| 5 to 17 Years | 0 (0.0%) | 0 (0.0%) |
| 18 to 34 Years | 0 (0.0%) | 0 (0.0%) |
| 35 to 64 Years | 5 (14.7%) | 2 (5.0%) |
| 65 to 74 Years | 0 (0.0%) | 1 (12.5%) |
| 75 Years and over | 0 (0.0%) | 0 (0.0%) |
Disability Class: Self-Care Difficulty
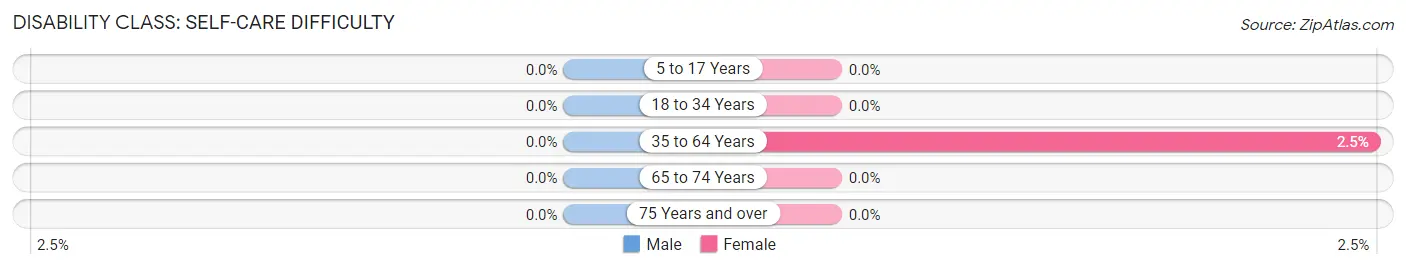
| Age Bracket | Male | Female |
| 5 to 17 Years | 0 (0.0%) | 0 (0.0%) |
| 18 to 34 Years | 0 (0.0%) | 0 (0.0%) |
| 35 to 64 Years | 0 (0.0%) | 1 (2.5%) |
| 65 to 74 Years | 0 (0.0%) | 0 (0.0%) |
| 75 Years and over | 0 (0.0%) | 0 (0.0%) |
Technology Access in Woodlawn
Computing Device Access in Woodlawn
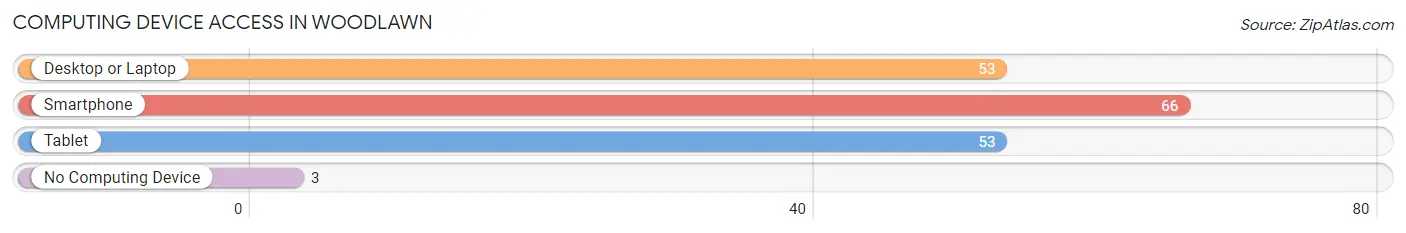
| Device Type | # Households | % Households |
| Desktop or Laptop | 53 | 76.8% |
| Smartphone | 66 | 95.7% |
| Tablet | 53 | 76.8% |
| No Computing Device | 3 | 4.3% |
| Total | 69 | 100.0% |
Internet Access in Woodlawn
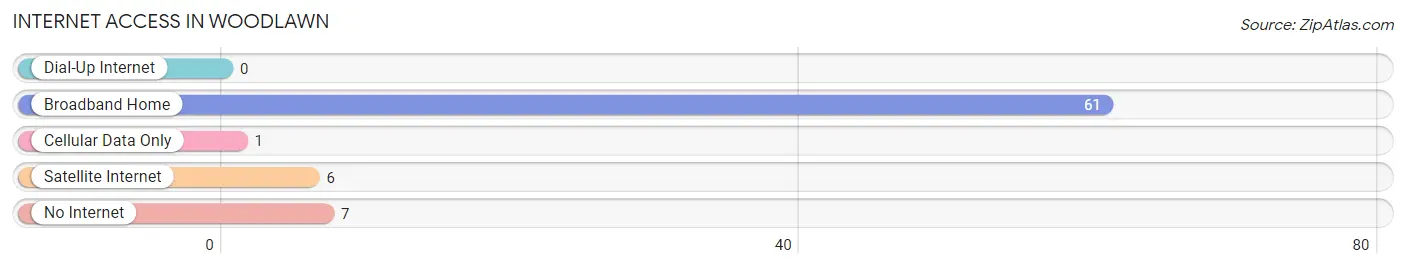
| Internet Type | # Households | % Households |
| Dial-Up Internet | 0 | 0.0% |
| Broadband Home | 61 | 88.4% |
| Cellular Data Only | 1 | 1.5% |
| Satellite Internet | 6 | 8.7% |
| No Internet | 7 | 10.1% |
| Total | 69 | 100.0% |
Woodlawn Summary
Woodlawn, Kentucky is a small unincorporated community located in the northern part of the state, in the county of Jefferson. It is situated on the banks of the Ohio River, just south of Louisville. The population of Woodlawn was estimated to be around 1,000 people in 2020.
History
Woodlawn was first settled in the early 1800s by a group of German immigrants. The area was originally known as “German Settlement” and was home to a number of German-speaking families. The settlement was later renamed Woodlawn in 1845, after the nearby Woodlawn Cemetery.
In the late 1800s, the area began to experience rapid growth due to the construction of the Louisville and Nashville Railroad. This allowed for the transportation of goods and people to and from the area, and helped to spur economic development.
In the early 1900s, Woodlawn was home to a number of businesses, including a flour mill, a sawmill, a brickyard, and a number of other small businesses. The area also had a number of churches, schools, and other institutions.
In the mid-1900s, Woodlawn experienced a period of decline due to the decline of the railroad industry. The area was also affected by the Great Depression and World War II. However, in the late 1900s, the area began to experience a resurgence due to the development of the nearby Louisville International Airport.
Geography
Woodlawn is located in the northern part of Jefferson County, Kentucky. It is situated on the banks of the Ohio River, just south of Louisville. The area is mostly flat, with some rolling hills in the surrounding area. The climate is generally mild, with hot summers and cold winters.
Economy
The economy of Woodlawn is largely based on the service industry. The area is home to a number of restaurants, hotels, and other businesses that cater to travelers and tourists. The area is also home to a number of manufacturing and industrial businesses.
Demographics
The population of Woodlawn was estimated to be around 1,000 people in 2020. The racial makeup of the area is predominantly white, with a small percentage of African Americans and other minorities. The median household income in the area is around $50,000. The median age of the population is around 40 years old.
Common Questions
What is Per Capita Income in Woodlawn?
Per Capita income in Woodlawn is $40,702.
What is the Median Family Income in Woodlawn?
Median Family Income in Woodlawn is $102,500.
What is the Median Household income in Woodlawn?
Median Household Income in Woodlawn is $88,125.
What is Income or Wage Gap in Woodlawn?
Income or Wage Gap in Woodlawn is 4.9%.
Women in Woodlawn earn 95.1 cents for every dollar earned by a man.
What is Inequality or Gini Index in Woodlawn?
Inequality or Gini Index in Woodlawn is 0.33.
What is the Total Population of Woodlawn?
Total Population of Woodlawn is 179.
What is the Total Male Population of Woodlawn?
Total Male Population of Woodlawn is 90.
What is the Total Female Population of Woodlawn?
Total Female Population of Woodlawn is 89.
What is the Ratio of Males per 100 Females in Woodlawn?
There are 101.12 Males per 100 Females in Woodlawn.
What is the Ratio of Females per 100 Males in Woodlawn?
There are 98.89 Females per 100 Males in Woodlawn.
What is the Median Population Age in Woodlawn?
Median Population Age in Woodlawn is 39.2 Years.
What is the Average Family Size in Woodlawn
Average Family Size in Woodlawn is 2.8 People.
What is the Average Household Size in Woodlawn
Average Household Size in Woodlawn is 2.5 People.
How Large is the Labor Force in Woodlawn?
There are 114 People in the Labor Forcein in Woodlawn.
What is the Percentage of People in the Labor Force in Woodlawn?
75.5% of People are in the Labor Force in Woodlawn.
What is the Unemployment Rate in Woodlawn?
Unemployment Rate in Woodlawn is 4.4%.