Symsonia, KY Map & Demographics
Symsonia Map
Symsonia Overview
$53,615
PER CAPITA INCOME
$157,115
AVG FAMILY INCOME
$76,000
AVG HOUSEHOLD INCOME
0.46
INEQUALITY / GINI INDEX
464
TOTAL POPULATION
274
MALE POPULATION
190
FEMALE POPULATION
144.21
MALES / 100 FEMALES
69.34
FEMALES / 100 MALES
59.7
MEDIAN AGE
2.3
AVG FAMILY SIZE
1.8
AVG HOUSEHOLD SIZE
278
LABOR FORCE [ PEOPLE ]
59.9%
PERCENT IN LABOR FORCE
Symsonia Zip Codes
Symsonia Area Codes
Income in Symsonia
Income Overview in Symsonia
Per Capita Income in Symsonia is $53,615, while median incomes of families and households are $157,115 and $76,000 respectively.
| Characteristic | Number | Measure |
| Per Capita Income | 464 | $53,615 |
| Median Family Income | 148 | $157,115 |
| Mean Family Income | 148 | $131,775 |
| Median Household Income | 264 | $76,000 |
| Mean Household Income | 264 | $94,331 |
| Income Deficit | 148 | $0 |
| Wage / Income Gap (%) | 464 | 0.00% |
| Wage / Income Gap ($) | 464 | 100.00¢ per $1 |
| Gini / Inequality Index | 464 | 0.46 |
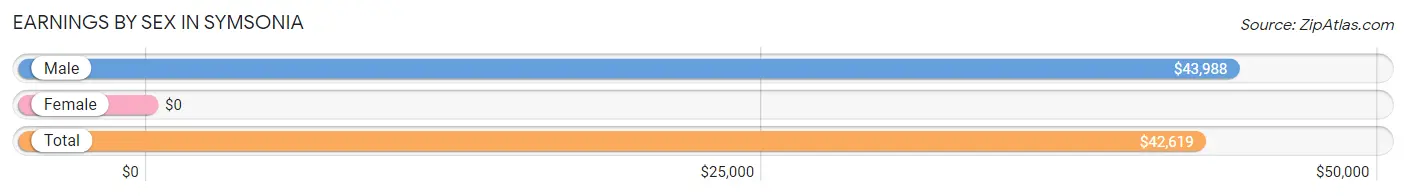
Earnings by Sex in Symsonia
| Sex | Number | Average Earnings |
| Male | 189 (68.0%) | $43,988 |
| Female | 89 (32.0%) | $0 |
| Total | 278 (100.0%) | $42,619 |
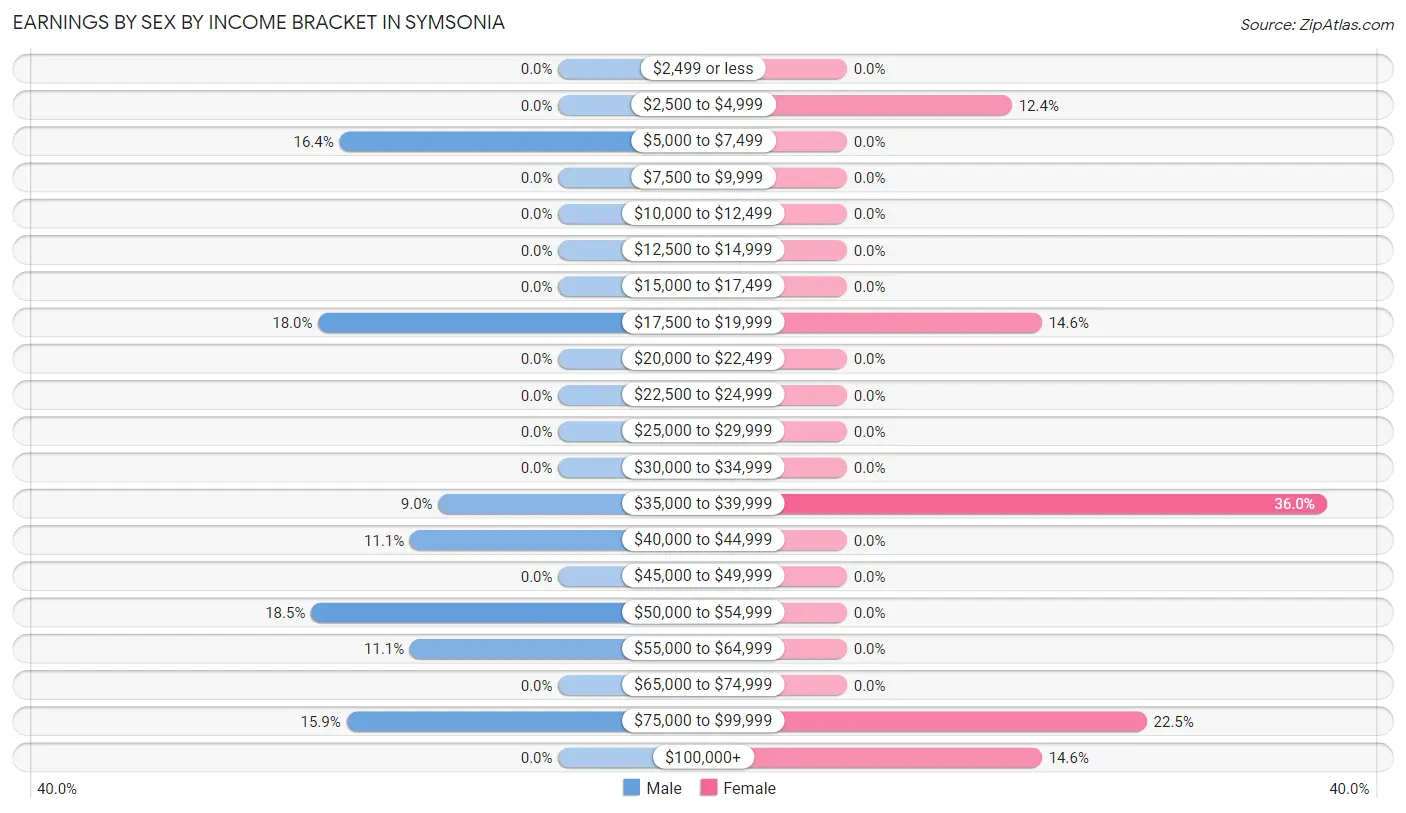
Earnings by Sex by Income Bracket in Symsonia
The most common earnings brackets in Symsonia are $50,000 to $54,999 for men (35 | 18.5%) and $35,000 to $39,999 for women (32 | 36.0%).
| Income | Male | Female |
| $2,499 or less | 0 (0.0%) | 0 (0.0%) |
| $2,500 to $4,999 | 0 (0.0%) | 11 (12.4%) |
| $5,000 to $7,499 | 31 (16.4%) | 0 (0.0%) |
| $7,500 to $9,999 | 0 (0.0%) | 0 (0.0%) |
| $10,000 to $12,499 | 0 (0.0%) | 0 (0.0%) |
| $12,500 to $14,999 | 0 (0.0%) | 0 (0.0%) |
| $15,000 to $17,499 | 0 (0.0%) | 0 (0.0%) |
| $17,500 to $19,999 | 34 (18.0%) | 13 (14.6%) |
| $20,000 to $22,499 | 0 (0.0%) | 0 (0.0%) |
| $22,500 to $24,999 | 0 (0.0%) | 0 (0.0%) |
| $25,000 to $29,999 | 0 (0.0%) | 0 (0.0%) |
| $30,000 to $34,999 | 0 (0.0%) | 0 (0.0%) |
| $35,000 to $39,999 | 17 (9.0%) | 32 (36.0%) |
| $40,000 to $44,999 | 21 (11.1%) | 0 (0.0%) |
| $45,000 to $49,999 | 0 (0.0%) | 0 (0.0%) |
| $50,000 to $54,999 | 35 (18.5%) | 0 (0.0%) |
| $55,000 to $64,999 | 21 (11.1%) | 0 (0.0%) |
| $65,000 to $74,999 | 0 (0.0%) | 0 (0.0%) |
| $75,000 to $99,999 | 30 (15.9%) | 20 (22.5%) |
| $100,000+ | 0 (0.0%) | 13 (14.6%) |
| Total | 189 (100.0%) | 89 (100.0%) |
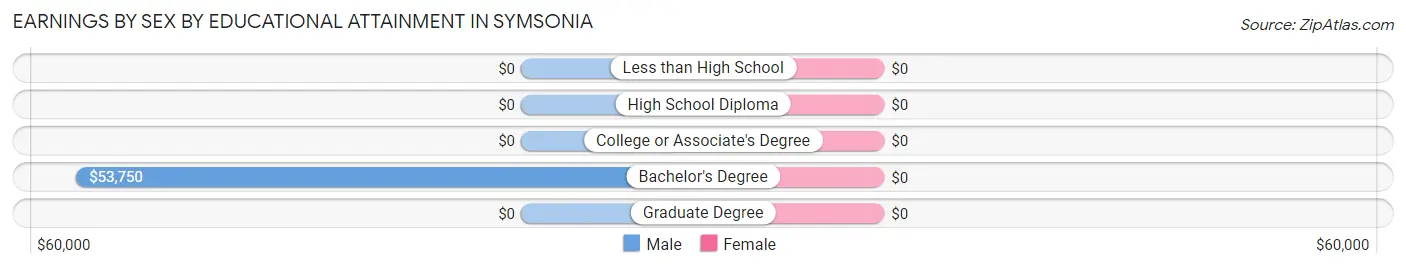
Earnings by Sex by Educational Attainment in Symsonia
| Educational Attainment | Male Income | Female Income |
| Less than High School | - | - |
| High School Diploma | - | - |
| College or Associate's Degree | - | - |
| Bachelor's Degree | $53,750 | $0 |
| Graduate Degree | - | - |
| Total | $53,000 | $0 |
Family Income in Symsonia
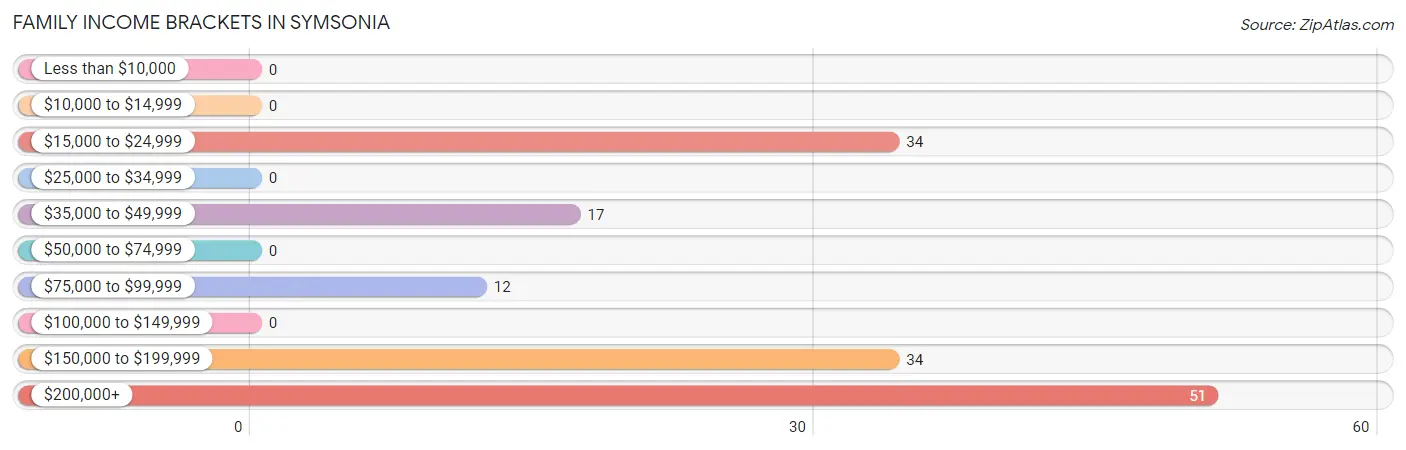
Family Income Brackets in Symsonia
According to the Symsonia family income data, there are 51 families falling into the $200,000+ income range, which is the most common income bracket and makes up 34.5% of all families.
| Income Bracket | # Families | % Families |
| Less than $10,000 | 0 | 0.0% |
| $10,000 to $14,999 | 0 | 0.0% |
| $15,000 to $24,999 | 34 | 23.0% |
| $25,000 to $34,999 | 0 | 0.0% |
| $35,000 to $49,999 | 17 | 11.5% |
| $50,000 to $74,999 | 0 | 0.0% |
| $75,000 to $99,999 | 12 | 8.1% |
| $100,000 to $149,999 | 0 | 0.0% |
| $150,000 to $199,999 | 34 | 23.0% |
| $200,000+ | 51 | 34.5% |
Family Income by Famaliy Size in Symsonia
| Income Bracket | # Families | Median Income |
| 2-Person Families | 97 (65.5%) | $0 |
| 3-Person Families | 51 (34.5%) | $0 |
| 4-Person Families | 0 (0.0%) | $0 |
| 5-Person Families | 0 (0.0%) | $0 |
| 6-Person Families | 0 (0.0%) | $0 |
| 7+ Person Families | 0 (0.0%) | $0 |
| Total | 148 (100.0%) | $157,115 |
Family Income by Number of Earners in Symsonia
| Number of Earners | # Families | Median Income |
| No Earners | 29 (19.6%) | $0 |
| 1 Earner | 34 (23.0%) | $0 |
| 2 Earners | 64 (43.2%) | $0 |
| 3+ Earners | 21 (14.2%) | $0 |
| Total | 148 (100.0%) | $157,115 |
Household Income in Symsonia
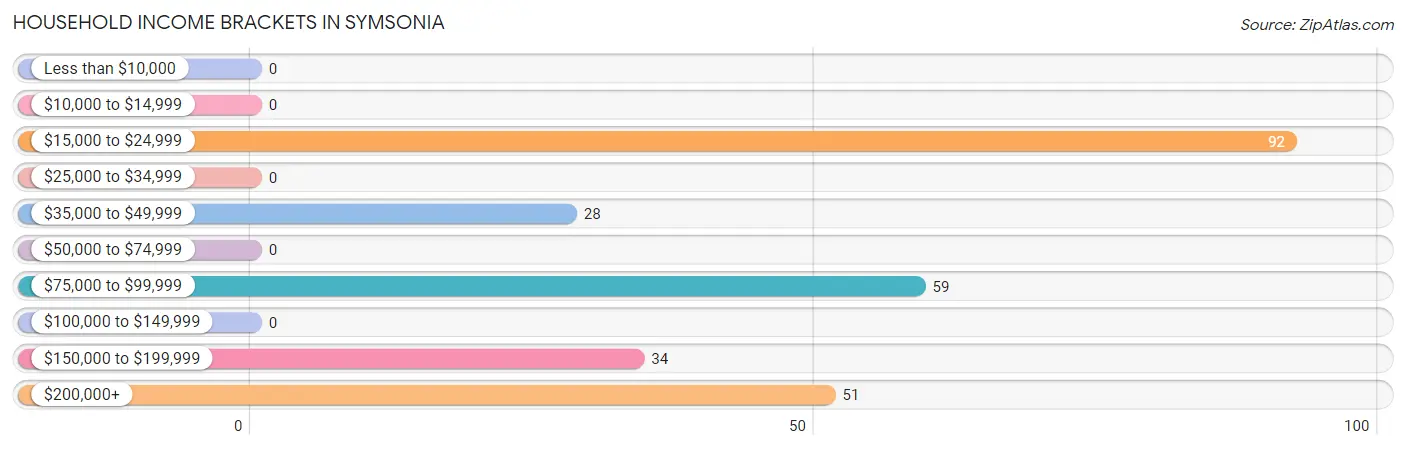
Household Income Brackets in Symsonia
With 92 households falling in the category, the $15,000 to $24,999 income range is the most frequent in Symsonia, accounting for 34.8% of all households.
| Income Bracket | # Households | % Households |
| Less than $10,000 | 0 | 0.0% |
| $10,000 to $14,999 | 0 | 0.0% |
| $15,000 to $24,999 | 92 | 34.8% |
| $25,000 to $34,999 | 0 | 0.0% |
| $35,000 to $49,999 | 28 | 10.6% |
| $50,000 to $74,999 | 0 | 0.0% |
| $75,000 to $99,999 | 59 | 22.3% |
| $100,000 to $149,999 | 0 | 0.0% |
| $150,000 to $199,999 | 34 | 12.9% |
| $200,000+ | 51 | 19.3% |
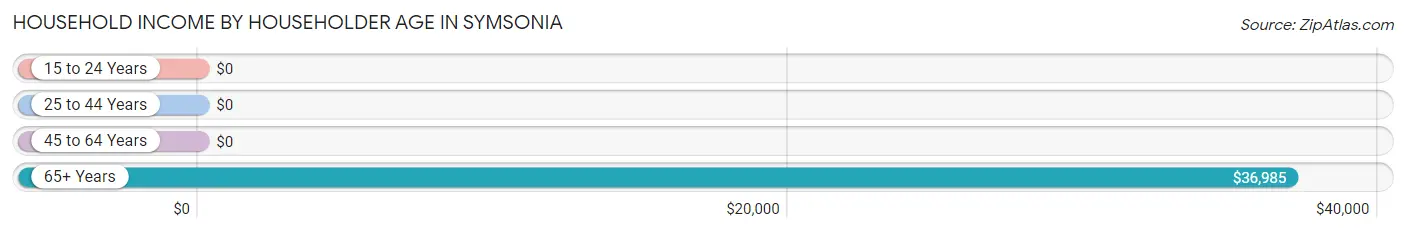
Household Income by Householder Age in Symsonia
The median household income in Symsonia is $76,000, with the highest median household income of $36,985 found in the 65+ years age bracket for the primary householder. A total of 53 households (20.1%) fall into this category.
| Income Bracket | # Households | Median Income |
| 15 to 24 Years | 0 (0.0%) | $0 |
| 25 to 44 Years | 43 (16.3%) | $0 |
| 45 to 64 Years | 168 (63.6%) | $0 |
| 65+ Years | 53 (20.1%) | $36,985 |
| Total | 264 (100.0%) | $76,000 |
Poverty in Symsonia
Income Below Poverty by Sex and Age in Symsonia
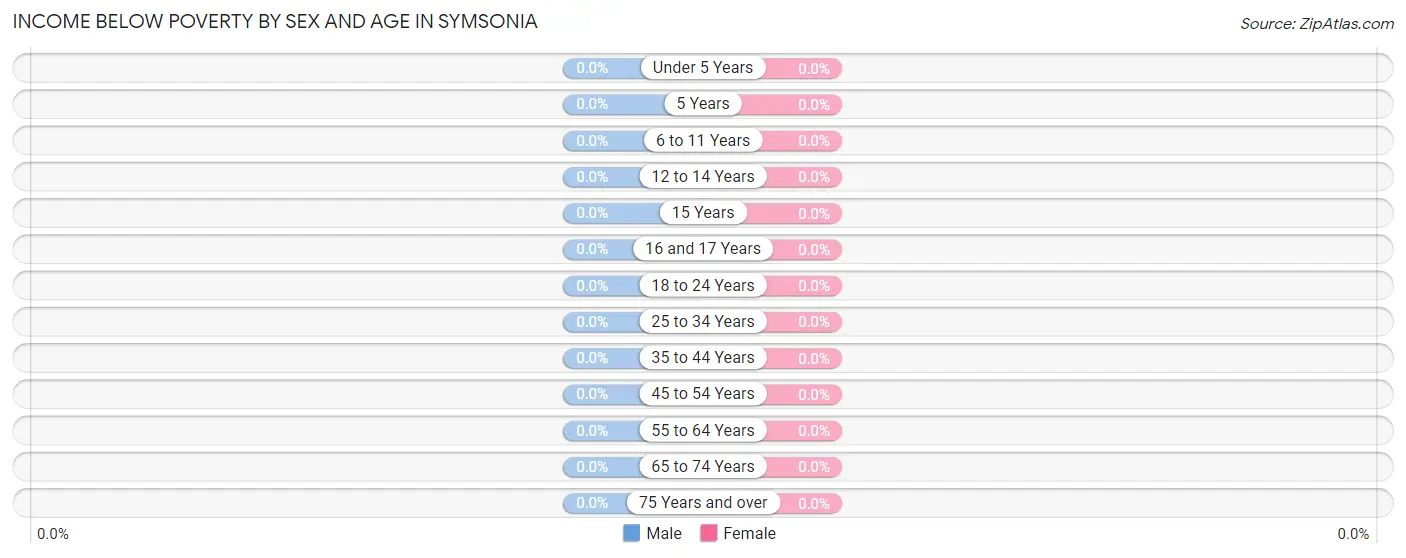
| Age Bracket | Male | Female |
| Under 5 Years | 0 (0.0%) | 0 (0.0%) |
| 5 Years | 0 (0.0%) | 0 (0.0%) |
| 6 to 11 Years | 0 (0.0%) | 0 (0.0%) |
| 12 to 14 Years | 0 (0.0%) | 0 (0.0%) |
| 15 Years | 0 (0.0%) | 0 (0.0%) |
| 16 and 17 Years | 0 (0.0%) | 0 (0.0%) |
| 18 to 24 Years | 0 (0.0%) | 0 (0.0%) |
| 25 to 34 Years | 0 (0.0%) | 0 (0.0%) |
| 35 to 44 Years | 0 (0.0%) | 0 (0.0%) |
| 45 to 54 Years | 0 (0.0%) | 0 (0.0%) |
| 55 to 64 Years | 0 (0.0%) | 0 (0.0%) |
| 65 to 74 Years | 0 (0.0%) | 0 (0.0%) |
| 75 Years and over | 0 (0.0%) | 0 (0.0%) |
| Total | 0 (0.0%) | 0 (0.0%) |
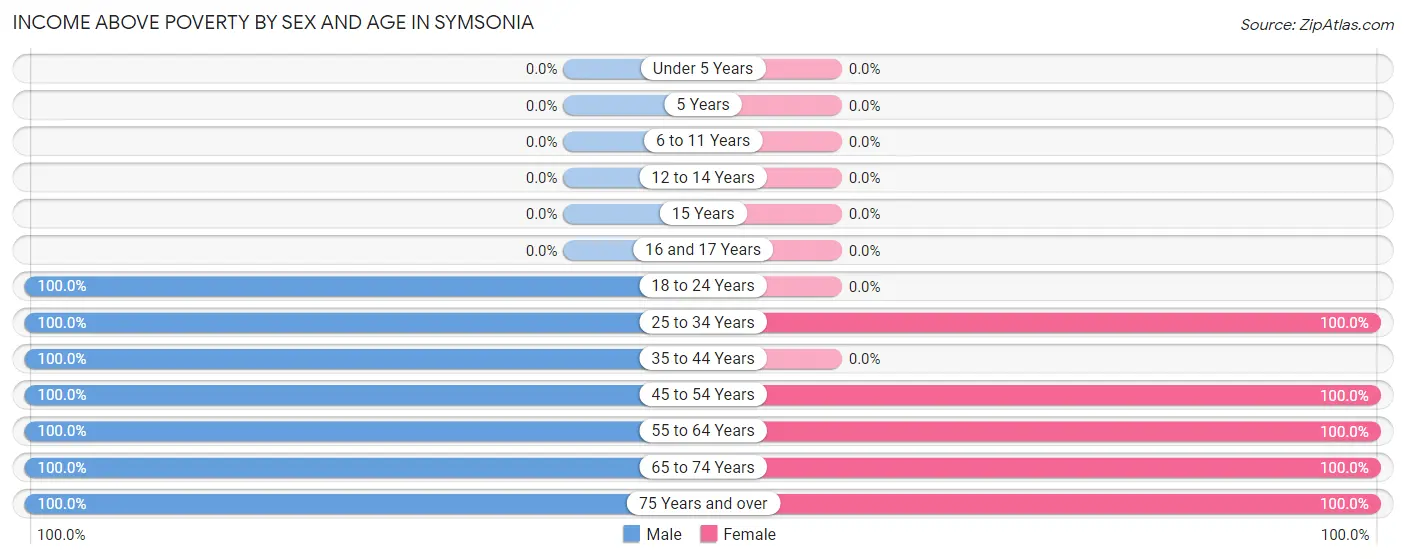
Income Above Poverty by Sex and Age in Symsonia
According to the poverty statistics in Symsonia, males aged 18 to 24 years and females aged 25 to 34 years are the age groups that are most secure financially, with 100.0% of males and 100.0% of females in these age groups living above the poverty line.
| Age Bracket | Male | Female |
| Under 5 Years | 0 (0.0%) | 0 (0.0%) |
| 5 Years | 0 (0.0%) | 0 (0.0%) |
| 6 to 11 Years | 0 (0.0%) | 0 (0.0%) |
| 12 to 14 Years | 0 (0.0%) | 0 (0.0%) |
| 15 Years | 0 (0.0%) | 0 (0.0%) |
| 16 and 17 Years | 0 (0.0%) | 0 (0.0%) |
| 18 to 24 Years | 31 (100.0%) | 0 (0.0%) |
| 25 to 34 Years | 35 (100.0%) | 13 (100.0%) |
| 35 to 44 Years | 30 (100.0%) | 0 (0.0%) |
| 45 to 54 Years | 21 (100.0%) | 20 (100.0%) |
| 55 to 64 Years | 115 (100.0%) | 100 (100.0%) |
| 65 to 74 Years | 25 (100.0%) | 29 (100.0%) |
| 75 Years and over | 17 (100.0%) | 28 (100.0%) |
| Total | 274 (100.0%) | 190 (100.0%) |
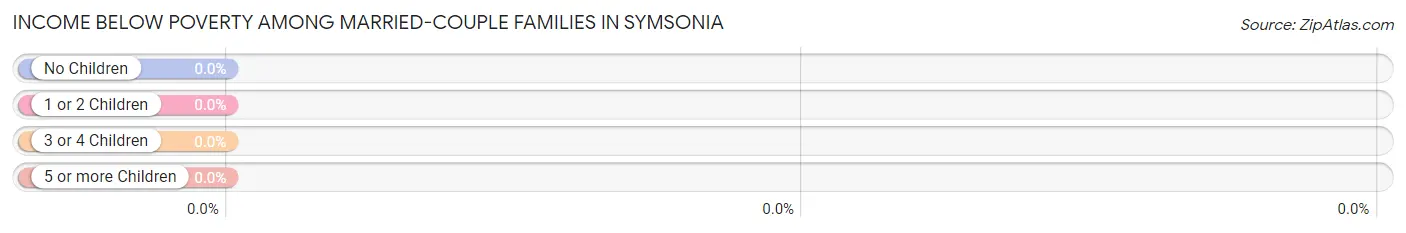
Income Below Poverty Among Married-Couple Families in Symsonia
| Children | Above Poverty | Below Poverty |
| No Children | 148 (100.0%) | 0 (0.0%) |
| 1 or 2 Children | 0 (0.0%) | 0 (0.0%) |
| 3 or 4 Children | 0 (0.0%) | 0 (0.0%) |
| 5 or more Children | 0 (0.0%) | 0 (0.0%) |
| Total | 148 (100.0%) | 0 (0.0%) |
Income Below Poverty Among Single-Parent Households in Symsonia
| Children | Single Father | Single Mother |
| No Children | 0 (0.0%) | 0 (0.0%) |
| 1 or 2 Children | 0 (0.0%) | 0 (0.0%) |
| 3 or 4 Children | 0 (0.0%) | 0 (0.0%) |
| 5 or more Children | 0 (0.0%) | 0 (0.0%) |
| Total | 0 (0.0%) | 0 (0.0%) |
Income Below Poverty Among Married-Couple vs Single-Parent Households in Symsonia
| Children | Married-Couple Families | Single-Parent Households |
| No Children | 0 (0.0%) | 0 (0.0%) |
| 1 or 2 Children | 0 (0.0%) | 0 (0.0%) |
| 3 or 4 Children | 0 (0.0%) | 0 (0.0%) |
| 5 or more Children | 0 (0.0%) | 0 (0.0%) |
| Total | 0 (0.0%) | 0 (0.0%) |
Race in Symsonia
The most populous races in Symsonia are , and White / Caucasian (464 | 100.0%).
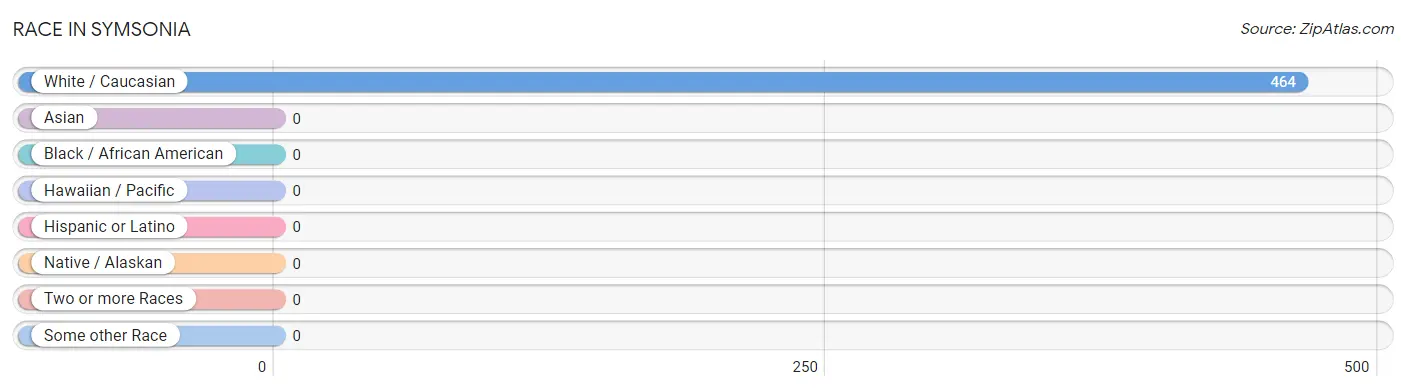
| Race | # Population | % Population |
| Asian | 0 | 0.0% |
| Black / African American | 0 | 0.0% |
| Hawaiian / Pacific | 0 | 0.0% |
| Hispanic or Latino | 0 | 0.0% |
| Native / Alaskan | 0 | 0.0% |
| White / Caucasian | 464 | 100.0% |
| Two or more Races | 0 | 0.0% |
| Some other Race | 0 | 0.0% |
| Total | 464 | 100.0% |
Ancestry in Symsonia
The most populous ancestries reported in Symsonia are American (134 | 28.9%), German (62 | 13.4%), English (47 | 10.1%), Irish (30 | 6.5%), and Scotch-Irish (17 | 3.7%), together accounting for 62.5% of all Symsonia residents.
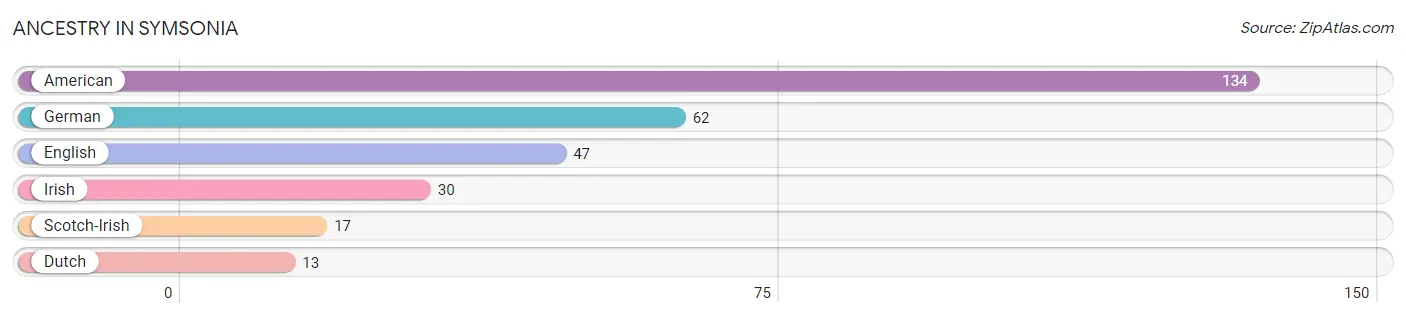
| Ancestry | # Population | % Population |
| American | 134 | 28.9% |
| Dutch | 13 | 2.8% |
| English | 47 | 10.1% |
| German | 62 | 13.4% |
| Irish | 30 | 6.5% |
| Scotch-Irish | 17 | 3.7% | View All 6 Rows |
Immigrants in Symsonia

| Immigration Origin | # Population | % Population | View All 0 Rows |
Sex and Age in Symsonia
Sex and Age in Symsonia
The most populous age groups in Symsonia are 60 to 64 Years (68 | 24.8%) for men and 60 to 64 Years (61 | 32.1%) for women.
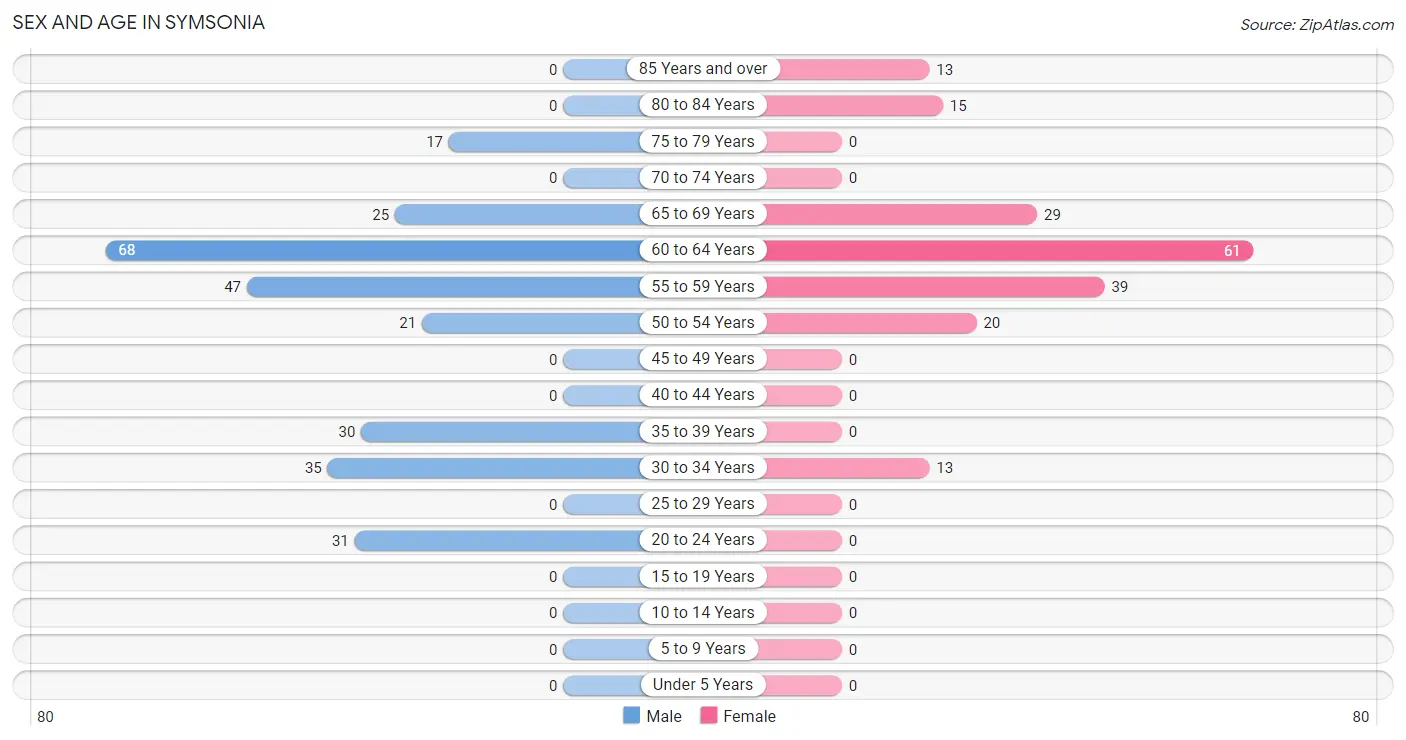
| Age Bracket | Male | Female |
| Under 5 Years | 0 (0.0%) | 0 (0.0%) |
| 5 to 9 Years | 0 (0.0%) | 0 (0.0%) |
| 10 to 14 Years | 0 (0.0%) | 0 (0.0%) |
| 15 to 19 Years | 0 (0.0%) | 0 (0.0%) |
| 20 to 24 Years | 31 (11.3%) | 0 (0.0%) |
| 25 to 29 Years | 0 (0.0%) | 0 (0.0%) |
| 30 to 34 Years | 35 (12.8%) | 13 (6.8%) |
| 35 to 39 Years | 30 (11.0%) | 0 (0.0%) |
| 40 to 44 Years | 0 (0.0%) | 0 (0.0%) |
| 45 to 49 Years | 0 (0.0%) | 0 (0.0%) |
| 50 to 54 Years | 21 (7.7%) | 20 (10.5%) |
| 55 to 59 Years | 47 (17.2%) | 39 (20.5%) |
| 60 to 64 Years | 68 (24.8%) | 61 (32.1%) |
| 65 to 69 Years | 25 (9.1%) | 29 (15.3%) |
| 70 to 74 Years | 0 (0.0%) | 0 (0.0%) |
| 75 to 79 Years | 17 (6.2%) | 0 (0.0%) |
| 80 to 84 Years | 0 (0.0%) | 15 (7.9%) |
| 85 Years and over | 0 (0.0%) | 13 (6.8%) |
| Total | 274 (100.0%) | 190 (100.0%) |
Families and Households in Symsonia
Median Family Size in Symsonia
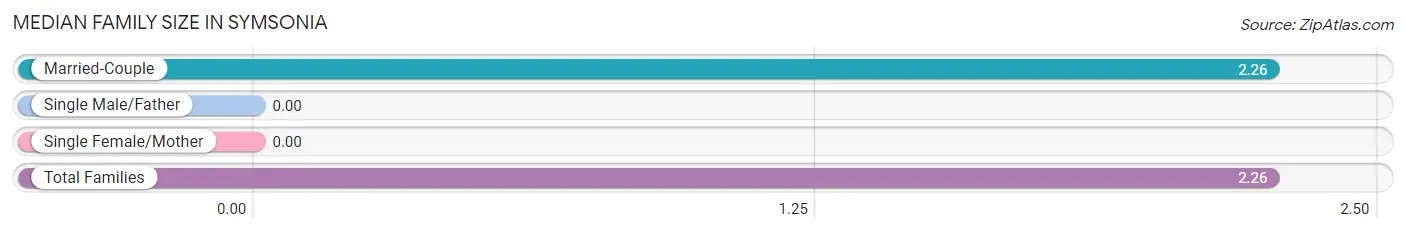
| Family Type | # Families | Family Size |
| Married-Couple | 148 (100.0%) | 2.26 |
| Single Male/Father | 0 (0.0%) | - |
| Single Female/Mother | 0 (0.0%) | - |
| Total Families | 148 (100.0%) | 2.26 |
Median Household Size in Symsonia
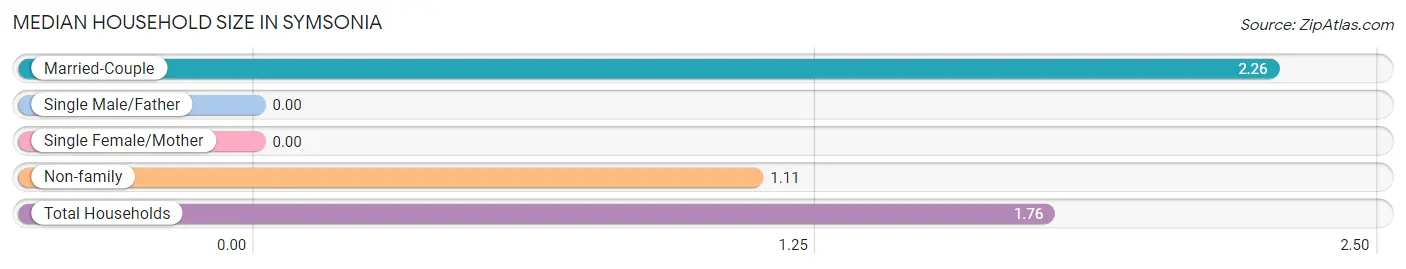
| Household Type | # Households | Household Size |
| Married-Couple | 148 (56.1%) | 2.26 |
| Single Male/Father | 0 (0.0%) | - |
| Single Female/Mother | 0 (0.0%) | - |
| Non-family | 116 (43.9%) | 1.11 |
| Total Households | 264 (100.0%) | 1.76 |
Household Size by Marriage Status in Symsonia
Out of a total of 264 households in Symsonia, 148 (56.1%) are family households, while 116 (43.9%) are nonfamily households. The most numerous type of family households are 2-person households, comprising 97, and the most common type of nonfamily households are 1-person households, comprising 105.
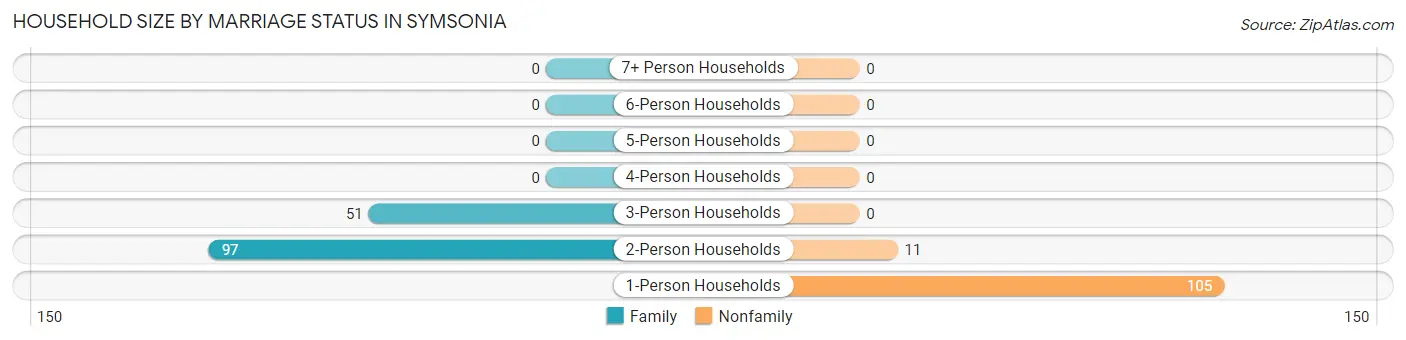
| Household Size | Family Households | Nonfamily Households |
| 1-Person Households | - | 105 (39.8%) |
| 2-Person Households | 97 (36.7%) | 11 (4.2%) |
| 3-Person Households | 51 (19.3%) | 0 (0.0%) |
| 4-Person Households | 0 (0.0%) | 0 (0.0%) |
| 5-Person Households | 0 (0.0%) | 0 (0.0%) |
| 6-Person Households | 0 (0.0%) | 0 (0.0%) |
| 7+ Person Households | 0 (0.0%) | 0 (0.0%) |
| Total | 148 (56.1%) | 116 (43.9%) |
Female Fertility in Symsonia
Fertility by Age in Symsonia
| Age Bracket | Women with Births | Births / 1,000 Women |
| 15 to 19 years | 0 (0.0%) | 0.0 |
| 20 to 34 years | 0 (0.0%) | 0.0 |
| 35 to 50 years | 0 (0.0%) | 0.0 |
| Total | 0 (0.0%) | 0.0 |
Fertility by Age by Marriage Status in Symsonia
| Age Bracket | Married | Unmarried |
| 15 to 19 years | 0 (0.0%) | 0 (0.0%) |
| 20 to 34 years | 0 (0.0%) | 0 (0.0%) |
| 35 to 50 years | 0 (0.0%) | 0 (0.0%) |
| Total | 0 (0.0%) | 0 (0.0%) |
Fertility by Education in Symsonia
| Educational Attainment | Women with Births | Births / 1,000 Women |
| Less than High School | 0 (0.0%) | 0.0 |
| High School Diploma | 0 (0.0%) | 0.0 |
| College or Associate's Degree | 0 (0.0%) | 0.0 |
| Bachelor's Degree | 0 (0.0%) | 0.0 |
| Graduate Degree | 0 (0.0%) | 0.0 |
| Total | 0 (0.0%) | 0.0 |
Fertility by Education by Marriage Status in Symsonia
| Educational Attainment | Married | Unmarried |
| Less than High School | 0 (0.0%) | 0 (0.0%) |
| High School Diploma | 0 (0.0%) | 0 (0.0%) |
| College or Associate's Degree | 0 (0.0%) | 0 (0.0%) |
| Bachelor's Degree | 0 (0.0%) | 0 (0.0%) |
| Graduate Degree | 0 (0.0%) | 0 (0.0%) |
| Total | 0 (0.0%) | 0 (0.0%) |
Employment Characteristics in Symsonia
Employment by Class of Employer in Symsonia
Among the 247 employed individuals in Symsonia, private company employees (189 | 76.5%), local government employees (21 | 8.5%), and not-for-profit organizations (20 | 8.1%) make up the most common classes of employment.
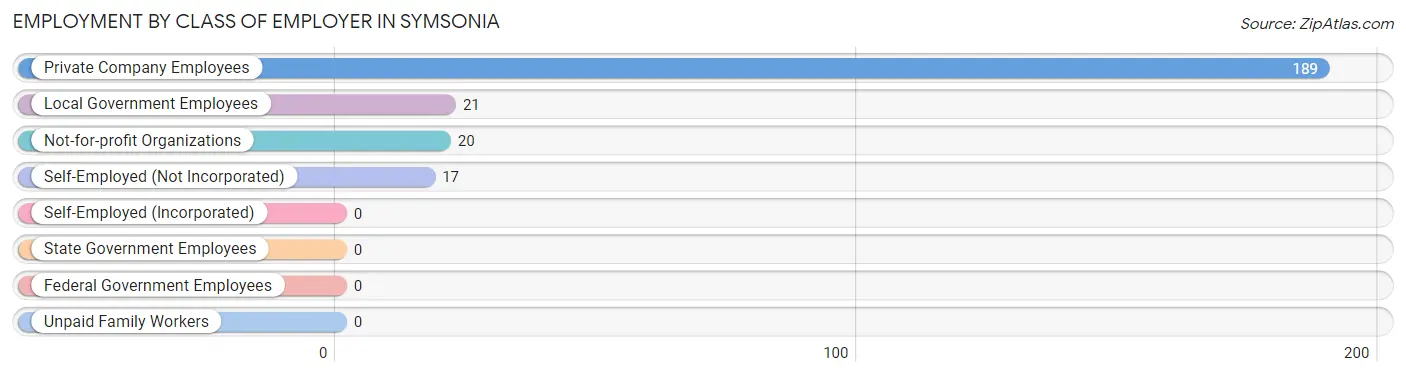
| Employer Class | # Employees | % Employees |
| Private Company Employees | 189 | 76.5% |
| Self-Employed (Incorporated) | 0 | 0.0% |
| Self-Employed (Not Incorporated) | 17 | 6.9% |
| Not-for-profit Organizations | 20 | 8.1% |
| Local Government Employees | 21 | 8.5% |
| State Government Employees | 0 | 0.0% |
| Federal Government Employees | 0 | 0.0% |
| Unpaid Family Workers | 0 | 0.0% |
| Total | 247 | 100.0% |
Employment Status by Age in Symsonia
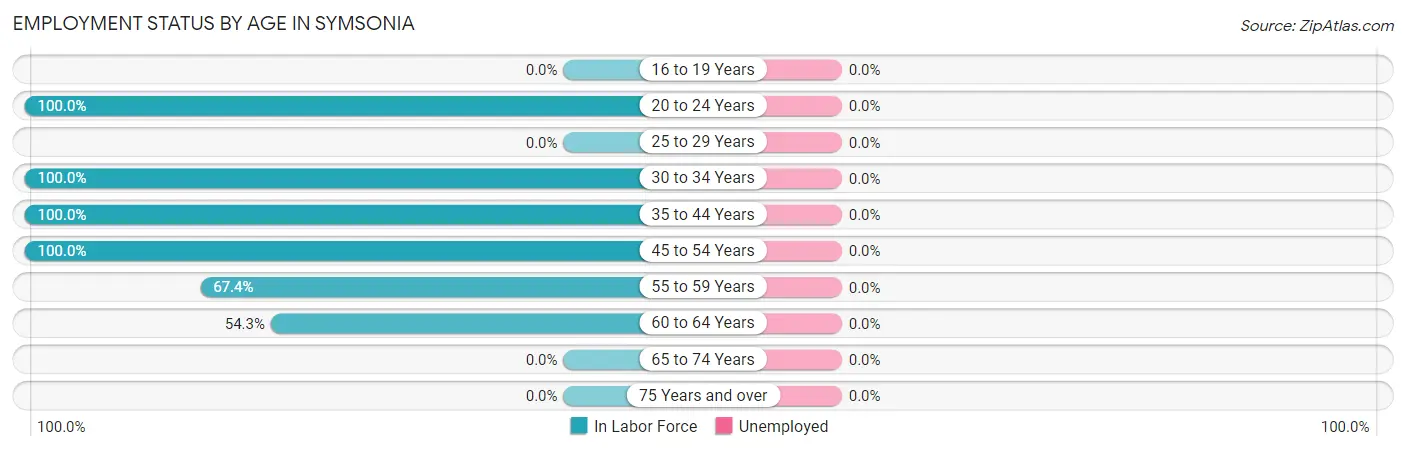
| Age Bracket | In Labor Force | Unemployed |
| 16 to 19 Years | 0 (0.0%) | 0 (0.0%) |
| 20 to 24 Years | 31 (100.0%) | 0 (0.0%) |
| 25 to 29 Years | 0 (0.0%) | 0 (0.0%) |
| 30 to 34 Years | 48 (100.0%) | 0 (0.0%) |
| 35 to 44 Years | 30 (100.0%) | 0 (0.0%) |
| 45 to 54 Years | 41 (100.0%) | 0 (0.0%) |
| 55 to 59 Years | 58 (67.4%) | 0 (0.0%) |
| 60 to 64 Years | 70 (54.3%) | 0 (0.0%) |
| 65 to 74 Years | 0 (0.0%) | 0 (0.0%) |
| 75 Years and over | 0 (0.0%) | 0 (0.0%) |
| Total | 278 (59.9%) | 0 (0.0%) |
Employment Status by Educational Attainment in Symsonia
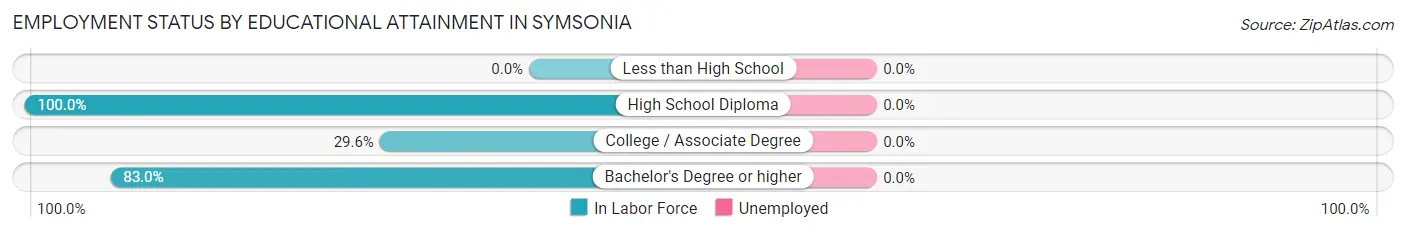
| Educational Attainment | In Labor Force | Unemployed |
| Less than High School | 0 (0.0%) | 0 (0.0%) |
| High School Diploma | 77 (100.0%) | 0 (0.0%) |
| College / Associate Degree | 24 (29.6%) | 0 (0.0%) |
| Bachelor's Degree or higher | 146 (83.0%) | 0 (0.0%) |
| Total | 247 (74.0%) | 0 (0.0%) |
Employment Occupations by Sex in Symsonia
Management, Business, Science and Arts Occupations
The most common Management, Business, Science and Arts occupations in Symsonia are Health Diagnosing & Treating (83 | 29.9%), Health Technologists (52 | 18.7%), Management (21 | 7.5%), Community & Social Service (17 | 6.1%), and Legal Services & Support (17 | 6.1%).
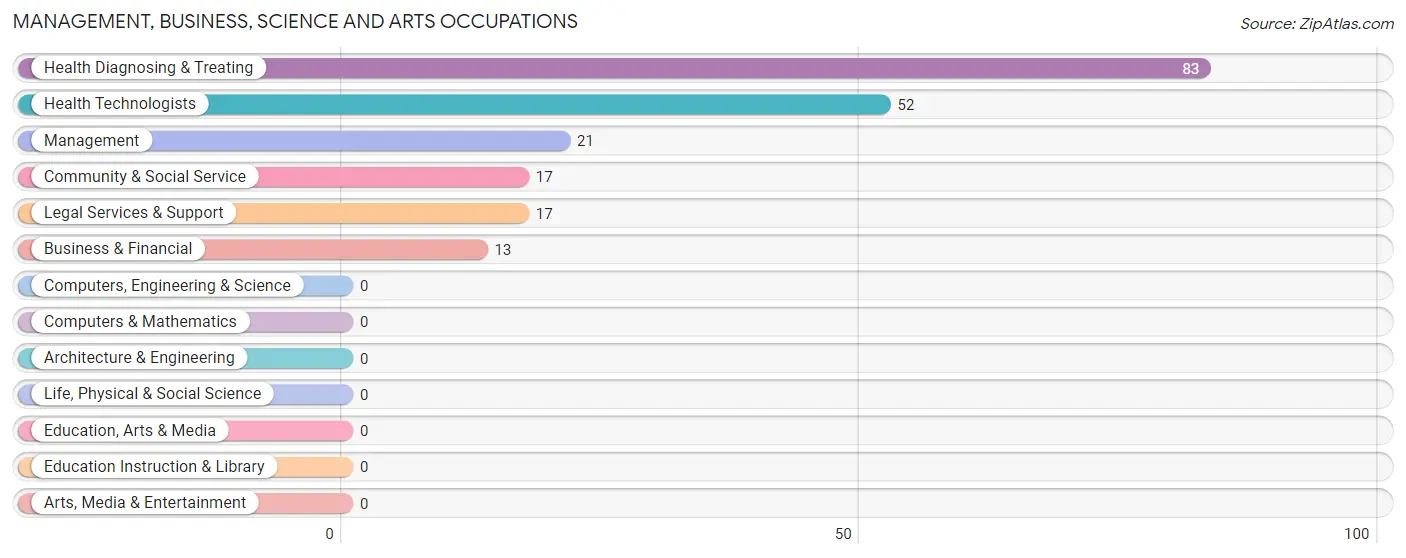
Management, Business, Science and Arts Occupations by Sex
Within the Management, Business, Science and Arts occupations in Symsonia, the most male-oriented occupations are Management (100.0%), Community & Social Service (100.0%), and Legal Services & Support (100.0%), while the most female-oriented occupations are Business & Financial (100.0%), Health Technologists (100.0%), and Health Diagnosing & Treating (62.6%).
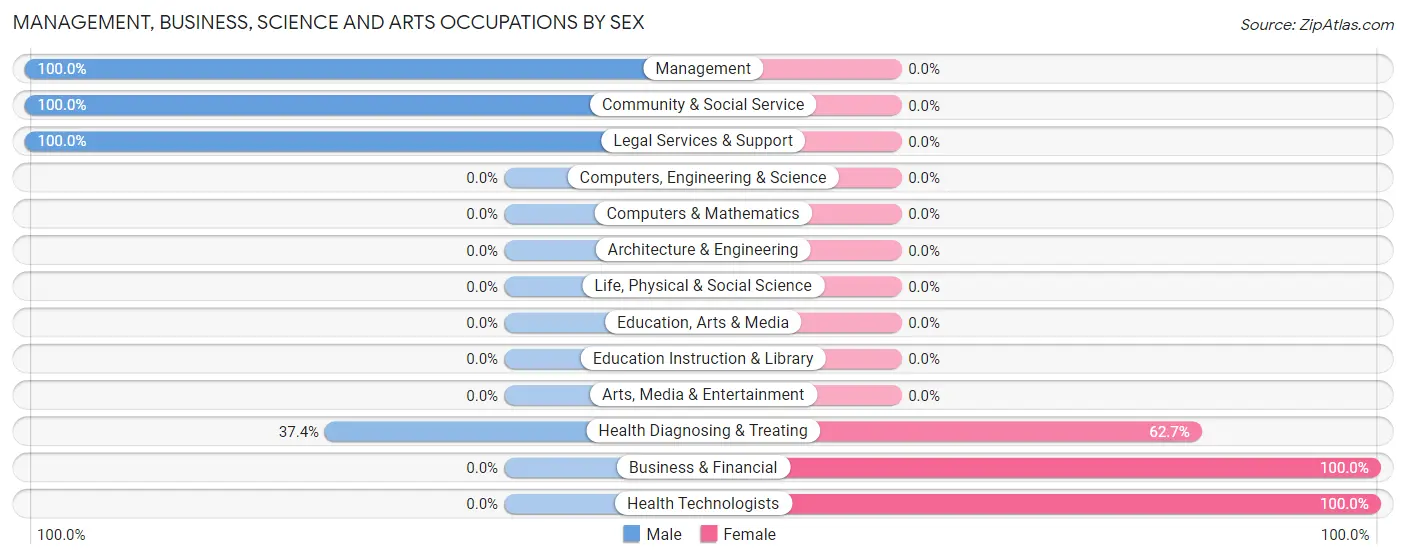
| Occupation | Male | Female |
| Management | 21 (100.0%) | 0 (0.0%) |
| Business & Financial | 0 (0.0%) | 13 (100.0%) |
| Computers, Engineering & Science | 0 (0.0%) | 0 (0.0%) |
| Computers & Mathematics | 0 (0.0%) | 0 (0.0%) |
| Architecture & Engineering | 0 (0.0%) | 0 (0.0%) |
| Life, Physical & Social Science | 0 (0.0%) | 0 (0.0%) |
| Community & Social Service | 17 (100.0%) | 0 (0.0%) |
| Education, Arts & Media | 0 (0.0%) | 0 (0.0%) |
| Legal Services & Support | 17 (100.0%) | 0 (0.0%) |
| Education Instruction & Library | 0 (0.0%) | 0 (0.0%) |
| Arts, Media & Entertainment | 0 (0.0%) | 0 (0.0%) |
| Health Diagnosing & Treating | 31 (37.3%) | 52 (62.6%) |
| Health Technologists | 0 (0.0%) | 52 (100.0%) |
| Total (Category) | 69 (51.5%) | 65 (48.5%) |
| Total (Overall) | 189 (68.0%) | 89 (32.0%) |
Services Occupations
The most common Services occupations in Symsonia are , and Healthcare Support (35 | 12.6%).
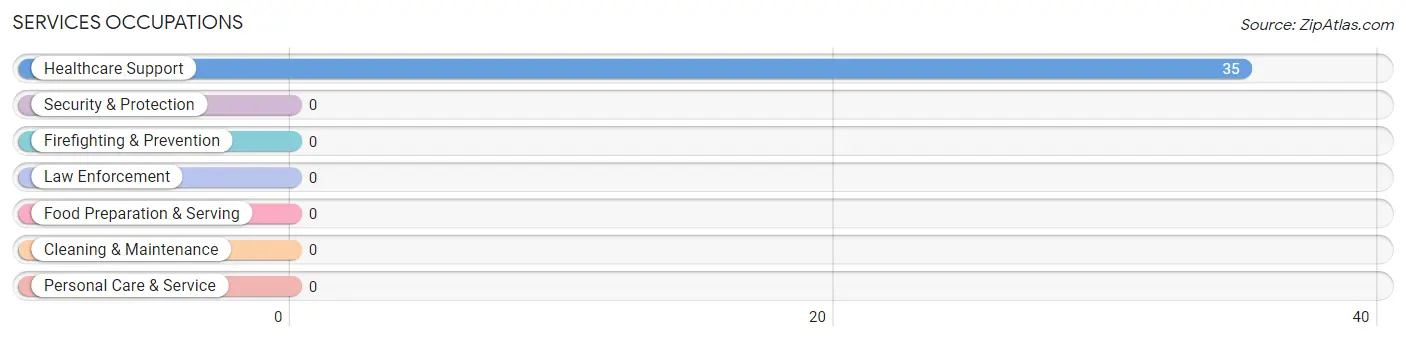
Services Occupations by Sex
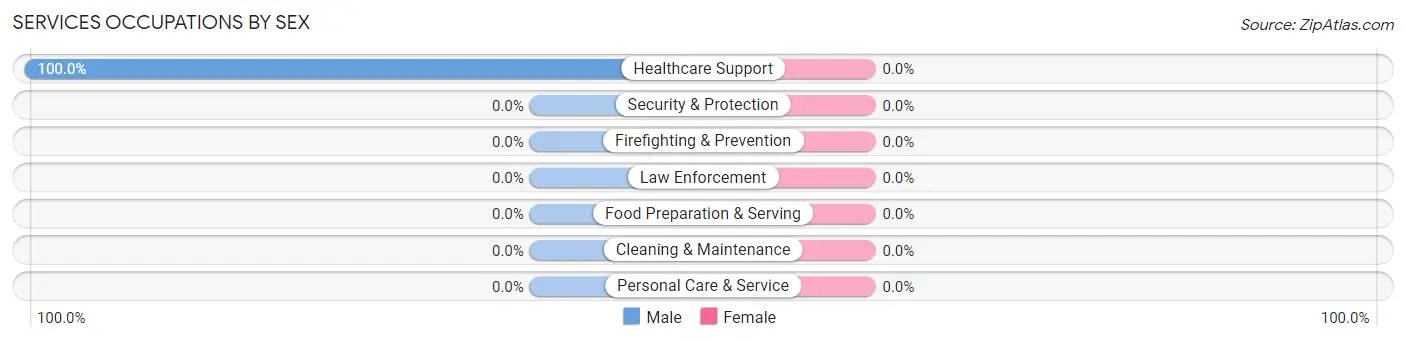
| Occupation | Male | Female |
| Healthcare Support | 35 (100.0%) | 0 (0.0%) |
| Security & Protection | 0 (0.0%) | 0 (0.0%) |
| Firefighting & Prevention | 0 (0.0%) | 0 (0.0%) |
| Law Enforcement | 0 (0.0%) | 0 (0.0%) |
| Food Preparation & Serving | 0 (0.0%) | 0 (0.0%) |
| Cleaning & Maintenance | 0 (0.0%) | 0 (0.0%) |
| Personal Care & Service | 0 (0.0%) | 0 (0.0%) |
| Total (Category) | 35 (100.0%) | 0 (0.0%) |
| Total (Overall) | 189 (68.0%) | 89 (32.0%) |
Sales and Office Occupations
The most common Sales and Office occupations in Symsonia are Sales & Related (55 | 19.8%), and Office & Administration (11 | 4.0%).
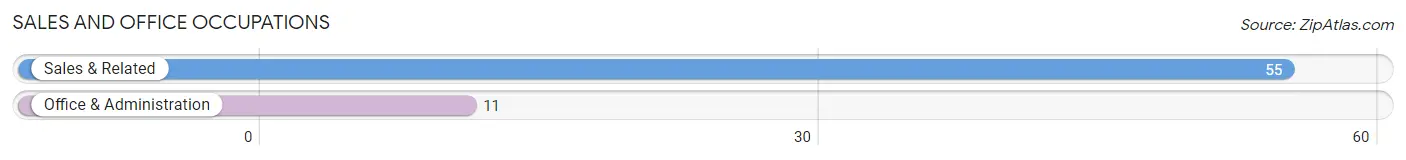
Sales and Office Occupations by Sex
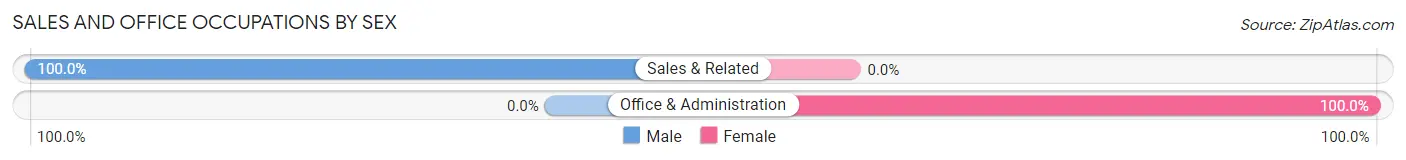
| Occupation | Male | Female |
| Sales & Related | 55 (100.0%) | 0 (0.0%) |
| Office & Administration | 0 (0.0%) | 11 (100.0%) |
| Total (Category) | 55 (83.3%) | 11 (16.7%) |
| Total (Overall) | 189 (68.0%) | 89 (32.0%) |
Natural Resources, Construction and Maintenance Occupations
The most common Natural Resources, Construction and Maintenance occupations in Symsonia are , and Construction & Extraction (30 | 10.8%).
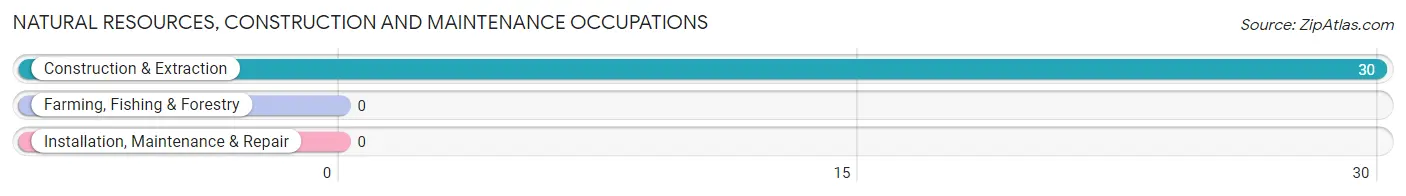
Natural Resources, Construction and Maintenance Occupations by Sex
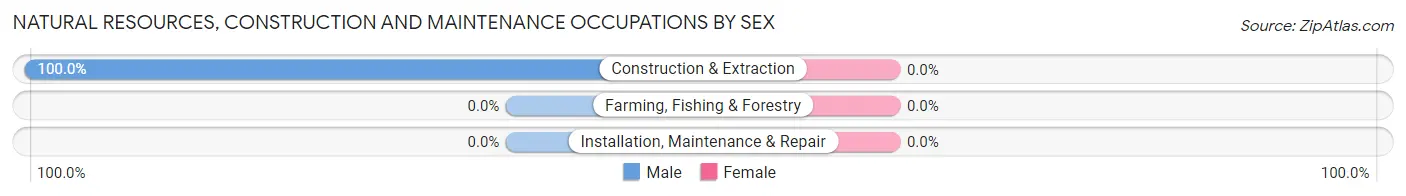
| Occupation | Male | Female |
| Farming, Fishing & Forestry | 0 (0.0%) | 0 (0.0%) |
| Construction & Extraction | 30 (100.0%) | 0 (0.0%) |
| Installation, Maintenance & Repair | 0 (0.0%) | 0 (0.0%) |
| Total (Category) | 30 (100.0%) | 0 (0.0%) |
| Total (Overall) | 189 (68.0%) | 89 (32.0%) |
Production, Transportation and Moving Occupations
The most common Production, Transportation and Moving occupations in Symsonia are , and Production (13 | 4.7%).
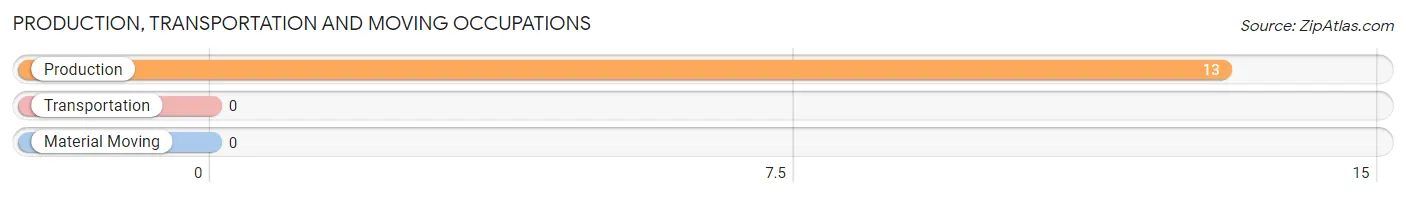
Production, Transportation and Moving Occupations by Sex
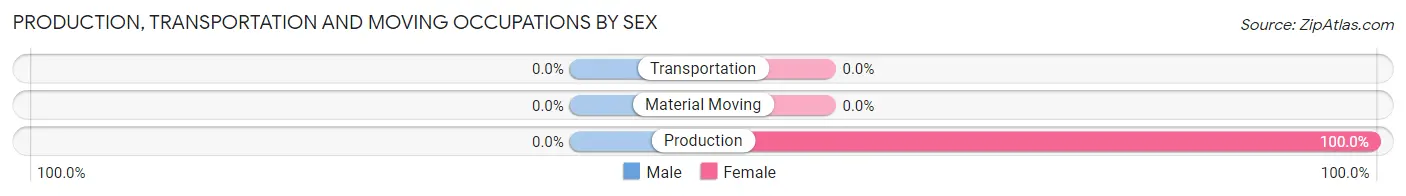
| Occupation | Male | Female |
| Production | 0 (0.0%) | 13 (100.0%) |
| Transportation | 0 (0.0%) | 0 (0.0%) |
| Material Moving | 0 (0.0%) | 0 (0.0%) |
| Total (Category) | 0 (0.0%) | 13 (100.0%) |
| Total (Overall) | 189 (68.0%) | 89 (32.0%) |
Employment Industries by Sex in Symsonia
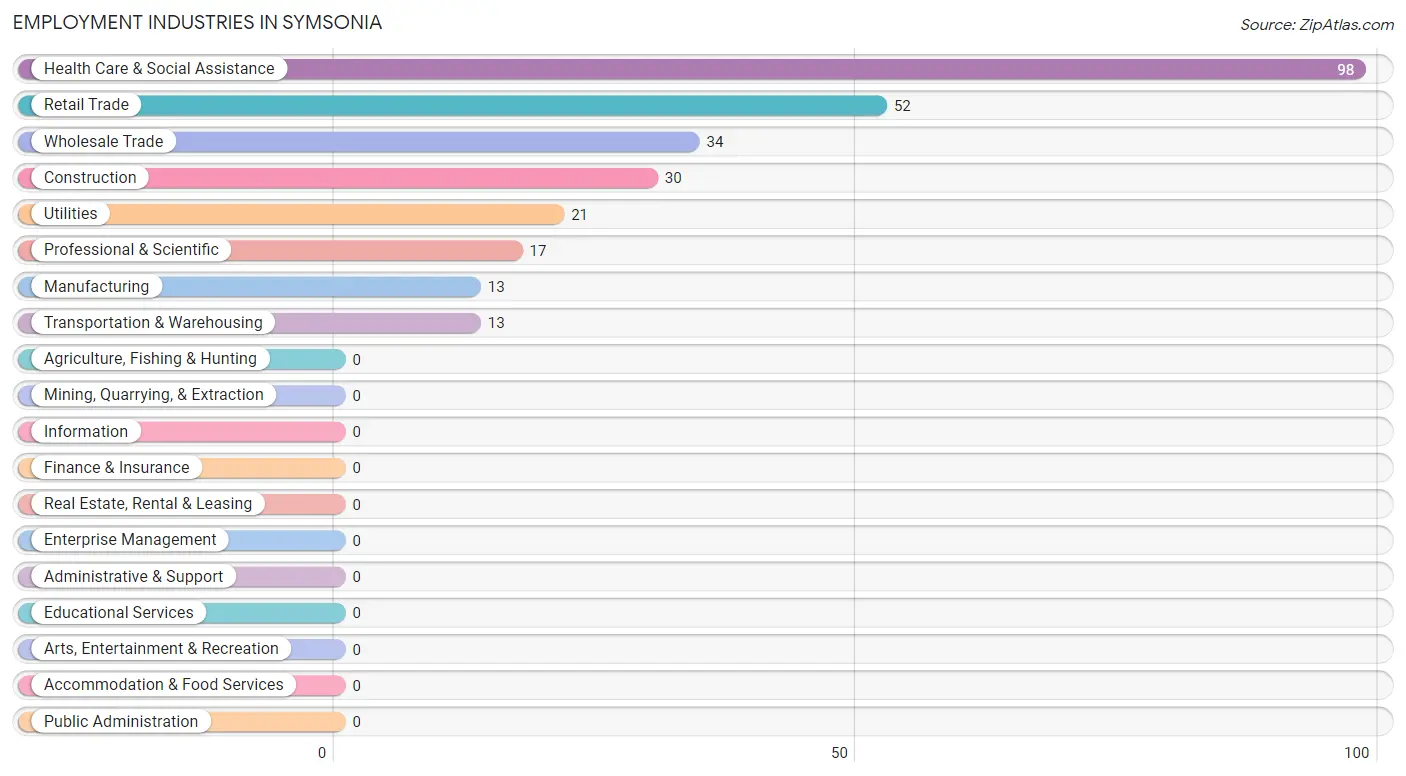
Employment Industries in Symsonia
The major employment industries in Symsonia include Health Care & Social Assistance (98 | 35.2%), Retail Trade (52 | 18.7%), Wholesale Trade (34 | 12.2%), Construction (30 | 10.8%), and Utilities (21 | 7.5%).
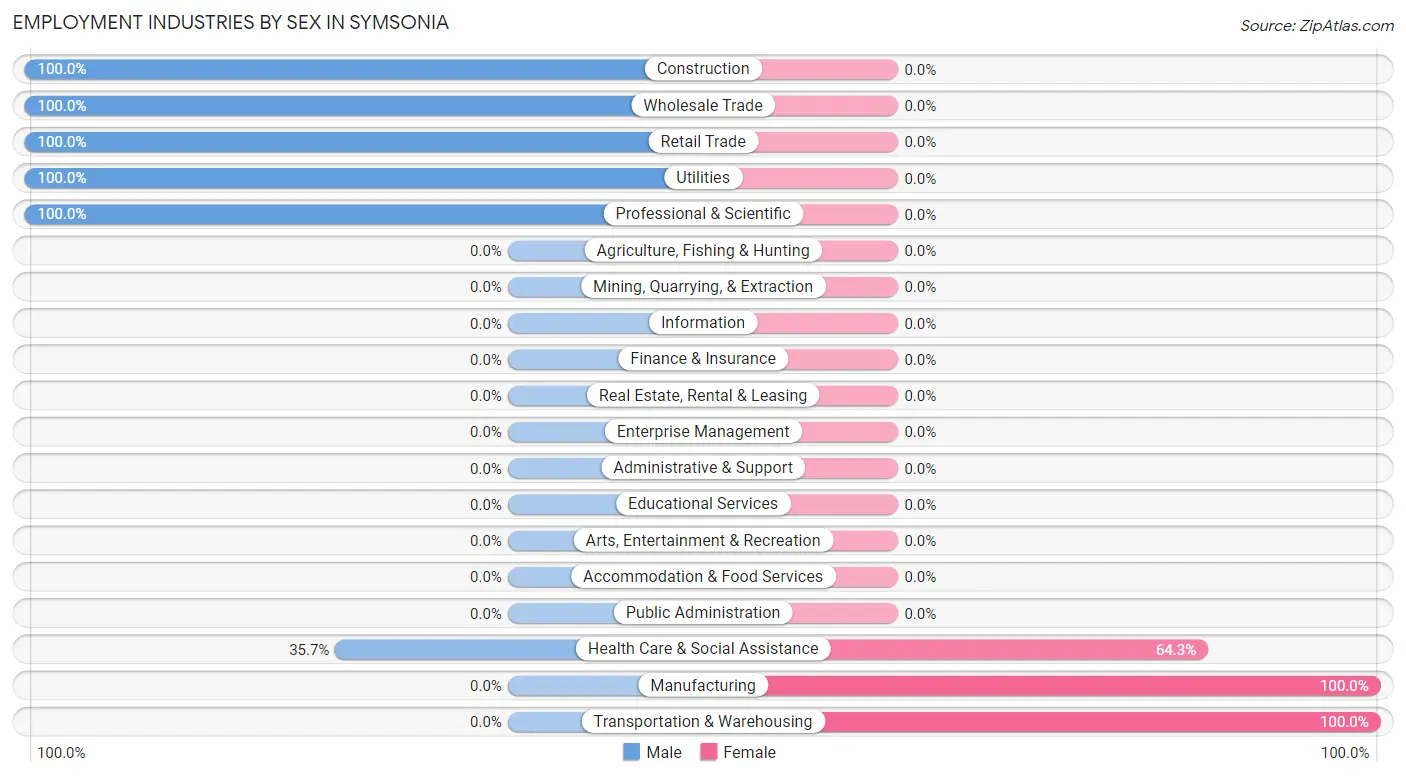
Employment Industries by Sex in Symsonia
The Symsonia industries that see more men than women are Construction (100.0%), Wholesale Trade (100.0%), and Retail Trade (100.0%), whereas the industries that tend to have a higher number of women are Manufacturing (100.0%), Transportation & Warehousing (100.0%), and Health Care & Social Assistance (64.3%).
| Industry | Male | Female |
| Agriculture, Fishing & Hunting | 0 (0.0%) | 0 (0.0%) |
| Mining, Quarrying, & Extraction | 0 (0.0%) | 0 (0.0%) |
| Construction | 30 (100.0%) | 0 (0.0%) |
| Manufacturing | 0 (0.0%) | 13 (100.0%) |
| Wholesale Trade | 34 (100.0%) | 0 (0.0%) |
| Retail Trade | 52 (100.0%) | 0 (0.0%) |
| Transportation & Warehousing | 0 (0.0%) | 13 (100.0%) |
| Utilities | 21 (100.0%) | 0 (0.0%) |
| Information | 0 (0.0%) | 0 (0.0%) |
| Finance & Insurance | 0 (0.0%) | 0 (0.0%) |
| Real Estate, Rental & Leasing | 0 (0.0%) | 0 (0.0%) |
| Professional & Scientific | 17 (100.0%) | 0 (0.0%) |
| Enterprise Management | 0 (0.0%) | 0 (0.0%) |
| Administrative & Support | 0 (0.0%) | 0 (0.0%) |
| Educational Services | 0 (0.0%) | 0 (0.0%) |
| Health Care & Social Assistance | 35 (35.7%) | 63 (64.3%) |
| Arts, Entertainment & Recreation | 0 (0.0%) | 0 (0.0%) |
| Accommodation & Food Services | 0 (0.0%) | 0 (0.0%) |
| Public Administration | 0 (0.0%) | 0 (0.0%) |
| Total | 189 (68.0%) | 89 (32.0%) |
Education in Symsonia
School Enrollment in Symsonia
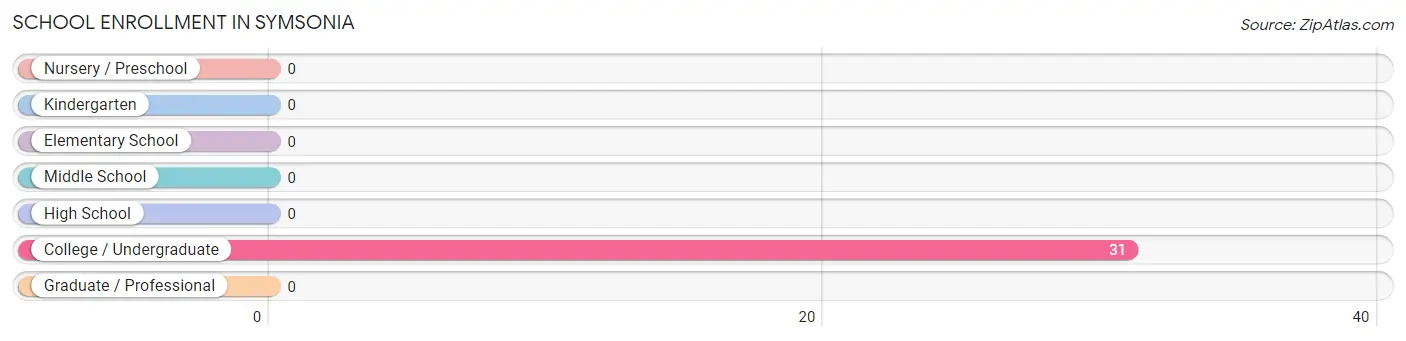
| School Level | # Students | % Students |
| Nursery / Preschool | 0 | 0.0% |
| Kindergarten | 0 | 0.0% |
| Elementary School | 0 | 0.0% |
| Middle School | 0 | 0.0% |
| High School | 0 | 0.0% |
| College / Undergraduate | 31 | 100.0% |
| Graduate / Professional | 0 | 0.0% |
| Total | 31 | 100.0% |
School Enrollment by Age by Funding Source in Symsonia
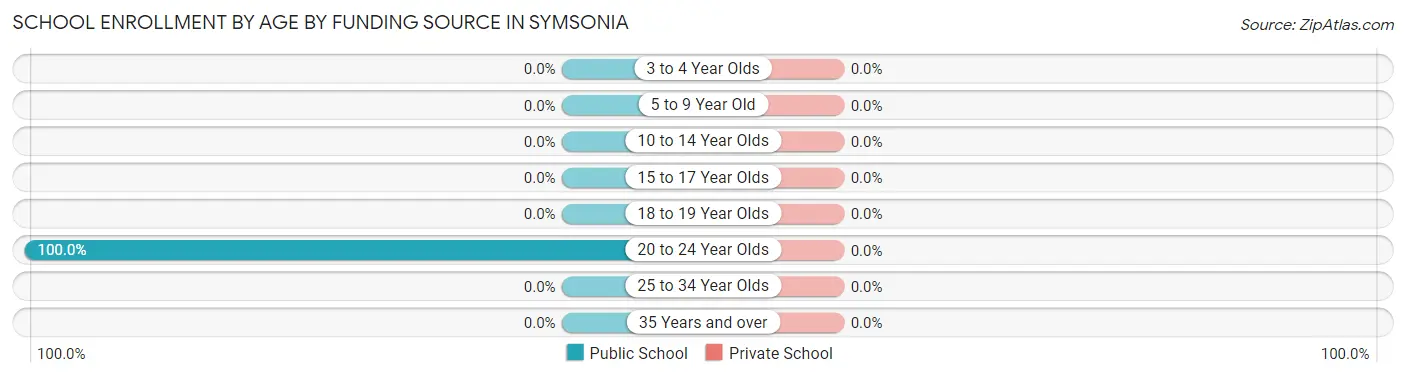
| Age Bracket | Public School | Private School |
| 3 to 4 Year Olds | 0 (0.0%) | 0 (0.0%) |
| 5 to 9 Year Old | 0 (0.0%) | 0 (0.0%) |
| 10 to 14 Year Olds | 0 (0.0%) | 0 (0.0%) |
| 15 to 17 Year Olds | 0 (0.0%) | 0 (0.0%) |
| 18 to 19 Year Olds | 0 (0.0%) | 0 (0.0%) |
| 20 to 24 Year Olds | 31 (100.0%) | 0 (0.0%) |
| 25 to 34 Year Olds | 0 (0.0%) | 0 (0.0%) |
| 35 Years and over | 0 (0.0%) | 0 (0.0%) |
| Total | 31 (100.0%) | 0 (0.0%) |
Educational Attainment by Field of Study in Symsonia
Science & technology (52 | 26.9%), social sciences (47 | 24.3%), business (38 | 19.7%), arts & humanities (35 | 18.1%), and liberal arts & history (21 | 10.9%) are the most common fields of study among 193 individuals in Symsonia who have obtained a bachelor's degree or higher.
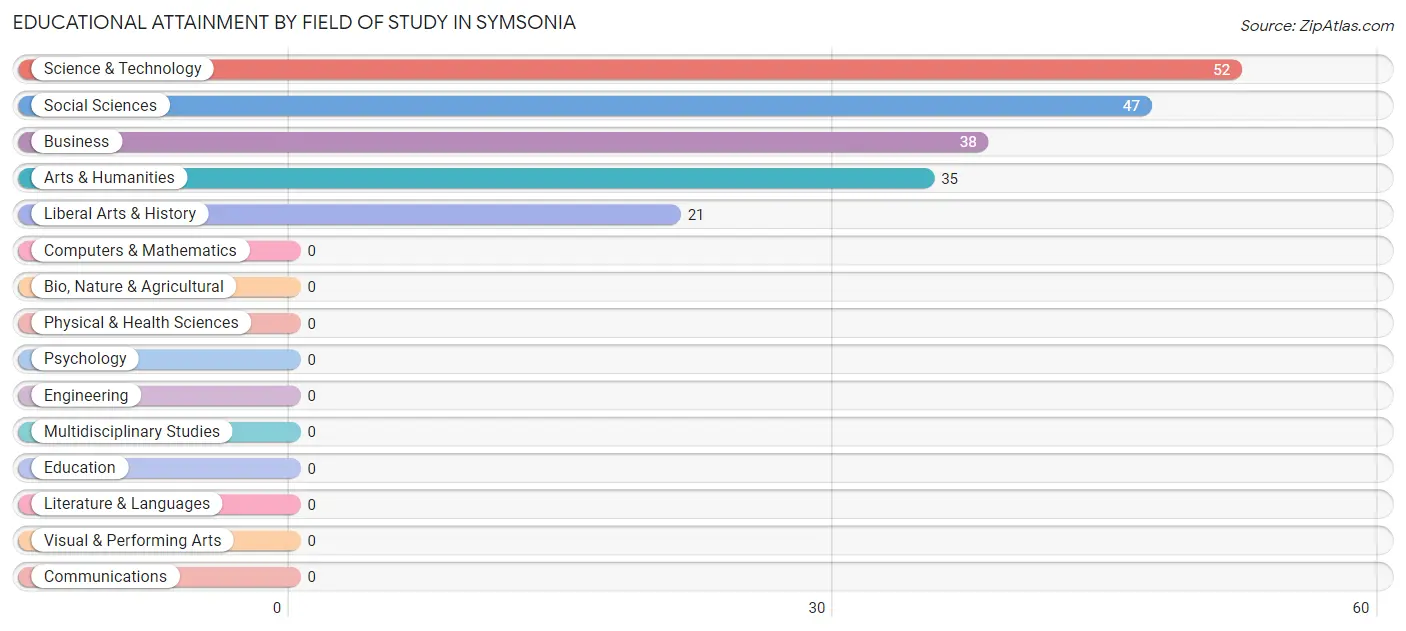
| Field of Study | # Graduates | % Graduates |
| Computers & Mathematics | 0 | 0.0% |
| Bio, Nature & Agricultural | 0 | 0.0% |
| Physical & Health Sciences | 0 | 0.0% |
| Psychology | 0 | 0.0% |
| Social Sciences | 47 | 24.3% |
| Engineering | 0 | 0.0% |
| Multidisciplinary Studies | 0 | 0.0% |
| Science & Technology | 52 | 26.9% |
| Business | 38 | 19.7% |
| Education | 0 | 0.0% |
| Literature & Languages | 0 | 0.0% |
| Liberal Arts & History | 21 | 10.9% |
| Visual & Performing Arts | 0 | 0.0% |
| Communications | 0 | 0.0% |
| Arts & Humanities | 35 | 18.1% |
| Total | 193 | 100.0% |
Transportation & Commute in Symsonia
Vehicle Availability by Sex in Symsonia
The most prevalent vehicle ownership categories in Symsonia are males with 3 vehicles (55, accounting for 34.8%) and females with 3 vehicles (31, making up 61.8%).
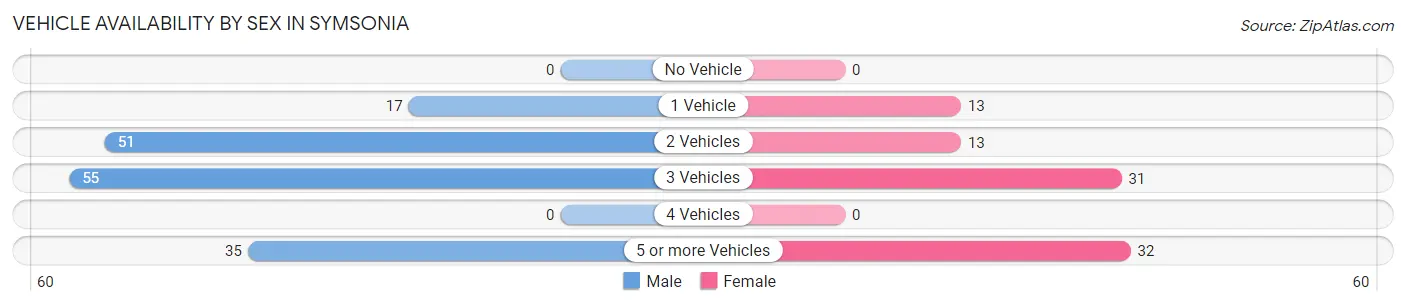
| Vehicles Available | Male | Female |
| No Vehicle | 0 (0.0%) | 0 (0.0%) |
| 1 Vehicle | 17 (10.8%) | 13 (14.6%) |
| 2 Vehicles | 51 (32.3%) | 13 (14.6%) |
| 3 Vehicles | 55 (34.8%) | 31 (34.8%) |
| 4 Vehicles | 0 (0.0%) | 0 (0.0%) |
| 5 or more Vehicles | 35 (22.2%) | 32 (36.0%) |
| Total | 158 (100.0%) | 89 (100.0%) |
Commute Time in Symsonia
The most frequently occuring commute durations in Symsonia are 30 to 34 minutes (120 commuters, 48.6%), less than 5 minutes (52 commuters, 21.0%), and 20 to 24 minutes (41 commuters, 16.6%).
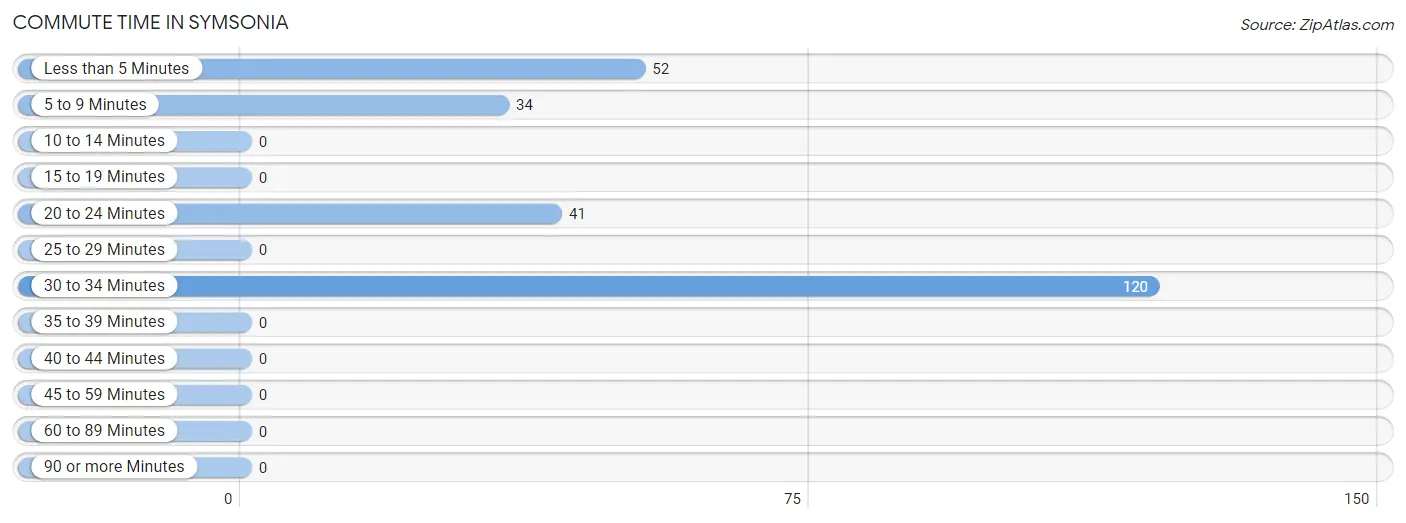
| Commute Time | # Commuters | % Commuters |
| Less than 5 Minutes | 52 | 21.0% |
| 5 to 9 Minutes | 34 | 13.8% |
| 10 to 14 Minutes | 0 | 0.0% |
| 15 to 19 Minutes | 0 | 0.0% |
| 20 to 24 Minutes | 41 | 16.6% |
| 25 to 29 Minutes | 0 | 0.0% |
| 30 to 34 Minutes | 120 | 48.6% |
| 35 to 39 Minutes | 0 | 0.0% |
| 40 to 44 Minutes | 0 | 0.0% |
| 45 to 59 Minutes | 0 | 0.0% |
| 60 to 89 Minutes | 0 | 0.0% |
| 90 or more Minutes | 0 | 0.0% |
Commute Time by Sex in Symsonia
The most common commute times in Symsonia are less than 5 minutes (52 commuters, 32.9%) for males and 30 to 34 minutes (69 commuters, 77.5%) for females.
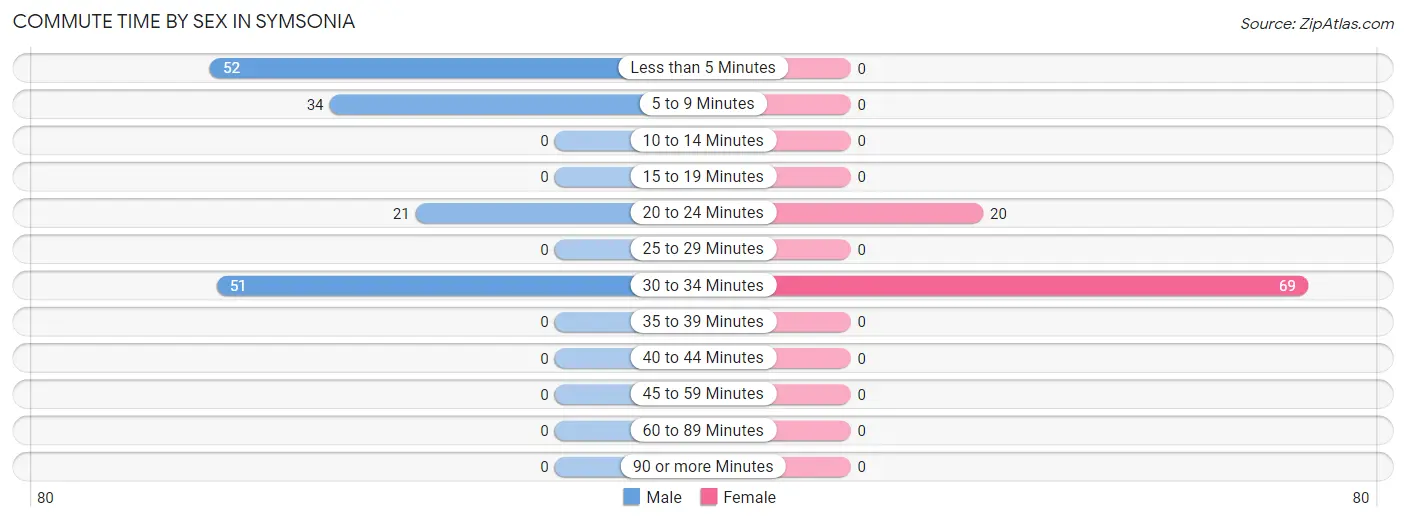
| Commute Time | Male | Female |
| Less than 5 Minutes | 52 (32.9%) | 0 (0.0%) |
| 5 to 9 Minutes | 34 (21.5%) | 0 (0.0%) |
| 10 to 14 Minutes | 0 (0.0%) | 0 (0.0%) |
| 15 to 19 Minutes | 0 (0.0%) | 0 (0.0%) |
| 20 to 24 Minutes | 21 (13.3%) | 20 (22.5%) |
| 25 to 29 Minutes | 0 (0.0%) | 0 (0.0%) |
| 30 to 34 Minutes | 51 (32.3%) | 69 (77.5%) |
| 35 to 39 Minutes | 0 (0.0%) | 0 (0.0%) |
| 40 to 44 Minutes | 0 (0.0%) | 0 (0.0%) |
| 45 to 59 Minutes | 0 (0.0%) | 0 (0.0%) |
| 60 to 89 Minutes | 0 (0.0%) | 0 (0.0%) |
| 90 or more Minutes | 0 (0.0%) | 0 (0.0%) |
Time of Departure to Work by Sex in Symsonia
The most frequent times of departure to work in Symsonia are 6:00 AM to 6:29 AM (86, 54.4%) for males and 7:30 AM to 7:59 AM (45, 50.6%) for females.
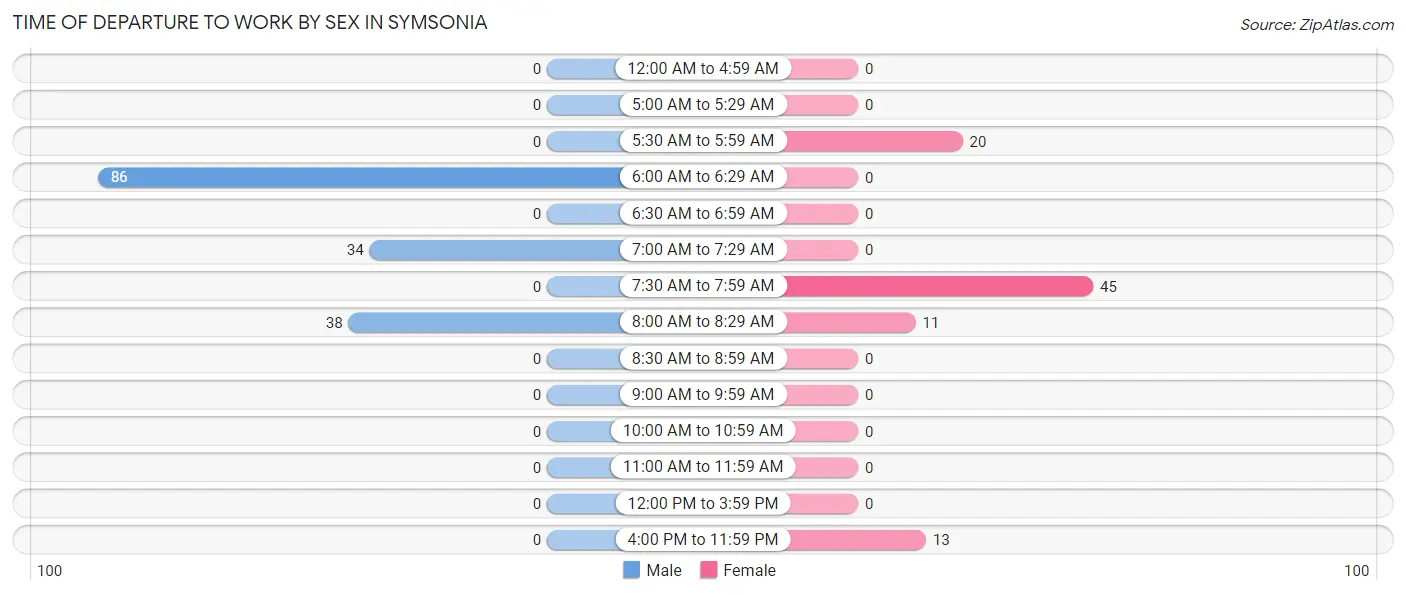
| Time of Departure | Male | Female |
| 12:00 AM to 4:59 AM | 0 (0.0%) | 0 (0.0%) |
| 5:00 AM to 5:29 AM | 0 (0.0%) | 0 (0.0%) |
| 5:30 AM to 5:59 AM | 0 (0.0%) | 20 (22.5%) |
| 6:00 AM to 6:29 AM | 86 (54.4%) | 0 (0.0%) |
| 6:30 AM to 6:59 AM | 0 (0.0%) | 0 (0.0%) |
| 7:00 AM to 7:29 AM | 34 (21.5%) | 0 (0.0%) |
| 7:30 AM to 7:59 AM | 0 (0.0%) | 45 (50.6%) |
| 8:00 AM to 8:29 AM | 38 (24.0%) | 11 (12.4%) |
| 8:30 AM to 8:59 AM | 0 (0.0%) | 0 (0.0%) |
| 9:00 AM to 9:59 AM | 0 (0.0%) | 0 (0.0%) |
| 10:00 AM to 10:59 AM | 0 (0.0%) | 0 (0.0%) |
| 11:00 AM to 11:59 AM | 0 (0.0%) | 0 (0.0%) |
| 12:00 PM to 3:59 PM | 0 (0.0%) | 0 (0.0%) |
| 4:00 PM to 11:59 PM | 0 (0.0%) | 13 (14.6%) |
| Total | 158 (100.0%) | 89 (100.0%) |
Housing Occupancy in Symsonia
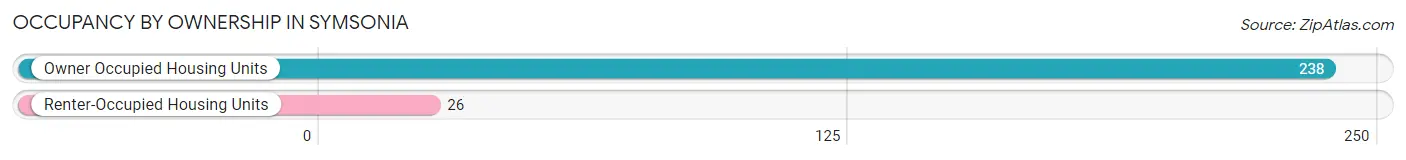
Occupancy by Ownership in Symsonia
Of the total 264 dwellings in Symsonia, owner-occupied units account for 238 (90.1%), while renter-occupied units make up 26 (9.9%).
| Occupancy | # Housing Units | % Housing Units |
| Owner Occupied Housing Units | 238 | 90.1% |
| Renter-Occupied Housing Units | 26 | 9.9% |
| Total Occupied Housing Units | 264 | 100.0% |
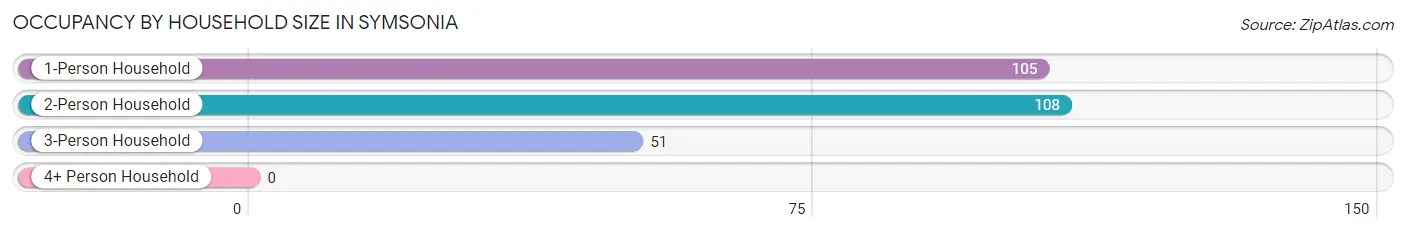
Occupancy by Household Size in Symsonia
| Household Size | # Housing Units | % Housing Units |
| 1-Person Household | 105 | 39.8% |
| 2-Person Household | 108 | 40.9% |
| 3-Person Household | 51 | 19.3% |
| 4+ Person Household | 0 | 0.0% |
| Total Housing Units | 264 | 100.0% |
Occupancy by Ownership by Household Size in Symsonia
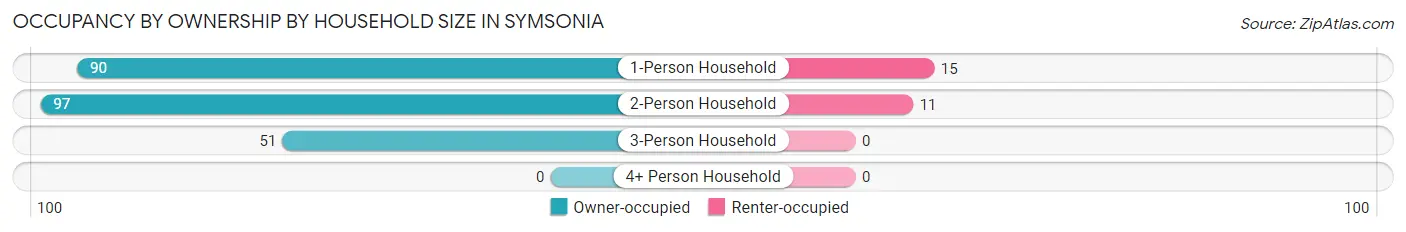
| Household Size | Owner-occupied | Renter-occupied |
| 1-Person Household | 90 (85.7%) | 15 (14.3%) |
| 2-Person Household | 97 (89.8%) | 11 (10.2%) |
| 3-Person Household | 51 (100.0%) | 0 (0.0%) |
| 4+ Person Household | 0 (0.0%) | 0 (0.0%) |
| Total Housing Units | 238 (90.1%) | 26 (9.9%) |
Occupancy by Educational Attainment in Symsonia
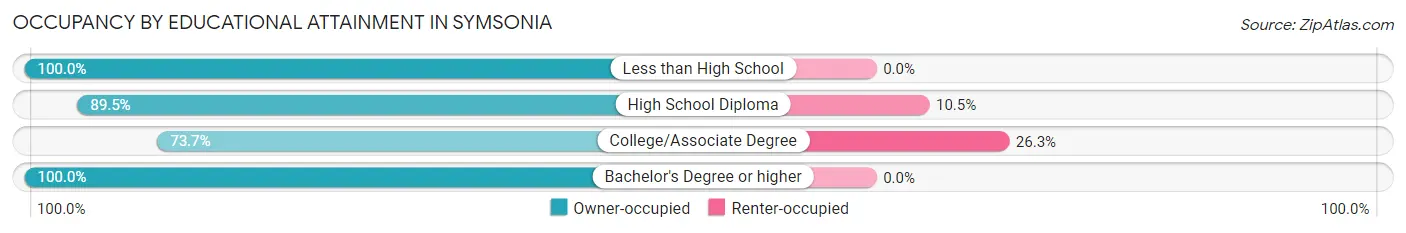
| Household Size | Owner-occupied | Renter-occupied |
| Less than High School | 13 (100.0%) | 0 (0.0%) |
| High School Diploma | 94 (89.5%) | 11 (10.5%) |
| College/Associate Degree | 42 (73.7%) | 15 (26.3%) |
| Bachelor's Degree or higher | 89 (100.0%) | 0 (0.0%) |
Occupancy by Age of Householder in Symsonia
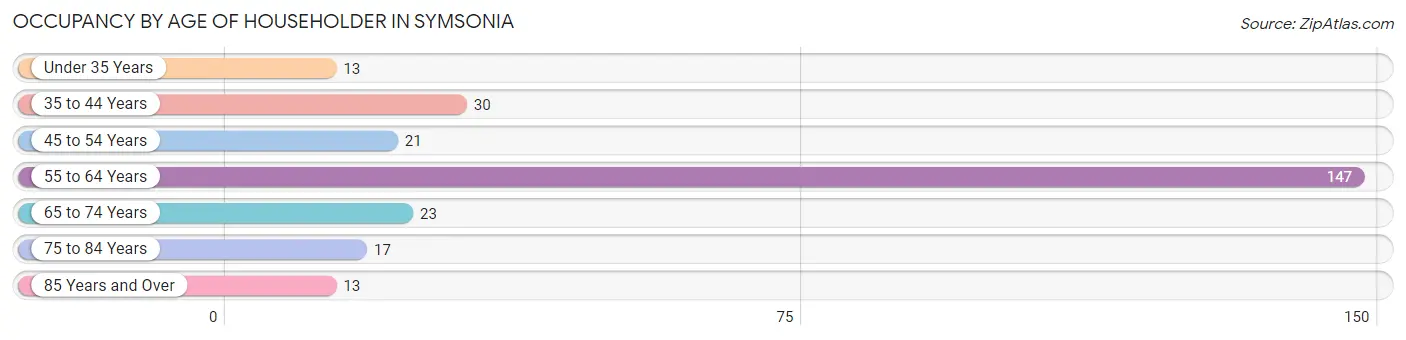
| Age Bracket | # Households | % Households |
| Under 35 Years | 13 | 4.9% |
| 35 to 44 Years | 30 | 11.4% |
| 45 to 54 Years | 21 | 8.0% |
| 55 to 64 Years | 147 | 55.7% |
| 65 to 74 Years | 23 | 8.7% |
| 75 to 84 Years | 17 | 6.4% |
| 85 Years and Over | 13 | 4.9% |
| Total | 264 | 100.0% |
Housing Finances in Symsonia
Median Income by Occupancy in Symsonia
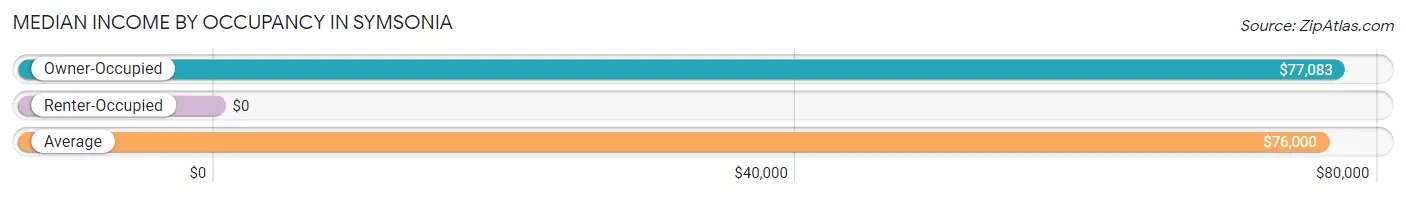
| Occupancy Type | # Households | Median Income |
| Owner-Occupied | 238 (90.1%) | $77,083 |
| Renter-Occupied | 26 (9.9%) | $0 |
| Average | 264 (100.0%) | $76,000 |
Occupancy by Householder Income Bracket in Symsonia
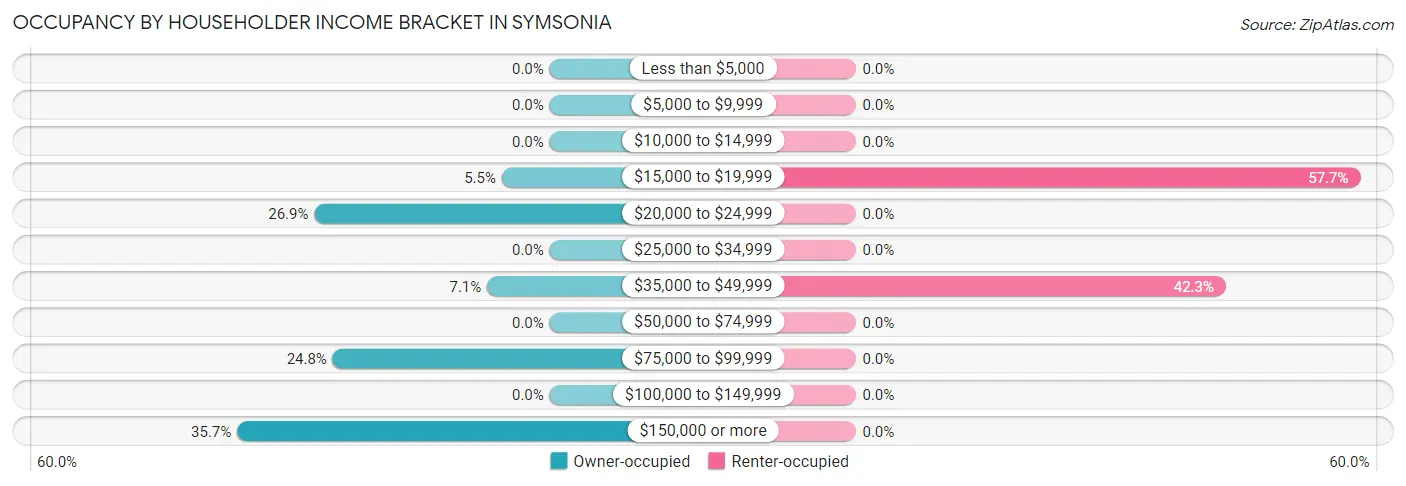
| Income Bracket | Owner-occupied | Renter-occupied |
| Less than $5,000 | 0 (0.0%) | 0 (0.0%) |
| $5,000 to $9,999 | 0 (0.0%) | 0 (0.0%) |
| $10,000 to $14,999 | 0 (0.0%) | 0 (0.0%) |
| $15,000 to $19,999 | 13 (5.5%) | 15 (57.7%) |
| $20,000 to $24,999 | 64 (26.9%) | 0 (0.0%) |
| $25,000 to $34,999 | 0 (0.0%) | 0 (0.0%) |
| $35,000 to $49,999 | 17 (7.1%) | 11 (42.3%) |
| $50,000 to $74,999 | 0 (0.0%) | 0 (0.0%) |
| $75,000 to $99,999 | 59 (24.8%) | 0 (0.0%) |
| $100,000 to $149,999 | 0 (0.0%) | 0 (0.0%) |
| $150,000 or more | 85 (35.7%) | 0 (0.0%) |
| Total | 238 (100.0%) | 26 (100.0%) |
Monthly Housing Cost Tiers in Symsonia
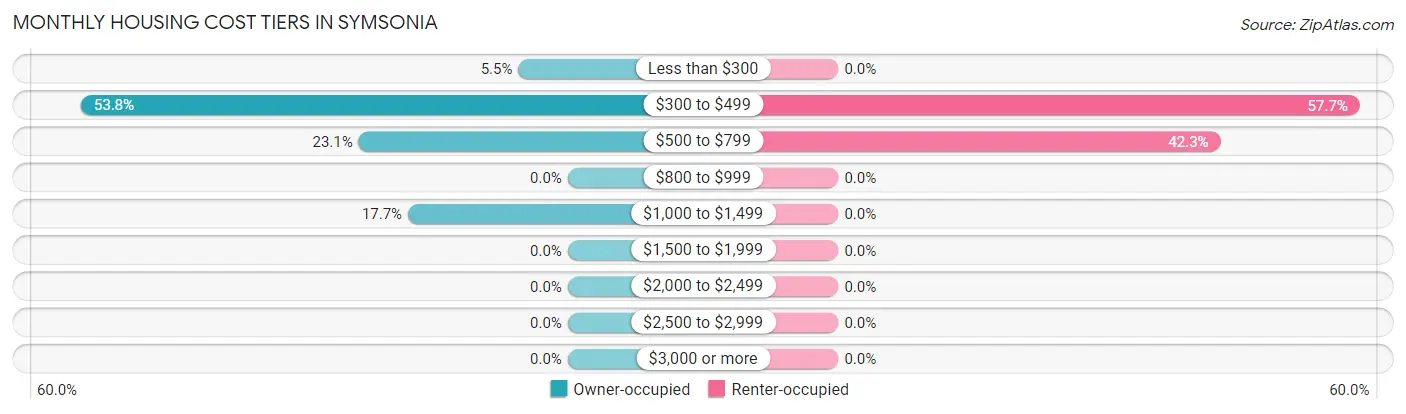
| Monthly Cost | Owner-occupied | Renter-occupied |
| Less than $300 | 13 (5.5%) | 0 (0.0%) |
| $300 to $499 | 128 (53.8%) | 15 (57.7%) |
| $500 to $799 | 55 (23.1%) | 11 (42.3%) |
| $800 to $999 | 0 (0.0%) | 0 (0.0%) |
| $1,000 to $1,499 | 42 (17.6%) | 0 (0.0%) |
| $1,500 to $1,999 | 0 (0.0%) | 0 (0.0%) |
| $2,000 to $2,499 | 0 (0.0%) | 0 (0.0%) |
| $2,500 to $2,999 | 0 (0.0%) | 0 (0.0%) |
| $3,000 or more | 0 (0.0%) | 0 (0.0%) |
| Total | 238 (100.0%) | 26 (100.0%) |
Physical Housing Characteristics in Symsonia
Housing Structures in Symsonia
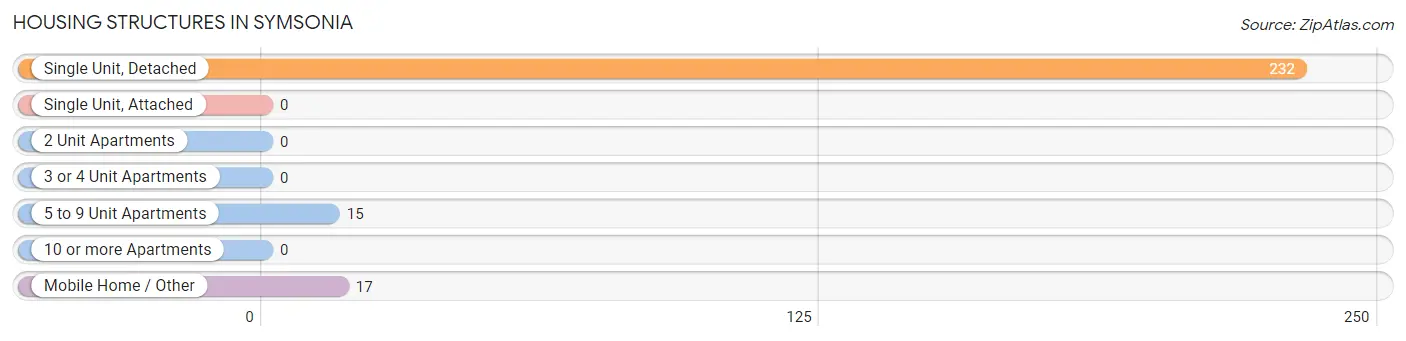
| Structure Type | # Housing Units | % Housing Units |
| Single Unit, Detached | 232 | 87.9% |
| Single Unit, Attached | 0 | 0.0% |
| 2 Unit Apartments | 0 | 0.0% |
| 3 or 4 Unit Apartments | 0 | 0.0% |
| 5 to 9 Unit Apartments | 15 | 5.7% |
| 10 or more Apartments | 0 | 0.0% |
| Mobile Home / Other | 17 | 6.4% |
| Total | 264 | 100.0% |
Housing Structures by Occupancy in Symsonia
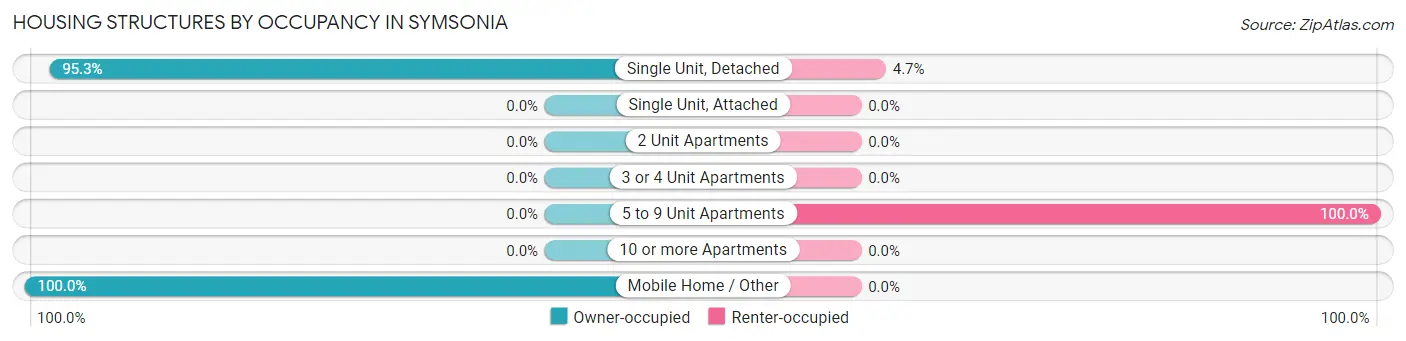
| Structure Type | Owner-occupied | Renter-occupied |
| Single Unit, Detached | 221 (95.3%) | 11 (4.7%) |
| Single Unit, Attached | 0 (0.0%) | 0 (0.0%) |
| 2 Unit Apartments | 0 (0.0%) | 0 (0.0%) |
| 3 or 4 Unit Apartments | 0 (0.0%) | 0 (0.0%) |
| 5 to 9 Unit Apartments | 0 (0.0%) | 15 (100.0%) |
| 10 or more Apartments | 0 (0.0%) | 0 (0.0%) |
| Mobile Home / Other | 17 (100.0%) | 0 (0.0%) |
| Total | 238 (90.1%) | 26 (9.9%) |
Housing Structures by Number of Rooms in Symsonia
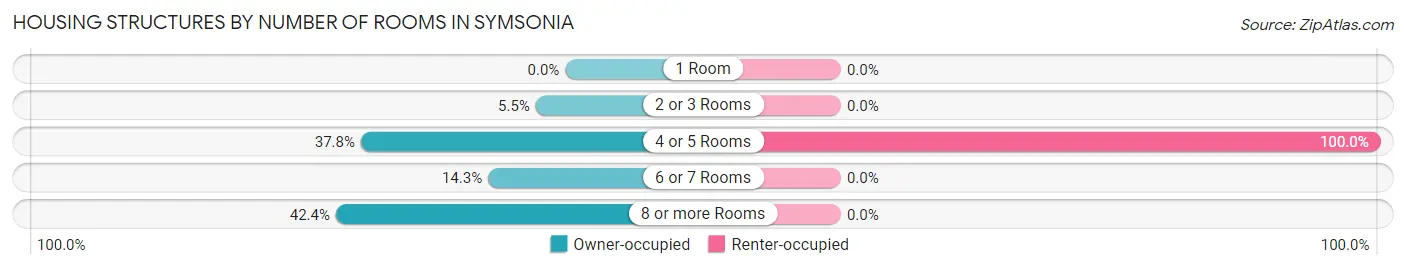
| Number of Rooms | Owner-occupied | Renter-occupied |
| 1 Room | 0 (0.0%) | 0 (0.0%) |
| 2 or 3 Rooms | 13 (5.5%) | 0 (0.0%) |
| 4 or 5 Rooms | 90 (37.8%) | 26 (100.0%) |
| 6 or 7 Rooms | 34 (14.3%) | 0 (0.0%) |
| 8 or more Rooms | 101 (42.4%) | 0 (0.0%) |
| Total | 238 (100.0%) | 26 (100.0%) |
Housing Structure by Heating Type in Symsonia
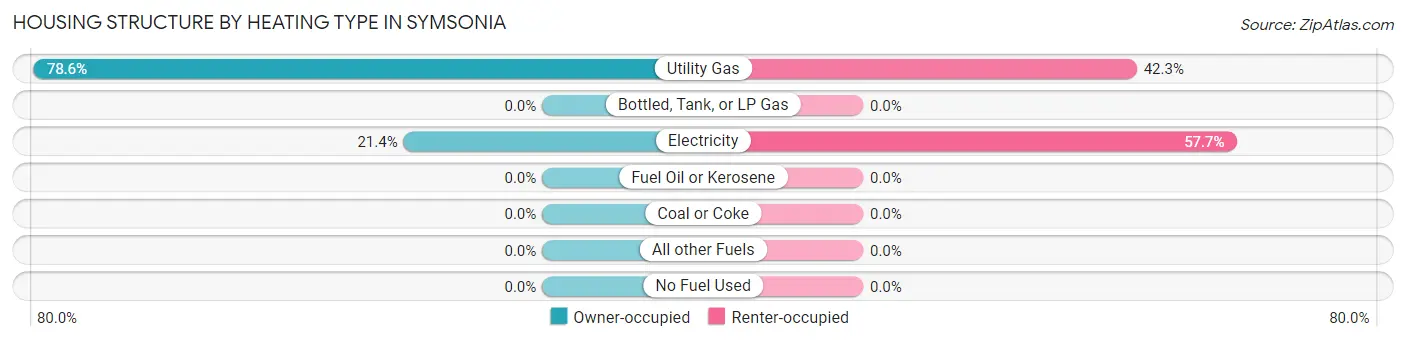
| Heating Type | Owner-occupied | Renter-occupied |
| Utility Gas | 187 (78.6%) | 11 (42.3%) |
| Bottled, Tank, or LP Gas | 0 (0.0%) | 0 (0.0%) |
| Electricity | 51 (21.4%) | 15 (57.7%) |
| Fuel Oil or Kerosene | 0 (0.0%) | 0 (0.0%) |
| Coal or Coke | 0 (0.0%) | 0 (0.0%) |
| All other Fuels | 0 (0.0%) | 0 (0.0%) |
| No Fuel Used | 0 (0.0%) | 0 (0.0%) |
| Total | 238 (100.0%) | 26 (100.0%) |
Household Vehicle Usage in Symsonia
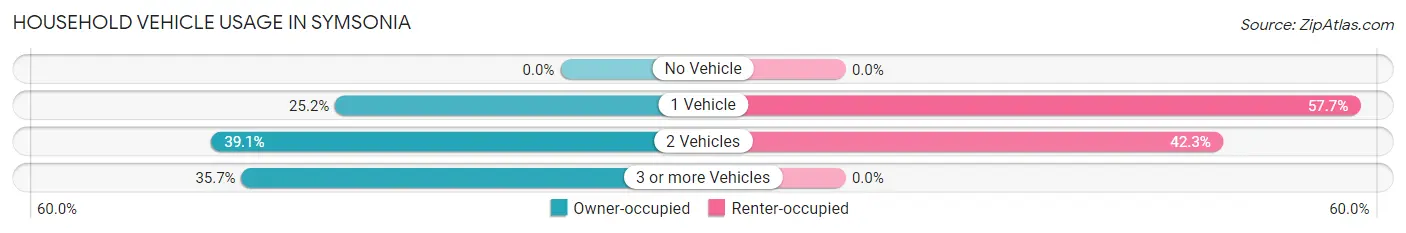
| Vehicles per Household | Owner-occupied | Renter-occupied |
| No Vehicle | 0 (0.0%) | 0 (0.0%) |
| 1 Vehicle | 60 (25.2%) | 15 (57.7%) |
| 2 Vehicles | 93 (39.1%) | 11 (42.3%) |
| 3 or more Vehicles | 85 (35.7%) | 0 (0.0%) |
| Total | 238 (100.0%) | 26 (100.0%) |
Real Estate & Mortgages in Symsonia
Real Estate and Mortgage Overview in Symsonia
| Characteristic | Without Mortgage | With Mortgage |
| Housing Units | 196 | 42 |
| Median Property Value | - | - |
| Median Household Income | - | - |
| Monthly Housing Costs | $387 | $0 |
| Real Estate Taxes | $876 | $0 |
Property Value by Mortgage Status in Symsonia
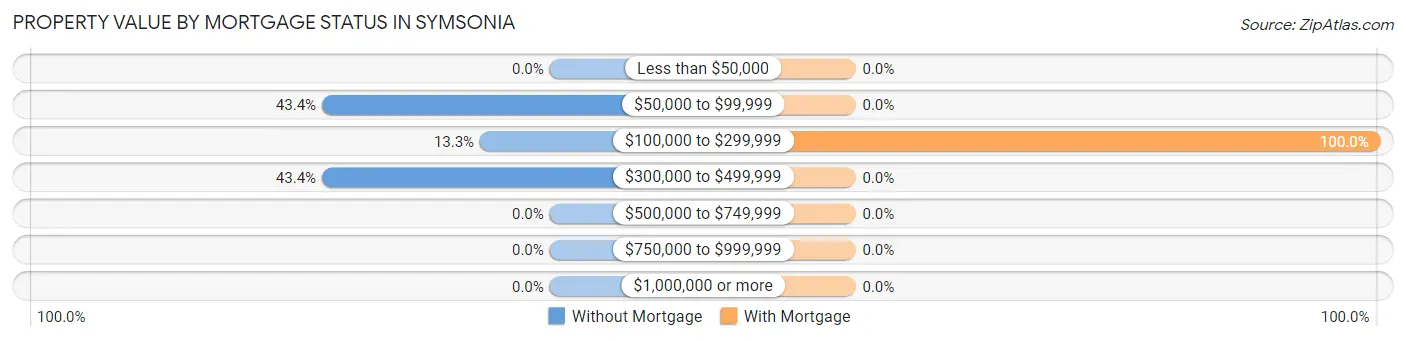
| Property Value | Without Mortgage | With Mortgage |
| Less than $50,000 | 0 (0.0%) | 0 (0.0%) |
| $50,000 to $99,999 | 85 (43.4%) | 0 (0.0%) |
| $100,000 to $299,999 | 26 (13.3%) | 42 (100.0%) |
| $300,000 to $499,999 | 85 (43.4%) | 0 (0.0%) |
| $500,000 to $749,999 | 0 (0.0%) | 0 (0.0%) |
| $750,000 to $999,999 | 0 (0.0%) | 0 (0.0%) |
| $1,000,000 or more | 0 (0.0%) | 0 (0.0%) |
| Total | 196 (100.0%) | 42 (100.0%) |
Household Income by Mortgage Status in Symsonia
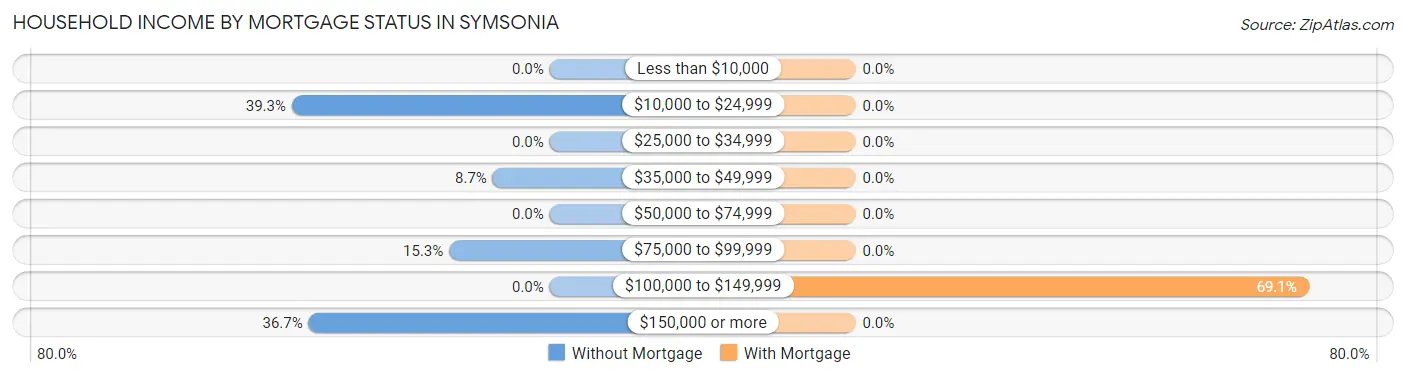
| Household Income | Without Mortgage | With Mortgage |
| Less than $10,000 | 0 (0.0%) | 0 (0.0%) |
| $10,000 to $24,999 | 77 (39.3%) | 0 (0.0%) |
| $25,000 to $34,999 | 0 (0.0%) | 0 (0.0%) |
| $35,000 to $49,999 | 17 (8.7%) | 0 (0.0%) |
| $50,000 to $74,999 | 0 (0.0%) | 0 (0.0%) |
| $75,000 to $99,999 | 30 (15.3%) | 0 (0.0%) |
| $100,000 to $149,999 | 0 (0.0%) | 29 (69.1%) |
| $150,000 or more | 72 (36.7%) | 0 (0.0%) |
| Total | 196 (100.0%) | 42 (100.0%) |
Property Value to Household Income Ratio in Symsonia
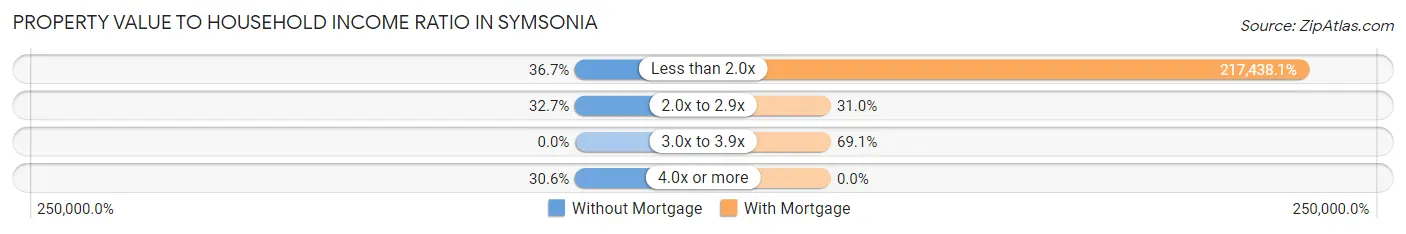
| Value-to-Income Ratio | Without Mortgage | With Mortgage |
| Less than 2.0x | 72 (36.7%) | 91,324 (217,438.1%) |
| 2.0x to 2.9x | 64 (32.7%) | 13 (30.9%) |
| 3.0x to 3.9x | 0 (0.0%) | 29 (69.1%) |
| 4.0x or more | 60 (30.6%) | 0 (0.0%) |
| Total | 196 (100.0%) | 42 (100.0%) |
Real Estate Taxes by Mortgage Status in Symsonia
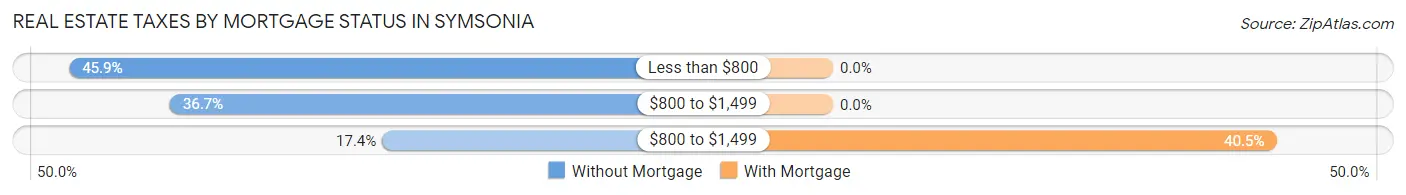
| Property Taxes | Without Mortgage | With Mortgage |
| Less than $800 | 90 (45.9%) | 0 (0.0%) |
| $800 to $1,499 | 72 (36.7%) | 0 (0.0%) |
| $800 to $1,499 | 34 (17.3%) | 17 (40.5%) |
| Total | 196 (100.0%) | 42 (100.0%) |
Health & Disability in Symsonia
Health Insurance Coverage by Age in Symsonia
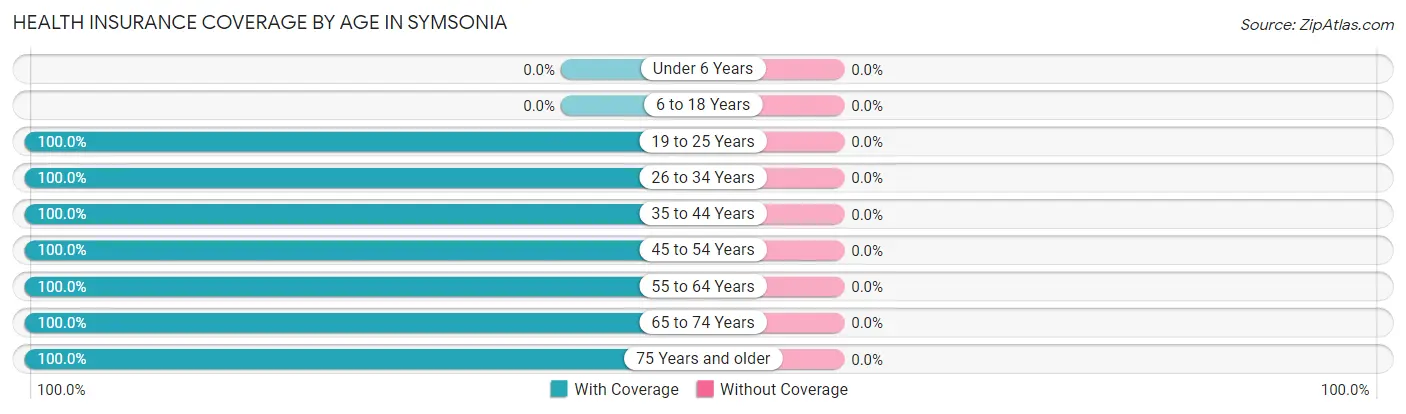
| Age Bracket | With Coverage | Without Coverage |
| Under 6 Years | 0 (0.0%) | 0 (0.0%) |
| 6 to 18 Years | 0 (0.0%) | 0 (0.0%) |
| 19 to 25 Years | 31 (100.0%) | 0 (0.0%) |
| 26 to 34 Years | 48 (100.0%) | 0 (0.0%) |
| 35 to 44 Years | 30 (100.0%) | 0 (0.0%) |
| 45 to 54 Years | 41 (100.0%) | 0 (0.0%) |
| 55 to 64 Years | 215 (100.0%) | 0 (0.0%) |
| 65 to 74 Years | 54 (100.0%) | 0 (0.0%) |
| 75 Years and older | 45 (100.0%) | 0 (0.0%) |
| Total | 464 (100.0%) | 0 (0.0%) |
Health Insurance Coverage by Citizenship Status in Symsonia
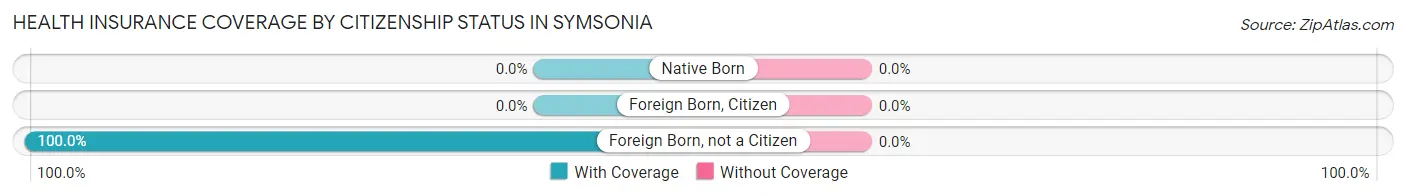
| Citizenship Status | With Coverage | Without Coverage |
| Native Born | 0 (0.0%) | 0 (0.0%) |
| Foreign Born, Citizen | 0 (0.0%) | 0 (0.0%) |
| Foreign Born, not a Citizen | 31 (100.0%) | 0 (0.0%) |
Health Insurance Coverage by Household Income in Symsonia
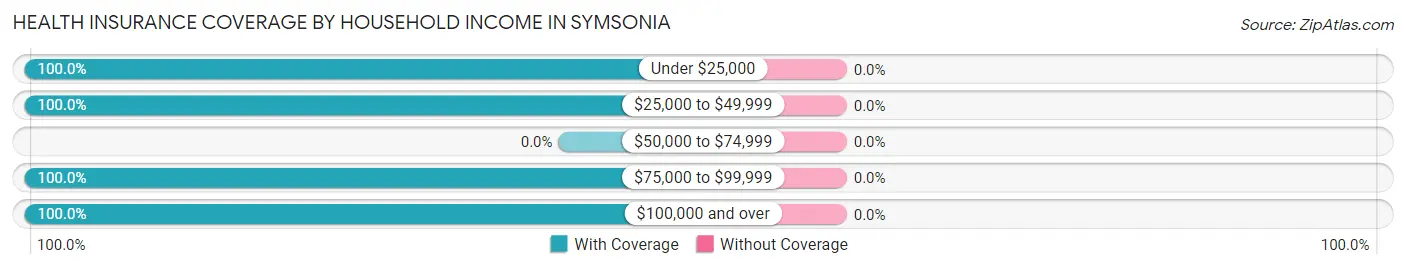
| Household Income | With Coverage | Without Coverage |
| Under $25,000 | 103 (100.0%) | 0 (0.0%) |
| $25,000 to $49,999 | 56 (100.0%) | 0 (0.0%) |
| $50,000 to $74,999 | 0 (0.0%) | 0 (0.0%) |
| $75,000 to $99,999 | 71 (100.0%) | 0 (0.0%) |
| $100,000 and over | 234 (100.0%) | 0 (0.0%) |
Public vs Private Health Insurance Coverage by Age in Symsonia
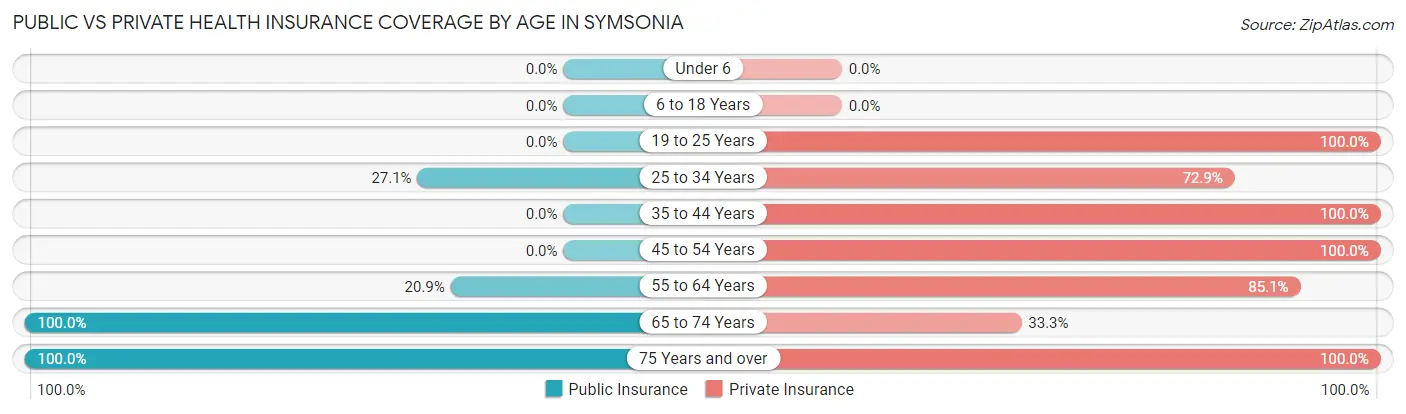
| Age Bracket | Public Insurance | Private Insurance |
| Under 6 | 0 (0.0%) | 0 (0.0%) |
| 6 to 18 Years | 0 (0.0%) | 0 (0.0%) |
| 19 to 25 Years | 0 (0.0%) | 31 (100.0%) |
| 25 to 34 Years | 13 (27.1%) | 35 (72.9%) |
| 35 to 44 Years | 0 (0.0%) | 30 (100.0%) |
| 45 to 54 Years | 0 (0.0%) | 41 (100.0%) |
| 55 to 64 Years | 45 (20.9%) | 183 (85.1%) |
| 65 to 74 Years | 54 (100.0%) | 18 (33.3%) |
| 75 Years and over | 45 (100.0%) | 45 (100.0%) |
| Total | 157 (33.8%) | 383 (82.5%) |
Disability Status by Sex by Age in Symsonia
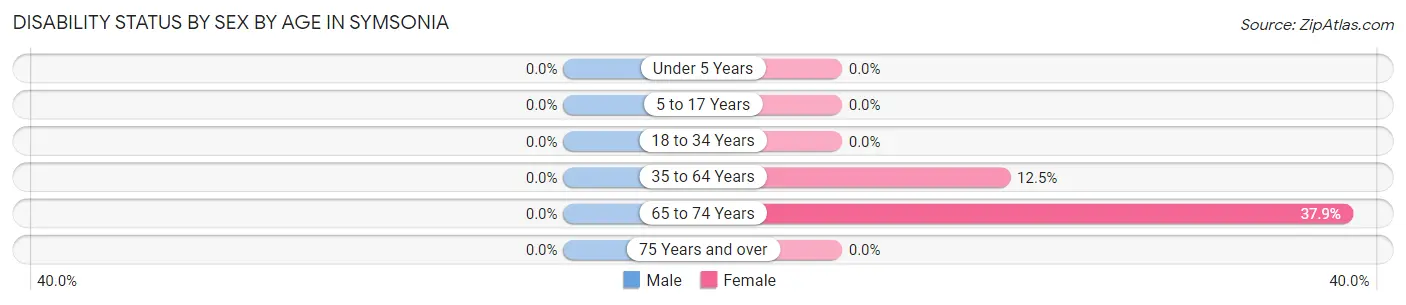
| Age Bracket | Male | Female |
| Under 5 Years | 0 (0.0%) | 0 (0.0%) |
| 5 to 17 Years | 0 (0.0%) | 0 (0.0%) |
| 18 to 34 Years | 0 (0.0%) | 0 (0.0%) |
| 35 to 64 Years | 0 (0.0%) | 15 (12.5%) |
| 65 to 74 Years | 0 (0.0%) | 11 (37.9%) |
| 75 Years and over | 0 (0.0%) | 0 (0.0%) |
Disability Class by Sex by Age in Symsonia
Disability Class: Hearing Difficulty
| Age Bracket | Male | Female |
| Under 5 Years | 0 (0.0%) | 0 (0.0%) |
| 5 to 17 Years | 0 (0.0%) | 0 (0.0%) |
| 18 to 34 Years | 0 (0.0%) | 0 (0.0%) |
| 35 to 64 Years | 0 (0.0%) | 0 (0.0%) |
| 65 to 74 Years | 0 (0.0%) | 0 (0.0%) |
| 75 Years and over | 0 (0.0%) | 0 (0.0%) |
Disability Class: Vision Difficulty
| Age Bracket | Male | Female |
| Under 5 Years | 0 (0.0%) | 0 (0.0%) |
| 5 to 17 Years | 0 (0.0%) | 0 (0.0%) |
| 18 to 34 Years | 0 (0.0%) | 0 (0.0%) |
| 35 to 64 Years | 0 (0.0%) | 0 (0.0%) |
| 65 to 74 Years | 0 (0.0%) | 0 (0.0%) |
| 75 Years and over | 0 (0.0%) | 0 (0.0%) |
Disability Class: Cognitive Difficulty
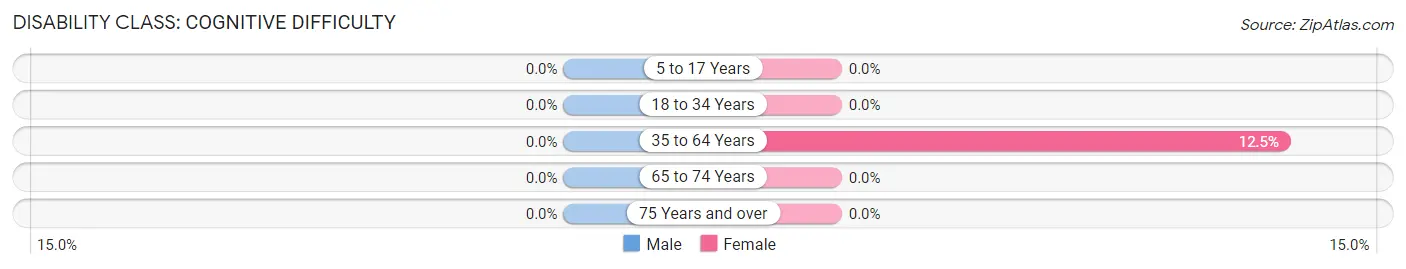
| Age Bracket | Male | Female |
| 5 to 17 Years | 0 (0.0%) | 0 (0.0%) |
| 18 to 34 Years | 0 (0.0%) | 0 (0.0%) |
| 35 to 64 Years | 0 (0.0%) | 15 (12.5%) |
| 65 to 74 Years | 0 (0.0%) | 0 (0.0%) |
| 75 Years and over | 0 (0.0%) | 0 (0.0%) |
Disability Class: Ambulatory Difficulty
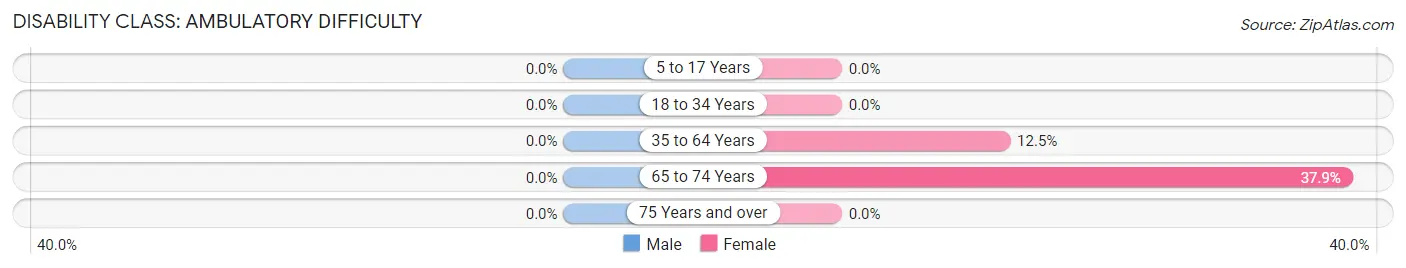
| Age Bracket | Male | Female |
| 5 to 17 Years | 0 (0.0%) | 0 (0.0%) |
| 18 to 34 Years | 0 (0.0%) | 0 (0.0%) |
| 35 to 64 Years | 0 (0.0%) | 15 (12.5%) |
| 65 to 74 Years | 0 (0.0%) | 11 (37.9%) |
| 75 Years and over | 0 (0.0%) | 0 (0.0%) |
Disability Class: Self-Care Difficulty
| Age Bracket | Male | Female |
| 5 to 17 Years | 0 (0.0%) | 0 (0.0%) |
| 18 to 34 Years | 0 (0.0%) | 0 (0.0%) |
| 35 to 64 Years | 0 (0.0%) | 0 (0.0%) |
| 65 to 74 Years | 0 (0.0%) | 0 (0.0%) |
| 75 Years and over | 0 (0.0%) | 0 (0.0%) |
Technology Access in Symsonia
Computing Device Access in Symsonia
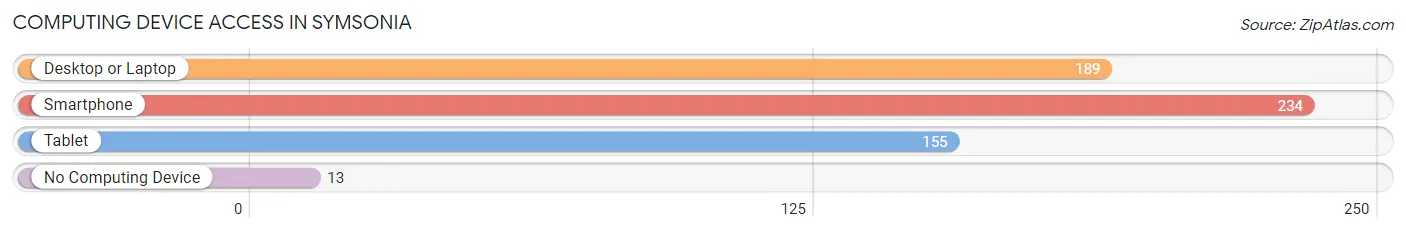
| Device Type | # Households | % Households |
| Desktop or Laptop | 189 | 71.6% |
| Smartphone | 234 | 88.6% |
| Tablet | 155 | 58.7% |
| No Computing Device | 13 | 4.9% |
| Total | 264 | 100.0% |
Internet Access in Symsonia
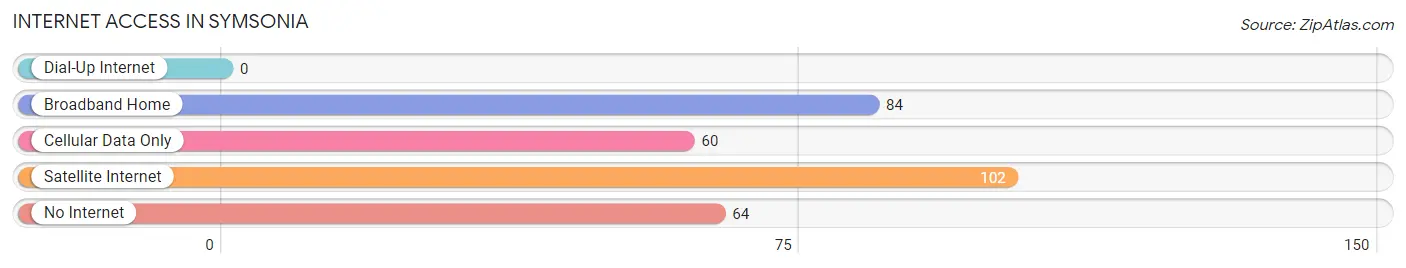
| Internet Type | # Households | % Households |
| Dial-Up Internet | 0 | 0.0% |
| Broadband Home | 84 | 31.8% |
| Cellular Data Only | 60 | 22.7% |
| Satellite Internet | 102 | 38.6% |
| No Internet | 64 | 24.2% |
| Total | 264 | 100.0% |
Symsonia Summary
Symsonia is a small unincorporated community located in Graves County, Kentucky. It is situated along the banks of the Tennessee River, approximately 10 miles south of Mayfield. The population of Symsonia was estimated to be 1,072 in 2019.
History
Symsonia was founded in 1820 by William Syms, a Revolutionary War veteran. Syms was a native of Virginia and had moved to Kentucky in 1817. He purchased a large tract of land in the area and named it Symsonia. The town was officially incorporated in 1837.
Symsonia was a thriving community in the late 19th and early 20th centuries. It was home to several businesses, including a general store, a blacksmith shop, a grist mill, and a sawmill. The town also had a post office, a school, and a church.
Geography
Symsonia is located in western Kentucky, approximately 10 miles south of Mayfield. It is situated along the banks of the Tennessee River. The town is surrounded by rolling hills and farmland.
The climate in Symsonia is humid subtropical, with hot summers and mild winters. The average annual temperature is around 62°F (17°C). The average annual precipitation is around 45 inches (114 cm).
Economy
Symsonia’s economy is largely based on agriculture. The town is home to several farms, which produce a variety of crops, including corn, soybeans, and wheat. The town also has a few small businesses, including a gas station, a convenience store, and a restaurant.
Demographics
As of 2019, the population of Symsonia was estimated to be 1,072. The racial makeup of the town was 97.2% White, 0.9% African American, 0.3% Native American, 0.2% Asian, and 1.4% from other races. The median household income was $37,917, and the median home value was $90,000.
Symsonia is served by the Graves County School District. The town has one elementary school, one middle school, and one high school. The town also has a public library and a community center.
Symsonia is a small, rural community with a rich history and a strong sense of community. The town is home to a variety of businesses and organizations, and it is a great place to live and work.
Common Questions
What is Per Capita Income in Symsonia?
Per Capita income in Symsonia is $53,615.
What is the Median Family Income in Symsonia?
Median Family Income in Symsonia is $157,115.
What is the Median Household income in Symsonia?
Median Household Income in Symsonia is $76,000.
What is Inequality or Gini Index in Symsonia?
Inequality or Gini Index in Symsonia is 0.46.
What is the Total Population of Symsonia?
Total Population of Symsonia is 464.
What is the Total Male Population of Symsonia?
Total Male Population of Symsonia is 274.
What is the Total Female Population of Symsonia?
Total Female Population of Symsonia is 190.
What is the Ratio of Males per 100 Females in Symsonia?
There are 144.21 Males per 100 Females in Symsonia.
What is the Ratio of Females per 100 Males in Symsonia?
There are 69.34 Females per 100 Males in Symsonia.
What is the Median Population Age in Symsonia?
Median Population Age in Symsonia is 59.7 Years.
What is the Average Family Size in Symsonia
Average Family Size in Symsonia is 2.3 People.
What is the Average Household Size in Symsonia
Average Household Size in Symsonia is 1.8 People.
How Large is the Labor Force in Symsonia?
There are 278 People in the Labor Forcein in Symsonia.
What is the Percentage of People in the Labor Force in Symsonia?
59.9% of People are in the Labor Force in Symsonia.