Zip Codes with the Highest Percentage of Population Employed in Legal Services & Support in Owensboro, KY
RELATED REPORTS & OPTIONS
Legal Services & Support
Owensboro
Compare Zip Codes
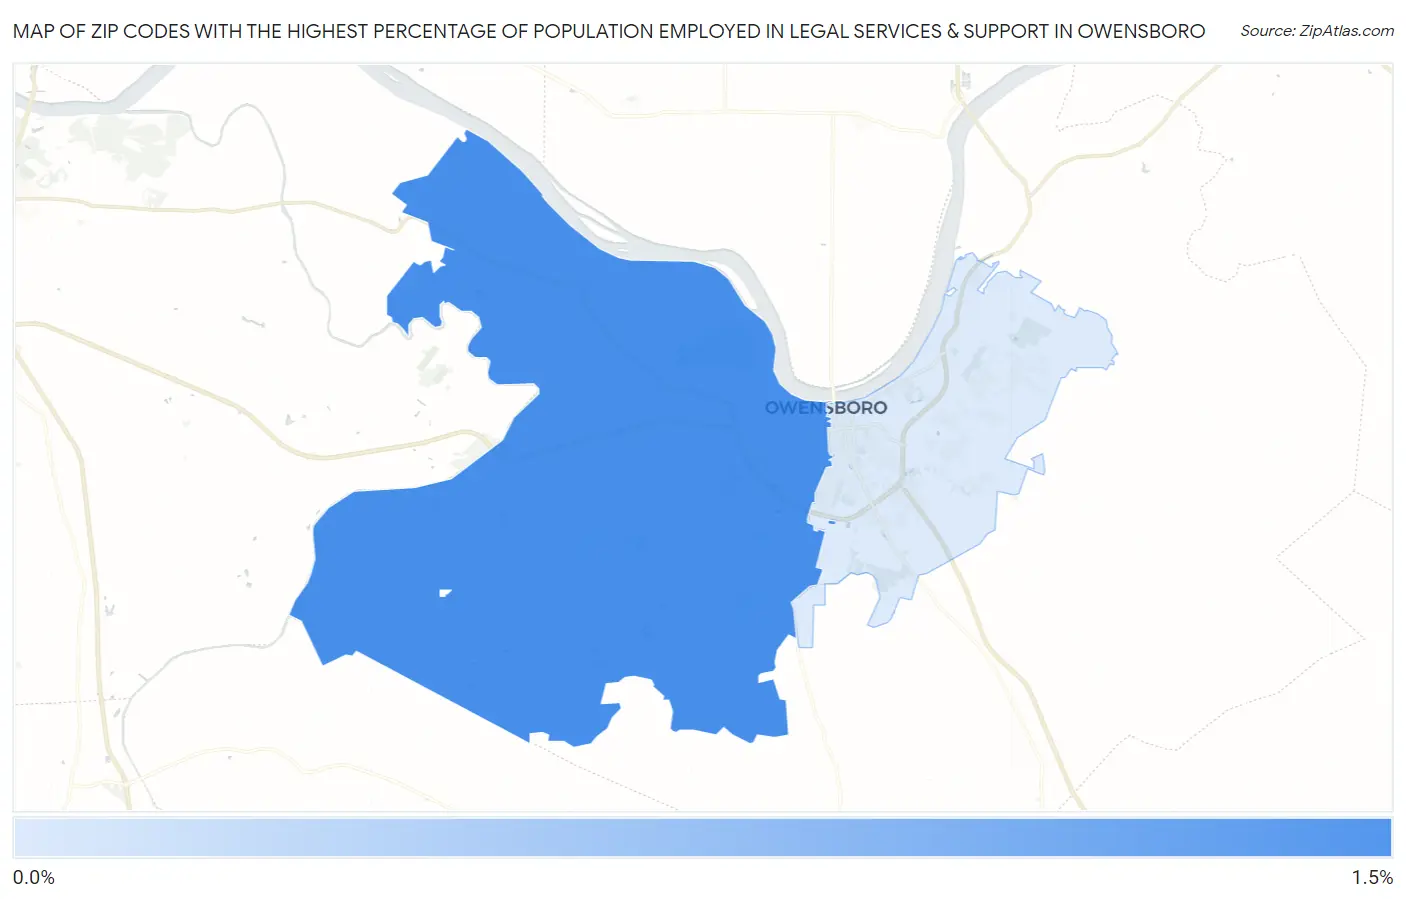
Map of Zip Codes with the Highest Percentage of Population Employed in Legal Services & Support in Owensboro
0.41%
1.0%
Zip Codes with the Highest Percentage of Population Employed in Legal Services & Support in Owensboro, KY
| Zip Code | % Employed | vs State | vs National | |
| 1. | 42301 | 1.0% | 0.95%(+0.059)#110 | 1.2%(-0.179)#7,793 |
| 2. | 42303 | 0.41% | 0.95%(-0.539)#186 | 1.2%(-0.777)#13,771 |
1
Common Questions
What are the Top Zip Codes with the Highest Percentage of Population Employed in Legal Services & Support in Owensboro, KY?
Top Zip Codes with the Highest Percentage of Population Employed in Legal Services & Support in Owensboro, KY are:
What zip code has the Highest Percentage of Population Employed in Legal Services & Support in Owensboro, KY?
42301 has the Highest Percentage of Population Employed in Legal Services & Support in Owensboro, KY with 1.0%.
What is the Percentage of Population Employed in Legal Services & Support in Owensboro, KY?
Percentage of Population Employed in Legal Services & Support in Owensboro is 0.96%.
What is the Percentage of Population Employed in Legal Services & Support in Kentucky?
Percentage of Population Employed in Legal Services & Support in Kentucky is 0.95%.
What is the Percentage of Population Employed in Legal Services & Support in the United States?
Percentage of Population Employed in Legal Services & Support in the United States is 1.2%.