Fleming Neon, KY Map & Demographics
Fleming Neon Map
Fleming Neon Overview
$19,306
PER CAPITA INCOME
$55,625
AVG FAMILY INCOME
$55,438
AVG HOUSEHOLD INCOME
23.6%
WAGE / INCOME GAP [ % ]
76.4¢/ $1
WAGE / INCOME GAP [ $ ]
$6,770
FAMILY INCOME DEFICIT
0.39
INEQUALITY / GINI INDEX
862
TOTAL POPULATION
480
MALE POPULATION
382
FEMALE POPULATION
125.65
MALES / 100 FEMALES
79.58
FEMALES / 100 MALES
33.2
MEDIAN AGE
3.1
AVG FAMILY SIZE
2.8
AVG HOUSEHOLD SIZE
307
LABOR FORCE [ PEOPLE ]
48.0%
PERCENT IN LABOR FORCE
Fleming Neon Area Codes
Income in Fleming Neon
Income Overview in Fleming Neon
Per Capita Income in Fleming Neon is $19,306, while median incomes of families and households are $55,625 and $55,438 respectively.
| Characteristic | Number | Measure |
| Per Capita Income | 862 | $19,306 |
| Median Family Income | 257 | $55,625 |
| Mean Family Income | 257 | $53,272 |
| Median Household Income | 305 | $55,438 |
| Mean Household Income | 305 | $52,344 |
| Income Deficit | 257 | $6,770 |
| Wage / Income Gap (%) | 862 | 23.59% |
| Wage / Income Gap ($) | 862 | 76.41¢ per $1 |
| Gini / Inequality Index | 862 | 0.39 |
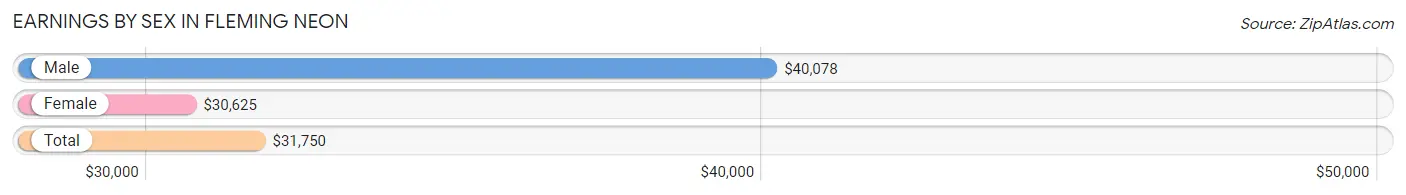
Earnings by Sex in Fleming Neon
Average Earnings in Fleming Neon are $31,750, $40,078 for men and $30,625 for women, a difference of 23.6%.
| Sex | Number | Average Earnings |
| Male | 245 (67.3%) | $40,078 |
| Female | 119 (32.7%) | $30,625 |
| Total | 364 (100.0%) | $31,750 |
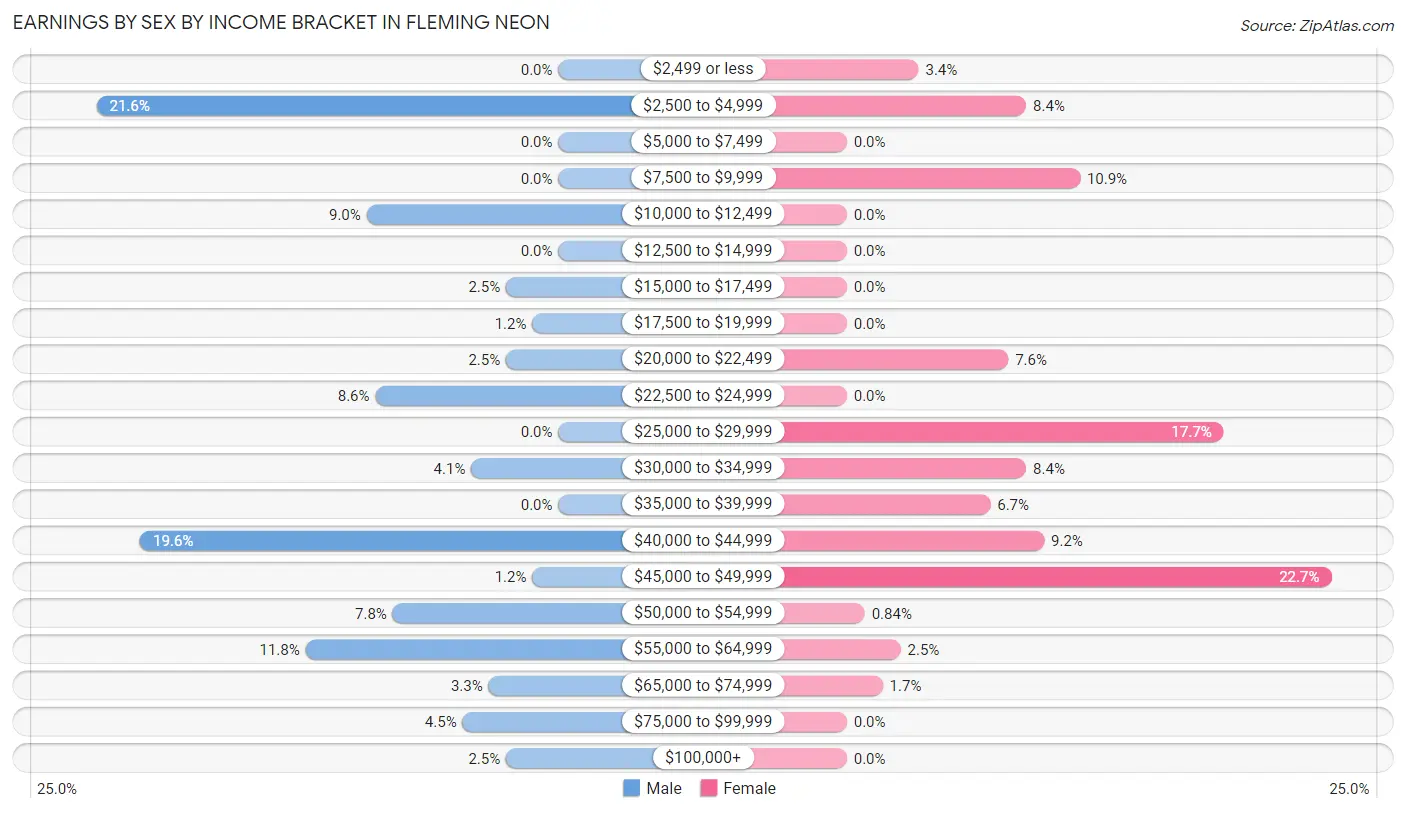
Earnings by Sex by Income Bracket in Fleming Neon
The most common earnings brackets in Fleming Neon are $2,500 to $4,999 for men (53 | 21.6%) and $45,000 to $49,999 for women (27 | 22.7%).
| Income | Male | Female |
| $2,499 or less | 0 (0.0%) | 4 (3.4%) |
| $2,500 to $4,999 | 53 (21.6%) | 10 (8.4%) |
| $5,000 to $7,499 | 0 (0.0%) | 0 (0.0%) |
| $7,500 to $9,999 | 0 (0.0%) | 13 (10.9%) |
| $10,000 to $12,499 | 22 (9.0%) | 0 (0.0%) |
| $12,500 to $14,999 | 0 (0.0%) | 0 (0.0%) |
| $15,000 to $17,499 | 6 (2.5%) | 0 (0.0%) |
| $17,500 to $19,999 | 3 (1.2%) | 0 (0.0%) |
| $20,000 to $22,499 | 6 (2.5%) | 9 (7.6%) |
| $22,500 to $24,999 | 21 (8.6%) | 0 (0.0%) |
| $25,000 to $29,999 | 0 (0.0%) | 21 (17.6%) |
| $30,000 to $34,999 | 10 (4.1%) | 10 (8.4%) |
| $35,000 to $39,999 | 0 (0.0%) | 8 (6.7%) |
| $40,000 to $44,999 | 48 (19.6%) | 11 (9.2%) |
| $45,000 to $49,999 | 3 (1.2%) | 27 (22.7%) |
| $50,000 to $54,999 | 19 (7.8%) | 1 (0.8%) |
| $55,000 to $64,999 | 29 (11.8%) | 3 (2.5%) |
| $65,000 to $74,999 | 8 (3.3%) | 2 (1.7%) |
| $75,000 to $99,999 | 11 (4.5%) | 0 (0.0%) |
| $100,000+ | 6 (2.5%) | 0 (0.0%) |
| Total | 245 (100.0%) | 119 (100.0%) |
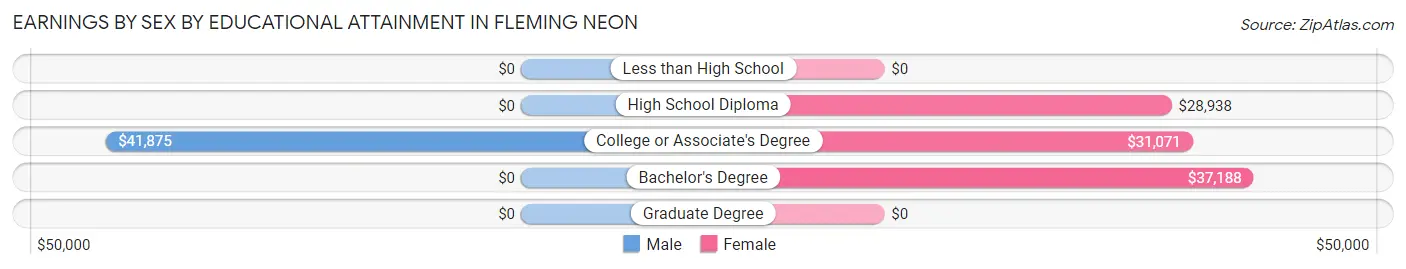
Earnings by Sex by Educational Attainment in Fleming Neon
Average earnings in Fleming Neon are $40,313 for men and $31,875 for women, a difference of 20.9%. Men with an educational attainment of college or associate's degree enjoy the highest average annual earnings of $41,875, while those with college or associate's degree education earn the least with $41,875. Women with an educational attainment of bachelor's degree earn the most with the average annual earnings of $37,188, while those with high school diploma education have the smallest earnings of $28,938.
| Educational Attainment | Male Income | Female Income |
| Less than High School | - | - |
| High School Diploma | - | - |
| College or Associate's Degree | $41,875 | $31,071 |
| Bachelor's Degree | - | - |
| Graduate Degree | - | - |
| Total | $40,313 | $31,875 |
Family Income in Fleming Neon
Family Income Brackets in Fleming Neon
According to the Fleming Neon family income data, there are 103 families falling into the $50,000 to $74,999 income range, which is the most common income bracket and makes up 40.1% of all families.
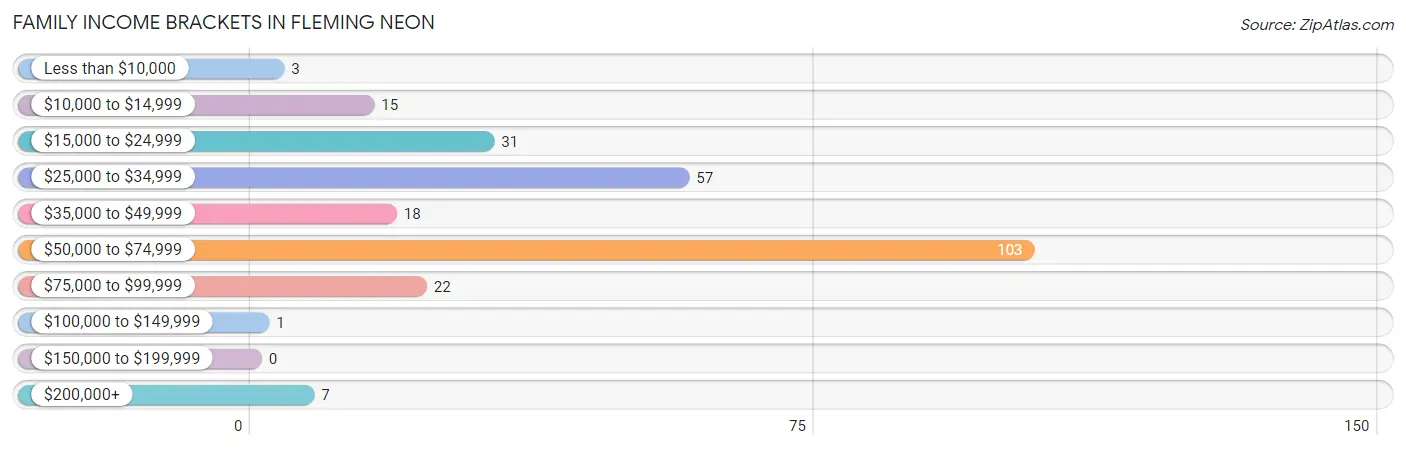
| Income Bracket | # Families | % Families |
| Less than $10,000 | 3 | 1.2% |
| $10,000 to $14,999 | 15 | 5.8% |
| $15,000 to $24,999 | 31 | 12.1% |
| $25,000 to $34,999 | 57 | 22.2% |
| $35,000 to $49,999 | 18 | 7.0% |
| $50,000 to $74,999 | 103 | 40.1% |
| $75,000 to $99,999 | 22 | 8.6% |
| $100,000 to $149,999 | 1 | 0.4% |
| $150,000 to $199,999 | 0 | 0.0% |
| $200,000+ | 7 | 2.7% |
Family Income by Famaliy Size in Fleming Neon
5-person families (16 | 6.2%) account for the highest median family income in Fleming Neon with $73,214 per family, while 2-person families (105 | 40.9%) have the highest median income of $29,024 per family member.
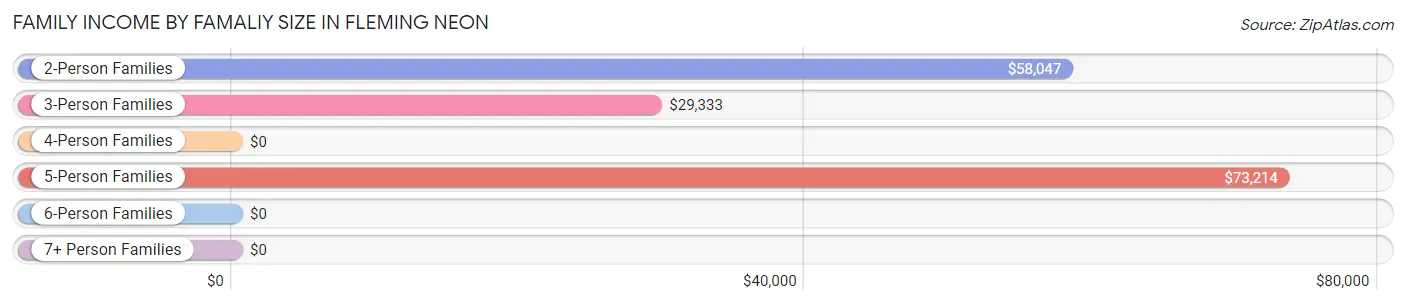
| Income Bracket | # Families | Median Income |
| 2-Person Families | 105 (40.9%) | $58,047 |
| 3-Person Families | 72 (28.0%) | $29,333 |
| 4-Person Families | 39 (15.2%) | $0 |
| 5-Person Families | 16 (6.2%) | $73,214 |
| 6-Person Families | 25 (9.7%) | $0 |
| 7+ Person Families | 0 (0.0%) | $0 |
| Total | 257 (100.0%) | $55,625 |
Family Income by Number of Earners in Fleming Neon
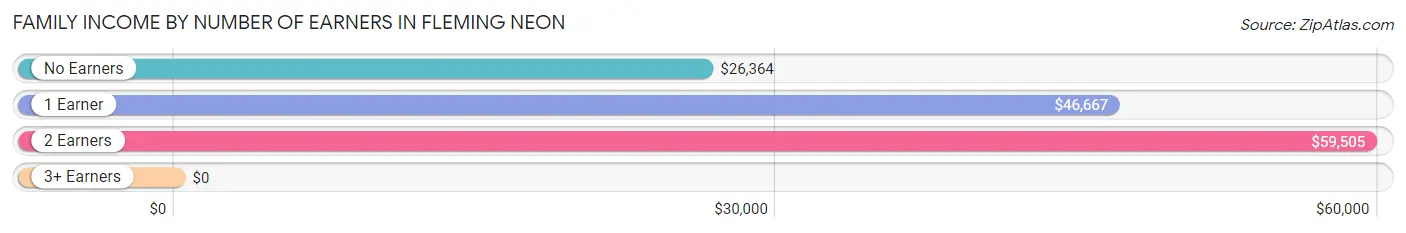
| Number of Earners | # Families | Median Income |
| No Earners | 78 (30.3%) | $26,364 |
| 1 Earner | 78 (30.3%) | $46,667 |
| 2 Earners | 89 (34.6%) | $59,505 |
| 3+ Earners | 12 (4.7%) | $0 |
| Total | 257 (100.0%) | $55,625 |
Household Income in Fleming Neon
Household Income Brackets in Fleming Neon
With 113 households falling in the category, the $50,000 to $74,999 income range is the most frequent in Fleming Neon, accounting for 37.0% of all households.
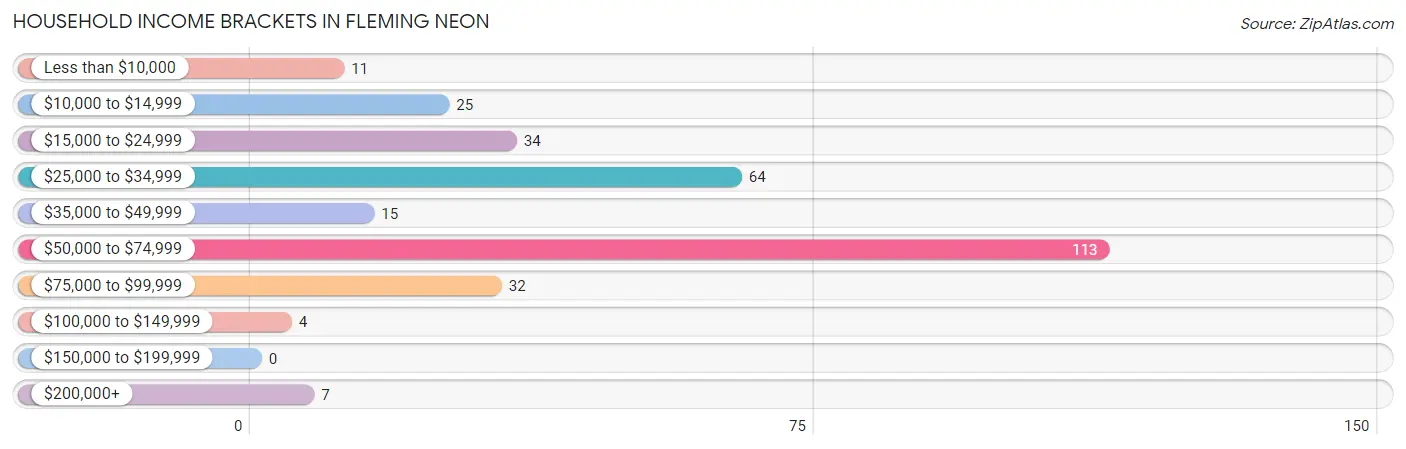
| Income Bracket | # Households | % Households |
| Less than $10,000 | 11 | 3.6% |
| $10,000 to $14,999 | 25 | 8.2% |
| $15,000 to $24,999 | 34 | 11.1% |
| $25,000 to $34,999 | 64 | 21.0% |
| $35,000 to $49,999 | 15 | 4.9% |
| $50,000 to $74,999 | 113 | 37.0% |
| $75,000 to $99,999 | 32 | 10.5% |
| $100,000 to $149,999 | 4 | 1.3% |
| $150,000 to $199,999 | 0 | 0.0% |
| $200,000+ | 7 | 2.3% |
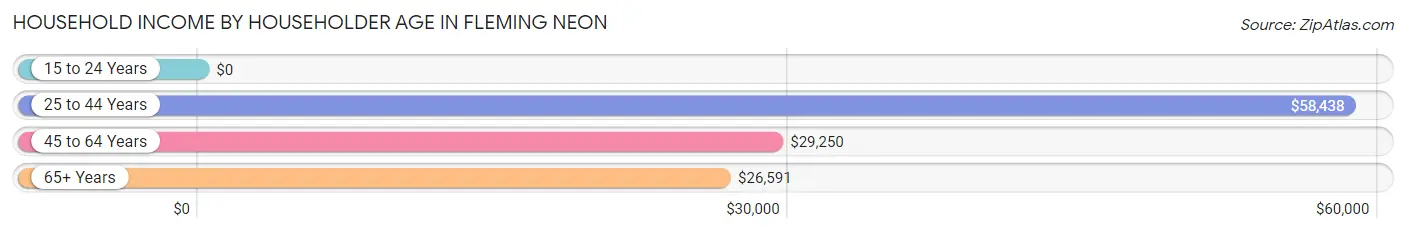
Household Income by Householder Age in Fleming Neon
The median household income in Fleming Neon is $55,438, with the highest median household income of $58,438 found in the 25 to 44 years age bracket for the primary householder. A total of 134 households (43.9%) fall into this category.
| Income Bracket | # Households | Median Income |
| 15 to 24 Years | 0 (0.0%) | $0 |
| 25 to 44 Years | 134 (43.9%) | $58,438 |
| 45 to 64 Years | 121 (39.7%) | $29,250 |
| 65+ Years | 50 (16.4%) | $26,591 |
| Total | 305 (100.0%) | $55,438 |
Poverty in Fleming Neon
Income Below Poverty by Sex and Age in Fleming Neon
With 11.9% poverty level for males and 29.1% for females among the residents of Fleming Neon, 65 to 74 year old males and 55 to 64 year old females are the most vulnerable to poverty, with 16 males (55.2%) and 45 females (71.4%) in their respective age groups living below the poverty level.
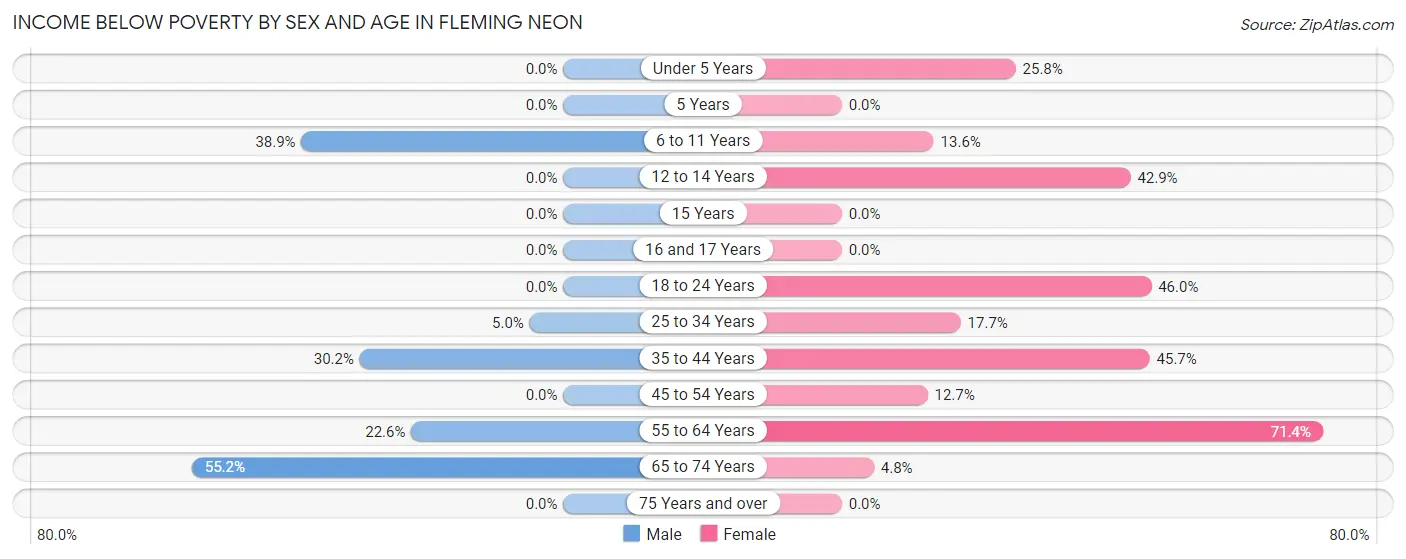
| Age Bracket | Male | Female |
| Under 5 Years | 0 (0.0%) | 8 (25.8%) |
| 5 Years | 0 (0.0%) | 0 (0.0%) |
| 6 to 11 Years | 14 (38.9%) | 3 (13.6%) |
| 12 to 14 Years | 0 (0.0%) | 3 (42.9%) |
| 15 Years | 0 (0.0%) | 0 (0.0%) |
| 16 and 17 Years | 0 (0.0%) | 0 (0.0%) |
| 18 to 24 Years | 0 (0.0%) | 17 (46.0%) |
| 25 to 34 Years | 7 (5.0%) | 9 (17.6%) |
| 35 to 44 Years | 13 (30.2%) | 16 (45.7%) |
| 45 to 54 Years | 0 (0.0%) | 7 (12.7%) |
| 55 to 64 Years | 7 (22.6%) | 45 (71.4%) |
| 65 to 74 Years | 16 (55.2%) | 1 (4.8%) |
| 75 Years and over | 0 (0.0%) | 0 (0.0%) |
| Total | 57 (11.9%) | 109 (29.1%) |
Income Above Poverty by Sex and Age in Fleming Neon
According to the poverty statistics in Fleming Neon, males aged under 5 years and females aged 5 years are the age groups that are most secure financially, with 100.0% of males and 100.0% of females in these age groups living above the poverty line.
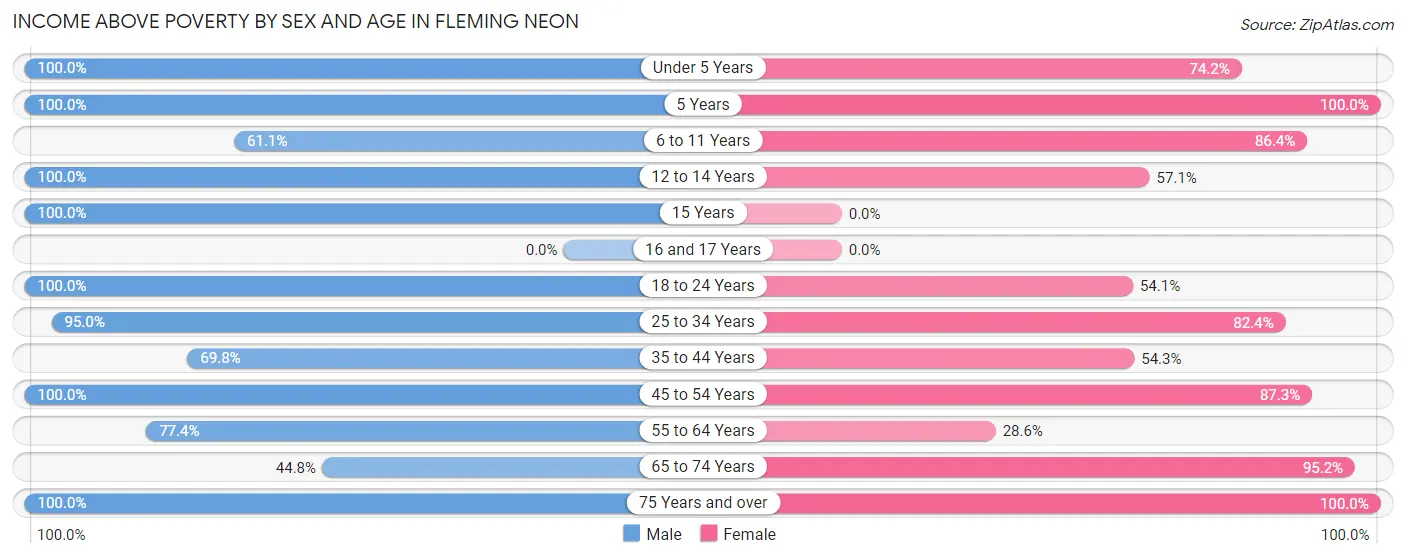
| Age Bracket | Male | Female |
| Under 5 Years | 56 (100.0%) | 23 (74.2%) |
| 5 Years | 2 (100.0%) | 33 (100.0%) |
| 6 to 11 Years | 22 (61.1%) | 19 (86.4%) |
| 12 to 14 Years | 21 (100.0%) | 4 (57.1%) |
| 15 Years | 6 (100.0%) | 0 (0.0%) |
| 16 and 17 Years | 0 (0.0%) | 0 (0.0%) |
| 18 to 24 Years | 9 (100.0%) | 20 (54.0%) |
| 25 to 34 Years | 133 (95.0%) | 42 (82.4%) |
| 35 to 44 Years | 30 (69.8%) | 19 (54.3%) |
| 45 to 54 Years | 54 (100.0%) | 48 (87.3%) |
| 55 to 64 Years | 24 (77.4%) | 18 (28.6%) |
| 65 to 74 Years | 13 (44.8%) | 20 (95.2%) |
| 75 Years and over | 53 (100.0%) | 19 (100.0%) |
| Total | 423 (88.1%) | 265 (70.9%) |
Income Below Poverty Among Married-Couple Families in Fleming Neon
The poverty statistics for married-couple families in Fleming Neon show that 22.9% or 25 of the total 109 families live below the poverty line. Families with 1 or 2 children have the highest poverty rate of 50.0%, comprising of 9 families. On the other hand, families with 3 or 4 children have the lowest poverty rate of 0.0%, which includes 0 families.
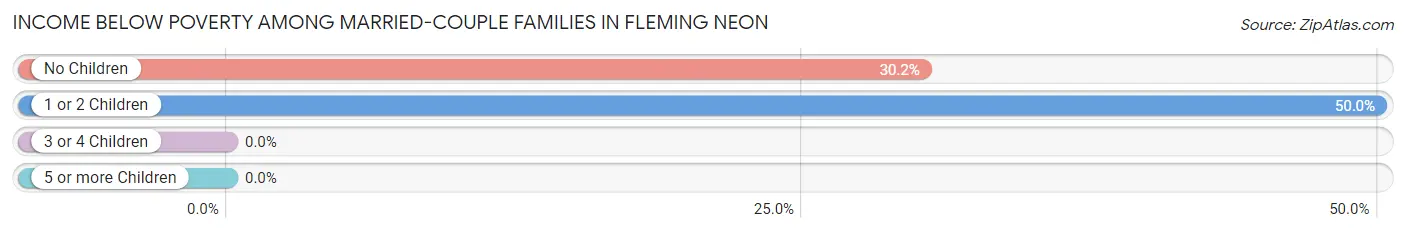
| Children | Above Poverty | Below Poverty |
| No Children | 37 (69.8%) | 16 (30.2%) |
| 1 or 2 Children | 9 (50.0%) | 9 (50.0%) |
| 3 or 4 Children | 38 (100.0%) | 0 (0.0%) |
| 5 or more Children | 0 (0.0%) | 0 (0.0%) |
| Total | 84 (77.1%) | 25 (22.9%) |
Income Below Poverty Among Single-Parent Households in Fleming Neon
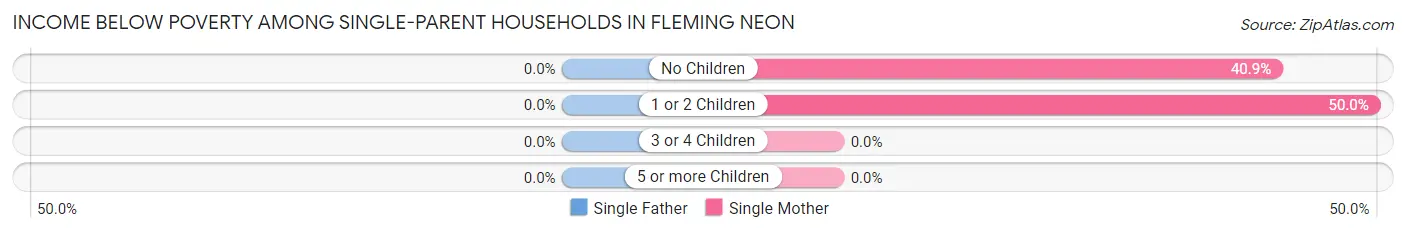
| Children | Single Father | Single Mother |
| No Children | 0 (0.0%) | 9 (40.9%) |
| 1 or 2 Children | 0 (0.0%) | 13 (50.0%) |
| 3 or 4 Children | 0 (0.0%) | 0 (0.0%) |
| 5 or more Children | 0 (0.0%) | 0 (0.0%) |
| Total | 0 (0.0%) | 22 (43.1%) |
Income Below Poverty Among Married-Couple vs Single-Parent Households in Fleming Neon
The poverty data for Fleming Neon shows that 25 of the married-couple family households (22.9%) and 22 of the single-parent households (14.9%) are living below the poverty level. Within the married-couple family households, those with 1 or 2 children have the highest poverty rate, with 9 households (50.0%) falling below the poverty line. Among the single-parent households, those with 1 or 2 children have the highest poverty rate, with 13 household (17.3%) living below poverty.
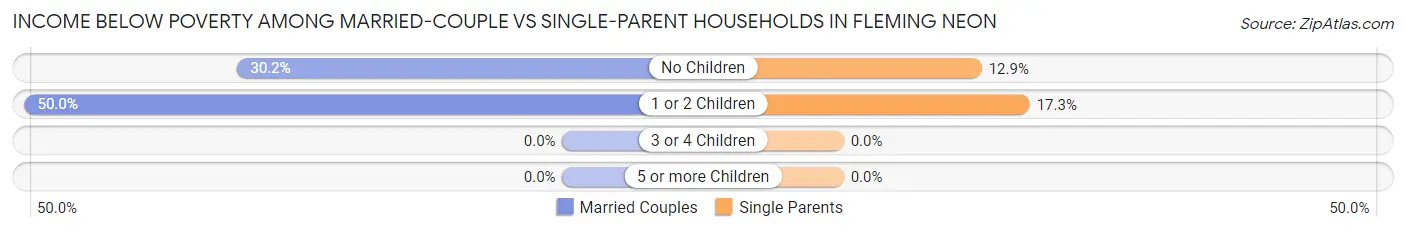
| Children | Married-Couple Families | Single-Parent Households |
| No Children | 16 (30.2%) | 9 (12.9%) |
| 1 or 2 Children | 9 (50.0%) | 13 (17.3%) |
| 3 or 4 Children | 0 (0.0%) | 0 (0.0%) |
| 5 or more Children | 0 (0.0%) | 0 (0.0%) |
| Total | 25 (22.9%) | 22 (14.9%) |
Race in Fleming Neon
The most populous races in Fleming Neon are White / Caucasian (775 | 89.9%), Black / African American (78 | 9.0%), and Hispanic or Latino (49 | 5.7%).
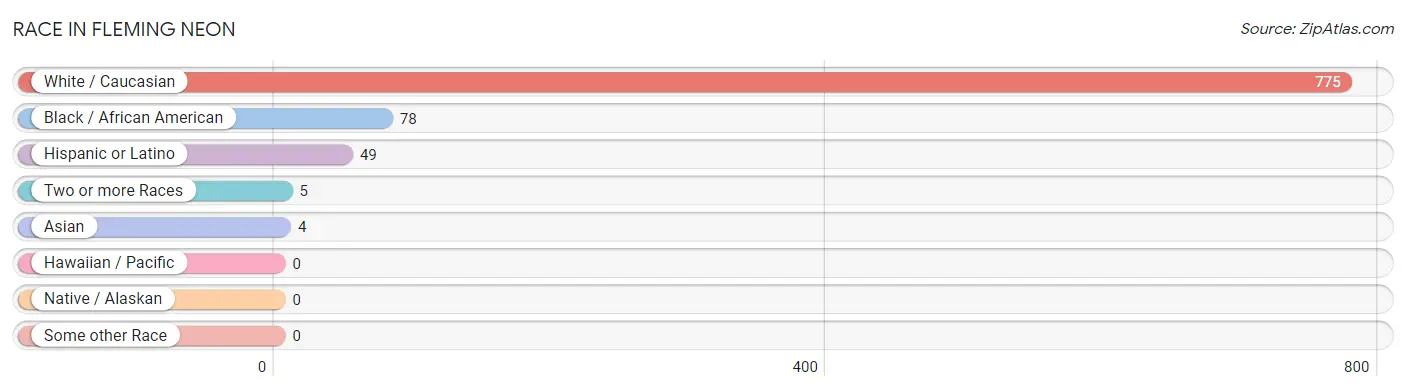
| Race | # Population | % Population |
| Asian | 4 | 0.5% |
| Black / African American | 78 | 9.0% |
| Hawaiian / Pacific | 0 | 0.0% |
| Hispanic or Latino | 49 | 5.7% |
| Native / Alaskan | 0 | 0.0% |
| White / Caucasian | 775 | 89.9% |
| Two or more Races | 5 | 0.6% |
| Some other Race | 0 | 0.0% |
| Total | 862 | 100.0% |
Ancestry in Fleming Neon
The most populous ancestries reported in Fleming Neon are American (186 | 21.6%), Irish (84 | 9.7%), German (67 | 7.8%), Eastern European (49 | 5.7%), and Puerto Rican (49 | 5.7%), together accounting for 50.4% of all Fleming Neon residents.
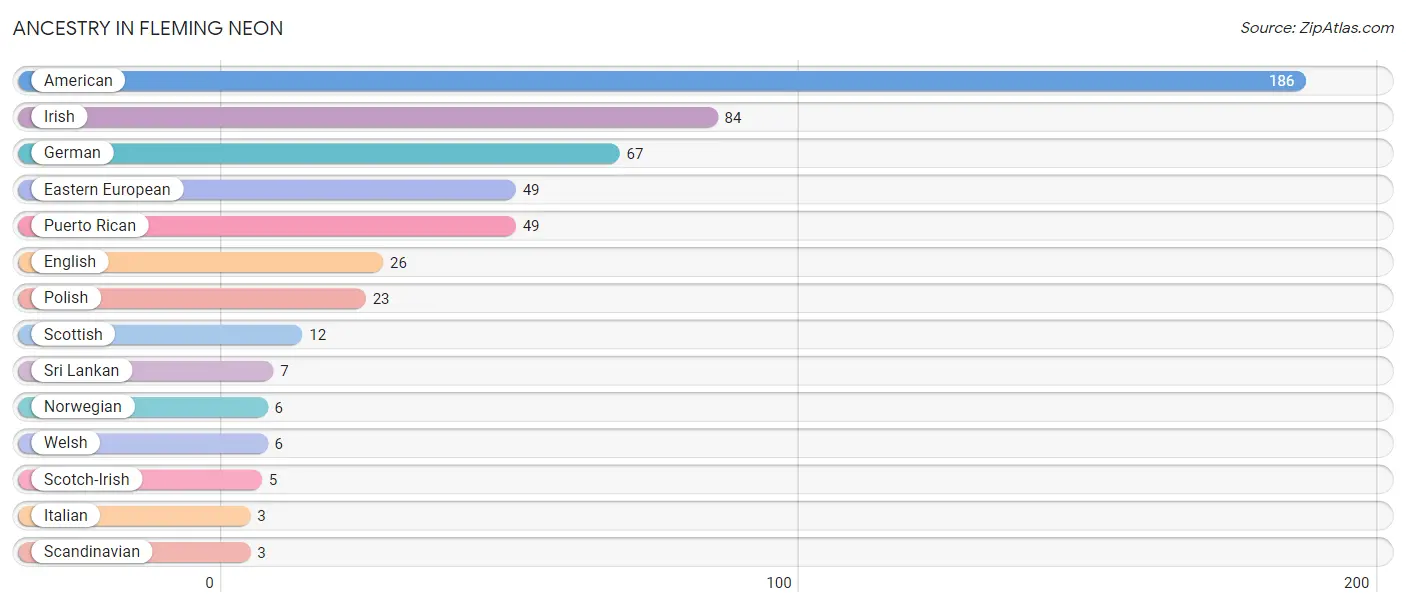
| Ancestry | # Population | % Population |
| American | 186 | 21.6% |
| Eastern European | 49 | 5.7% |
| English | 26 | 3.0% |
| German | 67 | 7.8% |
| Irish | 84 | 9.7% |
| Italian | 3 | 0.4% |
| Norwegian | 6 | 0.7% |
| Polish | 23 | 2.7% |
| Puerto Rican | 49 | 5.7% |
| Scandinavian | 3 | 0.4% |
| Scotch-Irish | 5 | 0.6% |
| Scottish | 12 | 1.4% |
| Sri Lankan | 7 | 0.8% |
| Welsh | 6 | 0.7% | View All 14 Rows |
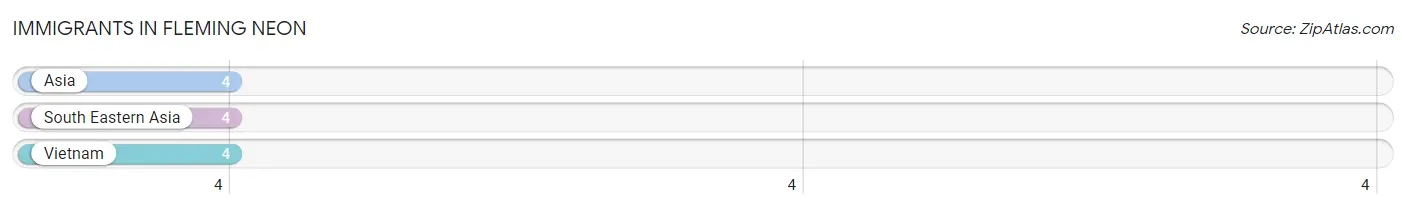
Immigrants in Fleming Neon
The most numerous immigrant groups reported in Fleming Neon came from Asia (4 | 0.5%), South Eastern Asia (4 | 0.5%), and Vietnam (4 | 0.5%), together accounting for 1.4% of all Fleming Neon residents.
| Immigration Origin | # Population | % Population |
| Asia | 4 | 0.5% |
| South Eastern Asia | 4 | 0.5% |
| Vietnam | 4 | 0.5% | View All 3 Rows |
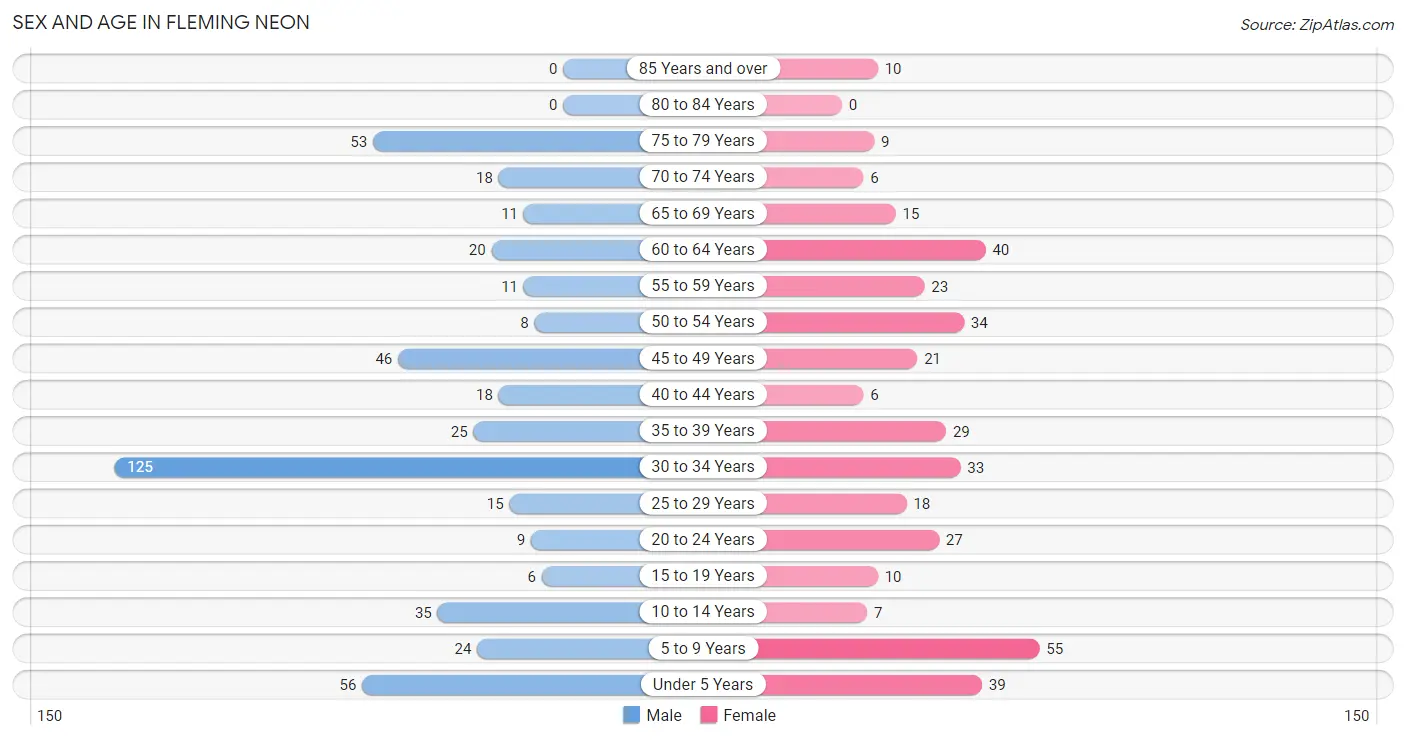
Sex and Age in Fleming Neon
Sex and Age in Fleming Neon
The most populous age groups in Fleming Neon are 30 to 34 Years (125 | 26.0%) for men and 5 to 9 Years (55 | 14.4%) for women.
| Age Bracket | Male | Female |
| Under 5 Years | 56 (11.7%) | 39 (10.2%) |
| 5 to 9 Years | 24 (5.0%) | 55 (14.4%) |
| 10 to 14 Years | 35 (7.3%) | 7 (1.8%) |
| 15 to 19 Years | 6 (1.3%) | 10 (2.6%) |
| 20 to 24 Years | 9 (1.9%) | 27 (7.1%) |
| 25 to 29 Years | 15 (3.1%) | 18 (4.7%) |
| 30 to 34 Years | 125 (26.0%) | 33 (8.6%) |
| 35 to 39 Years | 25 (5.2%) | 29 (7.6%) |
| 40 to 44 Years | 18 (3.7%) | 6 (1.6%) |
| 45 to 49 Years | 46 (9.6%) | 21 (5.5%) |
| 50 to 54 Years | 8 (1.7%) | 34 (8.9%) |
| 55 to 59 Years | 11 (2.3%) | 23 (6.0%) |
| 60 to 64 Years | 20 (4.2%) | 40 (10.5%) |
| 65 to 69 Years | 11 (2.3%) | 15 (3.9%) |
| 70 to 74 Years | 18 (3.7%) | 6 (1.6%) |
| 75 to 79 Years | 53 (11.0%) | 9 (2.4%) |
| 80 to 84 Years | 0 (0.0%) | 0 (0.0%) |
| 85 Years and over | 0 (0.0%) | 10 (2.6%) |
| Total | 480 (100.0%) | 382 (100.0%) |
Families and Households in Fleming Neon
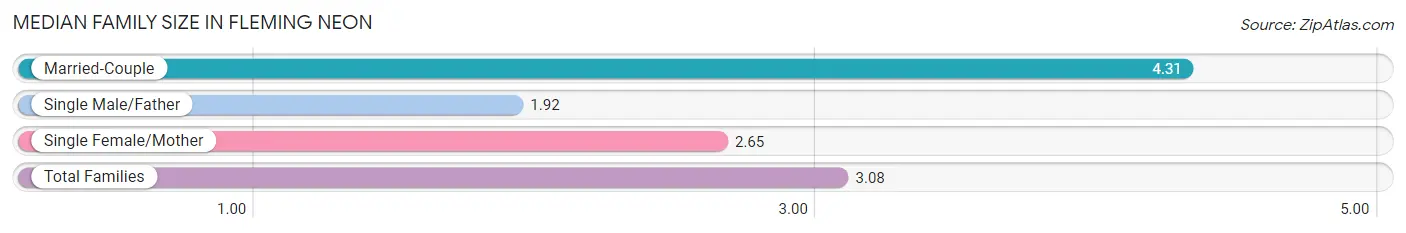
Median Family Size in Fleming Neon
The median family size in Fleming Neon is 3.08 persons per family, with married-couple families (109 | 42.4%) accounting for the largest median family size of 4.31 persons per family. On the other hand, single male/father families (97 | 37.7%) represent the smallest median family size with 1.92 persons per family.
| Family Type | # Families | Family Size |
| Married-Couple | 109 (42.4%) | 4.31 |
| Single Male/Father | 97 (37.7%) | 1.92 |
| Single Female/Mother | 51 (19.8%) | 2.65 |
| Total Families | 257 (100.0%) | 3.08 |
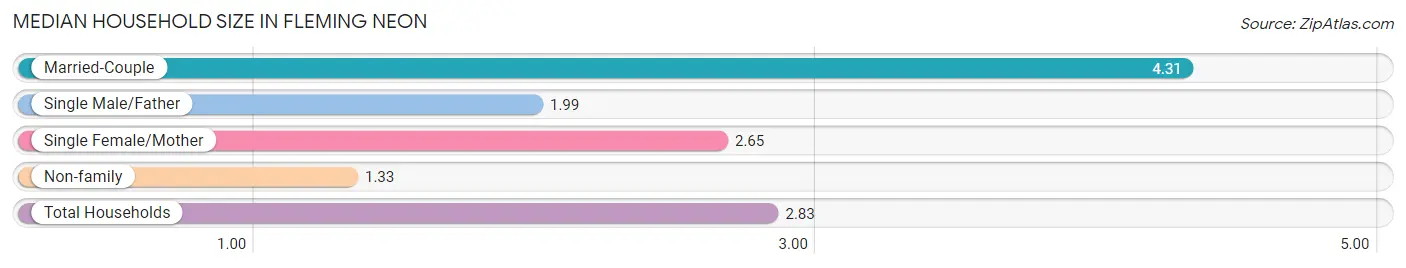
Median Household Size in Fleming Neon
The median household size in Fleming Neon is 2.83 persons per household, with married-couple households (109 | 35.7%) accounting for the largest median household size of 4.31 persons per household. non-family households (48 | 15.7%) represent the smallest median household size with 1.33 persons per household.
| Household Type | # Households | Household Size |
| Married-Couple | 109 (35.7%) | 4.31 |
| Single Male/Father | 97 (31.8%) | 1.99 |
| Single Female/Mother | 51 (16.7%) | 2.65 |
| Non-family | 48 (15.7%) | 1.33 |
| Total Households | 305 (100.0%) | 2.83 |
Household Size by Marriage Status in Fleming Neon
Out of a total of 305 households in Fleming Neon, 257 (84.3%) are family households, while 48 (15.7%) are nonfamily households. The most numerous type of family households are 2-person households, comprising 99, and the most common type of nonfamily households are 1-person households, comprising 40.
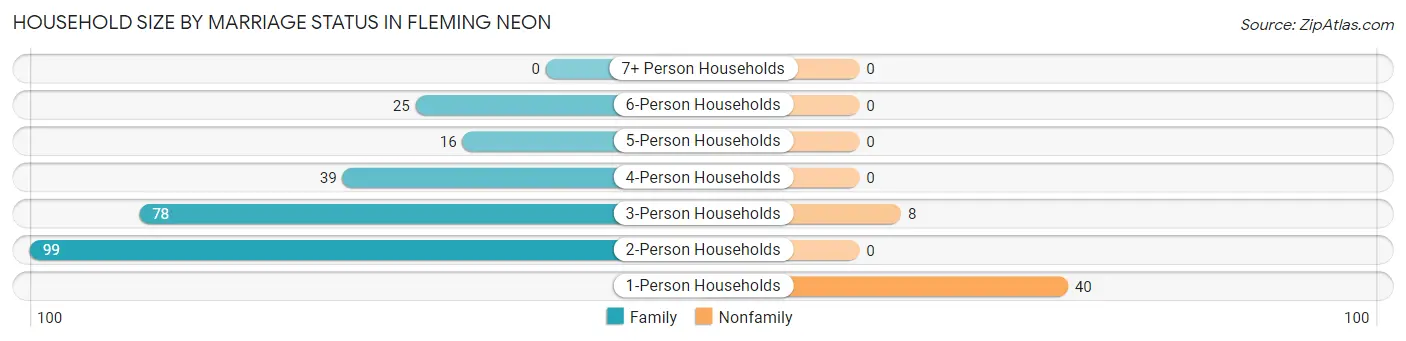
| Household Size | Family Households | Nonfamily Households |
| 1-Person Households | - | 40 (13.1%) |
| 2-Person Households | 99 (32.5%) | 0 (0.0%) |
| 3-Person Households | 78 (25.6%) | 8 (2.6%) |
| 4-Person Households | 39 (12.8%) | 0 (0.0%) |
| 5-Person Households | 16 (5.2%) | 0 (0.0%) |
| 6-Person Households | 25 (8.2%) | 0 (0.0%) |
| 7+ Person Households | 0 (0.0%) | 0 (0.0%) |
| Total | 257 (84.3%) | 48 (15.7%) |
Female Fertility in Fleming Neon
Fertility by Age in Fleming Neon
Average fertility rate in Fleming Neon is 236.0 births per 1,000 women. Women in the age bracket of 20 to 34 years have the highest fertility rate with 269.0 births per 1,000 women. Women in the age bracket of 20 to 34 years acount for 61.8% of all women with births.
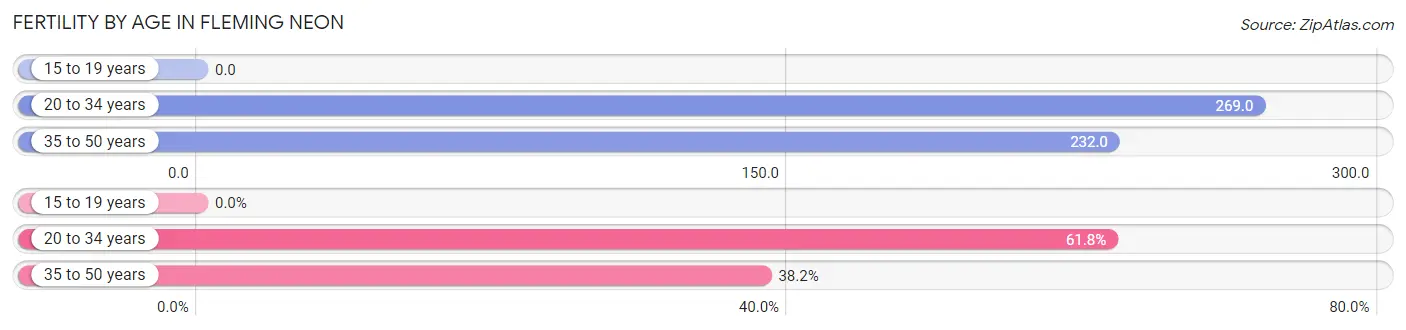
| Age Bracket | Women with Births | Births / 1,000 Women |
| 15 to 19 years | 0 (0.0%) | 0.0 |
| 20 to 34 years | 21 (61.8%) | 269.0 |
| 35 to 50 years | 13 (38.2%) | 232.0 |
| Total | 34 (100.0%) | 236.0 |
Fertility by Age by Marriage Status in Fleming Neon
52.9% of women with births (34) in Fleming Neon are married. The highest percentage of unmarried women with births falls into 35 to 50 years age bracket with 100.0% of them unmarried at the time of birth, while the lowest percentage of unmarried women with births belong to 20 to 34 years age bracket with 14.3% of them unmarried.
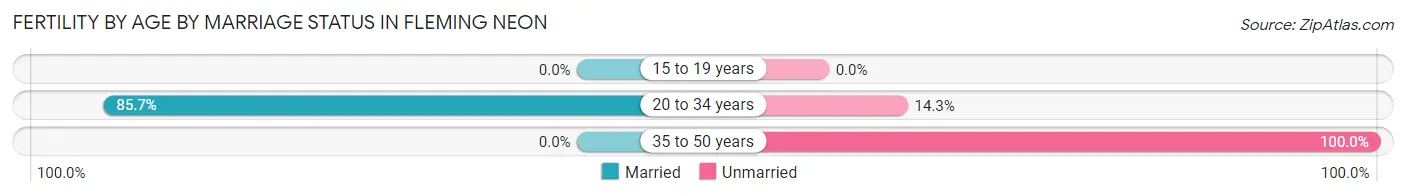
| Age Bracket | Married | Unmarried |
| 15 to 19 years | 0 (0.0%) | 0 (0.0%) |
| 20 to 34 years | 18 (85.7%) | 3 (14.3%) |
| 35 to 50 years | 0 (0.0%) | 13 (100.0%) |
| Total | 18 (52.9%) | 16 (47.1%) |
Fertility by Education in Fleming Neon
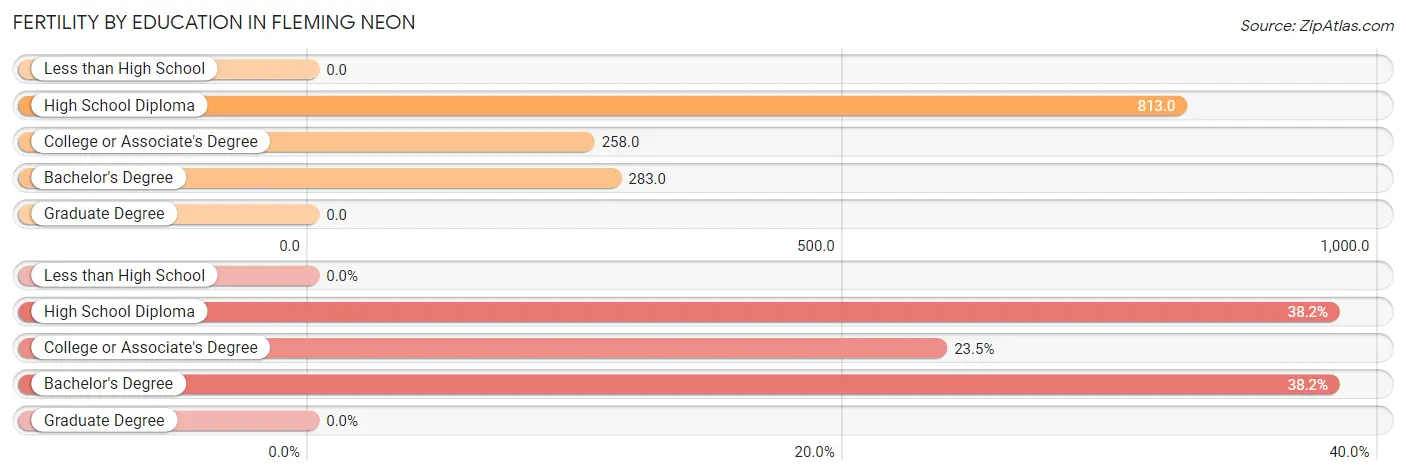
| Educational Attainment | Women with Births | Births / 1,000 Women |
| Less than High School | 0 (0.0%) | 0.0 |
| High School Diploma | 13 (38.2%) | 813.0 |
| College or Associate's Degree | 8 (23.5%) | 258.0 |
| Bachelor's Degree | 13 (38.2%) | 283.0 |
| Graduate Degree | 0 (0.0%) | 0.0 |
| Total | 34 (100.0%) | 236.0 |
Fertility by Education by Marriage Status in Fleming Neon
47.1% of women with births in Fleming Neon are unmarried. Women with the educational attainment of college or associate's degree are most likely to be married with 100.0% of them married at childbirth, while women with the educational attainment of high school diploma are least likely to be married with 100.0% of them unmarried at childbirth.
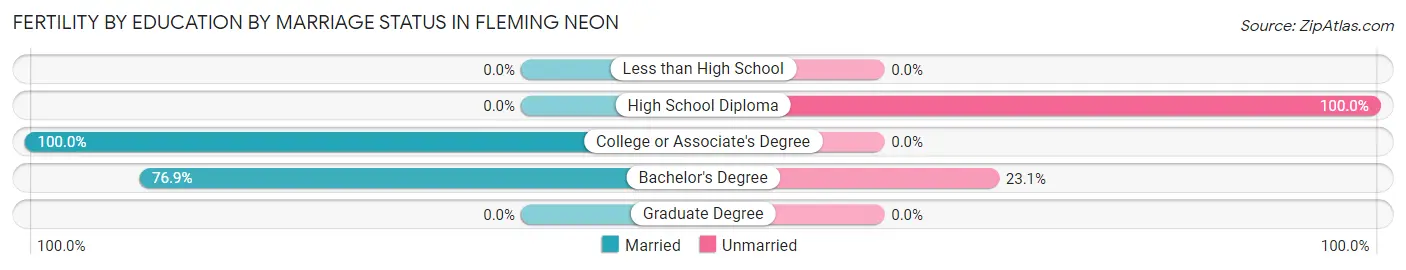
| Educational Attainment | Married | Unmarried |
| Less than High School | 0 (0.0%) | 0 (0.0%) |
| High School Diploma | 0 (0.0%) | 13 (100.0%) |
| College or Associate's Degree | 8 (100.0%) | 0 (0.0%) |
| Bachelor's Degree | 10 (76.9%) | 3 (23.1%) |
| Graduate Degree | 0 (0.0%) | 0 (0.0%) |
| Total | 18 (52.9%) | 16 (47.1%) |
Employment Characteristics in Fleming Neon
Employment by Class of Employer in Fleming Neon
Among the 307 employed individuals in Fleming Neon, private company employees (154 | 50.2%), local government employees (64 | 20.8%), and not-for-profit organizations (54 | 17.6%) make up the most common classes of employment.
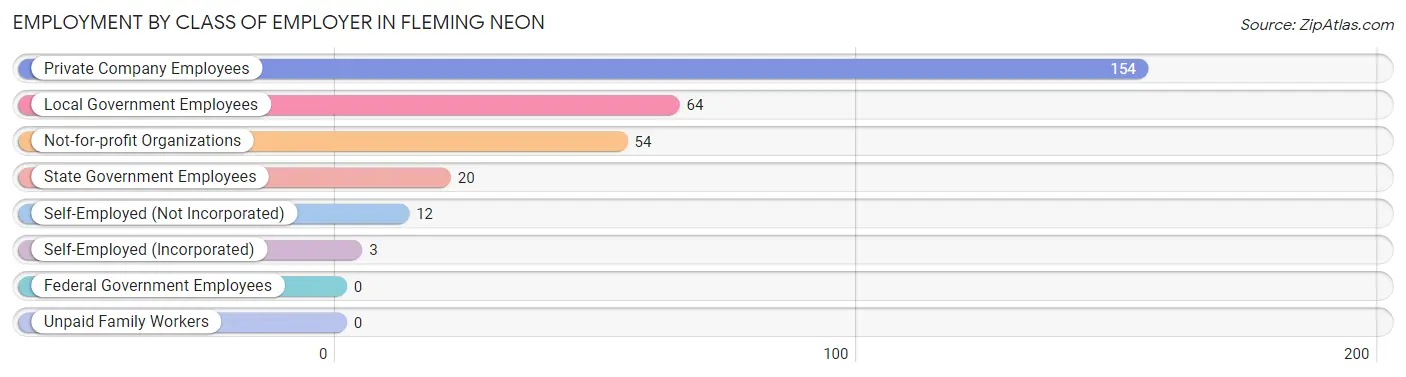
| Employer Class | # Employees | % Employees |
| Private Company Employees | 154 | 50.2% |
| Self-Employed (Incorporated) | 3 | 1.0% |
| Self-Employed (Not Incorporated) | 12 | 3.9% |
| Not-for-profit Organizations | 54 | 17.6% |
| Local Government Employees | 64 | 20.8% |
| State Government Employees | 20 | 6.5% |
| Federal Government Employees | 0 | 0.0% |
| Unpaid Family Workers | 0 | 0.0% |
| Total | 307 | 100.0% |
Employment Status by Age in Fleming Neon
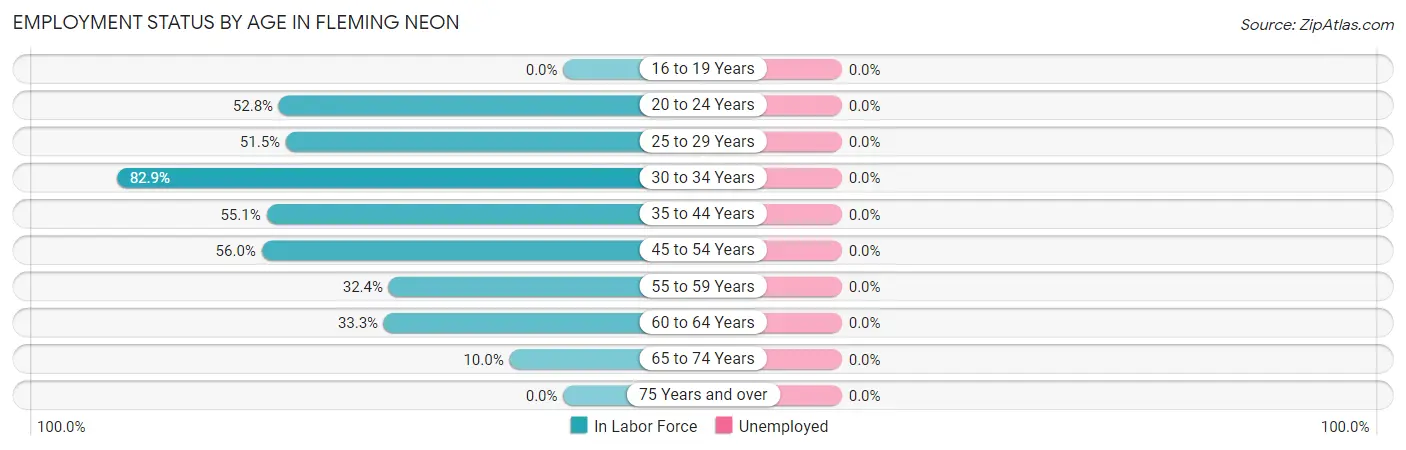
| Age Bracket | In Labor Force | Unemployed |
| 16 to 19 Years | 0 (0.0%) | 0 (0.0%) |
| 20 to 24 Years | 19 (52.8%) | 0 (0.0%) |
| 25 to 29 Years | 17 (51.5%) | 0 (0.0%) |
| 30 to 34 Years | 131 (82.9%) | 0 (0.0%) |
| 35 to 44 Years | 43 (55.1%) | 0 (0.0%) |
| 45 to 54 Years | 61 (56.0%) | 0 (0.0%) |
| 55 to 59 Years | 11 (32.4%) | 0 (0.0%) |
| 60 to 64 Years | 20 (33.3%) | 0 (0.0%) |
| 65 to 74 Years | 5 (10.0%) | 0 (0.0%) |
| 75 Years and over | 0 (0.0%) | 0 (0.0%) |
| Total | 307 (48.0%) | 0 (0.0%) |
Employment Status by Educational Attainment in Fleming Neon
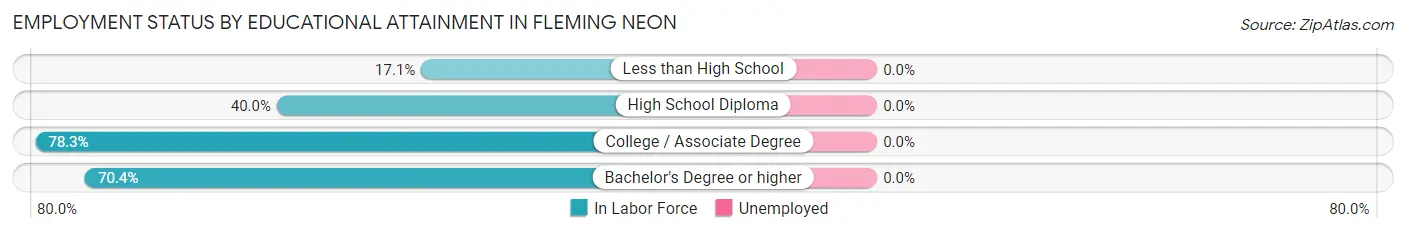
| Educational Attainment | In Labor Force | Unemployed |
| Less than High School | 13 (17.1%) | 0 (0.0%) |
| High School Diploma | 36 (40.0%) | 0 (0.0%) |
| College / Associate Degree | 184 (78.3%) | 0 (0.0%) |
| Bachelor's Degree or higher | 50 (70.4%) | 0 (0.0%) |
| Total | 283 (60.0%) | 0 (0.0%) |
Employment Occupations by Sex in Fleming Neon
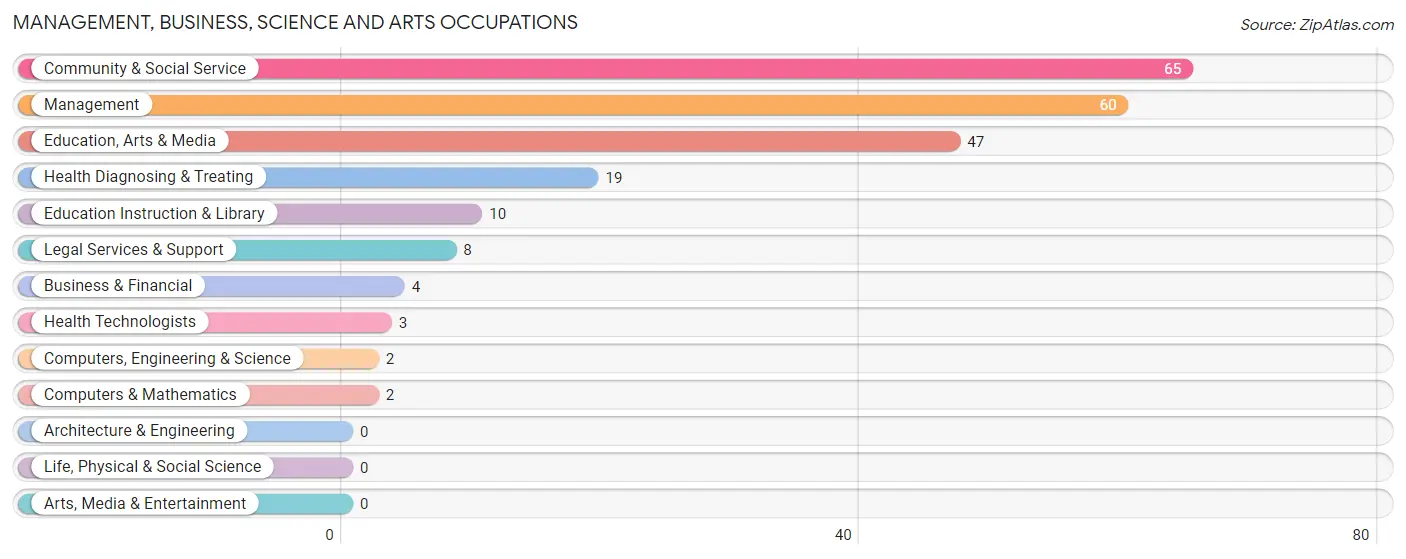
Management, Business, Science and Arts Occupations
The most common Management, Business, Science and Arts occupations in Fleming Neon are Community & Social Service (65 | 21.2%), Management (60 | 19.5%), Education, Arts & Media (47 | 15.3%), Health Diagnosing & Treating (19 | 6.2%), and Education Instruction & Library (10 | 3.3%).
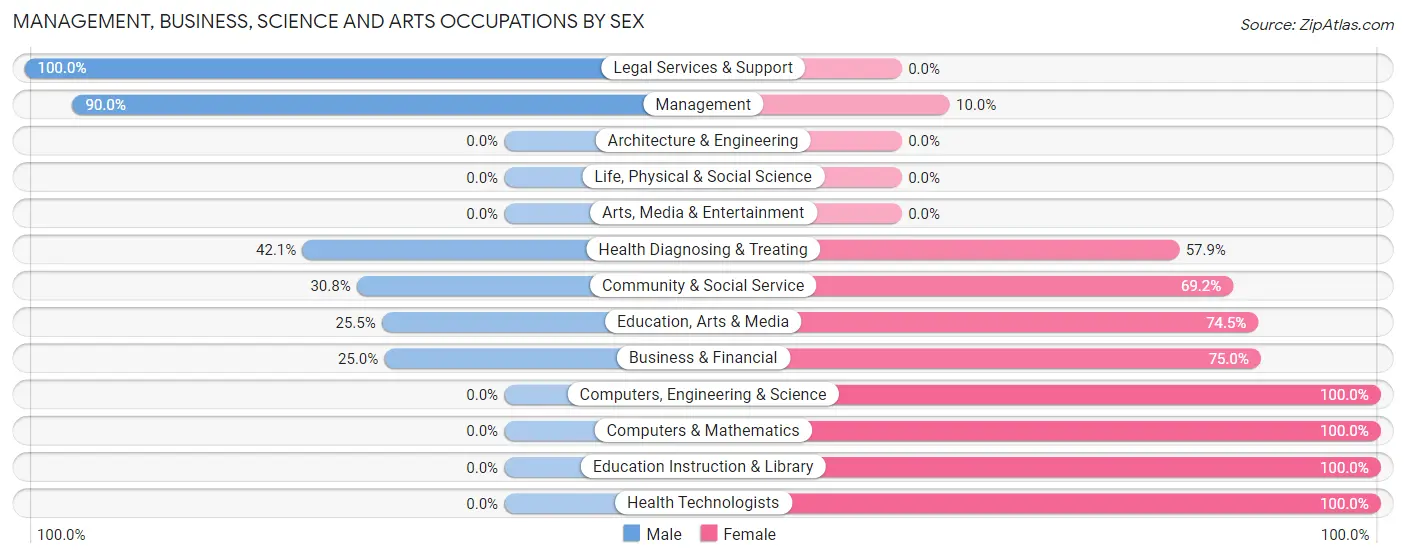
Management, Business, Science and Arts Occupations by Sex
Within the Management, Business, Science and Arts occupations in Fleming Neon, the most male-oriented occupations are Legal Services & Support (100.0%), Management (90.0%), and Health Diagnosing & Treating (42.1%), while the most female-oriented occupations are Computers, Engineering & Science (100.0%), Computers & Mathematics (100.0%), and Education Instruction & Library (100.0%).
| Occupation | Male | Female |
| Management | 54 (90.0%) | 6 (10.0%) |
| Business & Financial | 1 (25.0%) | 3 (75.0%) |
| Computers, Engineering & Science | 0 (0.0%) | 2 (100.0%) |
| Computers & Mathematics | 0 (0.0%) | 2 (100.0%) |
| Architecture & Engineering | 0 (0.0%) | 0 (0.0%) |
| Life, Physical & Social Science | 0 (0.0%) | 0 (0.0%) |
| Community & Social Service | 20 (30.8%) | 45 (69.2%) |
| Education, Arts & Media | 12 (25.5%) | 35 (74.5%) |
| Legal Services & Support | 8 (100.0%) | 0 (0.0%) |
| Education Instruction & Library | 0 (0.0%) | 10 (100.0%) |
| Arts, Media & Entertainment | 0 (0.0%) | 0 (0.0%) |
| Health Diagnosing & Treating | 8 (42.1%) | 11 (57.9%) |
| Health Technologists | 0 (0.0%) | 3 (100.0%) |
| Total (Category) | 83 (55.3%) | 67 (44.7%) |
| Total (Overall) | 192 (62.5%) | 115 (37.5%) |
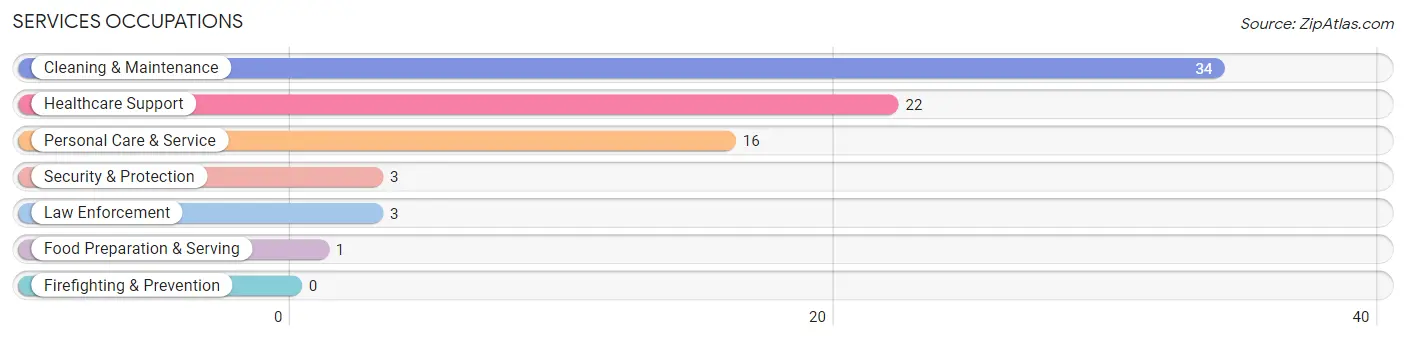
Services Occupations
The most common Services occupations in Fleming Neon are Cleaning & Maintenance (34 | 11.1%), Healthcare Support (22 | 7.2%), Personal Care & Service (16 | 5.2%), Security & Protection (3 | 1.0%), and Law Enforcement (3 | 1.0%).
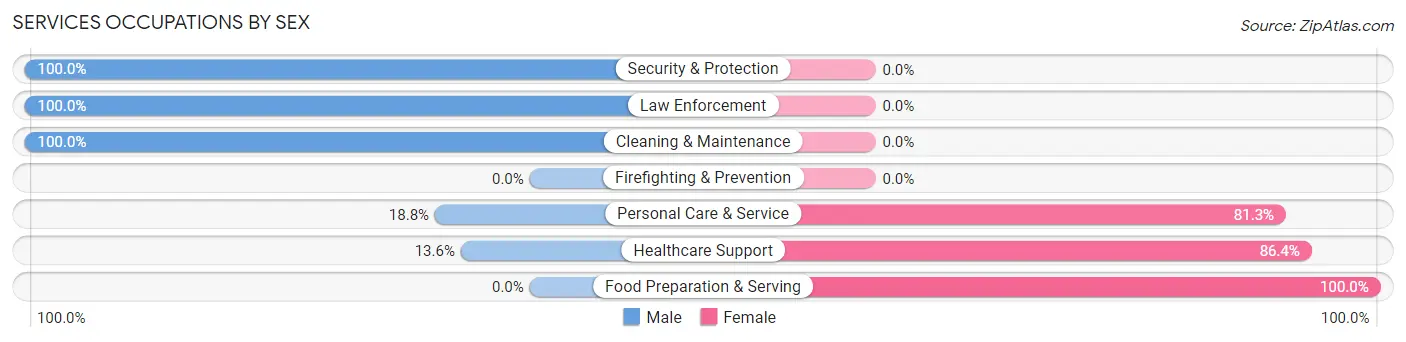
Services Occupations by Sex
Within the Services occupations in Fleming Neon, the most male-oriented occupations are Security & Protection (100.0%), Law Enforcement (100.0%), and Cleaning & Maintenance (100.0%), while the most female-oriented occupations are Food Preparation & Serving (100.0%), Healthcare Support (86.4%), and Personal Care & Service (81.2%).
| Occupation | Male | Female |
| Healthcare Support | 3 (13.6%) | 19 (86.4%) |
| Security & Protection | 3 (100.0%) | 0 (0.0%) |
| Firefighting & Prevention | 0 (0.0%) | 0 (0.0%) |
| Law Enforcement | 3 (100.0%) | 0 (0.0%) |
| Food Preparation & Serving | 0 (0.0%) | 1 (100.0%) |
| Cleaning & Maintenance | 34 (100.0%) | 0 (0.0%) |
| Personal Care & Service | 3 (18.8%) | 13 (81.2%) |
| Total (Category) | 43 (56.6%) | 33 (43.4%) |
| Total (Overall) | 192 (62.5%) | 115 (37.5%) |
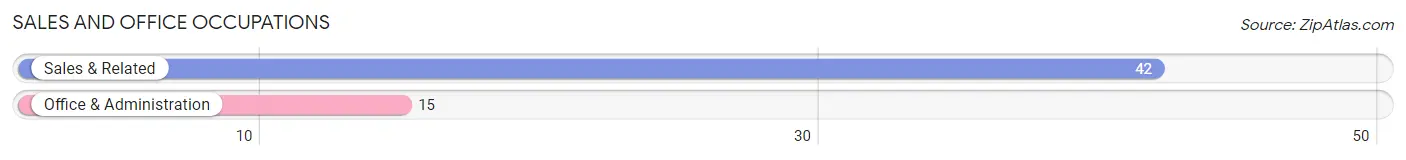
Sales and Office Occupations
The most common Sales and Office occupations in Fleming Neon are Sales & Related (42 | 13.7%), and Office & Administration (15 | 4.9%).
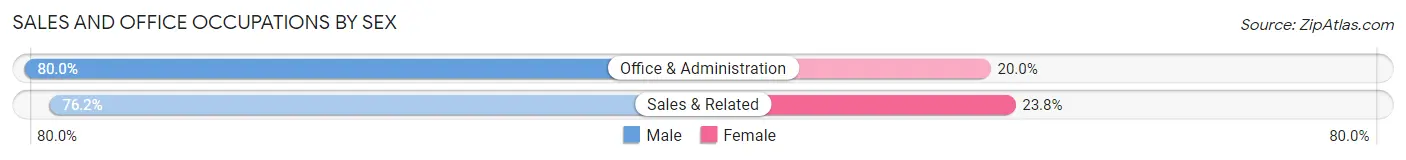
Sales and Office Occupations by Sex
| Occupation | Male | Female |
| Sales & Related | 32 (76.2%) | 10 (23.8%) |
| Office & Administration | 12 (80.0%) | 3 (20.0%) |
| Total (Category) | 44 (77.2%) | 13 (22.8%) |
| Total (Overall) | 192 (62.5%) | 115 (37.5%) |
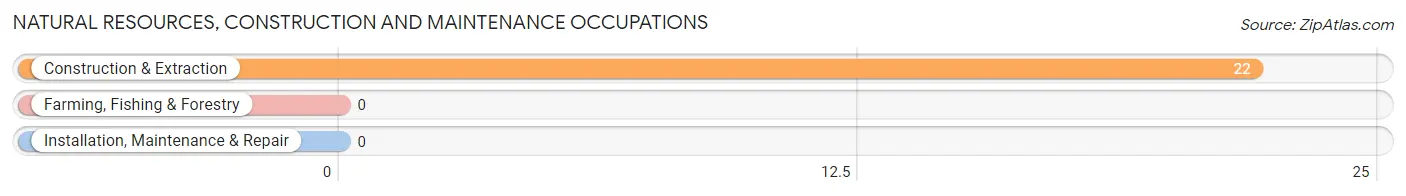
Natural Resources, Construction and Maintenance Occupations
The most common Natural Resources, Construction and Maintenance occupations in Fleming Neon are , and Construction & Extraction (22 | 7.2%).
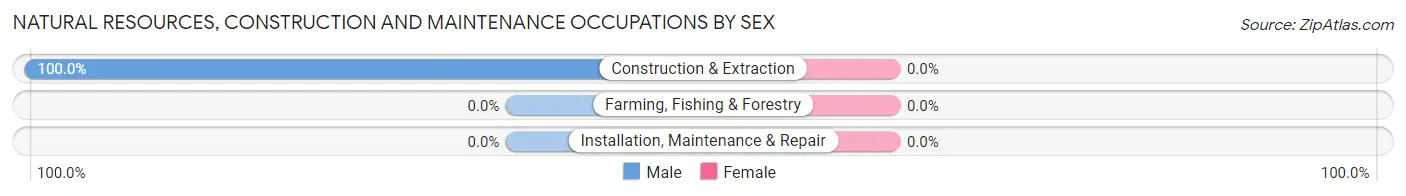
Natural Resources, Construction and Maintenance Occupations by Sex
| Occupation | Male | Female |
| Farming, Fishing & Forestry | 0 (0.0%) | 0 (0.0%) |
| Construction & Extraction | 22 (100.0%) | 0 (0.0%) |
| Installation, Maintenance & Repair | 0 (0.0%) | 0 (0.0%) |
| Total (Category) | 22 (100.0%) | 0 (0.0%) |
| Total (Overall) | 192 (62.5%) | 115 (37.5%) |
Production, Transportation and Moving Occupations
The most common Production, Transportation and Moving occupations in Fleming Neon are , and Material Moving (2 | 0.6%).
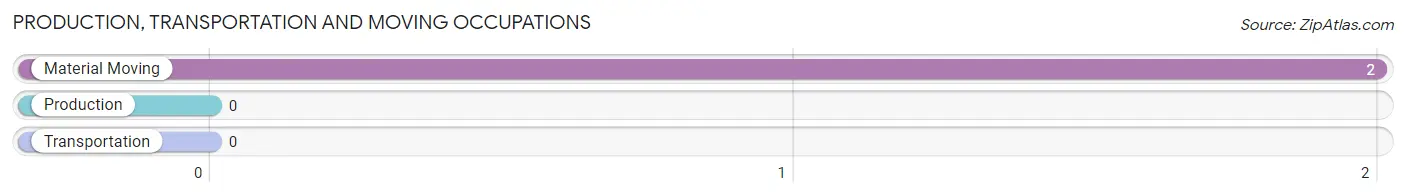
Production, Transportation and Moving Occupations by Sex
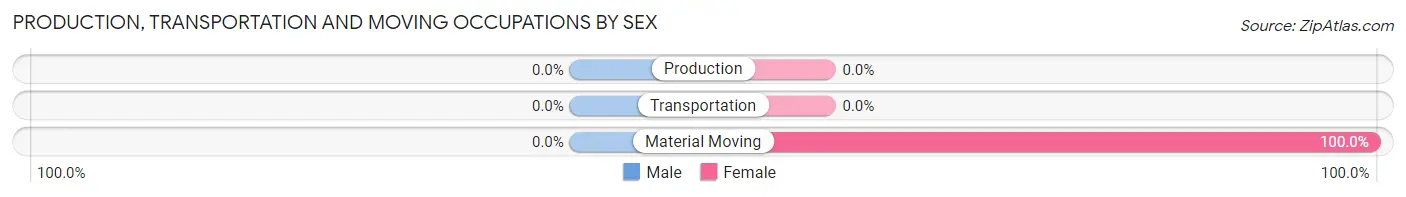
| Occupation | Male | Female |
| Production | 0 (0.0%) | 0 (0.0%) |
| Transportation | 0 (0.0%) | 0 (0.0%) |
| Material Moving | 0 (0.0%) | 2 (100.0%) |
| Total (Category) | 0 (0.0%) | 2 (100.0%) |
| Total (Overall) | 192 (62.5%) | 115 (37.5%) |
Employment Industries by Sex in Fleming Neon
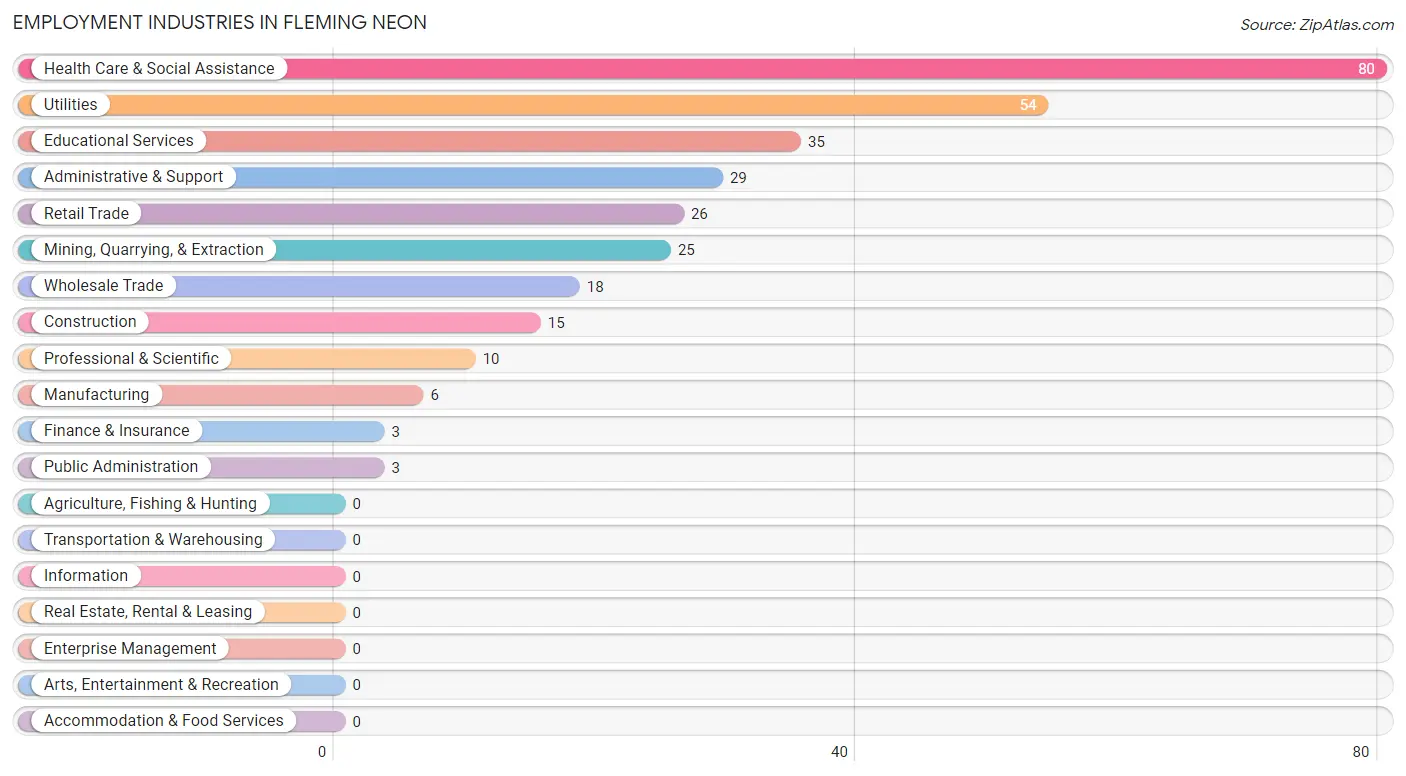
Employment Industries in Fleming Neon
The major employment industries in Fleming Neon include Health Care & Social Assistance (80 | 26.1%), Utilities (54 | 17.6%), Educational Services (35 | 11.4%), Administrative & Support (29 | 9.5%), and Retail Trade (26 | 8.5%).
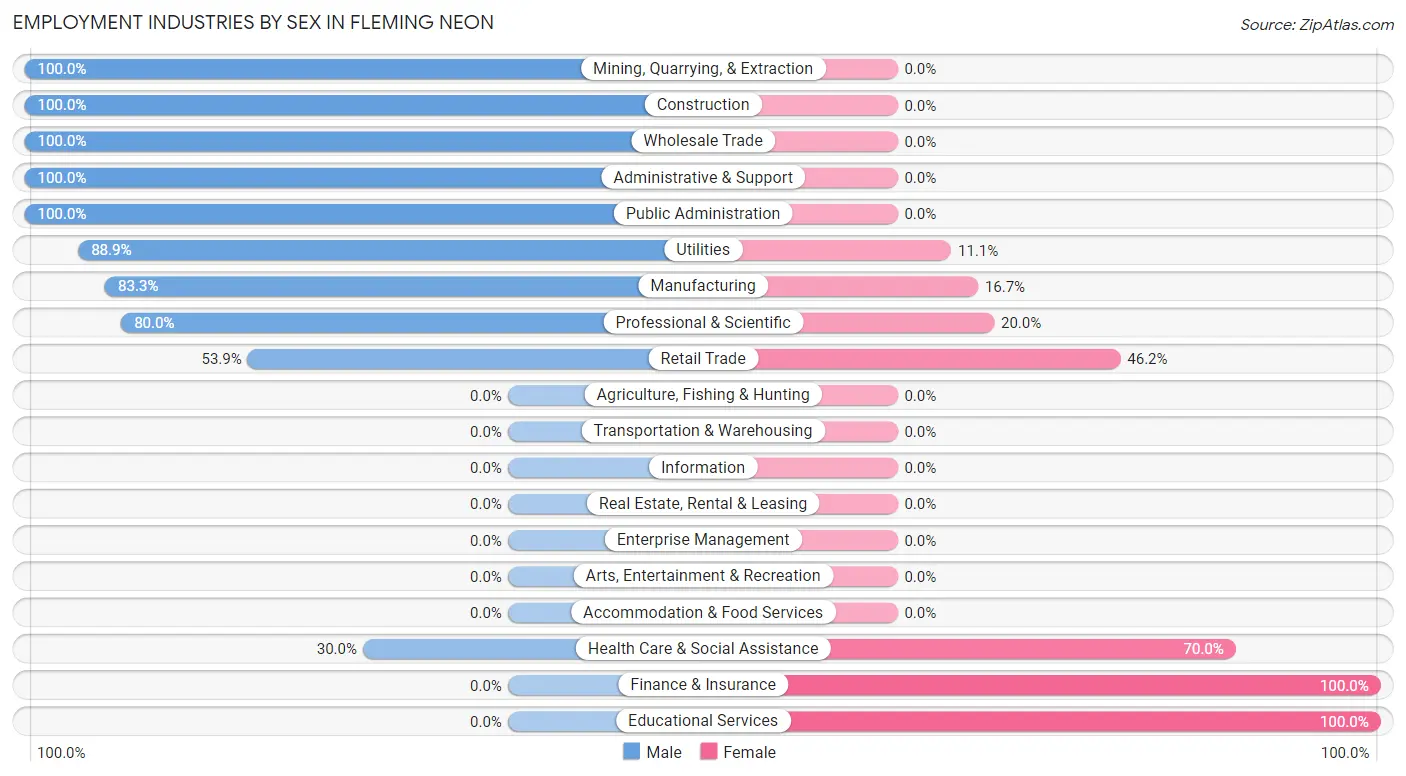
Employment Industries by Sex in Fleming Neon
The Fleming Neon industries that see more men than women are Mining, Quarrying, & Extraction (100.0%), Construction (100.0%), and Wholesale Trade (100.0%), whereas the industries that tend to have a higher number of women are Finance & Insurance (100.0%), Educational Services (100.0%), and Health Care & Social Assistance (70.0%).
| Industry | Male | Female |
| Agriculture, Fishing & Hunting | 0 (0.0%) | 0 (0.0%) |
| Mining, Quarrying, & Extraction | 25 (100.0%) | 0 (0.0%) |
| Construction | 15 (100.0%) | 0 (0.0%) |
| Manufacturing | 5 (83.3%) | 1 (16.7%) |
| Wholesale Trade | 18 (100.0%) | 0 (0.0%) |
| Retail Trade | 14 (53.8%) | 12 (46.2%) |
| Transportation & Warehousing | 0 (0.0%) | 0 (0.0%) |
| Utilities | 48 (88.9%) | 6 (11.1%) |
| Information | 0 (0.0%) | 0 (0.0%) |
| Finance & Insurance | 0 (0.0%) | 3 (100.0%) |
| Real Estate, Rental & Leasing | 0 (0.0%) | 0 (0.0%) |
| Professional & Scientific | 8 (80.0%) | 2 (20.0%) |
| Enterprise Management | 0 (0.0%) | 0 (0.0%) |
| Administrative & Support | 29 (100.0%) | 0 (0.0%) |
| Educational Services | 0 (0.0%) | 35 (100.0%) |
| Health Care & Social Assistance | 24 (30.0%) | 56 (70.0%) |
| Arts, Entertainment & Recreation | 0 (0.0%) | 0 (0.0%) |
| Accommodation & Food Services | 0 (0.0%) | 0 (0.0%) |
| Public Administration | 3 (100.0%) | 0 (0.0%) |
| Total | 192 (62.5%) | 115 (37.5%) |
Education in Fleming Neon
School Enrollment in Fleming Neon
The most common levels of schooling among the 120 students in Fleming Neon are middle school (33 | 27.5%), nursery / preschool (32 | 26.7%), and kindergarten (20 | 16.7%).
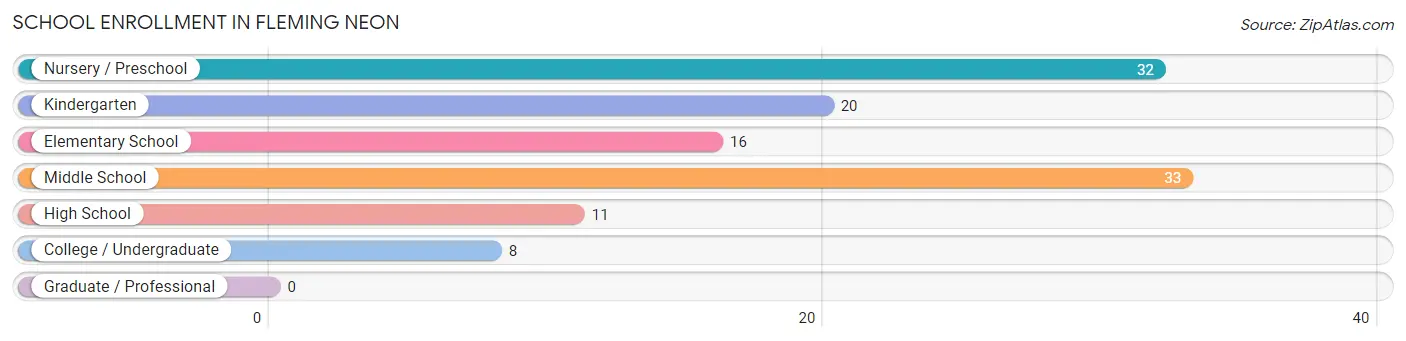
| School Level | # Students | % Students |
| Nursery / Preschool | 32 | 26.7% |
| Kindergarten | 20 | 16.7% |
| Elementary School | 16 | 13.3% |
| Middle School | 33 | 27.5% |
| High School | 11 | 9.2% |
| College / Undergraduate | 8 | 6.7% |
| Graduate / Professional | 0 | 0.0% |
| Total | 120 | 100.0% |
School Enrollment by Age by Funding Source in Fleming Neon
Out of a total of 120 students who are enrolled in schools in Fleming Neon, 3 (2.5%) attend a private institution, while the remaining 117 (97.5%) are enrolled in public schools. The age group of 10 to 14 year olds has the highest likelihood of being enrolled in private schools, with 3 (7.7% in the age bracket) enrolled. Conversely, the age group of 3 to 4 year olds has the lowest likelihood of being enrolled in a private school, with 30 (100.0% in the age bracket) attending a public institution.
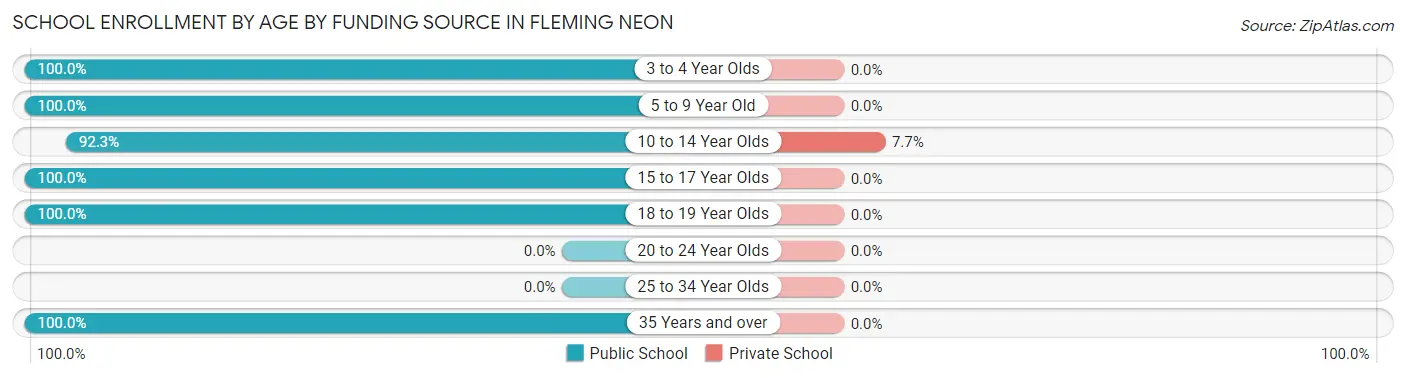
| Age Bracket | Public School | Private School |
| 3 to 4 Year Olds | 30 (100.0%) | 0 (0.0%) |
| 5 to 9 Year Old | 32 (100.0%) | 0 (0.0%) |
| 10 to 14 Year Olds | 36 (92.3%) | 3 (7.7%) |
| 15 to 17 Year Olds | 6 (100.0%) | 0 (0.0%) |
| 18 to 19 Year Olds | 10 (100.0%) | 0 (0.0%) |
| 20 to 24 Year Olds | 0 (0.0%) | 0 (0.0%) |
| 25 to 34 Year Olds | 0 (0.0%) | 0 (0.0%) |
| 35 Years and over | 3 (100.0%) | 0 (0.0%) |
| Total | 117 (97.5%) | 3 (2.5%) |
Educational Attainment by Field of Study in Fleming Neon
Business (61 | 41.8%), psychology (25 | 17.1%), arts & humanities (23 | 15.8%), communications (16 | 11.0%), and social sciences (12 | 8.2%) are the most common fields of study among 146 individuals in Fleming Neon who have obtained a bachelor's degree or higher.
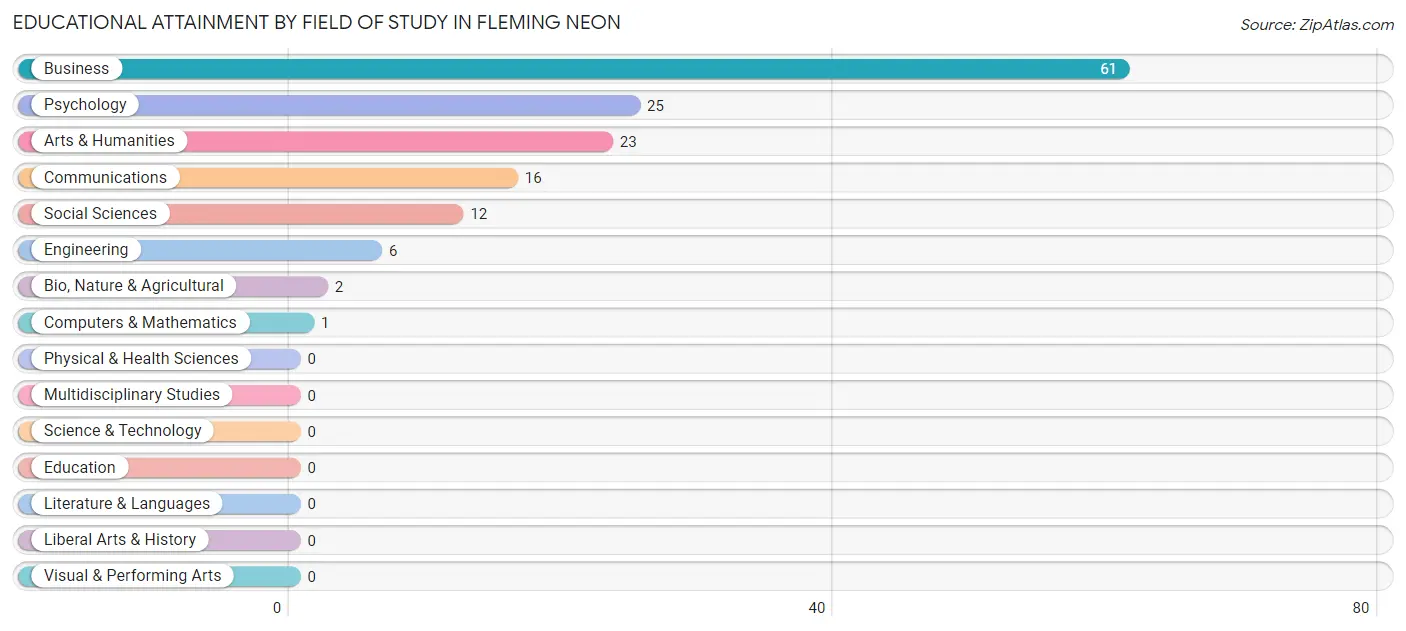
| Field of Study | # Graduates | % Graduates |
| Computers & Mathematics | 1 | 0.7% |
| Bio, Nature & Agricultural | 2 | 1.4% |
| Physical & Health Sciences | 0 | 0.0% |
| Psychology | 25 | 17.1% |
| Social Sciences | 12 | 8.2% |
| Engineering | 6 | 4.1% |
| Multidisciplinary Studies | 0 | 0.0% |
| Science & Technology | 0 | 0.0% |
| Business | 61 | 41.8% |
| Education | 0 | 0.0% |
| Literature & Languages | 0 | 0.0% |
| Liberal Arts & History | 0 | 0.0% |
| Visual & Performing Arts | 0 | 0.0% |
| Communications | 16 | 11.0% |
| Arts & Humanities | 23 | 15.8% |
| Total | 146 | 100.0% |
Transportation & Commute in Fleming Neon
Vehicle Availability by Sex in Fleming Neon
The most prevalent vehicle ownership categories in Fleming Neon are males with 2 vehicles (69, accounting for 35.9%) and females with 2 vehicles (53, making up 60.0%).
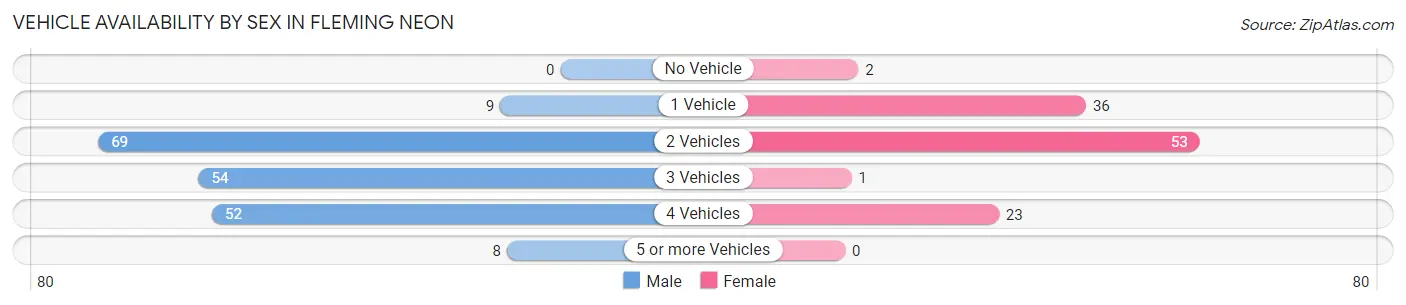
| Vehicles Available | Male | Female |
| No Vehicle | 0 (0.0%) | 2 (1.7%) |
| 1 Vehicle | 9 (4.7%) | 36 (31.3%) |
| 2 Vehicles | 69 (35.9%) | 53 (46.1%) |
| 3 Vehicles | 54 (28.1%) | 1 (0.9%) |
| 4 Vehicles | 52 (27.1%) | 23 (20.0%) |
| 5 or more Vehicles | 8 (4.2%) | 0 (0.0%) |
| Total | 192 (100.0%) | 115 (100.0%) |
Commute Time in Fleming Neon
The most frequently occuring commute durations in Fleming Neon are 20 to 24 minutes (71 commuters, 27.1%), 30 to 34 minutes (50 commuters, 19.1%), and 15 to 19 minutes (46 commuters, 17.6%).
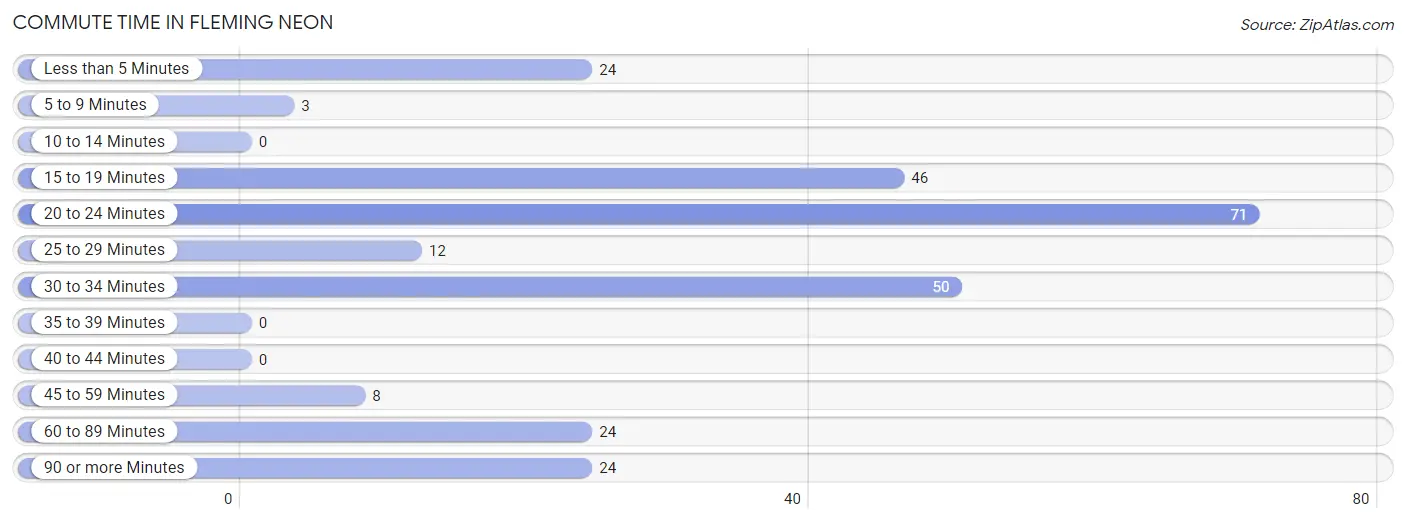
| Commute Time | # Commuters | % Commuters |
| Less than 5 Minutes | 24 | 9.2% |
| 5 to 9 Minutes | 3 | 1.1% |
| 10 to 14 Minutes | 0 | 0.0% |
| 15 to 19 Minutes | 46 | 17.6% |
| 20 to 24 Minutes | 71 | 27.1% |
| 25 to 29 Minutes | 12 | 4.6% |
| 30 to 34 Minutes | 50 | 19.1% |
| 35 to 39 Minutes | 0 | 0.0% |
| 40 to 44 Minutes | 0 | 0.0% |
| 45 to 59 Minutes | 8 | 3.0% |
| 60 to 89 Minutes | 24 | 9.2% |
| 90 or more Minutes | 24 | 9.2% |
Commute Time by Sex in Fleming Neon
The most common commute times in Fleming Neon are 20 to 24 minutes (56 commuters, 32.4%) for males and 30 to 34 minutes (25 commuters, 28.1%) for females.
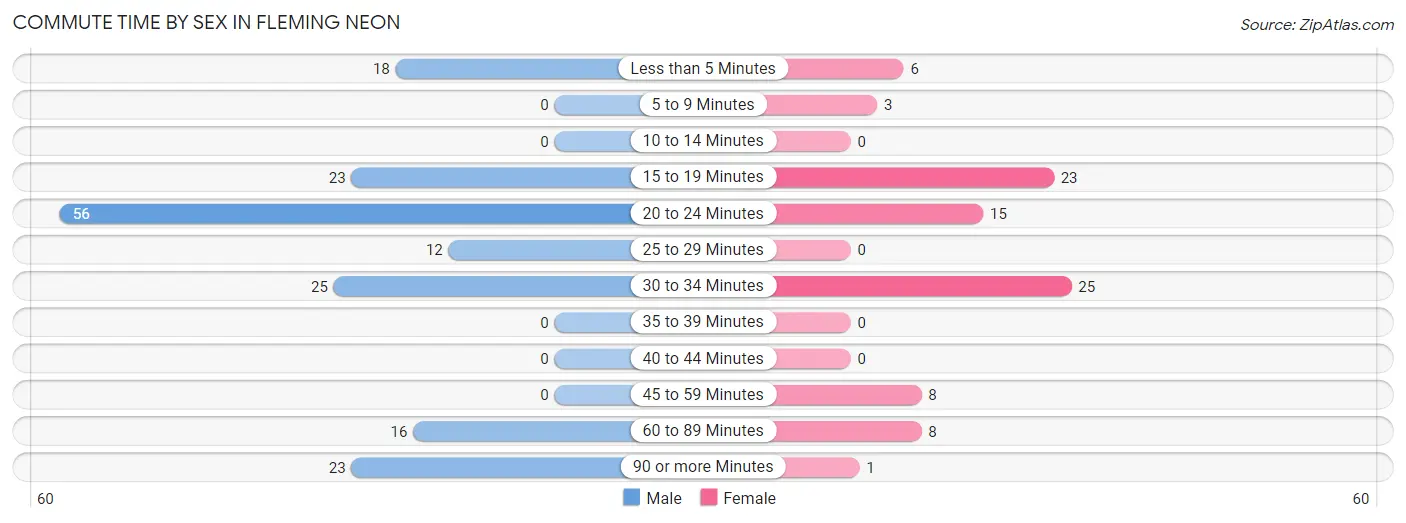
| Commute Time | Male | Female |
| Less than 5 Minutes | 18 (10.4%) | 6 (6.7%) |
| 5 to 9 Minutes | 0 (0.0%) | 3 (3.4%) |
| 10 to 14 Minutes | 0 (0.0%) | 0 (0.0%) |
| 15 to 19 Minutes | 23 (13.3%) | 23 (25.8%) |
| 20 to 24 Minutes | 56 (32.4%) | 15 (16.9%) |
| 25 to 29 Minutes | 12 (6.9%) | 0 (0.0%) |
| 30 to 34 Minutes | 25 (14.4%) | 25 (28.1%) |
| 35 to 39 Minutes | 0 (0.0%) | 0 (0.0%) |
| 40 to 44 Minutes | 0 (0.0%) | 0 (0.0%) |
| 45 to 59 Minutes | 0 (0.0%) | 8 (9.0%) |
| 60 to 89 Minutes | 16 (9.2%) | 8 (9.0%) |
| 90 or more Minutes | 23 (13.3%) | 1 (1.1%) |
Time of Departure to Work by Sex in Fleming Neon
The most frequent times of departure to work in Fleming Neon are 7:30 AM to 7:59 AM (75, 43.3%) for males and 8:00 AM to 8:29 AM (37, 41.6%) for females.
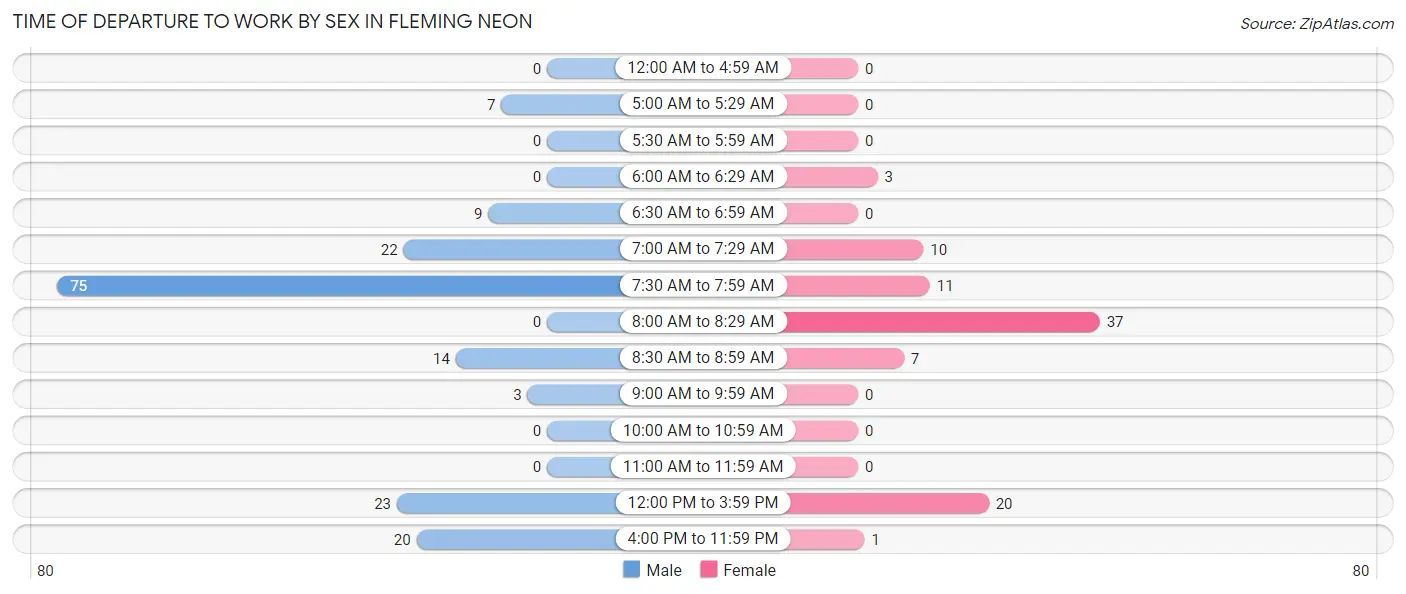
| Time of Departure | Male | Female |
| 12:00 AM to 4:59 AM | 0 (0.0%) | 0 (0.0%) |
| 5:00 AM to 5:29 AM | 7 (4.1%) | 0 (0.0%) |
| 5:30 AM to 5:59 AM | 0 (0.0%) | 0 (0.0%) |
| 6:00 AM to 6:29 AM | 0 (0.0%) | 3 (3.4%) |
| 6:30 AM to 6:59 AM | 9 (5.2%) | 0 (0.0%) |
| 7:00 AM to 7:29 AM | 22 (12.7%) | 10 (11.2%) |
| 7:30 AM to 7:59 AM | 75 (43.3%) | 11 (12.4%) |
| 8:00 AM to 8:29 AM | 0 (0.0%) | 37 (41.6%) |
| 8:30 AM to 8:59 AM | 14 (8.1%) | 7 (7.9%) |
| 9:00 AM to 9:59 AM | 3 (1.7%) | 0 (0.0%) |
| 10:00 AM to 10:59 AM | 0 (0.0%) | 0 (0.0%) |
| 11:00 AM to 11:59 AM | 0 (0.0%) | 0 (0.0%) |
| 12:00 PM to 3:59 PM | 23 (13.3%) | 20 (22.5%) |
| 4:00 PM to 11:59 PM | 20 (11.6%) | 1 (1.1%) |
| Total | 173 (100.0%) | 89 (100.0%) |
Housing Occupancy in Fleming Neon
Occupancy by Ownership in Fleming Neon
Of the total 305 dwellings in Fleming Neon, owner-occupied units account for 272 (89.2%), while renter-occupied units make up 33 (10.8%).
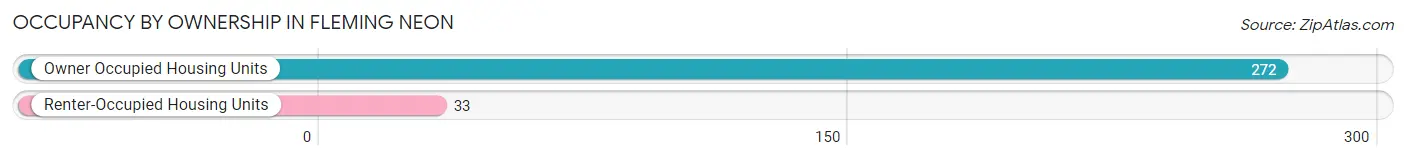
| Occupancy | # Housing Units | % Housing Units |
| Owner Occupied Housing Units | 272 | 89.2% |
| Renter-Occupied Housing Units | 33 | 10.8% |
| Total Occupied Housing Units | 305 | 100.0% |
Occupancy by Household Size in Fleming Neon
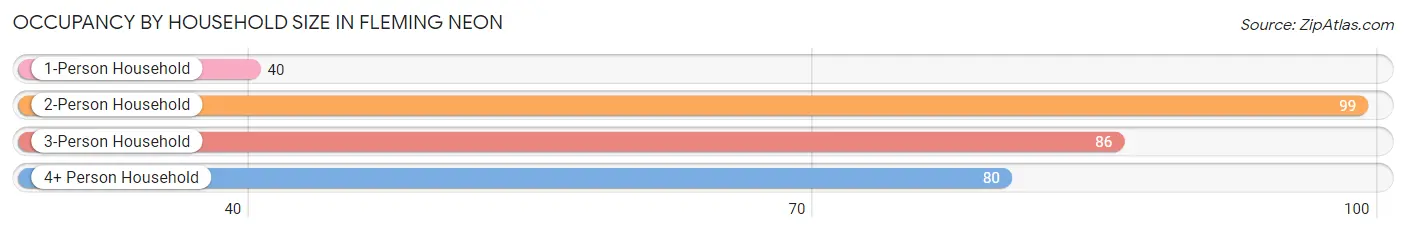
| Household Size | # Housing Units | % Housing Units |
| 1-Person Household | 40 | 13.1% |
| 2-Person Household | 99 | 32.5% |
| 3-Person Household | 86 | 28.2% |
| 4+ Person Household | 80 | 26.2% |
| Total Housing Units | 305 | 100.0% |
Occupancy by Ownership by Household Size in Fleming Neon
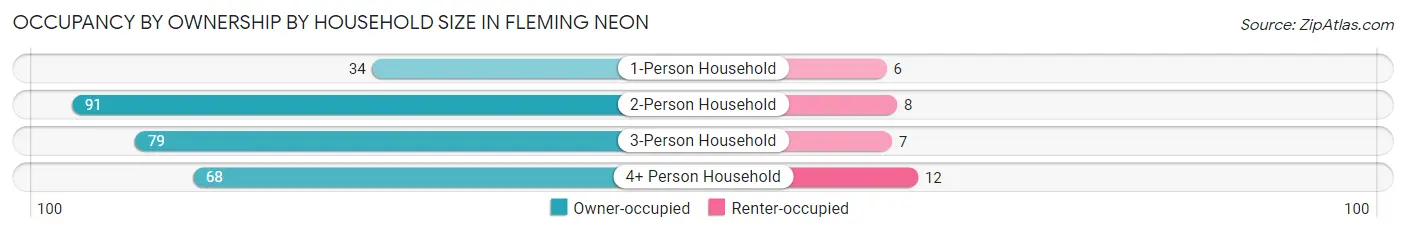
| Household Size | Owner-occupied | Renter-occupied |
| 1-Person Household | 34 (85.0%) | 6 (15.0%) |
| 2-Person Household | 91 (91.9%) | 8 (8.1%) |
| 3-Person Household | 79 (91.9%) | 7 (8.1%) |
| 4+ Person Household | 68 (85.0%) | 12 (15.0%) |
| Total Housing Units | 272 (89.2%) | 33 (10.8%) |
Occupancy by Educational Attainment in Fleming Neon
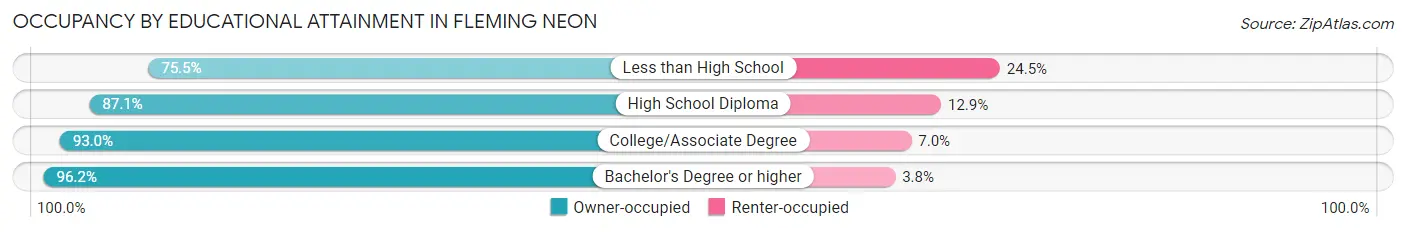
| Household Size | Owner-occupied | Renter-occupied |
| Less than High School | 40 (75.5%) | 13 (24.5%) |
| High School Diploma | 61 (87.1%) | 9 (12.9%) |
| College/Associate Degree | 120 (93.0%) | 9 (7.0%) |
| Bachelor's Degree or higher | 51 (96.2%) | 2 (3.8%) |
Occupancy by Age of Householder in Fleming Neon
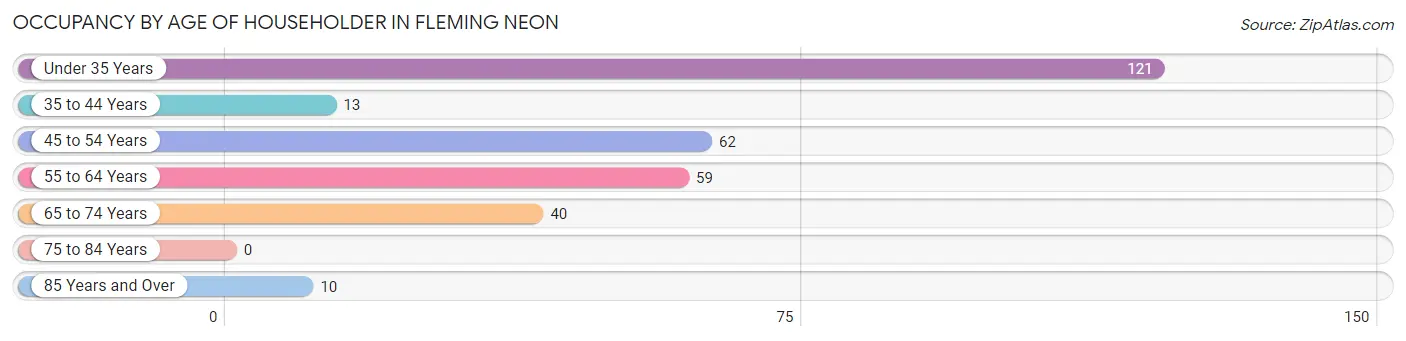
| Age Bracket | # Households | % Households |
| Under 35 Years | 121 | 39.7% |
| 35 to 44 Years | 13 | 4.3% |
| 45 to 54 Years | 62 | 20.3% |
| 55 to 64 Years | 59 | 19.3% |
| 65 to 74 Years | 40 | 13.1% |
| 75 to 84 Years | 0 | 0.0% |
| 85 Years and Over | 10 | 3.3% |
| Total | 305 | 100.0% |
Housing Finances in Fleming Neon
Median Income by Occupancy in Fleming Neon
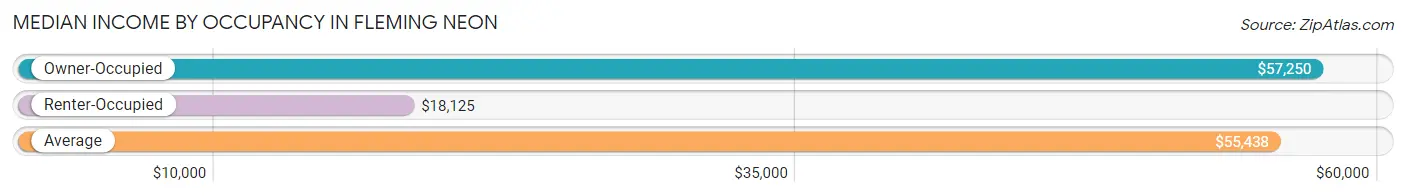
| Occupancy Type | # Households | Median Income |
| Owner-Occupied | 272 (89.2%) | $57,250 |
| Renter-Occupied | 33 (10.8%) | $18,125 |
| Average | 305 (100.0%) | $55,438 |
Occupancy by Householder Income Bracket in Fleming Neon
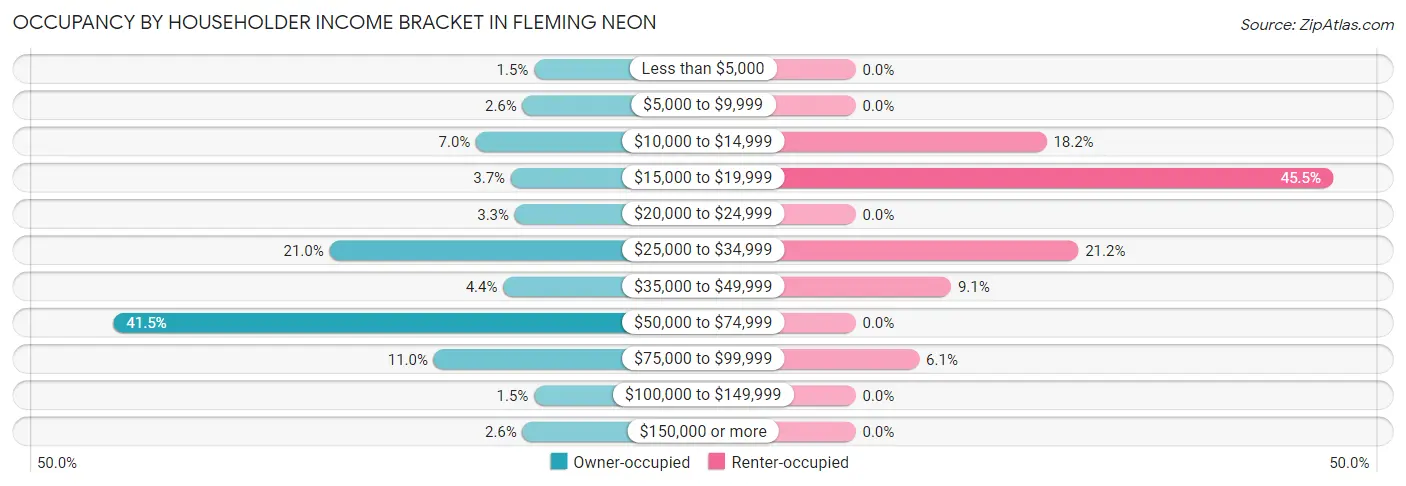
| Income Bracket | Owner-occupied | Renter-occupied |
| Less than $5,000 | 4 (1.5%) | 0 (0.0%) |
| $5,000 to $9,999 | 7 (2.6%) | 0 (0.0%) |
| $10,000 to $14,999 | 19 (7.0%) | 6 (18.2%) |
| $15,000 to $19,999 | 10 (3.7%) | 15 (45.5%) |
| $20,000 to $24,999 | 9 (3.3%) | 0 (0.0%) |
| $25,000 to $34,999 | 57 (21.0%) | 7 (21.2%) |
| $35,000 to $49,999 | 12 (4.4%) | 3 (9.1%) |
| $50,000 to $74,999 | 113 (41.5%) | 0 (0.0%) |
| $75,000 to $99,999 | 30 (11.0%) | 2 (6.1%) |
| $100,000 to $149,999 | 4 (1.5%) | 0 (0.0%) |
| $150,000 or more | 7 (2.6%) | 0 (0.0%) |
| Total | 272 (100.0%) | 33 (100.0%) |
Monthly Housing Cost Tiers in Fleming Neon
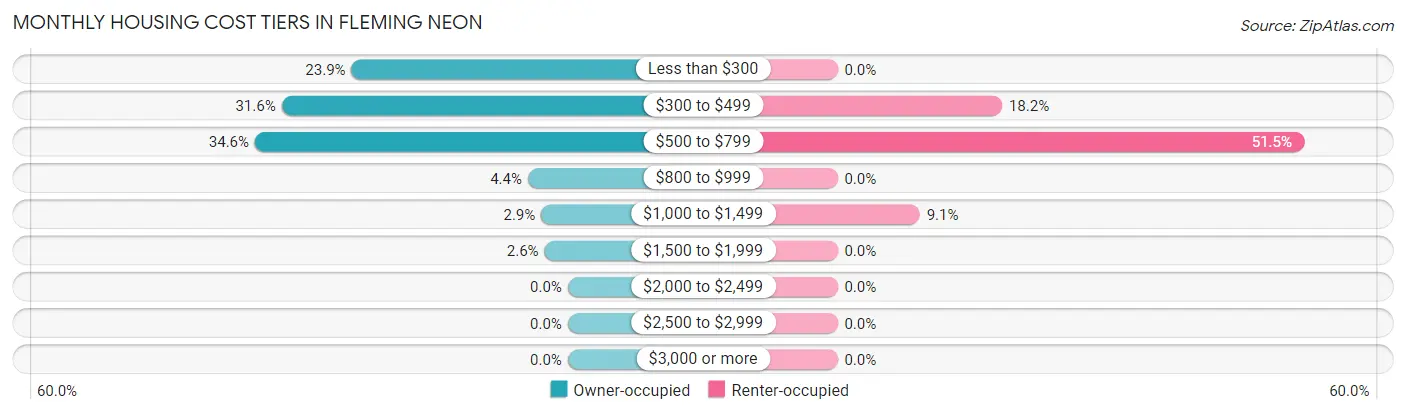
| Monthly Cost | Owner-occupied | Renter-occupied |
| Less than $300 | 65 (23.9%) | 0 (0.0%) |
| $300 to $499 | 86 (31.6%) | 6 (18.2%) |
| $500 to $799 | 94 (34.6%) | 17 (51.5%) |
| $800 to $999 | 12 (4.4%) | 0 (0.0%) |
| $1,000 to $1,499 | 8 (2.9%) | 3 (9.1%) |
| $1,500 to $1,999 | 7 (2.6%) | 0 (0.0%) |
| $2,000 to $2,499 | 0 (0.0%) | 0 (0.0%) |
| $2,500 to $2,999 | 0 (0.0%) | 0 (0.0%) |
| $3,000 or more | 0 (0.0%) | 0 (0.0%) |
| Total | 272 (100.0%) | 33 (100.0%) |
Physical Housing Characteristics in Fleming Neon
Housing Structures in Fleming Neon
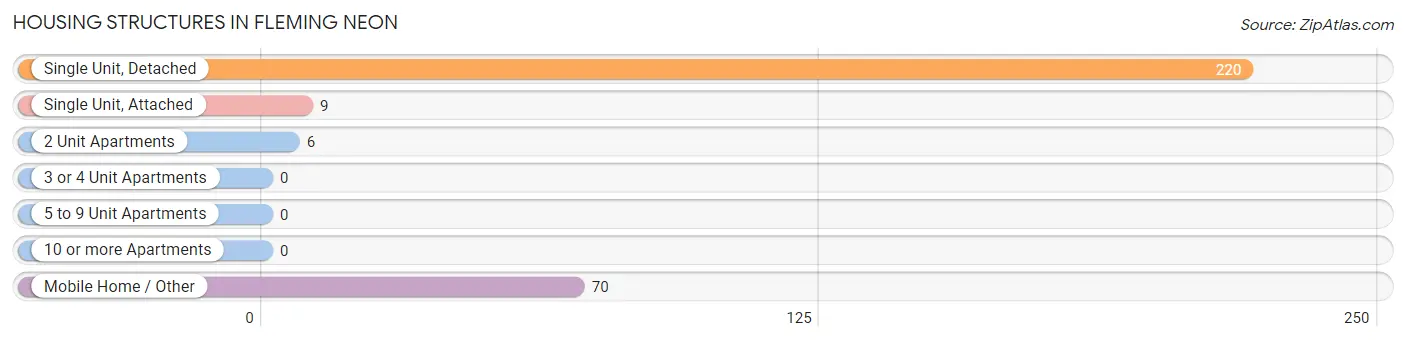
| Structure Type | # Housing Units | % Housing Units |
| Single Unit, Detached | 220 | 72.1% |
| Single Unit, Attached | 9 | 2.9% |
| 2 Unit Apartments | 6 | 2.0% |
| 3 or 4 Unit Apartments | 0 | 0.0% |
| 5 to 9 Unit Apartments | 0 | 0.0% |
| 10 or more Apartments | 0 | 0.0% |
| Mobile Home / Other | 70 | 23.0% |
| Total | 305 | 100.0% |
Housing Structures by Occupancy in Fleming Neon
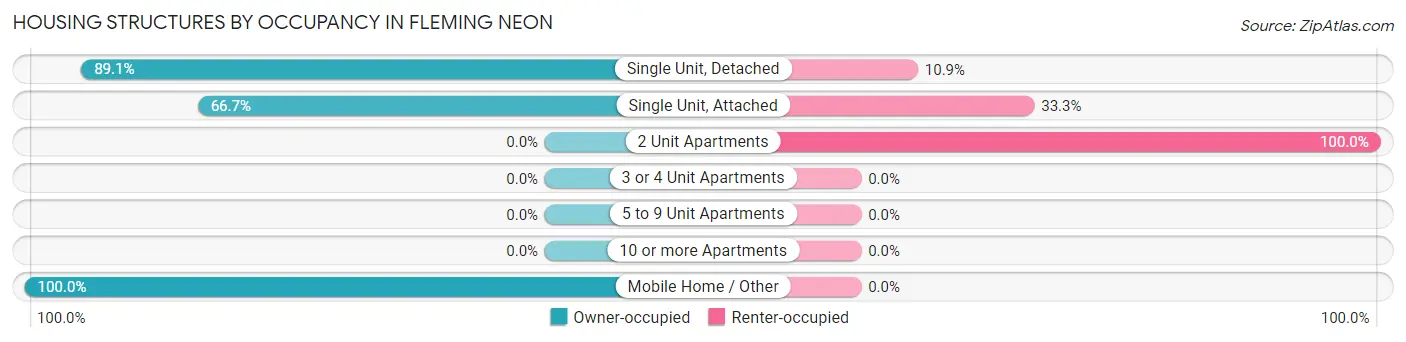
| Structure Type | Owner-occupied | Renter-occupied |
| Single Unit, Detached | 196 (89.1%) | 24 (10.9%) |
| Single Unit, Attached | 6 (66.7%) | 3 (33.3%) |
| 2 Unit Apartments | 0 (0.0%) | 6 (100.0%) |
| 3 or 4 Unit Apartments | 0 (0.0%) | 0 (0.0%) |
| 5 to 9 Unit Apartments | 0 (0.0%) | 0 (0.0%) |
| 10 or more Apartments | 0 (0.0%) | 0 (0.0%) |
| Mobile Home / Other | 70 (100.0%) | 0 (0.0%) |
| Total | 272 (89.2%) | 33 (10.8%) |
Housing Structures by Number of Rooms in Fleming Neon
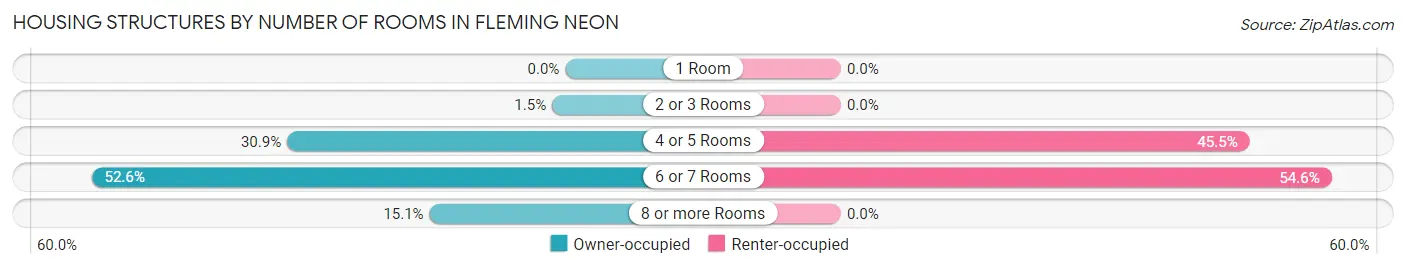
| Number of Rooms | Owner-occupied | Renter-occupied |
| 1 Room | 0 (0.0%) | 0 (0.0%) |
| 2 or 3 Rooms | 4 (1.5%) | 0 (0.0%) |
| 4 or 5 Rooms | 84 (30.9%) | 15 (45.5%) |
| 6 or 7 Rooms | 143 (52.6%) | 18 (54.5%) |
| 8 or more Rooms | 41 (15.1%) | 0 (0.0%) |
| Total | 272 (100.0%) | 33 (100.0%) |
Housing Structure by Heating Type in Fleming Neon
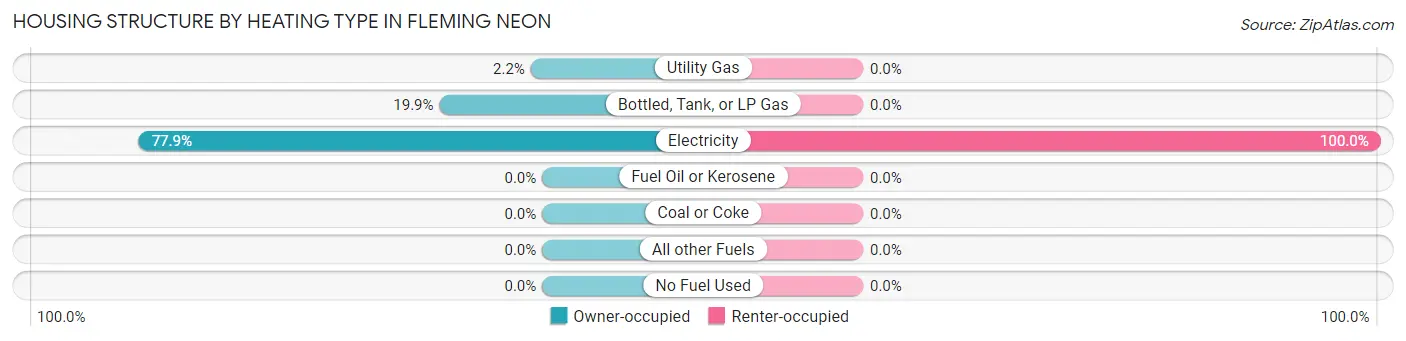
| Heating Type | Owner-occupied | Renter-occupied |
| Utility Gas | 6 (2.2%) | 0 (0.0%) |
| Bottled, Tank, or LP Gas | 54 (19.9%) | 0 (0.0%) |
| Electricity | 212 (77.9%) | 33 (100.0%) |
| Fuel Oil or Kerosene | 0 (0.0%) | 0 (0.0%) |
| Coal or Coke | 0 (0.0%) | 0 (0.0%) |
| All other Fuels | 0 (0.0%) | 0 (0.0%) |
| No Fuel Used | 0 (0.0%) | 0 (0.0%) |
| Total | 272 (100.0%) | 33 (100.0%) |
Household Vehicle Usage in Fleming Neon
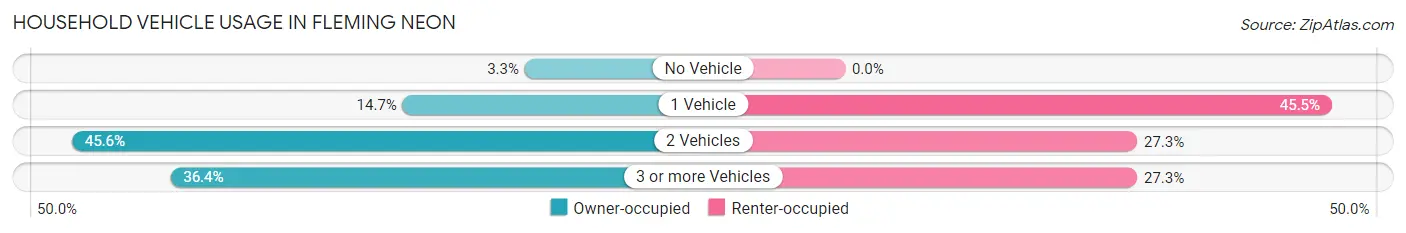
| Vehicles per Household | Owner-occupied | Renter-occupied |
| No Vehicle | 9 (3.3%) | 0 (0.0%) |
| 1 Vehicle | 40 (14.7%) | 15 (45.5%) |
| 2 Vehicles | 124 (45.6%) | 9 (27.3%) |
| 3 or more Vehicles | 99 (36.4%) | 9 (27.3%) |
| Total | 272 (100.0%) | 33 (100.0%) |
Real Estate & Mortgages in Fleming Neon
Real Estate and Mortgage Overview in Fleming Neon
| Characteristic | Without Mortgage | With Mortgage |
| Housing Units | 234 | 38 |
| Median Property Value | $40,400 | $0 |
| Median Household Income | $57,375 | $7 |
| Monthly Housing Costs | $381 | $0 |
| Real Estate Taxes | $397 | $0 |
Property Value by Mortgage Status in Fleming Neon
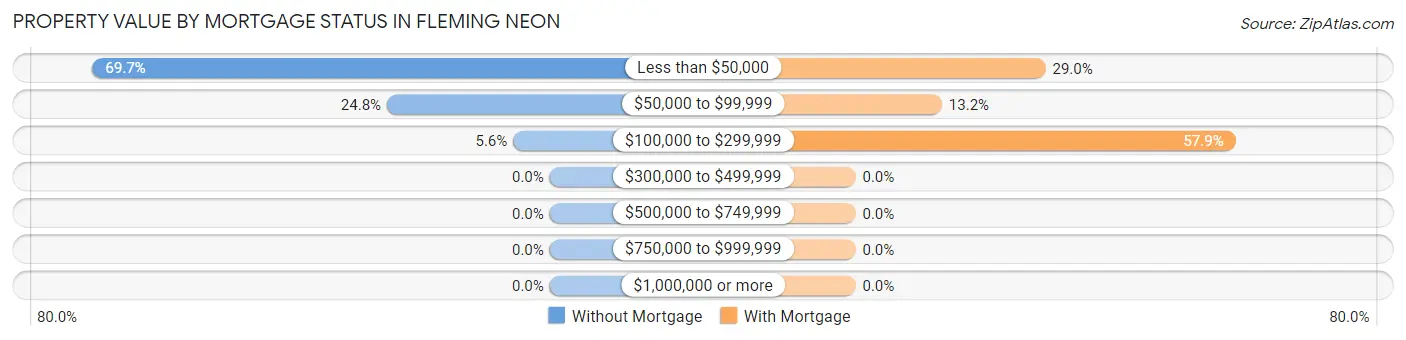
| Property Value | Without Mortgage | With Mortgage |
| Less than $50,000 | 163 (69.7%) | 11 (28.9%) |
| $50,000 to $99,999 | 58 (24.8%) | 5 (13.2%) |
| $100,000 to $299,999 | 13 (5.6%) | 22 (57.9%) |
| $300,000 to $499,999 | 0 (0.0%) | 0 (0.0%) |
| $500,000 to $749,999 | 0 (0.0%) | 0 (0.0%) |
| $750,000 to $999,999 | 0 (0.0%) | 0 (0.0%) |
| $1,000,000 or more | 0 (0.0%) | 0 (0.0%) |
| Total | 234 (100.0%) | 38 (100.0%) |
Household Income by Mortgage Status in Fleming Neon
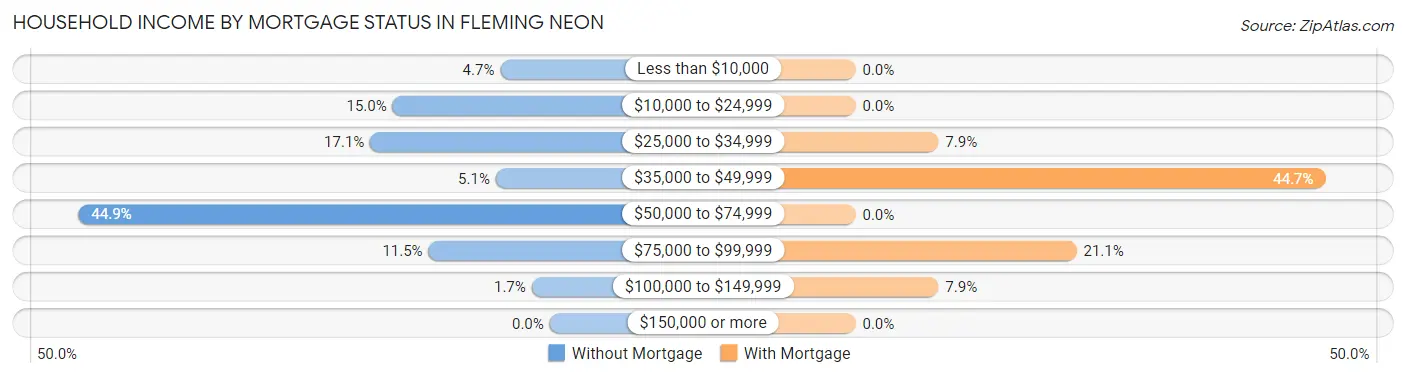
| Household Income | Without Mortgage | With Mortgage |
| Less than $10,000 | 11 (4.7%) | 0 (0.0%) |
| $10,000 to $24,999 | 35 (15.0%) | 0 (0.0%) |
| $25,000 to $34,999 | 40 (17.1%) | 3 (7.9%) |
| $35,000 to $49,999 | 12 (5.1%) | 17 (44.7%) |
| $50,000 to $74,999 | 105 (44.9%) | 0 (0.0%) |
| $75,000 to $99,999 | 27 (11.5%) | 8 (21.0%) |
| $100,000 to $149,999 | 4 (1.7%) | 3 (7.9%) |
| $150,000 or more | 0 (0.0%) | 0 (0.0%) |
| Total | 234 (100.0%) | 38 (100.0%) |
Property Value to Household Income Ratio in Fleming Neon
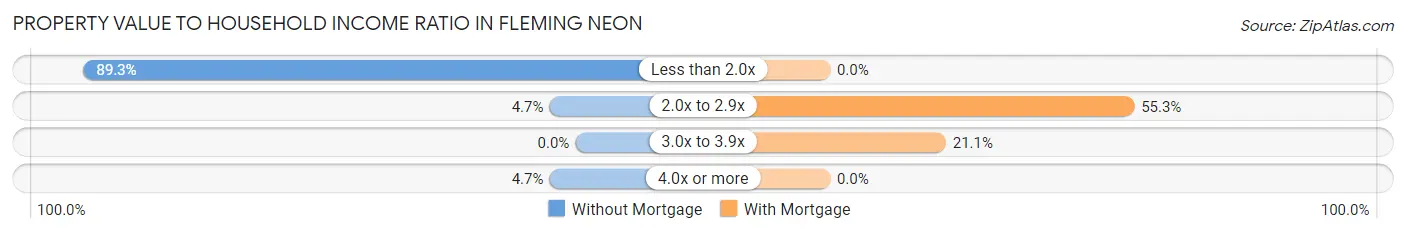
| Value-to-Income Ratio | Without Mortgage | With Mortgage |
| Less than 2.0x | 209 (89.3%) | 0 (0.0%) |
| 2.0x to 2.9x | 11 (4.7%) | 21 (55.3%) |
| 3.0x to 3.9x | 0 (0.0%) | 8 (21.0%) |
| 4.0x or more | 11 (4.7%) | 0 (0.0%) |
| Total | 234 (100.0%) | 38 (100.0%) |
Real Estate Taxes by Mortgage Status in Fleming Neon
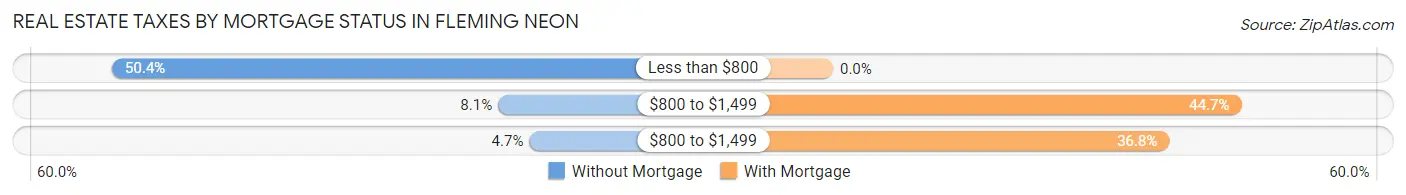
| Property Taxes | Without Mortgage | With Mortgage |
| Less than $800 | 118 (50.4%) | 0 (0.0%) |
| $800 to $1,499 | 19 (8.1%) | 17 (44.7%) |
| $800 to $1,499 | 11 (4.7%) | 14 (36.8%) |
| Total | 234 (100.0%) | 38 (100.0%) |
Health & Disability in Fleming Neon
Health Insurance Coverage by Age in Fleming Neon
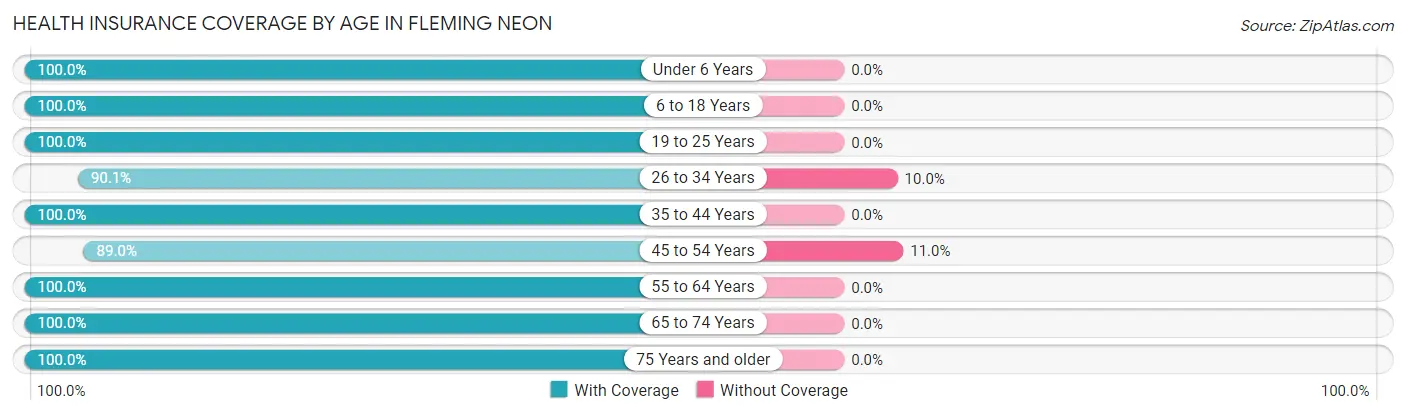
| Age Bracket | With Coverage | Without Coverage |
| Under 6 Years | 130 (100.0%) | 0 (0.0%) |
| 6 to 18 Years | 97 (100.0%) | 0 (0.0%) |
| 19 to 25 Years | 41 (100.0%) | 0 (0.0%) |
| 26 to 34 Years | 172 (90.0%) | 19 (10.0%) |
| 35 to 44 Years | 78 (100.0%) | 0 (0.0%) |
| 45 to 54 Years | 97 (89.0%) | 12 (11.0%) |
| 55 to 64 Years | 94 (100.0%) | 0 (0.0%) |
| 65 to 74 Years | 50 (100.0%) | 0 (0.0%) |
| 75 Years and older | 72 (100.0%) | 0 (0.0%) |
| Total | 831 (96.4%) | 31 (3.6%) |
Health Insurance Coverage by Citizenship Status in Fleming Neon
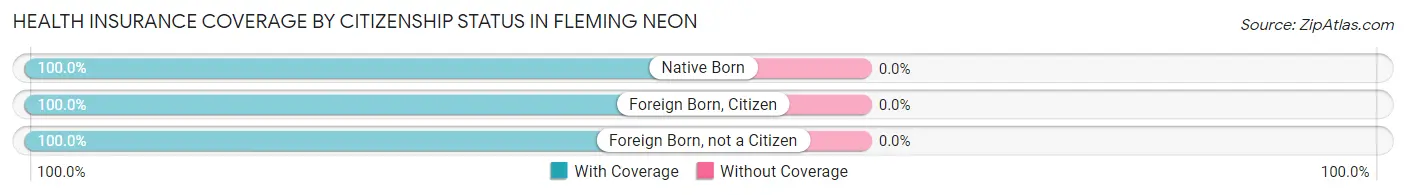
| Citizenship Status | With Coverage | Without Coverage |
| Native Born | 130 (100.0%) | 0 (0.0%) |
| Foreign Born, Citizen | 97 (100.0%) | 0 (0.0%) |
| Foreign Born, not a Citizen | 41 (100.0%) | 0 (0.0%) |
Health Insurance Coverage by Household Income in Fleming Neon
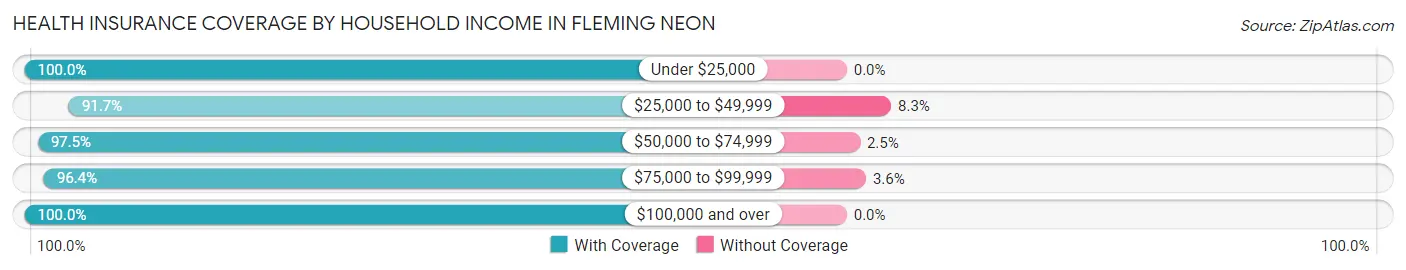
| Household Income | With Coverage | Without Coverage |
| Under $25,000 | 143 (100.0%) | 0 (0.0%) |
| $25,000 to $49,999 | 210 (91.7%) | 19 (8.3%) |
| $50,000 to $74,999 | 317 (97.5%) | 8 (2.5%) |
| $75,000 to $99,999 | 107 (96.4%) | 4 (3.6%) |
| $100,000 and over | 54 (100.0%) | 0 (0.0%) |
Public vs Private Health Insurance Coverage by Age in Fleming Neon
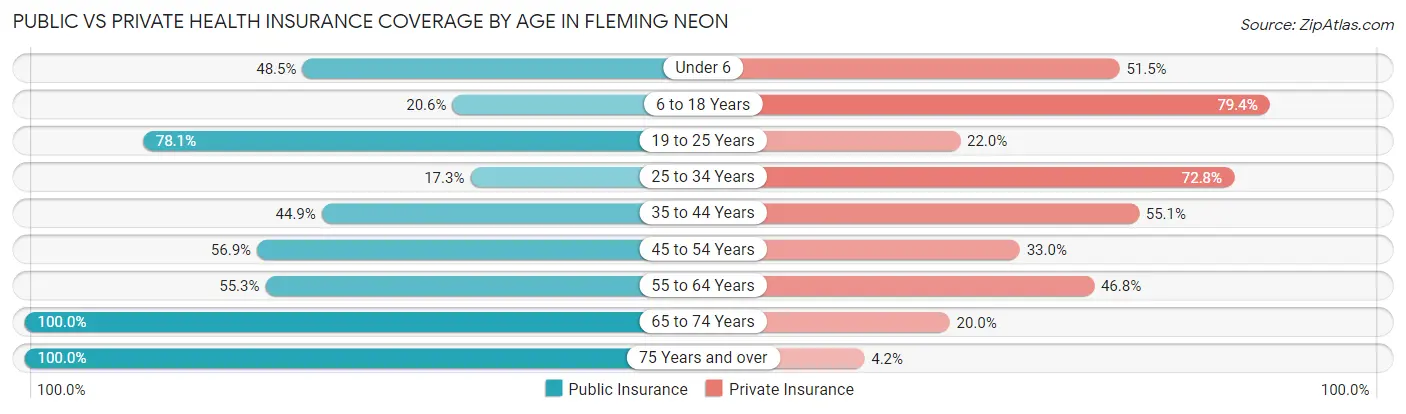
| Age Bracket | Public Insurance | Private Insurance |
| Under 6 | 63 (48.5%) | 67 (51.5%) |
| 6 to 18 Years | 20 (20.6%) | 77 (79.4%) |
| 19 to 25 Years | 32 (78.0%) | 9 (22.0%) |
| 25 to 34 Years | 33 (17.3%) | 139 (72.8%) |
| 35 to 44 Years | 35 (44.9%) | 43 (55.1%) |
| 45 to 54 Years | 62 (56.9%) | 36 (33.0%) |
| 55 to 64 Years | 52 (55.3%) | 44 (46.8%) |
| 65 to 74 Years | 50 (100.0%) | 10 (20.0%) |
| 75 Years and over | 72 (100.0%) | 3 (4.2%) |
| Total | 419 (48.6%) | 428 (49.6%) |
Disability Status by Sex by Age in Fleming Neon
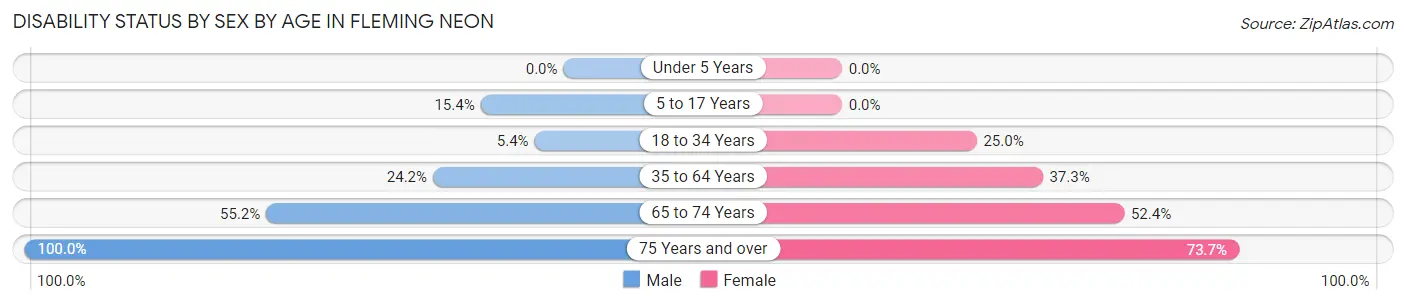
| Age Bracket | Male | Female |
| Under 5 Years | 0 (0.0%) | 0 (0.0%) |
| 5 to 17 Years | 10 (15.4%) | 0 (0.0%) |
| 18 to 34 Years | 8 (5.4%) | 22 (25.0%) |
| 35 to 64 Years | 31 (24.2%) | 57 (37.2%) |
| 65 to 74 Years | 16 (55.2%) | 11 (52.4%) |
| 75 Years and over | 53 (100.0%) | 14 (73.7%) |
Disability Class by Sex by Age in Fleming Neon
Disability Class: Hearing Difficulty
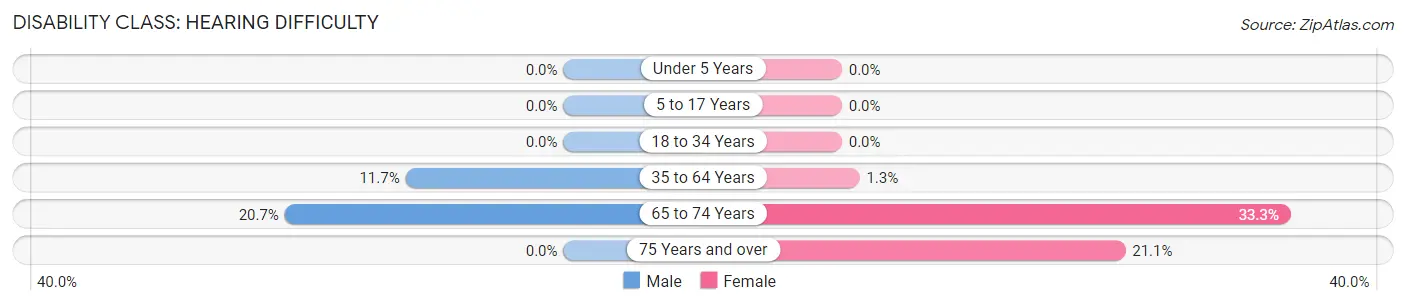
| Age Bracket | Male | Female |
| Under 5 Years | 0 (0.0%) | 0 (0.0%) |
| 5 to 17 Years | 0 (0.0%) | 0 (0.0%) |
| 18 to 34 Years | 0 (0.0%) | 0 (0.0%) |
| 35 to 64 Years | 15 (11.7%) | 2 (1.3%) |
| 65 to 74 Years | 6 (20.7%) | 7 (33.3%) |
| 75 Years and over | 0 (0.0%) | 4 (21.0%) |
Disability Class: Vision Difficulty
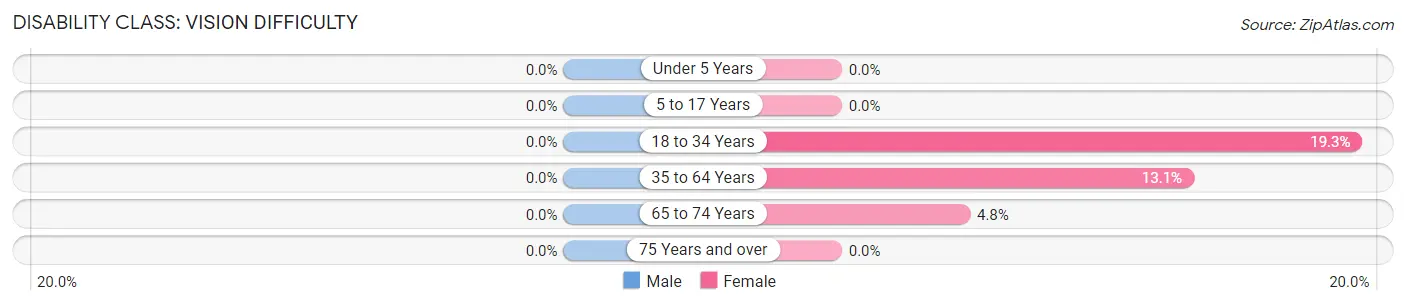
| Age Bracket | Male | Female |
| Under 5 Years | 0 (0.0%) | 0 (0.0%) |
| 5 to 17 Years | 0 (0.0%) | 0 (0.0%) |
| 18 to 34 Years | 0 (0.0%) | 17 (19.3%) |
| 35 to 64 Years | 0 (0.0%) | 20 (13.1%) |
| 65 to 74 Years | 0 (0.0%) | 1 (4.8%) |
| 75 Years and over | 0 (0.0%) | 0 (0.0%) |
Disability Class: Cognitive Difficulty
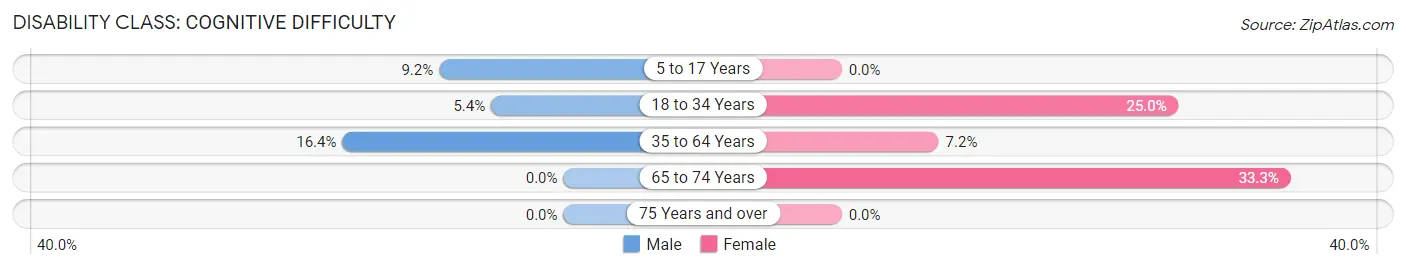
| Age Bracket | Male | Female |
| 5 to 17 Years | 6 (9.2%) | 0 (0.0%) |
| 18 to 34 Years | 8 (5.4%) | 22 (25.0%) |
| 35 to 64 Years | 21 (16.4%) | 11 (7.2%) |
| 65 to 74 Years | 0 (0.0%) | 7 (33.3%) |
| 75 Years and over | 0 (0.0%) | 0 (0.0%) |
Disability Class: Ambulatory Difficulty
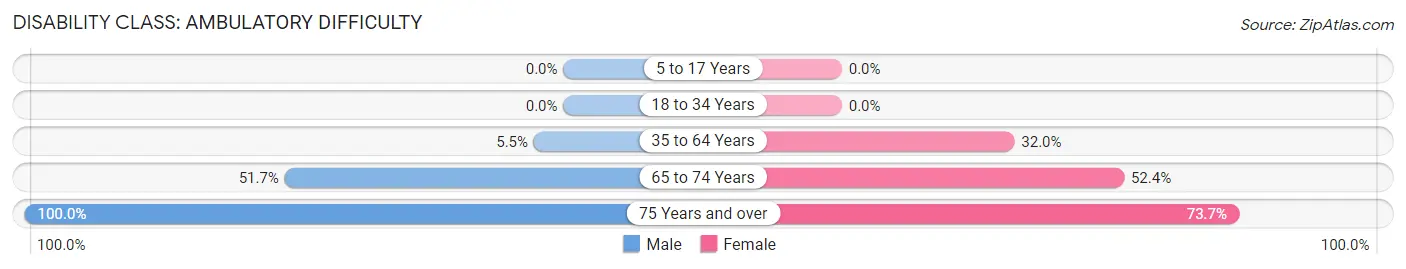
| Age Bracket | Male | Female |
| 5 to 17 Years | 0 (0.0%) | 0 (0.0%) |
| 18 to 34 Years | 0 (0.0%) | 0 (0.0%) |
| 35 to 64 Years | 7 (5.5%) | 49 (32.0%) |
| 65 to 74 Years | 15 (51.7%) | 11 (52.4%) |
| 75 Years and over | 53 (100.0%) | 14 (73.7%) |
Disability Class: Self-Care Difficulty
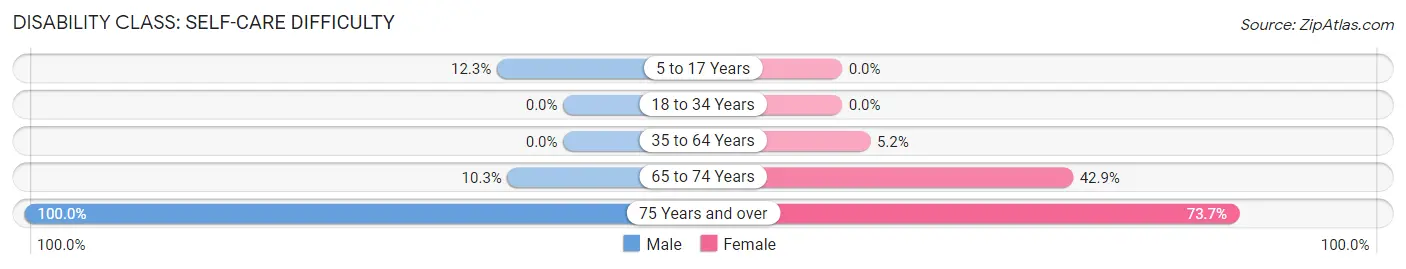
| Age Bracket | Male | Female |
| 5 to 17 Years | 8 (12.3%) | 0 (0.0%) |
| 18 to 34 Years | 0 (0.0%) | 0 (0.0%) |
| 35 to 64 Years | 0 (0.0%) | 8 (5.2%) |
| 65 to 74 Years | 3 (10.3%) | 9 (42.9%) |
| 75 Years and over | 53 (100.0%) | 14 (73.7%) |
Technology Access in Fleming Neon
Computing Device Access in Fleming Neon
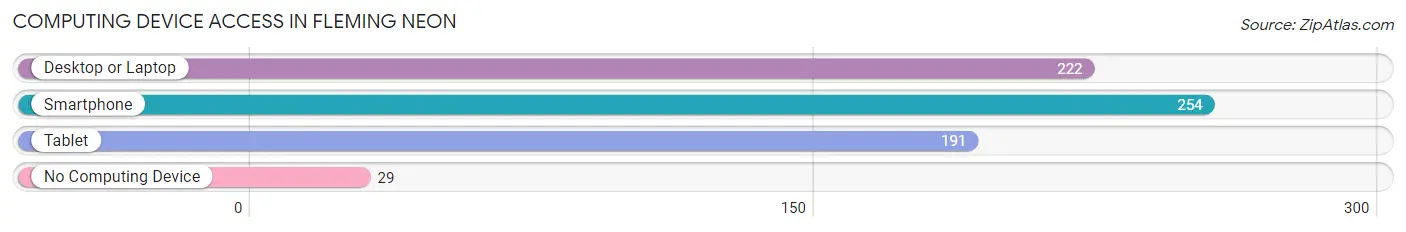
| Device Type | # Households | % Households |
| Desktop or Laptop | 222 | 72.8% |
| Smartphone | 254 | 83.3% |
| Tablet | 191 | 62.6% |
| No Computing Device | 29 | 9.5% |
| Total | 305 | 100.0% |
Internet Access in Fleming Neon
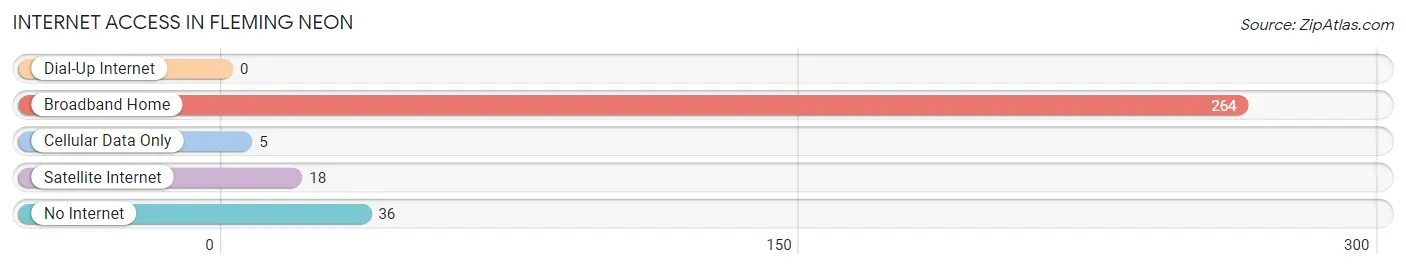
| Internet Type | # Households | % Households |
| Dial-Up Internet | 0 | 0.0% |
| Broadband Home | 264 | 86.6% |
| Cellular Data Only | 5 | 1.6% |
| Satellite Internet | 18 | 5.9% |
| No Internet | 36 | 11.8% |
| Total | 305 | 100.0% |
Fleming Neon Summary
Fleming Neon is a small unincorporated community located in the eastern part of Letcher County, Kentucky. It is situated in the Appalachian Mountains, near the Virginia border. The population of Fleming Neon was estimated to be around 500 people in 2000.
History
The area that is now Fleming Neon was first settled in the late 1700s by a group of settlers from Virginia. The town was originally known as “Neon”, after the nearby creek. In 1883, the town was renamed “Fleming Neon” in honor of the Fleming family, who had been living in the area since the early 1800s.
The town was a small farming community until the early 1900s, when coal mining began to take off in the area. The coal industry brought a large influx of people to the area, and the population of Fleming Neon grew rapidly. By the mid-1900s, the town had become a bustling coal mining town, with a population of over 1,000 people.
Geography
Fleming Neon is located in the Appalachian Mountains, near the Virginia border. The town is situated in a valley, surrounded by hills and mountains. The town is located at an elevation of 1,800 feet above sea level. The climate in the area is temperate, with mild winters and hot summers.
Economy
The economy of Fleming Neon is largely based on coal mining. The town is home to several coal mines, which provide jobs for many of the town’s residents. In addition to coal mining, the town also has a few small businesses, such as restaurants, stores, and gas stations.
Demographics
The population of Fleming Neon was estimated to be around 500 people in 2000. The town is predominantly white, with a small African American population. The median household income in the town is around $25,000, and the median age is around 40 years old.
Conclusion
Fleming Neon is a small unincorporated community located in the eastern part of Letcher County, Kentucky. It is situated in the Appalachian Mountains, near the Virginia border. The town was originally settled in the late 1700s, and was a small farming community until the early 1900s, when coal mining began to take off in the area. The population of Fleming Neon was estimated to be around 500 people in 2000. The economy of the town is largely based on coal mining, and the town also has a few small businesses. The town is predominantly white, with a small African American population.
Common Questions
What is Per Capita Income in Fleming Neon?
Per Capita income in Fleming Neon is $19,306.
What is the Median Family Income in Fleming Neon?
Median Family Income in Fleming Neon is $55,625.
What is the Median Household income in Fleming Neon?
Median Household Income in Fleming Neon is $55,438.
What is Income or Wage Gap in Fleming Neon?
Income or Wage Gap in Fleming Neon is 23.6%.
Women in Fleming Neon earn 76.4 cents for every dollar earned by a man.
What is Family Income Deficit in Fleming Neon?
Family Income Deficit in Fleming Neon is $6,770.
Families that are below poverty line in Fleming Neon earn $6,770 less on average than the poverty threshold level.
What is Inequality or Gini Index in Fleming Neon?
Inequality or Gini Index in Fleming Neon is 0.39.
What is the Total Population of Fleming Neon?
Total Population of Fleming Neon is 862.
What is the Total Male Population of Fleming Neon?
Total Male Population of Fleming Neon is 480.
What is the Total Female Population of Fleming Neon?
Total Female Population of Fleming Neon is 382.
What is the Ratio of Males per 100 Females in Fleming Neon?
There are 125.65 Males per 100 Females in Fleming Neon.
What is the Ratio of Females per 100 Males in Fleming Neon?
There are 79.58 Females per 100 Males in Fleming Neon.
What is the Median Population Age in Fleming Neon?
Median Population Age in Fleming Neon is 33.2 Years.
What is the Average Family Size in Fleming Neon
Average Family Size in Fleming Neon is 3.1 People.
What is the Average Household Size in Fleming Neon
Average Household Size in Fleming Neon is 2.8 People.
How Large is the Labor Force in Fleming Neon?
There are 307 People in the Labor Forcein in Fleming Neon.
What is the Percentage of People in the Labor Force in Fleming Neon?
48.0% of People are in the Labor Force in Fleming Neon.