Beaverdale, IA Map & Demographics
Beaverdale Map
Beaverdale Overview
$43,555
PER CAPITA INCOME
$76,894
AVG FAMILY INCOME
$67,188
AVG HOUSEHOLD INCOME
23.2%
WAGE / INCOME GAP [ % ]
76.8¢/ $1
WAGE / INCOME GAP [ $ ]
0.38
INEQUALITY / GINI INDEX
714
TOTAL POPULATION
301
MALE POPULATION
413
FEMALE POPULATION
72.88
MALES / 100 FEMALES
137.21
FEMALES / 100 MALES
56.6
MEDIAN AGE
2.7
AVG FAMILY SIZE
2.2
AVG HOUSEHOLD SIZE
327
LABOR FORCE [ PEOPLE ]
54.2%
PERCENT IN LABOR FORCE
4.3%
UNEMPLOYMENT RATE
Beaverdale Area Codes
Income in Beaverdale
Income Overview in Beaverdale
Per Capita Income in Beaverdale is $43,555, while median incomes of families and households are $76,894 and $67,188 respectively.
| Characteristic | Number | Measure |
| Per Capita Income | 714 | $43,555 |
| Median Family Income | 204 | $76,894 |
| Mean Family Income | 204 | $106,218 |
| Median Household Income | 328 | $67,188 |
| Mean Household Income | 328 | $93,385 |
| Income Deficit | 204 | $0 |
| Wage / Income Gap (%) | 714 | 23.22% |
| Wage / Income Gap ($) | 714 | 76.78¢ per $1 |
| Gini / Inequality Index | 714 | 0.38 |
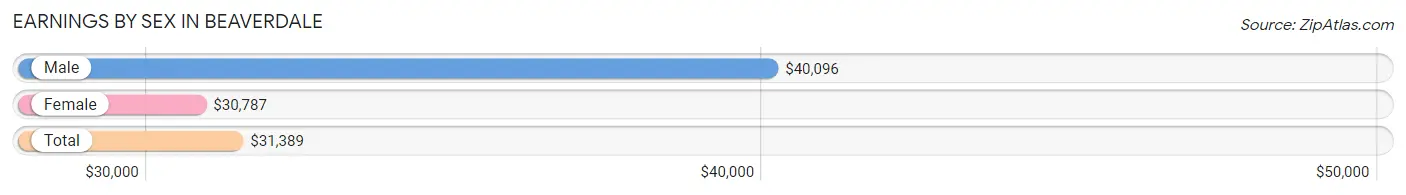
Earnings by Sex in Beaverdale
Average Earnings in Beaverdale are $31,389, $40,096 for men and $30,787 for women, a difference of 23.2%.
| Sex | Number | Average Earnings |
| Male | 133 (39.4%) | $40,096 |
| Female | 205 (60.7%) | $30,787 |
| Total | 338 (100.0%) | $31,389 |
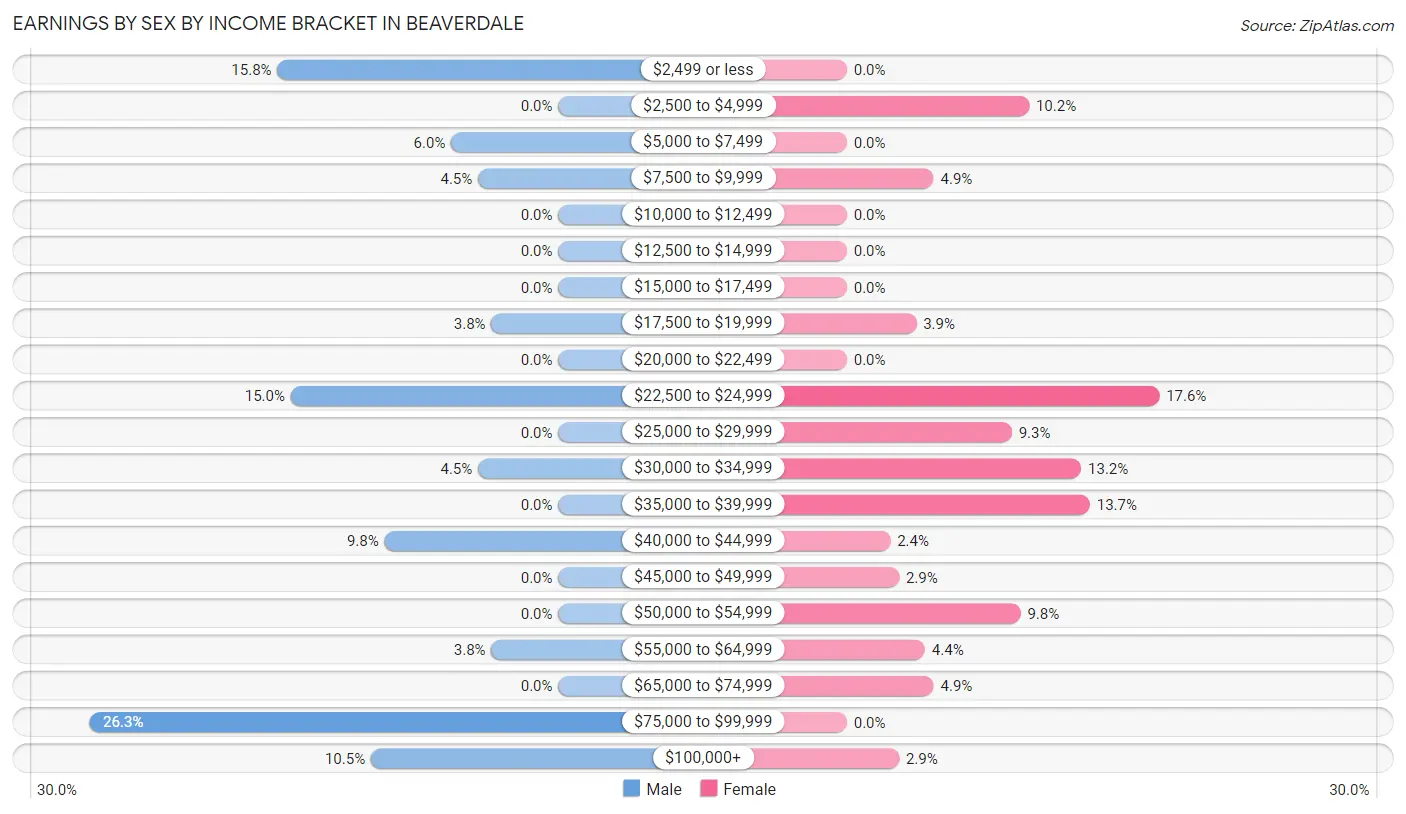
Earnings by Sex by Income Bracket in Beaverdale
The most common earnings brackets in Beaverdale are $75,000 to $99,999 for men (35 | 26.3%) and $22,500 to $24,999 for women (36 | 17.6%).
| Income | Male | Female |
| $2,499 or less | 21 (15.8%) | 0 (0.0%) |
| $2,500 to $4,999 | 0 (0.0%) | 21 (10.2%) |
| $5,000 to $7,499 | 8 (6.0%) | 0 (0.0%) |
| $7,500 to $9,999 | 6 (4.5%) | 10 (4.9%) |
| $10,000 to $12,499 | 0 (0.0%) | 0 (0.0%) |
| $12,500 to $14,999 | 0 (0.0%) | 0 (0.0%) |
| $15,000 to $17,499 | 0 (0.0%) | 0 (0.0%) |
| $17,500 to $19,999 | 5 (3.8%) | 8 (3.9%) |
| $20,000 to $22,499 | 0 (0.0%) | 0 (0.0%) |
| $22,500 to $24,999 | 20 (15.0%) | 36 (17.6%) |
| $25,000 to $29,999 | 0 (0.0%) | 19 (9.3%) |
| $30,000 to $34,999 | 6 (4.5%) | 27 (13.2%) |
| $35,000 to $39,999 | 0 (0.0%) | 28 (13.7%) |
| $40,000 to $44,999 | 13 (9.8%) | 5 (2.4%) |
| $45,000 to $49,999 | 0 (0.0%) | 6 (2.9%) |
| $50,000 to $54,999 | 0 (0.0%) | 20 (9.8%) |
| $55,000 to $64,999 | 5 (3.8%) | 9 (4.4%) |
| $65,000 to $74,999 | 0 (0.0%) | 10 (4.9%) |
| $75,000 to $99,999 | 35 (26.3%) | 0 (0.0%) |
| $100,000+ | 14 (10.5%) | 6 (2.9%) |
| Total | 133 (100.0%) | 205 (100.0%) |
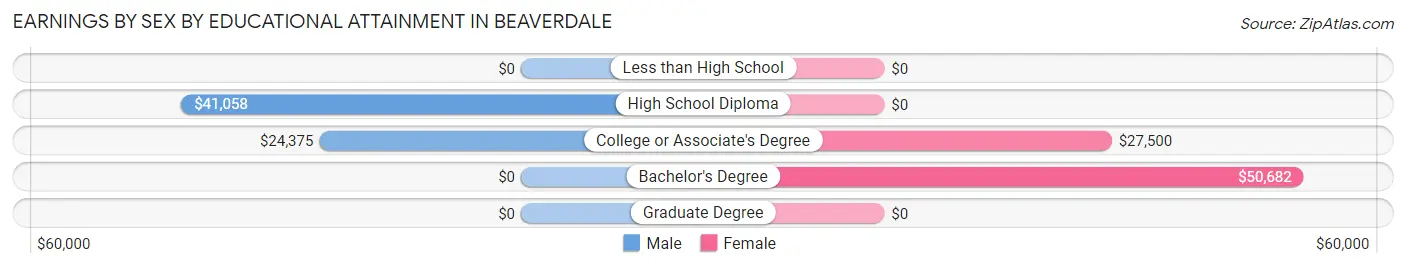
Earnings by Sex by Educational Attainment in Beaverdale
Average earnings in Beaverdale are $59,500 for men and $31,759 for women, a difference of 46.6%. Men with an educational attainment of high school diploma enjoy the highest average annual earnings of $41,058, while those with college or associate's degree education earn the least with $24,375. Women with an educational attainment of bachelor's degree earn the most with the average annual earnings of $50,682, while those with college or associate's degree education have the smallest earnings of $27,500.
| Educational Attainment | Male Income | Female Income |
| Less than High School | - | - |
| High School Diploma | $41,058 | $0 |
| College or Associate's Degree | $24,375 | $27,500 |
| Bachelor's Degree | - | - |
| Graduate Degree | - | - |
| Total | $59,500 | $31,759 |
Family Income in Beaverdale
Family Income Brackets in Beaverdale
According to the Beaverdale family income data, there are 58 families falling into the $75,000 to $99,999 income range, which is the most common income bracket and makes up 28.4% of all families.
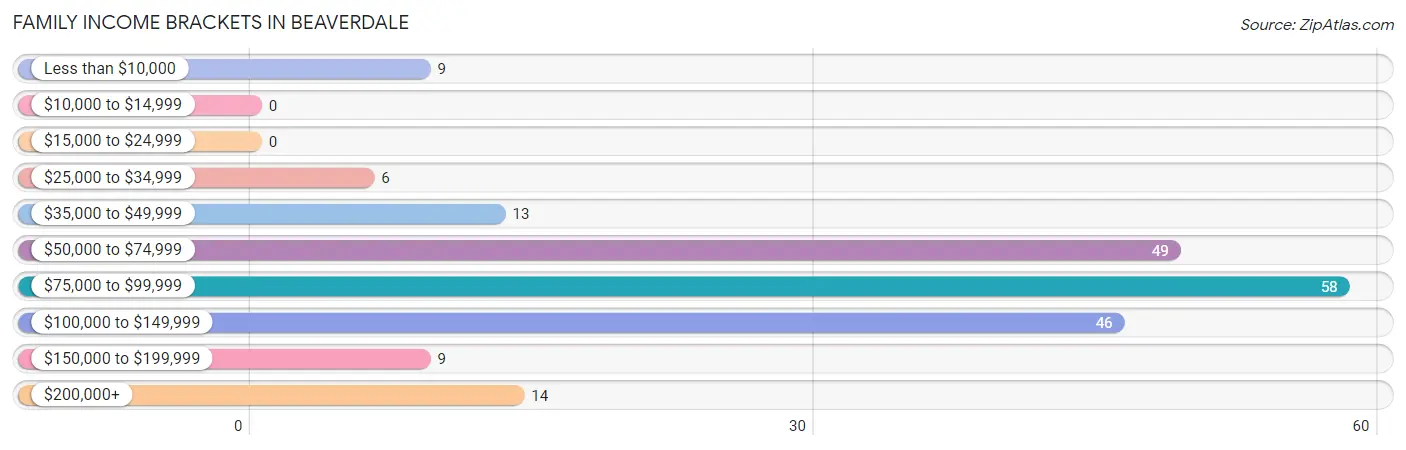
| Income Bracket | # Families | % Families |
| Less than $10,000 | 9 | 4.4% |
| $10,000 to $14,999 | 0 | 0.0% |
| $15,000 to $24,999 | 0 | 0.0% |
| $25,000 to $34,999 | 6 | 2.9% |
| $35,000 to $49,999 | 13 | 6.4% |
| $50,000 to $74,999 | 49 | 24.0% |
| $75,000 to $99,999 | 58 | 28.4% |
| $100,000 to $149,999 | 46 | 22.5% |
| $150,000 to $199,999 | 9 | 4.4% |
| $200,000+ | 14 | 6.9% |
Family Income by Famaliy Size in Beaverdale
4-person families (43 | 21.1%) account for the highest median family income in Beaverdale with $108,155 per family, while 2-person families (152 | 74.5%) have the highest median income of $38,106 per family member.
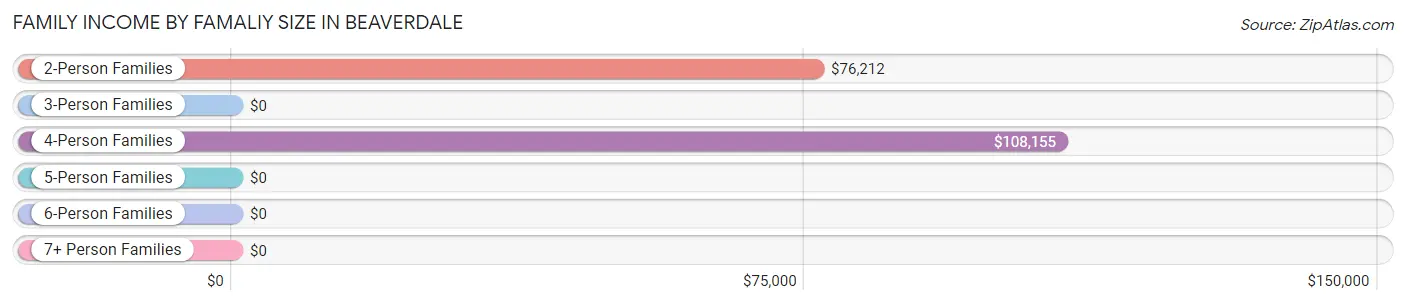
| Income Bracket | # Families | Median Income |
| 2-Person Families | 152 (74.5%) | $76,212 |
| 3-Person Families | 9 (4.4%) | $0 |
| 4-Person Families | 43 (21.1%) | $108,155 |
| 5-Person Families | 0 (0.0%) | $0 |
| 6-Person Families | 0 (0.0%) | $0 |
| 7+ Person Families | 0 (0.0%) | $0 |
| Total | 204 (100.0%) | $76,894 |
Family Income by Number of Earners in Beaverdale
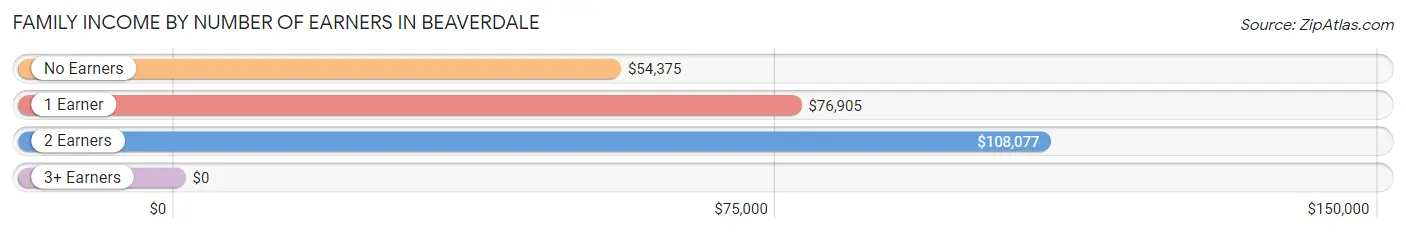
| Number of Earners | # Families | Median Income |
| No Earners | 62 (30.4%) | $54,375 |
| 1 Earner | 88 (43.1%) | $76,905 |
| 2 Earners | 40 (19.6%) | $108,077 |
| 3+ Earners | 14 (6.9%) | $0 |
| Total | 204 (100.0%) | $76,894 |
Household Income in Beaverdale
Household Income Brackets in Beaverdale
With 93 households falling in the category, the $50,000 to $74,999 income range is the most frequent in Beaverdale, accounting for 28.3% of all households.
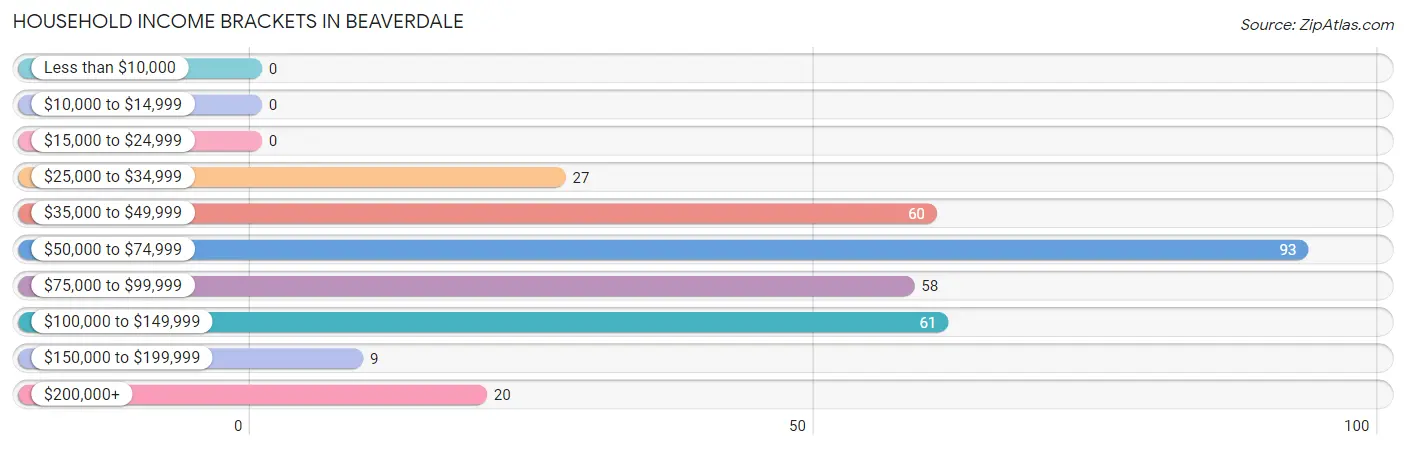
| Income Bracket | # Households | % Households |
| Less than $10,000 | 0 | 0.0% |
| $10,000 to $14,999 | 0 | 0.0% |
| $15,000 to $24,999 | 0 | 0.0% |
| $25,000 to $34,999 | 27 | 8.2% |
| $35,000 to $49,999 | 60 | 18.3% |
| $50,000 to $74,999 | 93 | 28.4% |
| $75,000 to $99,999 | 58 | 17.7% |
| $100,000 to $149,999 | 61 | 18.6% |
| $150,000 to $199,999 | 9 | 2.7% |
| $200,000+ | 20 | 6.1% |
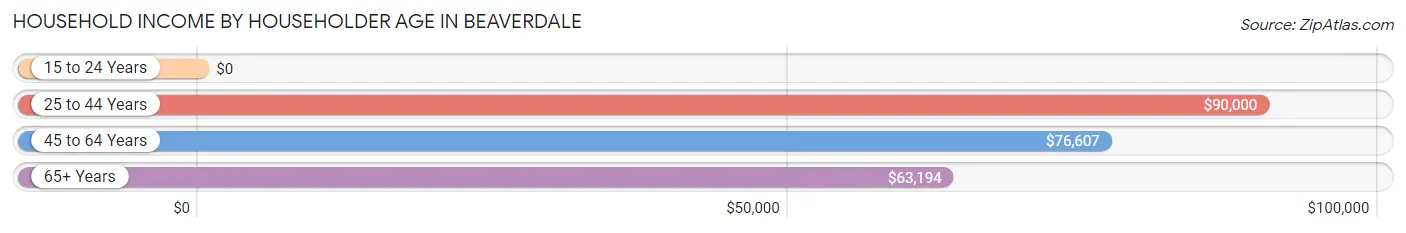
Household Income by Householder Age in Beaverdale
The median household income in Beaverdale is $67,188, with the highest median household income of $90,000 found in the 25 to 44 years age bracket for the primary householder. A total of 78 households (23.8%) fall into this category. Meanwhile, the 15 to 24 years age bracket for the primary householder has the lowest median household income of $0, with 9 households (2.7%) in this group.
| Income Bracket | # Households | Median Income |
| 15 to 24 Years | 9 (2.7%) | $0 |
| 25 to 44 Years | 78 (23.8%) | $90,000 |
| 45 to 64 Years | 97 (29.6%) | $76,607 |
| 65+ Years | 144 (43.9%) | $63,194 |
| Total | 328 (100.0%) | $67,188 |
Poverty in Beaverdale
Income Below Poverty by Sex and Age in Beaverdale
With 8.3% poverty level for males and 3.6% for females among the residents of Beaverdale, 18 to 24 year old males and under 5 year old females are the most vulnerable to poverty, with 15 males (71.4%) and 15 females (100.0%) in their respective age groups living below the poverty level.
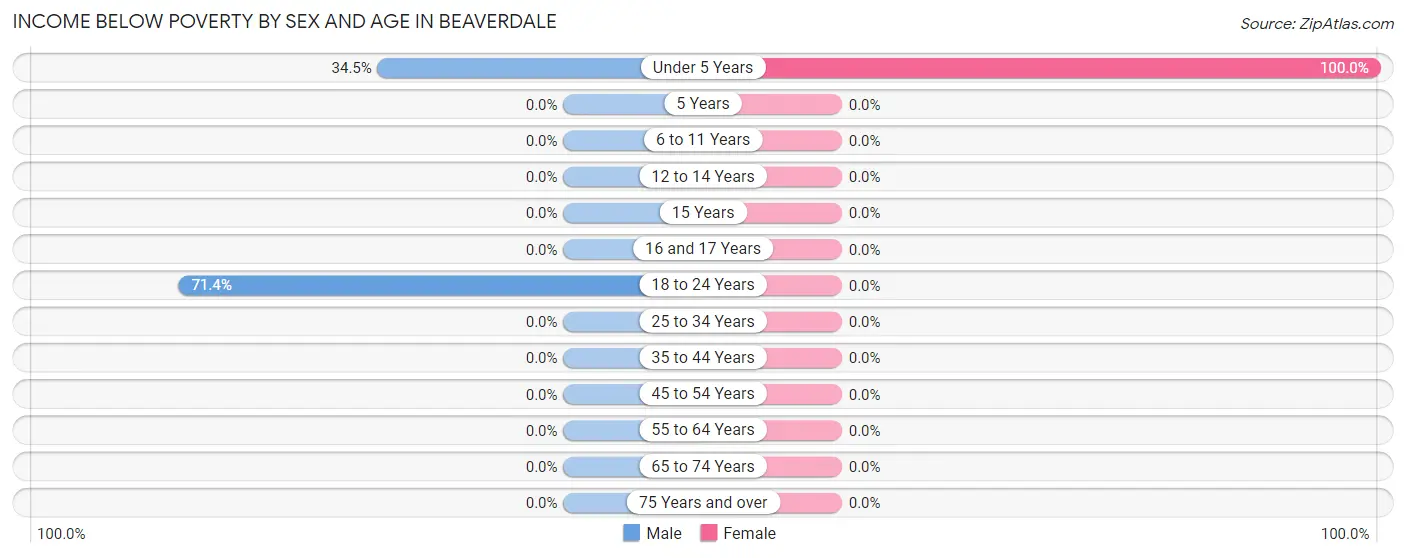
| Age Bracket | Male | Female |
| Under 5 Years | 10 (34.5%) | 15 (100.0%) |
| 5 Years | 0 (0.0%) | 0 (0.0%) |
| 6 to 11 Years | 0 (0.0%) | 0 (0.0%) |
| 12 to 14 Years | 0 (0.0%) | 0 (0.0%) |
| 15 Years | 0 (0.0%) | 0 (0.0%) |
| 16 and 17 Years | 0 (0.0%) | 0 (0.0%) |
| 18 to 24 Years | 15 (71.4%) | 0 (0.0%) |
| 25 to 34 Years | 0 (0.0%) | 0 (0.0%) |
| 35 to 44 Years | 0 (0.0%) | 0 (0.0%) |
| 45 to 54 Years | 0 (0.0%) | 0 (0.0%) |
| 55 to 64 Years | 0 (0.0%) | 0 (0.0%) |
| 65 to 74 Years | 0 (0.0%) | 0 (0.0%) |
| 75 Years and over | 0 (0.0%) | 0 (0.0%) |
| Total | 25 (8.3%) | 15 (3.6%) |
Income Above Poverty by Sex and Age in Beaverdale
According to the poverty statistics in Beaverdale, males aged 12 to 14 years and females aged 12 to 14 years are the age groups that are most secure financially, with 100.0% of males and 100.0% of females in these age groups living above the poverty line.
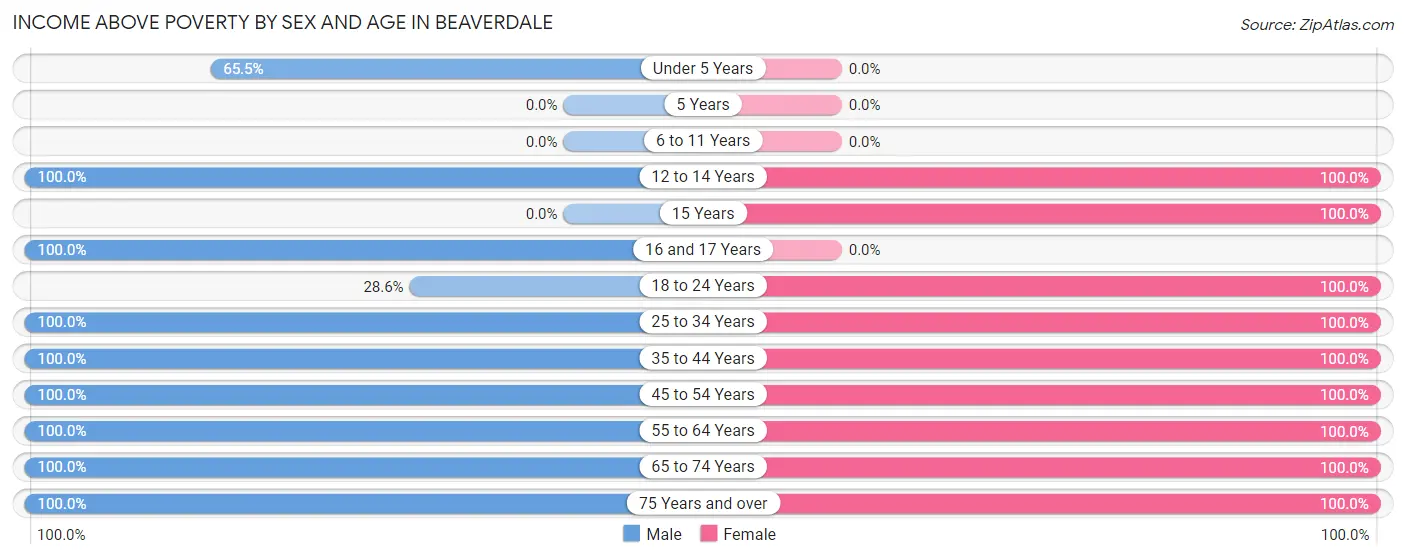
| Age Bracket | Male | Female |
| Under 5 Years | 19 (65.5%) | 0 (0.0%) |
| 5 Years | 0 (0.0%) | 0 (0.0%) |
| 6 to 11 Years | 0 (0.0%) | 0 (0.0%) |
| 12 to 14 Years | 6 (100.0%) | 7 (100.0%) |
| 15 Years | 0 (0.0%) | 54 (100.0%) |
| 16 and 17 Years | 12 (100.0%) | 0 (0.0%) |
| 18 to 24 Years | 6 (28.6%) | 21 (100.0%) |
| 25 to 34 Years | 27 (100.0%) | 17 (100.0%) |
| 35 to 44 Years | 24 (100.0%) | 65 (100.0%) |
| 45 to 54 Years | 8 (100.0%) | 37 (100.0%) |
| 55 to 64 Years | 62 (100.0%) | 108 (100.0%) |
| 65 to 74 Years | 77 (100.0%) | 52 (100.0%) |
| 75 Years and over | 35 (100.0%) | 37 (100.0%) |
| Total | 276 (91.7%) | 398 (96.4%) |
Income Below Poverty Among Married-Couple Families in Beaverdale
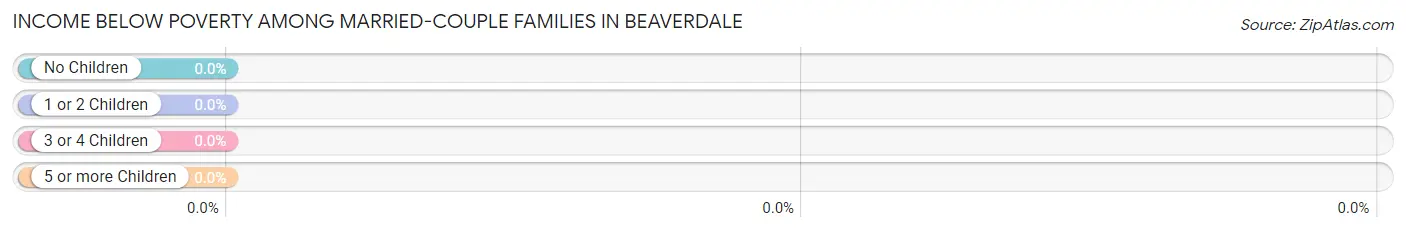
| Children | Above Poverty | Below Poverty |
| No Children | 154 (100.0%) | 0 (0.0%) |
| 1 or 2 Children | 35 (100.0%) | 0 (0.0%) |
| 3 or 4 Children | 0 (0.0%) | 0 (0.0%) |
| 5 or more Children | 0 (0.0%) | 0 (0.0%) |
| Total | 189 (100.0%) | 0 (0.0%) |
Income Below Poverty Among Single-Parent Households in Beaverdale
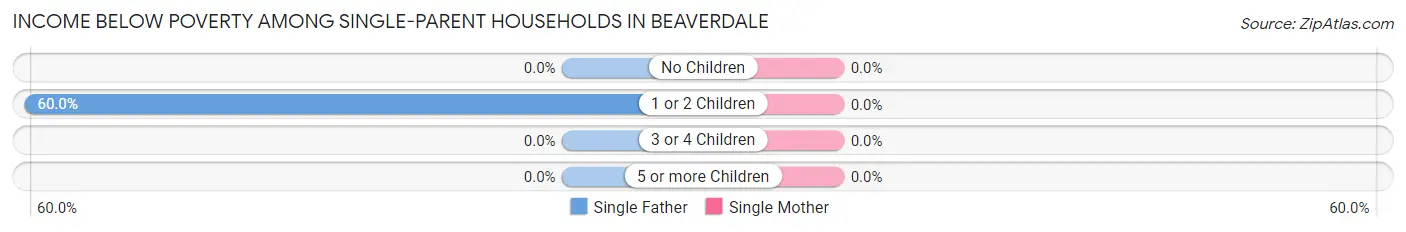
| Children | Single Father | Single Mother |
| No Children | 0 (0.0%) | 0 (0.0%) |
| 1 or 2 Children | 9 (60.0%) | 0 (0.0%) |
| 3 or 4 Children | 0 (0.0%) | 0 (0.0%) |
| 5 or more Children | 0 (0.0%) | 0 (0.0%) |
| Total | 9 (60.0%) | 0 (0.0%) |
Income Below Poverty Among Married-Couple vs Single-Parent Households in Beaverdale
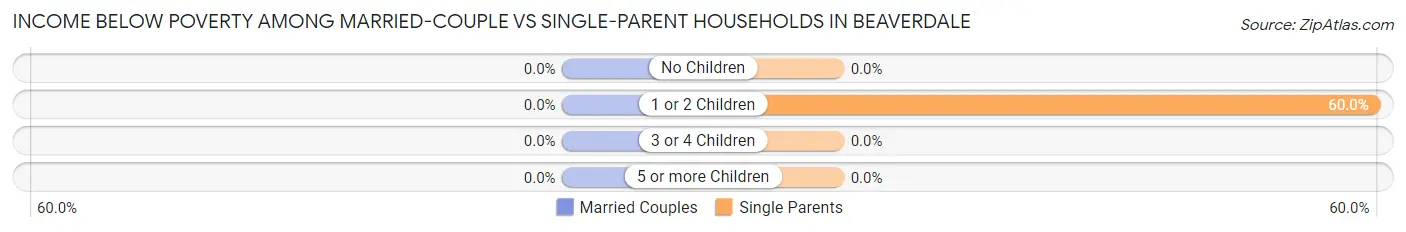
| Children | Married-Couple Families | Single-Parent Households |
| No Children | 0 (0.0%) | 0 (0.0%) |
| 1 or 2 Children | 0 (0.0%) | 9 (60.0%) |
| 3 or 4 Children | 0 (0.0%) | 0 (0.0%) |
| 5 or more Children | 0 (0.0%) | 0 (0.0%) |
| Total | 0 (0.0%) | 9 (60.0%) |
Race in Beaverdale
The most populous races in Beaverdale are White / Caucasian (700 | 98.0%), Some other Race (8 | 1.1%), and Asian (6 | 0.8%).
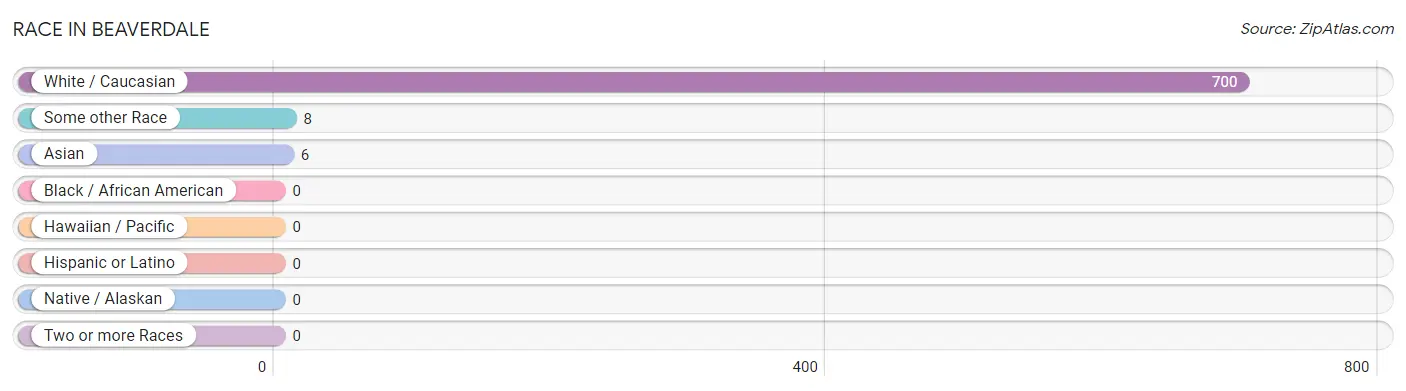
| Race | # Population | % Population |
| Asian | 6 | 0.8% |
| Black / African American | 0 | 0.0% |
| Hawaiian / Pacific | 0 | 0.0% |
| Hispanic or Latino | 0 | 0.0% |
| Native / Alaskan | 0 | 0.0% |
| White / Caucasian | 700 | 98.0% |
| Two or more Races | 0 | 0.0% |
| Some other Race | 8 | 1.1% |
| Total | 714 | 100.0% |
Ancestry in Beaverdale
The most populous ancestries reported in Beaverdale are German (264 | 37.0%), Irish (128 | 17.9%), Swedish (62 | 8.7%), English (60 | 8.4%), and Polish (40 | 5.6%), together accounting for 77.6% of all Beaverdale residents.
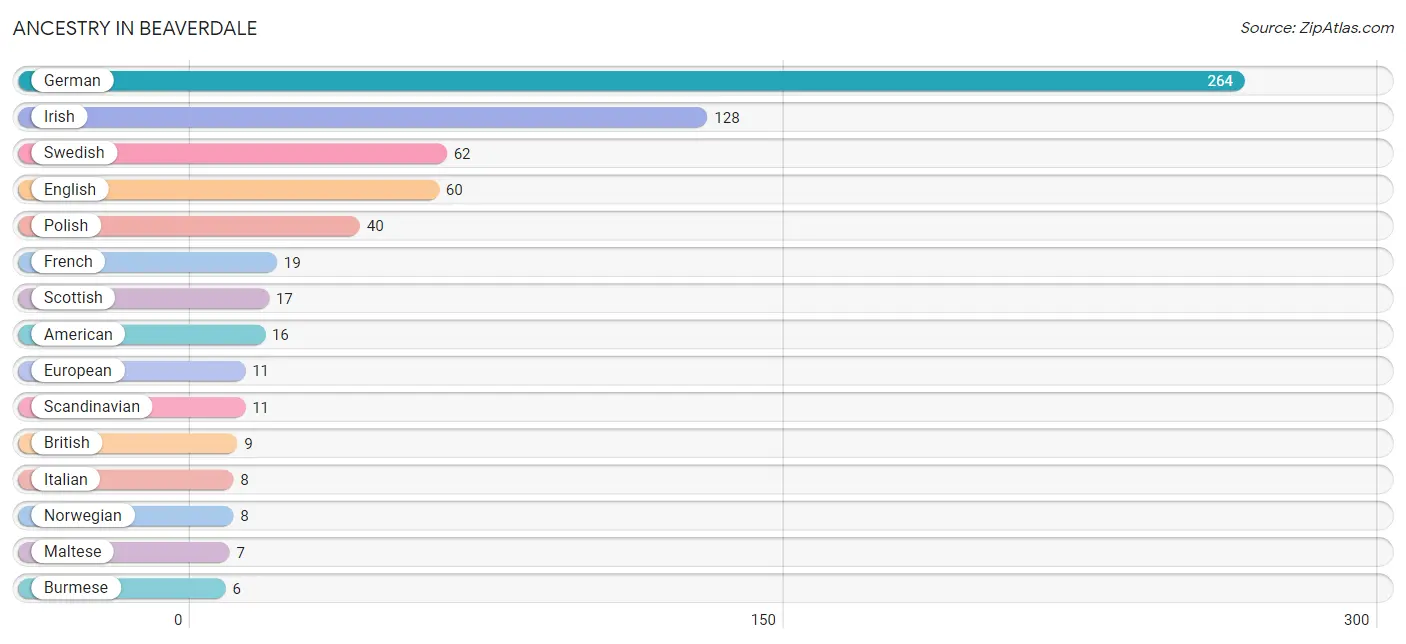
| Ancestry | # Population | % Population |
| American | 16 | 2.2% |
| British | 9 | 1.3% |
| Burmese | 6 | 0.8% |
| Danish | 5 | 0.7% |
| Dutch | 5 | 0.7% |
| English | 60 | 8.4% |
| European | 11 | 1.5% |
| French | 19 | 2.7% |
| German | 264 | 37.0% |
| Irish | 128 | 17.9% |
| Italian | 8 | 1.1% |
| Maltese | 7 | 1.0% |
| Norwegian | 8 | 1.1% |
| Polish | 40 | 5.6% |
| Russian | 5 | 0.7% |
| Scandinavian | 11 | 1.5% |
| Scottish | 17 | 2.4% |
| Swedish | 62 | 8.7% | View All 18 Rows |
Immigrants in Beaverdale
The most numerous immigrant groups reported in Beaverdale came from Asia (6 | 0.8%), Eastern Asia (6 | 0.8%), and Korea (6 | 0.8%), together accounting for 2.5% of all Beaverdale residents.
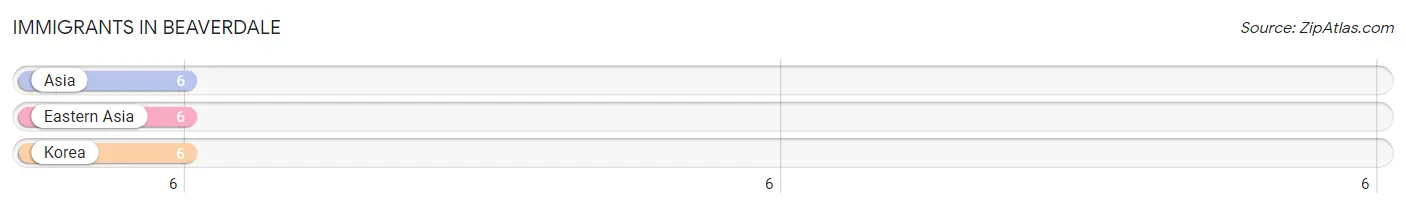
| Immigration Origin | # Population | % Population |
| Asia | 6 | 0.8% |
| Eastern Asia | 6 | 0.8% |
| Korea | 6 | 0.8% | View All 3 Rows |
Sex and Age in Beaverdale
Sex and Age in Beaverdale
The most populous age groups in Beaverdale are 60 to 64 Years (48 | 16.0%) for men and 60 to 64 Years (78 | 18.9%) for women.
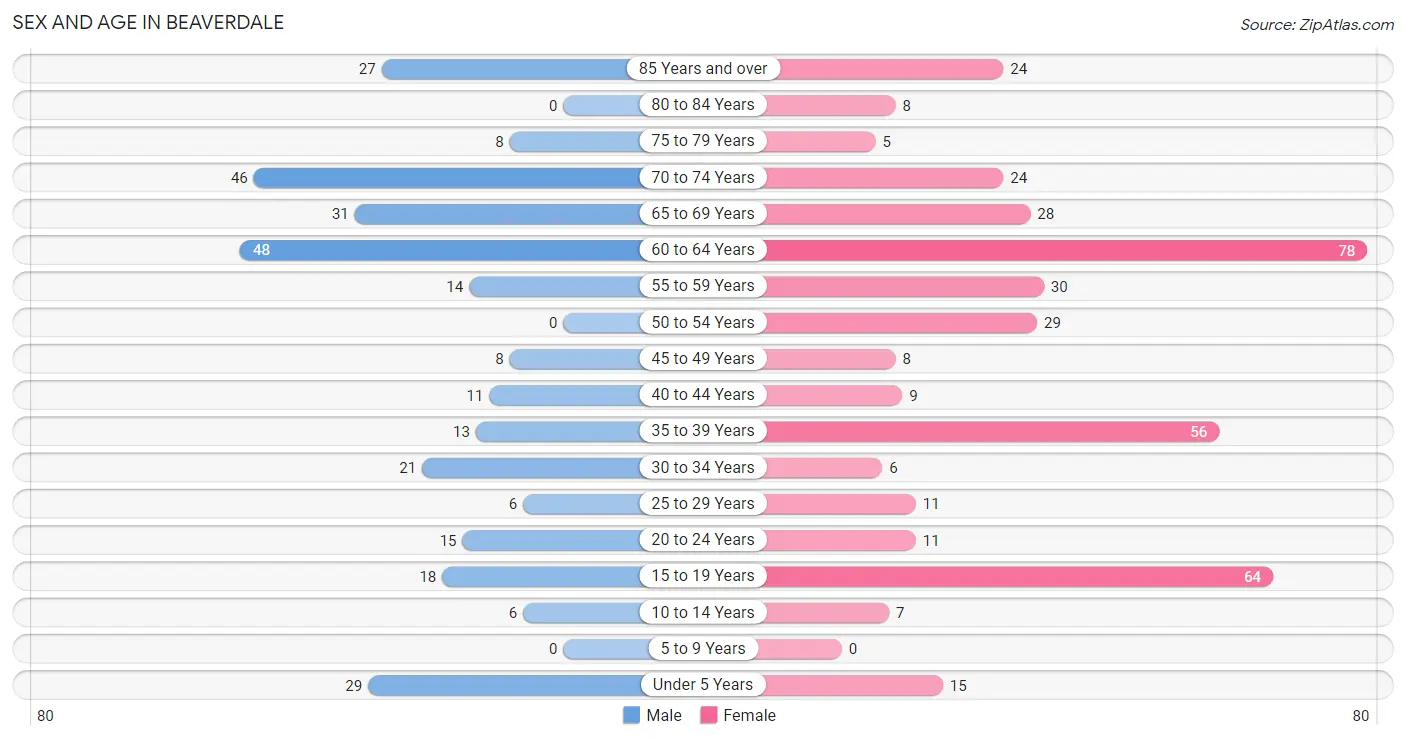
| Age Bracket | Male | Female |
| Under 5 Years | 29 (9.6%) | 15 (3.6%) |
| 5 to 9 Years | 0 (0.0%) | 0 (0.0%) |
| 10 to 14 Years | 6 (2.0%) | 7 (1.7%) |
| 15 to 19 Years | 18 (6.0%) | 64 (15.5%) |
| 20 to 24 Years | 15 (5.0%) | 11 (2.7%) |
| 25 to 29 Years | 6 (2.0%) | 11 (2.7%) |
| 30 to 34 Years | 21 (7.0%) | 6 (1.5%) |
| 35 to 39 Years | 13 (4.3%) | 56 (13.6%) |
| 40 to 44 Years | 11 (3.6%) | 9 (2.2%) |
| 45 to 49 Years | 8 (2.7%) | 8 (1.9%) |
| 50 to 54 Years | 0 (0.0%) | 29 (7.0%) |
| 55 to 59 Years | 14 (4.6%) | 30 (7.3%) |
| 60 to 64 Years | 48 (16.0%) | 78 (18.9%) |
| 65 to 69 Years | 31 (10.3%) | 28 (6.8%) |
| 70 to 74 Years | 46 (15.3%) | 24 (5.8%) |
| 75 to 79 Years | 8 (2.7%) | 5 (1.2%) |
| 80 to 84 Years | 0 (0.0%) | 8 (1.9%) |
| 85 Years and over | 27 (9.0%) | 24 (5.8%) |
| Total | 301 (100.0%) | 413 (100.0%) |
Families and Households in Beaverdale
Median Family Size in Beaverdale
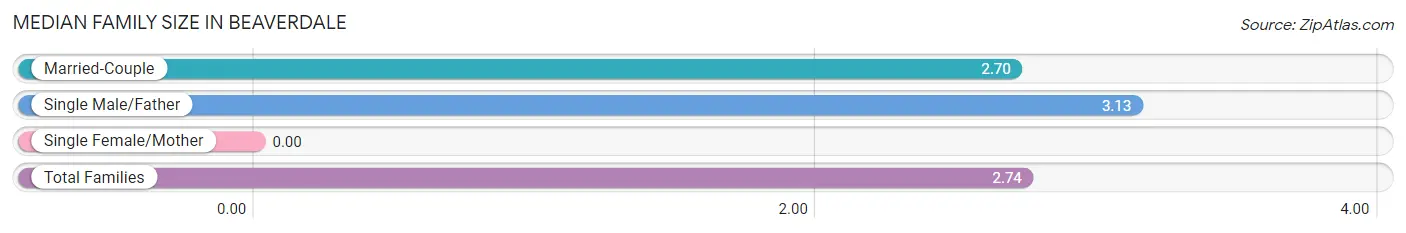
| Family Type | # Families | Family Size |
| Married-Couple | 189 (92.6%) | 2.70 |
| Single Male/Father | 15 (7.3%) | 3.13 |
| Single Female/Mother | 0 (0.0%) | - |
| Total Families | 204 (100.0%) | 2.74 |
Median Household Size in Beaverdale

| Household Type | # Households | Household Size |
| Married-Couple | 189 (57.6%) | 2.70 |
| Single Male/Father | 15 (4.6%) | 4.27 |
| Single Female/Mother | 0 (0.0%) | - |
| Non-family | 124 (37.8%) | 1.12 |
| Total Households | 328 (100.0%) | 2.18 |
Household Size by Marriage Status in Beaverdale
Out of a total of 328 households in Beaverdale, 204 (62.2%) are family households, while 124 (37.8%) are nonfamily households. The most numerous type of family households are 2-person households, comprising 152, and the most common type of nonfamily households are 1-person households, comprising 103.
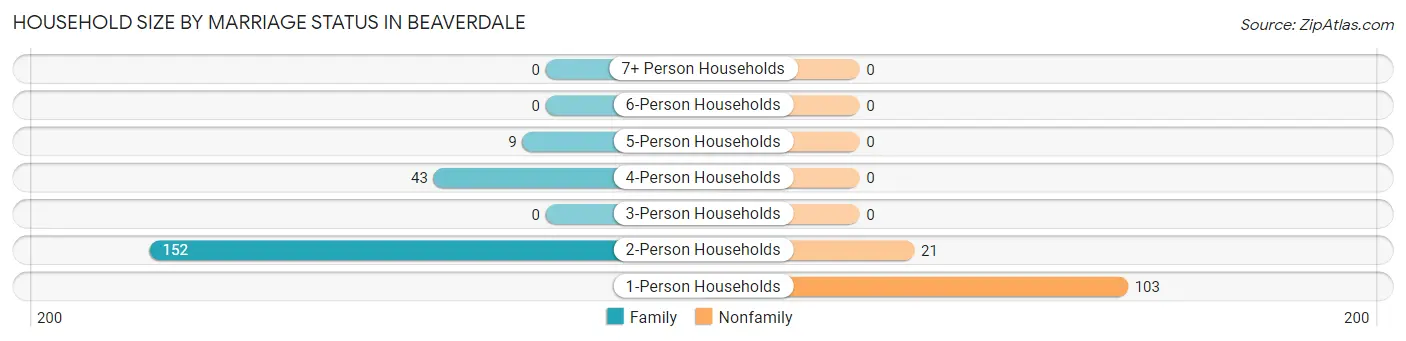
| Household Size | Family Households | Nonfamily Households |
| 1-Person Households | - | 103 (31.4%) |
| 2-Person Households | 152 (46.3%) | 21 (6.4%) |
| 3-Person Households | 0 (0.0%) | 0 (0.0%) |
| 4-Person Households | 43 (13.1%) | 0 (0.0%) |
| 5-Person Households | 9 (2.7%) | 0 (0.0%) |
| 6-Person Households | 0 (0.0%) | 0 (0.0%) |
| 7+ Person Households | 0 (0.0%) | 0 (0.0%) |
| Total | 204 (62.2%) | 124 (37.8%) |
Female Fertility in Beaverdale
Fertility by Age in Beaverdale
| Age Bracket | Women with Births | Births / 1,000 Women |
| 15 to 19 years | 0 (0.0%) | 0.0 |
| 20 to 34 years | 0 (0.0%) | 0.0 |
| 35 to 50 years | 0 (0.0%) | 0.0 |
| Total | 0 (0.0%) | 0.0 |
Fertility by Age by Marriage Status in Beaverdale
| Age Bracket | Married | Unmarried |
| 15 to 19 years | 0 (0.0%) | 0 (0.0%) |
| 20 to 34 years | 0 (0.0%) | 0 (0.0%) |
| 35 to 50 years | 0 (0.0%) | 0 (0.0%) |
| Total | 0 (0.0%) | 0 (0.0%) |
Fertility by Education in Beaverdale
| Educational Attainment | Women with Births | Births / 1,000 Women |
| Less than High School | 0 (0.0%) | 0.0 |
| High School Diploma | 0 (0.0%) | 0.0 |
| College or Associate's Degree | 0 (0.0%) | 0.0 |
| Bachelor's Degree | 0 (0.0%) | 0.0 |
| Graduate Degree | 0 (0.0%) | 0.0 |
| Total | 0 (0.0%) | 0.0 |
Fertility by Education by Marriage Status in Beaverdale
| Educational Attainment | Married | Unmarried |
| Less than High School | 0 (0.0%) | 0 (0.0%) |
| High School Diploma | 0 (0.0%) | 0 (0.0%) |
| College or Associate's Degree | 0 (0.0%) | 0 (0.0%) |
| Bachelor's Degree | 0 (0.0%) | 0 (0.0%) |
| Graduate Degree | 0 (0.0%) | 0 (0.0%) |
| Total | 0 (0.0%) | 0 (0.0%) |
Employment Characteristics in Beaverdale
Employment by Class of Employer in Beaverdale
Among the 313 employed individuals in Beaverdale, private company employees (229 | 73.2%), not-for-profit organizations (43 | 13.7%), and local government employees (21 | 6.7%) make up the most common classes of employment.
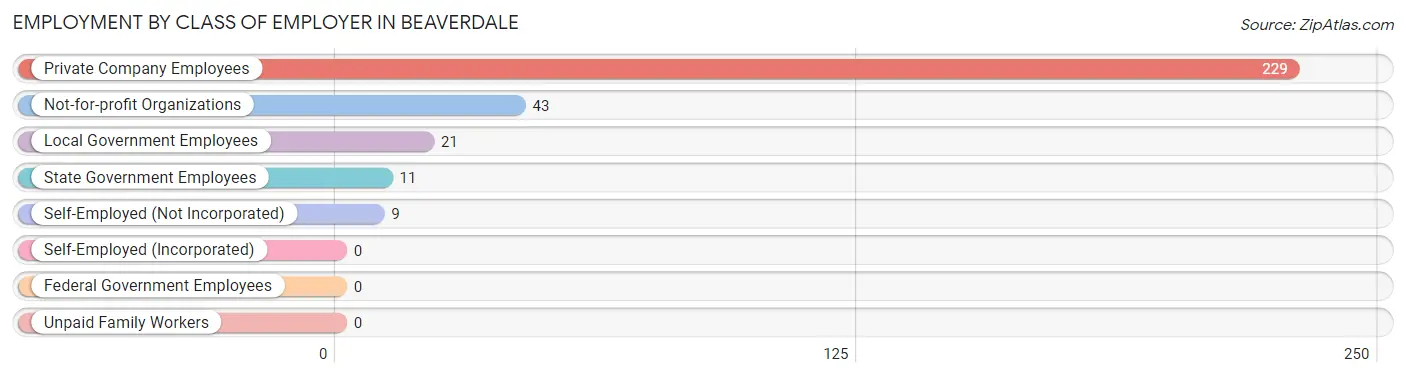
| Employer Class | # Employees | % Employees |
| Private Company Employees | 229 | 73.2% |
| Self-Employed (Incorporated) | 0 | 0.0% |
| Self-Employed (Not Incorporated) | 9 | 2.9% |
| Not-for-profit Organizations | 43 | 13.7% |
| Local Government Employees | 21 | 6.7% |
| State Government Employees | 11 | 3.5% |
| Federal Government Employees | 0 | 0.0% |
| Unpaid Family Workers | 0 | 0.0% |
| Total | 313 | 100.0% |
Employment Status by Age in Beaverdale
According to the labor force statistics for Beaverdale, out of the total population over 16 years of age (603), 54.2% or 327 individuals are in the labor force, with 4.3% or 14 of them unemployed. The age group with the highest labor force participation rate is 20 to 24 years, with 100.0% or 26 individuals in the labor force. Within the labor force, the 16 to 19 years age range has the highest percentage of unemployed individuals, with 27.3% or 6 of them being unemployed.
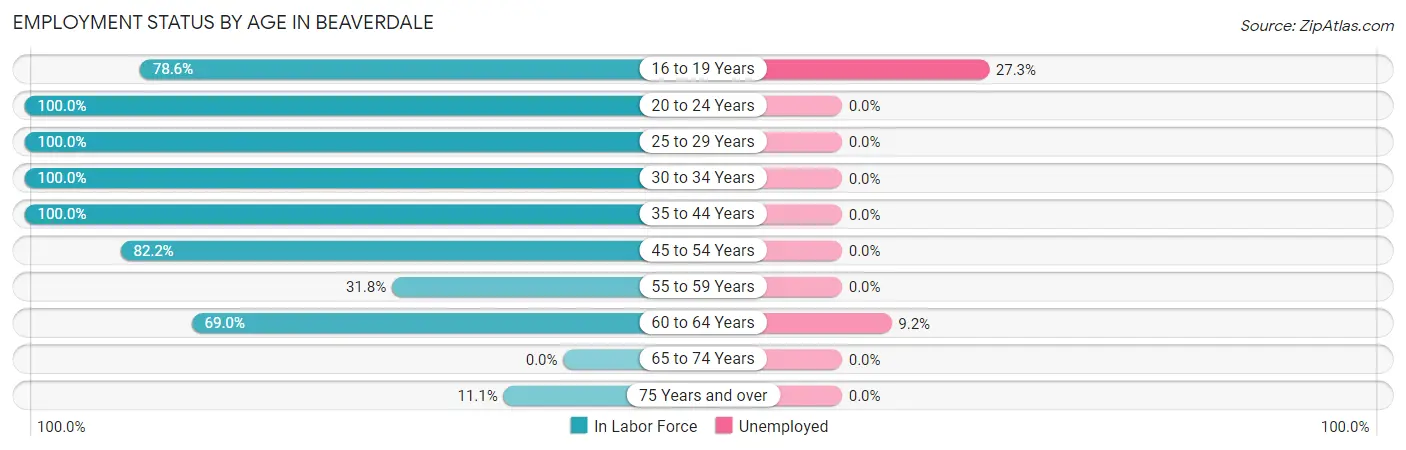
| Age Bracket | In Labor Force | Unemployed |
| 16 to 19 Years | 22 (78.6%) | 6 (27.3%) |
| 20 to 24 Years | 26 (100.0%) | 0 (0.0%) |
| 25 to 29 Years | 17 (100.0%) | 0 (0.0%) |
| 30 to 34 Years | 27 (100.0%) | 0 (0.0%) |
| 35 to 44 Years | 89 (100.0%) | 0 (0.0%) |
| 45 to 54 Years | 37 (82.2%) | 0 (0.0%) |
| 55 to 59 Years | 14 (31.8%) | 0 (0.0%) |
| 60 to 64 Years | 87 (69.0%) | 8 (9.2%) |
| 65 to 74 Years | 0 (0.0%) | 0 (0.0%) |
| 75 Years and over | 8 (11.1%) | 0 (0.0%) |
| Total | 327 (54.2%) | 14 (4.3%) |
Employment Status by Educational Attainment in Beaverdale
According to labor force statistics for Beaverdale, 77.9% of individuals (271) out of the total population between 25 and 64 years of age (348) are in the labor force, with 3.0% or 8 of them being unemployed. The group with the highest labor force participation rate are those with the educational attainment of college / associate degree, with 94.2% or 131 individuals in the labor force. Within the labor force, individuals with high school diploma education have the highest percentage of unemployment, with 19.5% or 8 of them being unemployed.
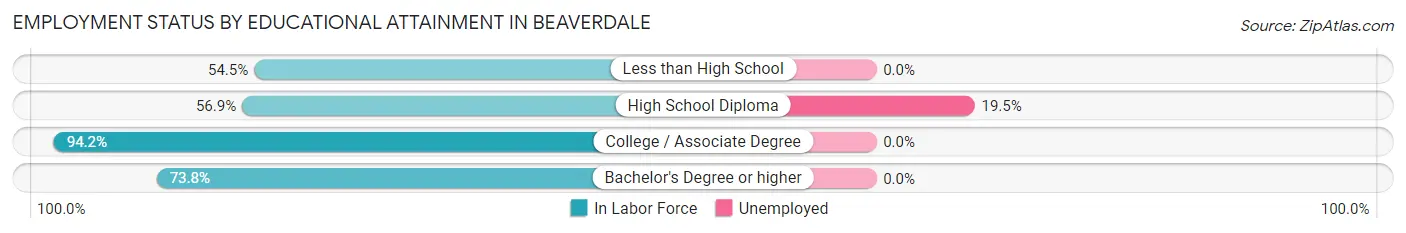
| Educational Attainment | In Labor Force | Unemployed |
| Less than High School | 6 (54.5%) | 0 (0.0%) |
| High School Diploma | 41 (56.9%) | 14 (19.5%) |
| College / Associate Degree | 131 (94.2%) | 0 (0.0%) |
| Bachelor's Degree or higher | 93 (73.8%) | 0 (0.0%) |
| Total | 271 (77.9%) | 10 (3.0%) |
Employment Occupations by Sex in Beaverdale
Management, Business, Science and Arts Occupations
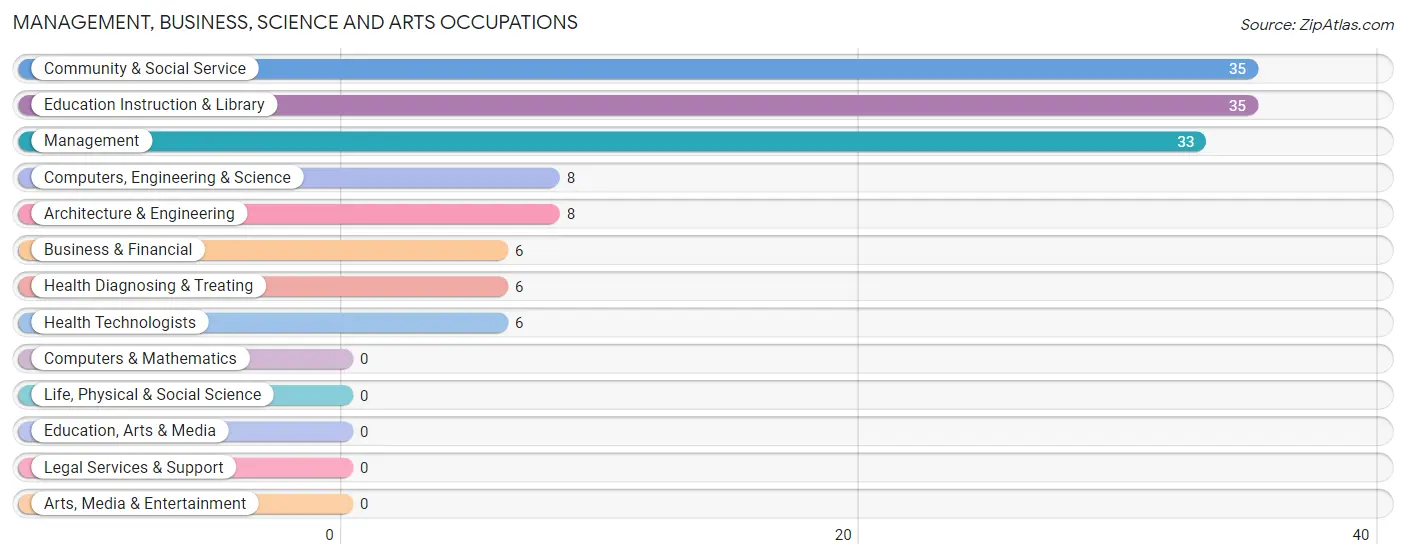
The most common Management, Business, Science and Arts occupations in Beaverdale are Community & Social Service (35 | 11.2%), Education Instruction & Library (35 | 11.2%), Management (33 | 10.5%), Computers, Engineering & Science (8 | 2.6%), and Architecture & Engineering (8 | 2.6%).
Management, Business, Science and Arts Occupations by Sex
Within the Management, Business, Science and Arts occupations in Beaverdale, the most male-oriented occupations are Business & Financial (100.0%), Computers, Engineering & Science (100.0%), and Architecture & Engineering (100.0%), while the most female-oriented occupations are Health Diagnosing & Treating (100.0%), Health Technologists (100.0%), and Management (57.6%).
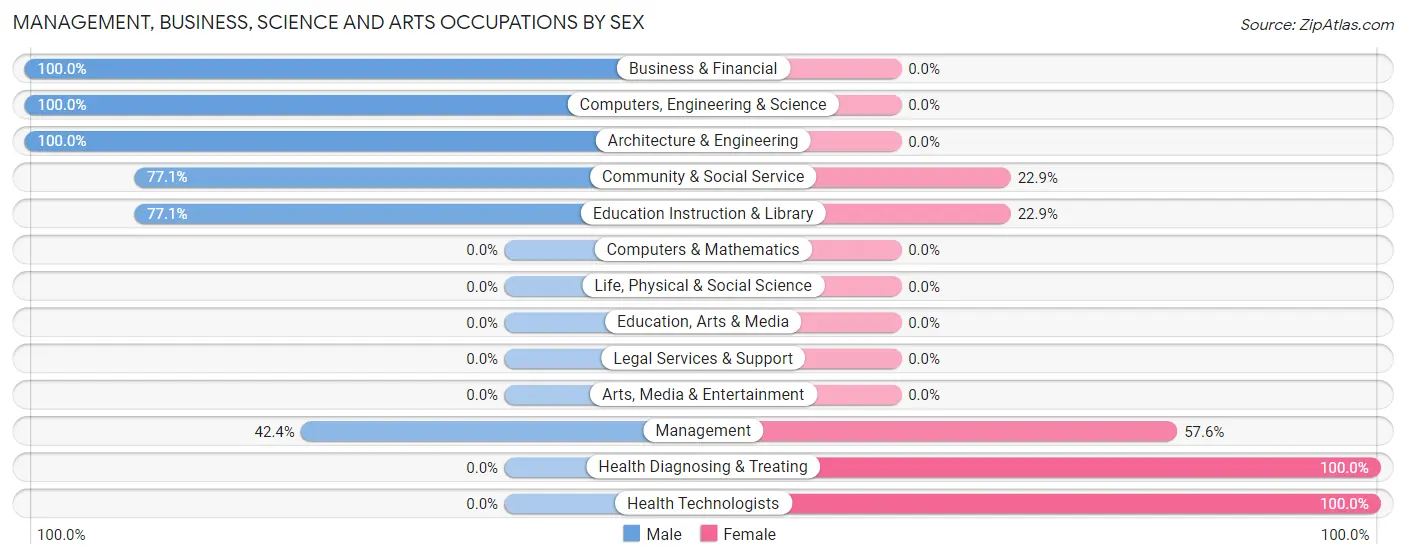
| Occupation | Male | Female |
| Management | 14 (42.4%) | 19 (57.6%) |
| Business & Financial | 6 (100.0%) | 0 (0.0%) |
| Computers, Engineering & Science | 8 (100.0%) | 0 (0.0%) |
| Computers & Mathematics | 0 (0.0%) | 0 (0.0%) |
| Architecture & Engineering | 8 (100.0%) | 0 (0.0%) |
| Life, Physical & Social Science | 0 (0.0%) | 0 (0.0%) |
| Community & Social Service | 27 (77.1%) | 8 (22.9%) |
| Education, Arts & Media | 0 (0.0%) | 0 (0.0%) |
| Legal Services & Support | 0 (0.0%) | 0 (0.0%) |
| Education Instruction & Library | 27 (77.1%) | 8 (22.9%) |
| Arts, Media & Entertainment | 0 (0.0%) | 0 (0.0%) |
| Health Diagnosing & Treating | 0 (0.0%) | 6 (100.0%) |
| Health Technologists | 0 (0.0%) | 6 (100.0%) |
| Total (Category) | 55 (62.5%) | 33 (37.5%) |
| Total (Overall) | 108 (34.5%) | 205 (65.5%) |
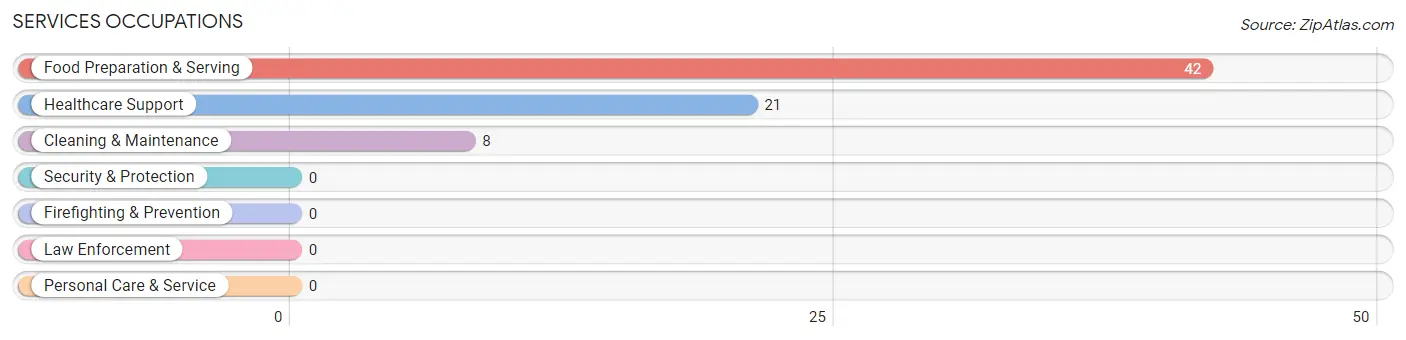
Services Occupations
The most common Services occupations in Beaverdale are Food Preparation & Serving (42 | 13.4%), Healthcare Support (21 | 6.7%), and Cleaning & Maintenance (8 | 2.6%).
Services Occupations by Sex
Within the Services occupations in Beaverdale, the most male-oriented occupations are Cleaning & Maintenance (100.0%), and Food Preparation & Serving (14.3%), while the most female-oriented occupations are Healthcare Support (100.0%), and Food Preparation & Serving (85.7%).
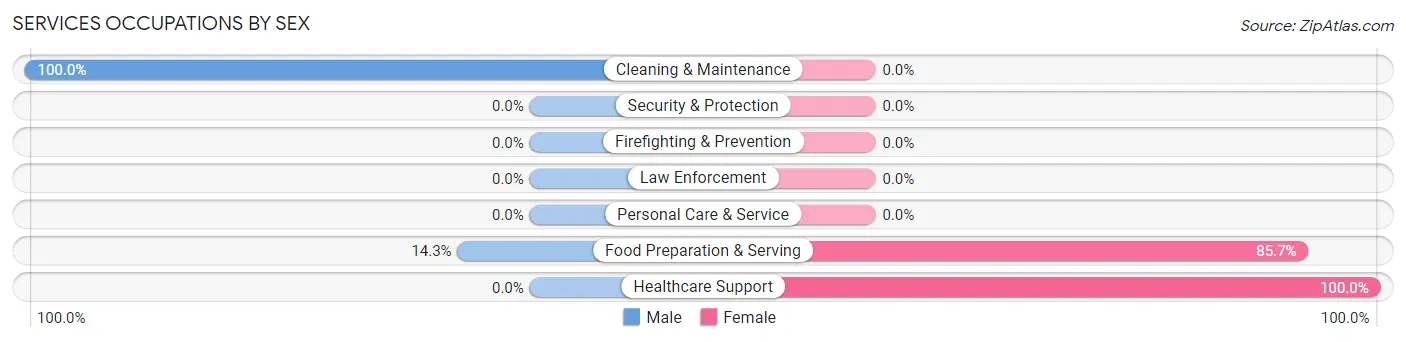
| Occupation | Male | Female |
| Healthcare Support | 0 (0.0%) | 21 (100.0%) |
| Security & Protection | 0 (0.0%) | 0 (0.0%) |
| Firefighting & Prevention | 0 (0.0%) | 0 (0.0%) |
| Law Enforcement | 0 (0.0%) | 0 (0.0%) |
| Food Preparation & Serving | 6 (14.3%) | 36 (85.7%) |
| Cleaning & Maintenance | 8 (100.0%) | 0 (0.0%) |
| Personal Care & Service | 0 (0.0%) | 0 (0.0%) |
| Total (Category) | 14 (19.7%) | 57 (80.3%) |
| Total (Overall) | 108 (34.5%) | 205 (65.5%) |
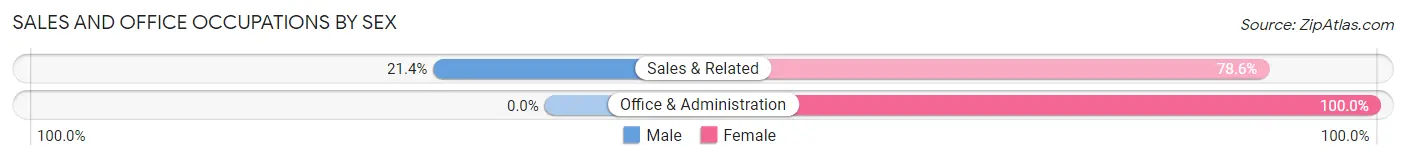
Sales and Office Occupations
The most common Sales and Office occupations in Beaverdale are Office & Administration (33 | 10.5%), and Sales & Related (28 | 8.9%).
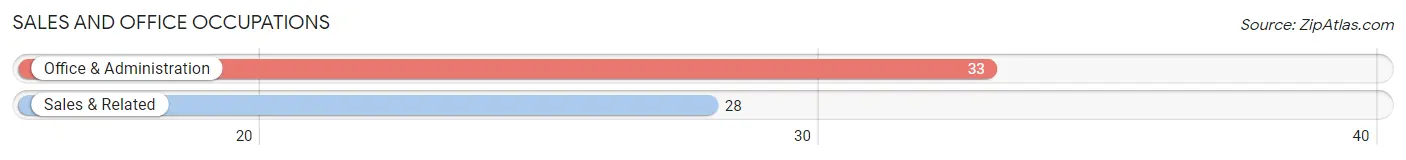
Sales and Office Occupations by Sex
| Occupation | Male | Female |
| Sales & Related | 6 (21.4%) | 22 (78.6%) |
| Office & Administration | 0 (0.0%) | 33 (100.0%) |
| Total (Category) | 6 (9.8%) | 55 (90.2%) |
| Total (Overall) | 108 (34.5%) | 205 (65.5%) |
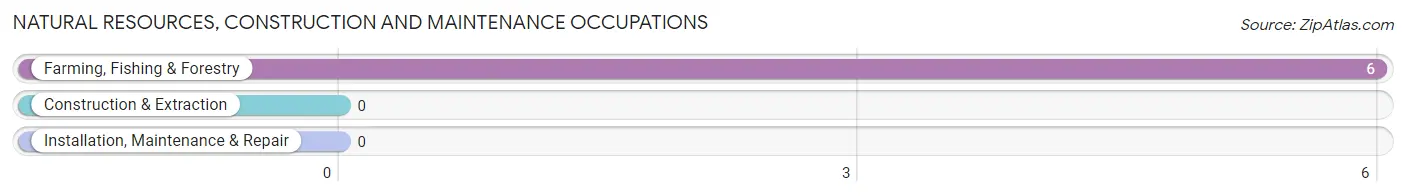
Natural Resources, Construction and Maintenance Occupations
The most common Natural Resources, Construction and Maintenance occupations in Beaverdale are , and Farming, Fishing & Forestry (6 | 1.9%).
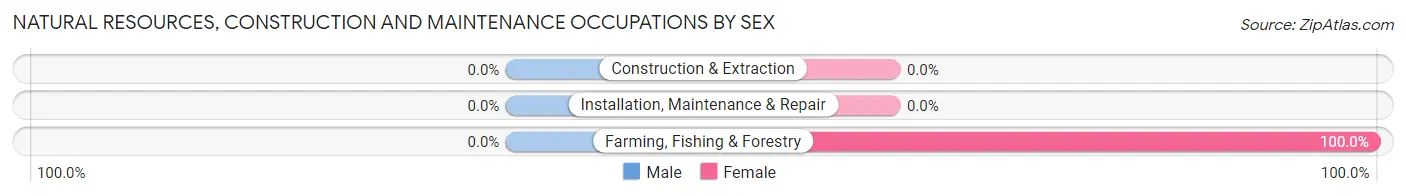
Natural Resources, Construction and Maintenance Occupations by Sex
| Occupation | Male | Female |
| Farming, Fishing & Forestry | 0 (0.0%) | 6 (100.0%) |
| Construction & Extraction | 0 (0.0%) | 0 (0.0%) |
| Installation, Maintenance & Repair | 0 (0.0%) | 0 (0.0%) |
| Total (Category) | 0 (0.0%) | 6 (100.0%) |
| Total (Overall) | 108 (34.5%) | 205 (65.5%) |
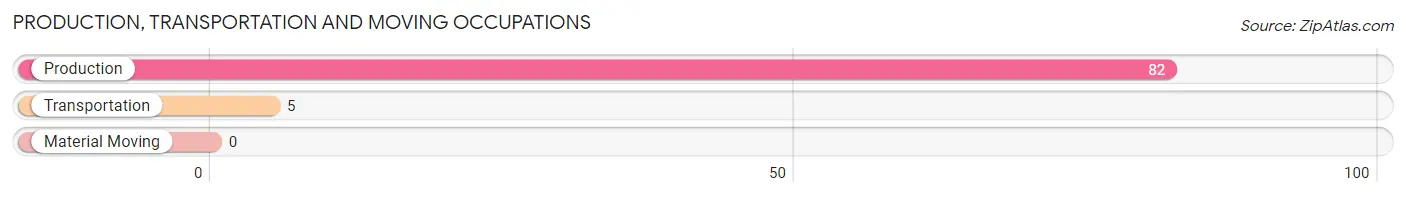
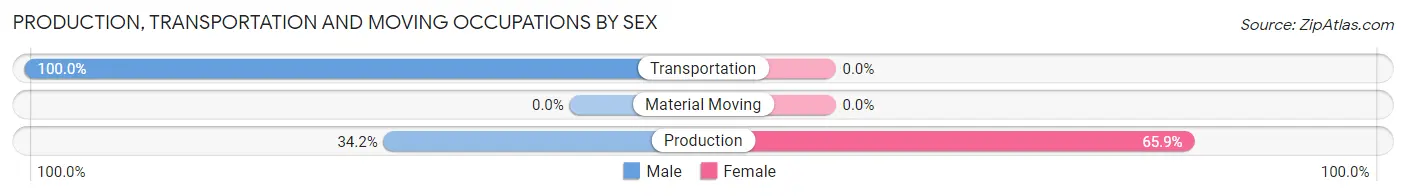
Production, Transportation and Moving Occupations
The most common Production, Transportation and Moving occupations in Beaverdale are Production (82 | 26.2%), and Transportation (5 | 1.6%).
Production, Transportation and Moving Occupations by Sex
| Occupation | Male | Female |
| Production | 28 (34.2%) | 54 (65.8%) |
| Transportation | 5 (100.0%) | 0 (0.0%) |
| Material Moving | 0 (0.0%) | 0 (0.0%) |
| Total (Category) | 33 (37.9%) | 54 (62.1%) |
| Total (Overall) | 108 (34.5%) | 205 (65.5%) |
Employment Industries by Sex in Beaverdale
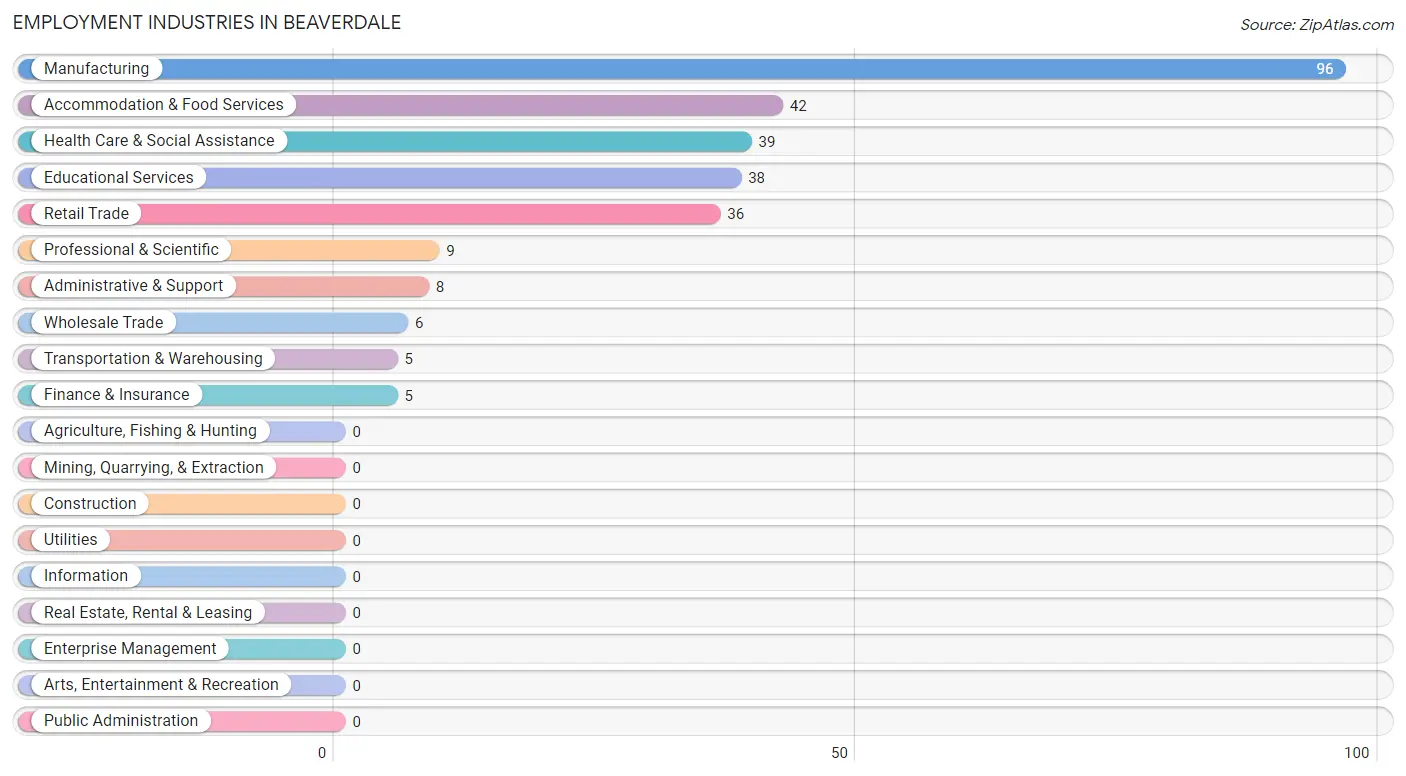
Employment Industries in Beaverdale
The major employment industries in Beaverdale include Manufacturing (96 | 30.7%), Accommodation & Food Services (42 | 13.4%), Health Care & Social Assistance (39 | 12.5%), Educational Services (38 | 12.1%), and Retail Trade (36 | 11.5%).
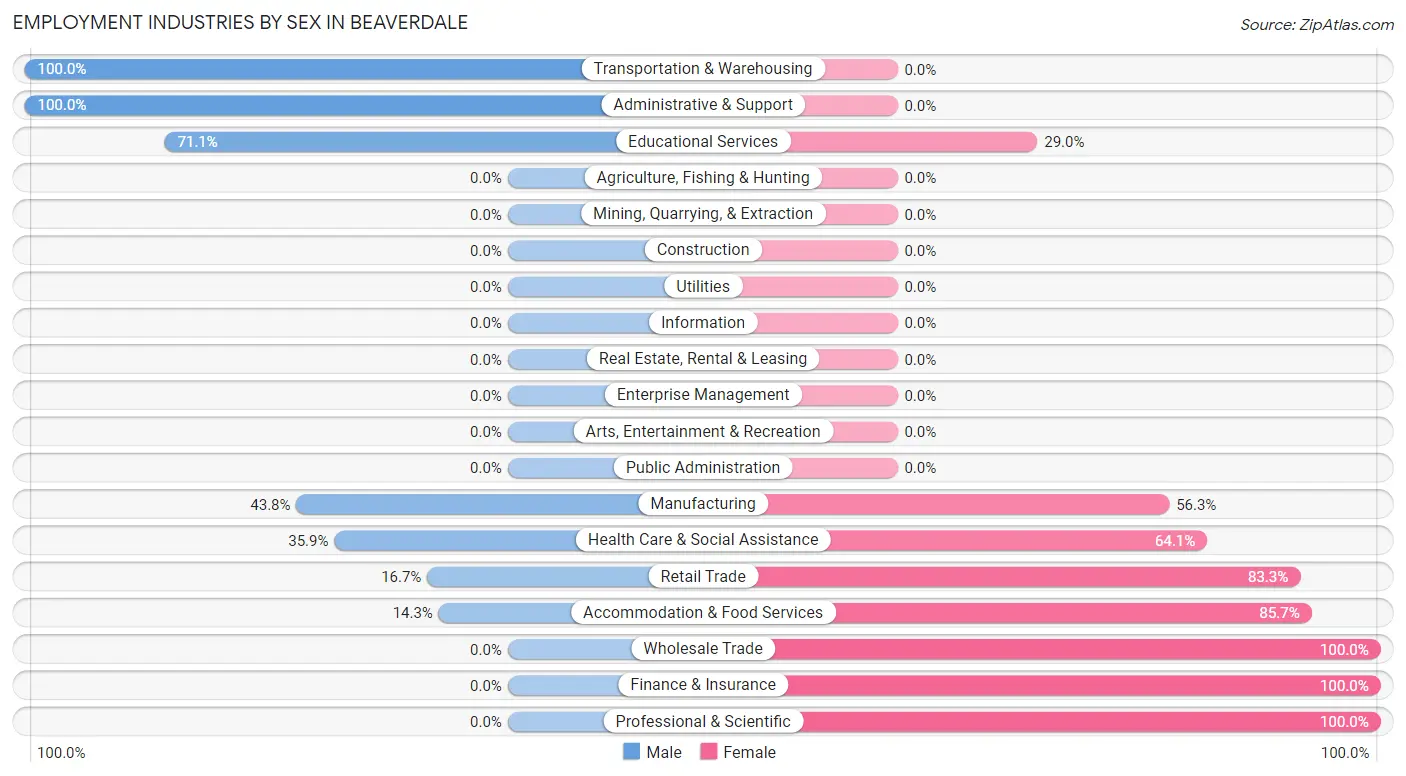
Employment Industries by Sex in Beaverdale
The Beaverdale industries that see more men than women are Transportation & Warehousing (100.0%), Administrative & Support (100.0%), and Educational Services (71.1%), whereas the industries that tend to have a higher number of women are Wholesale Trade (100.0%), Finance & Insurance (100.0%), and Professional & Scientific (100.0%).
| Industry | Male | Female |
| Agriculture, Fishing & Hunting | 0 (0.0%) | 0 (0.0%) |
| Mining, Quarrying, & Extraction | 0 (0.0%) | 0 (0.0%) |
| Construction | 0 (0.0%) | 0 (0.0%) |
| Manufacturing | 42 (43.8%) | 54 (56.2%) |
| Wholesale Trade | 0 (0.0%) | 6 (100.0%) |
| Retail Trade | 6 (16.7%) | 30 (83.3%) |
| Transportation & Warehousing | 5 (100.0%) | 0 (0.0%) |
| Utilities | 0 (0.0%) | 0 (0.0%) |
| Information | 0 (0.0%) | 0 (0.0%) |
| Finance & Insurance | 0 (0.0%) | 5 (100.0%) |
| Real Estate, Rental & Leasing | 0 (0.0%) | 0 (0.0%) |
| Professional & Scientific | 0 (0.0%) | 9 (100.0%) |
| Enterprise Management | 0 (0.0%) | 0 (0.0%) |
| Administrative & Support | 8 (100.0%) | 0 (0.0%) |
| Educational Services | 27 (71.1%) | 11 (28.9%) |
| Health Care & Social Assistance | 14 (35.9%) | 25 (64.1%) |
| Arts, Entertainment & Recreation | 0 (0.0%) | 0 (0.0%) |
| Accommodation & Food Services | 6 (14.3%) | 36 (85.7%) |
| Public Administration | 0 (0.0%) | 0 (0.0%) |
| Total | 108 (34.5%) | 205 (65.5%) |
Education in Beaverdale
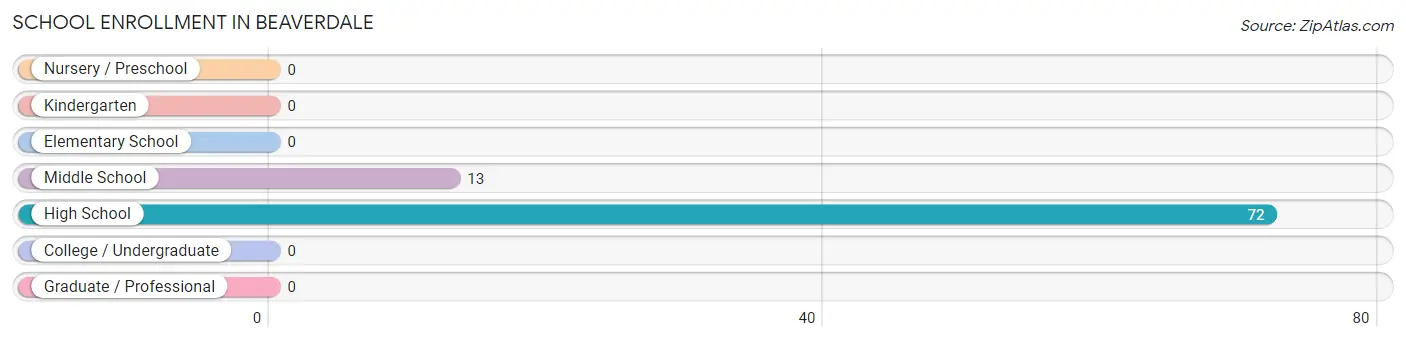
School Enrollment in Beaverdale
The most common levels of schooling among the 85 students in Beaverdale are high school (72 | 84.7%), and middle school (13 | 15.3%).
| School Level | # Students | % Students |
| Nursery / Preschool | 0 | 0.0% |
| Kindergarten | 0 | 0.0% |
| Elementary School | 0 | 0.0% |
| Middle School | 13 | 15.3% |
| High School | 72 | 84.7% |
| College / Undergraduate | 0 | 0.0% |
| Graduate / Professional | 0 | 0.0% |
| Total | 85 | 100.0% |
School Enrollment by Age by Funding Source in Beaverdale
Out of a total of 85 students who are enrolled in schools in Beaverdale, 12 (14.1%) attend a private institution, while the remaining 73 (85.9%) are enrolled in public schools. The age group of 10 to 14 year olds has the highest likelihood of being enrolled in private schools, with 6 (46.2% in the age bracket) enrolled. Conversely, the age group of 18 to 19 year olds has the lowest likelihood of being enrolled in a private school, with 6 (100.0% in the age bracket) attending a public institution.
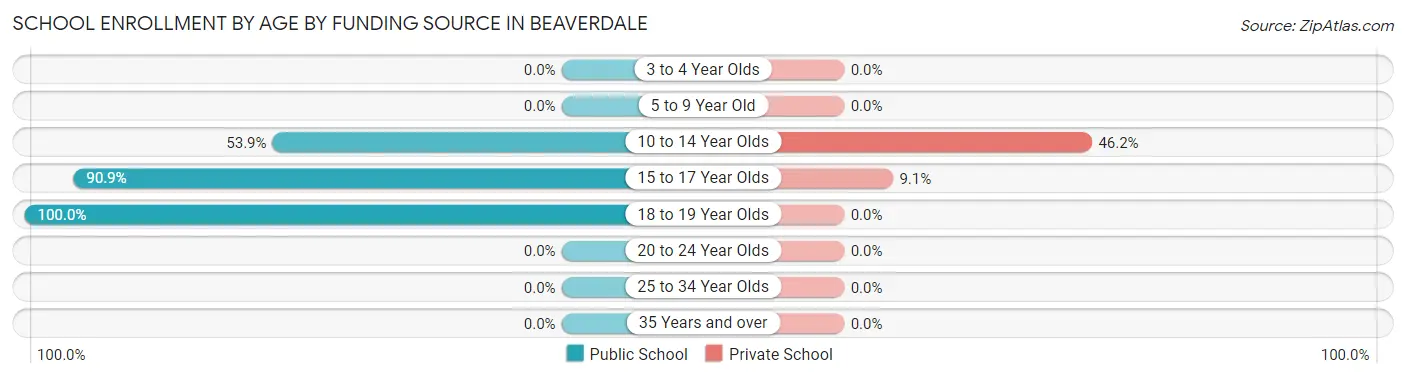
| Age Bracket | Public School | Private School |
| 3 to 4 Year Olds | 0 (0.0%) | 0 (0.0%) |
| 5 to 9 Year Old | 0 (0.0%) | 0 (0.0%) |
| 10 to 14 Year Olds | 7 (53.8%) | 6 (46.2%) |
| 15 to 17 Year Olds | 60 (90.9%) | 6 (9.1%) |
| 18 to 19 Year Olds | 6 (100.0%) | 0 (0.0%) |
| 20 to 24 Year Olds | 0 (0.0%) | 0 (0.0%) |
| 25 to 34 Year Olds | 0 (0.0%) | 0 (0.0%) |
| 35 Years and over | 0 (0.0%) | 0 (0.0%) |
| Total | 73 (85.9%) | 12 (14.1%) |
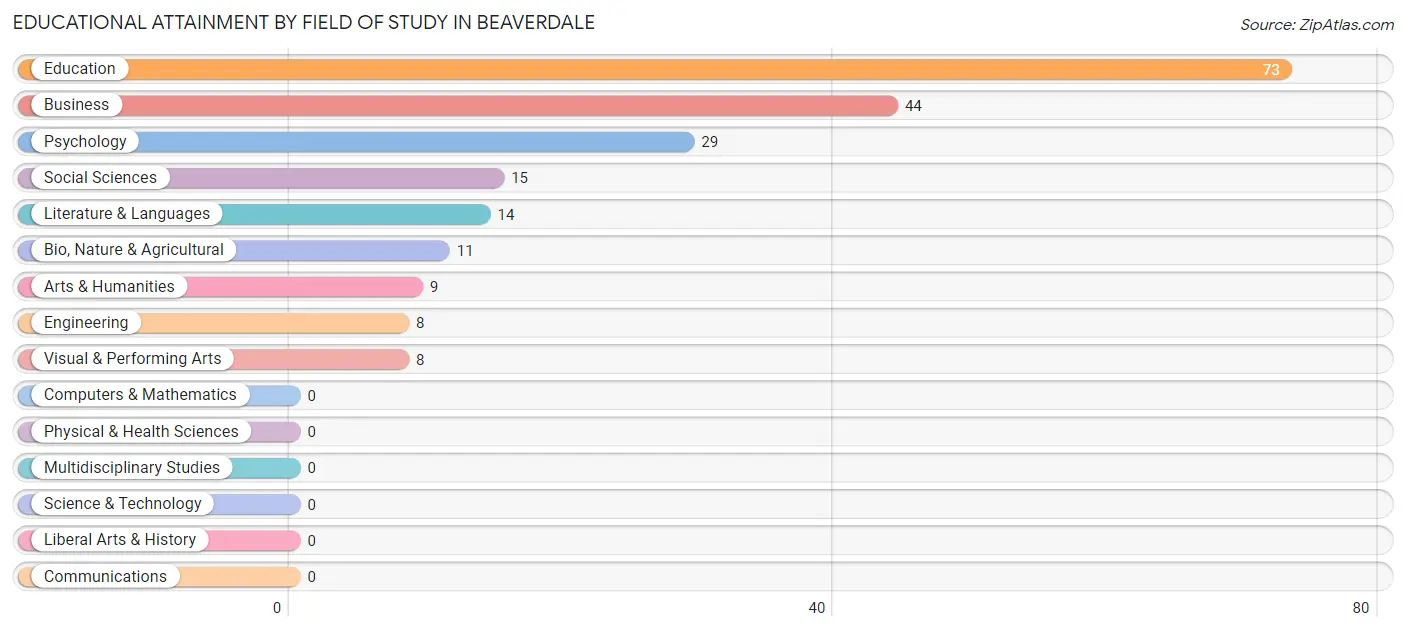
Educational Attainment by Field of Study in Beaverdale
Education (73 | 34.6%), business (44 | 20.8%), psychology (29 | 13.7%), social sciences (15 | 7.1%), and literature & languages (14 | 6.6%) are the most common fields of study among 211 individuals in Beaverdale who have obtained a bachelor's degree or higher.
| Field of Study | # Graduates | % Graduates |
| Computers & Mathematics | 0 | 0.0% |
| Bio, Nature & Agricultural | 11 | 5.2% |
| Physical & Health Sciences | 0 | 0.0% |
| Psychology | 29 | 13.7% |
| Social Sciences | 15 | 7.1% |
| Engineering | 8 | 3.8% |
| Multidisciplinary Studies | 0 | 0.0% |
| Science & Technology | 0 | 0.0% |
| Business | 44 | 20.8% |
| Education | 73 | 34.6% |
| Literature & Languages | 14 | 6.6% |
| Liberal Arts & History | 0 | 0.0% |
| Visual & Performing Arts | 8 | 3.8% |
| Communications | 0 | 0.0% |
| Arts & Humanities | 9 | 4.3% |
| Total | 211 | 100.0% |
Transportation & Commute in Beaverdale
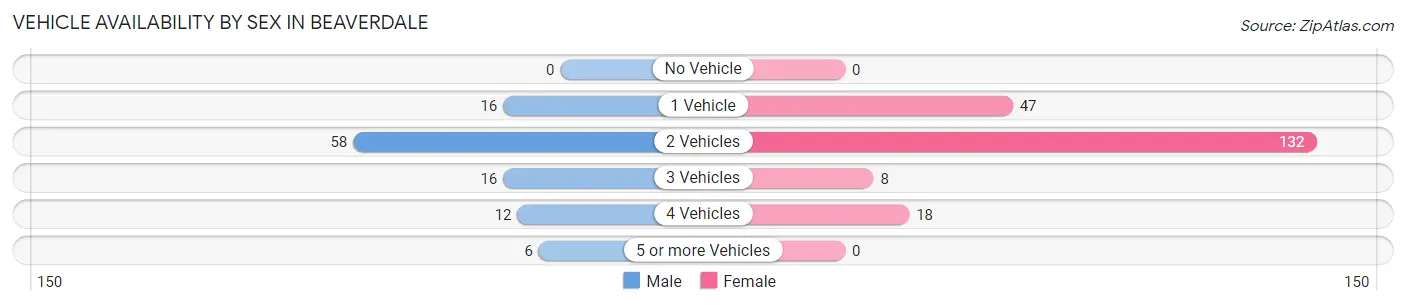
Vehicle Availability by Sex in Beaverdale
The most prevalent vehicle ownership categories in Beaverdale are males with 2 vehicles (58, accounting for 53.7%) and females with 2 vehicles (132, making up 28.3%).
| Vehicles Available | Male | Female |
| No Vehicle | 0 (0.0%) | 0 (0.0%) |
| 1 Vehicle | 16 (14.8%) | 47 (22.9%) |
| 2 Vehicles | 58 (53.7%) | 132 (64.4%) |
| 3 Vehicles | 16 (14.8%) | 8 (3.9%) |
| 4 Vehicles | 12 (11.1%) | 18 (8.8%) |
| 5 or more Vehicles | 6 (5.6%) | 0 (0.0%) |
| Total | 108 (100.0%) | 205 (100.0%) |
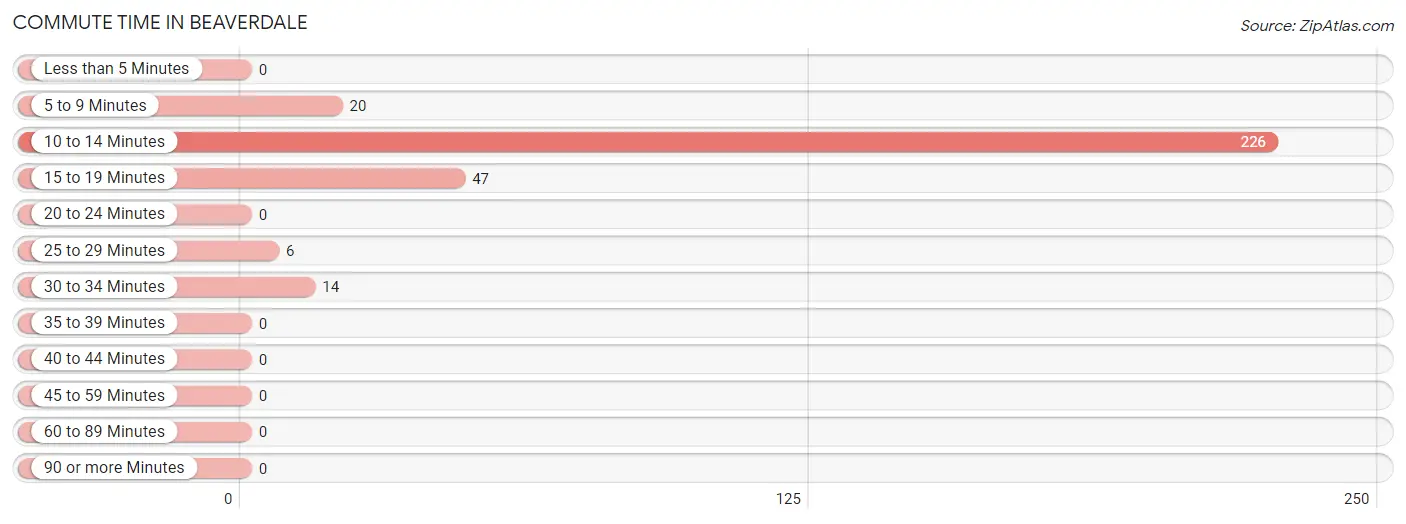
Commute Time in Beaverdale
The most frequently occuring commute durations in Beaverdale are 10 to 14 minutes (226 commuters, 72.2%), 15 to 19 minutes (47 commuters, 15.0%), and 5 to 9 minutes (20 commuters, 6.4%).
| Commute Time | # Commuters | % Commuters |
| Less than 5 Minutes | 0 | 0.0% |
| 5 to 9 Minutes | 20 | 6.4% |
| 10 to 14 Minutes | 226 | 72.2% |
| 15 to 19 Minutes | 47 | 15.0% |
| 20 to 24 Minutes | 0 | 0.0% |
| 25 to 29 Minutes | 6 | 1.9% |
| 30 to 34 Minutes | 14 | 4.5% |
| 35 to 39 Minutes | 0 | 0.0% |
| 40 to 44 Minutes | 0 | 0.0% |
| 45 to 59 Minutes | 0 | 0.0% |
| 60 to 89 Minutes | 0 | 0.0% |
| 90 or more Minutes | 0 | 0.0% |
Commute Time by Sex in Beaverdale
The most common commute times in Beaverdale are 10 to 14 minutes (48 commuters, 44.4%) for males and 10 to 14 minutes (178 commuters, 86.8%) for females.
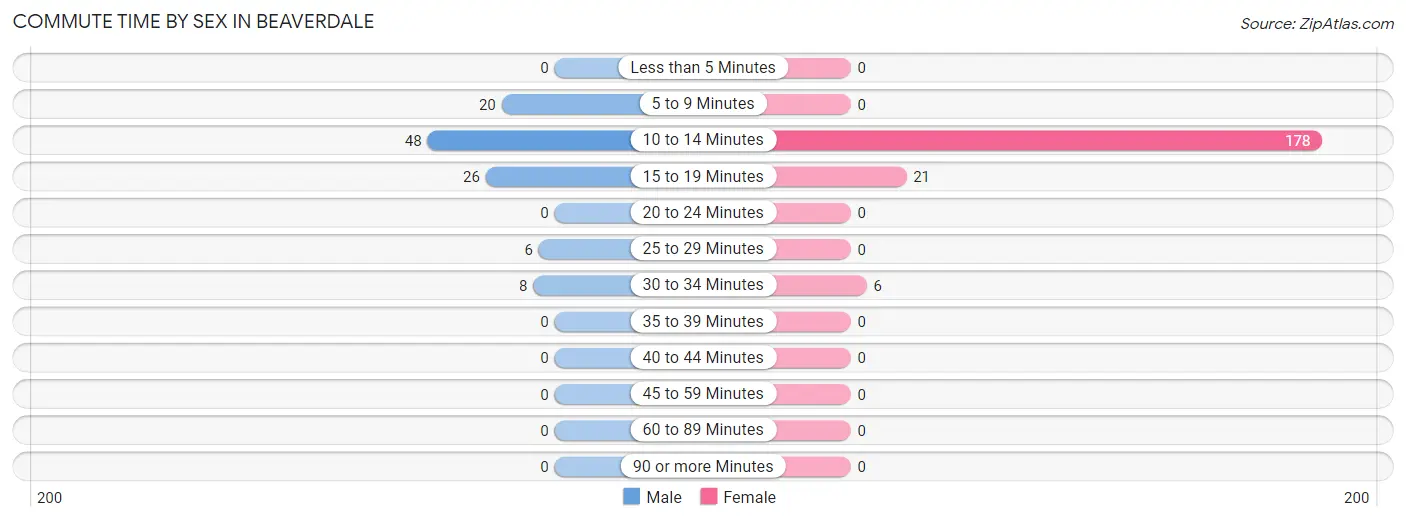
| Commute Time | Male | Female |
| Less than 5 Minutes | 0 (0.0%) | 0 (0.0%) |
| 5 to 9 Minutes | 20 (18.5%) | 0 (0.0%) |
| 10 to 14 Minutes | 48 (44.4%) | 178 (86.8%) |
| 15 to 19 Minutes | 26 (24.1%) | 21 (10.2%) |
| 20 to 24 Minutes | 0 (0.0%) | 0 (0.0%) |
| 25 to 29 Minutes | 6 (5.6%) | 0 (0.0%) |
| 30 to 34 Minutes | 8 (7.4%) | 6 (2.9%) |
| 35 to 39 Minutes | 0 (0.0%) | 0 (0.0%) |
| 40 to 44 Minutes | 0 (0.0%) | 0 (0.0%) |
| 45 to 59 Minutes | 0 (0.0%) | 0 (0.0%) |
| 60 to 89 Minutes | 0 (0.0%) | 0 (0.0%) |
| 90 or more Minutes | 0 (0.0%) | 0 (0.0%) |
Time of Departure to Work by Sex in Beaverdale
The most frequent times of departure to work in Beaverdale are 6:00 AM to 6:29 AM (35, 32.4%) for males and 10:00 AM to 10:59 AM (36, 17.6%) for females.
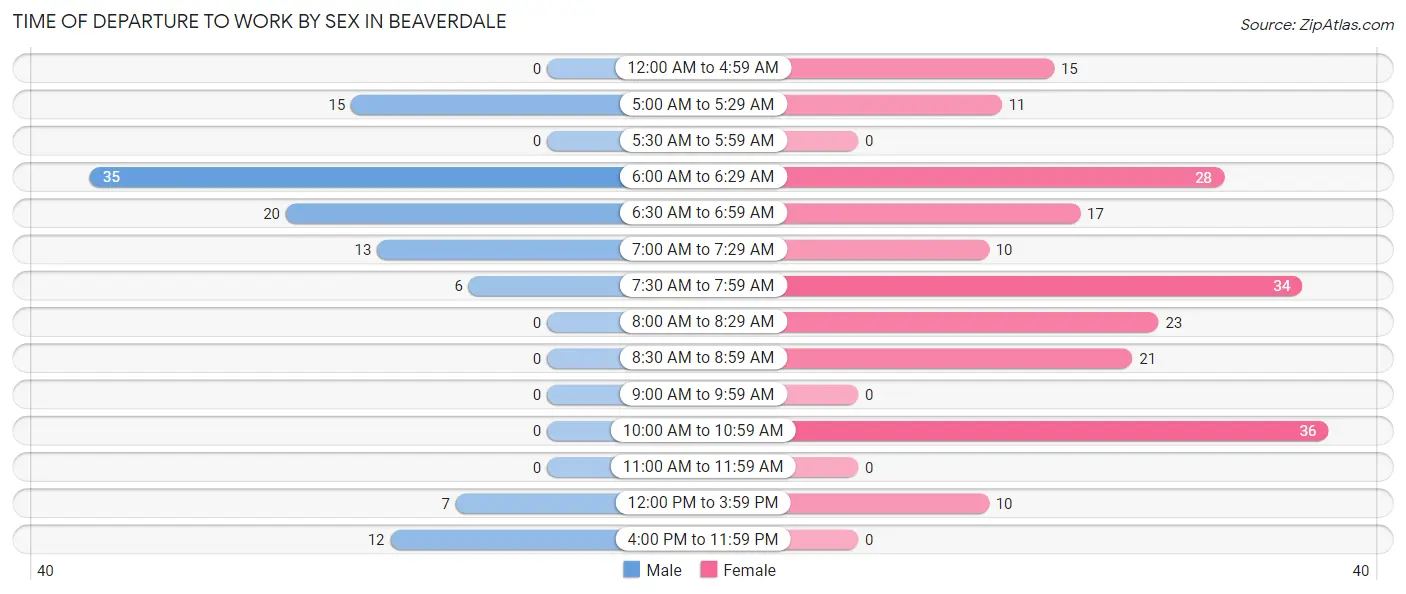
| Time of Departure | Male | Female |
| 12:00 AM to 4:59 AM | 0 (0.0%) | 15 (7.3%) |
| 5:00 AM to 5:29 AM | 15 (13.9%) | 11 (5.4%) |
| 5:30 AM to 5:59 AM | 0 (0.0%) | 0 (0.0%) |
| 6:00 AM to 6:29 AM | 35 (32.4%) | 28 (13.7%) |
| 6:30 AM to 6:59 AM | 20 (18.5%) | 17 (8.3%) |
| 7:00 AM to 7:29 AM | 13 (12.0%) | 10 (4.9%) |
| 7:30 AM to 7:59 AM | 6 (5.6%) | 34 (16.6%) |
| 8:00 AM to 8:29 AM | 0 (0.0%) | 23 (11.2%) |
| 8:30 AM to 8:59 AM | 0 (0.0%) | 21 (10.2%) |
| 9:00 AM to 9:59 AM | 0 (0.0%) | 0 (0.0%) |
| 10:00 AM to 10:59 AM | 0 (0.0%) | 36 (17.6%) |
| 11:00 AM to 11:59 AM | 0 (0.0%) | 0 (0.0%) |
| 12:00 PM to 3:59 PM | 7 (6.5%) | 10 (4.9%) |
| 4:00 PM to 11:59 PM | 12 (11.1%) | 0 (0.0%) |
| Total | 108 (100.0%) | 205 (100.0%) |
Housing Occupancy in Beaverdale
Occupancy by Ownership in Beaverdale
Of the total 328 dwellings in Beaverdale, owner-occupied units account for 296 (90.2%), while renter-occupied units make up 32 (9.8%).
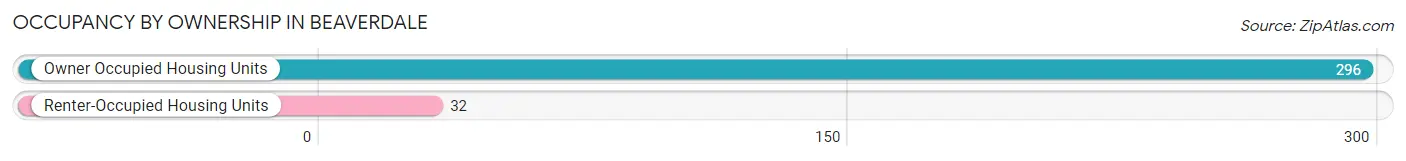
| Occupancy | # Housing Units | % Housing Units |
| Owner Occupied Housing Units | 296 | 90.2% |
| Renter-Occupied Housing Units | 32 | 9.8% |
| Total Occupied Housing Units | 328 | 100.0% |
Occupancy by Household Size in Beaverdale
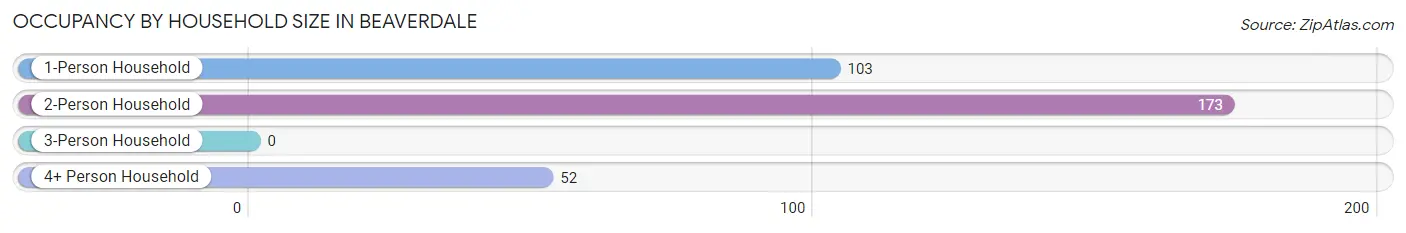
| Household Size | # Housing Units | % Housing Units |
| 1-Person Household | 103 | 31.4% |
| 2-Person Household | 173 | 52.7% |
| 3-Person Household | 0 | 0.0% |
| 4+ Person Household | 52 | 15.9% |
| Total Housing Units | 328 | 100.0% |
Occupancy by Ownership by Household Size in Beaverdale
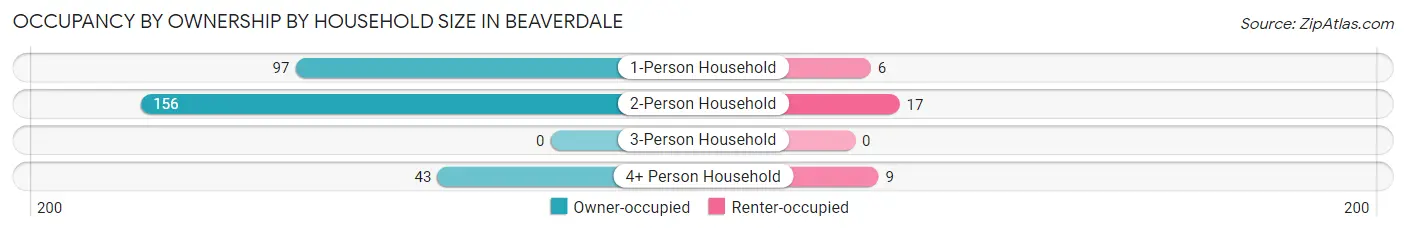
| Household Size | Owner-occupied | Renter-occupied |
| 1-Person Household | 97 (94.2%) | 6 (5.8%) |
| 2-Person Household | 156 (90.2%) | 17 (9.8%) |
| 3-Person Household | 0 (0.0%) | 0 (0.0%) |
| 4+ Person Household | 43 (82.7%) | 9 (17.3%) |
| Total Housing Units | 296 (90.2%) | 32 (9.8%) |
Occupancy by Educational Attainment in Beaverdale
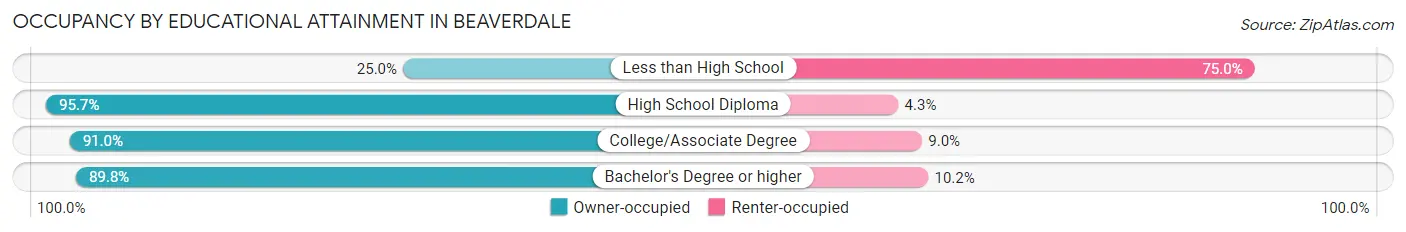
| Household Size | Owner-occupied | Renter-occupied |
| Less than High School | 3 (25.0%) | 9 (75.0%) |
| High School Diploma | 135 (95.7%) | 6 (4.3%) |
| College/Associate Degree | 61 (91.0%) | 6 (9.0%) |
| Bachelor's Degree or higher | 97 (89.8%) | 11 (10.2%) |
Occupancy by Age of Householder in Beaverdale
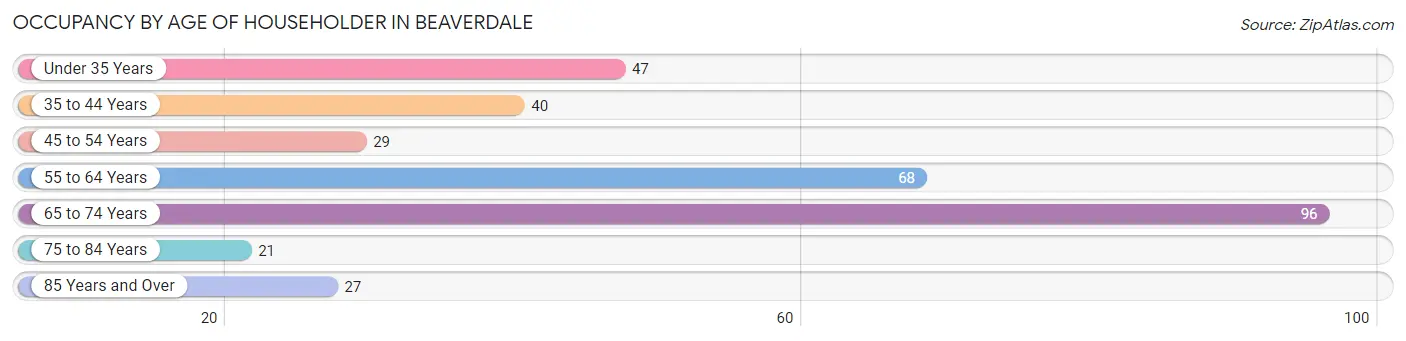
| Age Bracket | # Households | % Households |
| Under 35 Years | 47 | 14.3% |
| 35 to 44 Years | 40 | 12.2% |
| 45 to 54 Years | 29 | 8.8% |
| 55 to 64 Years | 68 | 20.7% |
| 65 to 74 Years | 96 | 29.3% |
| 75 to 84 Years | 21 | 6.4% |
| 85 Years and Over | 27 | 8.2% |
| Total | 328 | 100.0% |
Housing Finances in Beaverdale
Median Income by Occupancy in Beaverdale
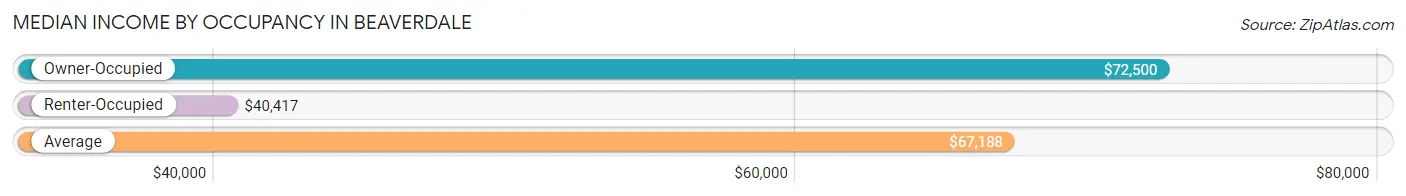
| Occupancy Type | # Households | Median Income |
| Owner-Occupied | 296 (90.2%) | $72,500 |
| Renter-Occupied | 32 (9.8%) | $40,417 |
| Average | 328 (100.0%) | $67,188 |
Occupancy by Householder Income Bracket in Beaverdale
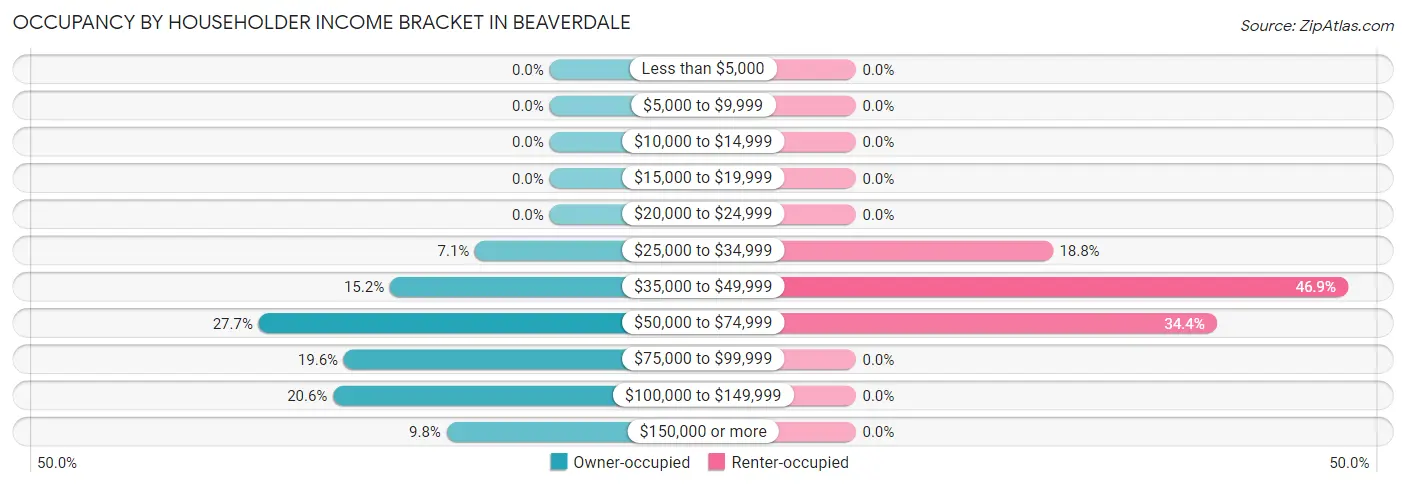
| Income Bracket | Owner-occupied | Renter-occupied |
| Less than $5,000 | 0 (0.0%) | 0 (0.0%) |
| $5,000 to $9,999 | 0 (0.0%) | 0 (0.0%) |
| $10,000 to $14,999 | 0 (0.0%) | 0 (0.0%) |
| $15,000 to $19,999 | 0 (0.0%) | 0 (0.0%) |
| $20,000 to $24,999 | 0 (0.0%) | 0 (0.0%) |
| $25,000 to $34,999 | 21 (7.1%) | 6 (18.8%) |
| $35,000 to $49,999 | 45 (15.2%) | 15 (46.9%) |
| $50,000 to $74,999 | 82 (27.7%) | 11 (34.4%) |
| $75,000 to $99,999 | 58 (19.6%) | 0 (0.0%) |
| $100,000 to $149,999 | 61 (20.6%) | 0 (0.0%) |
| $150,000 or more | 29 (9.8%) | 0 (0.0%) |
| Total | 296 (100.0%) | 32 (100.0%) |
Monthly Housing Cost Tiers in Beaverdale
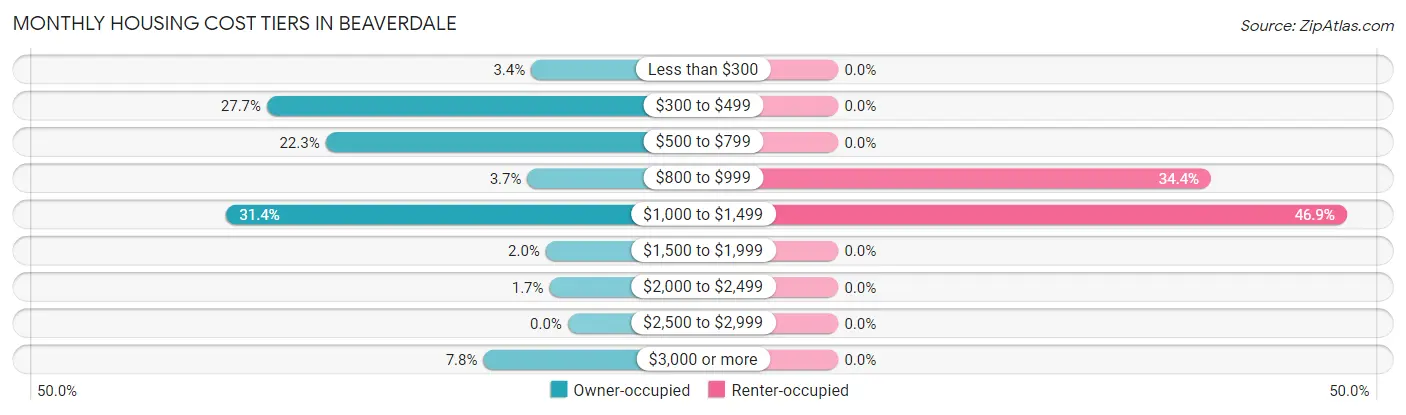
| Monthly Cost | Owner-occupied | Renter-occupied |
| Less than $300 | 10 (3.4%) | 0 (0.0%) |
| $300 to $499 | 82 (27.7%) | 0 (0.0%) |
| $500 to $799 | 66 (22.3%) | 0 (0.0%) |
| $800 to $999 | 11 (3.7%) | 11 (34.4%) |
| $1,000 to $1,499 | 93 (31.4%) | 15 (46.9%) |
| $1,500 to $1,999 | 6 (2.0%) | 0 (0.0%) |
| $2,000 to $2,499 | 5 (1.7%) | 0 (0.0%) |
| $2,500 to $2,999 | 0 (0.0%) | 0 (0.0%) |
| $3,000 or more | 23 (7.8%) | 0 (0.0%) |
| Total | 296 (100.0%) | 32 (100.0%) |
Physical Housing Characteristics in Beaverdale
Housing Structures in Beaverdale
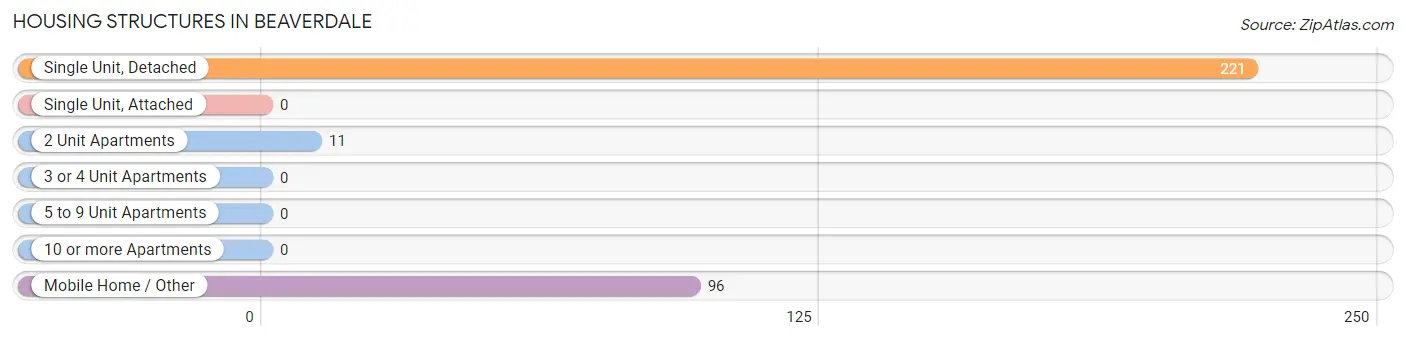
| Structure Type | # Housing Units | % Housing Units |
| Single Unit, Detached | 221 | 67.4% |
| Single Unit, Attached | 0 | 0.0% |
| 2 Unit Apartments | 11 | 3.4% |
| 3 or 4 Unit Apartments | 0 | 0.0% |
| 5 to 9 Unit Apartments | 0 | 0.0% |
| 10 or more Apartments | 0 | 0.0% |
| Mobile Home / Other | 96 | 29.3% |
| Total | 328 | 100.0% |
Housing Structures by Occupancy in Beaverdale
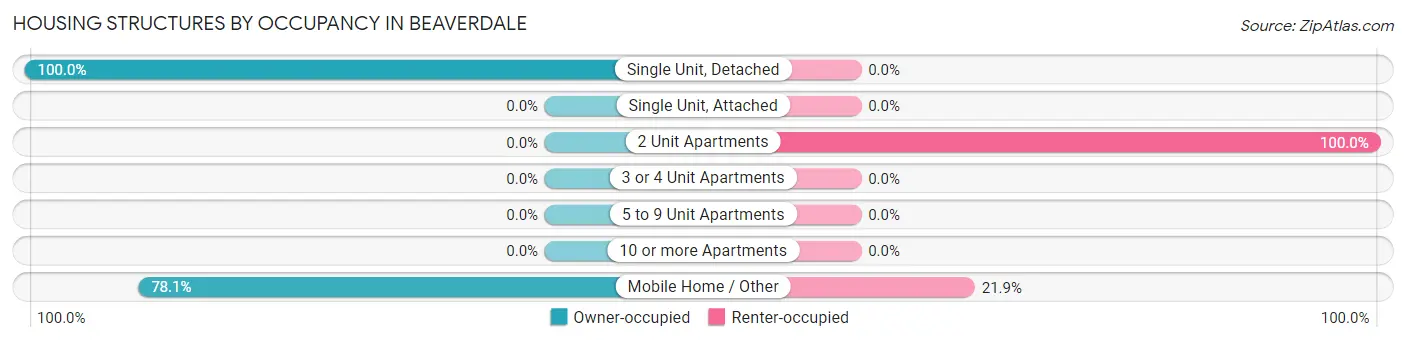
| Structure Type | Owner-occupied | Renter-occupied |
| Single Unit, Detached | 221 (100.0%) | 0 (0.0%) |
| Single Unit, Attached | 0 (0.0%) | 0 (0.0%) |
| 2 Unit Apartments | 0 (0.0%) | 11 (100.0%) |
| 3 or 4 Unit Apartments | 0 (0.0%) | 0 (0.0%) |
| 5 to 9 Unit Apartments | 0 (0.0%) | 0 (0.0%) |
| 10 or more Apartments | 0 (0.0%) | 0 (0.0%) |
| Mobile Home / Other | 75 (78.1%) | 21 (21.9%) |
| Total | 296 (90.2%) | 32 (9.8%) |
Housing Structures by Number of Rooms in Beaverdale
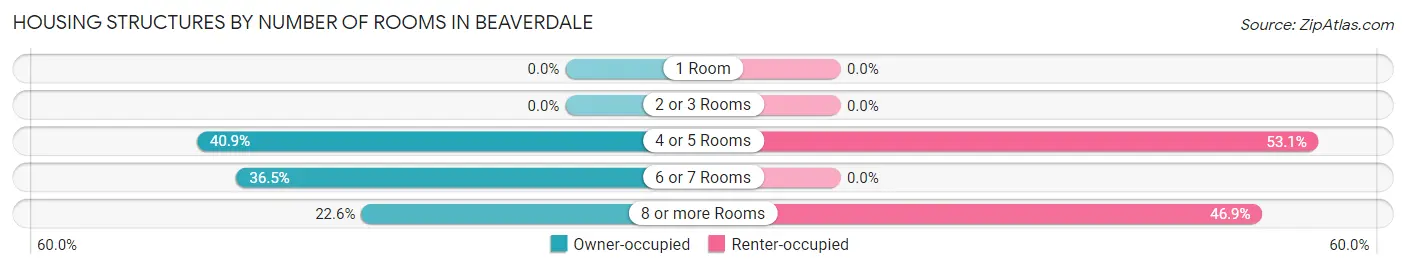
| Number of Rooms | Owner-occupied | Renter-occupied |
| 1 Room | 0 (0.0%) | 0 (0.0%) |
| 2 or 3 Rooms | 0 (0.0%) | 0 (0.0%) |
| 4 or 5 Rooms | 121 (40.9%) | 17 (53.1%) |
| 6 or 7 Rooms | 108 (36.5%) | 0 (0.0%) |
| 8 or more Rooms | 67 (22.6%) | 15 (46.9%) |
| Total | 296 (100.0%) | 32 (100.0%) |
Housing Structure by Heating Type in Beaverdale
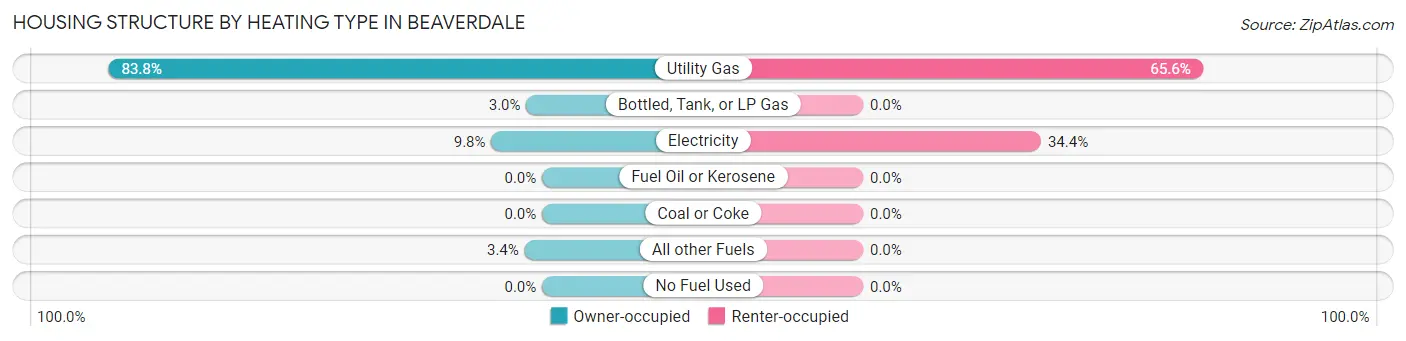
| Heating Type | Owner-occupied | Renter-occupied |
| Utility Gas | 248 (83.8%) | 21 (65.6%) |
| Bottled, Tank, or LP Gas | 9 (3.0%) | 0 (0.0%) |
| Electricity | 29 (9.8%) | 11 (34.4%) |
| Fuel Oil or Kerosene | 0 (0.0%) | 0 (0.0%) |
| Coal or Coke | 0 (0.0%) | 0 (0.0%) |
| All other Fuels | 10 (3.4%) | 0 (0.0%) |
| No Fuel Used | 0 (0.0%) | 0 (0.0%) |
| Total | 296 (100.0%) | 32 (100.0%) |
Household Vehicle Usage in Beaverdale
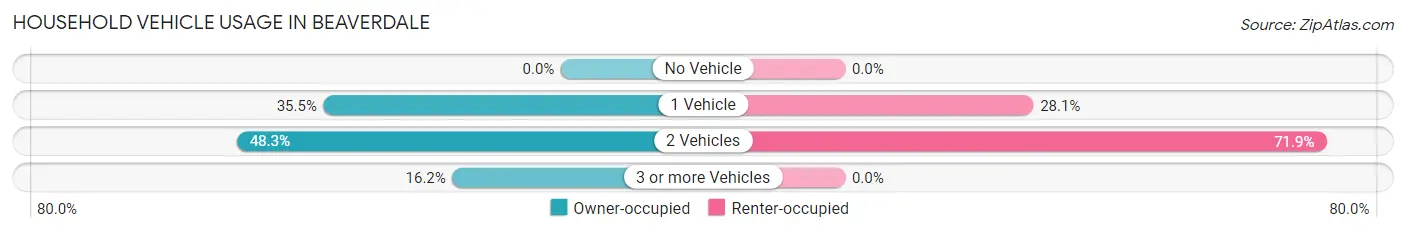
| Vehicles per Household | Owner-occupied | Renter-occupied |
| No Vehicle | 0 (0.0%) | 0 (0.0%) |
| 1 Vehicle | 105 (35.5%) | 9 (28.1%) |
| 2 Vehicles | 143 (48.3%) | 23 (71.9%) |
| 3 or more Vehicles | 48 (16.2%) | 0 (0.0%) |
| Total | 296 (100.0%) | 32 (100.0%) |
Real Estate & Mortgages in Beaverdale
Real Estate and Mortgage Overview in Beaverdale
| Characteristic | Without Mortgage | With Mortgage |
| Housing Units | 157 | 139 |
| Median Property Value | - | - |
| Median Household Income | $53,802 | $29 |
| Monthly Housing Costs | $498 | $23 |
| Real Estate Taxes | $1,653 | $6 |
Property Value by Mortgage Status in Beaverdale
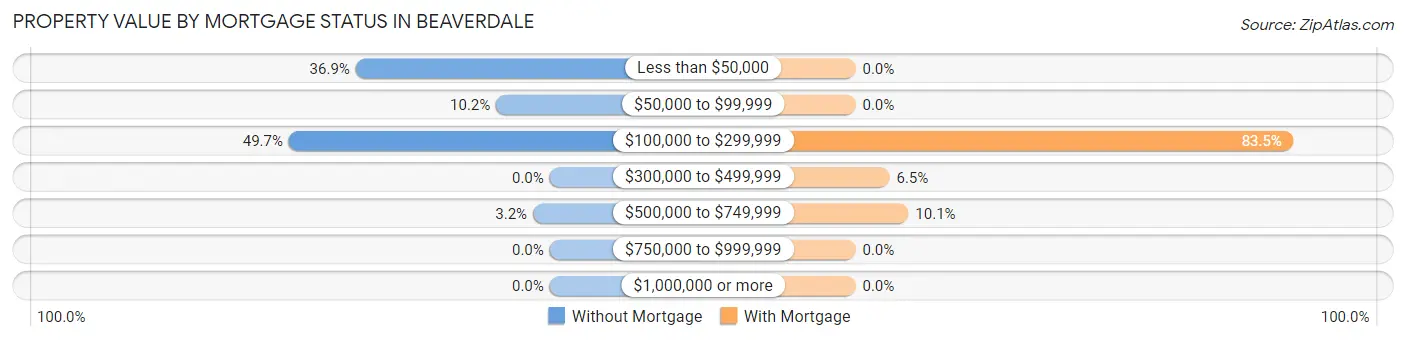
| Property Value | Without Mortgage | With Mortgage |
| Less than $50,000 | 58 (36.9%) | 0 (0.0%) |
| $50,000 to $99,999 | 16 (10.2%) | 0 (0.0%) |
| $100,000 to $299,999 | 78 (49.7%) | 116 (83.5%) |
| $300,000 to $499,999 | 0 (0.0%) | 9 (6.5%) |
| $500,000 to $749,999 | 5 (3.2%) | 14 (10.1%) |
| $750,000 to $999,999 | 0 (0.0%) | 0 (0.0%) |
| $1,000,000 or more | 0 (0.0%) | 0 (0.0%) |
| Total | 157 (100.0%) | 139 (100.0%) |
Household Income by Mortgage Status in Beaverdale
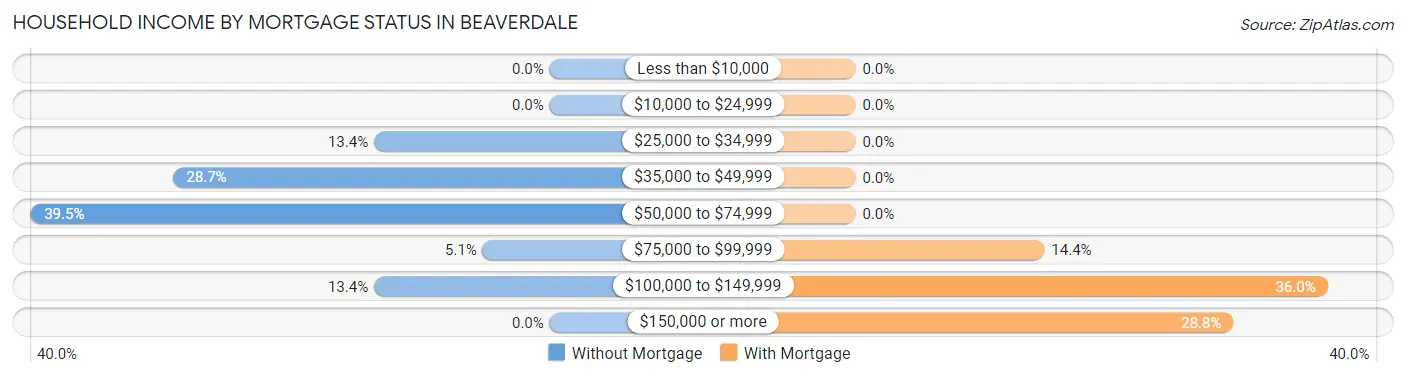
| Household Income | Without Mortgage | With Mortgage |
| Less than $10,000 | 0 (0.0%) | 0 (0.0%) |
| $10,000 to $24,999 | 0 (0.0%) | 0 (0.0%) |
| $25,000 to $34,999 | 21 (13.4%) | 0 (0.0%) |
| $35,000 to $49,999 | 45 (28.7%) | 0 (0.0%) |
| $50,000 to $74,999 | 62 (39.5%) | 0 (0.0%) |
| $75,000 to $99,999 | 8 (5.1%) | 20 (14.4%) |
| $100,000 to $149,999 | 21 (13.4%) | 50 (36.0%) |
| $150,000 or more | 0 (0.0%) | 40 (28.8%) |
| Total | 157 (100.0%) | 139 (100.0%) |
Property Value to Household Income Ratio in Beaverdale
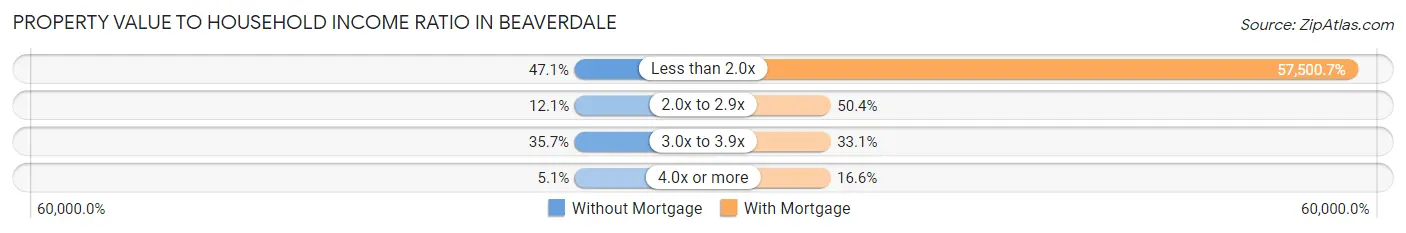
| Value-to-Income Ratio | Without Mortgage | With Mortgage |
| Less than 2.0x | 74 (47.1%) | 79,926 (57,500.7%) |
| 2.0x to 2.9x | 19 (12.1%) | 70 (50.4%) |
| 3.0x to 3.9x | 56 (35.7%) | 46 (33.1%) |
| 4.0x or more | 8 (5.1%) | 23 (16.6%) |
| Total | 157 (100.0%) | 139 (100.0%) |
Real Estate Taxes by Mortgage Status in Beaverdale
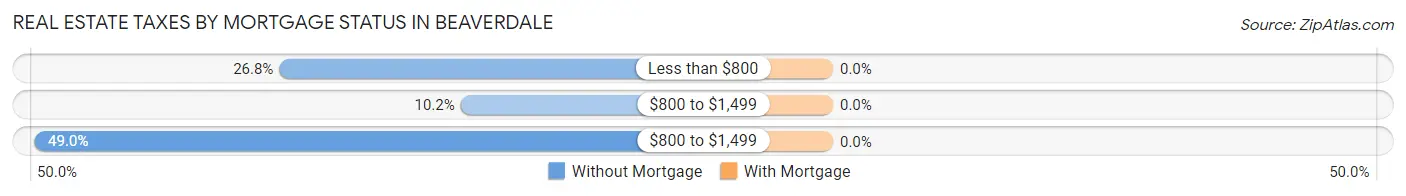
| Property Taxes | Without Mortgage | With Mortgage |
| Less than $800 | 42 (26.8%) | 0 (0.0%) |
| $800 to $1,499 | 16 (10.2%) | 0 (0.0%) |
| $800 to $1,499 | 77 (49.0%) | 0 (0.0%) |
| Total | 157 (100.0%) | 139 (100.0%) |
Health & Disability in Beaverdale
Health Insurance Coverage by Age in Beaverdale
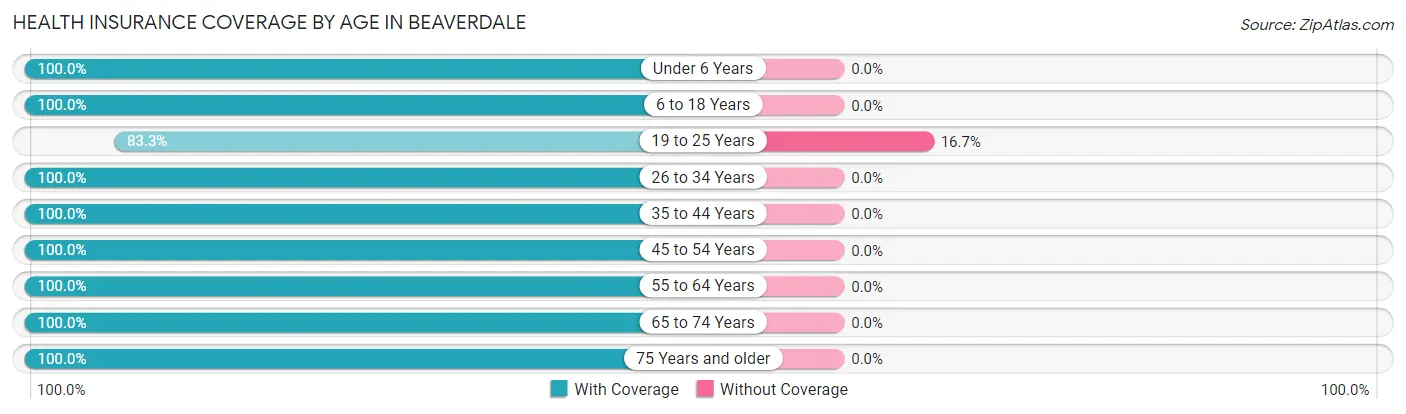
| Age Bracket | With Coverage | Without Coverage |
| Under 6 Years | 44 (100.0%) | 0 (0.0%) |
| 6 to 18 Years | 85 (100.0%) | 0 (0.0%) |
| 19 to 25 Years | 30 (83.3%) | 6 (16.7%) |
| 26 to 34 Years | 44 (100.0%) | 0 (0.0%) |
| 35 to 44 Years | 89 (100.0%) | 0 (0.0%) |
| 45 to 54 Years | 45 (100.0%) | 0 (0.0%) |
| 55 to 64 Years | 170 (100.0%) | 0 (0.0%) |
| 65 to 74 Years | 129 (100.0%) | 0 (0.0%) |
| 75 Years and older | 72 (100.0%) | 0 (0.0%) |
| Total | 708 (99.2%) | 6 (0.8%) |
Health Insurance Coverage by Citizenship Status in Beaverdale
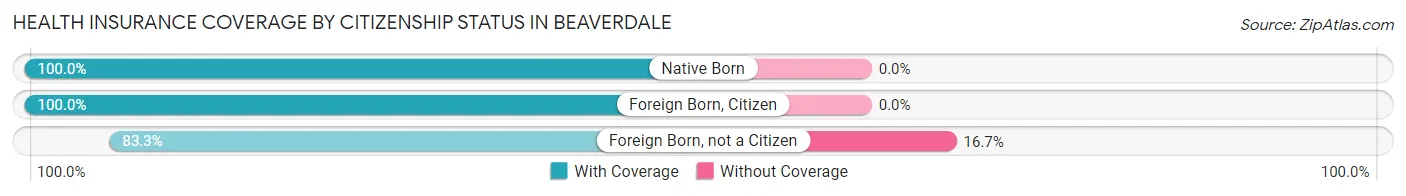
| Citizenship Status | With Coverage | Without Coverage |
| Native Born | 44 (100.0%) | 0 (0.0%) |
| Foreign Born, Citizen | 85 (100.0%) | 0 (0.0%) |
| Foreign Born, not a Citizen | 30 (83.3%) | 6 (16.7%) |
Health Insurance Coverage by Household Income in Beaverdale
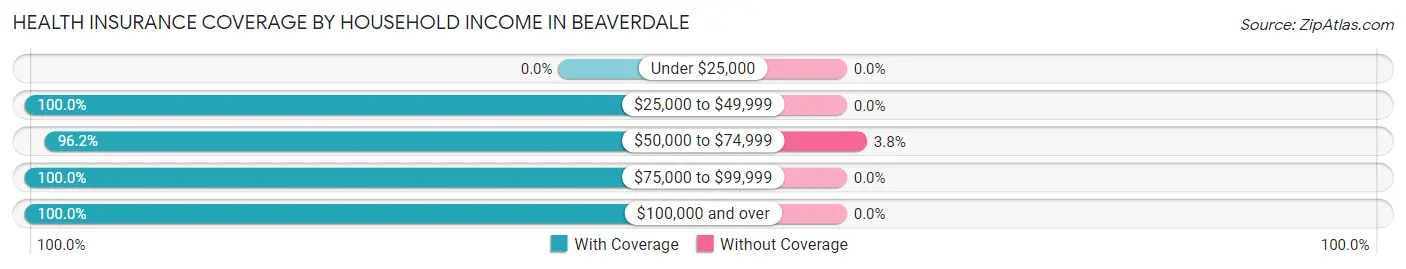
| Household Income | With Coverage | Without Coverage |
| Under $25,000 | 0 (0.0%) | 0 (0.0%) |
| $25,000 to $49,999 | 147 (100.0%) | 0 (0.0%) |
| $50,000 to $74,999 | 153 (96.2%) | 6 (3.8%) |
| $75,000 to $99,999 | 125 (100.0%) | 0 (0.0%) |
| $100,000 and over | 283 (100.0%) | 0 (0.0%) |
Public vs Private Health Insurance Coverage by Age in Beaverdale
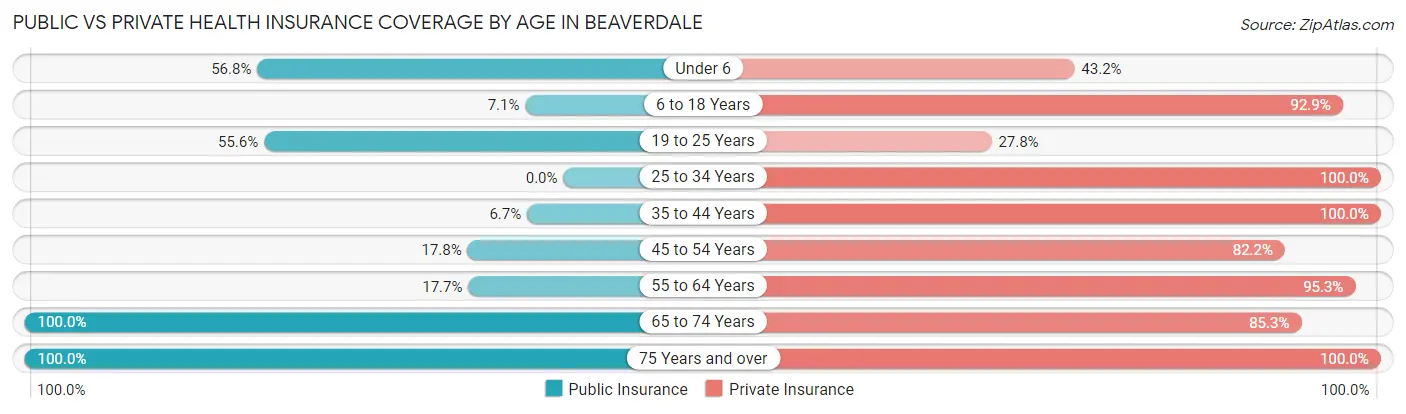
| Age Bracket | Public Insurance | Private Insurance |
| Under 6 | 25 (56.8%) | 19 (43.2%) |
| 6 to 18 Years | 6 (7.1%) | 79 (92.9%) |
| 19 to 25 Years | 20 (55.6%) | 10 (27.8%) |
| 25 to 34 Years | 0 (0.0%) | 44 (100.0%) |
| 35 to 44 Years | 6 (6.7%) | 89 (100.0%) |
| 45 to 54 Years | 8 (17.8%) | 37 (82.2%) |
| 55 to 64 Years | 30 (17.6%) | 162 (95.3%) |
| 65 to 74 Years | 129 (100.0%) | 110 (85.3%) |
| 75 Years and over | 72 (100.0%) | 72 (100.0%) |
| Total | 296 (41.5%) | 622 (87.1%) |
Disability Status by Sex by Age in Beaverdale
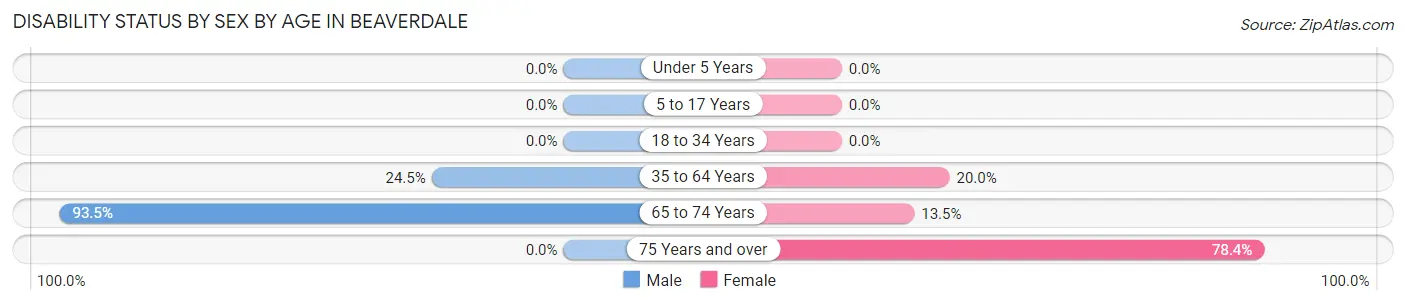
| Age Bracket | Male | Female |
| Under 5 Years | 0 (0.0%) | 0 (0.0%) |
| 5 to 17 Years | 0 (0.0%) | 0 (0.0%) |
| 18 to 34 Years | 0 (0.0%) | 0 (0.0%) |
| 35 to 64 Years | 23 (24.5%) | 42 (20.0%) |
| 65 to 74 Years | 72 (93.5%) | 7 (13.5%) |
| 75 Years and over | 0 (0.0%) | 29 (78.4%) |
Disability Class by Sex by Age in Beaverdale
Disability Class: Hearing Difficulty
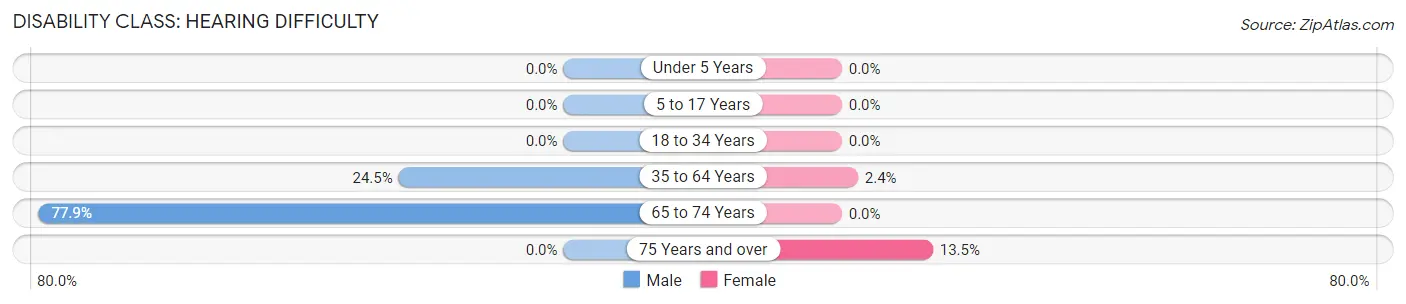
| Age Bracket | Male | Female |
| Under 5 Years | 0 (0.0%) | 0 (0.0%) |
| 5 to 17 Years | 0 (0.0%) | 0 (0.0%) |
| 18 to 34 Years | 0 (0.0%) | 0 (0.0%) |
| 35 to 64 Years | 23 (24.5%) | 5 (2.4%) |
| 65 to 74 Years | 60 (77.9%) | 0 (0.0%) |
| 75 Years and over | 0 (0.0%) | 5 (13.5%) |
Disability Class: Vision Difficulty
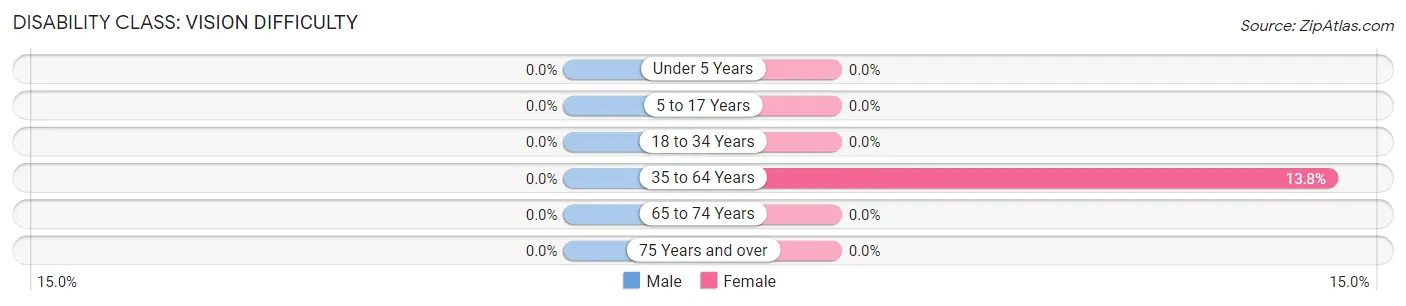
| Age Bracket | Male | Female |
| Under 5 Years | 0 (0.0%) | 0 (0.0%) |
| 5 to 17 Years | 0 (0.0%) | 0 (0.0%) |
| 18 to 34 Years | 0 (0.0%) | 0 (0.0%) |
| 35 to 64 Years | 0 (0.0%) | 29 (13.8%) |
| 65 to 74 Years | 0 (0.0%) | 0 (0.0%) |
| 75 Years and over | 0 (0.0%) | 0 (0.0%) |
Disability Class: Cognitive Difficulty
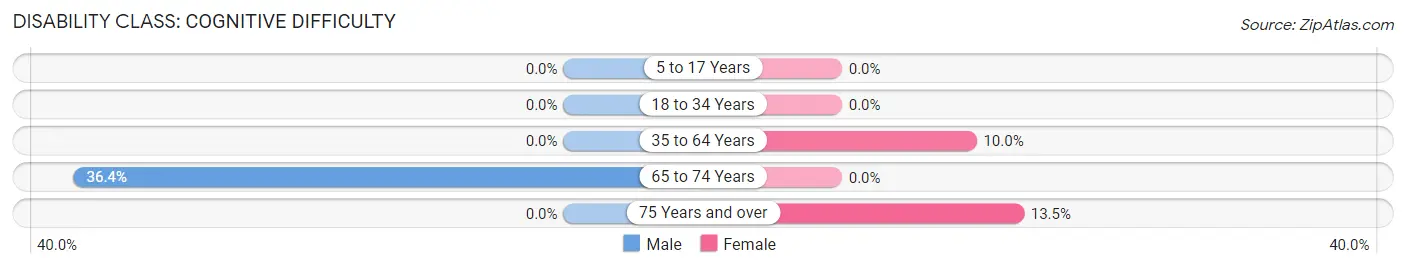
| Age Bracket | Male | Female |
| 5 to 17 Years | 0 (0.0%) | 0 (0.0%) |
| 18 to 34 Years | 0 (0.0%) | 0 (0.0%) |
| 35 to 64 Years | 0 (0.0%) | 21 (10.0%) |
| 65 to 74 Years | 28 (36.4%) | 0 (0.0%) |
| 75 Years and over | 0 (0.0%) | 5 (13.5%) |
Disability Class: Ambulatory Difficulty
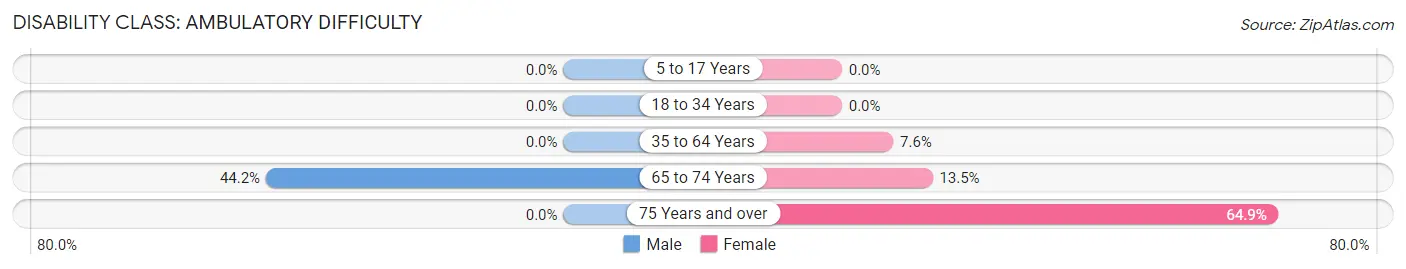
| Age Bracket | Male | Female |
| 5 to 17 Years | 0 (0.0%) | 0 (0.0%) |
| 18 to 34 Years | 0 (0.0%) | 0 (0.0%) |
| 35 to 64 Years | 0 (0.0%) | 16 (7.6%) |
| 65 to 74 Years | 34 (44.2%) | 7 (13.5%) |
| 75 Years and over | 0 (0.0%) | 24 (64.9%) |
Disability Class: Self-Care Difficulty
| Age Bracket | Male | Female |
| 5 to 17 Years | 0 (0.0%) | 0 (0.0%) |
| 18 to 34 Years | 0 (0.0%) | 0 (0.0%) |
| 35 to 64 Years | 0 (0.0%) | 0 (0.0%) |
| 65 to 74 Years | 0 (0.0%) | 0 (0.0%) |
| 75 Years and over | 0 (0.0%) | 0 (0.0%) |
Technology Access in Beaverdale
Computing Device Access in Beaverdale
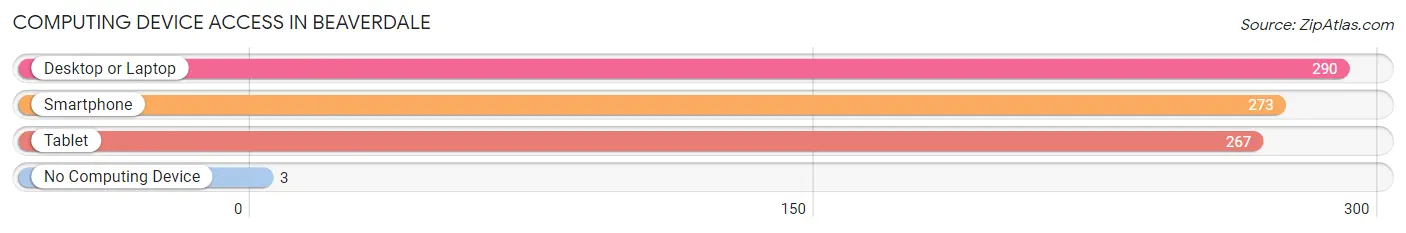
| Device Type | # Households | % Households |
| Desktop or Laptop | 290 | 88.4% |
| Smartphone | 273 | 83.2% |
| Tablet | 267 | 81.4% |
| No Computing Device | 3 | 0.9% |
| Total | 328 | 100.0% |
Internet Access in Beaverdale
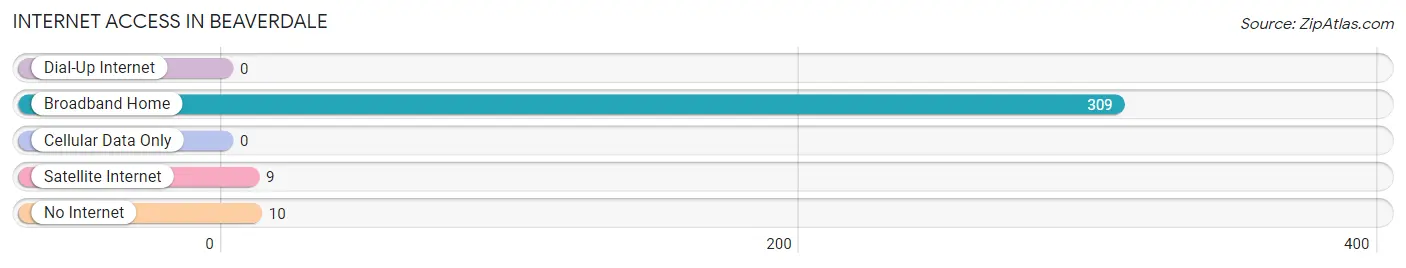
| Internet Type | # Households | % Households |
| Dial-Up Internet | 0 | 0.0% |
| Broadband Home | 309 | 94.2% |
| Cellular Data Only | 0 | 0.0% |
| Satellite Internet | 9 | 2.7% |
| No Internet | 10 | 3.0% |
| Total | 328 | 100.0% |
Beaverdale Summary
Beaverdale is a neighborhood located in Des Moines, Iowa. It is located in the northwest corner of the city, and is bordered by Merle Hay Road to the north, Hickman Road to the east, and Douglas Avenue to the south. The neighborhood is home to approximately 8,000 people, and is known for its diverse population and vibrant culture.
History
Beaverdale was first settled in the late 1800s by German and Irish immigrants. The area was originally known as “Beaverdale” due to the abundance of beaver dams in the area. The neighborhood was annexed by Des Moines in the early 1900s, and the area quickly grew in population. By the 1920s, Beaverdale had become a thriving community with a variety of businesses, churches, and schools.
Geography
Beaverdale is located in the northwest corner of Des Moines, Iowa. It is bordered by Merle Hay Road to the north, Hickman Road to the east, and Douglas Avenue to the south. The neighborhood is located in the Des Moines River Valley, and is surrounded by rolling hills and wooded areas. The area is home to several parks, including Beaverdale Park, which features a playground, picnic area, and walking trails.
Economy
Beaverdale is home to a variety of businesses, including restaurants, retail stores, and professional services. The neighborhood is also home to several industrial and manufacturing businesses, including the Des Moines Steel Company and the Des Moines Brick Company. The area is also home to several medical facilities, including the Mercy Medical Center and the Iowa Methodist Medical Center.
Demographics
Beaverdale is a diverse neighborhood, with a population of approximately 8,000 people. The area is home to a variety of ethnic and racial groups, including African Americans, Hispanics, Asians, and Native Americans. The median household income in Beaverdale is $45,000, and the median home value is $150,000. The area is also home to a variety of religious institutions, including churches, synagogues, and mosques.
Beaverdale is a vibrant and diverse neighborhood located in Des Moines, Iowa. The area is home to a variety of businesses, churches, and schools, and is known for its diverse population and vibrant culture. The area is also home to several parks, medical facilities, and industrial businesses, making it a great place to live and work.
Common Questions
What is Per Capita Income in Beaverdale?
Per Capita income in Beaverdale is $43,555.
What is the Median Family Income in Beaverdale?
Median Family Income in Beaverdale is $76,894.
What is the Median Household income in Beaverdale?
Median Household Income in Beaverdale is $67,188.
What is Income or Wage Gap in Beaverdale?
Income or Wage Gap in Beaverdale is 23.2%.
Women in Beaverdale earn 76.8 cents for every dollar earned by a man.
What is Inequality or Gini Index in Beaverdale?
Inequality or Gini Index in Beaverdale is 0.38.
What is the Total Population of Beaverdale?
Total Population of Beaverdale is 714.
What is the Total Male Population of Beaverdale?
Total Male Population of Beaverdale is 301.
What is the Total Female Population of Beaverdale?
Total Female Population of Beaverdale is 413.
What is the Ratio of Males per 100 Females in Beaverdale?
There are 72.88 Males per 100 Females in Beaverdale.
What is the Ratio of Females per 100 Males in Beaverdale?
There are 137.21 Females per 100 Males in Beaverdale.
What is the Median Population Age in Beaverdale?
Median Population Age in Beaverdale is 56.6 Years.
What is the Average Family Size in Beaverdale
Average Family Size in Beaverdale is 2.7 People.
What is the Average Household Size in Beaverdale
Average Household Size in Beaverdale is 2.2 People.
How Large is the Labor Force in Beaverdale?
There are 327 People in the Labor Forcein in Beaverdale.
What is the Percentage of People in the Labor Force in Beaverdale?
54.2% of People are in the Labor Force in Beaverdale.
What is the Unemployment Rate in Beaverdale?
Unemployment Rate in Beaverdale is 4.3%.