Shelby, MT Map & Demographics
Shelby Map
Shelby Overview
$30,341
PER CAPITA INCOME
$83,750
AVG FAMILY INCOME
$51,667
AVG HOUSEHOLD INCOME
43.2%
WAGE / INCOME GAP [ % ]
56.8¢/ $1
WAGE / INCOME GAP [ $ ]
0.46
INEQUALITY / GINI INDEX
3,058
TOTAL POPULATION
1,865
MALE POPULATION
1,193
FEMALE POPULATION
156.33
MALES / 100 FEMALES
63.97
FEMALES / 100 MALES
42.7
MEDIAN AGE
3.0
AVG FAMILY SIZE
2.2
AVG HOUSEHOLD SIZE
1,279
LABOR FORCE [ PEOPLE ]
47.7%
PERCENT IN LABOR FORCE
1.3%
UNEMPLOYMENT RATE
Shelby Zip Codes
Shelby Area Codes
Income in Shelby
Income Overview in Shelby
Per Capita Income in Shelby is $30,341, while median incomes of families and households are $83,750 and $51,667 respectively.
| Characteristic | Number | Measure |
| Per Capita Income | 3,058 | $30,341 |
| Median Family Income | 602 | $83,750 |
| Mean Family Income | 602 | $108,429 |
| Median Household Income | 1,126 | $51,667 |
| Mean Household Income | 1,126 | $75,164 |
| Income Deficit | 602 | $0 |
| Wage / Income Gap (%) | 3,058 | 43.25% |
| Wage / Income Gap ($) | 3,058 | 56.75¢ per $1 |
| Gini / Inequality Index | 3,058 | 0.46 |
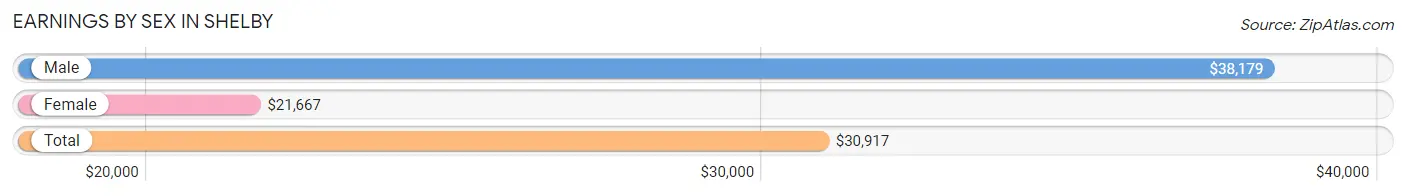
Earnings by Sex in Shelby
Average Earnings in Shelby are $30,917, $38,179 for men and $21,667 for women, a difference of 43.2%.
| Sex | Number | Average Earnings |
| Male | 825 (59.6%) | $38,179 |
| Female | 560 (40.4%) | $21,667 |
| Total | 1,385 (100.0%) | $30,917 |
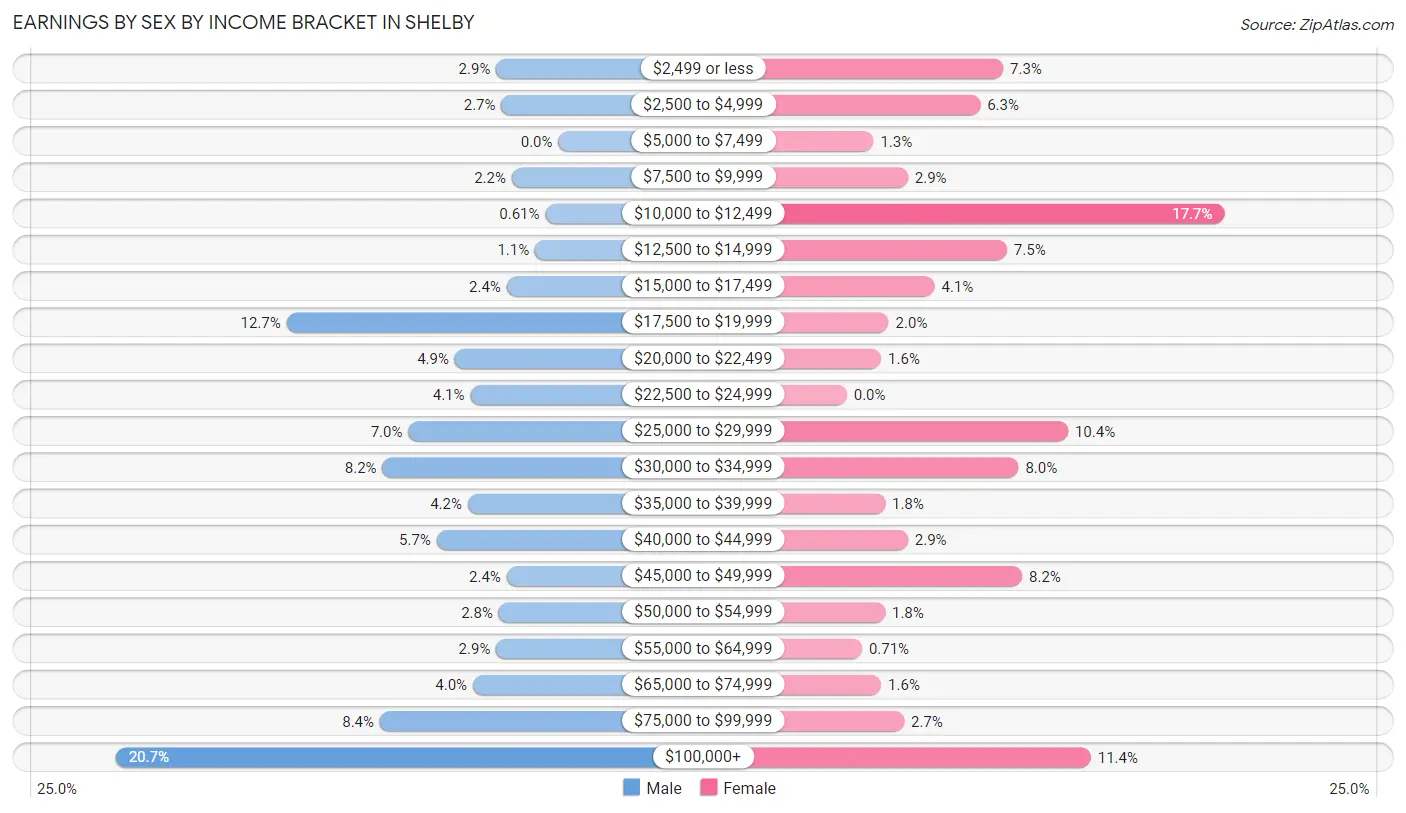
Earnings by Sex by Income Bracket in Shelby
The most common earnings brackets in Shelby are $100,000+ for men (171 | 20.7%) and $10,000 to $12,499 for women (99 | 17.7%).
| Income | Male | Female |
| $2,499 or less | 24 (2.9%) | 41 (7.3%) |
| $2,500 to $4,999 | 22 (2.7%) | 35 (6.2%) |
| $5,000 to $7,499 | 0 (0.0%) | 7 (1.3%) |
| $7,500 to $9,999 | 18 (2.2%) | 16 (2.9%) |
| $10,000 to $12,499 | 5 (0.6%) | 99 (17.7%) |
| $12,500 to $14,999 | 9 (1.1%) | 42 (7.5%) |
| $15,000 to $17,499 | 20 (2.4%) | 23 (4.1%) |
| $17,500 to $19,999 | 105 (12.7%) | 11 (2.0%) |
| $20,000 to $22,499 | 40 (4.9%) | 9 (1.6%) |
| $22,500 to $24,999 | 34 (4.1%) | 0 (0.0%) |
| $25,000 to $29,999 | 58 (7.0%) | 58 (10.4%) |
| $30,000 to $34,999 | 68 (8.2%) | 45 (8.0%) |
| $35,000 to $39,999 | 35 (4.2%) | 10 (1.8%) |
| $40,000 to $44,999 | 47 (5.7%) | 16 (2.9%) |
| $45,000 to $49,999 | 20 (2.4%) | 46 (8.2%) |
| $50,000 to $54,999 | 23 (2.8%) | 10 (1.8%) |
| $55,000 to $64,999 | 24 (2.9%) | 4 (0.7%) |
| $65,000 to $74,999 | 33 (4.0%) | 9 (1.6%) |
| $75,000 to $99,999 | 69 (8.4%) | 15 (2.7%) |
| $100,000+ | 171 (20.7%) | 64 (11.4%) |
| Total | 825 (100.0%) | 560 (100.0%) |
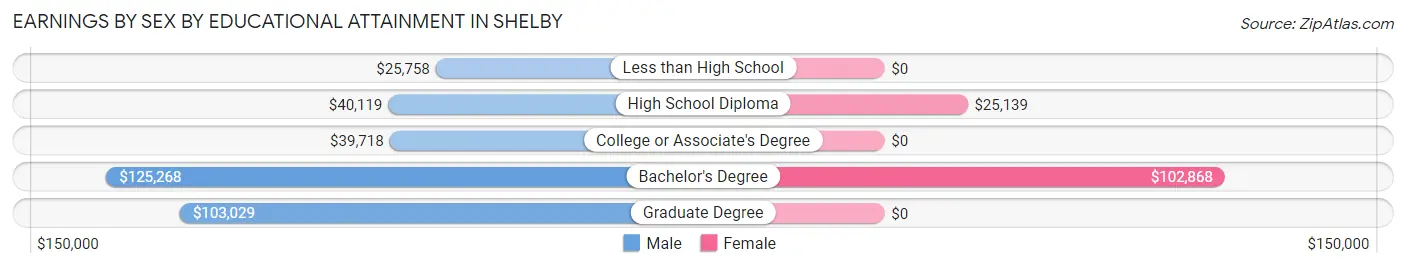
Earnings by Sex by Educational Attainment in Shelby
Average earnings in Shelby are $44,327 for men and $27,361 for women, a difference of 38.3%. Men with an educational attainment of bachelor's degree enjoy the highest average annual earnings of $125,268, while those with less than high school education earn the least with $25,758. Women with an educational attainment of bachelor's degree earn the most with the average annual earnings of $102,868, while those with high school diploma education have the smallest earnings of $25,139.
| Educational Attainment | Male Income | Female Income |
| Less than High School | $25,758 | $0 |
| High School Diploma | $40,119 | $25,139 |
| College or Associate's Degree | $39,718 | $0 |
| Bachelor's Degree | $125,268 | $102,868 |
| Graduate Degree | $103,029 | $0 |
| Total | $44,327 | $27,361 |
Family Income in Shelby
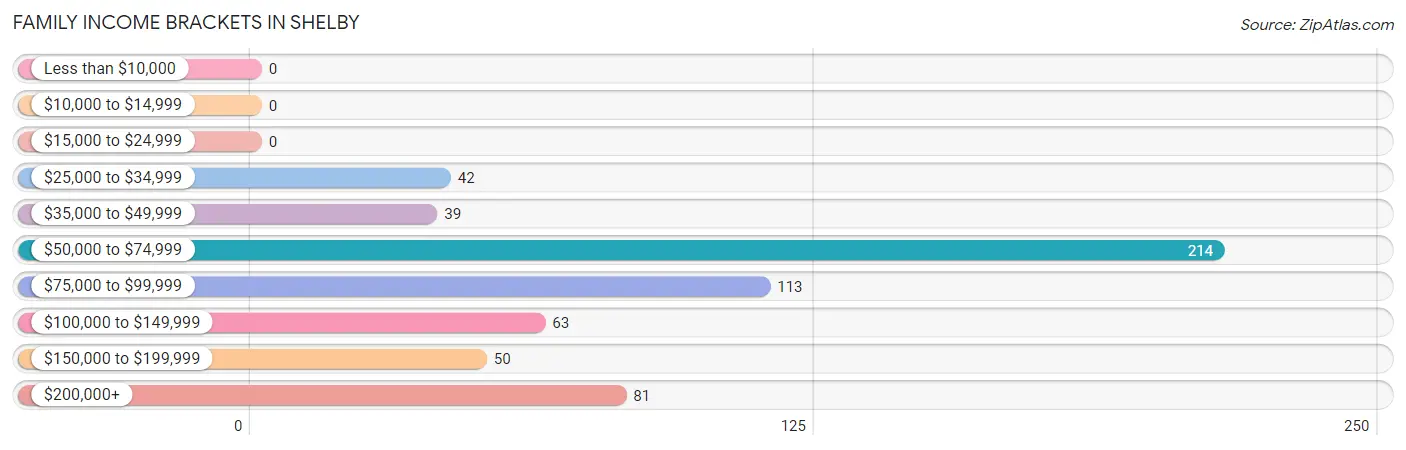
Family Income Brackets in Shelby
According to the Shelby family income data, there are 214 families falling into the $50,000 to $74,999 income range, which is the most common income bracket and makes up 35.5% of all families.
| Income Bracket | # Families | % Families |
| Less than $10,000 | 0 | 0.0% |
| $10,000 to $14,999 | 0 | 0.0% |
| $15,000 to $24,999 | 0 | 0.0% |
| $25,000 to $34,999 | 42 | 7.0% |
| $35,000 to $49,999 | 39 | 6.5% |
| $50,000 to $74,999 | 214 | 35.5% |
| $75,000 to $99,999 | 113 | 18.8% |
| $100,000 to $149,999 | 63 | 10.5% |
| $150,000 to $199,999 | 50 | 8.3% |
| $200,000+ | 81 | 13.5% |
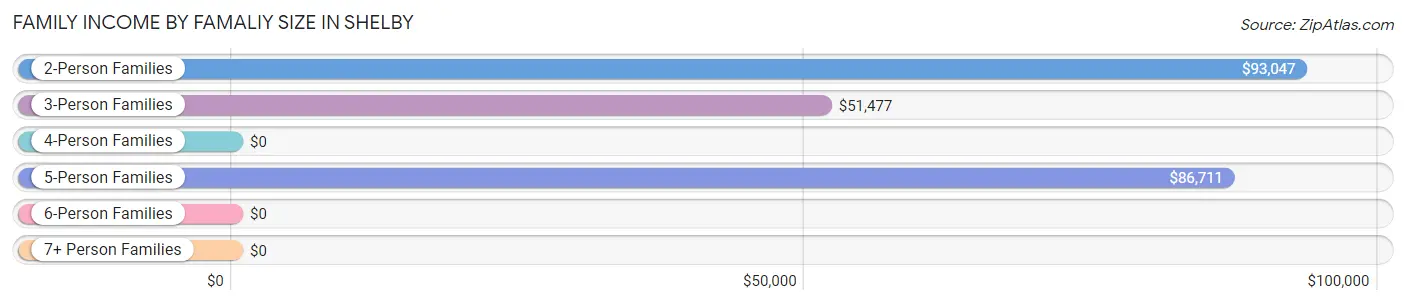
Family Income by Famaliy Size in Shelby
2-person families (315 | 52.3%) account for the highest median family income in Shelby with $93,047 per family, while 2-person families (315 | 52.3%) have the highest median income of $46,524 per family member.
| Income Bracket | # Families | Median Income |
| 2-Person Families | 315 (52.3%) | $93,047 |
| 3-Person Families | 131 (21.8%) | $51,477 |
| 4-Person Families | 46 (7.6%) | $0 |
| 5-Person Families | 104 (17.3%) | $86,711 |
| 6-Person Families | 6 (1.0%) | $0 |
| 7+ Person Families | 0 (0.0%) | $0 |
| Total | 602 (100.0%) | $83,750 |
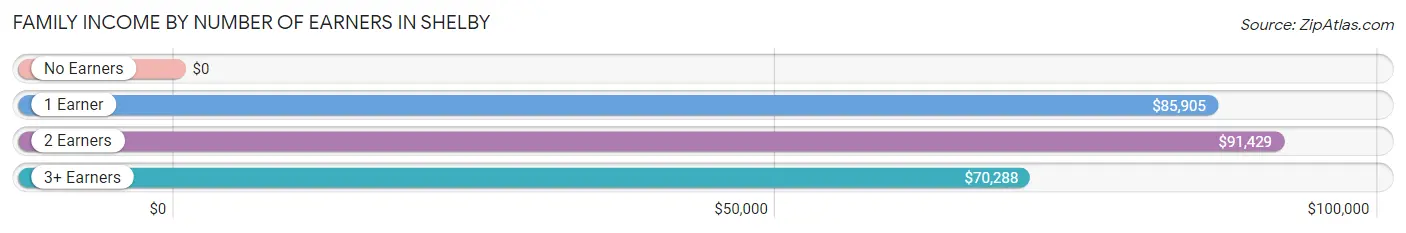
Family Income by Number of Earners in Shelby
| Number of Earners | # Families | Median Income |
| No Earners | 46 (7.6%) | $0 |
| 1 Earner | 209 (34.7%) | $85,905 |
| 2 Earners | 294 (48.8%) | $91,429 |
| 3+ Earners | 53 (8.8%) | $70,288 |
| Total | 602 (100.0%) | $83,750 |
Household Income in Shelby
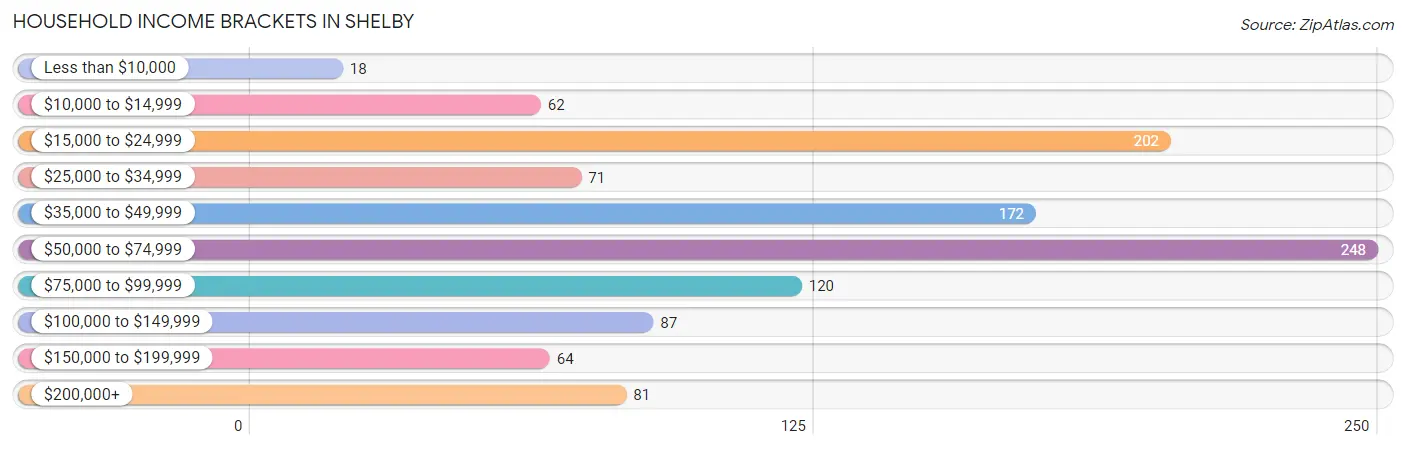
Household Income Brackets in Shelby
With 248 households falling in the category, the $50,000 to $74,999 income range is the most frequent in Shelby, accounting for 22.0% of all households. In contrast, only 18 households (1.6%) fall into the less than $10,000 income bracket, making it the least populous group.
| Income Bracket | # Households | % Households |
| Less than $10,000 | 18 | 1.6% |
| $10,000 to $14,999 | 62 | 5.5% |
| $15,000 to $24,999 | 202 | 17.9% |
| $25,000 to $34,999 | 71 | 6.3% |
| $35,000 to $49,999 | 172 | 15.3% |
| $50,000 to $74,999 | 248 | 22.0% |
| $75,000 to $99,999 | 120 | 10.7% |
| $100,000 to $149,999 | 87 | 7.7% |
| $150,000 to $199,999 | 64 | 5.7% |
| $200,000+ | 81 | 7.2% |
Household Income by Householder Age in Shelby
The median household income in Shelby is $51,667, with the highest median household income of $57,313 found in the 45 to 64 years age bracket for the primary householder. A total of 355 households (31.5%) fall into this category. Meanwhile, the 15 to 24 years age bracket for the primary householder has the lowest median household income of $0, with 24 households (2.1%) in this group.
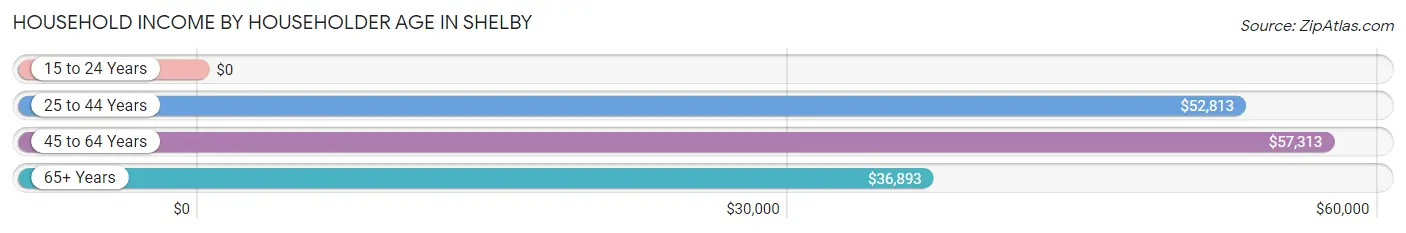
| Income Bracket | # Households | Median Income |
| 15 to 24 Years | 24 (2.1%) | $0 |
| 25 to 44 Years | 372 (33.0%) | $52,813 |
| 45 to 64 Years | 355 (31.5%) | $57,313 |
| 65+ Years | 375 (33.3%) | $36,893 |
| Total | 1,126 (100.0%) | $51,667 |
Poverty in Shelby
Income Below Poverty by Sex and Age in Shelby
With 5.5% poverty level for males and 13.4% for females among the residents of Shelby, 15 year old males and 35 to 44 year old females are the most vulnerable to poverty, with 10 males (100.0%) and 67 females (47.2%) in their respective age groups living below the poverty level.
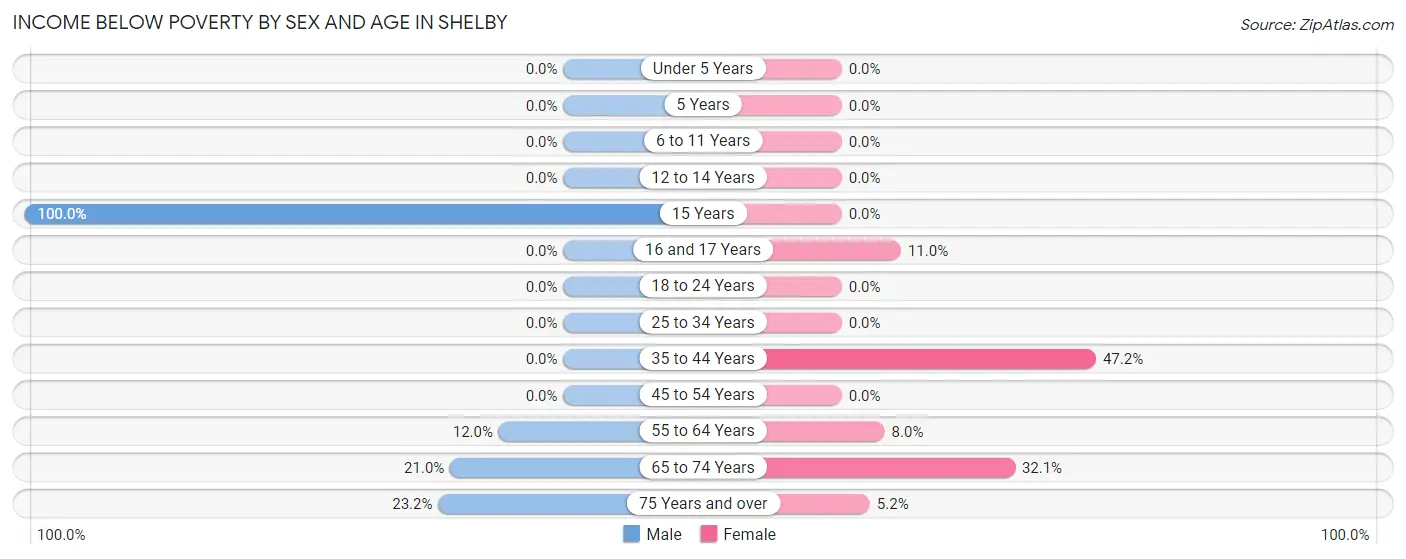
| Age Bracket | Male | Female |
| Under 5 Years | 0 (0.0%) | 0 (0.0%) |
| 5 Years | 0 (0.0%) | 0 (0.0%) |
| 6 to 11 Years | 0 (0.0%) | 0 (0.0%) |
| 12 to 14 Years | 0 (0.0%) | 0 (0.0%) |
| 15 Years | 10 (100.0%) | 0 (0.0%) |
| 16 and 17 Years | 0 (0.0%) | 10 (11.0%) |
| 18 to 24 Years | 0 (0.0%) | 0 (0.0%) |
| 25 to 34 Years | 0 (0.0%) | 0 (0.0%) |
| 35 to 44 Years | 0 (0.0%) | 67 (47.2%) |
| 45 to 54 Years | 0 (0.0%) | 0 (0.0%) |
| 55 to 64 Years | 23 (12.0%) | 18 (8.0%) |
| 65 to 74 Years | 25 (21.0%) | 54 (32.1%) |
| 75 Years and over | 13 (23.2%) | 7 (5.2%) |
| Total | 71 (5.5%) | 156 (13.4%) |
Income Above Poverty by Sex and Age in Shelby
According to the poverty statistics in Shelby, males aged under 5 years and females aged under 5 years are the age groups that are most secure financially, with 100.0% of males and 100.0% of females in these age groups living above the poverty line.
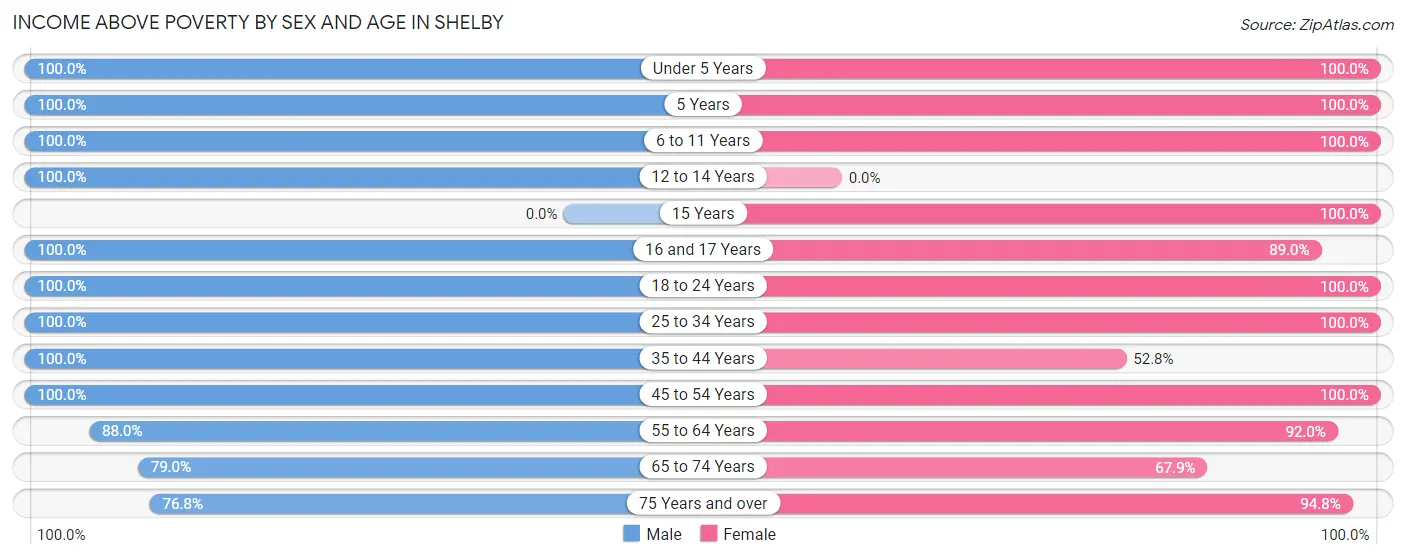
| Age Bracket | Male | Female |
| Under 5 Years | 59 (100.0%) | 62 (100.0%) |
| 5 Years | 36 (100.0%) | 10 (100.0%) |
| 6 to 11 Years | 78 (100.0%) | 39 (100.0%) |
| 12 to 14 Years | 54 (100.0%) | 0 (0.0%) |
| 15 Years | 0 (0.0%) | 27 (100.0%) |
| 16 and 17 Years | 11 (100.0%) | 81 (89.0%) |
| 18 to 24 Years | 115 (100.0%) | 56 (100.0%) |
| 25 to 34 Years | 194 (100.0%) | 129 (100.0%) |
| 35 to 44 Years | 228 (100.0%) | 75 (52.8%) |
| 45 to 54 Years | 140 (100.0%) | 84 (100.0%) |
| 55 to 64 Years | 169 (88.0%) | 208 (92.0%) |
| 65 to 74 Years | 94 (79.0%) | 114 (67.9%) |
| 75 Years and over | 43 (76.8%) | 127 (94.8%) |
| Total | 1,221 (94.5%) | 1,012 (86.6%) |
Income Below Poverty Among Married-Couple Families in Shelby
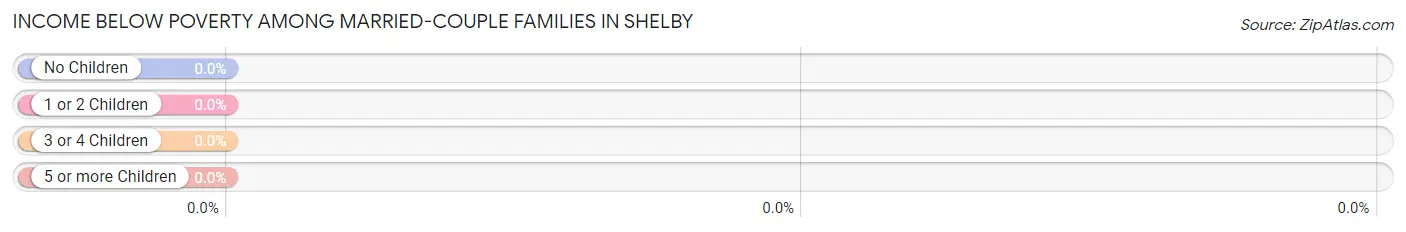
| Children | Above Poverty | Below Poverty |
| No Children | 374 (100.0%) | 0 (0.0%) |
| 1 or 2 Children | 87 (100.0%) | 0 (0.0%) |
| 3 or 4 Children | 110 (100.0%) | 0 (0.0%) |
| 5 or more Children | 0 (0.0%) | 0 (0.0%) |
| Total | 571 (100.0%) | 0 (0.0%) |
Income Below Poverty Among Single-Parent Households in Shelby
| Children | Single Father | Single Mother |
| No Children | 0 (0.0%) | 0 (0.0%) |
| 1 or 2 Children | 0 (0.0%) | 0 (0.0%) |
| 3 or 4 Children | 0 (0.0%) | 0 (0.0%) |
| 5 or more Children | 0 (0.0%) | 0 (0.0%) |
| Total | 0 (0.0%) | 0 (0.0%) |
Income Below Poverty Among Married-Couple vs Single-Parent Households in Shelby
| Children | Married-Couple Families | Single-Parent Households |
| No Children | 0 (0.0%) | 0 (0.0%) |
| 1 or 2 Children | 0 (0.0%) | 0 (0.0%) |
| 3 or 4 Children | 0 (0.0%) | 0 (0.0%) |
| 5 or more Children | 0 (0.0%) | 0 (0.0%) |
| Total | 0 (0.0%) | 0 (0.0%) |
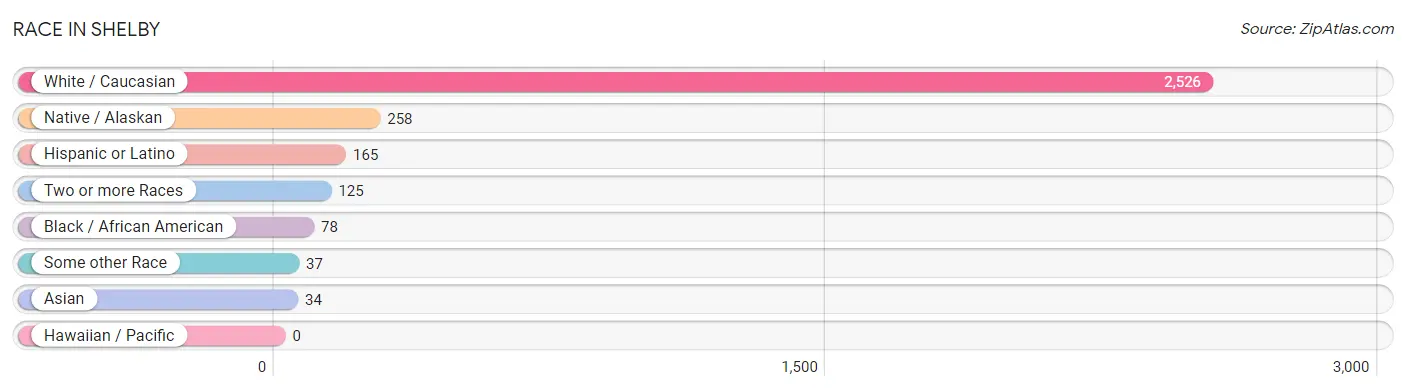
Race in Shelby
The most populous races in Shelby are White / Caucasian (2,526 | 82.6%), Native / Alaskan (258 | 8.4%), and Hispanic or Latino (165 | 5.4%).
| Race | # Population | % Population |
| Asian | 34 | 1.1% |
| Black / African American | 78 | 2.5% |
| Hawaiian / Pacific | 0 | 0.0% |
| Hispanic or Latino | 165 | 5.4% |
| Native / Alaskan | 258 | 8.4% |
| White / Caucasian | 2,526 | 82.6% |
| Two or more Races | 125 | 4.1% |
| Some other Race | 37 | 1.2% |
| Total | 3,058 | 100.0% |
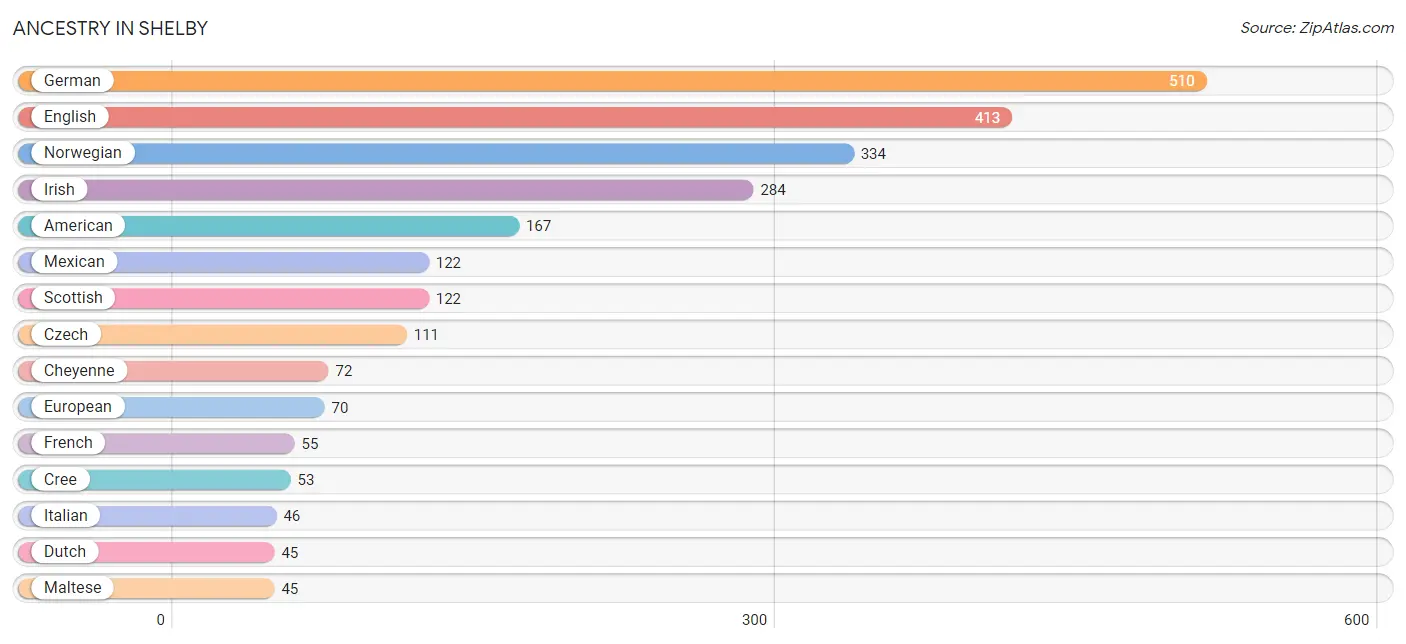
Ancestry in Shelby
The most populous ancestries reported in Shelby are German (510 | 16.7%), English (413 | 13.5%), Norwegian (334 | 10.9%), Irish (284 | 9.3%), and American (167 | 5.5%), together accounting for 55.9% of all Shelby residents.
| Ancestry | # Population | % Population |
| African | 18 | 0.6% |
| American | 167 | 5.5% |
| Arapaho | 4 | 0.1% |
| Blackfeet | 38 | 1.2% |
| Canadian | 11 | 0.4% |
| Central American Indian | 7 | 0.2% |
| Cherokee | 11 | 0.4% |
| Cheyenne | 72 | 2.4% |
| Chippewa | 34 | 1.1% |
| Cree | 53 | 1.7% |
| Crow | 19 | 0.6% |
| Czech | 111 | 3.6% |
| Danish | 19 | 0.6% |
| Dutch | 45 | 1.5% |
| English | 413 | 13.5% |
| European | 70 | 2.3% |
| Finnish | 5 | 0.2% |
| French | 55 | 1.8% |
| French Canadian | 24 | 0.8% |
| German | 510 | 16.7% |
| Greek | 6 | 0.2% |
| Indian (Asian) | 25 | 0.8% |
| Irish | 284 | 9.3% |
| Italian | 46 | 1.5% |
| Korean | 9 | 0.3% |
| Maltese | 45 | 1.5% |
| Menominee | 23 | 0.7% |
| Mexican | 122 | 4.0% |
| Navajo | 5 | 0.2% |
| Nigerian | 5 | 0.2% |
| Norwegian | 334 | 10.9% |
| Osage | 6 | 0.2% |
| Polish | 14 | 0.5% |
| Scandinavian | 11 | 0.4% |
| Scotch-Irish | 15 | 0.5% |
| Scottish | 122 | 4.0% |
| Sioux | 5 | 0.2% |
| Subsaharan African | 23 | 0.7% |
| Swedish | 21 | 0.7% |
| Swiss | 8 | 0.3% |
| Thai | 30 | 1.0% |
| Ukrainian | 34 | 1.1% |
| Welsh | 15 | 0.5% | View All 43 Rows |
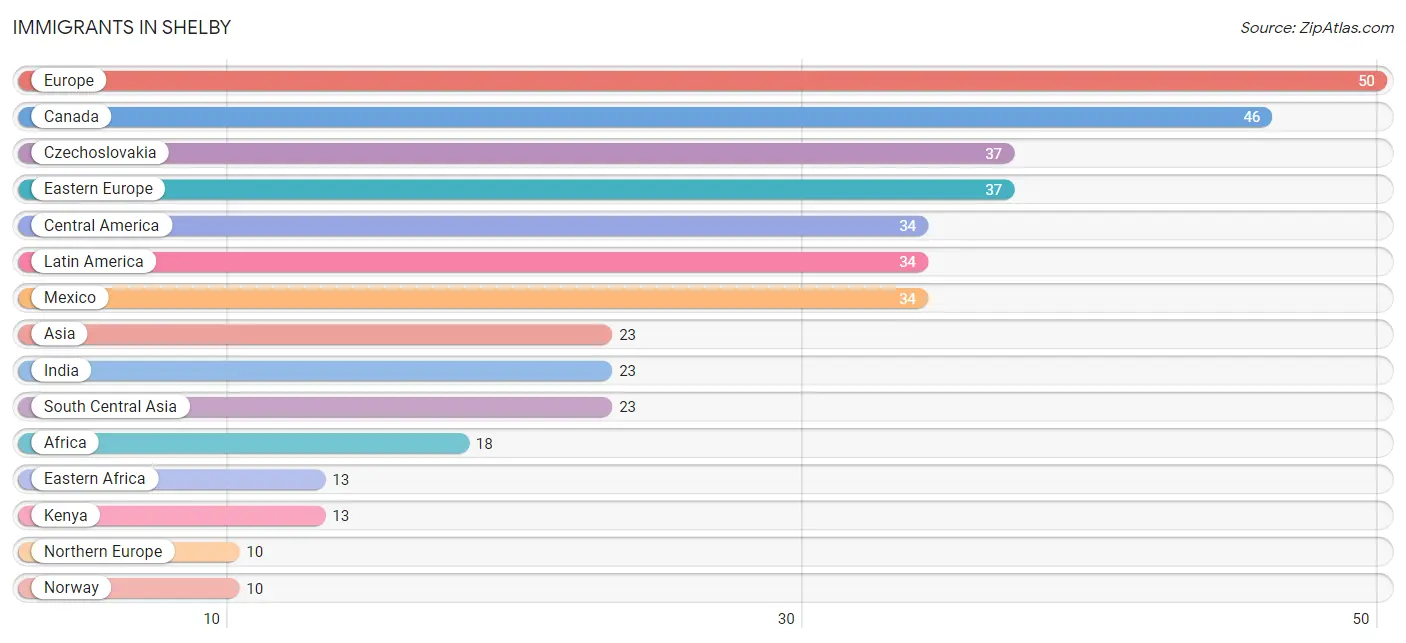
Immigrants in Shelby
The most numerous immigrant groups reported in Shelby came from Europe (50 | 1.6%), Canada (46 | 1.5%), Czechoslovakia (37 | 1.2%), Eastern Europe (37 | 1.2%), and Central America (34 | 1.1%), together accounting for 6.7% of all Shelby residents.
| Immigration Origin | # Population | % Population |
| Africa | 18 | 0.6% |
| Asia | 23 | 0.7% |
| Canada | 46 | 1.5% |
| Central America | 34 | 1.1% |
| Czechoslovakia | 37 | 1.2% |
| Eastern Africa | 13 | 0.4% |
| Eastern Europe | 37 | 1.2% |
| Europe | 50 | 1.6% |
| Greece | 3 | 0.1% |
| India | 23 | 0.7% |
| Kenya | 13 | 0.4% |
| Latin America | 34 | 1.1% |
| Mexico | 34 | 1.1% |
| Nigeria | 5 | 0.2% |
| Northern Europe | 10 | 0.3% |
| Norway | 10 | 0.3% |
| South Central Asia | 23 | 0.7% |
| Southern Europe | 3 | 0.1% |
| Western Africa | 5 | 0.2% | View All 19 Rows |
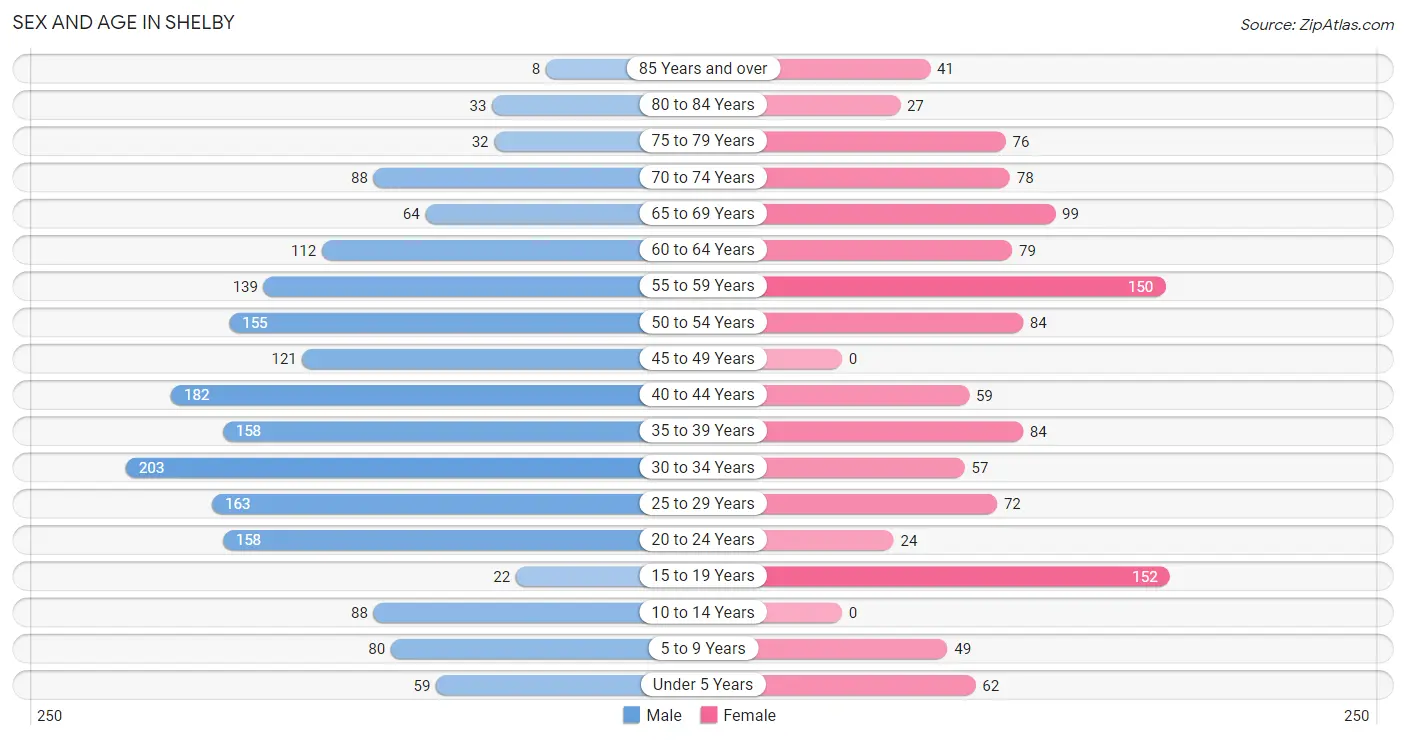
Sex and Age in Shelby
Sex and Age in Shelby
The most populous age groups in Shelby are 30 to 34 Years (203 | 10.9%) for men and 15 to 19 Years (152 | 12.7%) for women.
| Age Bracket | Male | Female |
| Under 5 Years | 59 (3.2%) | 62 (5.2%) |
| 5 to 9 Years | 80 (4.3%) | 49 (4.1%) |
| 10 to 14 Years | 88 (4.7%) | 0 (0.0%) |
| 15 to 19 Years | 22 (1.2%) | 152 (12.7%) |
| 20 to 24 Years | 158 (8.5%) | 24 (2.0%) |
| 25 to 29 Years | 163 (8.7%) | 72 (6.0%) |
| 30 to 34 Years | 203 (10.9%) | 57 (4.8%) |
| 35 to 39 Years | 158 (8.5%) | 84 (7.0%) |
| 40 to 44 Years | 182 (9.8%) | 59 (5.0%) |
| 45 to 49 Years | 121 (6.5%) | 0 (0.0%) |
| 50 to 54 Years | 155 (8.3%) | 84 (7.0%) |
| 55 to 59 Years | 139 (7.4%) | 150 (12.6%) |
| 60 to 64 Years | 112 (6.0%) | 79 (6.6%) |
| 65 to 69 Years | 64 (3.4%) | 99 (8.3%) |
| 70 to 74 Years | 88 (4.7%) | 78 (6.5%) |
| 75 to 79 Years | 32 (1.7%) | 76 (6.4%) |
| 80 to 84 Years | 33 (1.8%) | 27 (2.3%) |
| 85 Years and over | 8 (0.4%) | 41 (3.4%) |
| Total | 1,865 (100.0%) | 1,193 (100.0%) |
Families and Households in Shelby
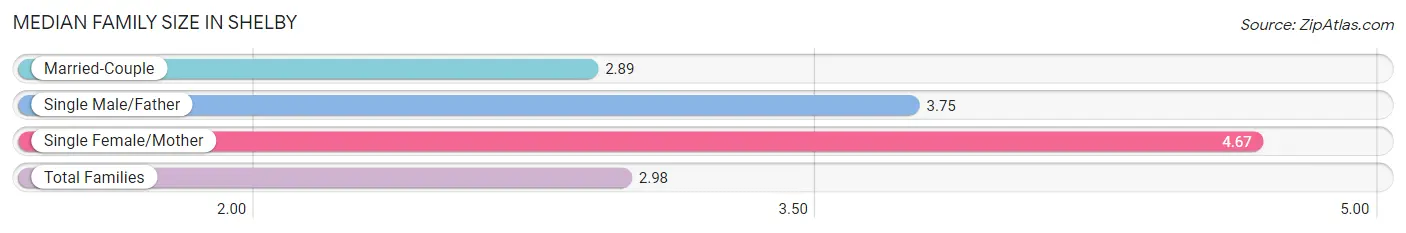
Median Family Size in Shelby
The median family size in Shelby is 2.98 persons per family, with single female/mother families (27 | 4.5%) accounting for the largest median family size of 4.67 persons per family. On the other hand, married-couple families (571 | 94.9%) represent the smallest median family size with 2.89 persons per family.
| Family Type | # Families | Family Size |
| Married-Couple | 571 (94.9%) | 2.89 |
| Single Male/Father | 4 (0.7%) | 3.75 |
| Single Female/Mother | 27 (4.5%) | 4.67 |
| Total Families | 602 (100.0%) | 2.98 |
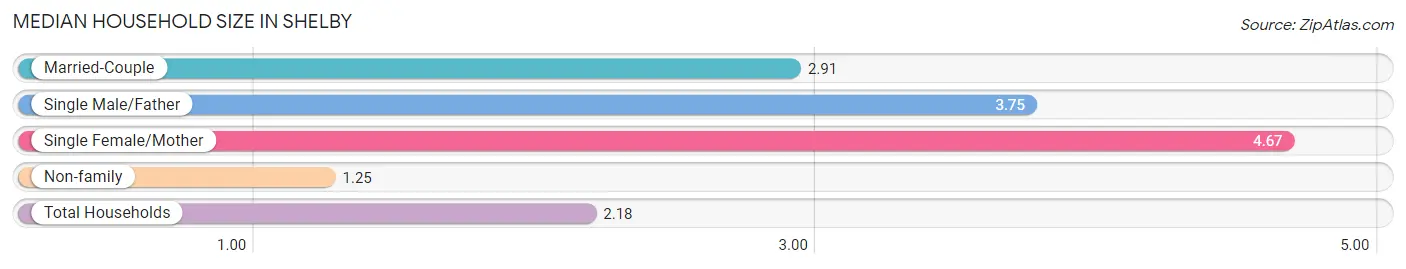
Median Household Size in Shelby
The median household size in Shelby is 2.18 persons per household, with single female/mother households (27 | 2.4%) accounting for the largest median household size of 4.67 persons per household. non-family households (524 | 46.5%) represent the smallest median household size with 1.25 persons per household.
| Household Type | # Households | Household Size |
| Married-Couple | 571 (50.7%) | 2.91 |
| Single Male/Father | 4 (0.4%) | 3.75 |
| Single Female/Mother | 27 (2.4%) | 4.67 |
| Non-family | 524 (46.5%) | 1.25 |
| Total Households | 1,126 (100.0%) | 2.18 |
Household Size by Marriage Status in Shelby
Out of a total of 1,126 households in Shelby, 602 (53.5%) are family households, while 524 (46.5%) are nonfamily households. The most numerous type of family households are 2-person households, comprising 308, and the most common type of nonfamily households are 1-person households, comprising 447.
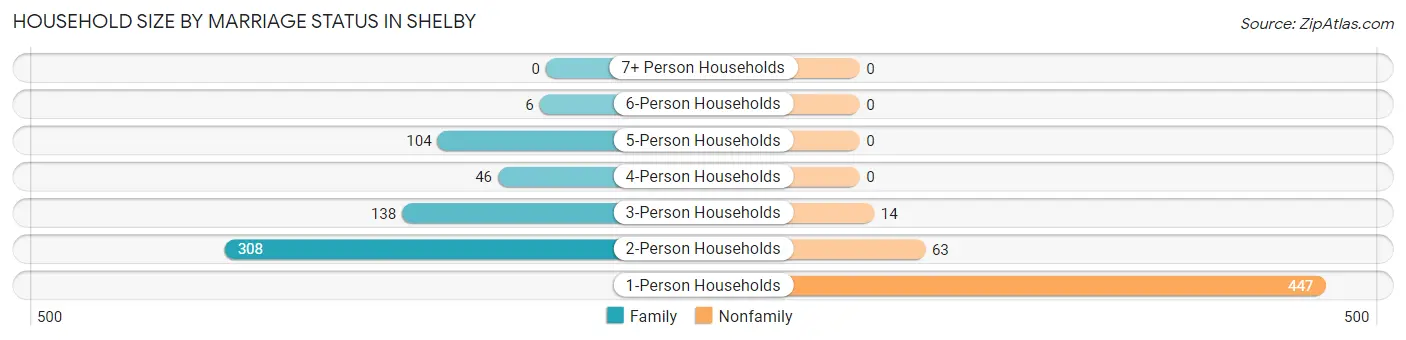
| Household Size | Family Households | Nonfamily Households |
| 1-Person Households | - | 447 (39.7%) |
| 2-Person Households | 308 (27.4%) | 63 (5.6%) |
| 3-Person Households | 138 (12.3%) | 14 (1.2%) |
| 4-Person Households | 46 (4.1%) | 0 (0.0%) |
| 5-Person Households | 104 (9.2%) | 0 (0.0%) |
| 6-Person Households | 6 (0.5%) | 0 (0.0%) |
| 7+ Person Households | 0 (0.0%) | 0 (0.0%) |
| Total | 602 (53.5%) | 524 (46.5%) |
Female Fertility in Shelby
Fertility by Age in Shelby
Average fertility rate in Shelby is 76.0 births per 1,000 women. Women in the age bracket of 20 to 34 years have the highest fertility rate with 222.0 births per 1,000 women. Women in the age bracket of 20 to 34 years acount for 100.0% of all women with births.
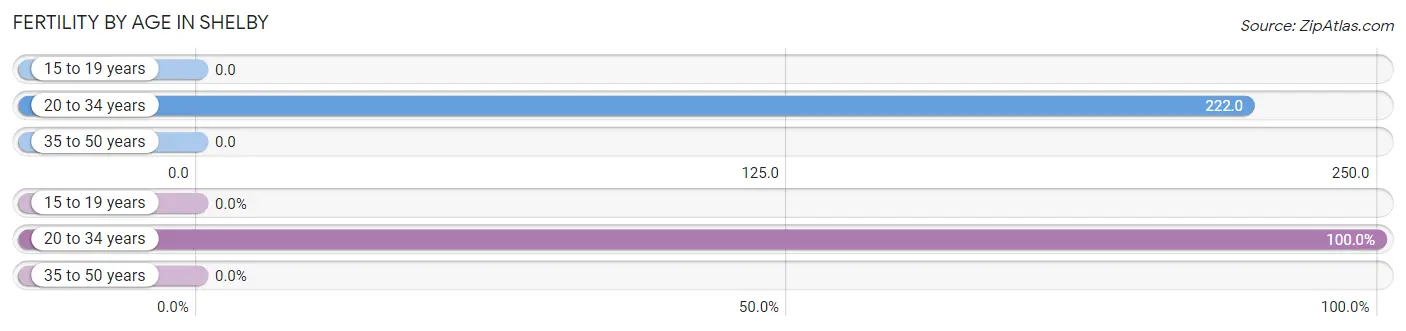
| Age Bracket | Women with Births | Births / 1,000 Women |
| 15 to 19 years | 0 (0.0%) | 0.0 |
| 20 to 34 years | 34 (100.0%) | 222.0 |
| 35 to 50 years | 0 (0.0%) | 0.0 |
| Total | 34 (100.0%) | 76.0 |
Fertility by Age by Marriage Status in Shelby
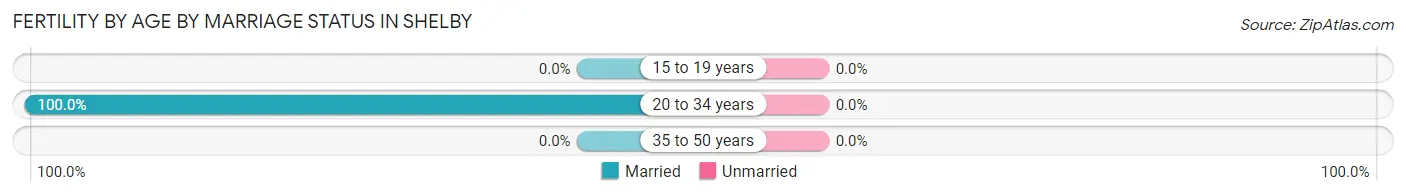
| Age Bracket | Married | Unmarried |
| 15 to 19 years | 0 (0.0%) | 0 (0.0%) |
| 20 to 34 years | 34 (100.0%) | 0 (0.0%) |
| 35 to 50 years | 0 (0.0%) | 0 (0.0%) |
| Total | 34 (100.0%) | 0 (0.0%) |
Fertility by Education in Shelby
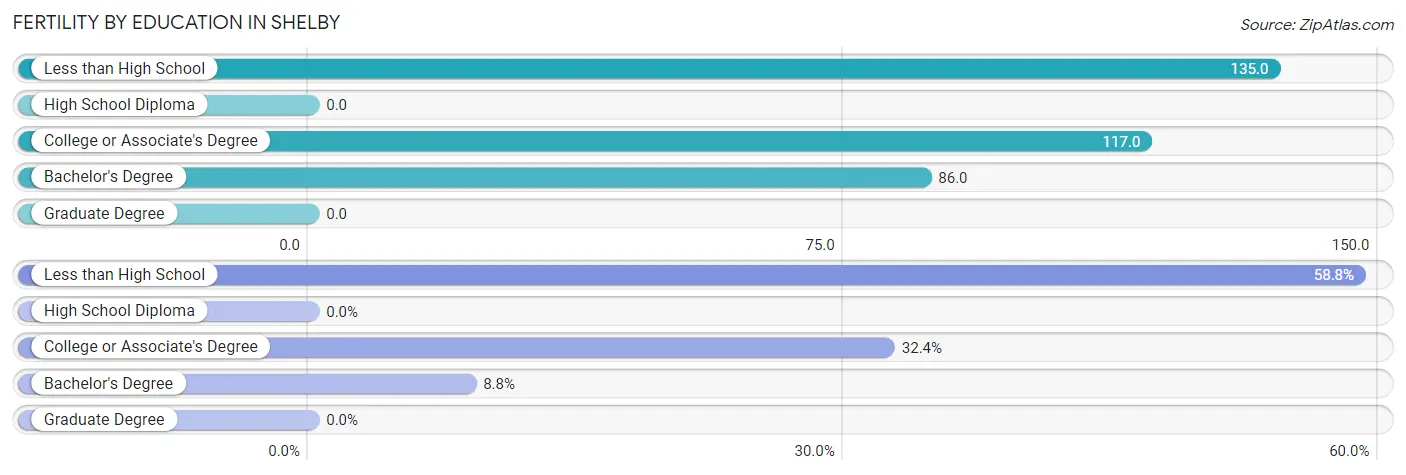
| Educational Attainment | Women with Births | Births / 1,000 Women |
| Less than High School | 20 (58.8%) | 135.0 |
| High School Diploma | 0 (0.0%) | 0.0 |
| College or Associate's Degree | 11 (32.4%) | 117.0 |
| Bachelor's Degree | 3 (8.8%) | 86.0 |
| Graduate Degree | 0 (0.0%) | 0.0 |
| Total | 34 (100.0%) | 76.0 |
Fertility by Education by Marriage Status in Shelby
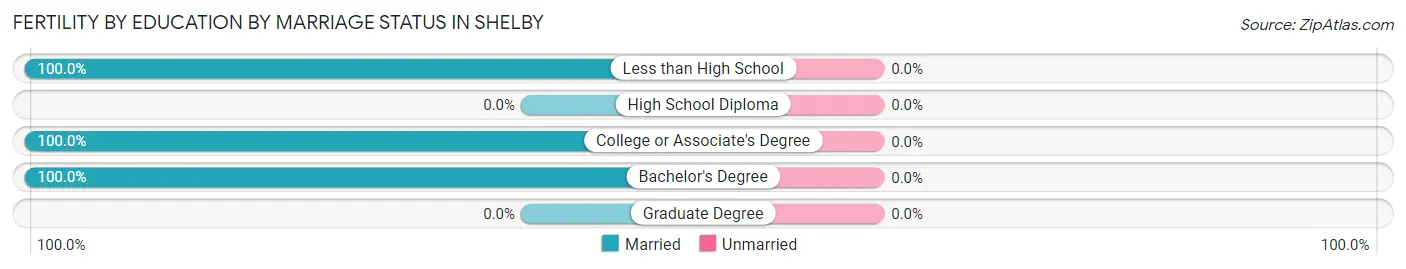
| Educational Attainment | Married | Unmarried |
| Less than High School | 20 (100.0%) | 0 (0.0%) |
| High School Diploma | 0 (0.0%) | 0 (0.0%) |
| College or Associate's Degree | 11 (100.0%) | 0 (0.0%) |
| Bachelor's Degree | 3 (100.0%) | 0 (0.0%) |
| Graduate Degree | 0 (0.0%) | 0 (0.0%) |
| Total | 34 (100.0%) | 0 (0.0%) |
Employment Characteristics in Shelby
Employment by Class of Employer in Shelby
Among the 1,251 employed individuals in Shelby, private company employees (593 | 47.4%), local government employees (247 | 19.7%), and self-employed (not incorporated) (165 | 13.2%) make up the most common classes of employment.
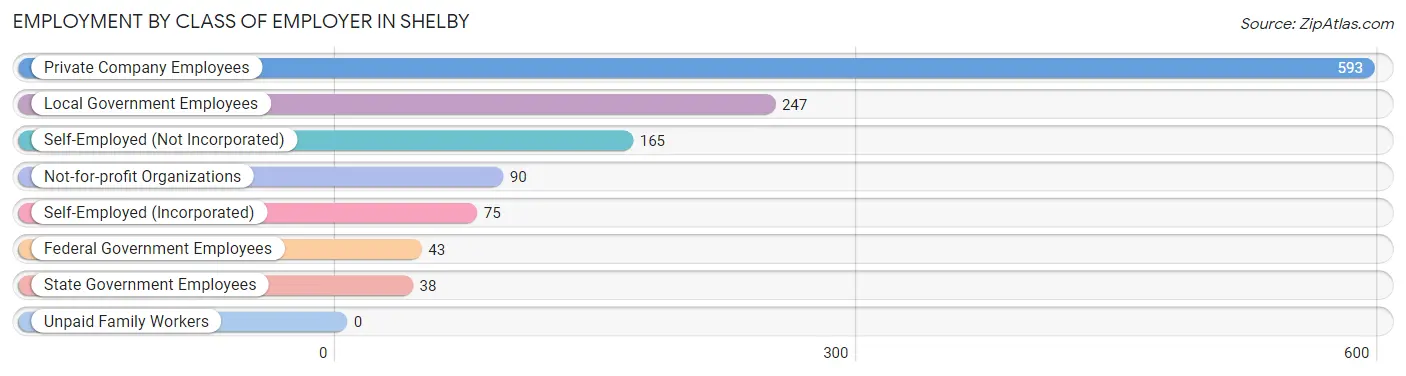
| Employer Class | # Employees | % Employees |
| Private Company Employees | 593 | 47.4% |
| Self-Employed (Incorporated) | 75 | 6.0% |
| Self-Employed (Not Incorporated) | 165 | 13.2% |
| Not-for-profit Organizations | 90 | 7.2% |
| Local Government Employees | 247 | 19.7% |
| State Government Employees | 38 | 3.0% |
| Federal Government Employees | 43 | 3.4% |
| Unpaid Family Workers | 0 | 0.0% |
| Total | 1,251 | 100.0% |
Employment Status by Age in Shelby
According to the labor force statistics for Shelby, out of the total population over 16 years of age (2,682), 47.7% or 1,279 individuals are in the labor force, with 1.3% or 17 of them unemployed. The age group with the highest labor force participation rate is 20 to 24 years, with 76.4% or 139 individuals in the labor force. Within the labor force, the 55 to 59 years age range has the highest percentage of unemployed individuals, with 5.5% or 11 of them being unemployed.
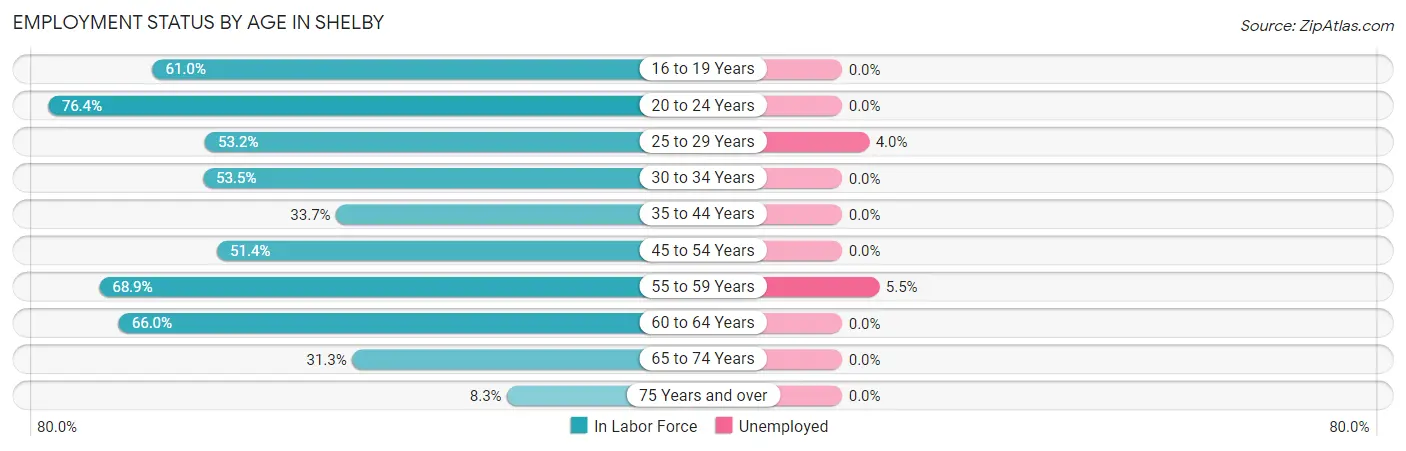
| Age Bracket | In Labor Force | Unemployed |
| 16 to 19 Years | 83 (61.0%) | 0 (0.0%) |
| 20 to 24 Years | 139 (76.4%) | 0 (0.0%) |
| 25 to 29 Years | 125 (53.2%) | 5 (4.0%) |
| 30 to 34 Years | 139 (53.5%) | 0 (0.0%) |
| 35 to 44 Years | 163 (33.7%) | 0 (0.0%) |
| 45 to 54 Years | 185 (51.4%) | 0 (0.0%) |
| 55 to 59 Years | 199 (68.9%) | 11 (5.5%) |
| 60 to 64 Years | 126 (66.0%) | 0 (0.0%) |
| 65 to 74 Years | 103 (31.3%) | 0 (0.0%) |
| 75 Years and over | 18 (8.3%) | 0 (0.0%) |
| Total | 1,279 (47.7%) | 17 (1.3%) |
Employment Status by Educational Attainment in Shelby
According to labor force statistics for Shelby, 51.5% of individuals (936) out of the total population between 25 and 64 years of age (1,818) are in the labor force, with 1.7% or 16 of them being unemployed. The group with the highest labor force participation rate are those with the educational attainment of college / associate degree, with 74.9% or 260 individuals in the labor force. Within the labor force, individuals with college / associate degree education have the highest percentage of unemployment, with 4.2% or 11 of them being unemployed.
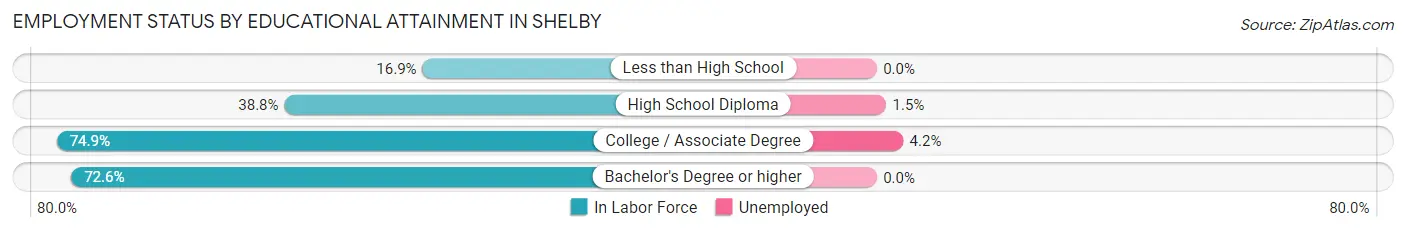
| Educational Attainment | In Labor Force | Unemployed |
| Less than High School | 33 (16.9%) | 0 (0.0%) |
| High School Diploma | 324 (38.8%) | 13 (1.5%) |
| College / Associate Degree | 260 (74.9%) | 15 (4.2%) |
| Bachelor's Degree or higher | 320 (72.6%) | 0 (0.0%) |
| Total | 936 (51.5%) | 31 (1.7%) |
Employment Occupations by Sex in Shelby
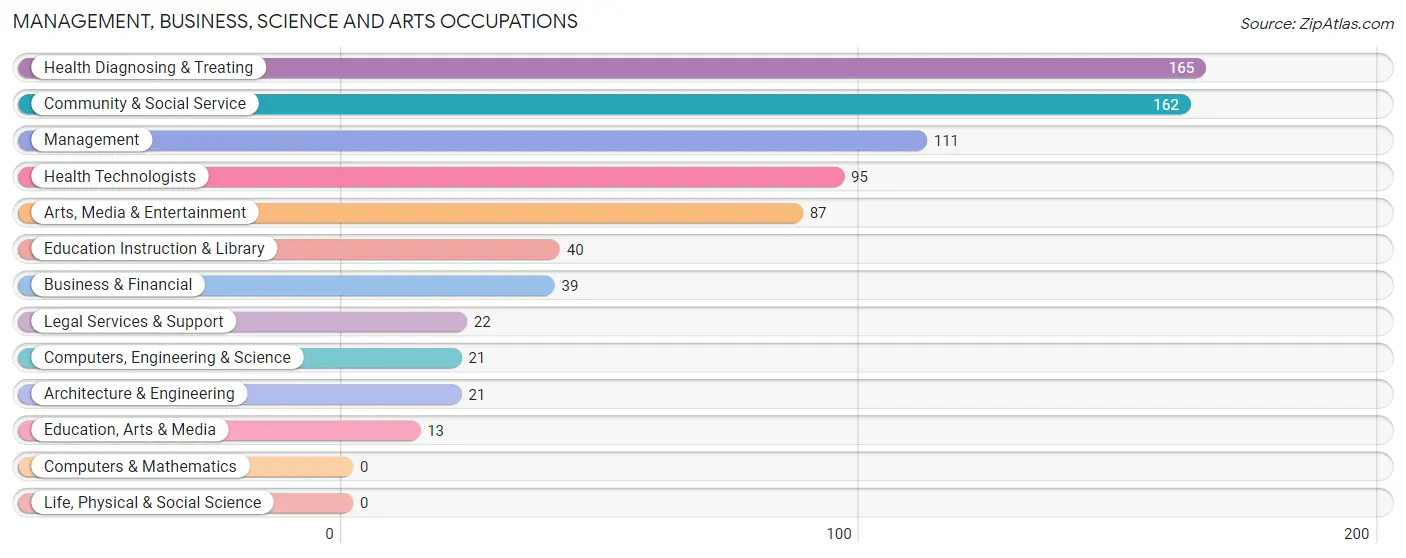
Management, Business, Science and Arts Occupations
The most common Management, Business, Science and Arts occupations in Shelby are Health Diagnosing & Treating (165 | 13.1%), Community & Social Service (162 | 12.8%), Management (111 | 8.8%), Health Technologists (95 | 7.5%), and Arts, Media & Entertainment (87 | 6.9%).
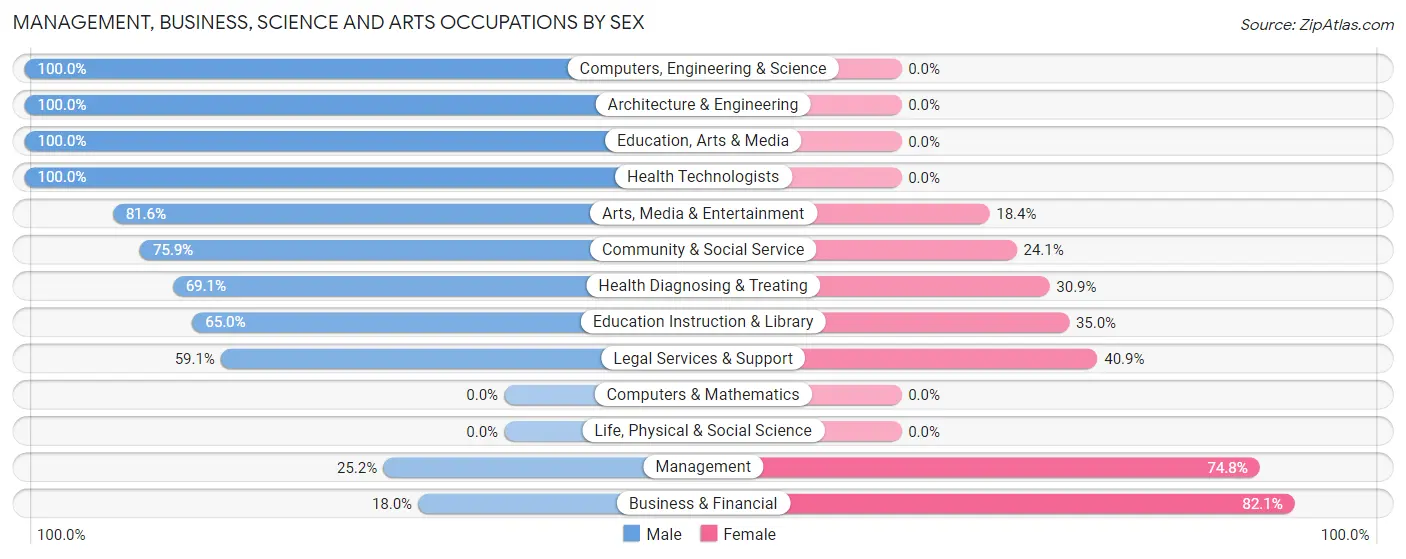
Management, Business, Science and Arts Occupations by Sex
Within the Management, Business, Science and Arts occupations in Shelby, the most male-oriented occupations are Computers, Engineering & Science (100.0%), Architecture & Engineering (100.0%), and Education, Arts & Media (100.0%), while the most female-oriented occupations are Business & Financial (82.1%), Management (74.8%), and Legal Services & Support (40.9%).
| Occupation | Male | Female |
| Management | 28 (25.2%) | 83 (74.8%) |
| Business & Financial | 7 (17.9%) | 32 (82.1%) |
| Computers, Engineering & Science | 21 (100.0%) | 0 (0.0%) |
| Computers & Mathematics | 0 (0.0%) | 0 (0.0%) |
| Architecture & Engineering | 21 (100.0%) | 0 (0.0%) |
| Life, Physical & Social Science | 0 (0.0%) | 0 (0.0%) |
| Community & Social Service | 123 (75.9%) | 39 (24.1%) |
| Education, Arts & Media | 13 (100.0%) | 0 (0.0%) |
| Legal Services & Support | 13 (59.1%) | 9 (40.9%) |
| Education Instruction & Library | 26 (65.0%) | 14 (35.0%) |
| Arts, Media & Entertainment | 71 (81.6%) | 16 (18.4%) |
| Health Diagnosing & Treating | 114 (69.1%) | 51 (30.9%) |
| Health Technologists | 95 (100.0%) | 0 (0.0%) |
| Total (Category) | 293 (58.8%) | 205 (41.2%) |
| Total (Overall) | 745 (58.9%) | 519 (41.1%) |
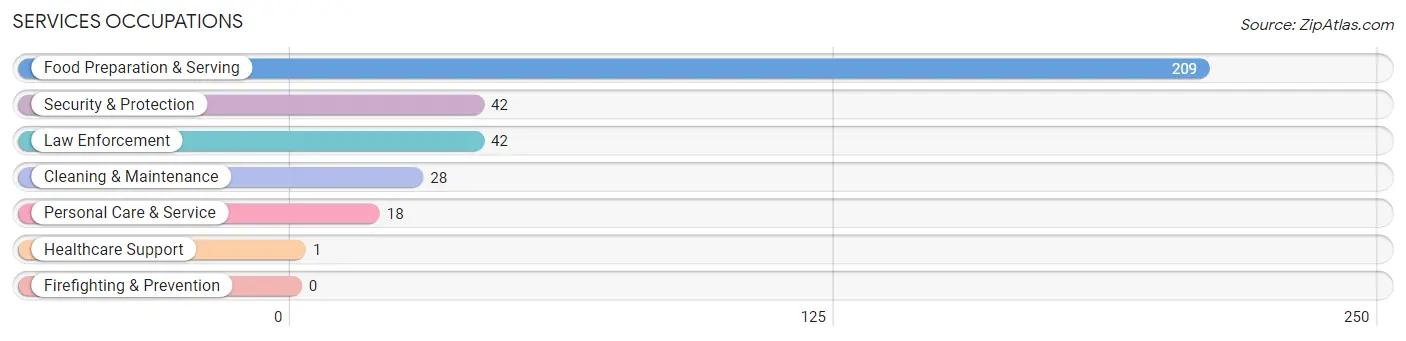
Services Occupations
The most common Services occupations in Shelby are Food Preparation & Serving (209 | 16.5%), Security & Protection (42 | 3.3%), Law Enforcement (42 | 3.3%), Cleaning & Maintenance (28 | 2.2%), and Personal Care & Service (18 | 1.4%).
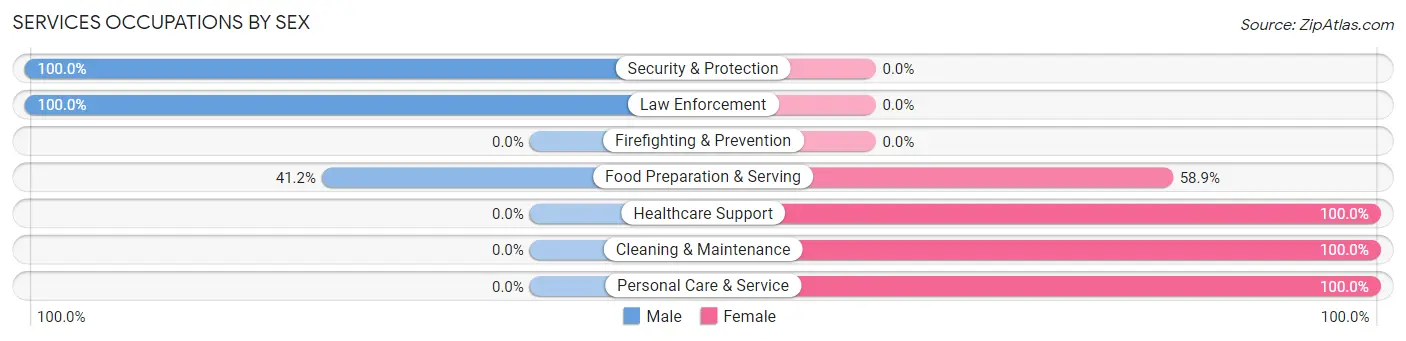
Services Occupations by Sex
Within the Services occupations in Shelby, the most male-oriented occupations are Security & Protection (100.0%), Law Enforcement (100.0%), and Food Preparation & Serving (41.1%), while the most female-oriented occupations are Healthcare Support (100.0%), Cleaning & Maintenance (100.0%), and Personal Care & Service (100.0%).
| Occupation | Male | Female |
| Healthcare Support | 0 (0.0%) | 1 (100.0%) |
| Security & Protection | 42 (100.0%) | 0 (0.0%) |
| Firefighting & Prevention | 0 (0.0%) | 0 (0.0%) |
| Law Enforcement | 42 (100.0%) | 0 (0.0%) |
| Food Preparation & Serving | 86 (41.1%) | 123 (58.9%) |
| Cleaning & Maintenance | 0 (0.0%) | 28 (100.0%) |
| Personal Care & Service | 0 (0.0%) | 18 (100.0%) |
| Total (Category) | 128 (42.9%) | 170 (57.1%) |
| Total (Overall) | 745 (58.9%) | 519 (41.1%) |
Sales and Office Occupations
The most common Sales and Office occupations in Shelby are Office & Administration (115 | 9.1%), and Sales & Related (74 | 5.9%).
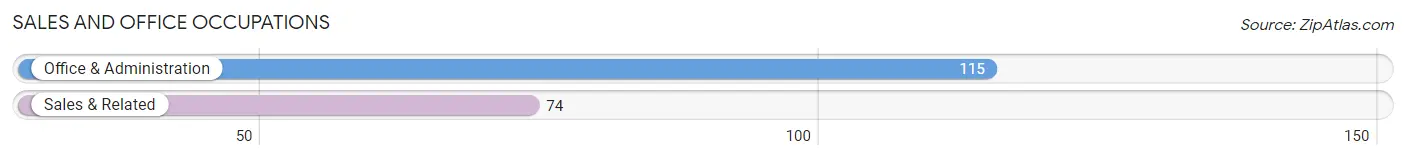
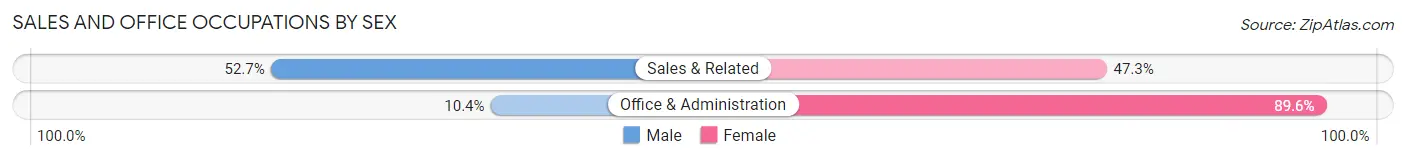
Sales and Office Occupations by Sex
| Occupation | Male | Female |
| Sales & Related | 39 (52.7%) | 35 (47.3%) |
| Office & Administration | 12 (10.4%) | 103 (89.6%) |
| Total (Category) | 51 (27.0%) | 138 (73.0%) |
| Total (Overall) | 745 (58.9%) | 519 (41.1%) |
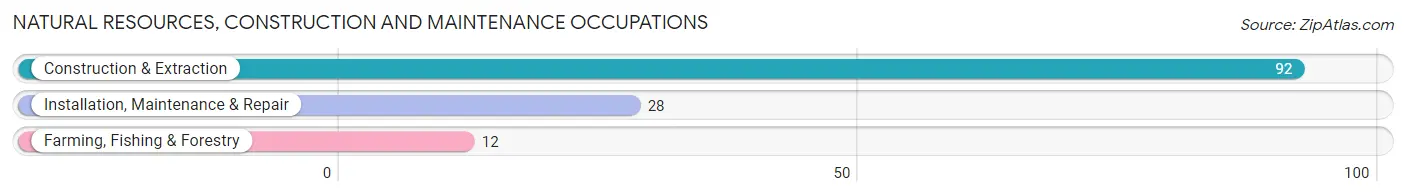
Natural Resources, Construction and Maintenance Occupations
The most common Natural Resources, Construction and Maintenance occupations in Shelby are Construction & Extraction (92 | 7.3%), Installation, Maintenance & Repair (28 | 2.2%), and Farming, Fishing & Forestry (12 | 0.9%).
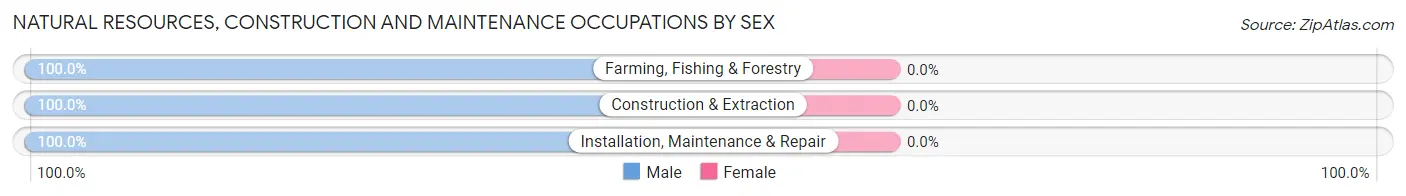
Natural Resources, Construction and Maintenance Occupations by Sex
| Occupation | Male | Female |
| Farming, Fishing & Forestry | 12 (100.0%) | 0 (0.0%) |
| Construction & Extraction | 92 (100.0%) | 0 (0.0%) |
| Installation, Maintenance & Repair | 28 (100.0%) | 0 (0.0%) |
| Total (Category) | 132 (100.0%) | 0 (0.0%) |
| Total (Overall) | 745 (58.9%) | 519 (41.1%) |
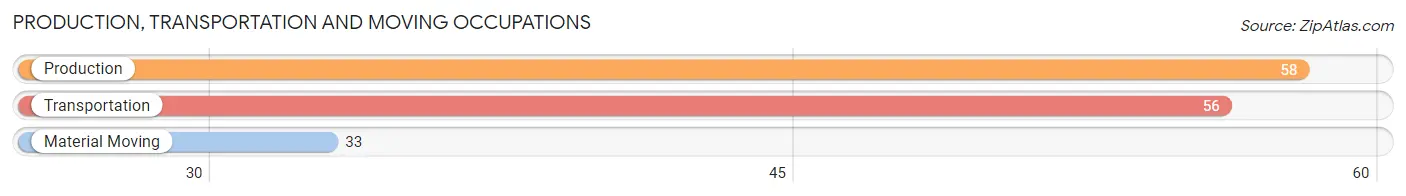
Production, Transportation and Moving Occupations
The most common Production, Transportation and Moving occupations in Shelby are Production (58 | 4.6%), Transportation (56 | 4.4%), and Material Moving (33 | 2.6%).
Production, Transportation and Moving Occupations by Sex
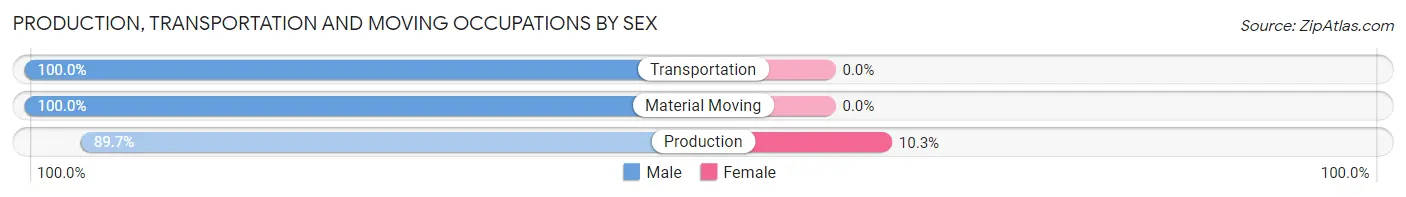
| Occupation | Male | Female |
| Production | 52 (89.7%) | 6 (10.3%) |
| Transportation | 56 (100.0%) | 0 (0.0%) |
| Material Moving | 33 (100.0%) | 0 (0.0%) |
| Total (Category) | 141 (95.9%) | 6 (4.1%) |
| Total (Overall) | 745 (58.9%) | 519 (41.1%) |
Employment Industries by Sex in Shelby
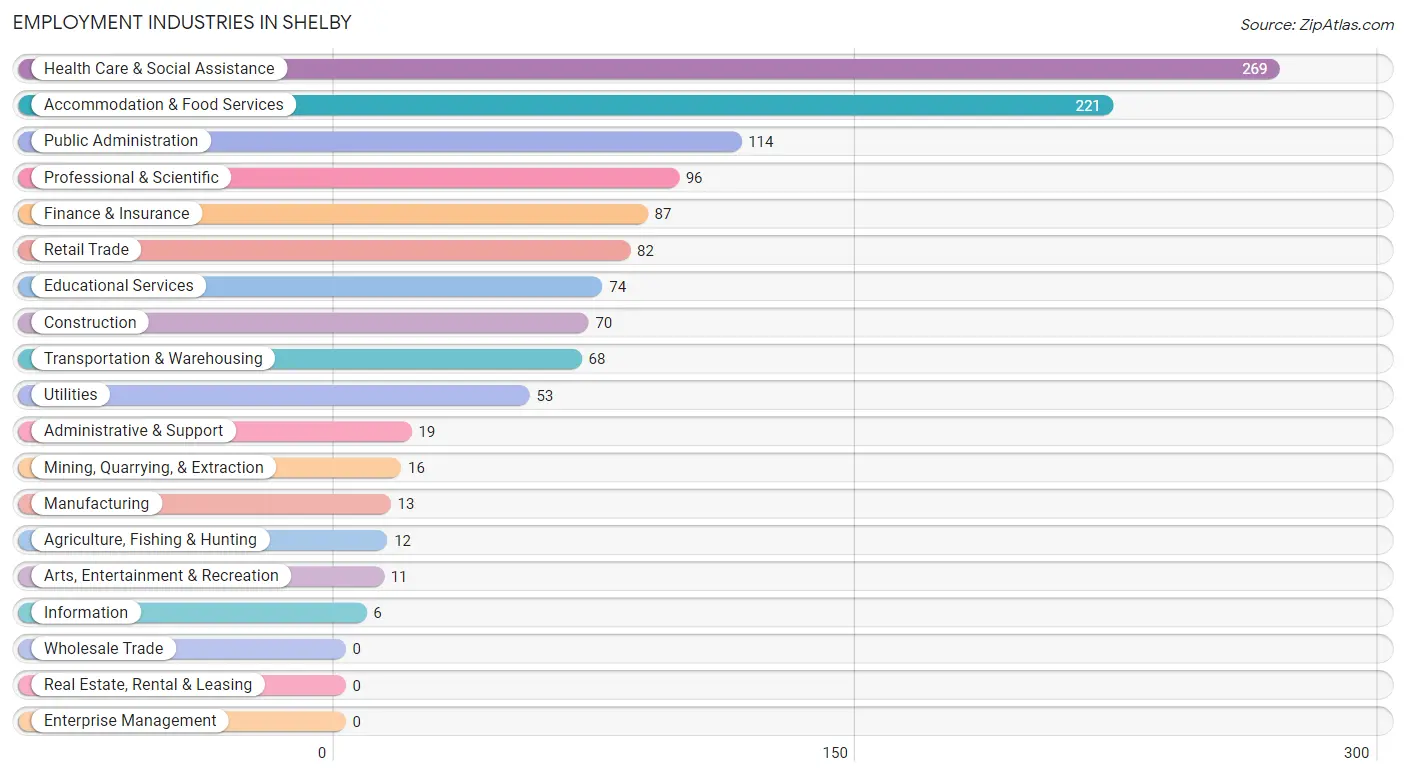
Employment Industries in Shelby
The major employment industries in Shelby include Health Care & Social Assistance (269 | 21.3%), Accommodation & Food Services (221 | 17.5%), Public Administration (114 | 9.0%), Professional & Scientific (96 | 7.6%), and Finance & Insurance (87 | 6.9%).
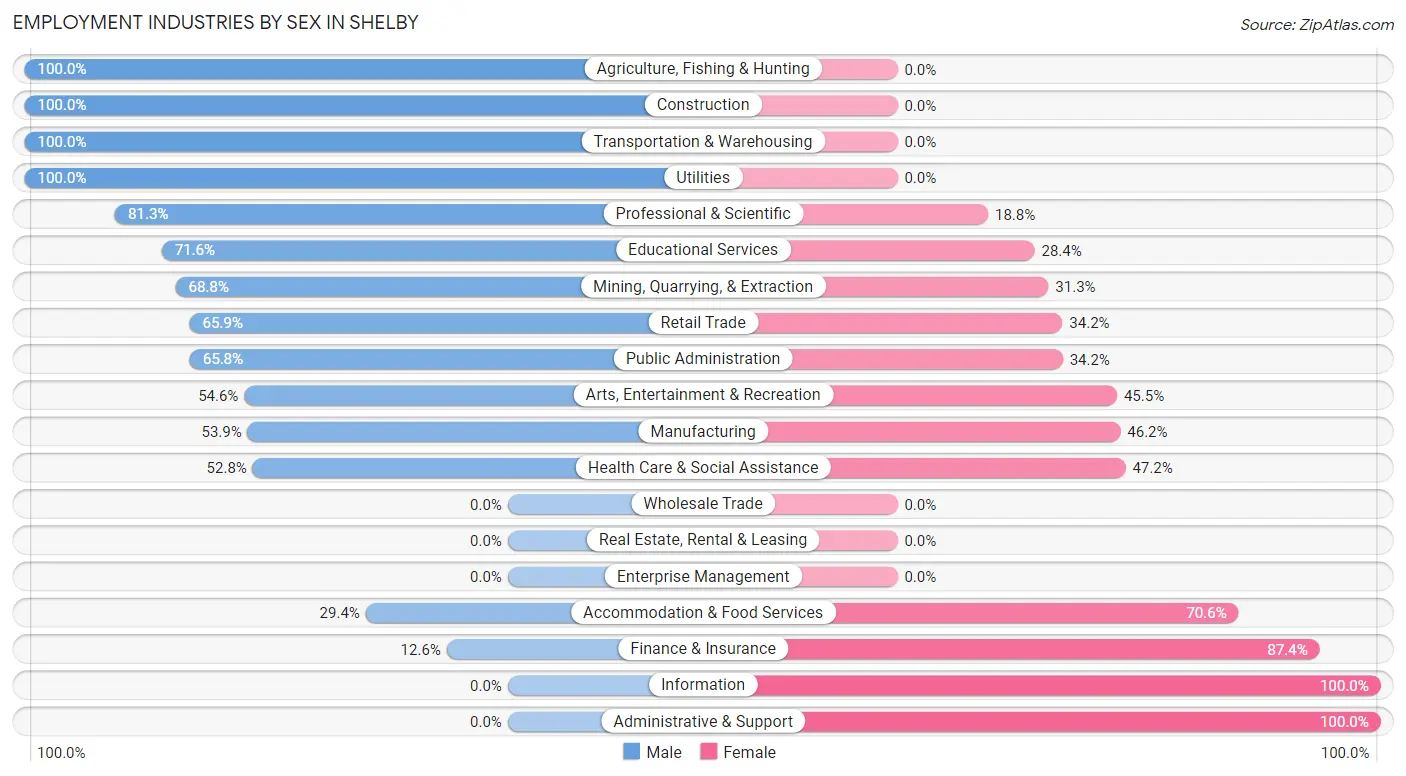
Employment Industries by Sex in Shelby
The Shelby industries that see more men than women are Agriculture, Fishing & Hunting (100.0%), Construction (100.0%), and Transportation & Warehousing (100.0%), whereas the industries that tend to have a higher number of women are Information (100.0%), Administrative & Support (100.0%), and Finance & Insurance (87.4%).
| Industry | Male | Female |
| Agriculture, Fishing & Hunting | 12 (100.0%) | 0 (0.0%) |
| Mining, Quarrying, & Extraction | 11 (68.8%) | 5 (31.2%) |
| Construction | 70 (100.0%) | 0 (0.0%) |
| Manufacturing | 7 (53.8%) | 6 (46.2%) |
| Wholesale Trade | 0 (0.0%) | 0 (0.0%) |
| Retail Trade | 54 (65.8%) | 28 (34.2%) |
| Transportation & Warehousing | 68 (100.0%) | 0 (0.0%) |
| Utilities | 53 (100.0%) | 0 (0.0%) |
| Information | 0 (0.0%) | 6 (100.0%) |
| Finance & Insurance | 11 (12.6%) | 76 (87.4%) |
| Real Estate, Rental & Leasing | 0 (0.0%) | 0 (0.0%) |
| Professional & Scientific | 78 (81.2%) | 18 (18.8%) |
| Enterprise Management | 0 (0.0%) | 0 (0.0%) |
| Administrative & Support | 0 (0.0%) | 19 (100.0%) |
| Educational Services | 53 (71.6%) | 21 (28.4%) |
| Health Care & Social Assistance | 142 (52.8%) | 127 (47.2%) |
| Arts, Entertainment & Recreation | 6 (54.5%) | 5 (45.5%) |
| Accommodation & Food Services | 65 (29.4%) | 156 (70.6%) |
| Public Administration | 75 (65.8%) | 39 (34.2%) |
| Total | 745 (58.9%) | 519 (41.1%) |
Education in Shelby
School Enrollment in Shelby
The most common levels of schooling among the 466 students in Shelby are high school (142 | 30.5%), college / undergraduate (97 | 20.8%), and middle school (88 | 18.9%).
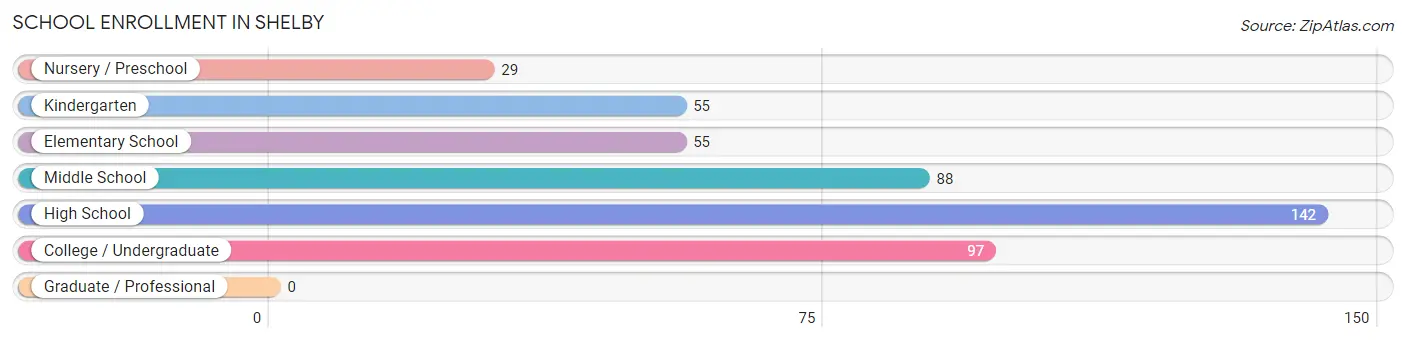
| School Level | # Students | % Students |
| Nursery / Preschool | 29 | 6.2% |
| Kindergarten | 55 | 11.8% |
| Elementary School | 55 | 11.8% |
| Middle School | 88 | 18.9% |
| High School | 142 | 30.5% |
| College / Undergraduate | 97 | 20.8% |
| Graduate / Professional | 0 | 0.0% |
| Total | 466 | 100.0% |
School Enrollment by Age by Funding Source in Shelby
Out of a total of 466 students who are enrolled in schools in Shelby, 70 (15.0%) attend a private institution, while the remaining 396 (85.0%) are enrolled in public schools. The age group of 25 to 34 year olds has the highest likelihood of being enrolled in private schools, with 8 (100.0% in the age bracket) enrolled. Conversely, the age group of 20 to 24 year olds has the lowest likelihood of being enrolled in a private school, with 24 (100.0% in the age bracket) attending a public institution.
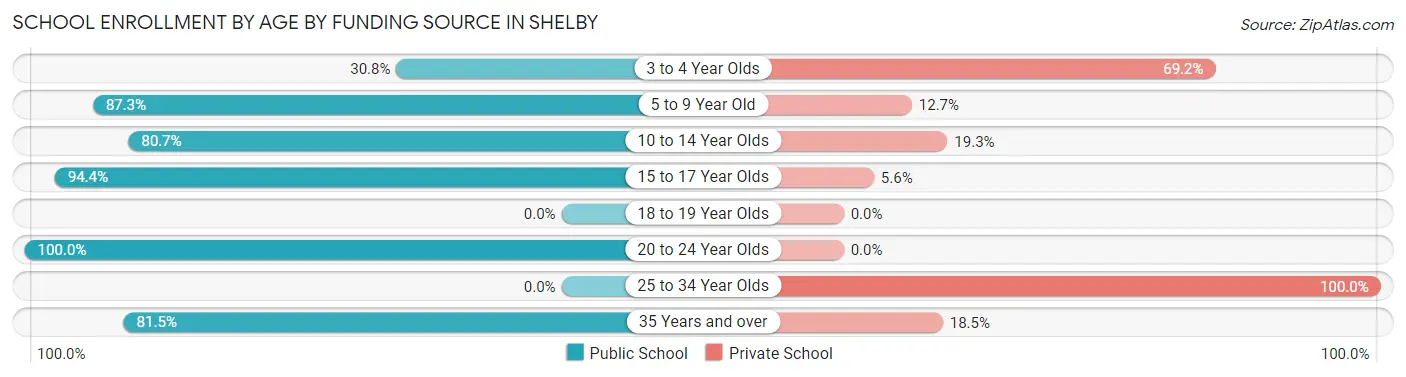
| Age Bracket | Public School | Private School |
| 3 to 4 Year Olds | 4 (30.8%) | 9 (69.2%) |
| 5 to 9 Year Old | 110 (87.3%) | 16 (12.7%) |
| 10 to 14 Year Olds | 71 (80.7%) | 17 (19.3%) |
| 15 to 17 Year Olds | 134 (94.4%) | 8 (5.6%) |
| 18 to 19 Year Olds | 0 (0.0%) | 0 (0.0%) |
| 20 to 24 Year Olds | 24 (100.0%) | 0 (0.0%) |
| 25 to 34 Year Olds | 0 (0.0%) | 8 (100.0%) |
| 35 Years and over | 53 (81.5%) | 12 (18.5%) |
| Total | 396 (85.0%) | 70 (15.0%) |
Educational Attainment by Field of Study in Shelby
Business (146 | 25.7%), science & technology (133 | 23.4%), bio, nature & agricultural (109 | 19.2%), arts & humanities (42 | 7.4%), and social sciences (33 | 5.8%) are the most common fields of study among 568 individuals in Shelby who have obtained a bachelor's degree or higher.
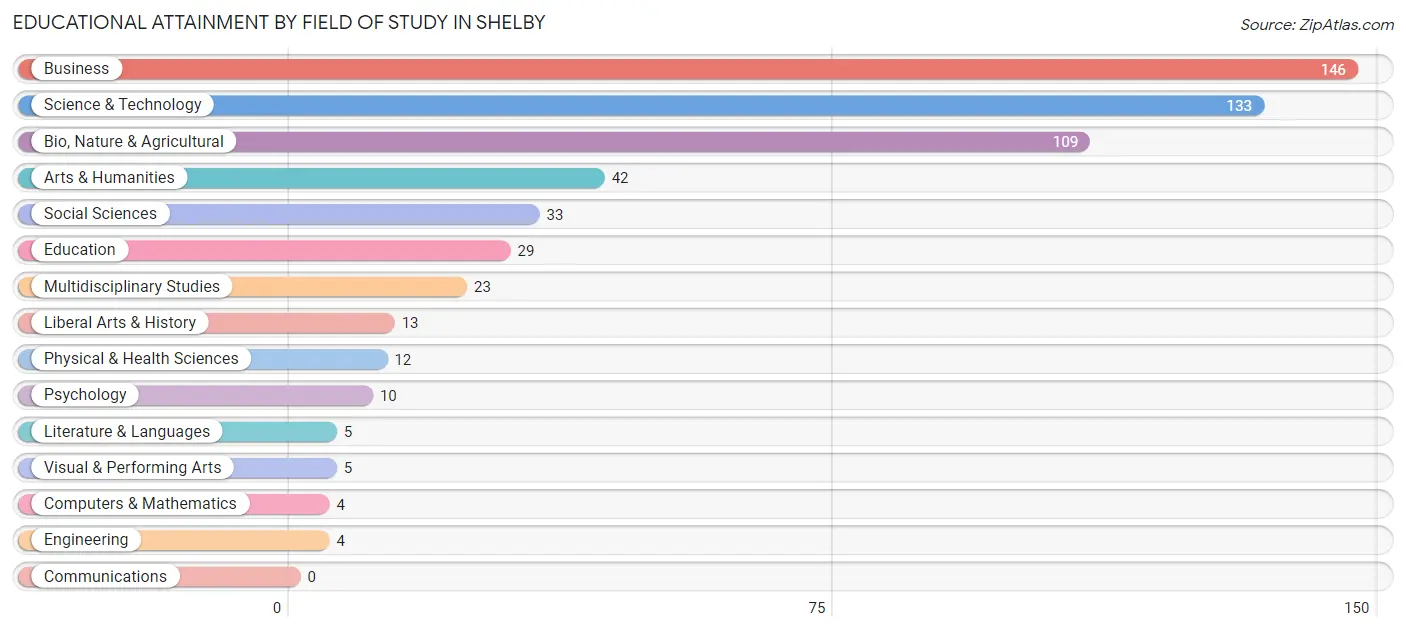
| Field of Study | # Graduates | % Graduates |
| Computers & Mathematics | 4 | 0.7% |
| Bio, Nature & Agricultural | 109 | 19.2% |
| Physical & Health Sciences | 12 | 2.1% |
| Psychology | 10 | 1.8% |
| Social Sciences | 33 | 5.8% |
| Engineering | 4 | 0.7% |
| Multidisciplinary Studies | 23 | 4.1% |
| Science & Technology | 133 | 23.4% |
| Business | 146 | 25.7% |
| Education | 29 | 5.1% |
| Literature & Languages | 5 | 0.9% |
| Liberal Arts & History | 13 | 2.3% |
| Visual & Performing Arts | 5 | 0.9% |
| Communications | 0 | 0.0% |
| Arts & Humanities | 42 | 7.4% |
| Total | 568 | 100.0% |
Transportation & Commute in Shelby
Vehicle Availability by Sex in Shelby
The most prevalent vehicle ownership categories in Shelby are males with 2 vehicles (369, accounting for 50.4%) and females with 2 vehicles (233, making up 71.1%).
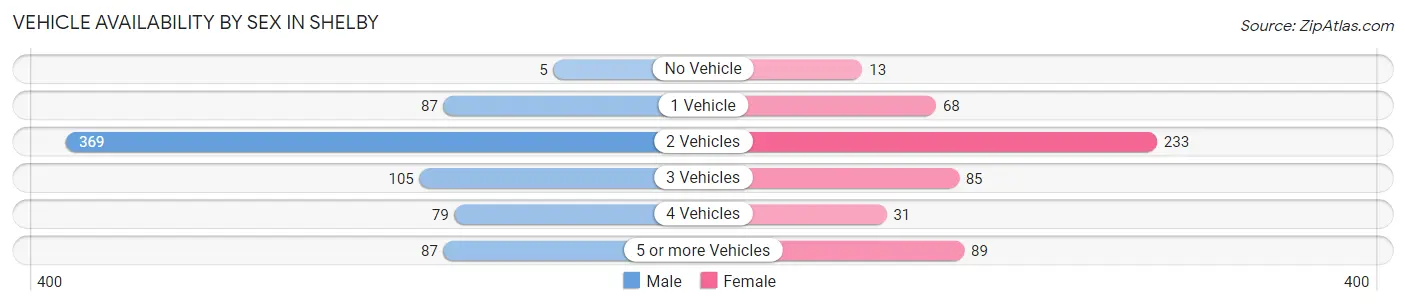
| Vehicles Available | Male | Female |
| No Vehicle | 5 (0.7%) | 13 (2.5%) |
| 1 Vehicle | 87 (11.9%) | 68 (13.1%) |
| 2 Vehicles | 369 (50.4%) | 233 (44.9%) |
| 3 Vehicles | 105 (14.3%) | 85 (16.4%) |
| 4 Vehicles | 79 (10.8%) | 31 (6.0%) |
| 5 or more Vehicles | 87 (11.9%) | 89 (17.2%) |
| Total | 732 (100.0%) | 519 (100.0%) |
Commute Time in Shelby
The most frequently occuring commute durations in Shelby are 5 to 9 minutes (508 commuters, 43.0%), less than 5 minutes (223 commuters, 18.9%), and 15 to 19 minutes (99 commuters, 8.4%).
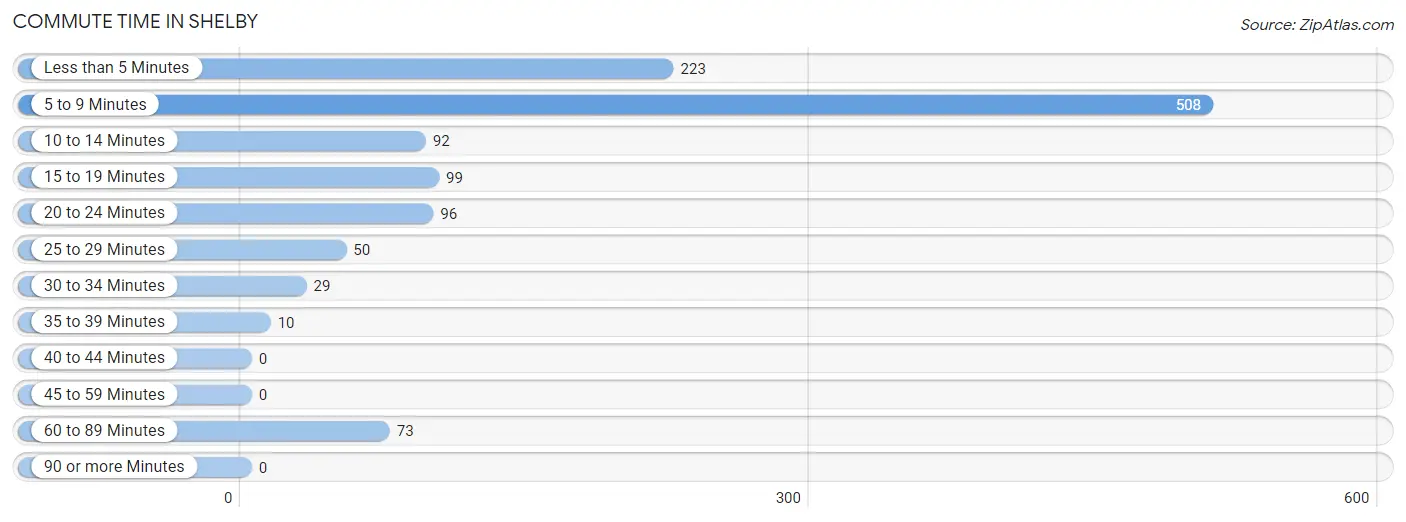
| Commute Time | # Commuters | % Commuters |
| Less than 5 Minutes | 223 | 18.9% |
| 5 to 9 Minutes | 508 | 43.0% |
| 10 to 14 Minutes | 92 | 7.8% |
| 15 to 19 Minutes | 99 | 8.4% |
| 20 to 24 Minutes | 96 | 8.1% |
| 25 to 29 Minutes | 50 | 4.2% |
| 30 to 34 Minutes | 29 | 2.5% |
| 35 to 39 Minutes | 10 | 0.9% |
| 40 to 44 Minutes | 0 | 0.0% |
| 45 to 59 Minutes | 0 | 0.0% |
| 60 to 89 Minutes | 73 | 6.2% |
| 90 or more Minutes | 0 | 0.0% |
Commute Time by Sex in Shelby
The most common commute times in Shelby are 5 to 9 minutes (227 commuters, 33.0%) for males and 5 to 9 minutes (281 commuters, 57.1%) for females.
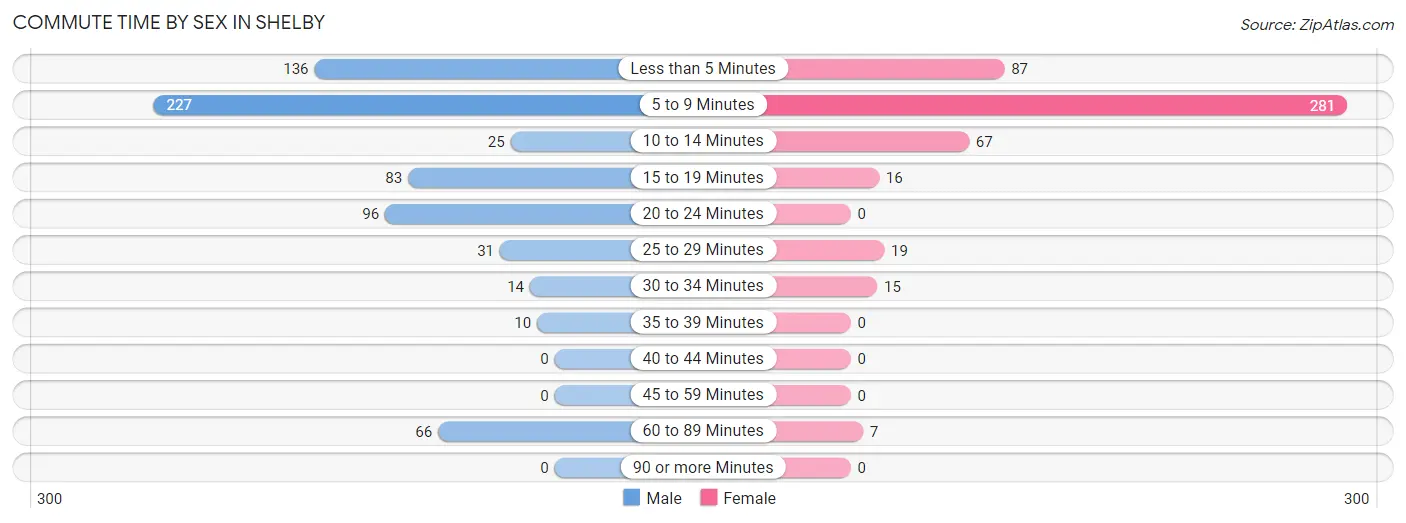
| Commute Time | Male | Female |
| Less than 5 Minutes | 136 (19.8%) | 87 (17.7%) |
| 5 to 9 Minutes | 227 (33.0%) | 281 (57.1%) |
| 10 to 14 Minutes | 25 (3.6%) | 67 (13.6%) |
| 15 to 19 Minutes | 83 (12.1%) | 16 (3.3%) |
| 20 to 24 Minutes | 96 (14.0%) | 0 (0.0%) |
| 25 to 29 Minutes | 31 (4.5%) | 19 (3.9%) |
| 30 to 34 Minutes | 14 (2.0%) | 15 (3.0%) |
| 35 to 39 Minutes | 10 (1.5%) | 0 (0.0%) |
| 40 to 44 Minutes | 0 (0.0%) | 0 (0.0%) |
| 45 to 59 Minutes | 0 (0.0%) | 0 (0.0%) |
| 60 to 89 Minutes | 66 (9.6%) | 7 (1.4%) |
| 90 or more Minutes | 0 (0.0%) | 0 (0.0%) |
Time of Departure to Work by Sex in Shelby
The most frequent times of departure to work in Shelby are 8:00 AM to 8:29 AM (158, 23.0%) for males and 7:30 AM to 7:59 AM (158, 32.1%) for females.
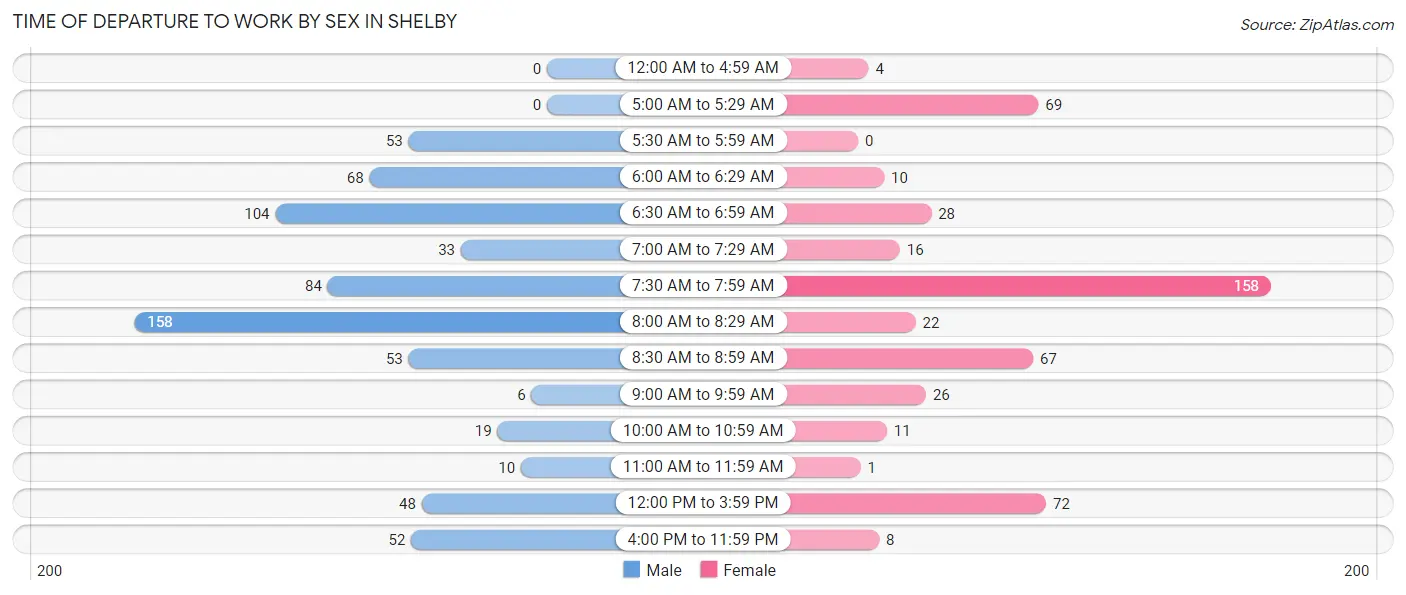
| Time of Departure | Male | Female |
| 12:00 AM to 4:59 AM | 0 (0.0%) | 4 (0.8%) |
| 5:00 AM to 5:29 AM | 0 (0.0%) | 69 (14.0%) |
| 5:30 AM to 5:59 AM | 53 (7.7%) | 0 (0.0%) |
| 6:00 AM to 6:29 AM | 68 (9.9%) | 10 (2.0%) |
| 6:30 AM to 6:59 AM | 104 (15.1%) | 28 (5.7%) |
| 7:00 AM to 7:29 AM | 33 (4.8%) | 16 (3.3%) |
| 7:30 AM to 7:59 AM | 84 (12.2%) | 158 (32.1%) |
| 8:00 AM to 8:29 AM | 158 (23.0%) | 22 (4.5%) |
| 8:30 AM to 8:59 AM | 53 (7.7%) | 67 (13.6%) |
| 9:00 AM to 9:59 AM | 6 (0.9%) | 26 (5.3%) |
| 10:00 AM to 10:59 AM | 19 (2.8%) | 11 (2.2%) |
| 11:00 AM to 11:59 AM | 10 (1.5%) | 1 (0.2%) |
| 12:00 PM to 3:59 PM | 48 (7.0%) | 72 (14.6%) |
| 4:00 PM to 11:59 PM | 52 (7.6%) | 8 (1.6%) |
| Total | 688 (100.0%) | 492 (100.0%) |
Housing Occupancy in Shelby
Occupancy by Ownership in Shelby
Of the total 1,126 dwellings in Shelby, owner-occupied units account for 732 (65.0%), while renter-occupied units make up 394 (35.0%).
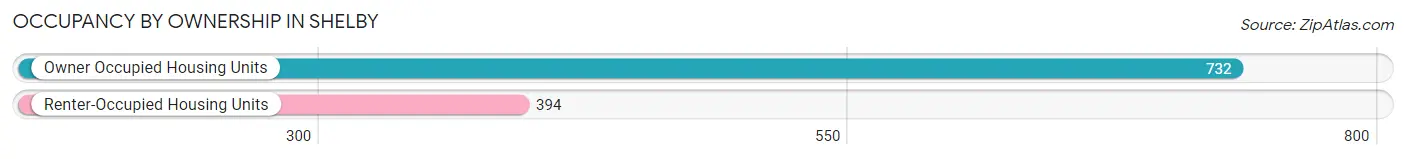
| Occupancy | # Housing Units | % Housing Units |
| Owner Occupied Housing Units | 732 | 65.0% |
| Renter-Occupied Housing Units | 394 | 35.0% |
| Total Occupied Housing Units | 1,126 | 100.0% |
Occupancy by Household Size in Shelby
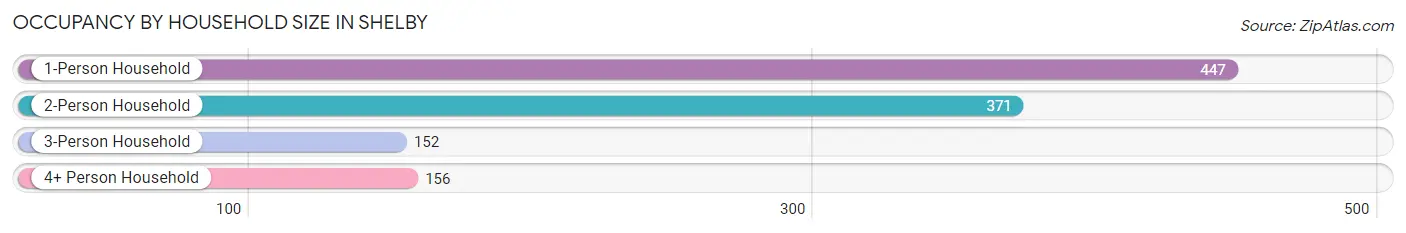
| Household Size | # Housing Units | % Housing Units |
| 1-Person Household | 447 | 39.7% |
| 2-Person Household | 371 | 33.0% |
| 3-Person Household | 152 | 13.5% |
| 4+ Person Household | 156 | 13.9% |
| Total Housing Units | 1,126 | 100.0% |
Occupancy by Ownership by Household Size in Shelby
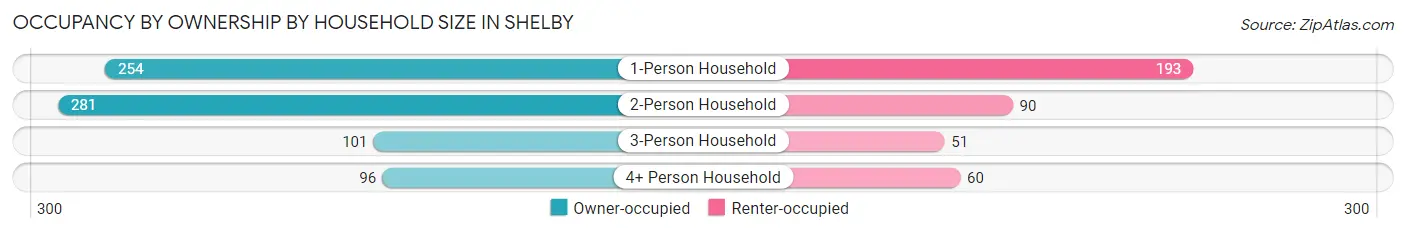
| Household Size | Owner-occupied | Renter-occupied |
| 1-Person Household | 254 (56.8%) | 193 (43.2%) |
| 2-Person Household | 281 (75.7%) | 90 (24.3%) |
| 3-Person Household | 101 (66.4%) | 51 (33.6%) |
| 4+ Person Household | 96 (61.5%) | 60 (38.5%) |
| Total Housing Units | 732 (65.0%) | 394 (35.0%) |
Occupancy by Educational Attainment in Shelby
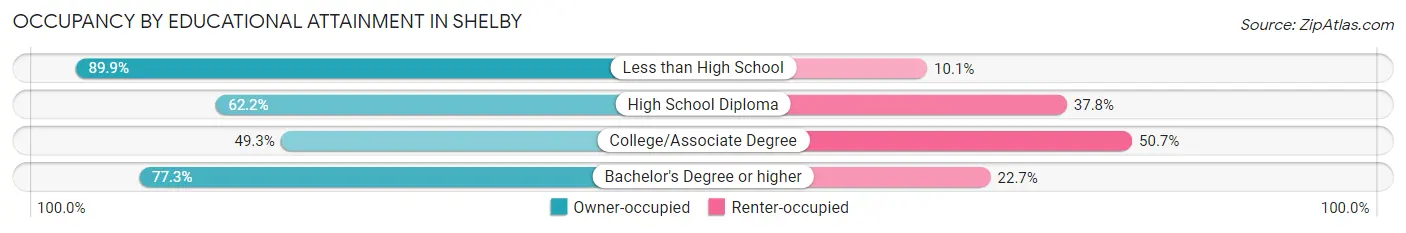
| Household Size | Owner-occupied | Renter-occupied |
| Less than High School | 80 (89.9%) | 9 (10.1%) |
| High School Diploma | 227 (62.2%) | 138 (37.8%) |
| College/Associate Degree | 166 (49.3%) | 171 (50.7%) |
| Bachelor's Degree or higher | 259 (77.3%) | 76 (22.7%) |
Occupancy by Age of Householder in Shelby
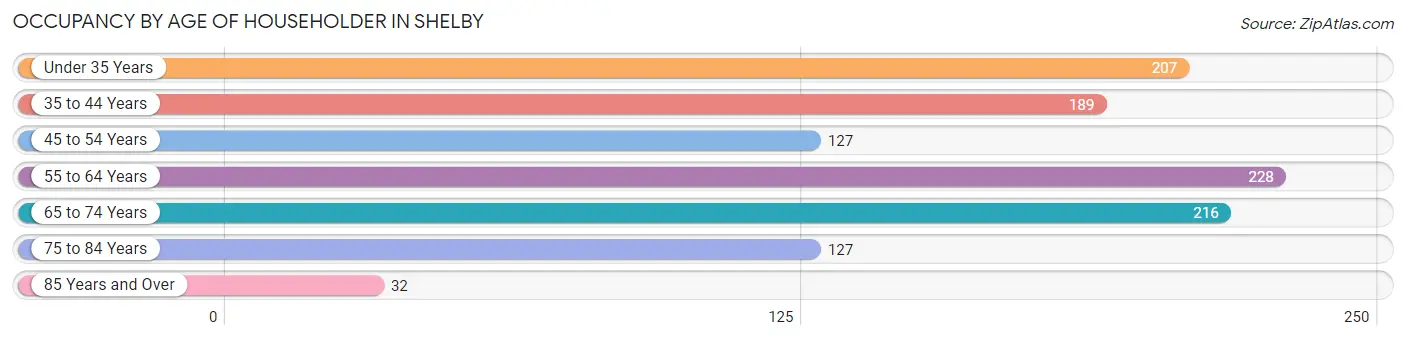
| Age Bracket | # Households | % Households |
| Under 35 Years | 207 | 18.4% |
| 35 to 44 Years | 189 | 16.8% |
| 45 to 54 Years | 127 | 11.3% |
| 55 to 64 Years | 228 | 20.3% |
| 65 to 74 Years | 216 | 19.2% |
| 75 to 84 Years | 127 | 11.3% |
| 85 Years and Over | 32 | 2.8% |
| Total | 1,126 | 100.0% |
Housing Finances in Shelby
Median Income by Occupancy in Shelby
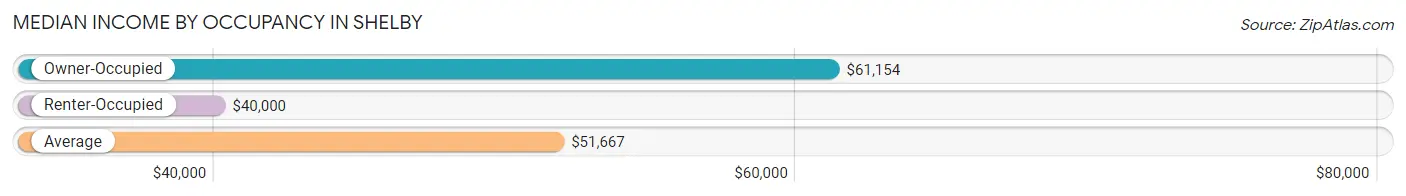
| Occupancy Type | # Households | Median Income |
| Owner-Occupied | 732 (65.0%) | $61,154 |
| Renter-Occupied | 394 (35.0%) | $40,000 |
| Average | 1,126 (100.0%) | $51,667 |
Occupancy by Householder Income Bracket in Shelby
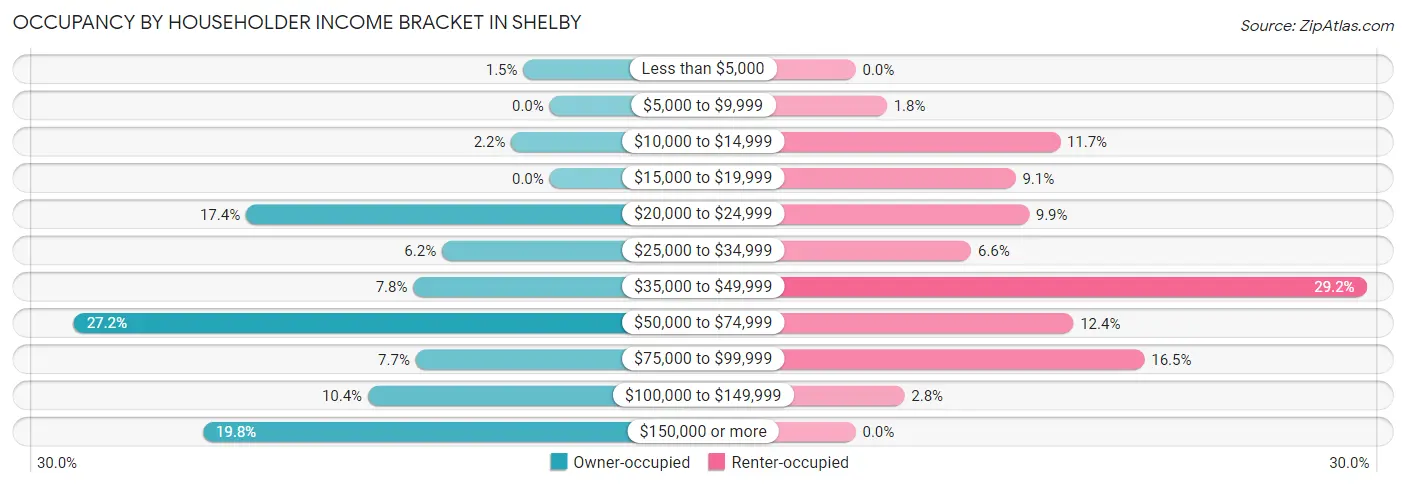
| Income Bracket | Owner-occupied | Renter-occupied |
| Less than $5,000 | 11 (1.5%) | 0 (0.0%) |
| $5,000 to $9,999 | 0 (0.0%) | 7 (1.8%) |
| $10,000 to $14,999 | 16 (2.2%) | 46 (11.7%) |
| $15,000 to $19,999 | 0 (0.0%) | 36 (9.1%) |
| $20,000 to $24,999 | 127 (17.3%) | 39 (9.9%) |
| $25,000 to $34,999 | 45 (6.1%) | 26 (6.6%) |
| $35,000 to $49,999 | 57 (7.8%) | 115 (29.2%) |
| $50,000 to $74,999 | 199 (27.2%) | 49 (12.4%) |
| $75,000 to $99,999 | 56 (7.6%) | 65 (16.5%) |
| $100,000 to $149,999 | 76 (10.4%) | 11 (2.8%) |
| $150,000 or more | 145 (19.8%) | 0 (0.0%) |
| Total | 732 (100.0%) | 394 (100.0%) |
Monthly Housing Cost Tiers in Shelby
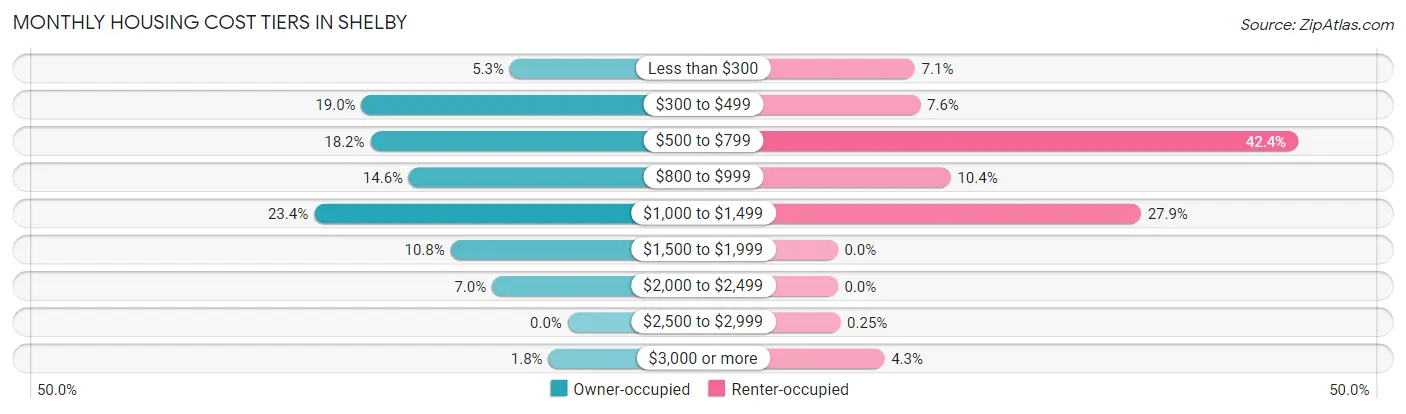
| Monthly Cost | Owner-occupied | Renter-occupied |
| Less than $300 | 39 (5.3%) | 28 (7.1%) |
| $300 to $499 | 139 (19.0%) | 30 (7.6%) |
| $500 to $799 | 133 (18.2%) | 167 (42.4%) |
| $800 to $999 | 107 (14.6%) | 41 (10.4%) |
| $1,000 to $1,499 | 171 (23.4%) | 110 (27.9%) |
| $1,500 to $1,999 | 79 (10.8%) | 0 (0.0%) |
| $2,000 to $2,499 | 51 (7.0%) | 0 (0.0%) |
| $2,500 to $2,999 | 0 (0.0%) | 1 (0.3%) |
| $3,000 or more | 13 (1.8%) | 17 (4.3%) |
| Total | 732 (100.0%) | 394 (100.0%) |
Physical Housing Characteristics in Shelby
Housing Structures in Shelby
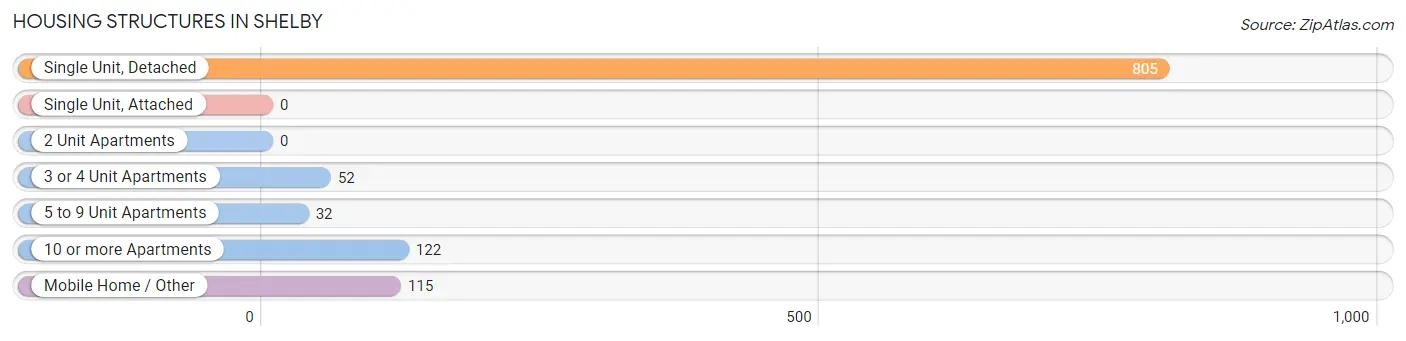
| Structure Type | # Housing Units | % Housing Units |
| Single Unit, Detached | 805 | 71.5% |
| Single Unit, Attached | 0 | 0.0% |
| 2 Unit Apartments | 0 | 0.0% |
| 3 or 4 Unit Apartments | 52 | 4.6% |
| 5 to 9 Unit Apartments | 32 | 2.8% |
| 10 or more Apartments | 122 | 10.8% |
| Mobile Home / Other | 115 | 10.2% |
| Total | 1,126 | 100.0% |
Housing Structures by Occupancy in Shelby
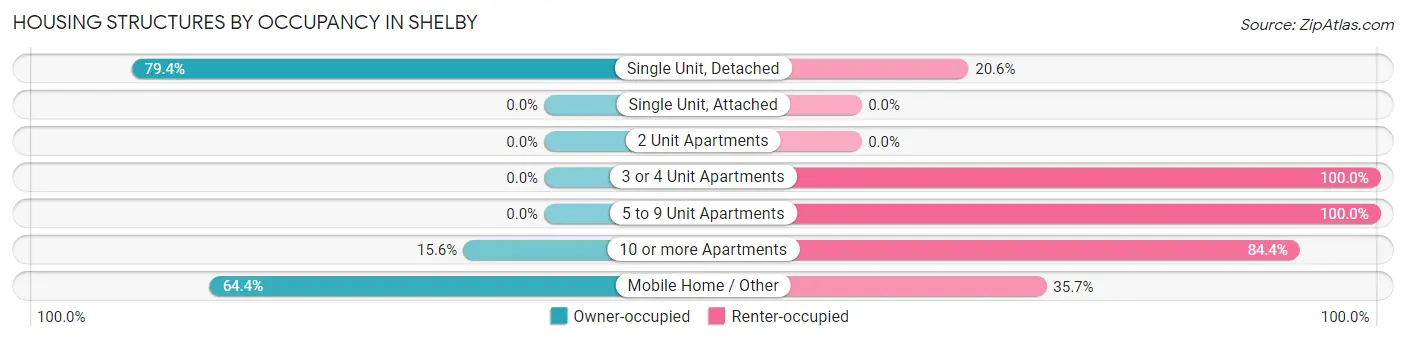
| Structure Type | Owner-occupied | Renter-occupied |
| Single Unit, Detached | 639 (79.4%) | 166 (20.6%) |
| Single Unit, Attached | 0 (0.0%) | 0 (0.0%) |
| 2 Unit Apartments | 0 (0.0%) | 0 (0.0%) |
| 3 or 4 Unit Apartments | 0 (0.0%) | 52 (100.0%) |
| 5 to 9 Unit Apartments | 0 (0.0%) | 32 (100.0%) |
| 10 or more Apartments | 19 (15.6%) | 103 (84.4%) |
| Mobile Home / Other | 74 (64.3%) | 41 (35.6%) |
| Total | 732 (65.0%) | 394 (35.0%) |
Housing Structures by Number of Rooms in Shelby
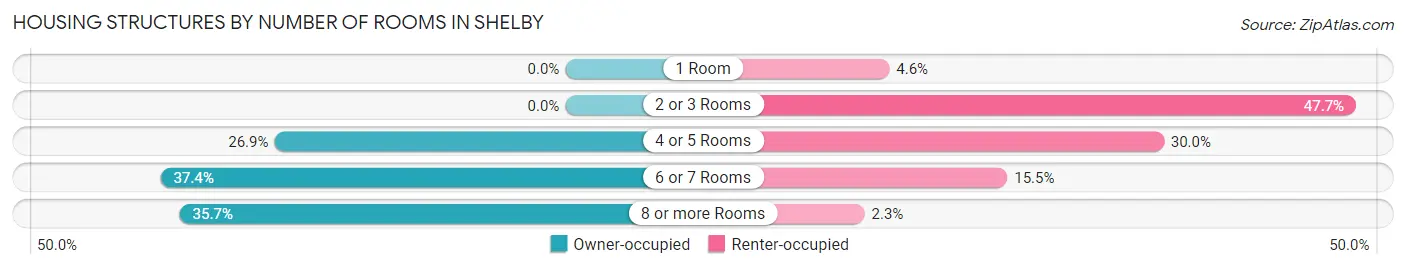
| Number of Rooms | Owner-occupied | Renter-occupied |
| 1 Room | 0 (0.0%) | 18 (4.6%) |
| 2 or 3 Rooms | 0 (0.0%) | 188 (47.7%) |
| 4 or 5 Rooms | 197 (26.9%) | 118 (29.9%) |
| 6 or 7 Rooms | 274 (37.4%) | 61 (15.5%) |
| 8 or more Rooms | 261 (35.7%) | 9 (2.3%) |
| Total | 732 (100.0%) | 394 (100.0%) |
Housing Structure by Heating Type in Shelby
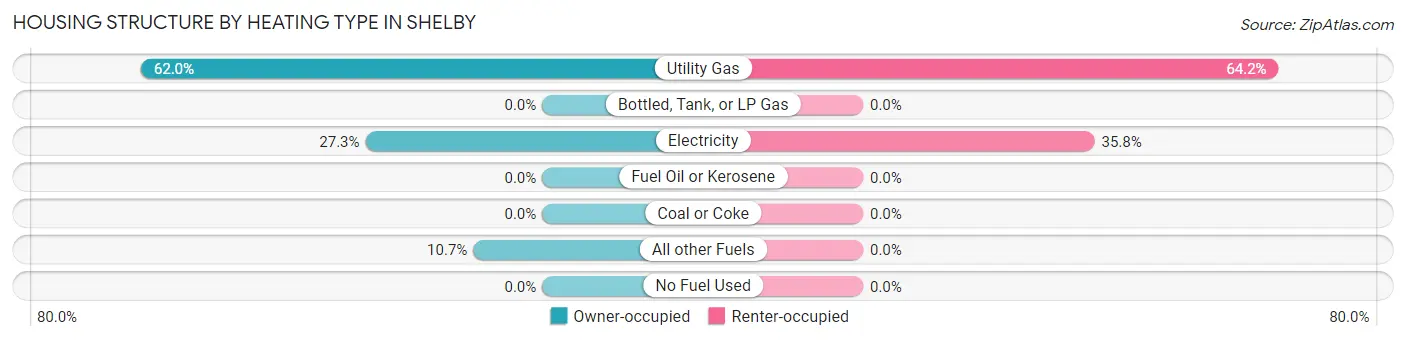
| Heating Type | Owner-occupied | Renter-occupied |
| Utility Gas | 454 (62.0%) | 253 (64.2%) |
| Bottled, Tank, or LP Gas | 0 (0.0%) | 0 (0.0%) |
| Electricity | 200 (27.3%) | 141 (35.8%) |
| Fuel Oil or Kerosene | 0 (0.0%) | 0 (0.0%) |
| Coal or Coke | 0 (0.0%) | 0 (0.0%) |
| All other Fuels | 78 (10.7%) | 0 (0.0%) |
| No Fuel Used | 0 (0.0%) | 0 (0.0%) |
| Total | 732 (100.0%) | 394 (100.0%) |
Household Vehicle Usage in Shelby
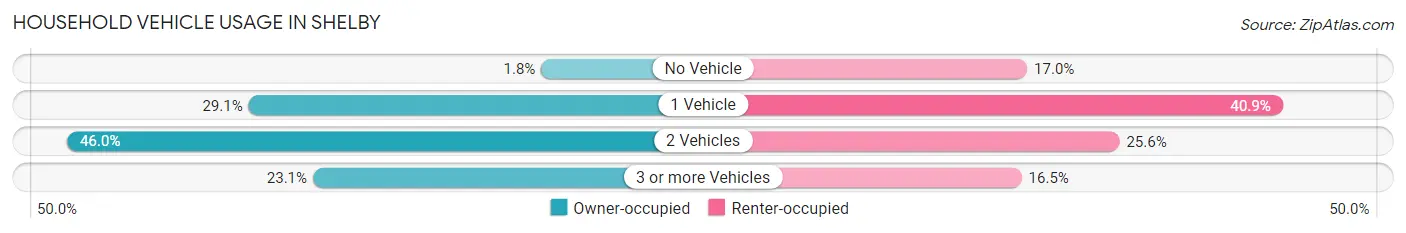
| Vehicles per Household | Owner-occupied | Renter-occupied |
| No Vehicle | 13 (1.8%) | 67 (17.0%) |
| 1 Vehicle | 213 (29.1%) | 161 (40.9%) |
| 2 Vehicles | 337 (46.0%) | 101 (25.6%) |
| 3 or more Vehicles | 169 (23.1%) | 65 (16.5%) |
| Total | 732 (100.0%) | 394 (100.0%) |
Real Estate & Mortgages in Shelby
Real Estate and Mortgage Overview in Shelby
| Characteristic | Without Mortgage | With Mortgage |
| Housing Units | 284 | 448 |
| Median Property Value | $128,500 | $201,900 |
| Median Household Income | $51,316 | $128 |
| Monthly Housing Costs | $457 | $13 |
| Real Estate Taxes | $1,481 | $0 |
Property Value by Mortgage Status in Shelby
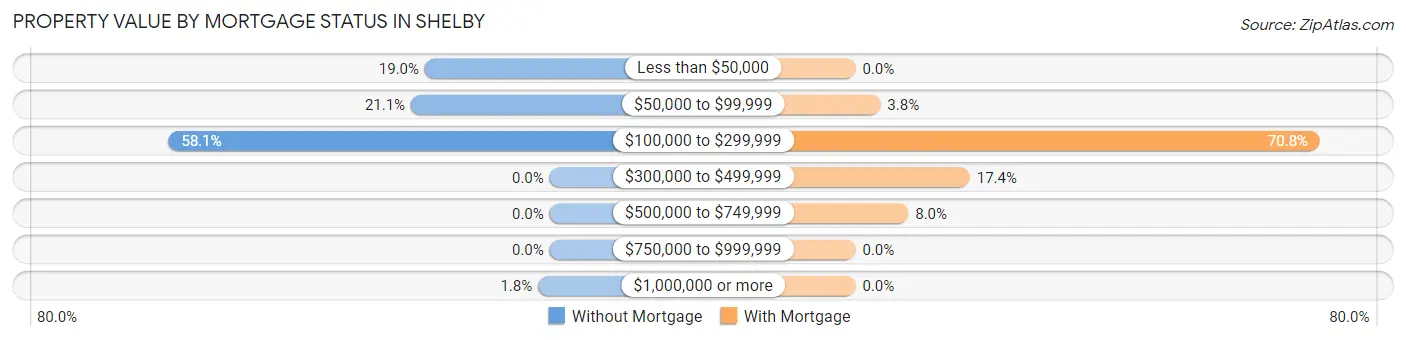
| Property Value | Without Mortgage | With Mortgage |
| Less than $50,000 | 54 (19.0%) | 0 (0.0%) |
| $50,000 to $99,999 | 60 (21.1%) | 17 (3.8%) |
| $100,000 to $299,999 | 165 (58.1%) | 317 (70.8%) |
| $300,000 to $499,999 | 0 (0.0%) | 78 (17.4%) |
| $500,000 to $749,999 | 0 (0.0%) | 36 (8.0%) |
| $750,000 to $999,999 | 0 (0.0%) | 0 (0.0%) |
| $1,000,000 or more | 5 (1.8%) | 0 (0.0%) |
| Total | 284 (100.0%) | 448 (100.0%) |
Household Income by Mortgage Status in Shelby
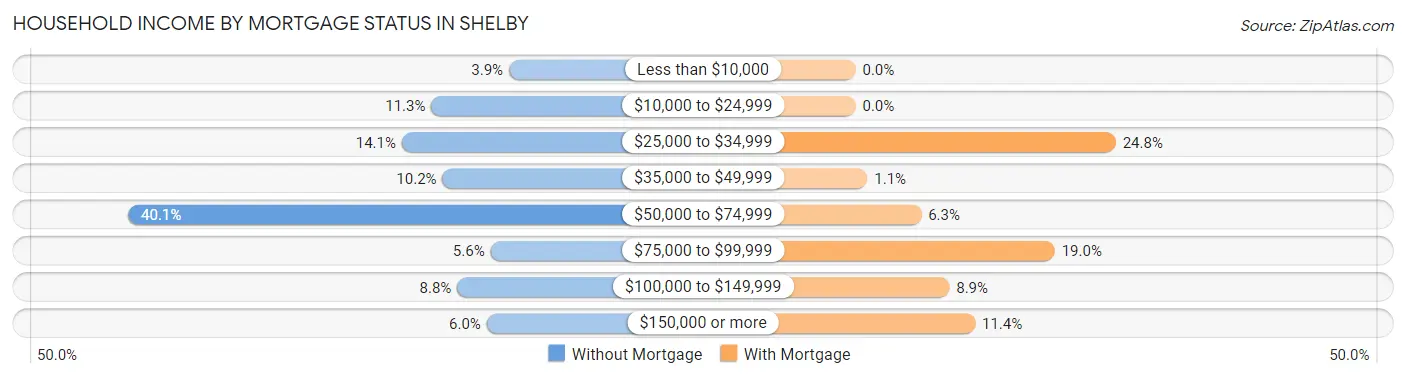
| Household Income | Without Mortgage | With Mortgage |
| Less than $10,000 | 11 (3.9%) | 0 (0.0%) |
| $10,000 to $24,999 | 32 (11.3%) | 0 (0.0%) |
| $25,000 to $34,999 | 40 (14.1%) | 111 (24.8%) |
| $35,000 to $49,999 | 29 (10.2%) | 5 (1.1%) |
| $50,000 to $74,999 | 114 (40.1%) | 28 (6.2%) |
| $75,000 to $99,999 | 16 (5.6%) | 85 (19.0%) |
| $100,000 to $149,999 | 25 (8.8%) | 40 (8.9%) |
| $150,000 or more | 17 (6.0%) | 51 (11.4%) |
| Total | 284 (100.0%) | 448 (100.0%) |
Property Value to Household Income Ratio in Shelby
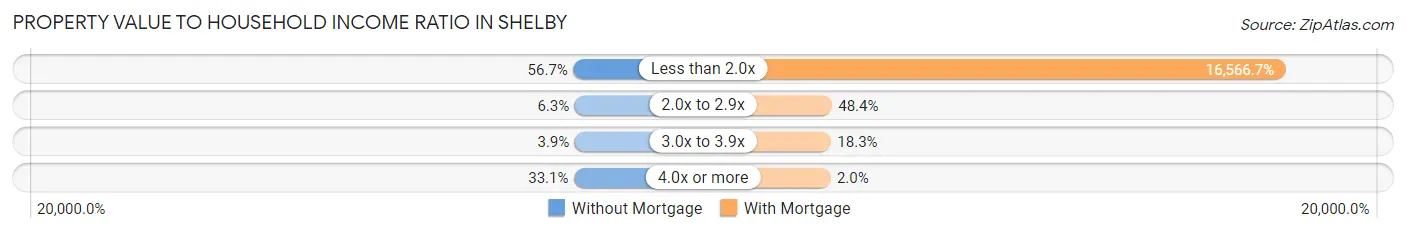
| Value-to-Income Ratio | Without Mortgage | With Mortgage |
| Less than 2.0x | 161 (56.7%) | 74,219 (16,566.7%) |
| 2.0x to 2.9x | 18 (6.3%) | 217 (48.4%) |
| 3.0x to 3.9x | 11 (3.9%) | 82 (18.3%) |
| 4.0x or more | 94 (33.1%) | 9 (2.0%) |
| Total | 284 (100.0%) | 448 (100.0%) |
Real Estate Taxes by Mortgage Status in Shelby
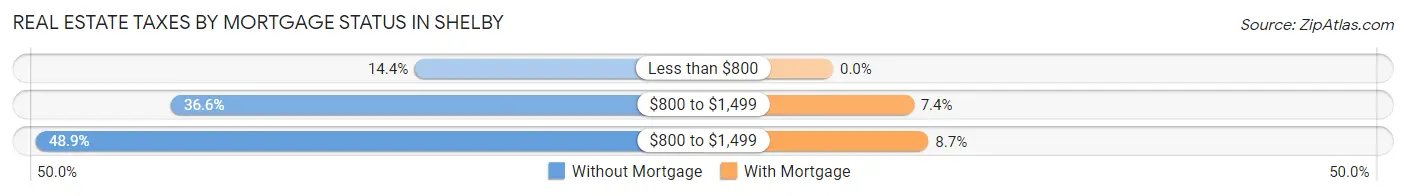
| Property Taxes | Without Mortgage | With Mortgage |
| Less than $800 | 41 (14.4%) | 0 (0.0%) |
| $800 to $1,499 | 104 (36.6%) | 33 (7.4%) |
| $800 to $1,499 | 139 (48.9%) | 39 (8.7%) |
| Total | 284 (100.0%) | 448 (100.0%) |
Health & Disability in Shelby
Health Insurance Coverage by Age in Shelby
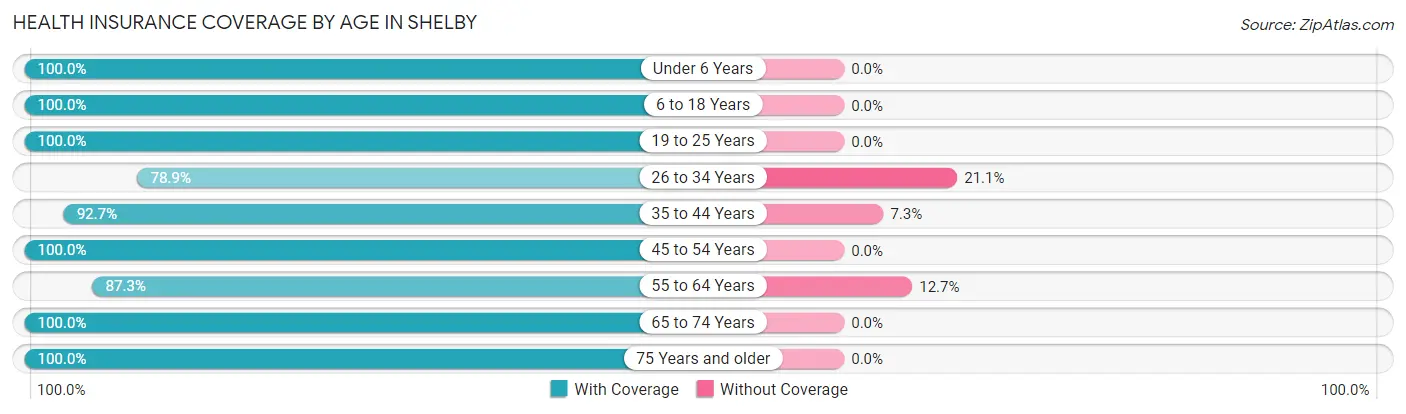
| Age Bracket | With Coverage | Without Coverage |
| Under 6 Years | 167 (100.0%) | 0 (0.0%) |
| 6 to 18 Years | 342 (100.0%) | 0 (0.0%) |
| 19 to 25 Years | 144 (100.0%) | 0 (0.0%) |
| 26 to 34 Years | 251 (78.9%) | 67 (21.1%) |
| 35 to 44 Years | 343 (92.7%) | 27 (7.3%) |
| 45 to 54 Years | 224 (100.0%) | 0 (0.0%) |
| 55 to 64 Years | 365 (87.3%) | 53 (12.7%) |
| 65 to 74 Years | 287 (100.0%) | 0 (0.0%) |
| 75 Years and older | 190 (100.0%) | 0 (0.0%) |
| Total | 2,313 (94.0%) | 147 (6.0%) |
Health Insurance Coverage by Citizenship Status in Shelby
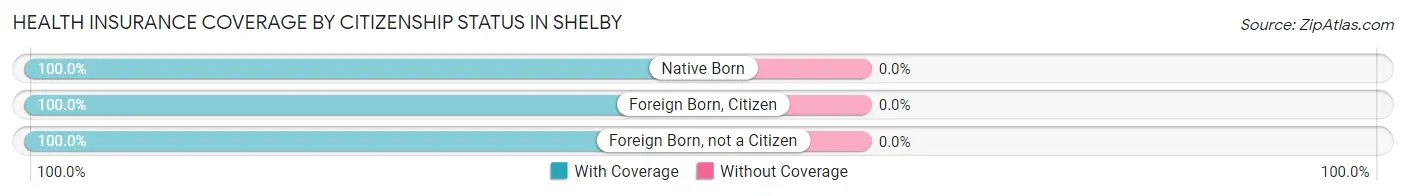
| Citizenship Status | With Coverage | Without Coverage |
| Native Born | 167 (100.0%) | 0 (0.0%) |
| Foreign Born, Citizen | 342 (100.0%) | 0 (0.0%) |
| Foreign Born, not a Citizen | 144 (100.0%) | 0 (0.0%) |
Health Insurance Coverage by Household Income in Shelby
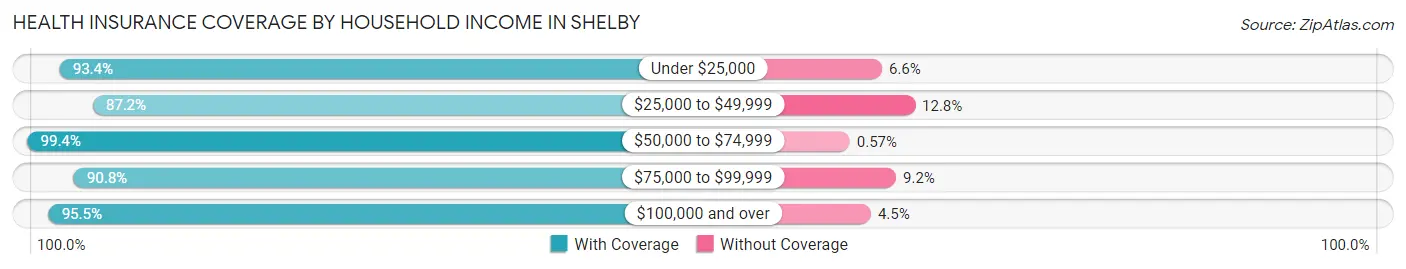
| Household Income | With Coverage | Without Coverage |
| Under $25,000 | 354 (93.4%) | 25 (6.6%) |
| $25,000 to $49,999 | 402 (87.2%) | 59 (12.8%) |
| $50,000 to $74,999 | 696 (99.4%) | 4 (0.6%) |
| $75,000 to $99,999 | 334 (90.8%) | 34 (9.2%) |
| $100,000 and over | 527 (95.5%) | 25 (4.5%) |
Public vs Private Health Insurance Coverage by Age in Shelby
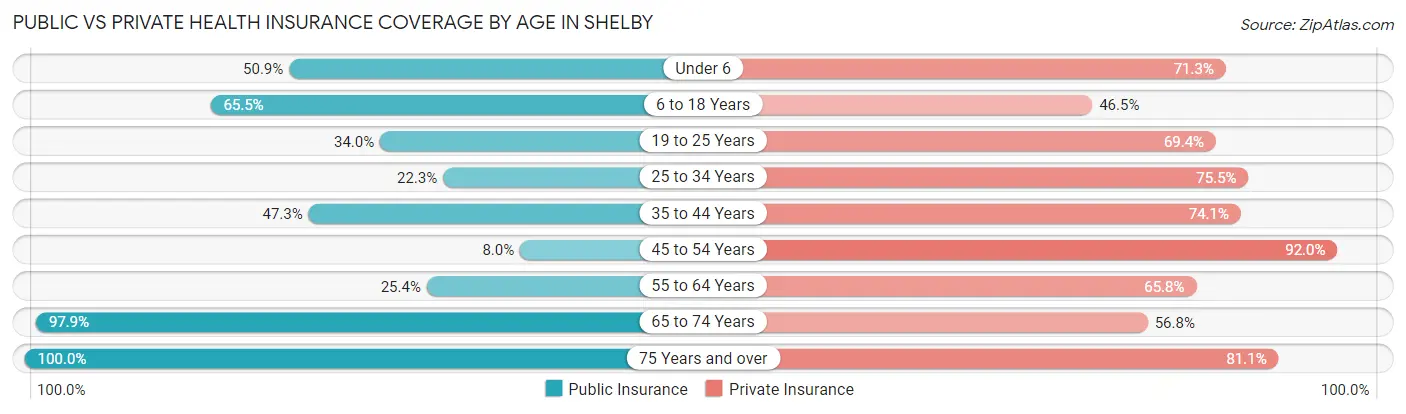
| Age Bracket | Public Insurance | Private Insurance |
| Under 6 | 85 (50.9%) | 119 (71.3%) |
| 6 to 18 Years | 224 (65.5%) | 159 (46.5%) |
| 19 to 25 Years | 49 (34.0%) | 100 (69.4%) |
| 25 to 34 Years | 71 (22.3%) | 240 (75.5%) |
| 35 to 44 Years | 175 (47.3%) | 274 (74.1%) |
| 45 to 54 Years | 18 (8.0%) | 206 (92.0%) |
| 55 to 64 Years | 106 (25.4%) | 275 (65.8%) |
| 65 to 74 Years | 281 (97.9%) | 163 (56.8%) |
| 75 Years and over | 190 (100.0%) | 154 (81.0%) |
| Total | 1,199 (48.7%) | 1,690 (68.7%) |
Disability Status by Sex by Age in Shelby
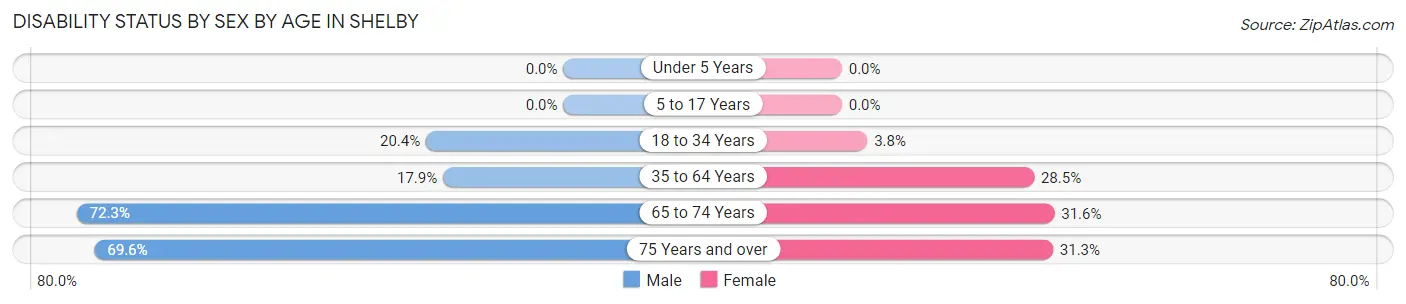
| Age Bracket | Male | Female |
| Under 5 Years | 0 (0.0%) | 0 (0.0%) |
| 5 to 17 Years | 0 (0.0%) | 0 (0.0%) |
| 18 to 34 Years | 63 (20.4%) | 7 (3.8%) |
| 35 to 64 Years | 100 (17.9%) | 129 (28.5%) |
| 65 to 74 Years | 86 (72.3%) | 53 (31.6%) |
| 75 Years and over | 39 (69.6%) | 42 (31.3%) |
Disability Class by Sex by Age in Shelby
Disability Class: Hearing Difficulty
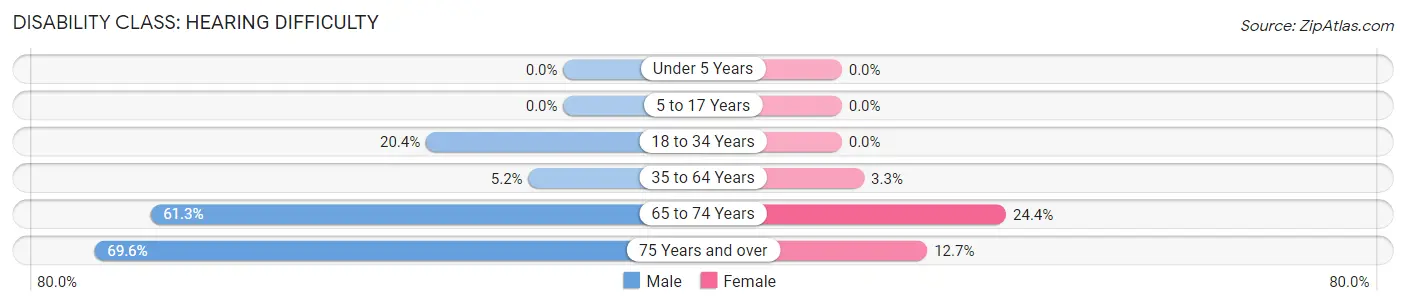
| Age Bracket | Male | Female |
| Under 5 Years | 0 (0.0%) | 0 (0.0%) |
| 5 to 17 Years | 0 (0.0%) | 0 (0.0%) |
| 18 to 34 Years | 63 (20.4%) | 0 (0.0%) |
| 35 to 64 Years | 29 (5.2%) | 15 (3.3%) |
| 65 to 74 Years | 73 (61.3%) | 41 (24.4%) |
| 75 Years and over | 39 (69.6%) | 17 (12.7%) |
Disability Class: Vision Difficulty
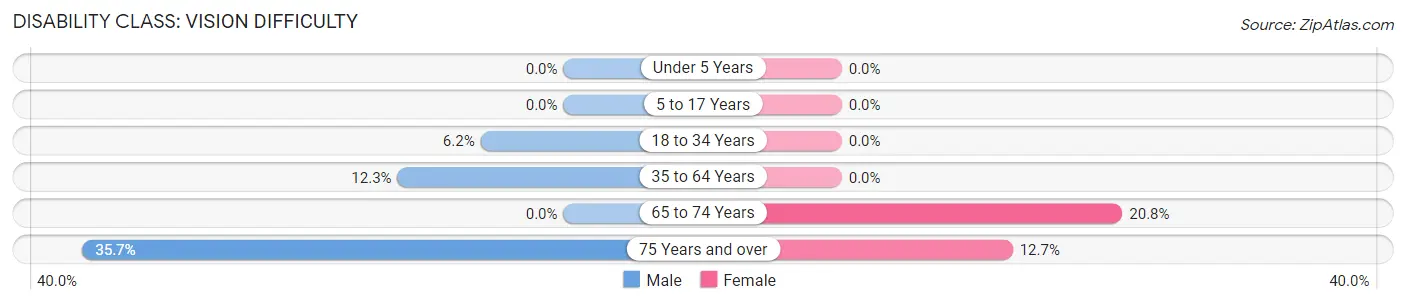
| Age Bracket | Male | Female |
| Under 5 Years | 0 (0.0%) | 0 (0.0%) |
| 5 to 17 Years | 0 (0.0%) | 0 (0.0%) |
| 18 to 34 Years | 19 (6.1%) | 0 (0.0%) |
| 35 to 64 Years | 69 (12.3%) | 0 (0.0%) |
| 65 to 74 Years | 0 (0.0%) | 35 (20.8%) |
| 75 Years and over | 20 (35.7%) | 17 (12.7%) |
Disability Class: Cognitive Difficulty
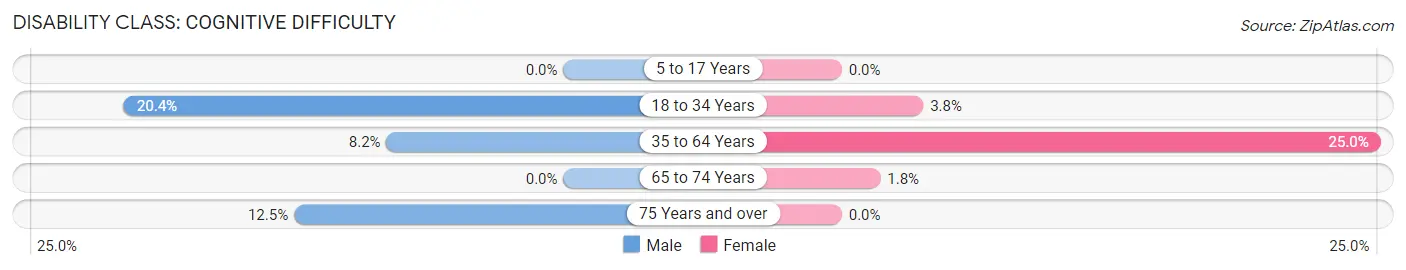
| Age Bracket | Male | Female |
| 5 to 17 Years | 0 (0.0%) | 0 (0.0%) |
| 18 to 34 Years | 63 (20.4%) | 7 (3.8%) |
| 35 to 64 Years | 46 (8.2%) | 113 (25.0%) |
| 65 to 74 Years | 0 (0.0%) | 3 (1.8%) |
| 75 Years and over | 7 (12.5%) | 0 (0.0%) |
Disability Class: Ambulatory Difficulty
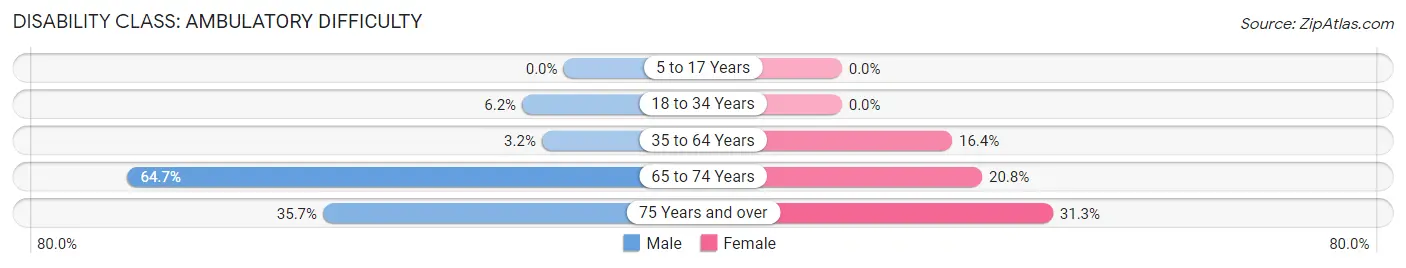
| Age Bracket | Male | Female |
| 5 to 17 Years | 0 (0.0%) | 0 (0.0%) |
| 18 to 34 Years | 19 (6.1%) | 0 (0.0%) |
| 35 to 64 Years | 18 (3.2%) | 74 (16.4%) |
| 65 to 74 Years | 77 (64.7%) | 35 (20.8%) |
| 75 Years and over | 20 (35.7%) | 42 (31.3%) |
Disability Class: Self-Care Difficulty
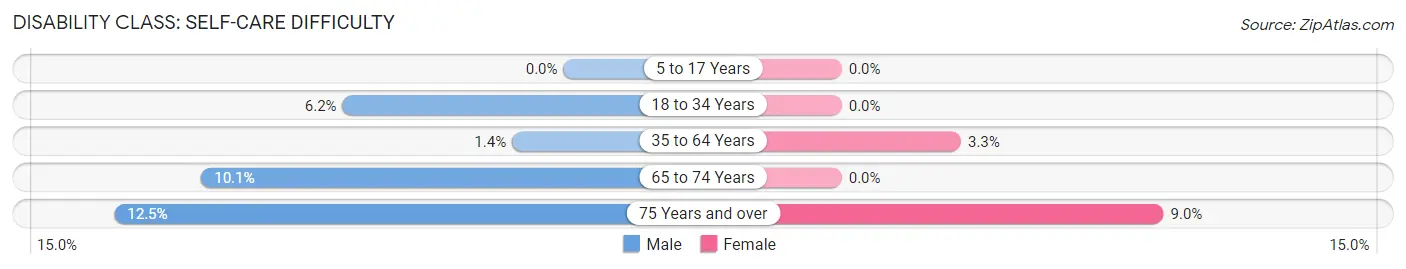
| Age Bracket | Male | Female |
| 5 to 17 Years | 0 (0.0%) | 0 (0.0%) |
| 18 to 34 Years | 19 (6.1%) | 0 (0.0%) |
| 35 to 64 Years | 8 (1.4%) | 15 (3.3%) |
| 65 to 74 Years | 12 (10.1%) | 0 (0.0%) |
| 75 Years and over | 7 (12.5%) | 12 (9.0%) |
Technology Access in Shelby
Computing Device Access in Shelby
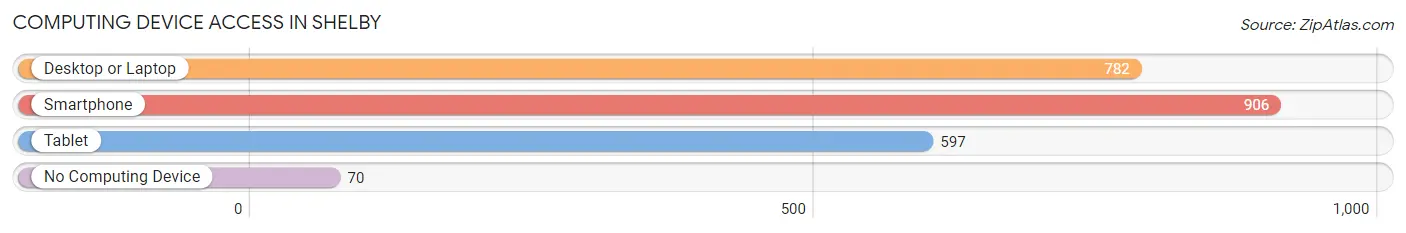
| Device Type | # Households | % Households |
| Desktop or Laptop | 782 | 69.5% |
| Smartphone | 906 | 80.5% |
| Tablet | 597 | 53.0% |
| No Computing Device | 70 | 6.2% |
| Total | 1,126 | 100.0% |
Internet Access in Shelby
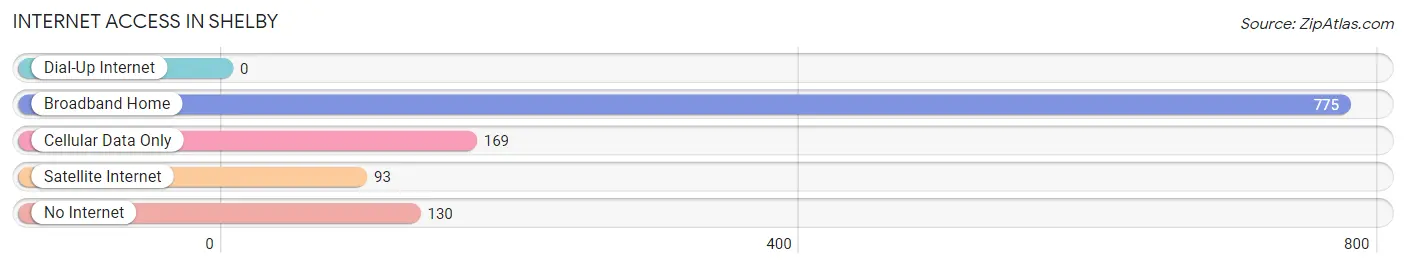
| Internet Type | # Households | % Households |
| Dial-Up Internet | 0 | 0.0% |
| Broadband Home | 775 | 68.8% |
| Cellular Data Only | 169 | 15.0% |
| Satellite Internet | 93 | 8.3% |
| No Internet | 130 | 11.6% |
| Total | 1,126 | 100.0% |
Shelby Summary
Shelby, Montana is a small city located in the north-central part of the state, in Toole County. It is situated at the intersection of Interstate 15 and U.S. Highway 2, and is the county seat of Toole County. The city has a population of approximately 3,000 people, and is the largest city in the county.
History
Shelby was founded in 1909, when the Great Northern Railway was built through the area. The city was named after the railroad's president, Charles M. Shelby. The city was incorporated in 1910, and the first mayor was elected in 1911.
The city grew rapidly in the early 20th century, and by the 1920s, it had become a major agricultural center. The city was also home to a large number of oil wells, and the oil industry was a major contributor to the city's economy.
In the 1950s, the city began to experience a decline in population, as many of the oil wells were depleted and the agricultural industry began to decline. However, the city has experienced a resurgence in recent years, as it has become a popular tourist destination.
Geography
Shelby is located in the north-central part of Montana, in Toole County. It is situated at the intersection of Interstate 15 and U.S. Highway 2, and is the county seat of Toole County. The city is located in the Rocky Mountain Front, and is surrounded by the Rocky Mountains to the west and the Great Plains to the east.
The city has a total area of 4.2 square miles, of which 4.1 square miles is land and 0.1 square miles is water. The city is located at an elevation of 3,400 feet above sea level.
Economy
Shelby's economy is largely based on agriculture and tourism. The city is home to a number of farms, and the agricultural industry is a major contributor to the city's economy. The city is also home to a number of tourist attractions, including the Toole County Museum, the Shelby Rodeo, and the Great Northern Railway Museum.
The city is also home to a number of businesses, including a number of restaurants, hotels, and retail stores. The city is also home to a number of manufacturing companies, including a number of oil and gas companies.
Demographics
As of the 2010 census, the city had a population of 3,074 people. The racial makeup of the city was 94.3% White, 0.7% African American, 0.7% Native American, 0.3% Asian, 0.1% Pacific Islander, 1.3% from other races, and 2.6% from two or more races. Hispanic or Latino of any race were 4.2% of the population.
The median income for a household in the city was $37,917, and the median income for a family was $45,938. The per capita income for the city was $19,945. About 11.3% of families and 14.2% of the population were below the poverty line, including 19.2% of those under age 18 and 8.2% of those age 65 or over.
Common Questions
What is Per Capita Income in Shelby?
Per Capita income in Shelby is $30,341.
What is the Median Family Income in Shelby?
Median Family Income in Shelby is $83,750.
What is the Median Household income in Shelby?
Median Household Income in Shelby is $51,667.
What is Income or Wage Gap in Shelby?
Income or Wage Gap in Shelby is 43.2%.
Women in Shelby earn 56.8 cents for every dollar earned by a man.
What is Inequality or Gini Index in Shelby?
Inequality or Gini Index in Shelby is 0.46.
What is the Total Population of Shelby?
Total Population of Shelby is 3,058.
What is the Total Male Population of Shelby?
Total Male Population of Shelby is 1,865.
What is the Total Female Population of Shelby?
Total Female Population of Shelby is 1,193.
What is the Ratio of Males per 100 Females in Shelby?
There are 156.33 Males per 100 Females in Shelby.
What is the Ratio of Females per 100 Males in Shelby?
There are 63.97 Females per 100 Males in Shelby.
What is the Median Population Age in Shelby?
Median Population Age in Shelby is 42.7 Years.
What is the Average Family Size in Shelby
Average Family Size in Shelby is 3.0 People.
What is the Average Household Size in Shelby
Average Household Size in Shelby is 2.2 People.
How Large is the Labor Force in Shelby?
There are 1,279 People in the Labor Forcein in Shelby.
What is the Percentage of People in the Labor Force in Shelby?
47.7% of People are in the Labor Force in Shelby.
What is the Unemployment Rate in Shelby?
Unemployment Rate in Shelby is 1.3%.