Victor, ID Map & Demographics
Victor Map
Victor Overview
$32,129
PER CAPITA INCOME
$105,234
AVG FAMILY INCOME
$70,923
AVG HOUSEHOLD INCOME
33.0%
WAGE / INCOME GAP [ % ]
67.0¢/ $1
WAGE / INCOME GAP [ $ ]
0.38
INEQUALITY / GINI INDEX
2,876
TOTAL POPULATION
1,653
MALE POPULATION
1,223
FEMALE POPULATION
135.16
MALES / 100 FEMALES
73.99
FEMALES / 100 MALES
32.5
MEDIAN AGE
4.0
AVG FAMILY SIZE
3.0
AVG HOUSEHOLD SIZE
1,747
LABOR FORCE [ PEOPLE ]
79.3%
PERCENT IN LABOR FORCE
Victor Zip Codes
Victor Area Codes
Income in Victor
Income Overview in Victor
Per Capita Income in Victor is $32,129, while median incomes of families and households are $105,234 and $70,923 respectively.
| Characteristic | Number | Measure |
| Per Capita Income | 2,876 | $32,129 |
| Median Family Income | 501 | $105,234 |
| Mean Family Income | 501 | $109,096 |
| Median Household Income | 964 | $70,923 |
| Mean Household Income | 964 | $86,930 |
| Income Deficit | 501 | $0 |
| Wage / Income Gap (%) | 2,876 | 33.03% |
| Wage / Income Gap ($) | 2,876 | 66.97¢ per $1 |
| Gini / Inequality Index | 2,876 | 0.38 |
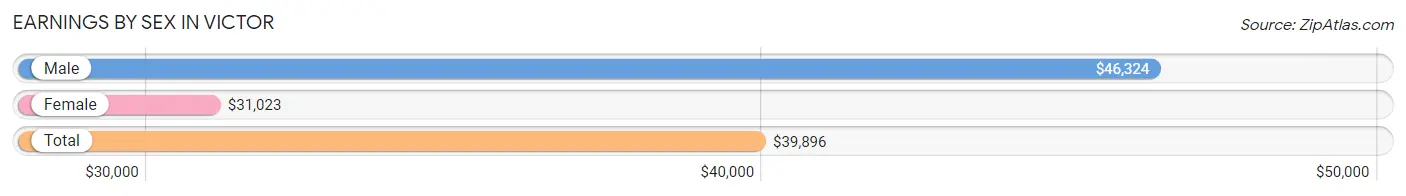
Earnings by Sex in Victor
Average Earnings in Victor are $39,896, $46,324 for men and $31,023 for women, a difference of 33.0%.
| Sex | Number | Average Earnings |
| Male | 1,038 (55.8%) | $46,324 |
| Female | 821 (44.2%) | $31,023 |
| Total | 1,859 (100.0%) | $39,896 |
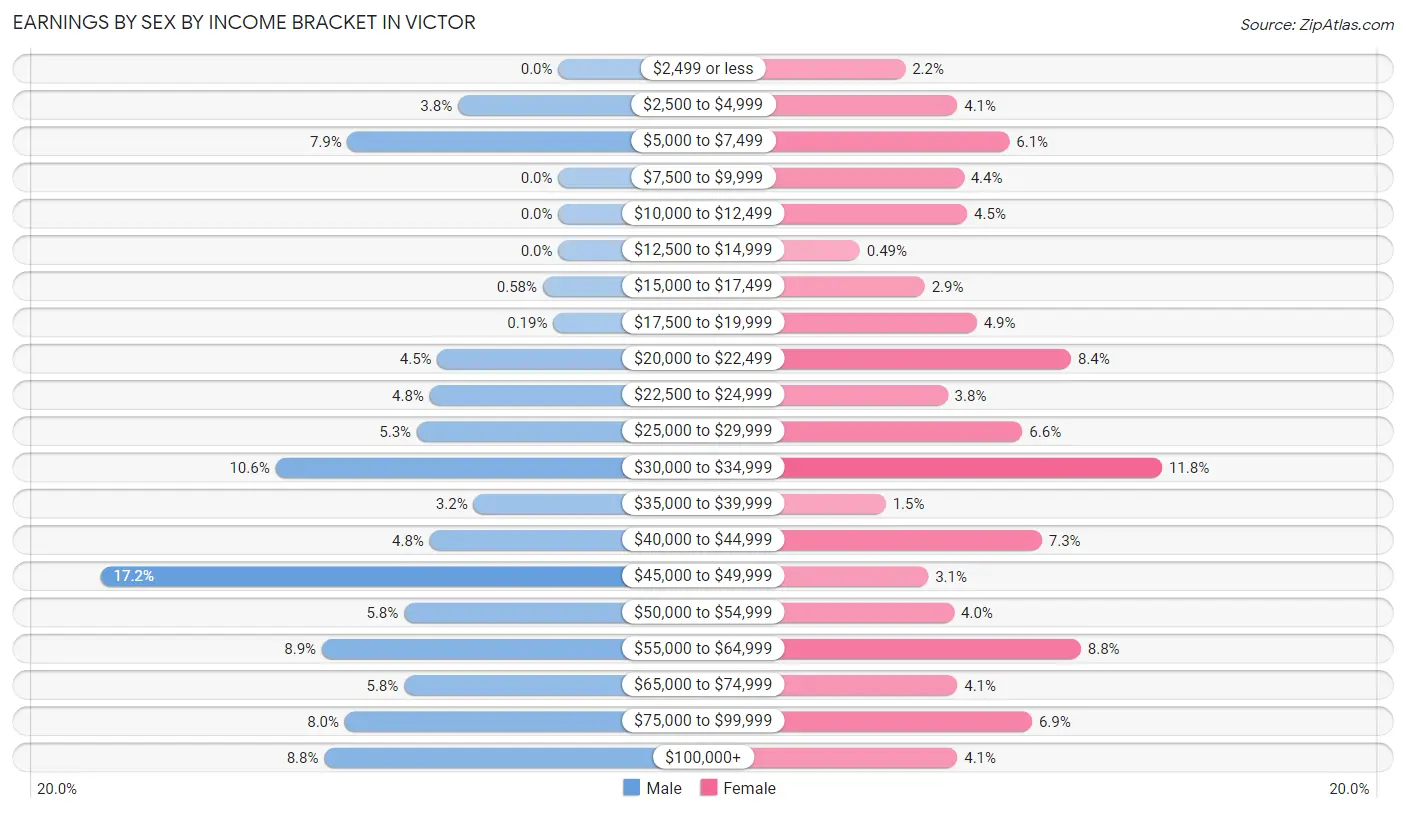
Earnings by Sex by Income Bracket in Victor
The most common earnings brackets in Victor are $45,000 to $49,999 for men (178 | 17.2%) and $30,000 to $34,999 for women (97 | 11.8%).
| Income | Male | Female |
| $2,499 or less | 0 (0.0%) | 18 (2.2%) |
| $2,500 to $4,999 | 39 (3.8%) | 34 (4.1%) |
| $5,000 to $7,499 | 82 (7.9%) | 50 (6.1%) |
| $7,500 to $9,999 | 0 (0.0%) | 36 (4.4%) |
| $10,000 to $12,499 | 0 (0.0%) | 37 (4.5%) |
| $12,500 to $14,999 | 0 (0.0%) | 4 (0.5%) |
| $15,000 to $17,499 | 6 (0.6%) | 24 (2.9%) |
| $17,500 to $19,999 | 2 (0.2%) | 40 (4.9%) |
| $20,000 to $22,499 | 47 (4.5%) | 69 (8.4%) |
| $22,500 to $24,999 | 50 (4.8%) | 31 (3.8%) |
| $25,000 to $29,999 | 55 (5.3%) | 54 (6.6%) |
| $30,000 to $34,999 | 110 (10.6%) | 97 (11.8%) |
| $35,000 to $39,999 | 33 (3.2%) | 12 (1.5%) |
| $40,000 to $44,999 | 50 (4.8%) | 60 (7.3%) |
| $45,000 to $49,999 | 178 (17.2%) | 25 (3.0%) |
| $50,000 to $54,999 | 60 (5.8%) | 33 (4.0%) |
| $55,000 to $64,999 | 92 (8.9%) | 72 (8.8%) |
| $65,000 to $74,999 | 60 (5.8%) | 34 (4.1%) |
| $75,000 to $99,999 | 83 (8.0%) | 57 (6.9%) |
| $100,000+ | 91 (8.8%) | 34 (4.1%) |
| Total | 1,038 (100.0%) | 821 (100.0%) |
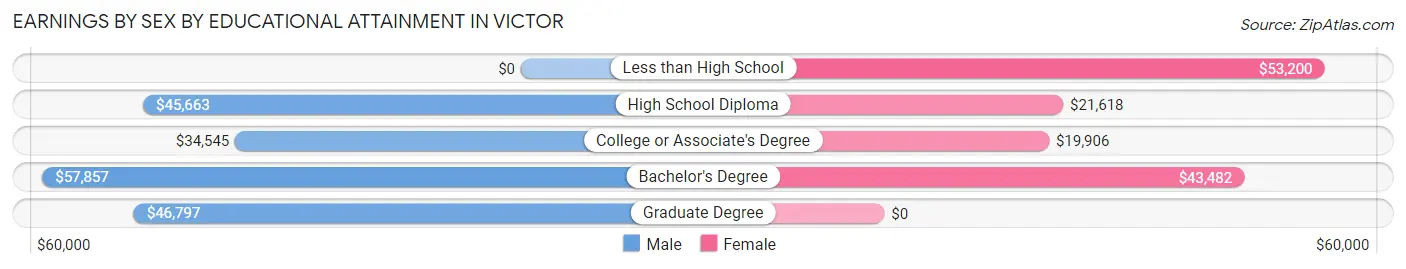
Earnings by Sex by Educational Attainment in Victor
Average earnings in Victor are $48,320 for men and $33,333 for women, a difference of 31.0%. Men with an educational attainment of bachelor's degree enjoy the highest average annual earnings of $57,857, while those with college or associate's degree education earn the least with $34,545. Women with an educational attainment of less than high school earn the most with the average annual earnings of $53,200, while those with college or associate's degree education have the smallest earnings of $19,906.
| Educational Attainment | Male Income | Female Income |
| Less than High School | - | - |
| High School Diploma | $45,663 | $21,618 |
| College or Associate's Degree | $34,545 | $19,906 |
| Bachelor's Degree | $57,857 | $43,482 |
| Graduate Degree | $46,797 | $0 |
| Total | $48,320 | $33,333 |
Family Income in Victor
Family Income Brackets in Victor
According to the Victor family income data, there are 179 families falling into the $100,000 to $149,999 income range, which is the most common income bracket and makes up 35.7% of all families.
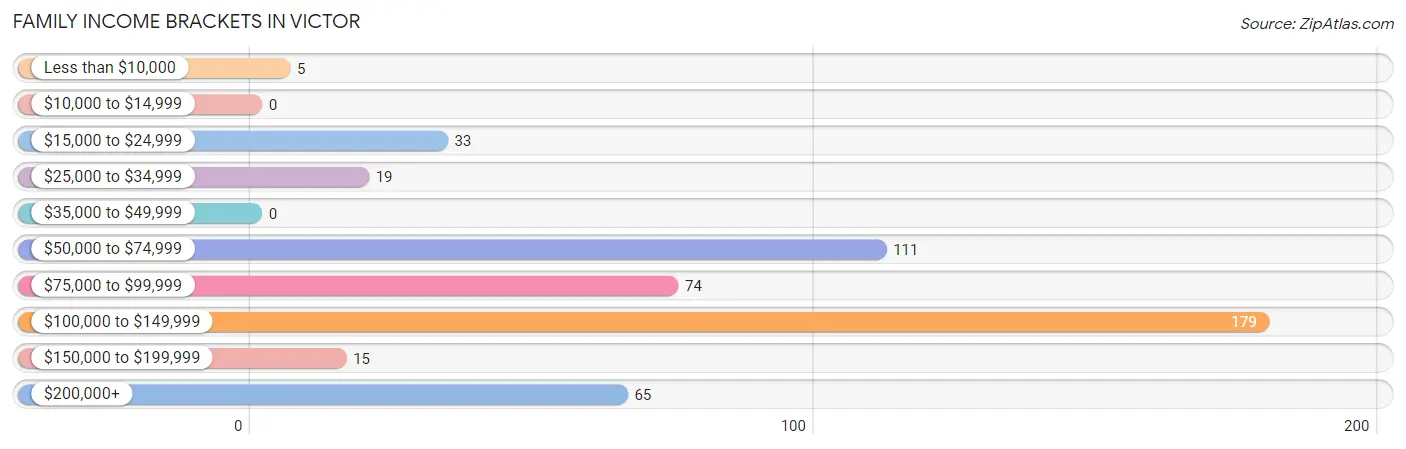
| Income Bracket | # Families | % Families |
| Less than $10,000 | 5 | 1.0% |
| $10,000 to $14,999 | 0 | 0.0% |
| $15,000 to $24,999 | 33 | 6.6% |
| $25,000 to $34,999 | 19 | 3.8% |
| $35,000 to $49,999 | 0 | 0.0% |
| $50,000 to $74,999 | 111 | 22.2% |
| $75,000 to $99,999 | 74 | 14.8% |
| $100,000 to $149,999 | 179 | 35.7% |
| $150,000 to $199,999 | 15 | 3.0% |
| $200,000+ | 65 | 13.0% |
Family Income by Famaliy Size in Victor
4-person families (181 | 36.1%) account for the highest median family income in Victor with $120,605 per family, while 2-person families (191 | 38.1%) have the highest median income of $40,486 per family member.
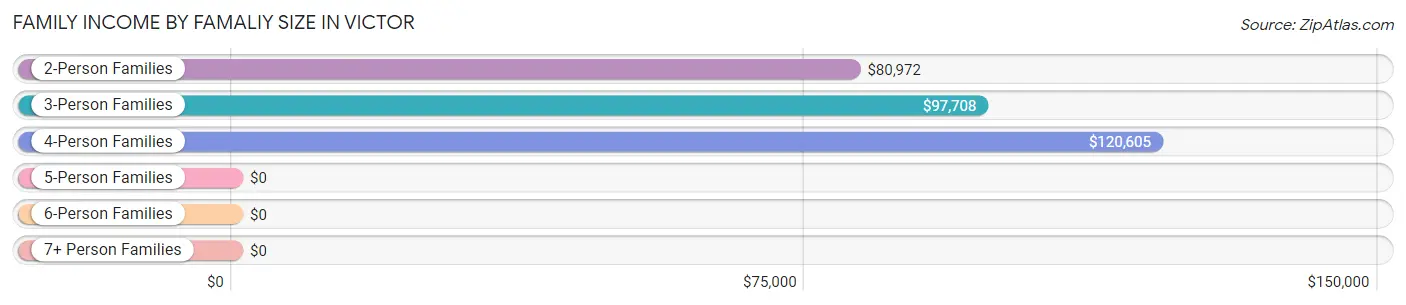
| Income Bracket | # Families | Median Income |
| 2-Person Families | 191 (38.1%) | $80,972 |
| 3-Person Families | 71 (14.2%) | $97,708 |
| 4-Person Families | 181 (36.1%) | $120,605 |
| 5-Person Families | 58 (11.6%) | $0 |
| 6-Person Families | 0 (0.0%) | $0 |
| 7+ Person Families | 0 (0.0%) | $0 |
| Total | 501 (100.0%) | $105,234 |
Family Income by Number of Earners in Victor
The median family income in Victor is $105,234, with families comprising 3+ earners (70) having the highest median family income of $122,258, while families with no earners (31) have the lowest median family income of $21,313, accounting for 14.0% and 6.2% of families, respectively.
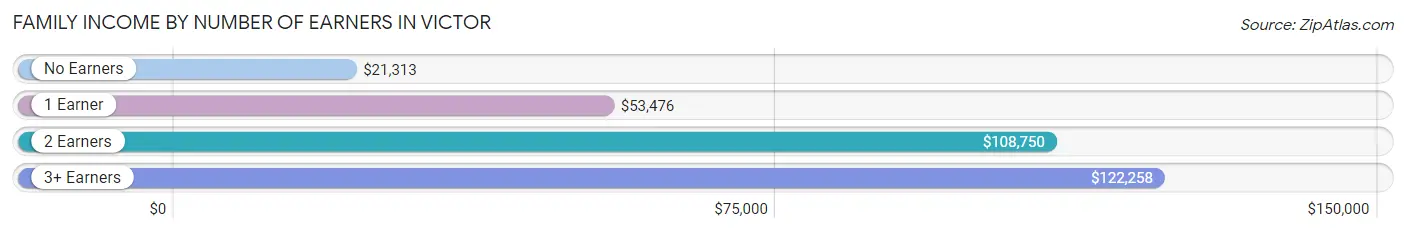
| Number of Earners | # Families | Median Income |
| No Earners | 31 (6.2%) | $21,313 |
| 1 Earner | 86 (17.2%) | $53,476 |
| 2 Earners | 314 (62.7%) | $108,750 |
| 3+ Earners | 70 (14.0%) | $122,258 |
| Total | 501 (100.0%) | $105,234 |
Household Income in Victor
Household Income Brackets in Victor
With 283 households falling in the category, the $50,000 to $74,999 income range is the most frequent in Victor, accounting for 29.4% of all households.
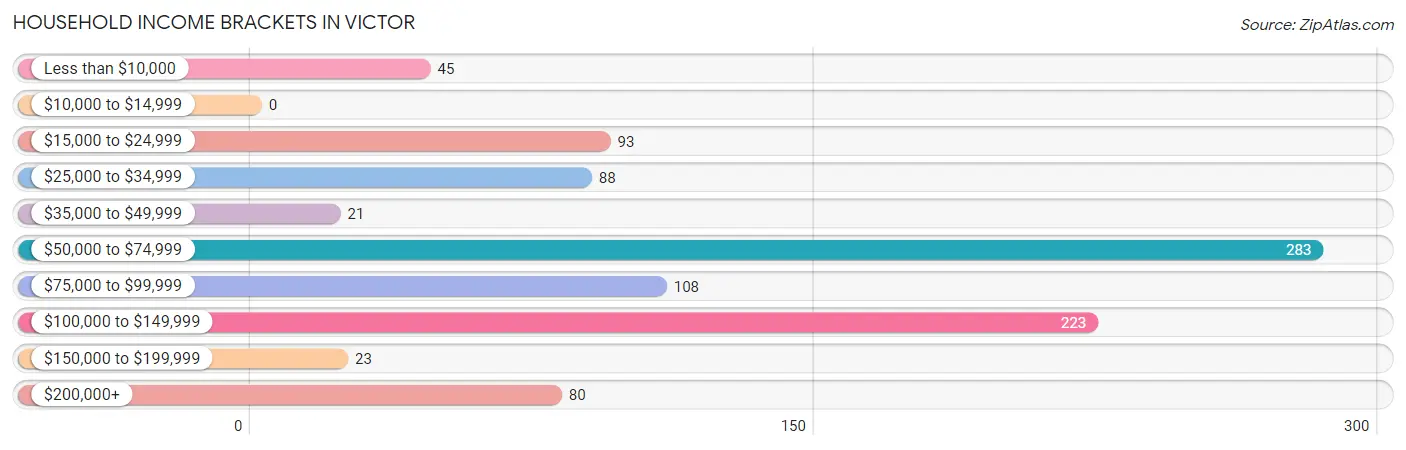
| Income Bracket | # Households | % Households |
| Less than $10,000 | 45 | 4.7% |
| $10,000 to $14,999 | 0 | 0.0% |
| $15,000 to $24,999 | 93 | 9.6% |
| $25,000 to $34,999 | 88 | 9.1% |
| $35,000 to $49,999 | 21 | 2.2% |
| $50,000 to $74,999 | 283 | 29.4% |
| $75,000 to $99,999 | 108 | 11.2% |
| $100,000 to $149,999 | 223 | 23.1% |
| $150,000 to $199,999 | 23 | 2.4% |
| $200,000+ | 80 | 8.3% |
Household Income by Householder Age in Victor
The median household income in Victor is $70,923, with the highest median household income of $92,333 found in the 45 to 64 years age bracket for the primary householder. A total of 312 households (32.4%) fall into this category. Meanwhile, the 15 to 24 years age bracket for the primary householder has the lowest median household income of $0, with 28 households (2.9%) in this group.
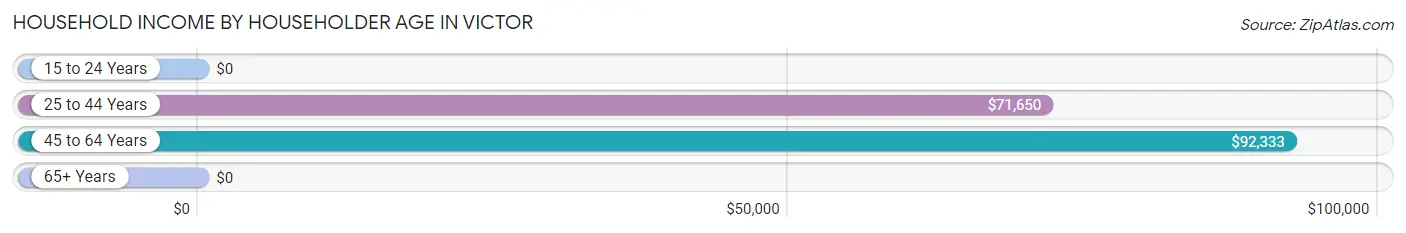
| Income Bracket | # Households | Median Income |
| 15 to 24 Years | 28 (2.9%) | $0 |
| 25 to 44 Years | 477 (49.5%) | $71,650 |
| 45 to 64 Years | 312 (32.4%) | $92,333 |
| 65+ Years | 147 (15.2%) | $0 |
| Total | 964 (100.0%) | $70,923 |
Poverty in Victor
Income Below Poverty by Sex and Age in Victor
With 6.1% poverty level for males and 23.0% for females among the residents of Victor, 16 and 17 year old males and under 5 year old females are the most vulnerable to poverty, with 10 males (35.7%) and 40 females (71.4%) in their respective age groups living below the poverty level.
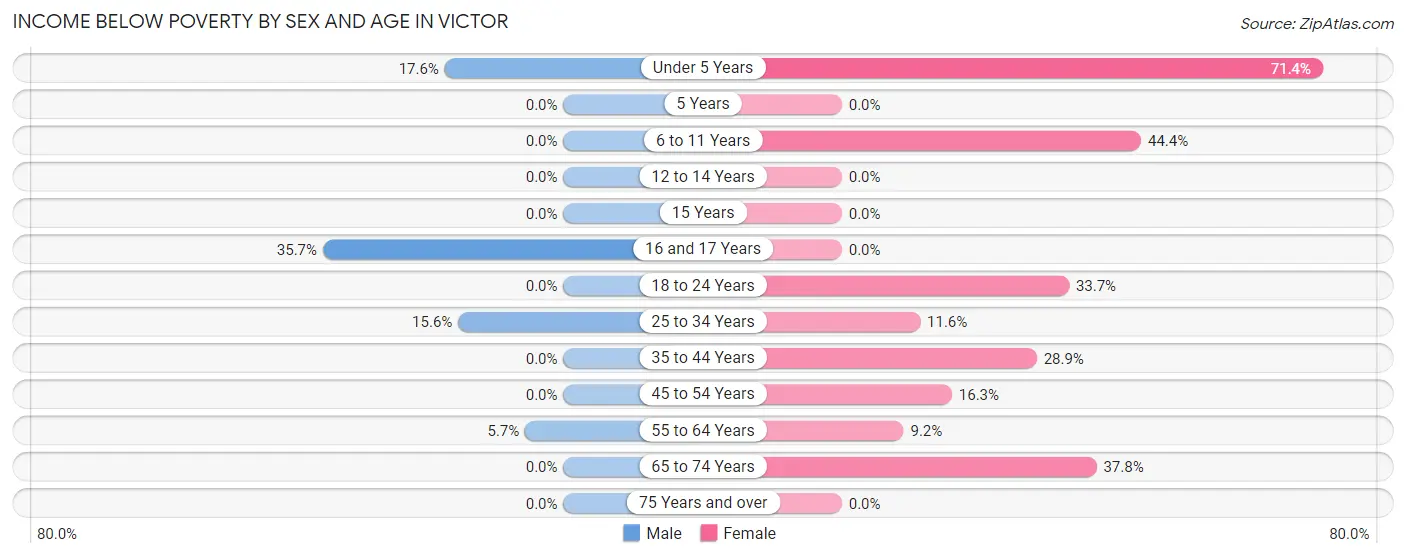
| Age Bracket | Male | Female |
| Under 5 Years | 34 (17.6%) | 40 (71.4%) |
| 5 Years | 0 (0.0%) | 0 (0.0%) |
| 6 to 11 Years | 0 (0.0%) | 20 (44.4%) |
| 12 to 14 Years | 0 (0.0%) | 0 (0.0%) |
| 15 Years | 0 (0.0%) | 0 (0.0%) |
| 16 and 17 Years | 10 (35.7%) | 0 (0.0%) |
| 18 to 24 Years | 0 (0.0%) | 28 (33.7%) |
| 25 to 34 Years | 52 (15.6%) | 25 (11.6%) |
| 35 to 44 Years | 0 (0.0%) | 79 (28.9%) |
| 45 to 54 Years | 0 (0.0%) | 33 (16.3%) |
| 55 to 64 Years | 5 (5.7%) | 11 (9.2%) |
| 65 to 74 Years | 0 (0.0%) | 45 (37.8%) |
| 75 Years and over | 0 (0.0%) | 0 (0.0%) |
| Total | 101 (6.1%) | 281 (23.0%) |
Income Above Poverty by Sex and Age in Victor
According to the poverty statistics in Victor, males aged 5 years and females aged 5 years are the age groups that are most secure financially, with 100.0% of males and 100.0% of females in these age groups living above the poverty line.
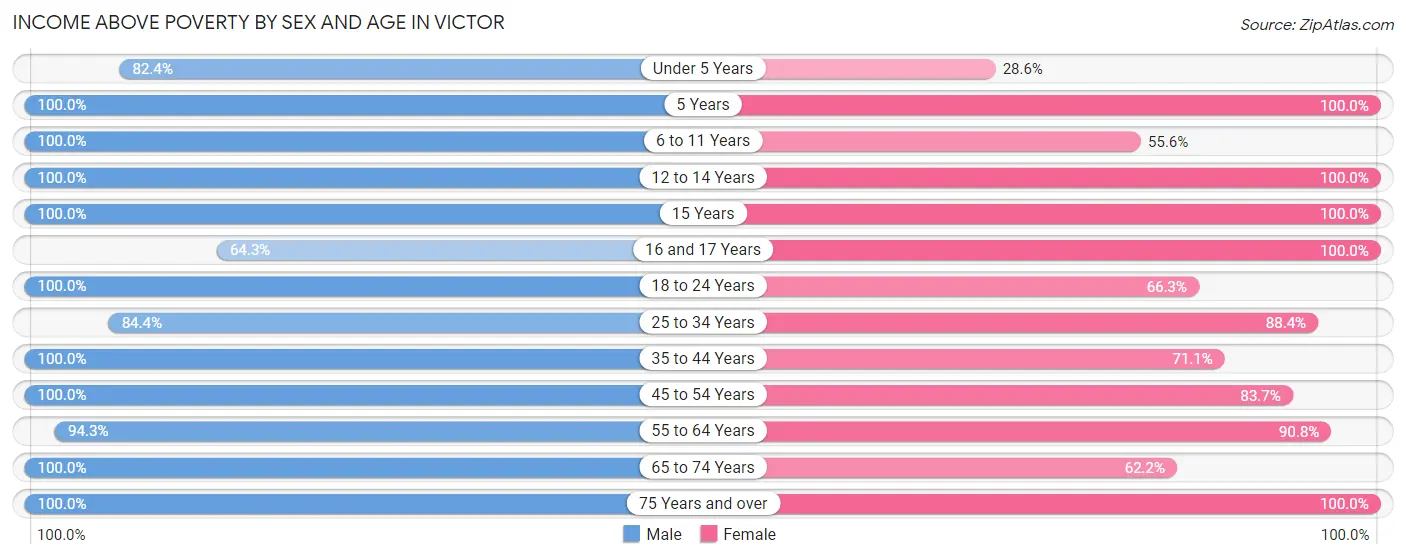
| Age Bracket | Male | Female |
| Under 5 Years | 159 (82.4%) | 16 (28.6%) |
| 5 Years | 51 (100.0%) | 4 (100.0%) |
| 6 to 11 Years | 204 (100.0%) | 25 (55.6%) |
| 12 to 14 Years | 49 (100.0%) | 43 (100.0%) |
| 15 Years | 9 (100.0%) | 19 (100.0%) |
| 16 and 17 Years | 18 (64.3%) | 27 (100.0%) |
| 18 to 24 Years | 180 (100.0%) | 55 (66.3%) |
| 25 to 34 Years | 281 (84.4%) | 190 (88.4%) |
| 35 to 44 Years | 272 (100.0%) | 194 (71.1%) |
| 45 to 54 Years | 188 (100.0%) | 169 (83.7%) |
| 55 to 64 Years | 83 (94.3%) | 109 (90.8%) |
| 65 to 74 Years | 35 (100.0%) | 74 (62.2%) |
| 75 Years and over | 23 (100.0%) | 17 (100.0%) |
| Total | 1,552 (93.9%) | 942 (77.0%) |
Income Below Poverty Among Married-Couple Families in Victor
The poverty statistics for married-couple families in Victor show that 1.3% or 5 of the total 389 families live below the poverty line. Families with no children have the highest poverty rate of 3.0%, comprising of 5 families. On the other hand, families with 1 or 2 children have the lowest poverty rate of 0.0%, which includes 0 families.
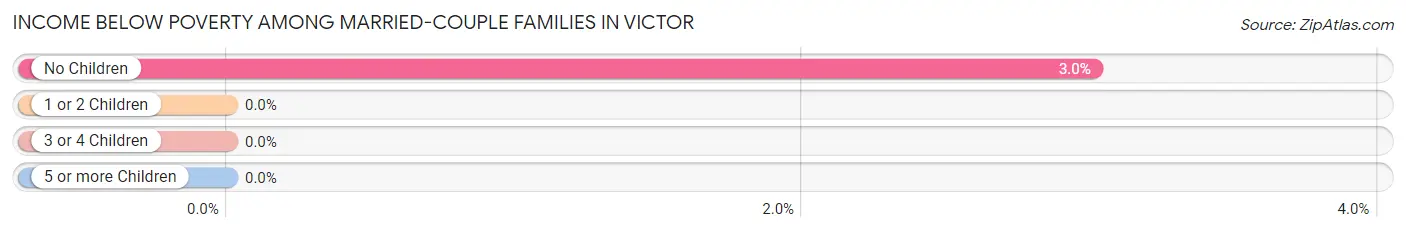
| Children | Above Poverty | Below Poverty |
| No Children | 161 (97.0%) | 5 (3.0%) |
| 1 or 2 Children | 201 (100.0%) | 0 (0.0%) |
| 3 or 4 Children | 22 (100.0%) | 0 (0.0%) |
| 5 or more Children | 0 (0.0%) | 0 (0.0%) |
| Total | 384 (98.7%) | 5 (1.3%) |
Income Below Poverty Among Single-Parent Households in Victor
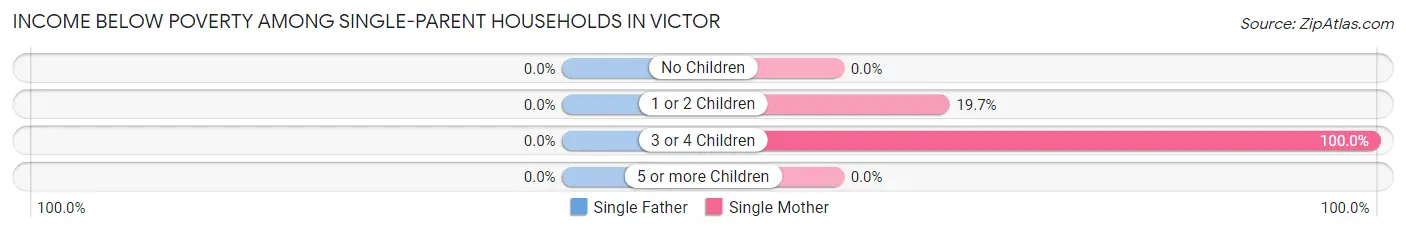
| Children | Single Father | Single Mother |
| No Children | 0 (0.0%) | 0 (0.0%) |
| 1 or 2 Children | 0 (0.0%) | 13 (19.7%) |
| 3 or 4 Children | 0 (0.0%) | 19 (100.0%) |
| 5 or more Children | 0 (0.0%) | 0 (0.0%) |
| Total | 0 (0.0%) | 32 (35.2%) |
Income Below Poverty Among Married-Couple vs Single-Parent Households in Victor
The poverty data for Victor shows that 5 of the married-couple family households (1.3%) and 32 of the single-parent households (28.6%) are living below the poverty level. Within the married-couple family households, those with no children have the highest poverty rate, with 5 households (3.0%) falling below the poverty line. Among the single-parent households, those with 3 or 4 children have the highest poverty rate, with 19 household (100.0%) living below poverty.
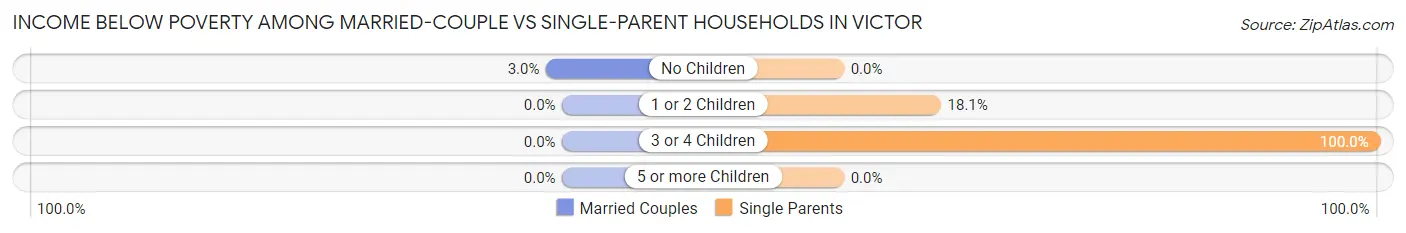
| Children | Married-Couple Families | Single-Parent Households |
| No Children | 5 (3.0%) | 0 (0.0%) |
| 1 or 2 Children | 0 (0.0%) | 13 (18.1%) |
| 3 or 4 Children | 0 (0.0%) | 19 (100.0%) |
| 5 or more Children | 0 (0.0%) | 0 (0.0%) |
| Total | 5 (1.3%) | 32 (28.6%) |
Race in Victor
The most populous races in Victor are White / Caucasian (2,331 | 81.0%), Hispanic or Latino (672 | 23.4%), and Two or more Races (309 | 10.7%).
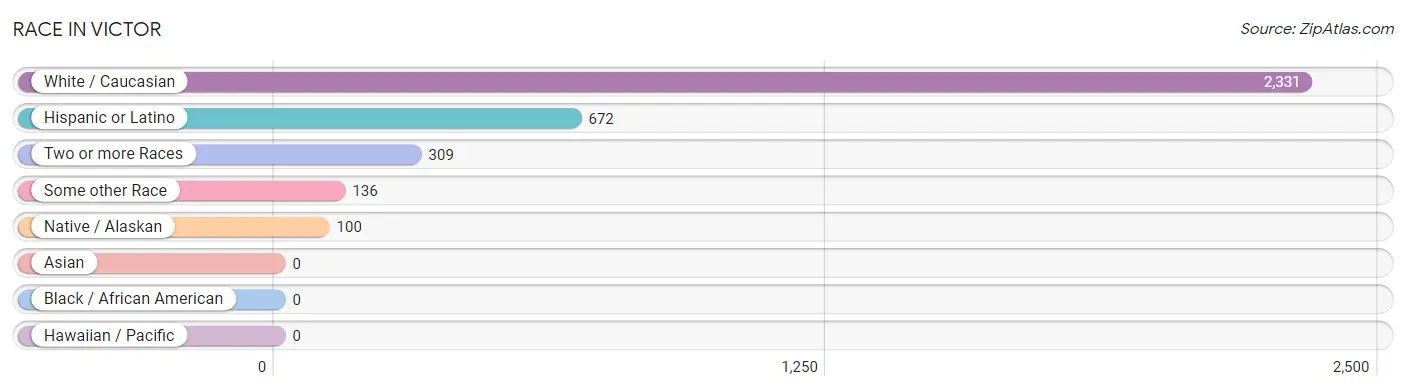
| Race | # Population | % Population |
| Asian | 0 | 0.0% |
| Black / African American | 0 | 0.0% |
| Hawaiian / Pacific | 0 | 0.0% |
| Hispanic or Latino | 672 | 23.4% |
| Native / Alaskan | 100 | 3.5% |
| White / Caucasian | 2,331 | 81.0% |
| Two or more Races | 309 | 10.7% |
| Some other Race | 136 | 4.7% |
| Total | 2,876 | 100.0% |
Ancestry in Victor
The most populous ancestries reported in Victor are Mexican (610 | 21.2%), English (463 | 16.1%), German (296 | 10.3%), American (182 | 6.3%), and Irish (139 | 4.8%), together accounting for 58.8% of all Victor residents.
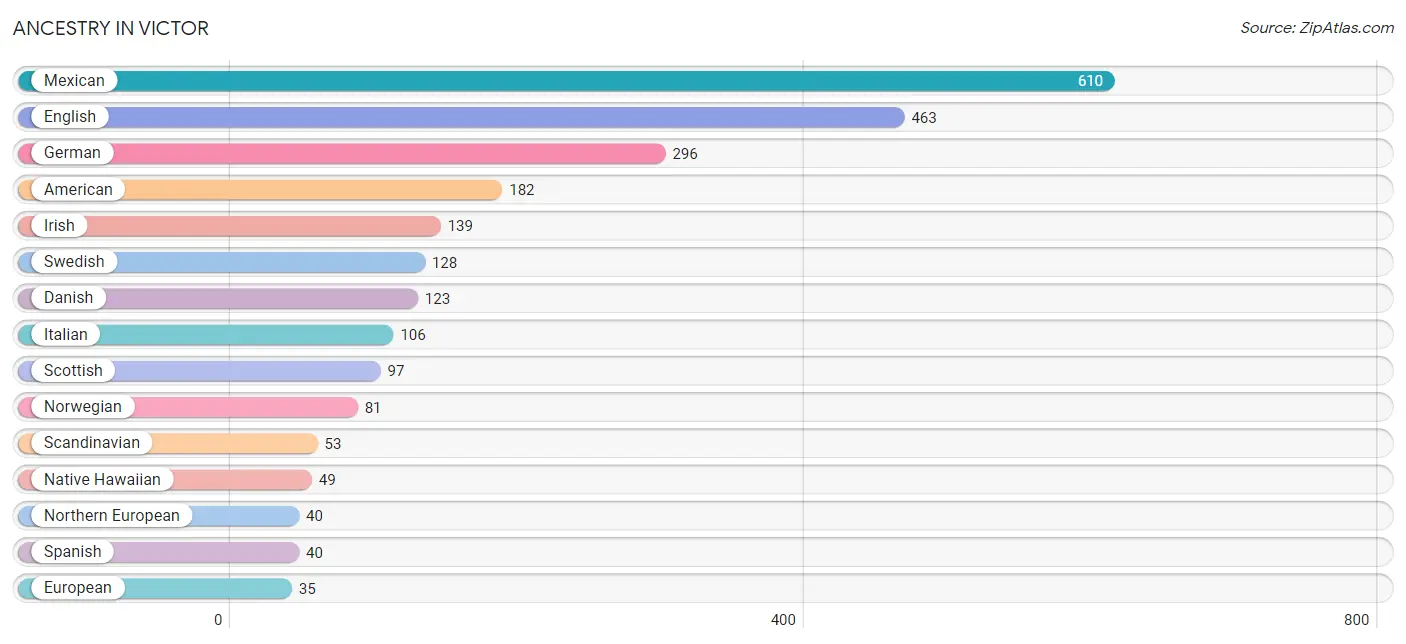
| Ancestry | # Population | % Population |
| American | 182 | 6.3% |
| Bhutanese | 26 | 0.9% |
| Blackfeet | 26 | 0.9% |
| British | 19 | 0.7% |
| Cajun | 5 | 0.2% |
| Czech | 2 | 0.1% |
| Danish | 123 | 4.3% |
| Dutch | 17 | 0.6% |
| English | 463 | 16.1% |
| European | 35 | 1.2% |
| Finnish | 6 | 0.2% |
| French | 26 | 0.9% |
| French Canadian | 15 | 0.5% |
| German | 296 | 10.3% |
| Irish | 139 | 4.8% |
| Italian | 106 | 3.7% |
| Maltese | 16 | 0.6% |
| Mexican | 610 | 21.2% |
| Mexican American Indian | 32 | 1.1% |
| Native Hawaiian | 49 | 1.7% |
| Northern European | 40 | 1.4% |
| Norwegian | 81 | 2.8% |
| Peruvian | 2 | 0.1% |
| Polish | 17 | 0.6% |
| Puerto Rican | 20 | 0.7% |
| Romanian | 35 | 1.2% |
| Russian | 2 | 0.1% |
| Scandinavian | 53 | 1.8% |
| Scotch-Irish | 25 | 0.9% |
| Scottish | 97 | 3.4% |
| Slovak | 7 | 0.2% |
| Slovene | 13 | 0.4% |
| South American | 2 | 0.1% |
| Spanish | 40 | 1.4% |
| Swedish | 128 | 4.4% |
| Swiss | 26 | 0.9% |
| Welsh | 4 | 0.1% | View All 37 Rows |
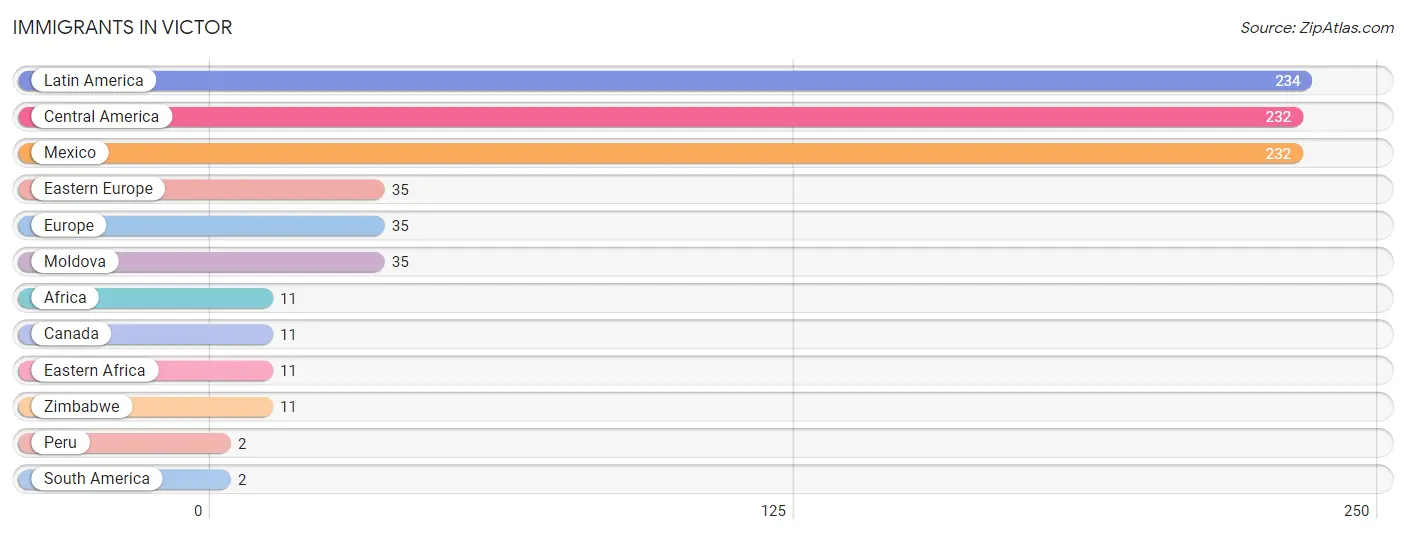
Immigrants in Victor
The most numerous immigrant groups reported in Victor came from Latin America (234 | 8.1%), Central America (232 | 8.1%), Mexico (232 | 8.1%), Eastern Europe (35 | 1.2%), and Europe (35 | 1.2%), together accounting for 26.7% of all Victor residents.
| Immigration Origin | # Population | % Population |
| Africa | 11 | 0.4% |
| Canada | 11 | 0.4% |
| Central America | 232 | 8.1% |
| Eastern Africa | 11 | 0.4% |
| Eastern Europe | 35 | 1.2% |
| Europe | 35 | 1.2% |
| Latin America | 234 | 8.1% |
| Mexico | 232 | 8.1% |
| Moldova | 35 | 1.2% |
| Peru | 2 | 0.1% |
| South America | 2 | 0.1% |
| Zimbabwe | 11 | 0.4% | View All 12 Rows |
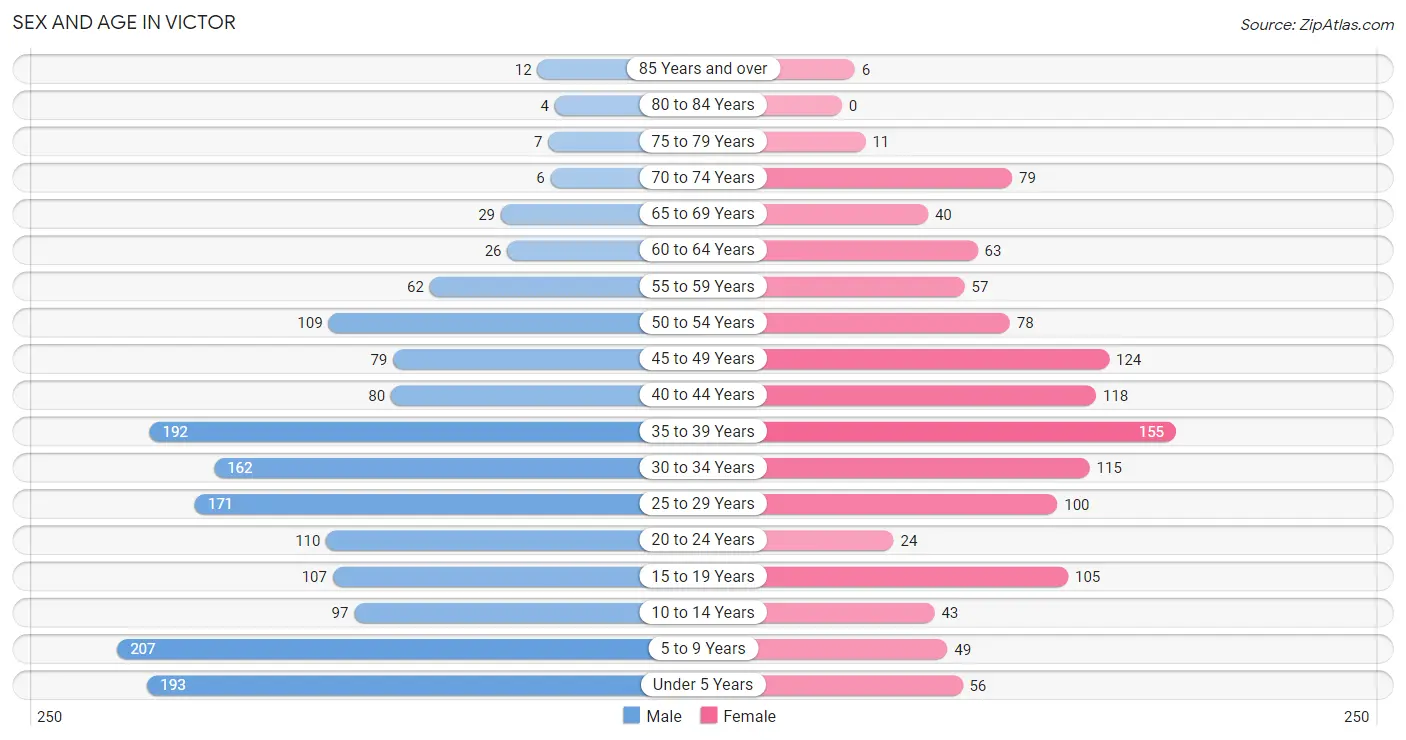
Sex and Age in Victor
Sex and Age in Victor
The most populous age groups in Victor are 5 to 9 Years (207 | 12.5%) for men and 35 to 39 Years (155 | 12.7%) for women.
| Age Bracket | Male | Female |
| Under 5 Years | 193 (11.7%) | 56 (4.6%) |
| 5 to 9 Years | 207 (12.5%) | 49 (4.0%) |
| 10 to 14 Years | 97 (5.9%) | 43 (3.5%) |
| 15 to 19 Years | 107 (6.5%) | 105 (8.6%) |
| 20 to 24 Years | 110 (6.7%) | 24 (2.0%) |
| 25 to 29 Years | 171 (10.3%) | 100 (8.2%) |
| 30 to 34 Years | 162 (9.8%) | 115 (9.4%) |
| 35 to 39 Years | 192 (11.6%) | 155 (12.7%) |
| 40 to 44 Years | 80 (4.8%) | 118 (9.7%) |
| 45 to 49 Years | 79 (4.8%) | 124 (10.1%) |
| 50 to 54 Years | 109 (6.6%) | 78 (6.4%) |
| 55 to 59 Years | 62 (3.7%) | 57 (4.7%) |
| 60 to 64 Years | 26 (1.6%) | 63 (5.1%) |
| 65 to 69 Years | 29 (1.8%) | 40 (3.3%) |
| 70 to 74 Years | 6 (0.4%) | 79 (6.5%) |
| 75 to 79 Years | 7 (0.4%) | 11 (0.9%) |
| 80 to 84 Years | 4 (0.2%) | 0 (0.0%) |
| 85 Years and over | 12 (0.7%) | 6 (0.5%) |
| Total | 1,653 (100.0%) | 1,223 (100.0%) |
Families and Households in Victor
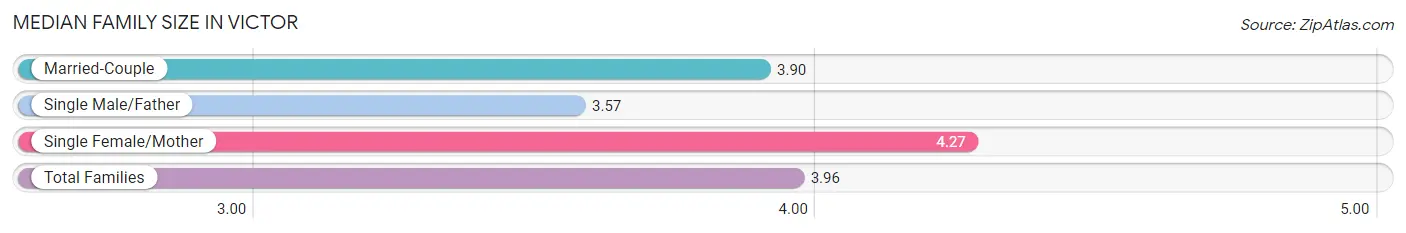
Median Family Size in Victor
The median family size in Victor is 3.96 persons per family, with single female/mother families (91 | 18.2%) accounting for the largest median family size of 4.27 persons per family. On the other hand, single male/father families (21 | 4.2%) represent the smallest median family size with 3.57 persons per family.
| Family Type | # Families | Family Size |
| Married-Couple | 389 (77.6%) | 3.90 |
| Single Male/Father | 21 (4.2%) | 3.57 |
| Single Female/Mother | 91 (18.2%) | 4.27 |
| Total Families | 501 (100.0%) | 3.96 |
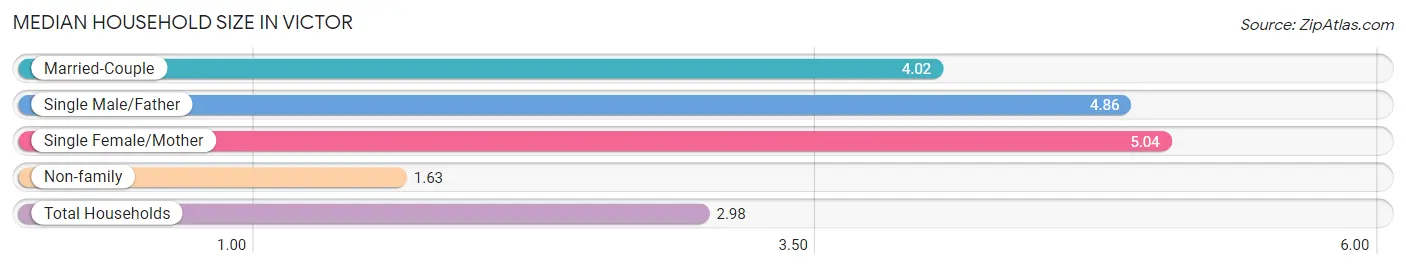
Median Household Size in Victor
The median household size in Victor is 2.98 persons per household, with single female/mother households (91 | 9.4%) accounting for the largest median household size of 5.04 persons per household. non-family households (463 | 48.0%) represent the smallest median household size with 1.63 persons per household.
| Household Type | # Households | Household Size |
| Married-Couple | 389 (40.4%) | 4.02 |
| Single Male/Father | 21 (2.2%) | 4.86 |
| Single Female/Mother | 91 (9.4%) | 5.04 |
| Non-family | 463 (48.0%) | 1.63 |
| Total Households | 964 (100.0%) | 2.98 |
Household Size by Marriage Status in Victor
Out of a total of 964 households in Victor, 501 (52.0%) are family households, while 463 (48.0%) are nonfamily households. The most numerous type of family households are 4-person households, comprising 193, and the most common type of nonfamily households are 1-person households, comprising 250.
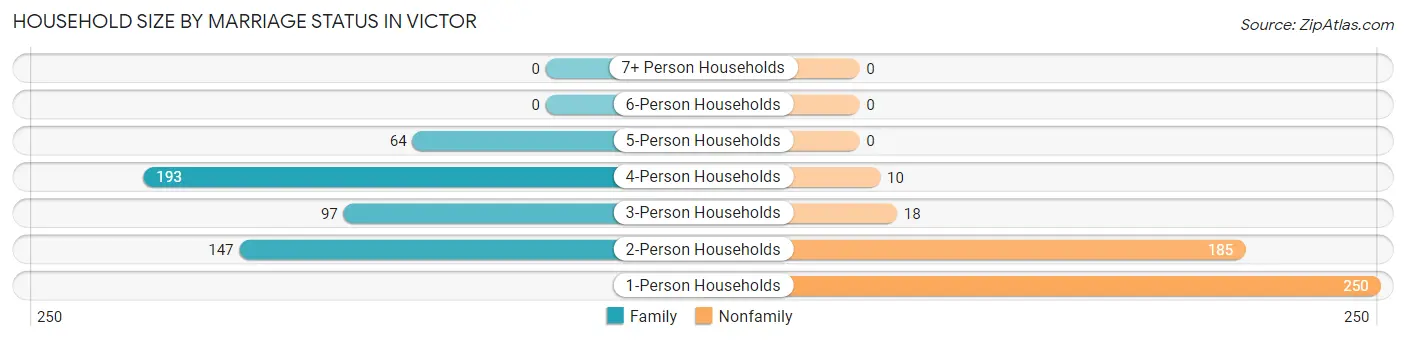
| Household Size | Family Households | Nonfamily Households |
| 1-Person Households | - | 250 (25.9%) |
| 2-Person Households | 147 (15.2%) | 185 (19.2%) |
| 3-Person Households | 97 (10.1%) | 18 (1.9%) |
| 4-Person Households | 193 (20.0%) | 10 (1.0%) |
| 5-Person Households | 64 (6.6%) | 0 (0.0%) |
| 6-Person Households | 0 (0.0%) | 0 (0.0%) |
| 7+ Person Households | 0 (0.0%) | 0 (0.0%) |
| Total | 501 (52.0%) | 463 (48.0%) |
Female Fertility in Victor
Fertility by Age in Victor
Average fertility rate in Victor is 41.0 births per 1,000 women. Women in the age bracket of 20 to 34 years have the highest fertility rate with 59.0 births per 1,000 women. Women in the age bracket of 35 to 50 years acount for 54.8% of all women with births.
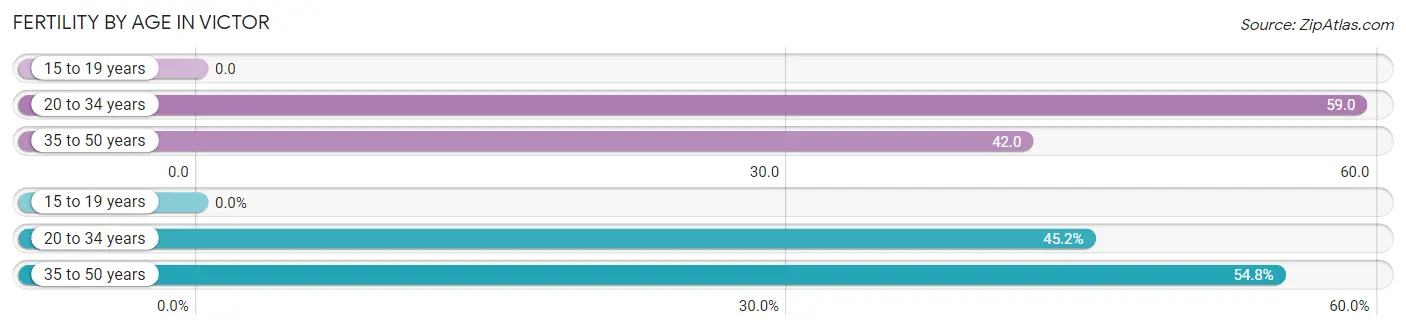
| Age Bracket | Women with Births | Births / 1,000 Women |
| 15 to 19 years | 0 (0.0%) | 0.0 |
| 20 to 34 years | 14 (45.2%) | 59.0 |
| 35 to 50 years | 17 (54.8%) | 42.0 |
| Total | 31 (100.0%) | 41.0 |
Fertility by Age by Marriage Status in Victor
54.8% of women with births (31) in Victor are married. The highest percentage of unmarried women with births falls into 20 to 34 years age bracket with 100.0% of them unmarried at the time of birth, while the lowest percentage of unmarried women with births belong to 35 to 50 years age bracket with 0.0% of them unmarried.
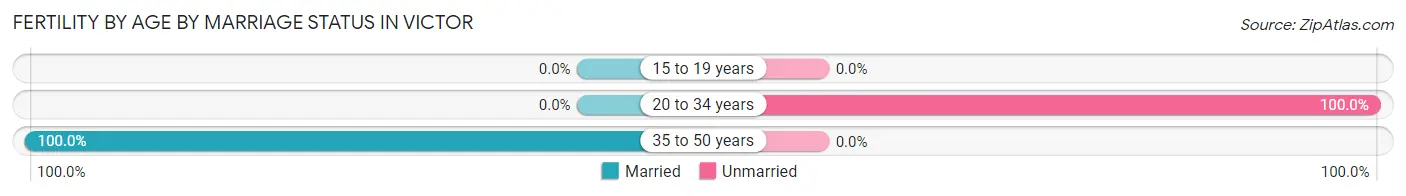
| Age Bracket | Married | Unmarried |
| 15 to 19 years | 0 (0.0%) | 0 (0.0%) |
| 20 to 34 years | 0 (0.0%) | 14 (100.0%) |
| 35 to 50 years | 17 (100.0%) | 0 (0.0%) |
| Total | 17 (54.8%) | 14 (45.2%) |
Fertility by Education in Victor
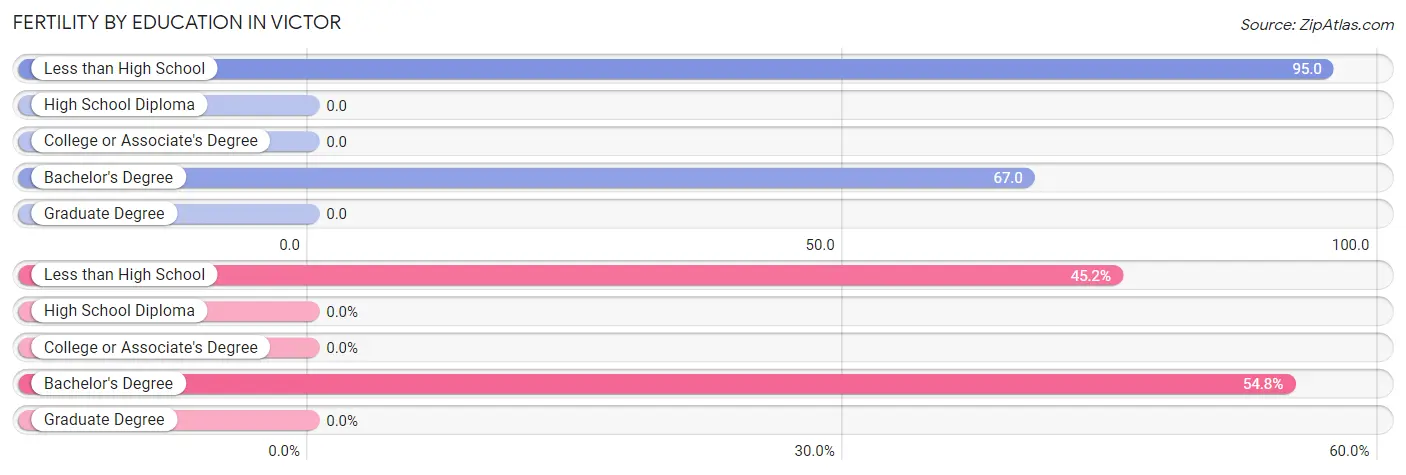
| Educational Attainment | Women with Births | Births / 1,000 Women |
| Less than High School | 14 (45.2%) | 95.0 |
| High School Diploma | 0 (0.0%) | 0.0 |
| College or Associate's Degree | 0 (0.0%) | 0.0 |
| Bachelor's Degree | 17 (54.8%) | 67.0 |
| Graduate Degree | 0 (0.0%) | 0.0 |
| Total | 31 (100.0%) | 41.0 |
Fertility by Education by Marriage Status in Victor
45.2% of women with births in Victor are unmarried. Women with the educational attainment of bachelor's degree are most likely to be married with 100.0% of them married at childbirth, while women with the educational attainment of less than high school are least likely to be married with 100.0% of them unmarried at childbirth.
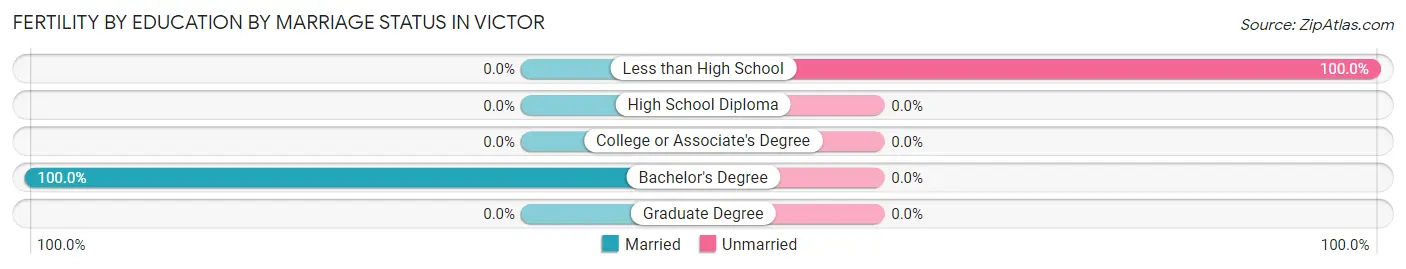
| Educational Attainment | Married | Unmarried |
| Less than High School | 0 (0.0%) | 14 (100.0%) |
| High School Diploma | 0 (0.0%) | 0 (0.0%) |
| College or Associate's Degree | 0 (0.0%) | 0 (0.0%) |
| Bachelor's Degree | 17 (100.0%) | 0 (0.0%) |
| Graduate Degree | 0 (0.0%) | 0 (0.0%) |
| Total | 17 (54.8%) | 14 (45.2%) |
Employment Characteristics in Victor
Employment by Class of Employer in Victor
Among the 1,672 employed individuals in Victor, private company employees (1,085 | 64.9%), self-employed (not incorporated) (152 | 9.1%), and not-for-profit organizations (136 | 8.1%) make up the most common classes of employment.
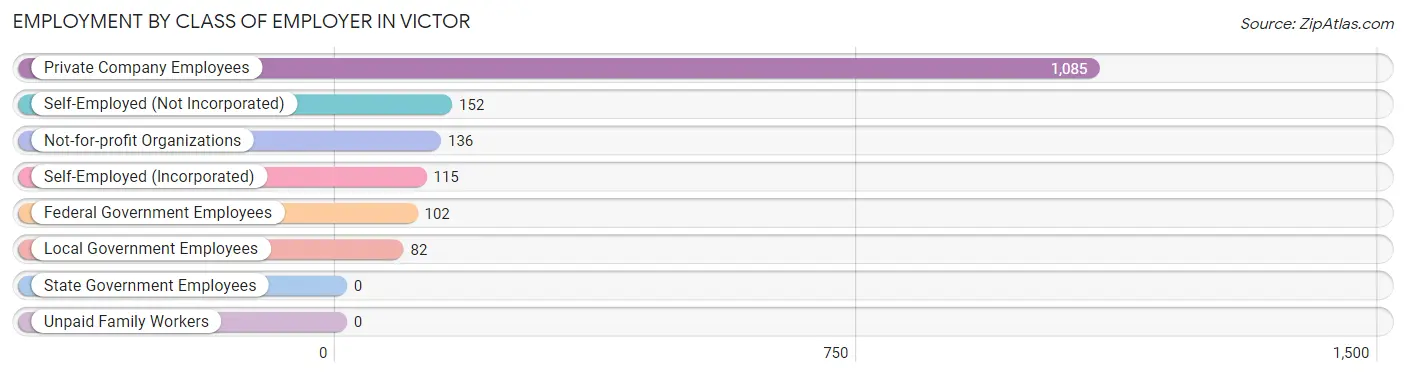
| Employer Class | # Employees | % Employees |
| Private Company Employees | 1,085 | 64.9% |
| Self-Employed (Incorporated) | 115 | 6.9% |
| Self-Employed (Not Incorporated) | 152 | 9.1% |
| Not-for-profit Organizations | 136 | 8.1% |
| Local Government Employees | 82 | 4.9% |
| State Government Employees | 0 | 0.0% |
| Federal Government Employees | 102 | 6.1% |
| Unpaid Family Workers | 0 | 0.0% |
| Total | 1,672 | 100.0% |
Employment Status by Age in Victor
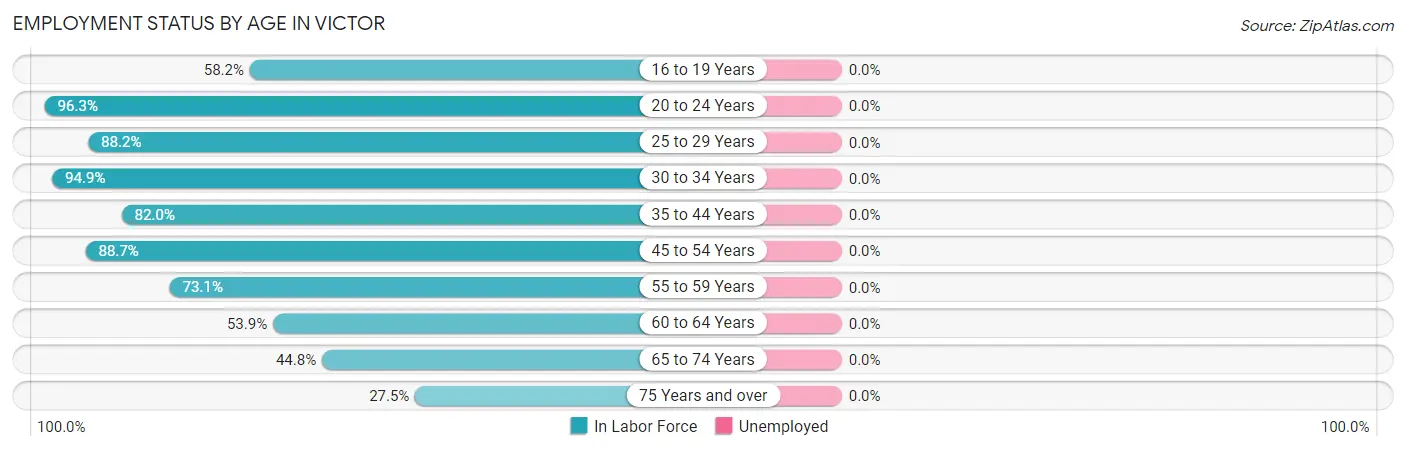
| Age Bracket | In Labor Force | Unemployed |
| 16 to 19 Years | 107 (58.2%) | 0 (0.0%) |
| 20 to 24 Years | 129 (96.3%) | 0 (0.0%) |
| 25 to 29 Years | 239 (88.2%) | 0 (0.0%) |
| 30 to 34 Years | 263 (94.9%) | 0 (0.0%) |
| 35 to 44 Years | 447 (82.0%) | 0 (0.0%) |
| 45 to 54 Years | 346 (88.7%) | 0 (0.0%) |
| 55 to 59 Years | 87 (73.1%) | 0 (0.0%) |
| 60 to 64 Years | 48 (53.9%) | 0 (0.0%) |
| 65 to 74 Years | 69 (44.8%) | 0 (0.0%) |
| 75 Years and over | 11 (27.5%) | 0 (0.0%) |
| Total | 1,747 (79.3%) | 0 (0.0%) |
Employment Status by Educational Attainment in Victor
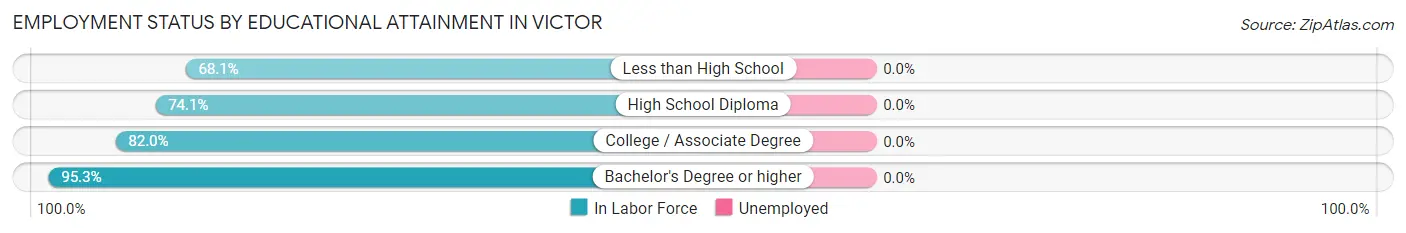
| Educational Attainment | In Labor Force | Unemployed |
| Less than High School | 109 (68.1%) | 0 (0.0%) |
| High School Diploma | 315 (74.1%) | 0 (0.0%) |
| College / Associate Degree | 297 (82.0%) | 0 (0.0%) |
| Bachelor's Degree or higher | 709 (95.3%) | 0 (0.0%) |
| Total | 1,431 (84.6%) | 0 (0.0%) |
Employment Occupations by Sex in Victor
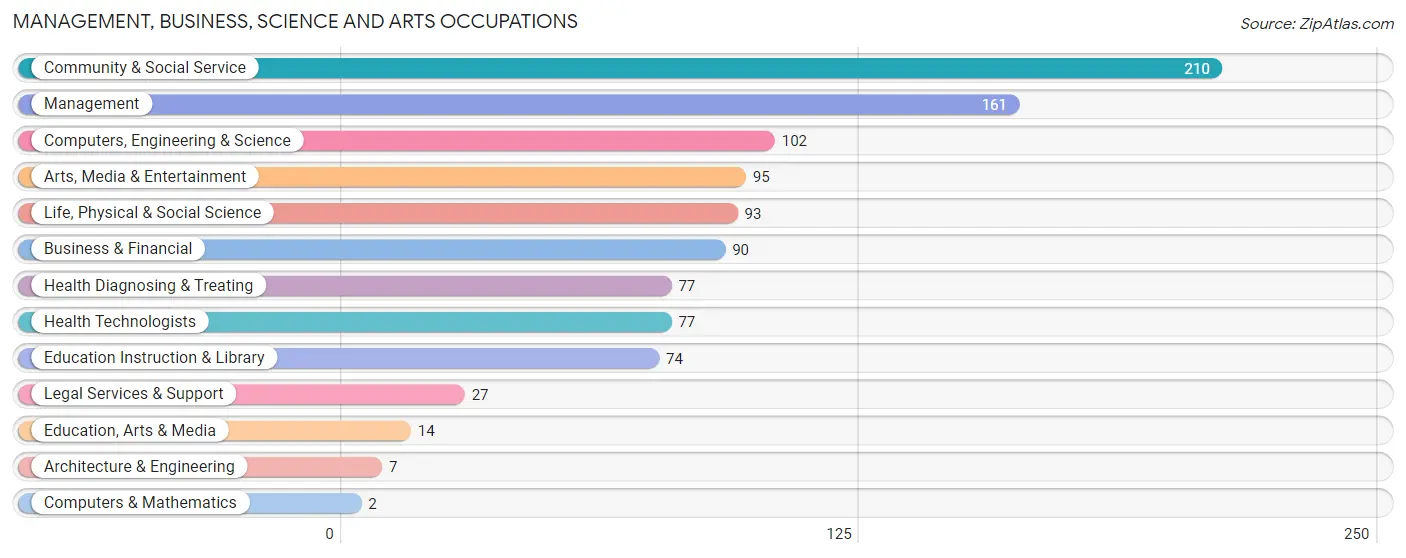
Management, Business, Science and Arts Occupations
The most common Management, Business, Science and Arts occupations in Victor are Community & Social Service (210 | 12.0%), Management (161 | 9.2%), Computers, Engineering & Science (102 | 5.8%), Arts, Media & Entertainment (95 | 5.4%), and Life, Physical & Social Science (93 | 5.3%).
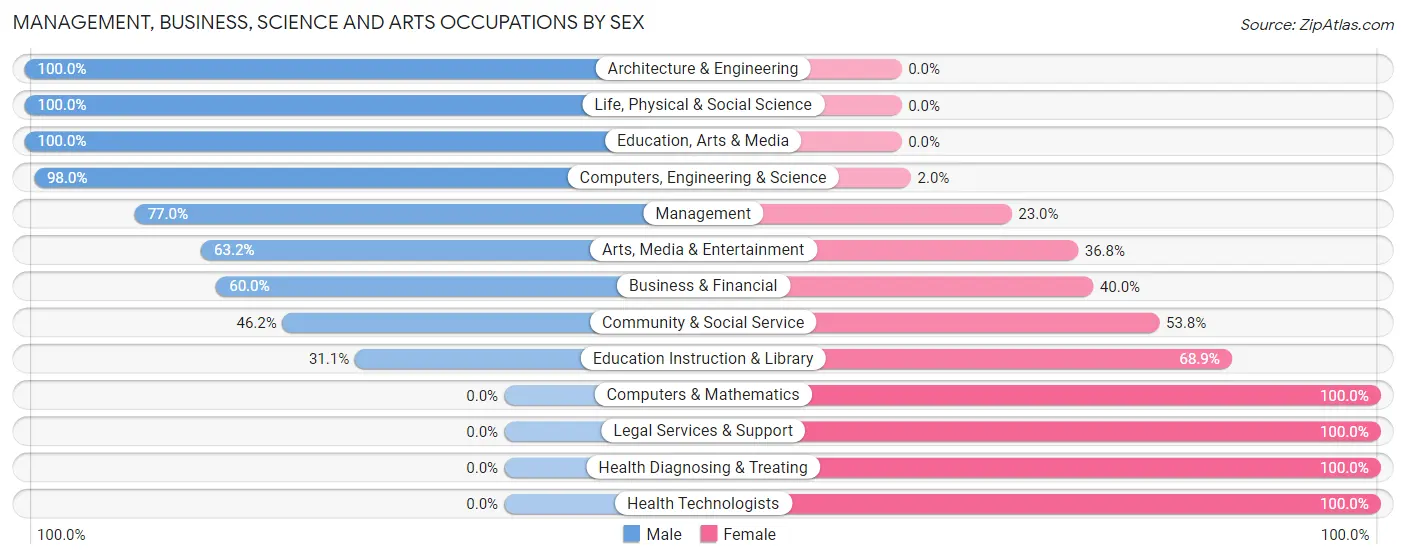
Management, Business, Science and Arts Occupations by Sex
Within the Management, Business, Science and Arts occupations in Victor, the most male-oriented occupations are Architecture & Engineering (100.0%), Life, Physical & Social Science (100.0%), and Education, Arts & Media (100.0%), while the most female-oriented occupations are Computers & Mathematics (100.0%), Legal Services & Support (100.0%), and Health Diagnosing & Treating (100.0%).
| Occupation | Male | Female |
| Management | 124 (77.0%) | 37 (23.0%) |
| Business & Financial | 54 (60.0%) | 36 (40.0%) |
| Computers, Engineering & Science | 100 (98.0%) | 2 (2.0%) |
| Computers & Mathematics | 0 (0.0%) | 2 (100.0%) |
| Architecture & Engineering | 7 (100.0%) | 0 (0.0%) |
| Life, Physical & Social Science | 93 (100.0%) | 0 (0.0%) |
| Community & Social Service | 97 (46.2%) | 113 (53.8%) |
| Education, Arts & Media | 14 (100.0%) | 0 (0.0%) |
| Legal Services & Support | 0 (0.0%) | 27 (100.0%) |
| Education Instruction & Library | 23 (31.1%) | 51 (68.9%) |
| Arts, Media & Entertainment | 60 (63.2%) | 35 (36.8%) |
| Health Diagnosing & Treating | 0 (0.0%) | 77 (100.0%) |
| Health Technologists | 0 (0.0%) | 77 (100.0%) |
| Total (Category) | 375 (58.6%) | 265 (41.4%) |
| Total (Overall) | 968 (55.4%) | 778 (44.6%) |
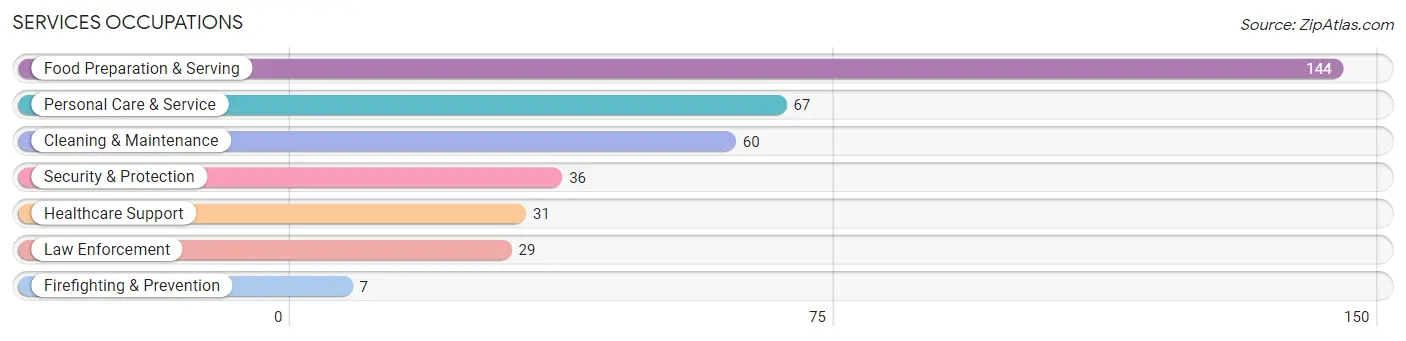
Services Occupations
The most common Services occupations in Victor are Food Preparation & Serving (144 | 8.3%), Personal Care & Service (67 | 3.8%), Cleaning & Maintenance (60 | 3.4%), Security & Protection (36 | 2.1%), and Healthcare Support (31 | 1.8%).
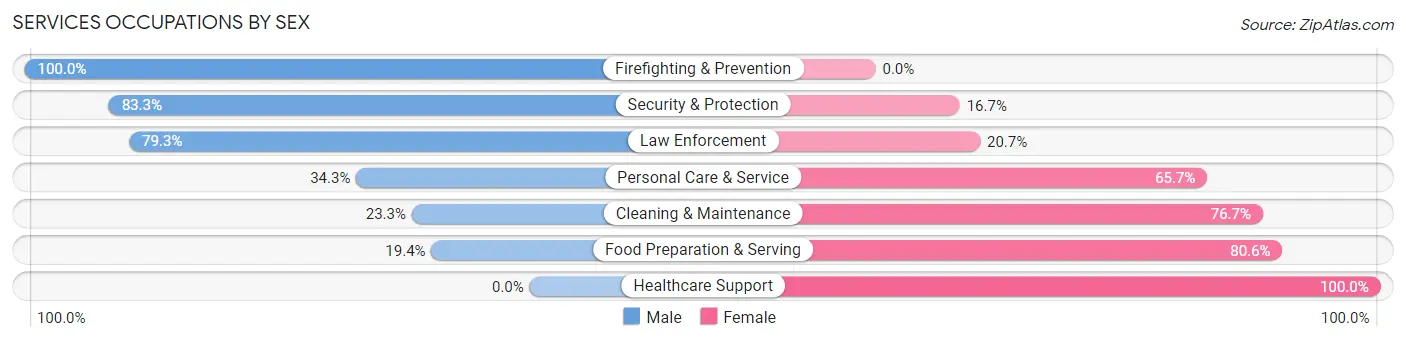
Services Occupations by Sex
Within the Services occupations in Victor, the most male-oriented occupations are Firefighting & Prevention (100.0%), Security & Protection (83.3%), and Law Enforcement (79.3%), while the most female-oriented occupations are Healthcare Support (100.0%), Food Preparation & Serving (80.6%), and Cleaning & Maintenance (76.7%).
| Occupation | Male | Female |
| Healthcare Support | 0 (0.0%) | 31 (100.0%) |
| Security & Protection | 30 (83.3%) | 6 (16.7%) |
| Firefighting & Prevention | 7 (100.0%) | 0 (0.0%) |
| Law Enforcement | 23 (79.3%) | 6 (20.7%) |
| Food Preparation & Serving | 28 (19.4%) | 116 (80.6%) |
| Cleaning & Maintenance | 14 (23.3%) | 46 (76.7%) |
| Personal Care & Service | 23 (34.3%) | 44 (65.7%) |
| Total (Category) | 95 (28.1%) | 243 (71.9%) |
| Total (Overall) | 968 (55.4%) | 778 (44.6%) |
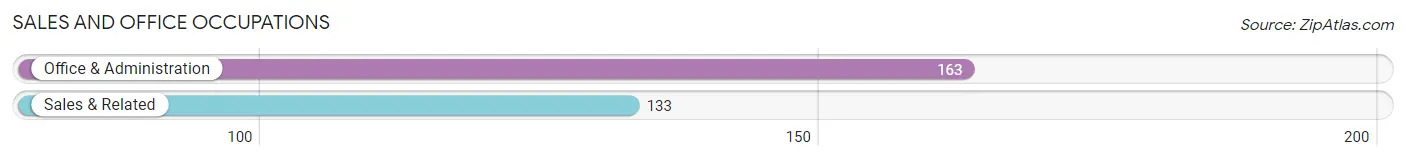
Sales and Office Occupations
The most common Sales and Office occupations in Victor are Office & Administration (163 | 9.3%), and Sales & Related (133 | 7.6%).
Sales and Office Occupations by Sex
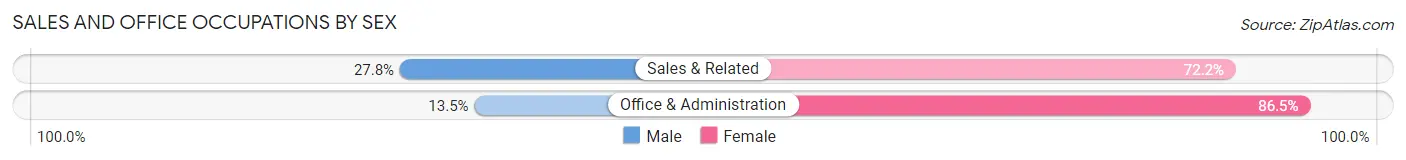
| Occupation | Male | Female |
| Sales & Related | 37 (27.8%) | 96 (72.2%) |
| Office & Administration | 22 (13.5%) | 141 (86.5%) |
| Total (Category) | 59 (19.9%) | 237 (80.1%) |
| Total (Overall) | 968 (55.4%) | 778 (44.6%) |
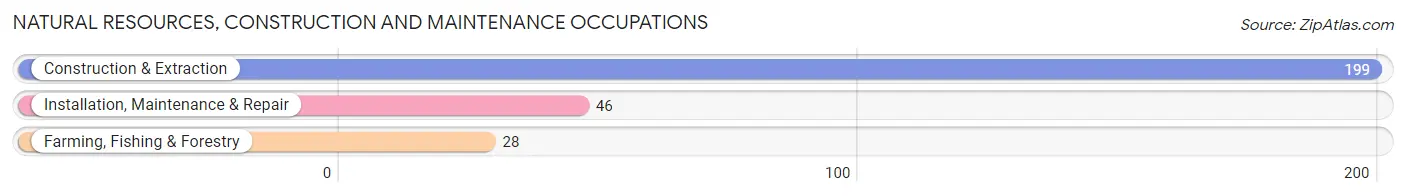
Natural Resources, Construction and Maintenance Occupations
The most common Natural Resources, Construction and Maintenance occupations in Victor are Construction & Extraction (199 | 11.4%), Installation, Maintenance & Repair (46 | 2.6%), and Farming, Fishing & Forestry (28 | 1.6%).
Natural Resources, Construction and Maintenance Occupations by Sex
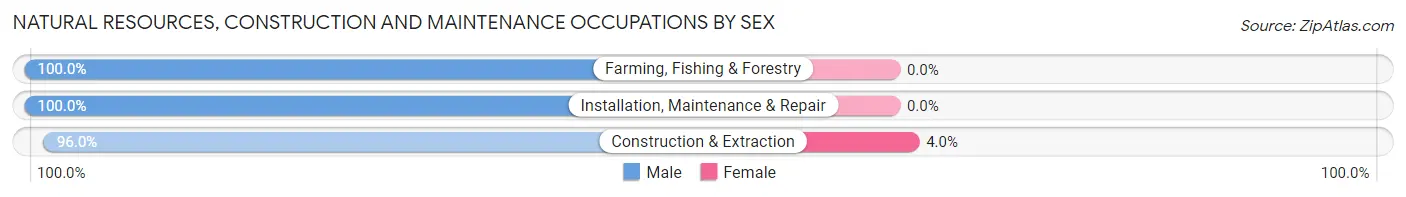
| Occupation | Male | Female |
| Farming, Fishing & Forestry | 28 (100.0%) | 0 (0.0%) |
| Construction & Extraction | 191 (96.0%) | 8 (4.0%) |
| Installation, Maintenance & Repair | 46 (100.0%) | 0 (0.0%) |
| Total (Category) | 265 (97.1%) | 8 (2.9%) |
| Total (Overall) | 968 (55.4%) | 778 (44.6%) |
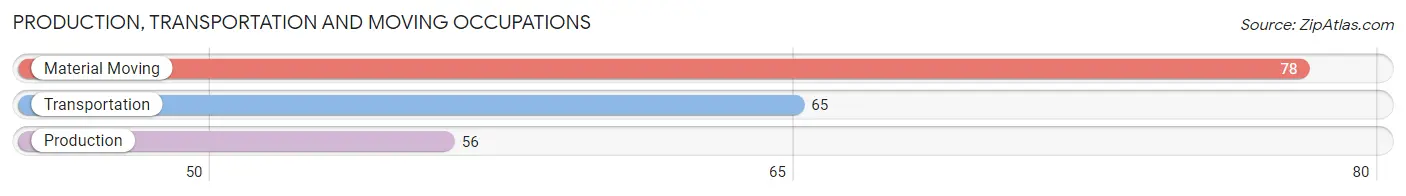
Production, Transportation and Moving Occupations
The most common Production, Transportation and Moving occupations in Victor are Material Moving (78 | 4.5%), Transportation (65 | 3.7%), and Production (56 | 3.2%).
Production, Transportation and Moving Occupations by Sex
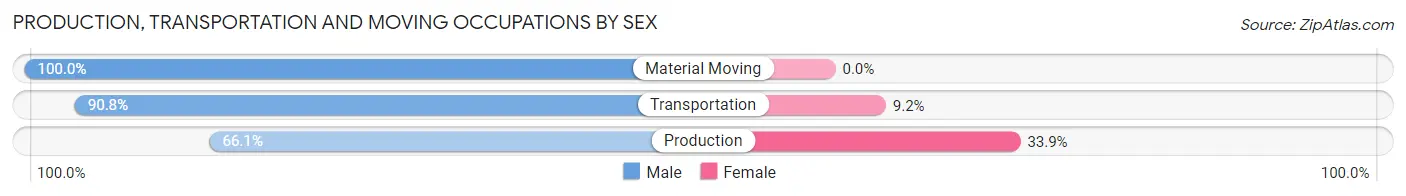
| Occupation | Male | Female |
| Production | 37 (66.1%) | 19 (33.9%) |
| Transportation | 59 (90.8%) | 6 (9.2%) |
| Material Moving | 78 (100.0%) | 0 (0.0%) |
| Total (Category) | 174 (87.4%) | 25 (12.6%) |
| Total (Overall) | 968 (55.4%) | 778 (44.6%) |
Employment Industries by Sex in Victor
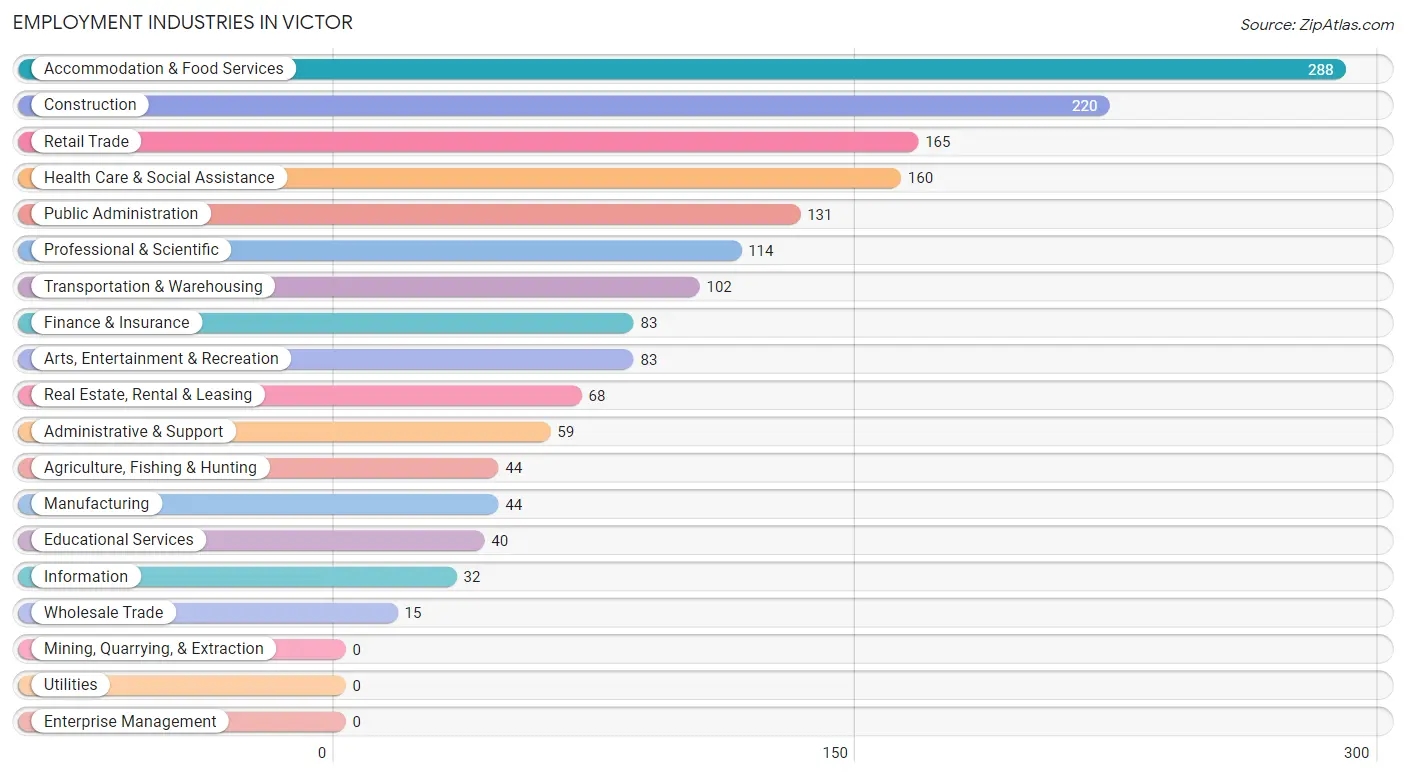
Employment Industries in Victor
The major employment industries in Victor include Accommodation & Food Services (288 | 16.5%), Construction (220 | 12.6%), Retail Trade (165 | 9.5%), Health Care & Social Assistance (160 | 9.2%), and Public Administration (131 | 7.5%).
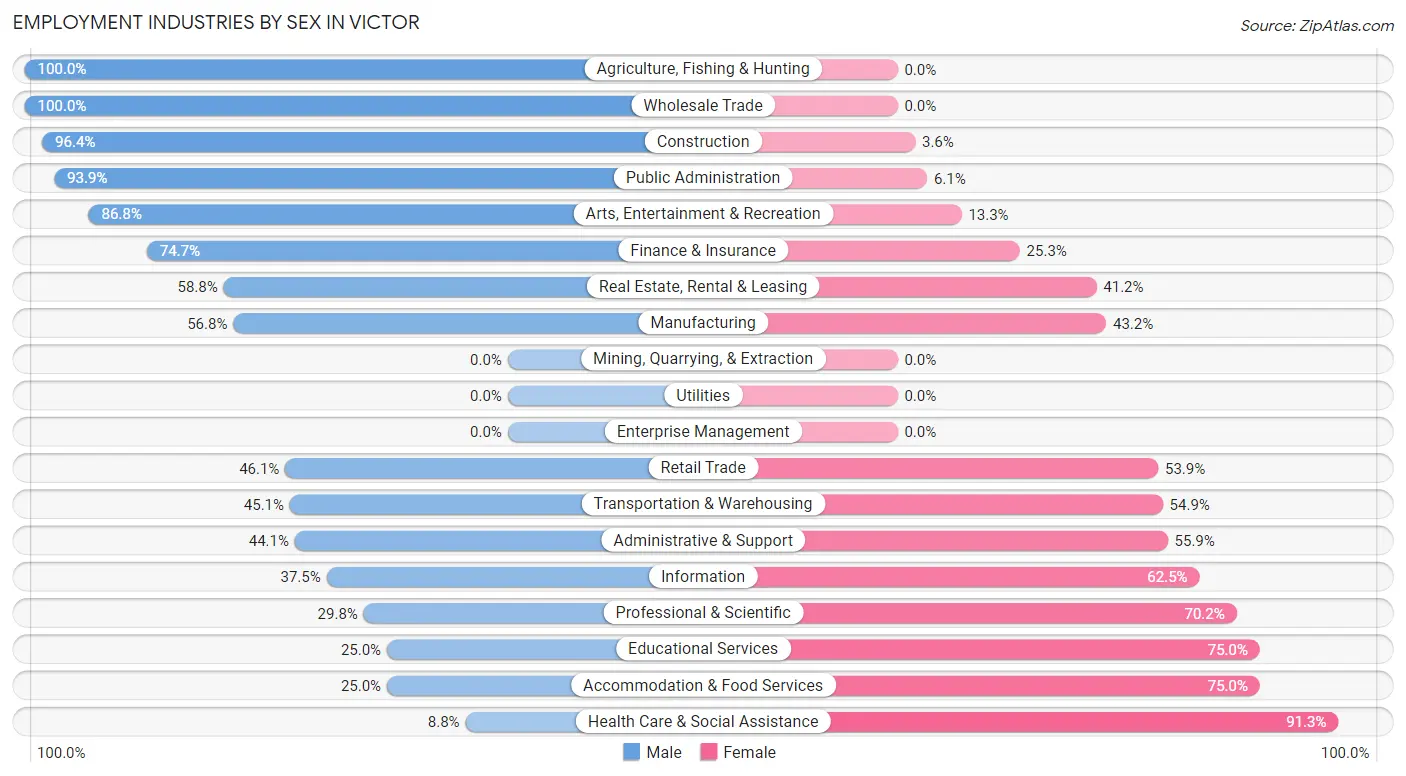
Employment Industries by Sex in Victor
The Victor industries that see more men than women are Agriculture, Fishing & Hunting (100.0%), Wholesale Trade (100.0%), and Construction (96.4%), whereas the industries that tend to have a higher number of women are Health Care & Social Assistance (91.2%), Educational Services (75.0%), and Accommodation & Food Services (75.0%).
| Industry | Male | Female |
| Agriculture, Fishing & Hunting | 44 (100.0%) | 0 (0.0%) |
| Mining, Quarrying, & Extraction | 0 (0.0%) | 0 (0.0%) |
| Construction | 212 (96.4%) | 8 (3.6%) |
| Manufacturing | 25 (56.8%) | 19 (43.2%) |
| Wholesale Trade | 15 (100.0%) | 0 (0.0%) |
| Retail Trade | 76 (46.1%) | 89 (53.9%) |
| Transportation & Warehousing | 46 (45.1%) | 56 (54.9%) |
| Utilities | 0 (0.0%) | 0 (0.0%) |
| Information | 12 (37.5%) | 20 (62.5%) |
| Finance & Insurance | 62 (74.7%) | 21 (25.3%) |
| Real Estate, Rental & Leasing | 40 (58.8%) | 28 (41.2%) |
| Professional & Scientific | 34 (29.8%) | 80 (70.2%) |
| Enterprise Management | 0 (0.0%) | 0 (0.0%) |
| Administrative & Support | 26 (44.1%) | 33 (55.9%) |
| Educational Services | 10 (25.0%) | 30 (75.0%) |
| Health Care & Social Assistance | 14 (8.7%) | 146 (91.2%) |
| Arts, Entertainment & Recreation | 72 (86.8%) | 11 (13.3%) |
| Accommodation & Food Services | 72 (25.0%) | 216 (75.0%) |
| Public Administration | 123 (93.9%) | 8 (6.1%) |
| Total | 968 (55.4%) | 778 (44.6%) |
Education in Victor
School Enrollment in Victor
The most common levels of schooling among the 466 students in Victor are middle school (128 | 27.5%), elementary school (112 | 24.0%), and kindergarten (97 | 20.8%).
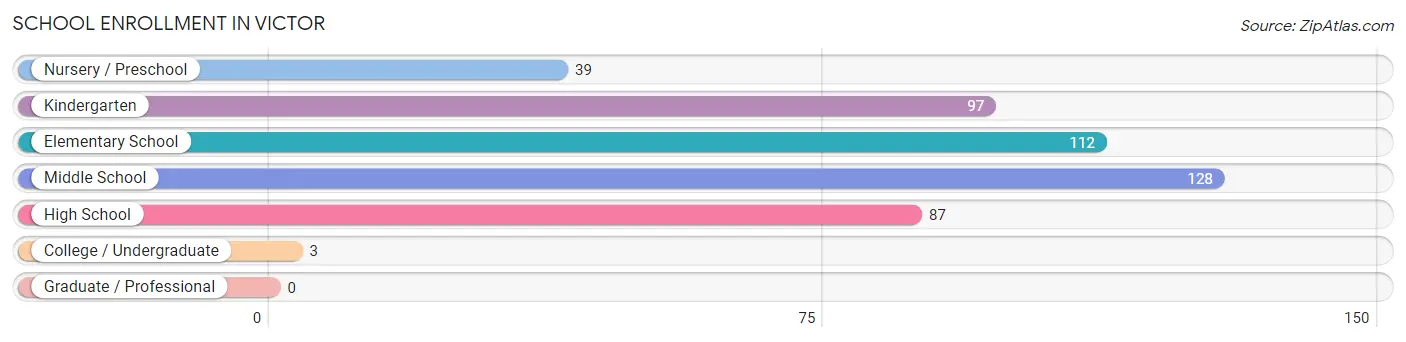
| School Level | # Students | % Students |
| Nursery / Preschool | 39 | 8.4% |
| Kindergarten | 97 | 20.8% |
| Elementary School | 112 | 24.0% |
| Middle School | 128 | 27.5% |
| High School | 87 | 18.7% |
| College / Undergraduate | 3 | 0.6% |
| Graduate / Professional | 0 | 0.0% |
| Total | 466 | 100.0% |
School Enrollment by Age by Funding Source in Victor
Out of a total of 466 students who are enrolled in schools in Victor, 83 (17.8%) attend a private institution, while the remaining 383 (82.2%) are enrolled in public schools. The age group of 3 to 4 year olds has the highest likelihood of being enrolled in private schools, with 7 (100.0% in the age bracket) enrolled. Conversely, the age group of 25 to 34 year olds has the lowest likelihood of being enrolled in a private school, with 3 (100.0% in the age bracket) attending a public institution.
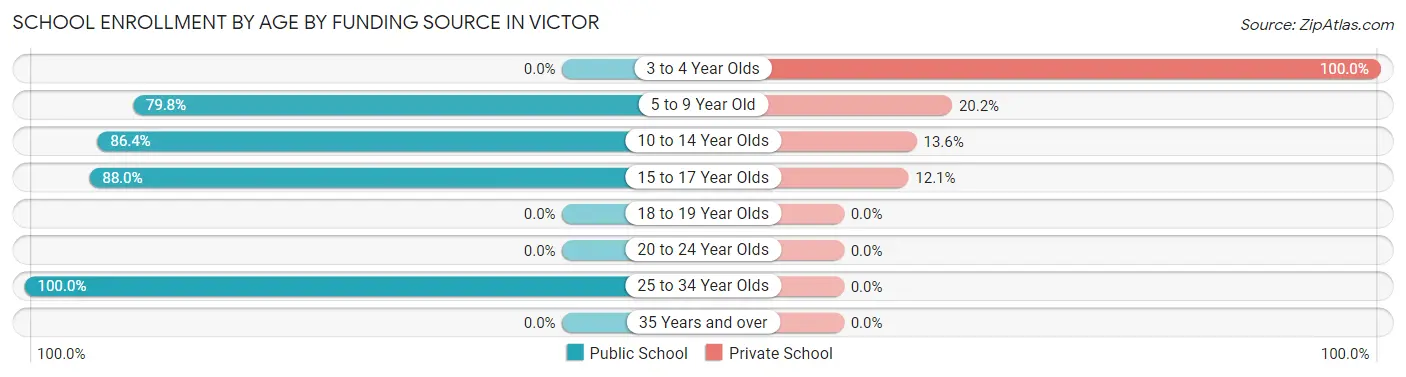
| Age Bracket | Public School | Private School |
| 3 to 4 Year Olds | 0 (0.0%) | 7 (100.0%) |
| 5 to 9 Year Old | 186 (79.8%) | 47 (20.2%) |
| 10 to 14 Year Olds | 121 (86.4%) | 19 (13.6%) |
| 15 to 17 Year Olds | 73 (87.9%) | 10 (12.0%) |
| 18 to 19 Year Olds | 0 (0.0%) | 0 (0.0%) |
| 20 to 24 Year Olds | 0 (0.0%) | 0 (0.0%) |
| 25 to 34 Year Olds | 3 (100.0%) | 0 (0.0%) |
| 35 Years and over | 0 (0.0%) | 0 (0.0%) |
| Total | 383 (82.2%) | 83 (17.8%) |
Educational Attainment by Field of Study in Victor
Business (176 | 21.4%), bio, nature & agricultural (116 | 14.1%), psychology (87 | 10.6%), visual & performing arts (84 | 10.2%), and arts & humanities (83 | 10.1%) are the most common fields of study among 823 individuals in Victor who have obtained a bachelor's degree or higher.
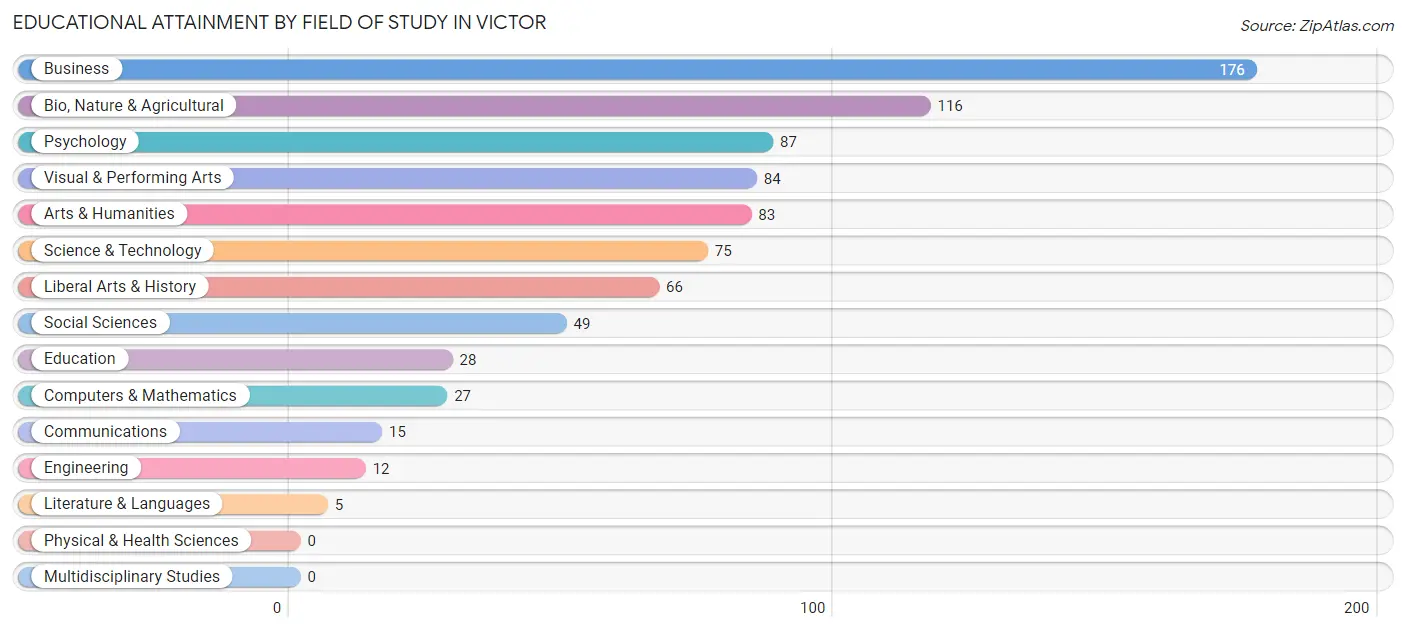
| Field of Study | # Graduates | % Graduates |
| Computers & Mathematics | 27 | 3.3% |
| Bio, Nature & Agricultural | 116 | 14.1% |
| Physical & Health Sciences | 0 | 0.0% |
| Psychology | 87 | 10.6% |
| Social Sciences | 49 | 5.9% |
| Engineering | 12 | 1.5% |
| Multidisciplinary Studies | 0 | 0.0% |
| Science & Technology | 75 | 9.1% |
| Business | 176 | 21.4% |
| Education | 28 | 3.4% |
| Literature & Languages | 5 | 0.6% |
| Liberal Arts & History | 66 | 8.0% |
| Visual & Performing Arts | 84 | 10.2% |
| Communications | 15 | 1.8% |
| Arts & Humanities | 83 | 10.1% |
| Total | 823 | 100.0% |
Transportation & Commute in Victor
Vehicle Availability by Sex in Victor
The most prevalent vehicle ownership categories in Victor are males with 2 vehicles (412, accounting for 45.6%) and females with 2 vehicles (276, making up 53.6%).
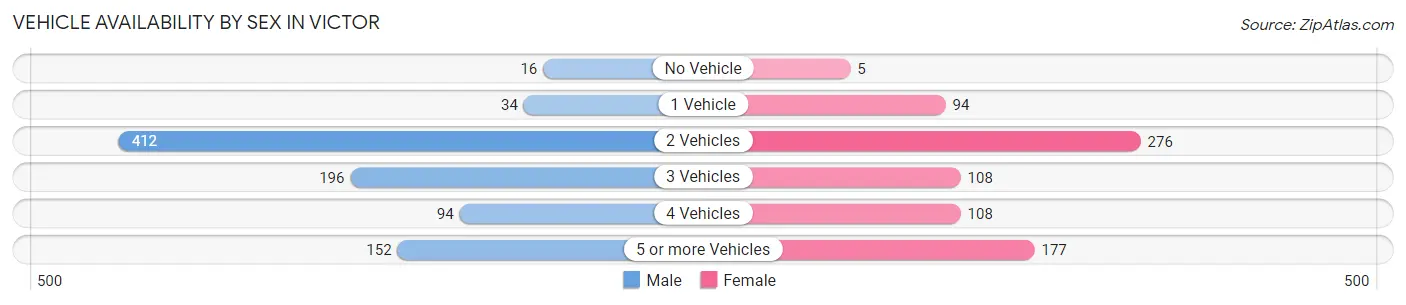
| Vehicles Available | Male | Female |
| No Vehicle | 16 (1.8%) | 5 (0.6%) |
| 1 Vehicle | 34 (3.8%) | 94 (12.2%) |
| 2 Vehicles | 412 (45.6%) | 276 (35.9%) |
| 3 Vehicles | 196 (21.7%) | 108 (14.1%) |
| 4 Vehicles | 94 (10.4%) | 108 (14.1%) |
| 5 or more Vehicles | 152 (16.8%) | 177 (23.1%) |
| Total | 904 (100.0%) | 768 (100.0%) |
Commute Time in Victor
The most frequently occuring commute durations in Victor are 45 to 59 minutes (347 commuters, 23.5%), 40 to 44 minutes (332 commuters, 22.5%), and 10 to 14 minutes (160 commuters, 10.8%).
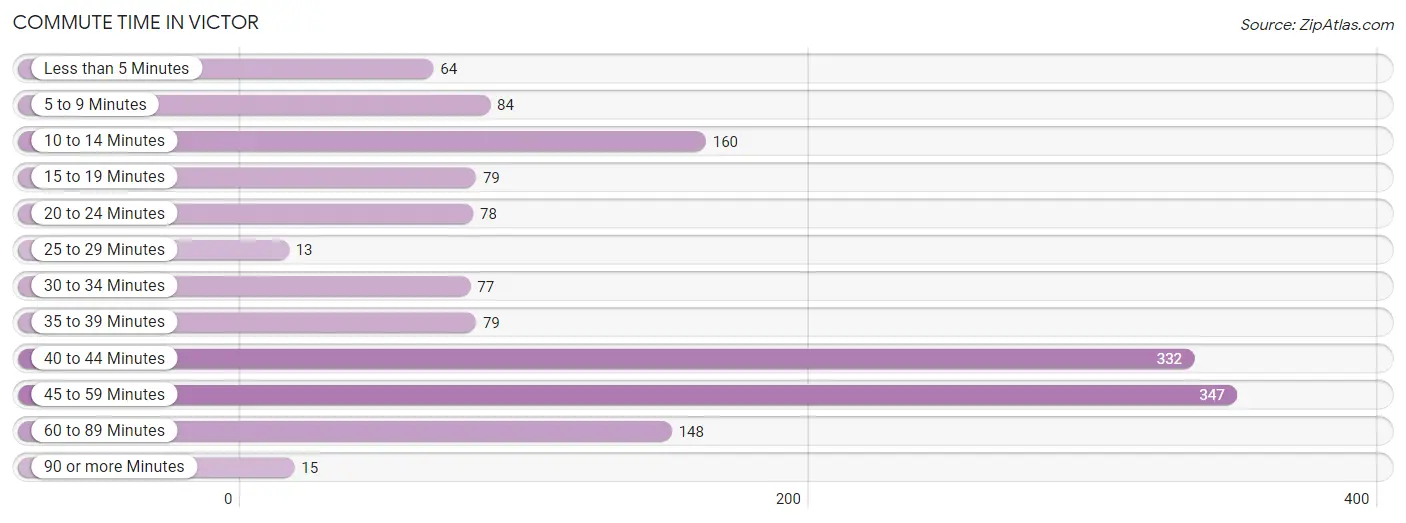
| Commute Time | # Commuters | % Commuters |
| Less than 5 Minutes | 64 | 4.3% |
| 5 to 9 Minutes | 84 | 5.7% |
| 10 to 14 Minutes | 160 | 10.8% |
| 15 to 19 Minutes | 79 | 5.3% |
| 20 to 24 Minutes | 78 | 5.3% |
| 25 to 29 Minutes | 13 | 0.9% |
| 30 to 34 Minutes | 77 | 5.2% |
| 35 to 39 Minutes | 79 | 5.3% |
| 40 to 44 Minutes | 332 | 22.5% |
| 45 to 59 Minutes | 347 | 23.5% |
| 60 to 89 Minutes | 148 | 10.0% |
| 90 or more Minutes | 15 | 1.0% |
Commute Time by Sex in Victor
The most common commute times in Victor are 40 to 44 minutes (216 commuters, 25.9%) for males and 45 to 59 minutes (168 commuters, 26.2%) for females.
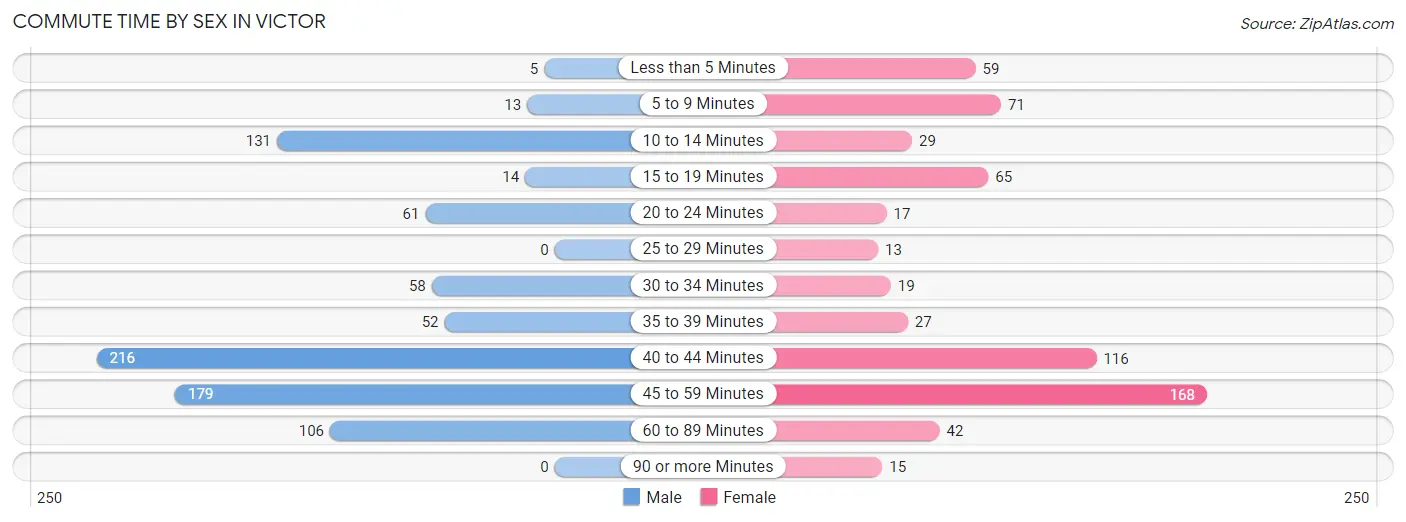
| Commute Time | Male | Female |
| Less than 5 Minutes | 5 (0.6%) | 59 (9.2%) |
| 5 to 9 Minutes | 13 (1.6%) | 71 (11.1%) |
| 10 to 14 Minutes | 131 (15.7%) | 29 (4.5%) |
| 15 to 19 Minutes | 14 (1.7%) | 65 (10.1%) |
| 20 to 24 Minutes | 61 (7.3%) | 17 (2.6%) |
| 25 to 29 Minutes | 0 (0.0%) | 13 (2.0%) |
| 30 to 34 Minutes | 58 (7.0%) | 19 (3.0%) |
| 35 to 39 Minutes | 52 (6.2%) | 27 (4.2%) |
| 40 to 44 Minutes | 216 (25.9%) | 116 (18.1%) |
| 45 to 59 Minutes | 179 (21.4%) | 168 (26.2%) |
| 60 to 89 Minutes | 106 (12.7%) | 42 (6.6%) |
| 90 or more Minutes | 0 (0.0%) | 15 (2.3%) |
Time of Departure to Work by Sex in Victor
The most frequent times of departure to work in Victor are 6:30 AM to 6:59 AM (216, 25.9%) for males and 7:00 AM to 7:29 AM (146, 22.8%) for females.
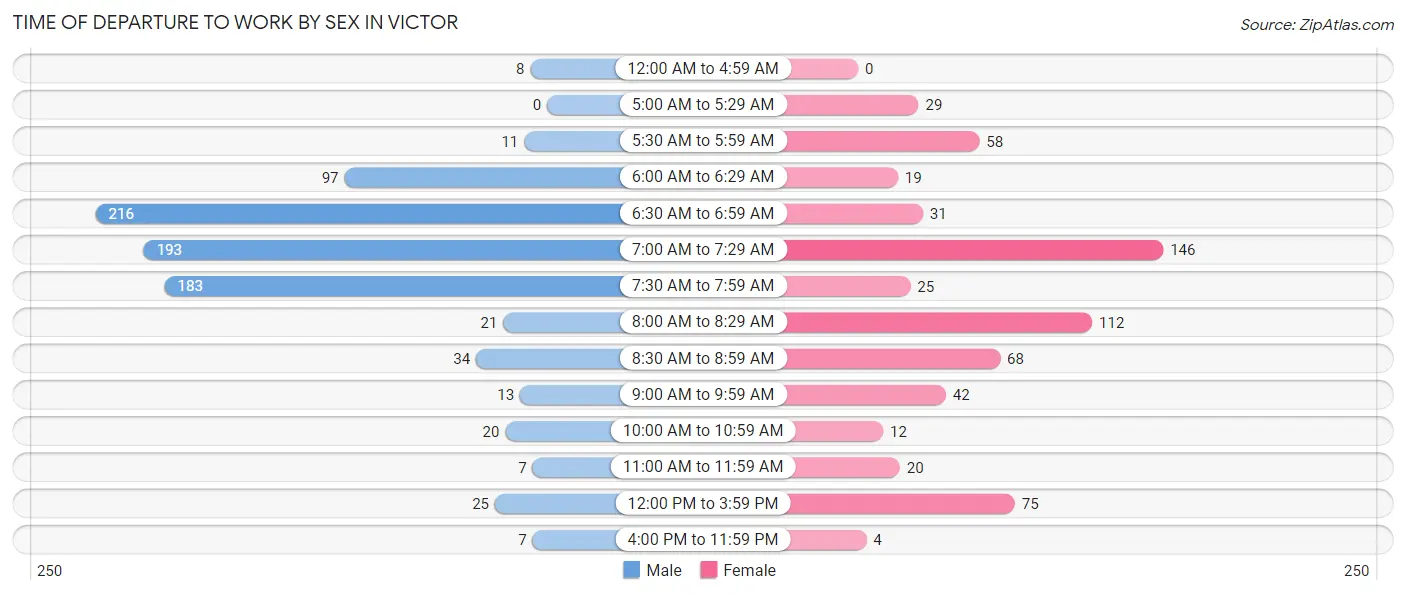
| Time of Departure | Male | Female |
| 12:00 AM to 4:59 AM | 8 (1.0%) | 0 (0.0%) |
| 5:00 AM to 5:29 AM | 0 (0.0%) | 29 (4.5%) |
| 5:30 AM to 5:59 AM | 11 (1.3%) | 58 (9.0%) |
| 6:00 AM to 6:29 AM | 97 (11.6%) | 19 (3.0%) |
| 6:30 AM to 6:59 AM | 216 (25.9%) | 31 (4.8%) |
| 7:00 AM to 7:29 AM | 193 (23.1%) | 146 (22.8%) |
| 7:30 AM to 7:59 AM | 183 (21.9%) | 25 (3.9%) |
| 8:00 AM to 8:29 AM | 21 (2.5%) | 112 (17.5%) |
| 8:30 AM to 8:59 AM | 34 (4.1%) | 68 (10.6%) |
| 9:00 AM to 9:59 AM | 13 (1.6%) | 42 (6.6%) |
| 10:00 AM to 10:59 AM | 20 (2.4%) | 12 (1.9%) |
| 11:00 AM to 11:59 AM | 7 (0.8%) | 20 (3.1%) |
| 12:00 PM to 3:59 PM | 25 (3.0%) | 75 (11.7%) |
| 4:00 PM to 11:59 PM | 7 (0.8%) | 4 (0.6%) |
| Total | 835 (100.0%) | 641 (100.0%) |
Housing Occupancy in Victor
Occupancy by Ownership in Victor
Of the total 964 dwellings in Victor, owner-occupied units account for 659 (68.4%), while renter-occupied units make up 305 (31.6%).
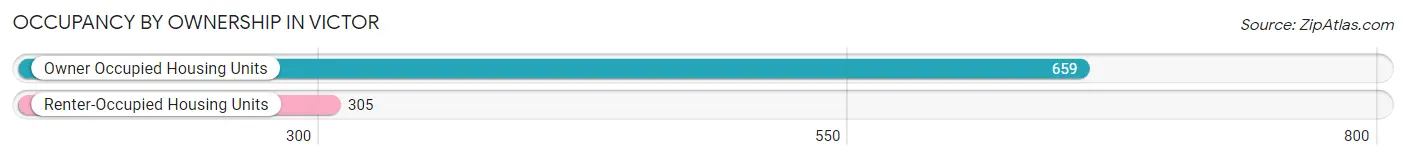
| Occupancy | # Housing Units | % Housing Units |
| Owner Occupied Housing Units | 659 | 68.4% |
| Renter-Occupied Housing Units | 305 | 31.6% |
| Total Occupied Housing Units | 964 | 100.0% |
Occupancy by Household Size in Victor
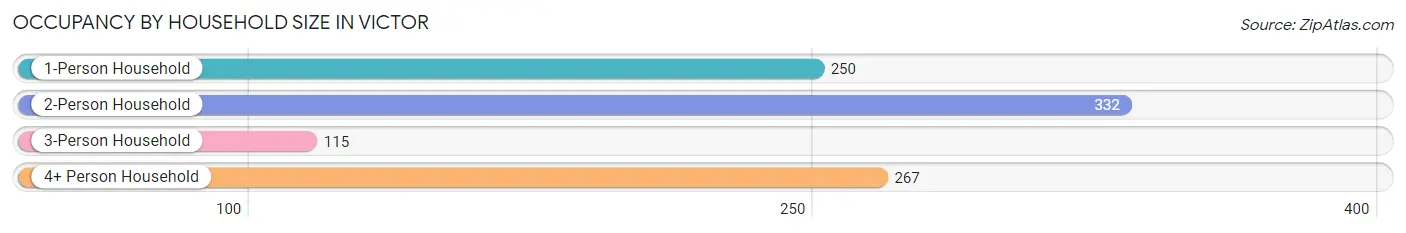
| Household Size | # Housing Units | % Housing Units |
| 1-Person Household | 250 | 25.9% |
| 2-Person Household | 332 | 34.4% |
| 3-Person Household | 115 | 11.9% |
| 4+ Person Household | 267 | 27.7% |
| Total Housing Units | 964 | 100.0% |
Occupancy by Ownership by Household Size in Victor
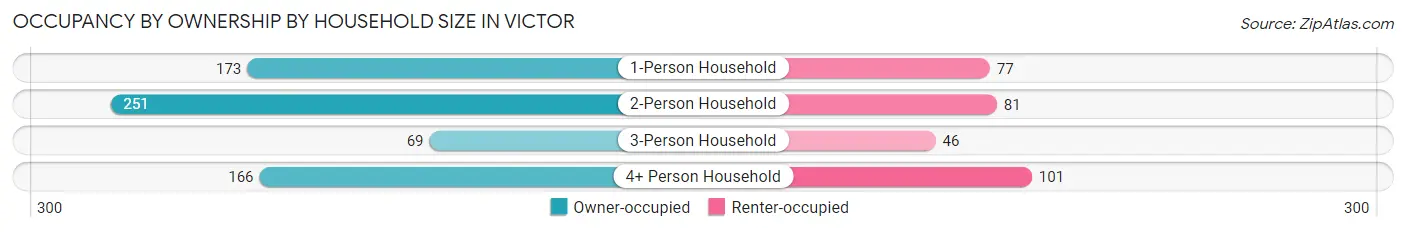
| Household Size | Owner-occupied | Renter-occupied |
| 1-Person Household | 173 (69.2%) | 77 (30.8%) |
| 2-Person Household | 251 (75.6%) | 81 (24.4%) |
| 3-Person Household | 69 (60.0%) | 46 (40.0%) |
| 4+ Person Household | 166 (62.2%) | 101 (37.8%) |
| Total Housing Units | 659 (68.4%) | 305 (31.6%) |
Occupancy by Educational Attainment in Victor
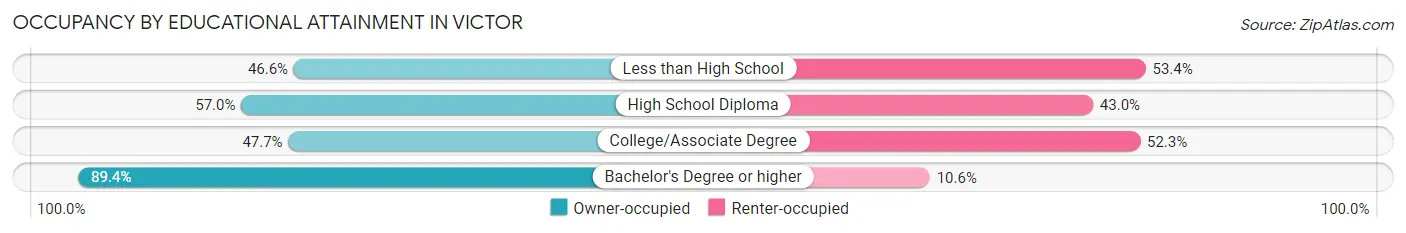
| Household Size | Owner-occupied | Renter-occupied |
| Less than High School | 48 (46.6%) | 55 (53.4%) |
| High School Diploma | 73 (57.0%) | 55 (43.0%) |
| College/Associate Degree | 134 (47.7%) | 147 (52.3%) |
| Bachelor's Degree or higher | 404 (89.4%) | 48 (10.6%) |
Occupancy by Age of Householder in Victor
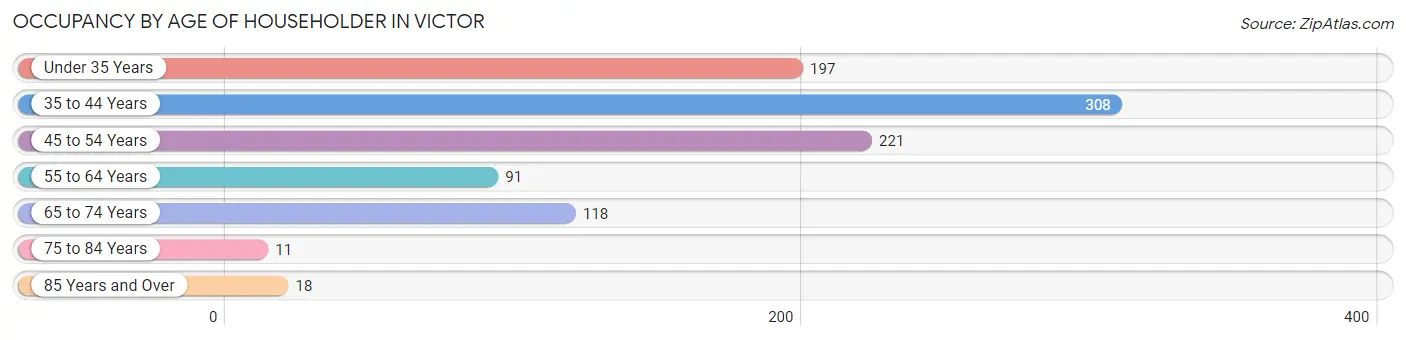
| Age Bracket | # Households | % Households |
| Under 35 Years | 197 | 20.4% |
| 35 to 44 Years | 308 | 32.0% |
| 45 to 54 Years | 221 | 22.9% |
| 55 to 64 Years | 91 | 9.4% |
| 65 to 74 Years | 118 | 12.2% |
| 75 to 84 Years | 11 | 1.1% |
| 85 Years and Over | 18 | 1.9% |
| Total | 964 | 100.0% |
Housing Finances in Victor
Median Income by Occupancy in Victor
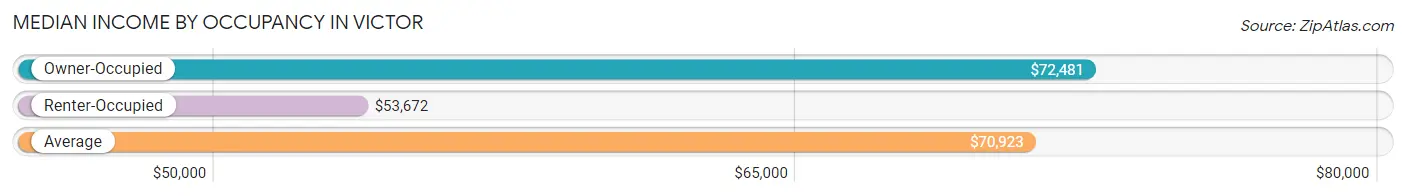
| Occupancy Type | # Households | Median Income |
| Owner-Occupied | 659 (68.4%) | $72,481 |
| Renter-Occupied | 305 (31.6%) | $53,672 |
| Average | 964 (100.0%) | $70,923 |
Occupancy by Householder Income Bracket in Victor
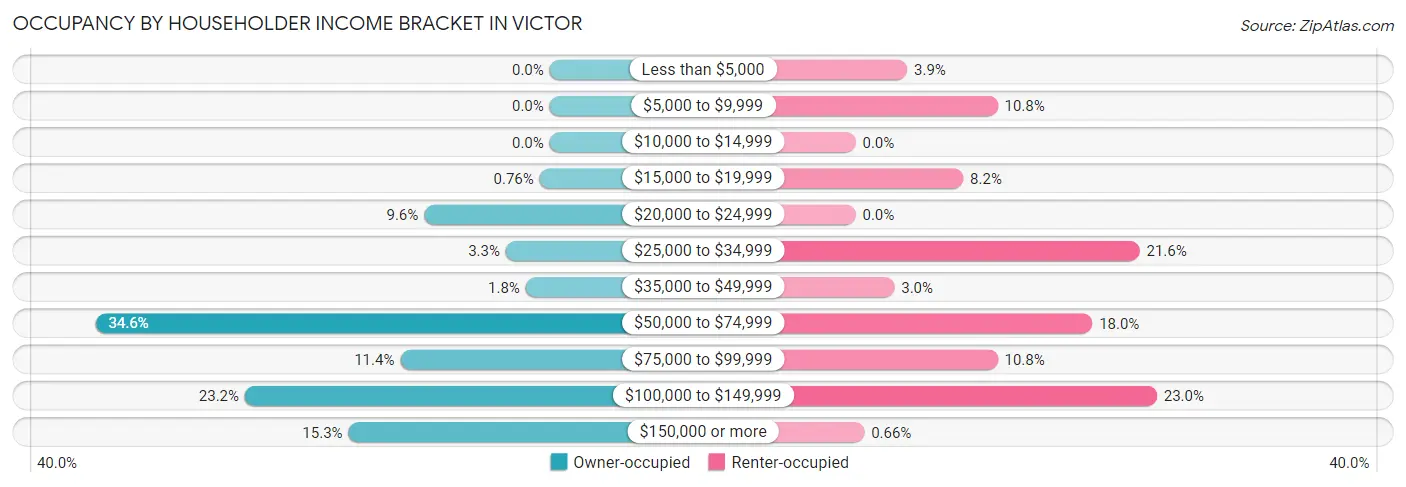
| Income Bracket | Owner-occupied | Renter-occupied |
| Less than $5,000 | 0 (0.0%) | 12 (3.9%) |
| $5,000 to $9,999 | 0 (0.0%) | 33 (10.8%) |
| $10,000 to $14,999 | 0 (0.0%) | 0 (0.0%) |
| $15,000 to $19,999 | 5 (0.8%) | 25 (8.2%) |
| $20,000 to $24,999 | 63 (9.6%) | 0 (0.0%) |
| $25,000 to $34,999 | 22 (3.3%) | 66 (21.6%) |
| $35,000 to $49,999 | 12 (1.8%) | 9 (2.9%) |
| $50,000 to $74,999 | 228 (34.6%) | 55 (18.0%) |
| $75,000 to $99,999 | 75 (11.4%) | 33 (10.8%) |
| $100,000 to $149,999 | 153 (23.2%) | 70 (23.0%) |
| $150,000 or more | 101 (15.3%) | 2 (0.7%) |
| Total | 659 (100.0%) | 305 (100.0%) |
Monthly Housing Cost Tiers in Victor
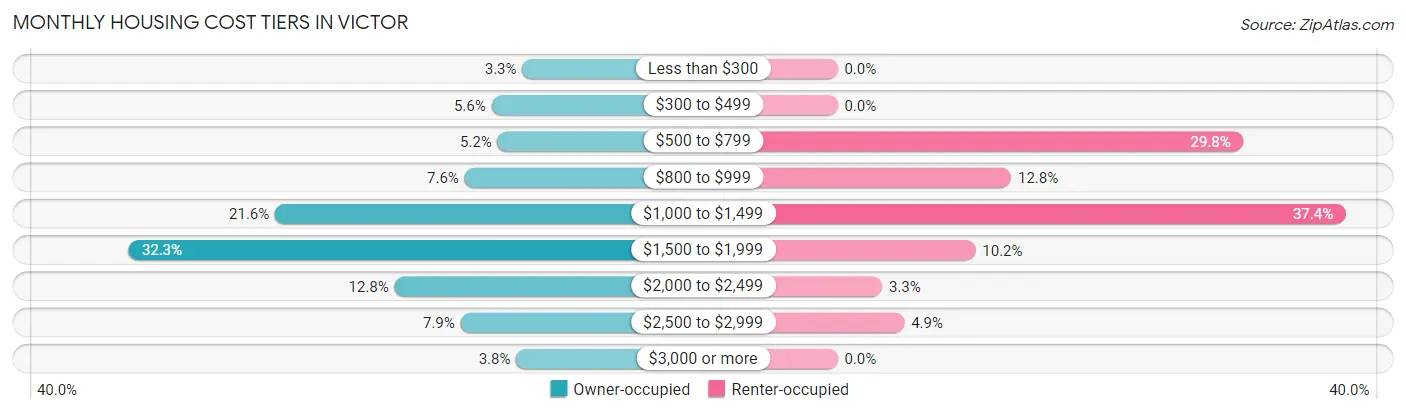
| Monthly Cost | Owner-occupied | Renter-occupied |
| Less than $300 | 22 (3.3%) | 0 (0.0%) |
| $300 to $499 | 37 (5.6%) | 0 (0.0%) |
| $500 to $799 | 34 (5.2%) | 91 (29.8%) |
| $800 to $999 | 50 (7.6%) | 39 (12.8%) |
| $1,000 to $1,499 | 142 (21.5%) | 114 (37.4%) |
| $1,500 to $1,999 | 213 (32.3%) | 31 (10.2%) |
| $2,000 to $2,499 | 84 (12.8%) | 10 (3.3%) |
| $2,500 to $2,999 | 52 (7.9%) | 15 (4.9%) |
| $3,000 or more | 25 (3.8%) | 0 (0.0%) |
| Total | 659 (100.0%) | 305 (100.0%) |
Physical Housing Characteristics in Victor
Housing Structures in Victor
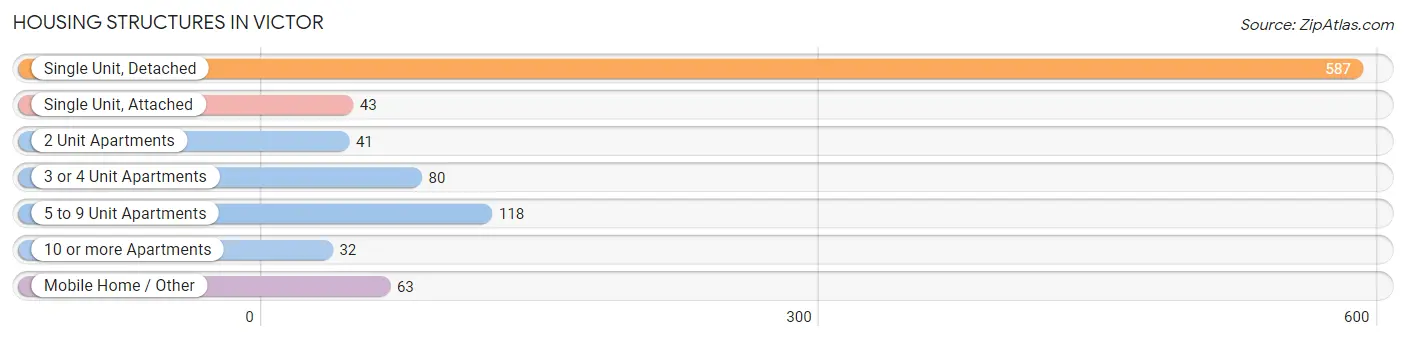
| Structure Type | # Housing Units | % Housing Units |
| Single Unit, Detached | 587 | 60.9% |
| Single Unit, Attached | 43 | 4.5% |
| 2 Unit Apartments | 41 | 4.3% |
| 3 or 4 Unit Apartments | 80 | 8.3% |
| 5 to 9 Unit Apartments | 118 | 12.2% |
| 10 or more Apartments | 32 | 3.3% |
| Mobile Home / Other | 63 | 6.5% |
| Total | 964 | 100.0% |
Housing Structures by Occupancy in Victor
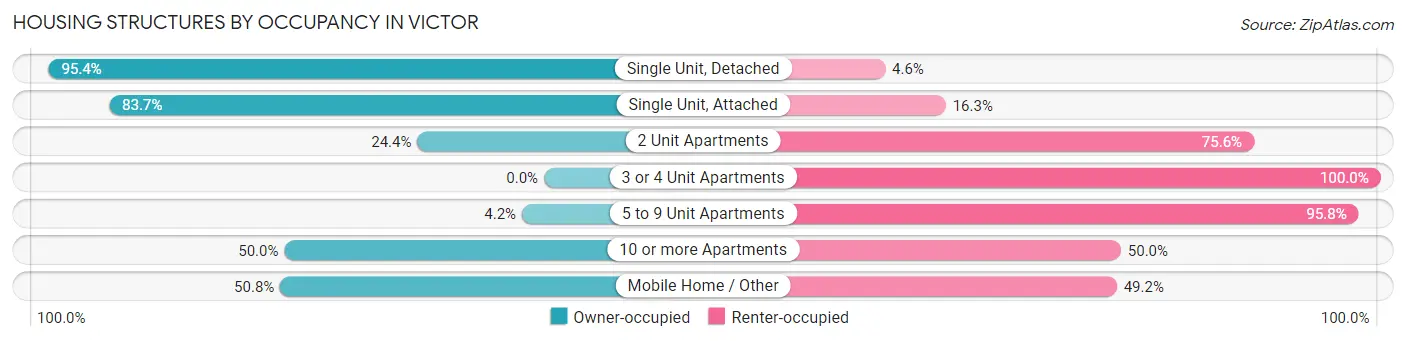
| Structure Type | Owner-occupied | Renter-occupied |
| Single Unit, Detached | 560 (95.4%) | 27 (4.6%) |
| Single Unit, Attached | 36 (83.7%) | 7 (16.3%) |
| 2 Unit Apartments | 10 (24.4%) | 31 (75.6%) |
| 3 or 4 Unit Apartments | 0 (0.0%) | 80 (100.0%) |
| 5 to 9 Unit Apartments | 5 (4.2%) | 113 (95.8%) |
| 10 or more Apartments | 16 (50.0%) | 16 (50.0%) |
| Mobile Home / Other | 32 (50.8%) | 31 (49.2%) |
| Total | 659 (68.4%) | 305 (31.6%) |
Housing Structures by Number of Rooms in Victor
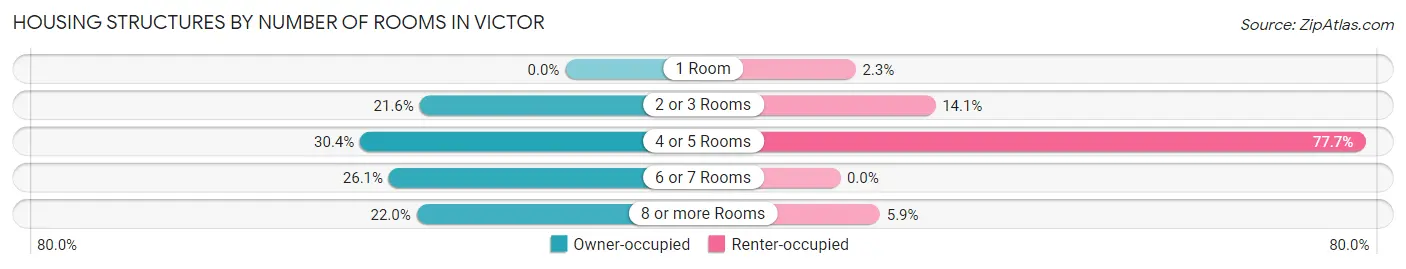
| Number of Rooms | Owner-occupied | Renter-occupied |
| 1 Room | 0 (0.0%) | 7 (2.3%) |
| 2 or 3 Rooms | 142 (21.5%) | 43 (14.1%) |
| 4 or 5 Rooms | 200 (30.3%) | 237 (77.7%) |
| 6 or 7 Rooms | 172 (26.1%) | 0 (0.0%) |
| 8 or more Rooms | 145 (22.0%) | 18 (5.9%) |
| Total | 659 (100.0%) | 305 (100.0%) |
Housing Structure by Heating Type in Victor
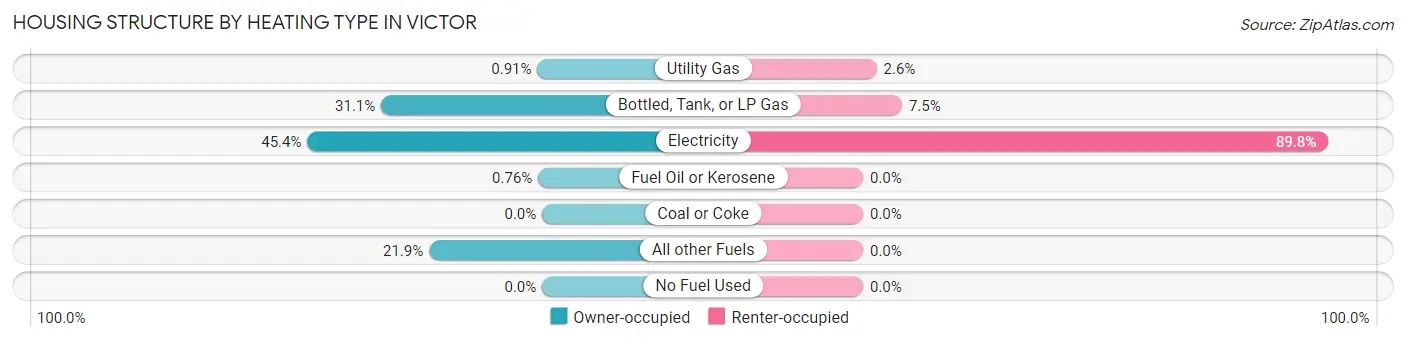
| Heating Type | Owner-occupied | Renter-occupied |
| Utility Gas | 6 (0.9%) | 8 (2.6%) |
| Bottled, Tank, or LP Gas | 205 (31.1%) | 23 (7.5%) |
| Electricity | 299 (45.4%) | 274 (89.8%) |
| Fuel Oil or Kerosene | 5 (0.8%) | 0 (0.0%) |
| Coal or Coke | 0 (0.0%) | 0 (0.0%) |
| All other Fuels | 144 (21.8%) | 0 (0.0%) |
| No Fuel Used | 0 (0.0%) | 0 (0.0%) |
| Total | 659 (100.0%) | 305 (100.0%) |
Household Vehicle Usage in Victor
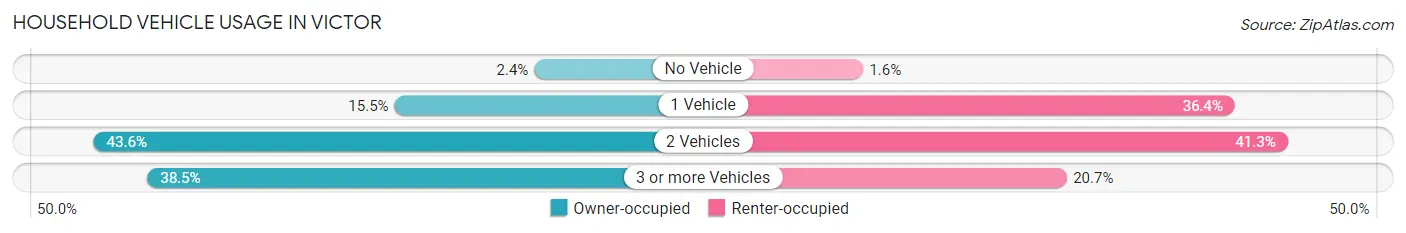
| Vehicles per Household | Owner-occupied | Renter-occupied |
| No Vehicle | 16 (2.4%) | 5 (1.6%) |
| 1 Vehicle | 102 (15.5%) | 111 (36.4%) |
| 2 Vehicles | 287 (43.5%) | 126 (41.3%) |
| 3 or more Vehicles | 254 (38.5%) | 63 (20.7%) |
| Total | 659 (100.0%) | 305 (100.0%) |
Real Estate & Mortgages in Victor
Real Estate and Mortgage Overview in Victor
| Characteristic | Without Mortgage | With Mortgage |
| Housing Units | 123 | 536 |
| Median Property Value | $512,000 | $501,100 |
| Median Household Income | $70,594 | $89 |
| Monthly Housing Costs | $542 | $25 |
| Real Estate Taxes | $2,183 | $0 |
Property Value by Mortgage Status in Victor
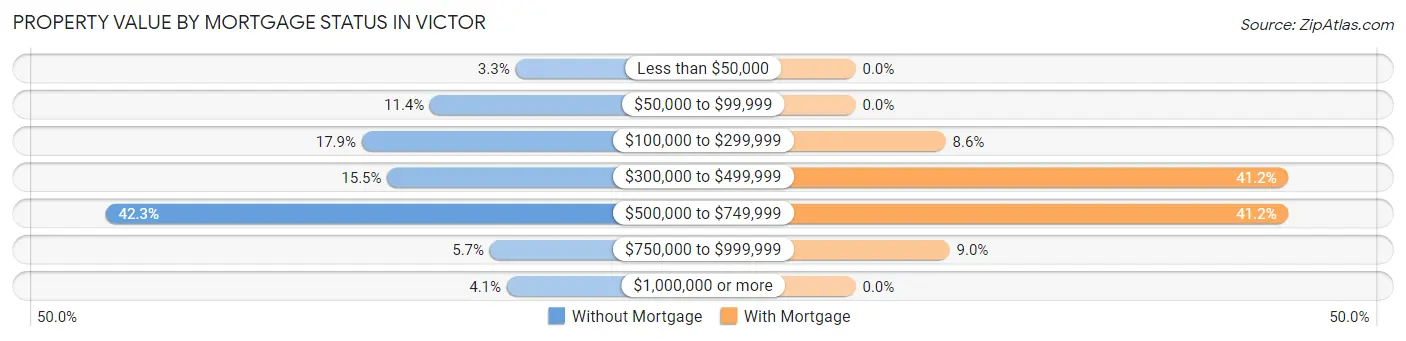
| Property Value | Without Mortgage | With Mortgage |
| Less than $50,000 | 4 (3.3%) | 0 (0.0%) |
| $50,000 to $99,999 | 14 (11.4%) | 0 (0.0%) |
| $100,000 to $299,999 | 22 (17.9%) | 46 (8.6%) |
| $300,000 to $499,999 | 19 (15.4%) | 221 (41.2%) |
| $500,000 to $749,999 | 52 (42.3%) | 221 (41.2%) |
| $750,000 to $999,999 | 7 (5.7%) | 48 (9.0%) |
| $1,000,000 or more | 5 (4.1%) | 0 (0.0%) |
| Total | 123 (100.0%) | 536 (100.0%) |
Household Income by Mortgage Status in Victor
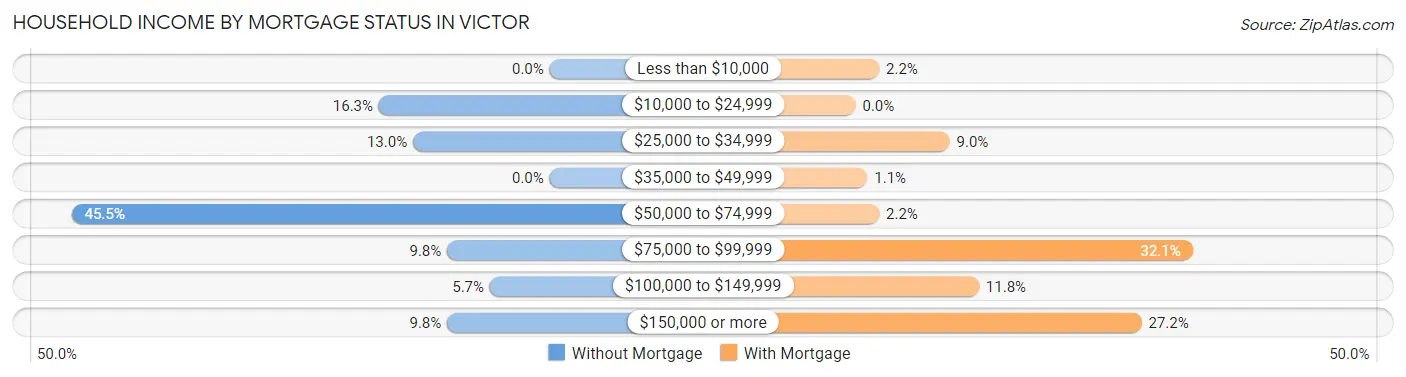
| Household Income | Without Mortgage | With Mortgage |
| Less than $10,000 | 0 (0.0%) | 12 (2.2%) |
| $10,000 to $24,999 | 20 (16.3%) | 0 (0.0%) |
| $25,000 to $34,999 | 16 (13.0%) | 48 (9.0%) |
| $35,000 to $49,999 | 0 (0.0%) | 6 (1.1%) |
| $50,000 to $74,999 | 56 (45.5%) | 12 (2.2%) |
| $75,000 to $99,999 | 12 (9.8%) | 172 (32.1%) |
| $100,000 to $149,999 | 7 (5.7%) | 63 (11.7%) |
| $150,000 or more | 12 (9.8%) | 146 (27.2%) |
| Total | 123 (100.0%) | 536 (100.0%) |
Property Value to Household Income Ratio in Victor
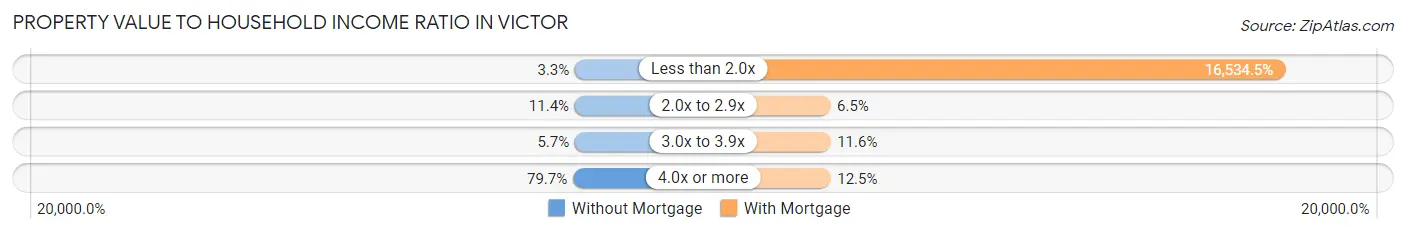
| Value-to-Income Ratio | Without Mortgage | With Mortgage |
| Less than 2.0x | 4 (3.3%) | 88,625 (16,534.5%) |
| 2.0x to 2.9x | 14 (11.4%) | 35 (6.5%) |
| 3.0x to 3.9x | 7 (5.7%) | 62 (11.6%) |
| 4.0x or more | 98 (79.7%) | 67 (12.5%) |
| Total | 123 (100.0%) | 536 (100.0%) |
Real Estate Taxes by Mortgage Status in Victor
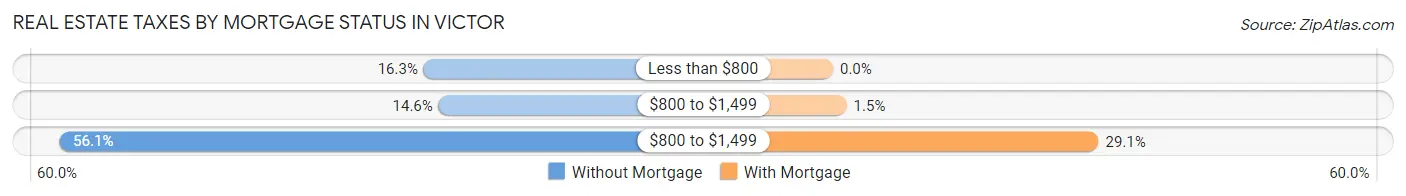
| Property Taxes | Without Mortgage | With Mortgage |
| Less than $800 | 20 (16.3%) | 0 (0.0%) |
| $800 to $1,499 | 18 (14.6%) | 8 (1.5%) |
| $800 to $1,499 | 69 (56.1%) | 156 (29.1%) |
| Total | 123 (100.0%) | 536 (100.0%) |
Health & Disability in Victor
Health Insurance Coverage by Age in Victor
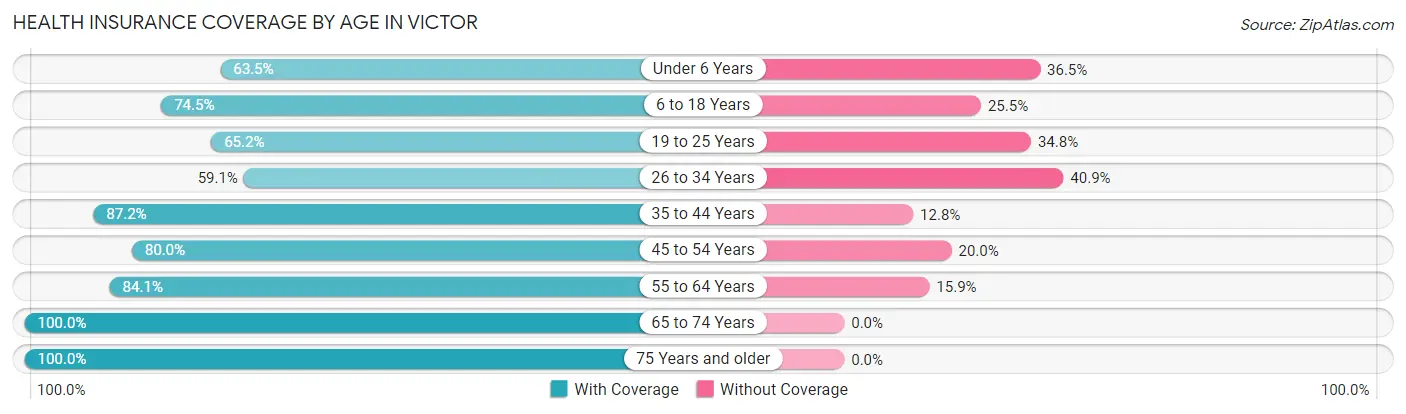
| Age Bracket | With Coverage | Without Coverage |
| Under 6 Years | 193 (63.5%) | 111 (36.5%) |
| 6 to 18 Years | 339 (74.5%) | 116 (25.5%) |
| 19 to 25 Years | 191 (65.2%) | 102 (34.8%) |
| 26 to 34 Years | 288 (59.1%) | 199 (40.9%) |
| 35 to 44 Years | 475 (87.2%) | 70 (12.8%) |
| 45 to 54 Years | 312 (80.0%) | 78 (20.0%) |
| 55 to 64 Years | 175 (84.1%) | 33 (15.9%) |
| 65 to 74 Years | 154 (100.0%) | 0 (0.0%) |
| 75 Years and older | 40 (100.0%) | 0 (0.0%) |
| Total | 2,167 (75.3%) | 709 (24.6%) |
Health Insurance Coverage by Citizenship Status in Victor
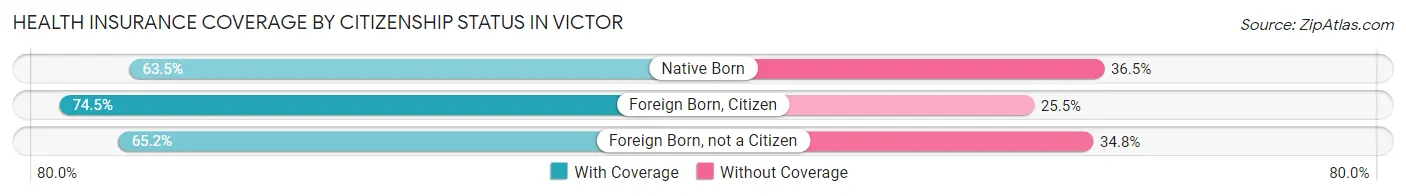
| Citizenship Status | With Coverage | Without Coverage |
| Native Born | 193 (63.5%) | 111 (36.5%) |
| Foreign Born, Citizen | 339 (74.5%) | 116 (25.5%) |
| Foreign Born, not a Citizen | 191 (65.2%) | 102 (34.8%) |
Health Insurance Coverage by Household Income in Victor
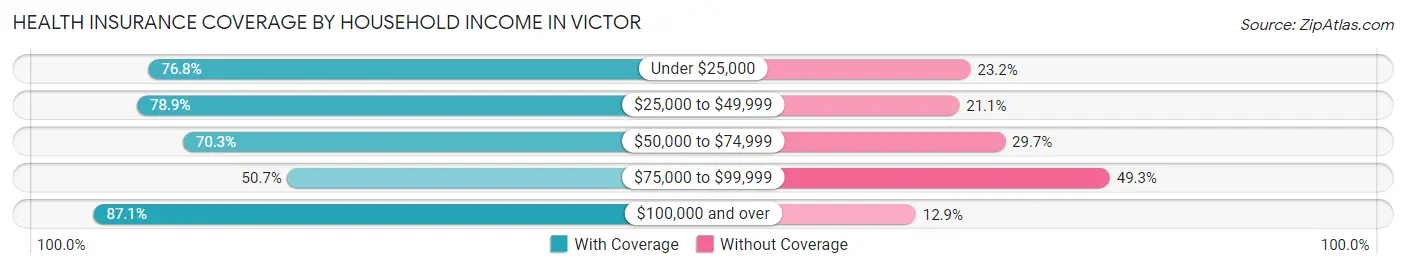
| Household Income | With Coverage | Without Coverage |
| Under $25,000 | 159 (76.8%) | 48 (23.2%) |
| $25,000 to $49,999 | 191 (78.9%) | 51 (21.1%) |
| $50,000 to $74,999 | 498 (70.3%) | 210 (29.7%) |
| $75,000 to $99,999 | 248 (50.7%) | 241 (49.3%) |
| $100,000 and over | 1,071 (87.1%) | 159 (12.9%) |
Public vs Private Health Insurance Coverage by Age in Victor
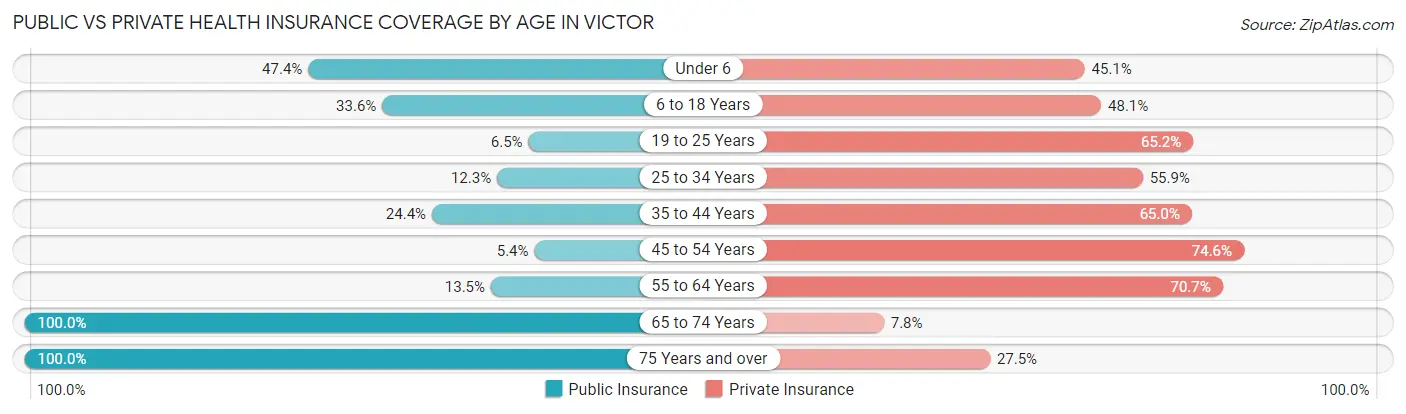
| Age Bracket | Public Insurance | Private Insurance |
| Under 6 | 144 (47.4%) | 137 (45.1%) |
| 6 to 18 Years | 153 (33.6%) | 219 (48.1%) |
| 19 to 25 Years | 19 (6.5%) | 191 (65.2%) |
| 25 to 34 Years | 60 (12.3%) | 272 (55.8%) |
| 35 to 44 Years | 133 (24.4%) | 354 (64.9%) |
| 45 to 54 Years | 21 (5.4%) | 291 (74.6%) |
| 55 to 64 Years | 28 (13.5%) | 147 (70.7%) |
| 65 to 74 Years | 154 (100.0%) | 12 (7.8%) |
| 75 Years and over | 40 (100.0%) | 11 (27.5%) |
| Total | 752 (26.2%) | 1,634 (56.8%) |
Disability Status by Sex by Age in Victor
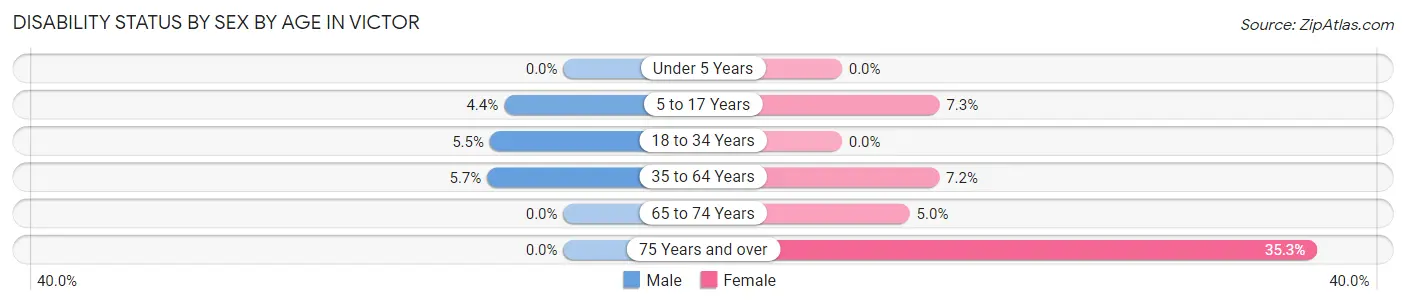
| Age Bracket | Male | Female |
| Under 5 Years | 0 (0.0%) | 0 (0.0%) |
| 5 to 17 Years | 15 (4.4%) | 10 (7.2%) |
| 18 to 34 Years | 28 (5.5%) | 0 (0.0%) |
| 35 to 64 Years | 31 (5.7%) | 43 (7.2%) |
| 65 to 74 Years | 0 (0.0%) | 6 (5.0%) |
| 75 Years and over | 0 (0.0%) | 6 (35.3%) |
Disability Class by Sex by Age in Victor
Disability Class: Hearing Difficulty
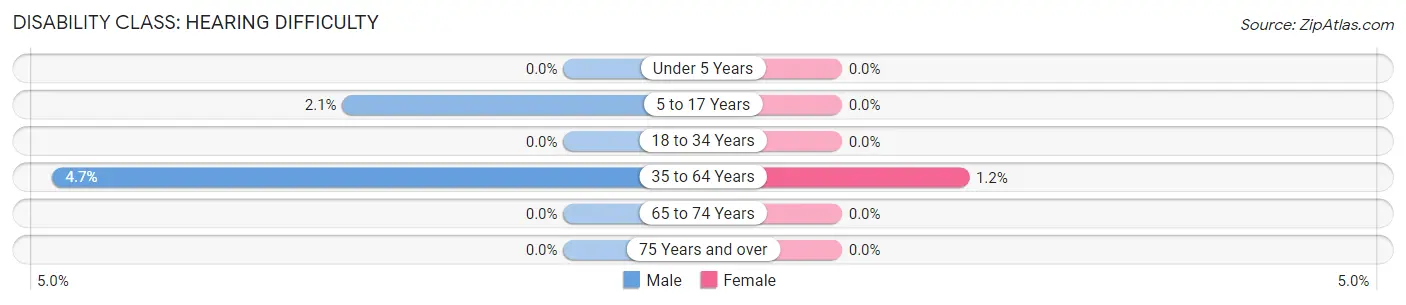
| Age Bracket | Male | Female |
| Under 5 Years | 0 (0.0%) | 0 (0.0%) |
| 5 to 17 Years | 7 (2.1%) | 0 (0.0%) |
| 18 to 34 Years | 0 (0.0%) | 0 (0.0%) |
| 35 to 64 Years | 26 (4.7%) | 7 (1.2%) |
| 65 to 74 Years | 0 (0.0%) | 0 (0.0%) |
| 75 Years and over | 0 (0.0%) | 0 (0.0%) |
Disability Class: Vision Difficulty
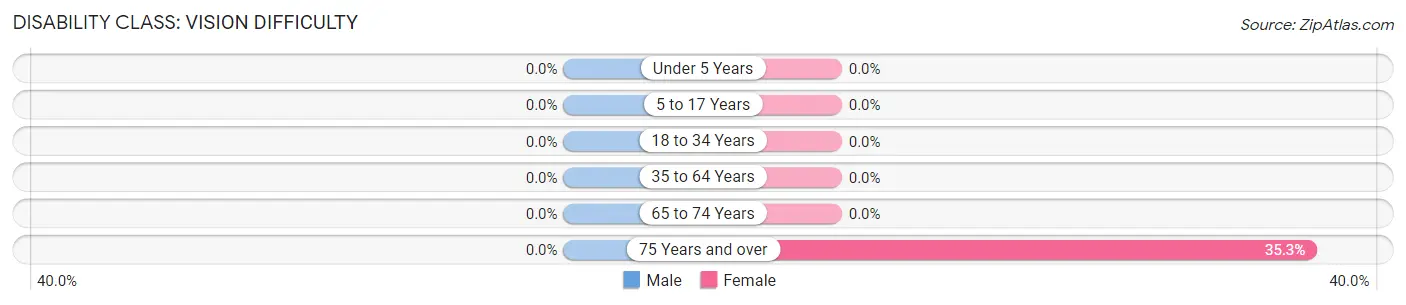
| Age Bracket | Male | Female |
| Under 5 Years | 0 (0.0%) | 0 (0.0%) |
| 5 to 17 Years | 0 (0.0%) | 0 (0.0%) |
| 18 to 34 Years | 0 (0.0%) | 0 (0.0%) |
| 35 to 64 Years | 0 (0.0%) | 0 (0.0%) |
| 65 to 74 Years | 0 (0.0%) | 0 (0.0%) |
| 75 Years and over | 0 (0.0%) | 6 (35.3%) |
Disability Class: Cognitive Difficulty
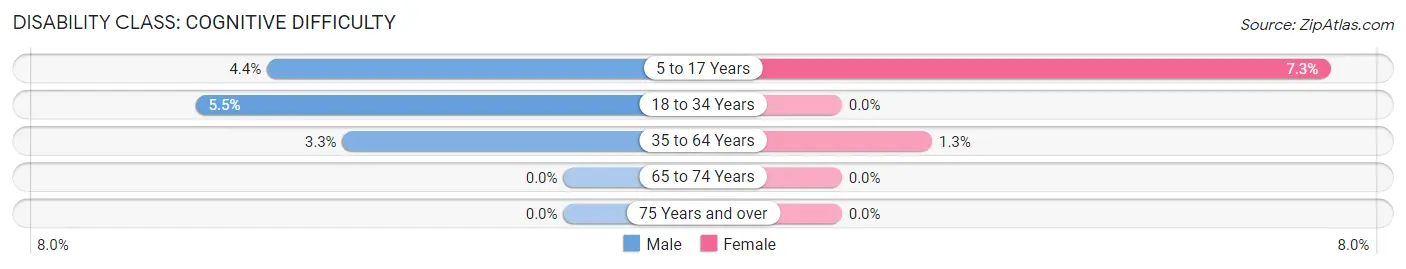
| Age Bracket | Male | Female |
| 5 to 17 Years | 15 (4.4%) | 10 (7.2%) |
| 18 to 34 Years | 28 (5.5%) | 0 (0.0%) |
| 35 to 64 Years | 18 (3.3%) | 8 (1.3%) |
| 65 to 74 Years | 0 (0.0%) | 0 (0.0%) |
| 75 Years and over | 0 (0.0%) | 0 (0.0%) |
Disability Class: Ambulatory Difficulty
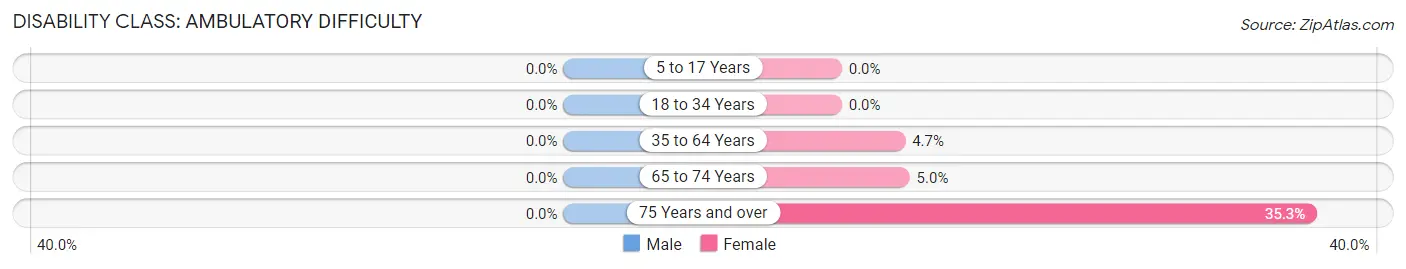
| Age Bracket | Male | Female |
| 5 to 17 Years | 0 (0.0%) | 0 (0.0%) |
| 18 to 34 Years | 0 (0.0%) | 0 (0.0%) |
| 35 to 64 Years | 0 (0.0%) | 28 (4.7%) |
| 65 to 74 Years | 0 (0.0%) | 6 (5.0%) |
| 75 Years and over | 0 (0.0%) | 6 (35.3%) |
Disability Class: Self-Care Difficulty
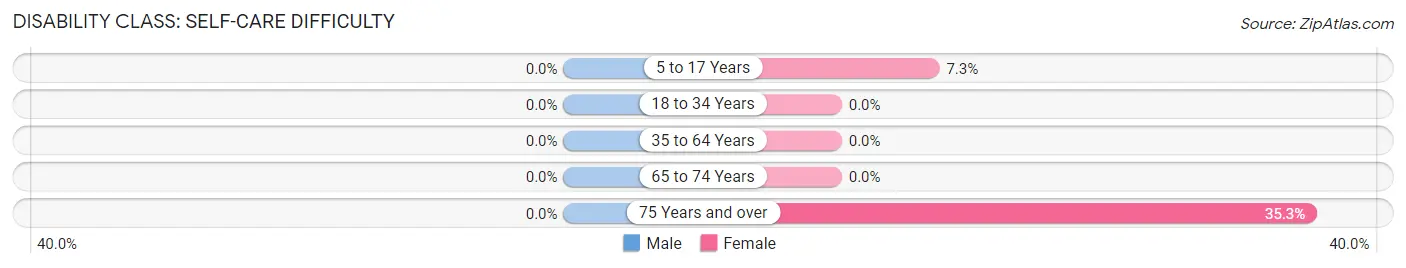
| Age Bracket | Male | Female |
| 5 to 17 Years | 0 (0.0%) | 10 (7.2%) |
| 18 to 34 Years | 0 (0.0%) | 0 (0.0%) |
| 35 to 64 Years | 0 (0.0%) | 0 (0.0%) |
| 65 to 74 Years | 0 (0.0%) | 0 (0.0%) |
| 75 Years and over | 0 (0.0%) | 6 (35.3%) |
Technology Access in Victor
Computing Device Access in Victor
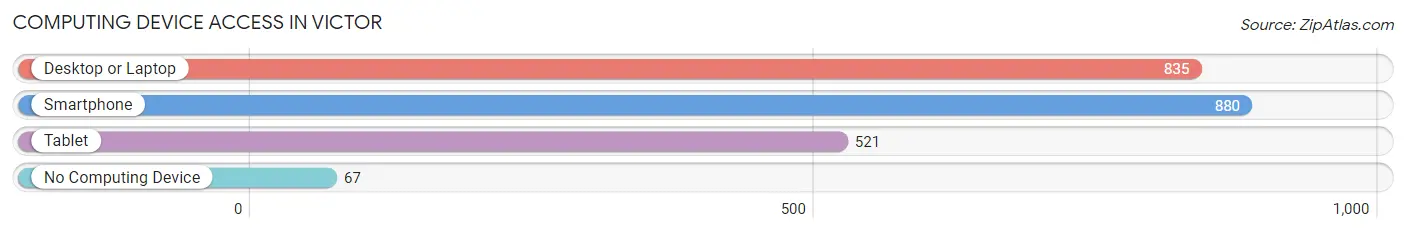
| Device Type | # Households | % Households |
| Desktop or Laptop | 835 | 86.6% |
| Smartphone | 880 | 91.3% |
| Tablet | 521 | 54.0% |
| No Computing Device | 67 | 7.0% |
| Total | 964 | 100.0% |
Internet Access in Victor
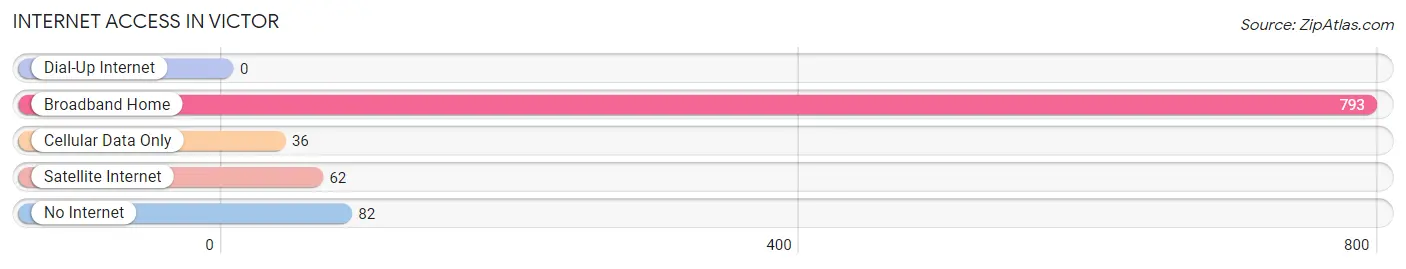
| Internet Type | # Households | % Households |
| Dial-Up Internet | 0 | 0.0% |
| Broadband Home | 793 | 82.3% |
| Cellular Data Only | 36 | 3.7% |
| Satellite Internet | 62 | 6.4% |
| No Internet | 82 | 8.5% |
| Total | 964 | 100.0% |
Victor Summary
Victor, Idaho is a small city located in the western part of the state, in Teton County. It is situated at the base of the Teton Mountains, and is surrounded by the Targhee National Forest. The city has a population of approximately 2,000 people, and is the county seat of Teton County.
Victor was founded in 1883 by a group of Mormon settlers, and was named after a local Native American chief. The city was incorporated in 1891, and has since grown to become a popular tourist destination.
Geography
Victor is located in the western part of Idaho, in Teton County. It is situated at the base of the Teton Mountains, and is surrounded by the Targhee National Forest. The city is located at an elevation of 5,890 feet, and has a total area of 1.2 square miles. The climate in Victor is semi-arid, with hot summers and cold winters.
Economy
Victor’s economy is largely based on tourism, as the city is a popular destination for outdoor recreation. The city is home to several ski resorts, as well as numerous hiking trails and other outdoor activities. Additionally, Victor is home to several businesses, including restaurants, retail stores, and other services.
Demographics
As of the 2010 census, Victor had a population of 2,000 people. The racial makeup of the city was 95.2% White, 0.7% Native American, 0.3% Asian, 0.2% African American, and 3.6% from other races. The median household income in Victor was $45,000, and the median age was 37.
Conclusion
Victor, Idaho is a small city located in the western part of the state, in Teton County. It is situated at the base of the Teton Mountains, and is surrounded by the Targhee National Forest. The city has a population of approximately 2,000 people, and is the county seat of Teton County. The economy of Victor is largely based on tourism, as the city is a popular destination for outdoor recreation. Additionally, the city is home to several businesses, including restaurants, retail stores, and other services. The racial makeup of the city is predominantly White, with a small percentage of Native American, Asian, and African American residents.
Common Questions
What is Per Capita Income in Victor?
Per Capita income in Victor is $32,129.
What is the Median Family Income in Victor?
Median Family Income in Victor is $105,234.
What is the Median Household income in Victor?
Median Household Income in Victor is $70,923.
What is Income or Wage Gap in Victor?
Income or Wage Gap in Victor is 33.0%.
Women in Victor earn 67.0 cents for every dollar earned by a man.
What is Inequality or Gini Index in Victor?
Inequality or Gini Index in Victor is 0.38.
What is the Total Population of Victor?
Total Population of Victor is 2,876.
What is the Total Male Population of Victor?
Total Male Population of Victor is 1,653.
What is the Total Female Population of Victor?
Total Female Population of Victor is 1,223.
What is the Ratio of Males per 100 Females in Victor?
There are 135.16 Males per 100 Females in Victor.
What is the Ratio of Females per 100 Males in Victor?
There are 73.99 Females per 100 Males in Victor.
What is the Median Population Age in Victor?
Median Population Age in Victor is 32.5 Years.
What is the Average Family Size in Victor
Average Family Size in Victor is 4.0 People.
What is the Average Household Size in Victor
Average Household Size in Victor is 3.0 People.
How Large is the Labor Force in Victor?
There are 1,747 People in the Labor Forcein in Victor.
What is the Percentage of People in the Labor Force in Victor?
79.3% of People are in the Labor Force in Victor.