West Lake Hills, TX Map & Demographics
West Lake Hills Map
West Lake Hills Overview
$105,273
PER CAPITA INCOME
$231,528
AVG FAMILY INCOME
$210,000
AVG HOUSEHOLD INCOME
39.6%
WAGE / INCOME GAP [ % ]
60.4¢/ $1
WAGE / INCOME GAP [ $ ]
0.47
INEQUALITY / GINI INDEX
3,360
TOTAL POPULATION
1,600
MALE POPULATION
1,760
FEMALE POPULATION
90.91
MALES / 100 FEMALES
110.00
FEMALES / 100 MALES
49.7
MEDIAN AGE
3.0
AVG FAMILY SIZE
2.7
AVG HOUSEHOLD SIZE
1,366
LABOR FORCE [ PEOPLE ]
51.4%
PERCENT IN LABOR FORCE
4.5%
UNEMPLOYMENT RATE
West Lake Hills Area Codes
Income in West Lake Hills
Income Overview in West Lake Hills
Per Capita Income in West Lake Hills is $105,273, while median incomes of families and households are $231,528 and $210,000 respectively.
| Characteristic | Number | Measure |
| Per Capita Income | 3,360 | $105,273 |
| Median Family Income | 1,007 | $231,528 |
| Mean Family Income | 1,007 | $314,882 |
| Median Household Income | 1,234 | $210,000 |
| Mean Household Income | 1,234 | $282,727 |
| Income Deficit | 1,007 | $0 |
| Wage / Income Gap (%) | 3,360 | 39.58% |
| Wage / Income Gap ($) | 3,360 | 60.42¢ per $1 |
| Gini / Inequality Index | 3,360 | 0.47 |
Earnings by Sex in West Lake Hills
Average Earnings in West Lake Hills are $132,218, $142,158 for men and $85,893 for women, a difference of 39.6%.
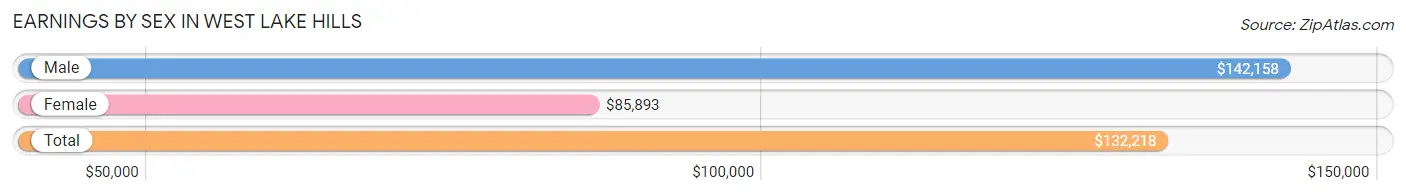
| Sex | Number | Average Earnings |
| Male | 856 (59.2%) | $142,158 |
| Female | 591 (40.8%) | $85,893 |
| Total | 1,447 (100.0%) | $132,218 |
Earnings by Sex by Income Bracket in West Lake Hills
The most common earnings brackets in West Lake Hills are $100,000+ for men (599 | 70.0%) and $100,000+ for women (253 | 42.8%).
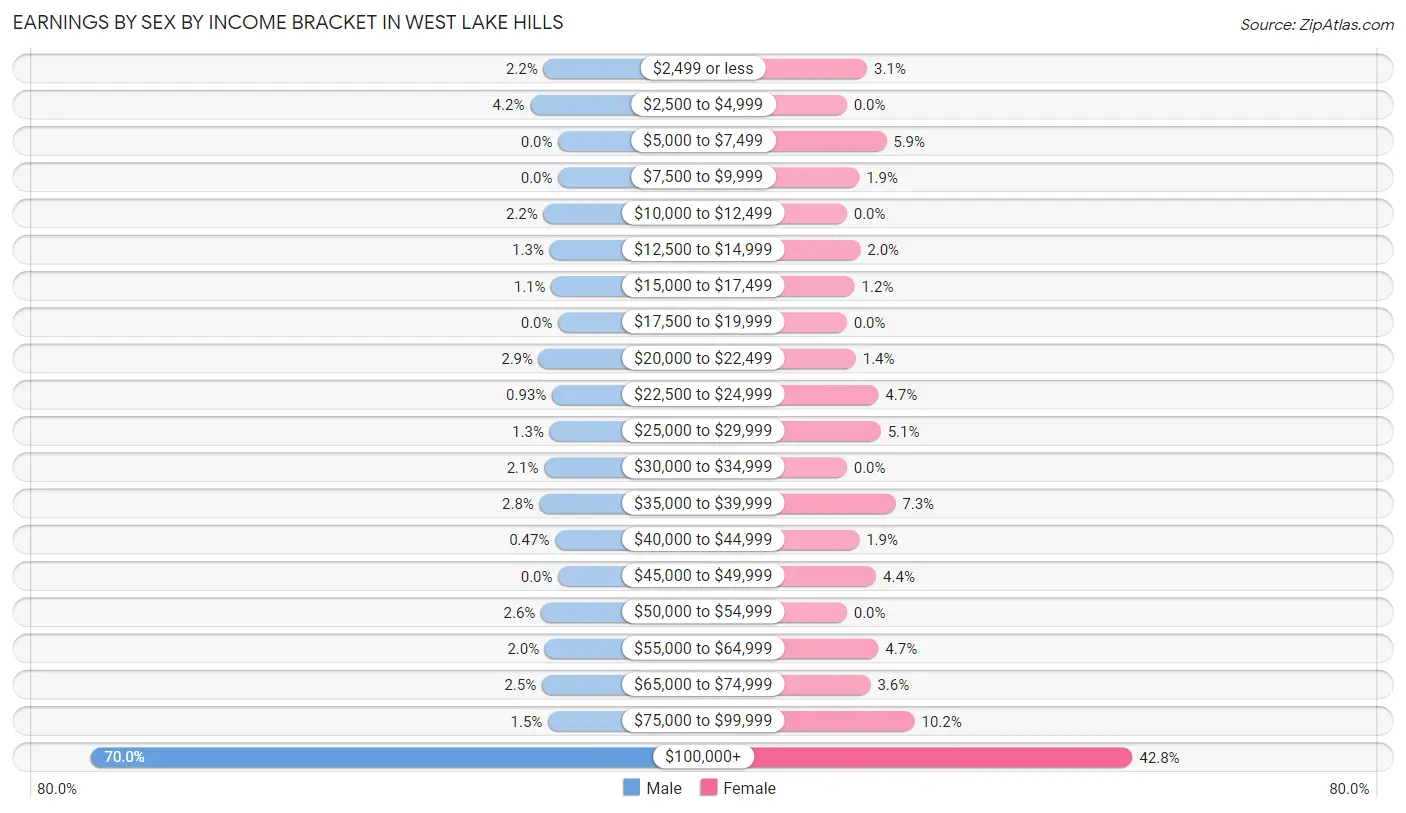
| Income | Male | Female |
| $2,499 or less | 19 (2.2%) | 18 (3.0%) |
| $2,500 to $4,999 | 36 (4.2%) | 0 (0.0%) |
| $5,000 to $7,499 | 0 (0.0%) | 35 (5.9%) |
| $7,500 to $9,999 | 0 (0.0%) | 11 (1.9%) |
| $10,000 to $12,499 | 19 (2.2%) | 0 (0.0%) |
| $12,500 to $14,999 | 11 (1.3%) | 12 (2.0%) |
| $15,000 to $17,499 | 9 (1.1%) | 7 (1.2%) |
| $17,500 to $19,999 | 0 (0.0%) | 0 (0.0%) |
| $20,000 to $22,499 | 25 (2.9%) | 8 (1.3%) |
| $22,500 to $24,999 | 8 (0.9%) | 28 (4.7%) |
| $25,000 to $29,999 | 11 (1.3%) | 30 (5.1%) |
| $30,000 to $34,999 | 18 (2.1%) | 0 (0.0%) |
| $35,000 to $39,999 | 24 (2.8%) | 43 (7.3%) |
| $40,000 to $44,999 | 4 (0.5%) | 11 (1.9%) |
| $45,000 to $49,999 | 0 (0.0%) | 26 (4.4%) |
| $50,000 to $54,999 | 22 (2.6%) | 0 (0.0%) |
| $55,000 to $64,999 | 17 (2.0%) | 28 (4.7%) |
| $65,000 to $74,999 | 21 (2.5%) | 21 (3.5%) |
| $75,000 to $99,999 | 13 (1.5%) | 60 (10.2%) |
| $100,000+ | 599 (70.0%) | 253 (42.8%) |
| Total | 856 (100.0%) | 591 (100.0%) |
Earnings by Sex by Educational Attainment in West Lake Hills
Average earnings in West Lake Hills are $148,611 for men and $88,000 for women, a difference of 40.8%. Men with an educational attainment of college or associate's degree enjoy the highest average annual earnings of $164,408, while those with bachelor's degree education earn the least with $132,056. Women with an educational attainment of graduate degree earn the most with the average annual earnings of $95,893, while those with graduate degree education have the smallest earnings of $95,893.
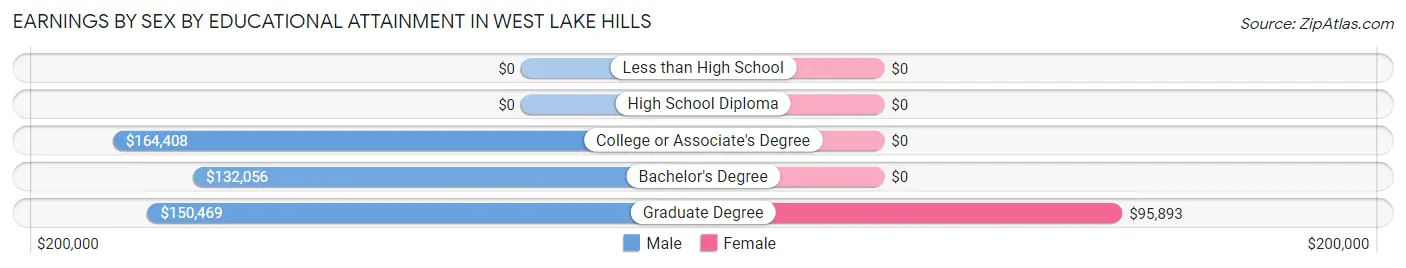
| Educational Attainment | Male Income | Female Income |
| Less than High School | - | - |
| High School Diploma | - | - |
| College or Associate's Degree | $164,408 | $0 |
| Bachelor's Degree | $132,056 | $0 |
| Graduate Degree | $150,469 | $95,893 |
| Total | $148,611 | $88,000 |
Family Income in West Lake Hills
Family Income Brackets in West Lake Hills
According to the West Lake Hills family income data, there are 617 families falling into the $200,000+ income range, which is the most common income bracket and makes up 61.3% of all families.
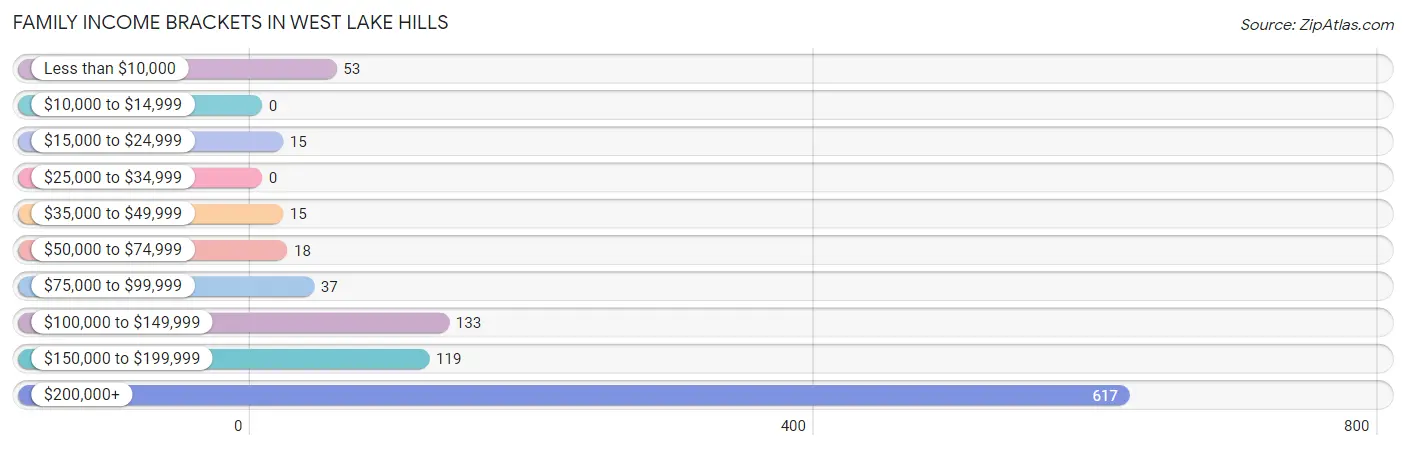
| Income Bracket | # Families | % Families |
| Less than $10,000 | 53 | 5.3% |
| $10,000 to $14,999 | 0 | 0.0% |
| $15,000 to $24,999 | 15 | 1.5% |
| $25,000 to $34,999 | 0 | 0.0% |
| $35,000 to $49,999 | 15 | 1.5% |
| $50,000 to $74,999 | 18 | 1.8% |
| $75,000 to $99,999 | 37 | 3.7% |
| $100,000 to $149,999 | 133 | 13.2% |
| $150,000 to $199,999 | 119 | 11.8% |
| $200,000+ | 617 | 61.3% |
Family Income by Famaliy Size in West Lake Hills
3-person families (172 | 17.1%) account for the highest median family income in West Lake Hills with $250,001 per family, while 2-person families (455 | 45.2%) have the highest median income of $105,625 per family member.
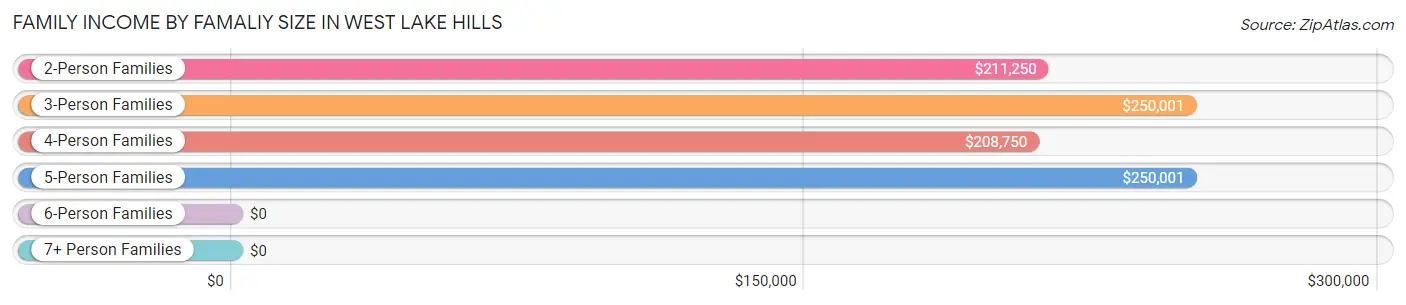
| Income Bracket | # Families | Median Income |
| 2-Person Families | 455 (45.2%) | $211,250 |
| 3-Person Families | 172 (17.1%) | $250,001 |
| 4-Person Families | 302 (30.0%) | $208,750 |
| 5-Person Families | 69 (6.9%) | $250,001 |
| 6-Person Families | 9 (0.9%) | $0 |
| 7+ Person Families | 0 (0.0%) | $0 |
| Total | 1,007 (100.0%) | $231,528 |
Family Income by Number of Earners in West Lake Hills
The median family income in West Lake Hills is $231,528, with families comprising 2 earners (416) having the highest median family income of $250,001, while families with no earners (207) have the lowest median family income of $115,680, accounting for 41.3% and 20.6% of families, respectively.
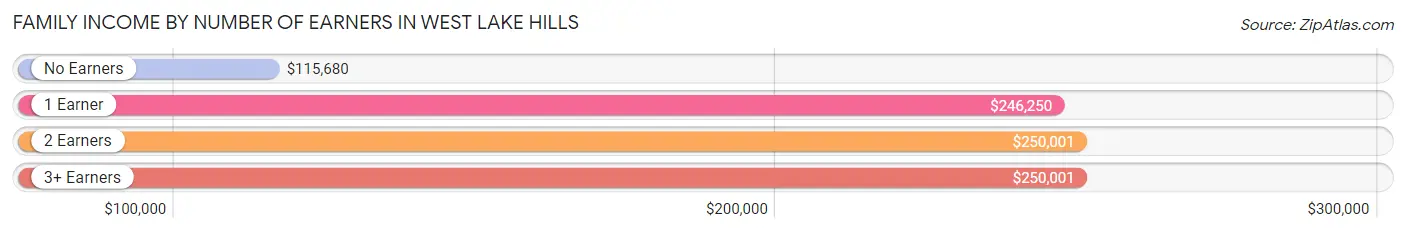
| Number of Earners | # Families | Median Income |
| No Earners | 207 (20.6%) | $115,680 |
| 1 Earner | 358 (35.5%) | $246,250 |
| 2 Earners | 416 (41.3%) | $250,001 |
| 3+ Earners | 26 (2.6%) | $250,001 |
| Total | 1,007 (100.0%) | $231,528 |
Household Income in West Lake Hills
Household Income Brackets in West Lake Hills
With 677 households falling in the category, the $200,000+ income range is the most frequent in West Lake Hills, accounting for 54.9% of all households.
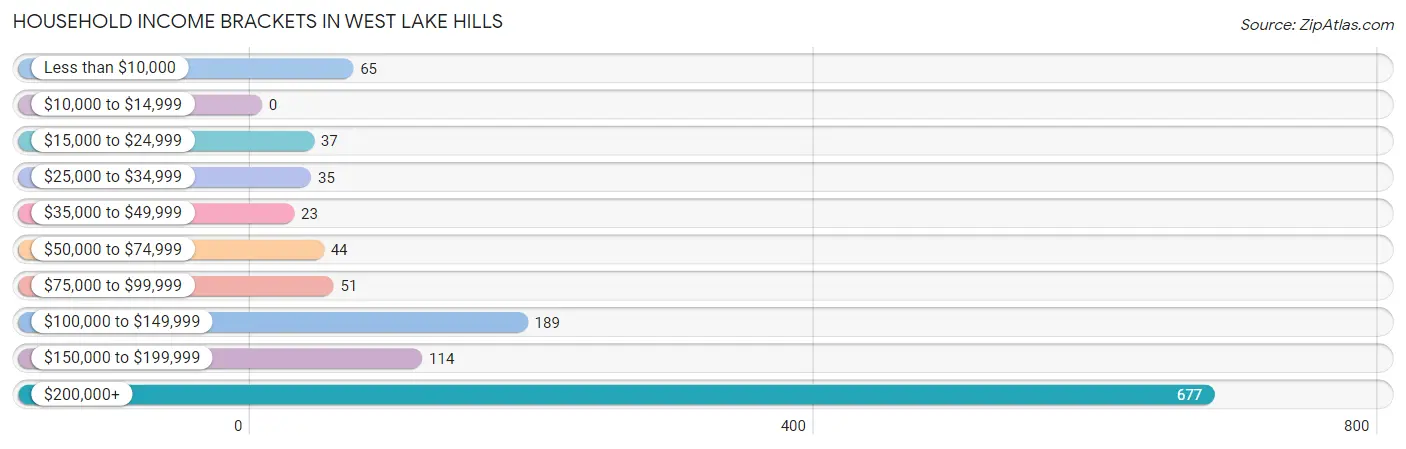
| Income Bracket | # Households | % Households |
| Less than $10,000 | 65 | 5.3% |
| $10,000 to $14,999 | 0 | 0.0% |
| $15,000 to $24,999 | 37 | 3.0% |
| $25,000 to $34,999 | 35 | 2.8% |
| $35,000 to $49,999 | 23 | 1.9% |
| $50,000 to $74,999 | 44 | 3.6% |
| $75,000 to $99,999 | 51 | 4.1% |
| $100,000 to $149,999 | 189 | 15.3% |
| $150,000 to $199,999 | 114 | 9.2% |
| $200,000+ | 677 | 54.9% |
Household Income by Householder Age in West Lake Hills
The median household income in West Lake Hills is $210,000, with the highest median household income of $250,001 found in the 25 to 44 years age bracket for the primary householder. A total of 162 households (13.1%) fall into this category. Meanwhile, the 15 to 24 years age bracket for the primary householder has the lowest median household income of $0, with 8 households (0.6%) in this group.
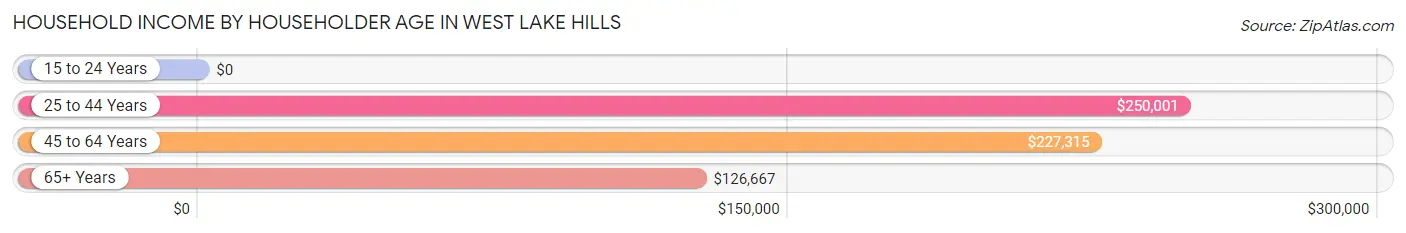
| Income Bracket | # Households | Median Income |
| 15 to 24 Years | 8 (0.6%) | $0 |
| 25 to 44 Years | 162 (13.1%) | $250,001 |
| 45 to 64 Years | 584 (47.3%) | $227,315 |
| 65+ Years | 480 (38.9%) | $126,667 |
| Total | 1,234 (100.0%) | $210,000 |
Poverty in West Lake Hills
Income Below Poverty by Sex and Age in West Lake Hills
With 10.4% poverty level for males and 6.5% for females among the residents of West Lake Hills, 18 to 24 year old males and 12 to 14 year old females are the most vulnerable to poverty, with 63 males (56.2%) and 39 females (37.5%) in their respective age groups living below the poverty level.
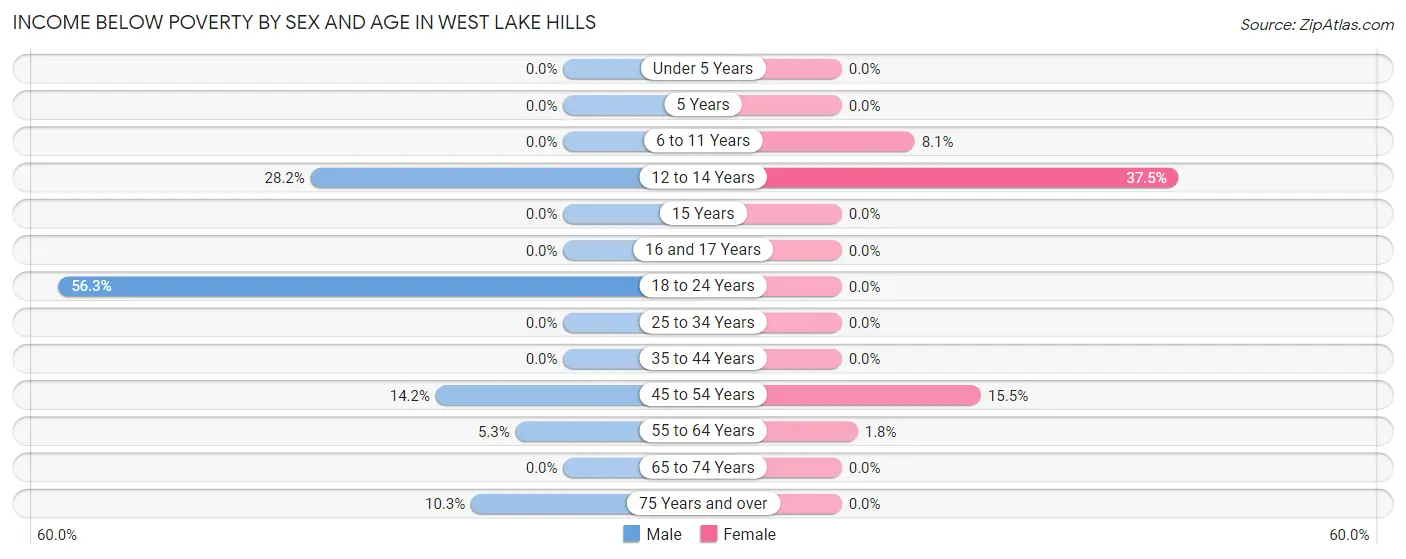
| Age Bracket | Male | Female |
| Under 5 Years | 0 (0.0%) | 0 (0.0%) |
| 5 Years | 0 (0.0%) | 0 (0.0%) |
| 6 to 11 Years | 0 (0.0%) | 16 (8.1%) |
| 12 to 14 Years | 38 (28.1%) | 39 (37.5%) |
| 15 Years | 0 (0.0%) | 0 (0.0%) |
| 16 and 17 Years | 0 (0.0%) | 0 (0.0%) |
| 18 to 24 Years | 63 (56.2%) | 0 (0.0%) |
| 25 to 34 Years | 0 (0.0%) | 0 (0.0%) |
| 35 to 44 Years | 0 (0.0%) | 0 (0.0%) |
| 45 to 54 Years | 27 (14.2%) | 53 (15.5%) |
| 55 to 64 Years | 19 (5.3%) | 5 (1.8%) |
| 65 to 74 Years | 0 (0.0%) | 0 (0.0%) |
| 75 Years and over | 15 (10.3%) | 0 (0.0%) |
| Total | 162 (10.4%) | 113 (6.5%) |
Income Above Poverty by Sex and Age in West Lake Hills
According to the poverty statistics in West Lake Hills, males aged under 5 years and females aged under 5 years are the age groups that are most secure financially, with 100.0% of males and 100.0% of females in these age groups living above the poverty line.
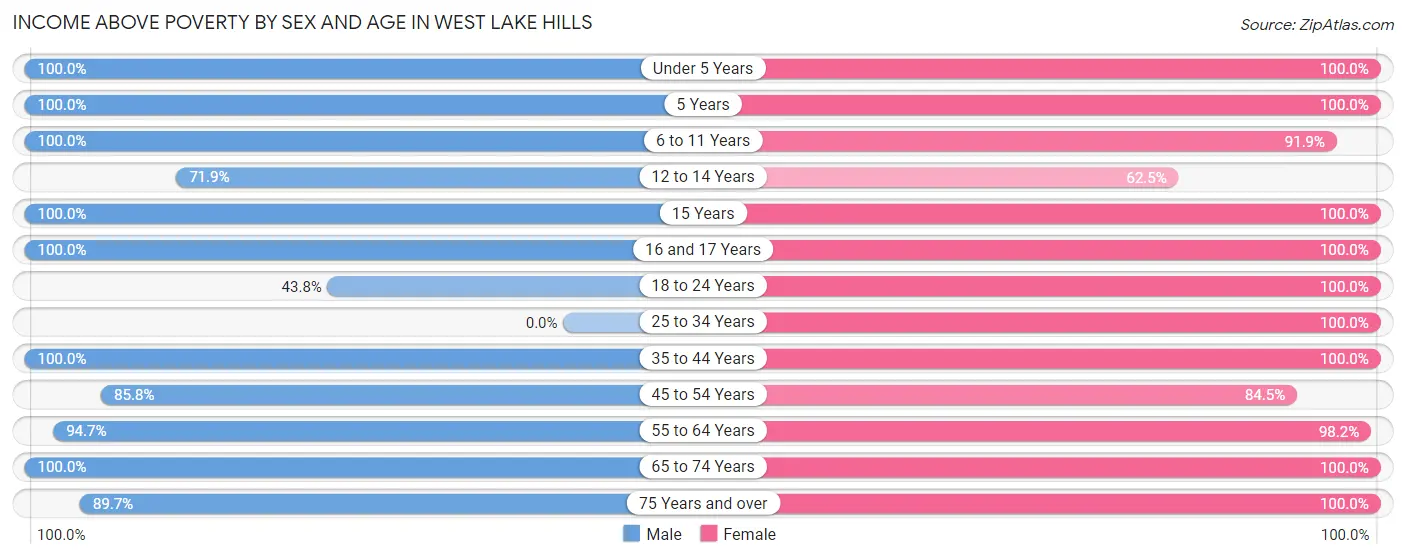
| Age Bracket | Male | Female |
| Under 5 Years | 19 (100.0%) | 37 (100.0%) |
| 5 Years | 9 (100.0%) | 17 (100.0%) |
| 6 to 11 Years | 119 (100.0%) | 181 (91.9%) |
| 12 to 14 Years | 97 (71.9%) | 65 (62.5%) |
| 15 Years | 40 (100.0%) | 7 (100.0%) |
| 16 and 17 Years | 18 (100.0%) | 170 (100.0%) |
| 18 to 24 Years | 49 (43.8%) | 96 (100.0%) |
| 25 to 34 Years | 0 (0.0%) | 16 (100.0%) |
| 35 to 44 Years | 134 (100.0%) | 164 (100.0%) |
| 45 to 54 Years | 163 (85.8%) | 289 (84.5%) |
| 55 to 64 Years | 338 (94.7%) | 276 (98.2%) |
| 65 to 74 Years | 279 (100.0%) | 168 (100.0%) |
| 75 Years and over | 131 (89.7%) | 147 (100.0%) |
| Total | 1,396 (89.6%) | 1,633 (93.5%) |
Income Below Poverty Among Married-Couple Families in West Lake Hills
The poverty statistics for married-couple families in West Lake Hills show that 1.0% or 8 of the total 830 families live below the poverty line. Families with 1 or 2 children have the highest poverty rate of 2.8%, comprising of 8 families. On the other hand, families with no children have the lowest poverty rate of 0.0%, which includes 0 families.
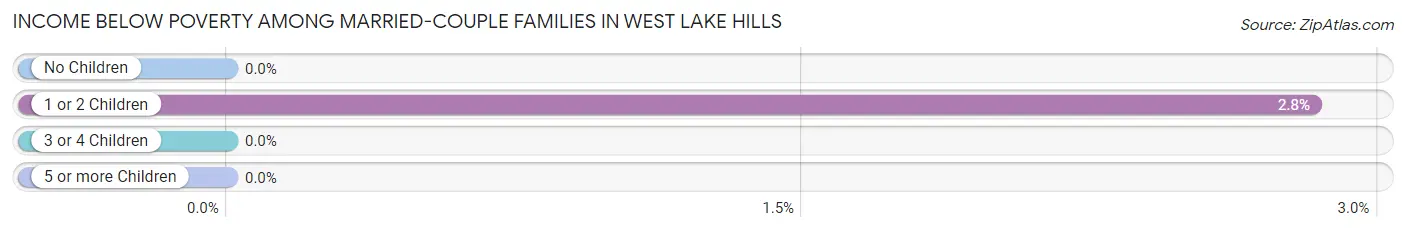
| Children | Above Poverty | Below Poverty |
| No Children | 469 (100.0%) | 0 (0.0%) |
| 1 or 2 Children | 275 (97.2%) | 8 (2.8%) |
| 3 or 4 Children | 78 (100.0%) | 0 (0.0%) |
| 5 or more Children | 0 (0.0%) | 0 (0.0%) |
| Total | 822 (99.0%) | 8 (1.0%) |
Income Below Poverty Among Single-Parent Households in West Lake Hills
According to the poverty data in West Lake Hills, 46.9% or 15 single-father households and 31.0% or 45 single-mother households are living below the poverty line. Among single-father households, those with no children have the highest poverty rate, with 15 households (100.0%) experiencing poverty. Likewise, among single-mother households, those with 1 or 2 children have the highest poverty rate, with 45 households (40.5%) falling below the poverty line.
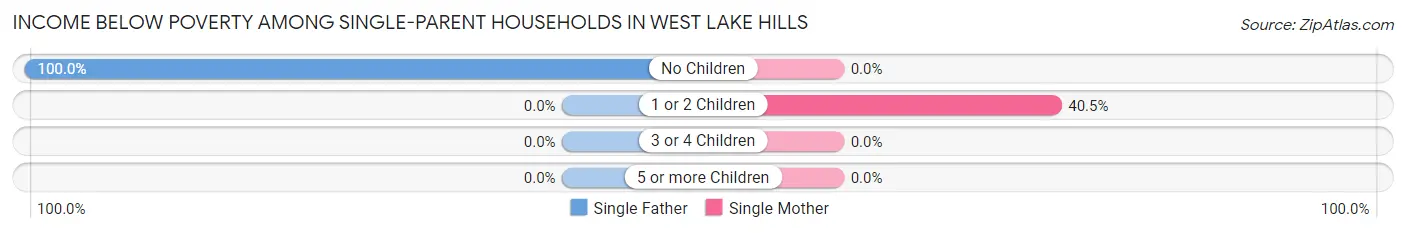
| Children | Single Father | Single Mother |
| No Children | 15 (100.0%) | 0 (0.0%) |
| 1 or 2 Children | 0 (0.0%) | 45 (40.5%) |
| 3 or 4 Children | 0 (0.0%) | 0 (0.0%) |
| 5 or more Children | 0 (0.0%) | 0 (0.0%) |
| Total | 15 (46.9%) | 45 (31.0%) |
Income Below Poverty Among Married-Couple vs Single-Parent Households in West Lake Hills
The poverty data for West Lake Hills shows that 8 of the married-couple family households (1.0%) and 60 of the single-parent households (33.9%) are living below the poverty level. Within the married-couple family households, those with 1 or 2 children have the highest poverty rate, with 8 households (2.8%) falling below the poverty line. Among the single-parent households, those with no children have the highest poverty rate, with 15 household (53.6%) living below poverty.
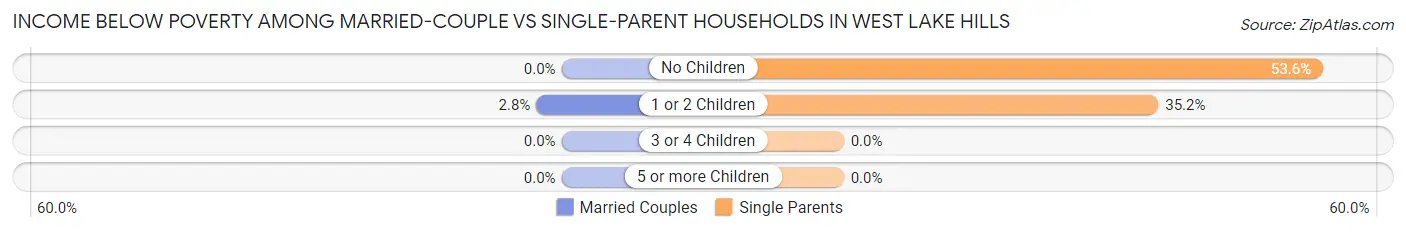
| Children | Married-Couple Families | Single-Parent Households |
| No Children | 0 (0.0%) | 15 (53.6%) |
| 1 or 2 Children | 8 (2.8%) | 45 (35.2%) |
| 3 or 4 Children | 0 (0.0%) | 0 (0.0%) |
| 5 or more Children | 0 (0.0%) | 0 (0.0%) |
| Total | 8 (1.0%) | 60 (33.9%) |
Race in West Lake Hills
The most populous races in West Lake Hills are White / Caucasian (3,130 | 93.1%), Hispanic or Latino (392 | 11.7%), and Asian (126 | 3.7%).
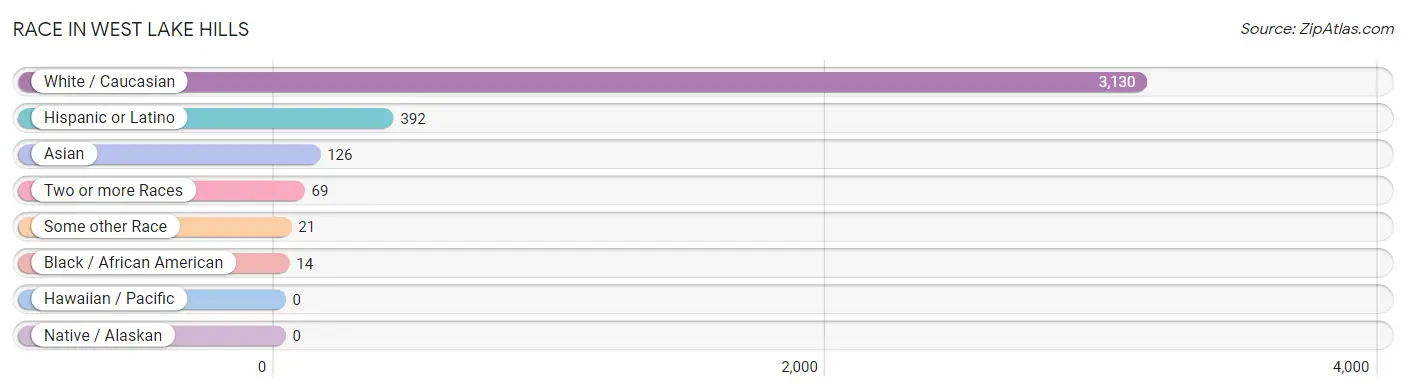
| Race | # Population | % Population |
| Asian | 126 | 3.7% |
| Black / African American | 14 | 0.4% |
| Hawaiian / Pacific | 0 | 0.0% |
| Hispanic or Latino | 392 | 11.7% |
| Native / Alaskan | 0 | 0.0% |
| White / Caucasian | 3,130 | 93.1% |
| Two or more Races | 69 | 2.1% |
| Some other Race | 21 | 0.6% |
| Total | 3,360 | 100.0% |
Ancestry in West Lake Hills
The most populous ancestries reported in West Lake Hills are English (537 | 16.0%), Irish (460 | 13.7%), European (408 | 12.1%), German (375 | 11.2%), and Italian (271 | 8.1%), together accounting for 61.0% of all West Lake Hills residents.
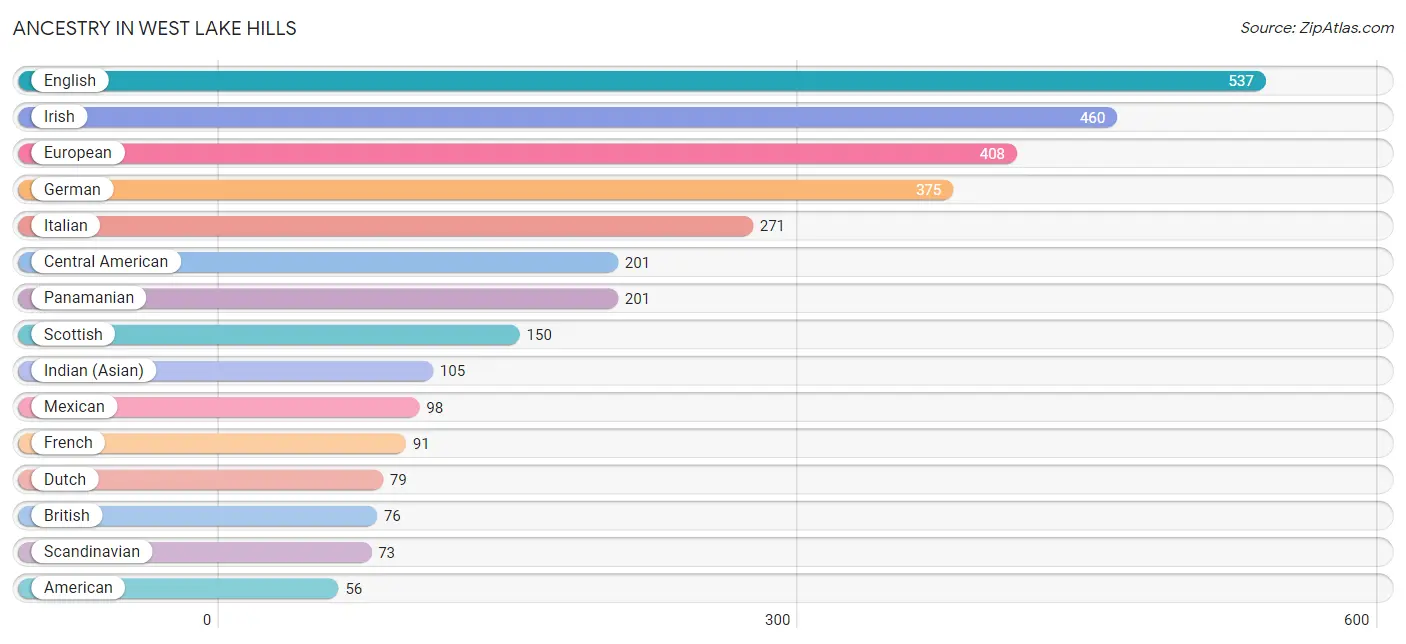
| Ancestry | # Population | % Population |
| American | 56 | 1.7% |
| Arab | 38 | 1.1% |
| British | 76 | 2.3% |
| Burmese | 50 | 1.5% |
| Cajun | 9 | 0.3% |
| Celtic | 15 | 0.4% |
| Central American | 201 | 6.0% |
| Croatian | 9 | 0.3% |
| Czech | 19 | 0.6% |
| Danish | 8 | 0.2% |
| Dutch | 79 | 2.4% |
| Eastern European | 45 | 1.3% |
| English | 537 | 16.0% |
| European | 408 | 12.1% |
| French | 91 | 2.7% |
| French Canadian | 4 | 0.1% |
| German | 375 | 11.2% |
| Greek | 30 | 0.9% |
| Hungarian | 11 | 0.3% |
| Indian (Asian) | 105 | 3.1% |
| Irish | 460 | 13.7% |
| Italian | 271 | 8.1% |
| Lebanese | 9 | 0.3% |
| Lithuanian | 7 | 0.2% |
| Mexican | 98 | 2.9% |
| Northern European | 8 | 0.2% |
| Norwegian | 15 | 0.4% |
| Pakistani | 6 | 0.2% |
| Panamanian | 201 | 6.0% |
| Pennsylvania German | 11 | 0.3% |
| Peruvian | 8 | 0.2% |
| Polish | 36 | 1.1% |
| Puerto Rican | 10 | 0.3% |
| Russian | 27 | 0.8% |
| Scandinavian | 73 | 2.2% |
| Scotch-Irish | 13 | 0.4% |
| Scottish | 150 | 4.5% |
| South American | 17 | 0.5% |
| Spaniard | 44 | 1.3% |
| Spanish | 21 | 0.6% |
| Swedish | 8 | 0.2% |
| Swiss | 16 | 0.5% |
| Thai | 16 | 0.5% |
| Turkish | 13 | 0.4% |
| Ukrainian | 24 | 0.7% |
| Venezuelan | 9 | 0.3% | View All 46 Rows |
Immigrants in West Lake Hills
The most numerous immigrant groups reported in West Lake Hills came from Europe (125 | 3.7%), Italy (77 | 2.3%), Southern Europe (77 | 2.3%), Asia (50 | 1.5%), and Western Europe (39 | 1.2%), together accounting for 11.0% of all West Lake Hills residents.
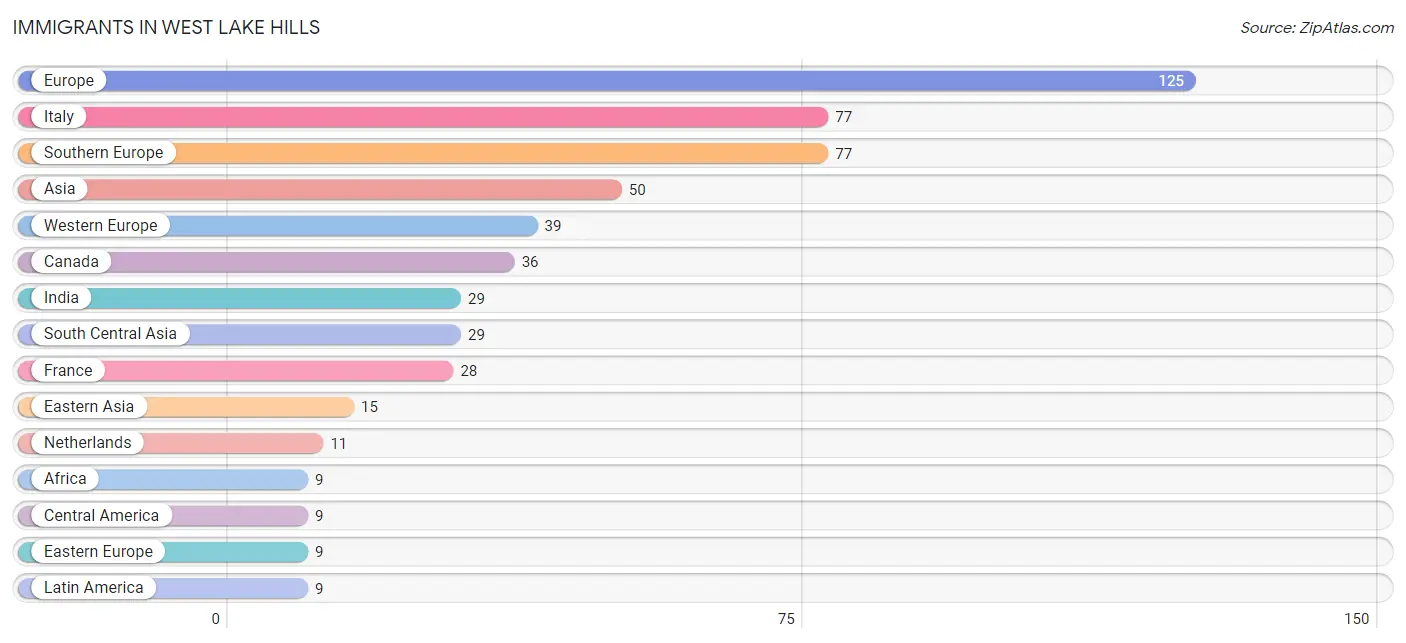
| Immigration Origin | # Population | % Population |
| Africa | 9 | 0.3% |
| Asia | 50 | 1.5% |
| Canada | 36 | 1.1% |
| Central America | 9 | 0.3% |
| China | 7 | 0.2% |
| Eastern Asia | 15 | 0.4% |
| Eastern Europe | 9 | 0.3% |
| Europe | 125 | 3.7% |
| France | 28 | 0.8% |
| Hong Kong | 7 | 0.2% |
| India | 29 | 0.9% |
| Italy | 77 | 2.3% |
| Korea | 8 | 0.2% |
| Latin America | 9 | 0.3% |
| Mexico | 9 | 0.3% |
| Morocco | 9 | 0.3% |
| Netherlands | 11 | 0.3% |
| Northern Africa | 9 | 0.3% |
| South Central Asia | 29 | 0.9% |
| South Eastern Asia | 6 | 0.2% |
| Southern Europe | 77 | 2.3% |
| Thailand | 6 | 0.2% |
| Western Europe | 39 | 1.2% | View All 23 Rows |
Sex and Age in West Lake Hills
Sex and Age in West Lake Hills
The most populous age groups in West Lake Hills are 70 to 74 Years (220 | 13.8%) for men and 15 to 19 Years (245 | 13.9%) for women.
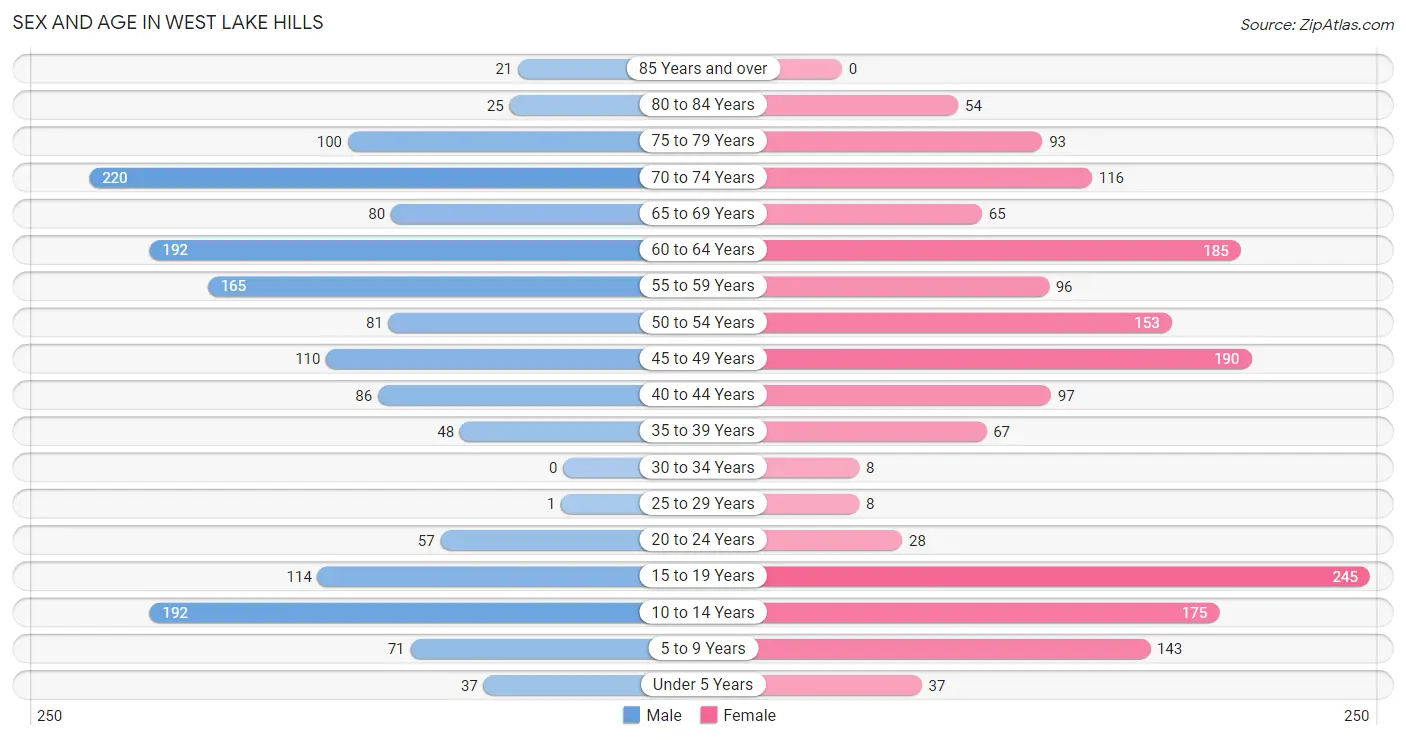
| Age Bracket | Male | Female |
| Under 5 Years | 37 (2.3%) | 37 (2.1%) |
| 5 to 9 Years | 71 (4.4%) | 143 (8.1%) |
| 10 to 14 Years | 192 (12.0%) | 175 (9.9%) |
| 15 to 19 Years | 114 (7.1%) | 245 (13.9%) |
| 20 to 24 Years | 57 (3.6%) | 28 (1.6%) |
| 25 to 29 Years | 1 (0.1%) | 8 (0.4%) |
| 30 to 34 Years | 0 (0.0%) | 8 (0.4%) |
| 35 to 39 Years | 48 (3.0%) | 67 (3.8%) |
| 40 to 44 Years | 86 (5.4%) | 97 (5.5%) |
| 45 to 49 Years | 110 (6.9%) | 190 (10.8%) |
| 50 to 54 Years | 81 (5.1%) | 153 (8.7%) |
| 55 to 59 Years | 165 (10.3%) | 96 (5.4%) |
| 60 to 64 Years | 192 (12.0%) | 185 (10.5%) |
| 65 to 69 Years | 80 (5.0%) | 65 (3.7%) |
| 70 to 74 Years | 220 (13.8%) | 116 (6.6%) |
| 75 to 79 Years | 100 (6.2%) | 93 (5.3%) |
| 80 to 84 Years | 25 (1.6%) | 54 (3.1%) |
| 85 Years and over | 21 (1.3%) | 0 (0.0%) |
| Total | 1,600 (100.0%) | 1,760 (100.0%) |
Families and Households in West Lake Hills
Median Family Size in West Lake Hills
The median family size in West Lake Hills is 2.98 persons per family, with married-couple families (830 | 82.4%) accounting for the largest median family size of 3.01 persons per family. On the other hand, single male/father families (32 | 3.2%) represent the smallest median family size with 2.63 persons per family.
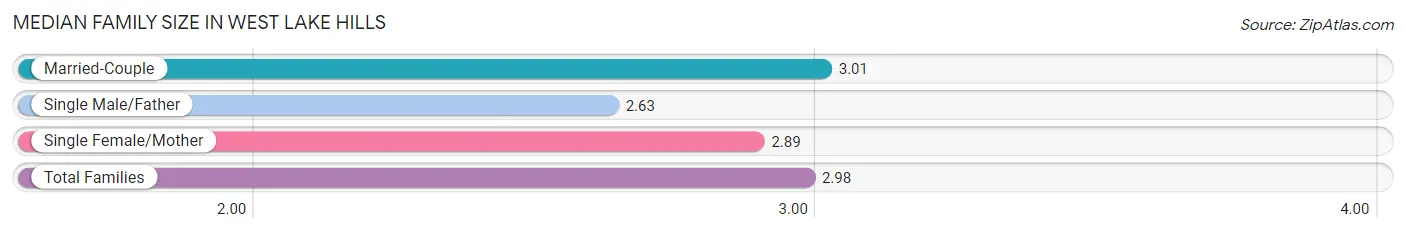
| Family Type | # Families | Family Size |
| Married-Couple | 830 (82.4%) | 3.01 |
| Single Male/Father | 32 (3.2%) | 2.63 |
| Single Female/Mother | 145 (14.4%) | 2.89 |
| Total Families | 1,007 (100.0%) | 2.98 |
Median Household Size in West Lake Hills
The median household size in West Lake Hills is 2.68 persons per household, with married-couple households (830 | 67.3%) accounting for the largest median household size of 3.04 persons per household. non-family households (227 | 18.4%) represent the smallest median household size with 1.20 persons per household.
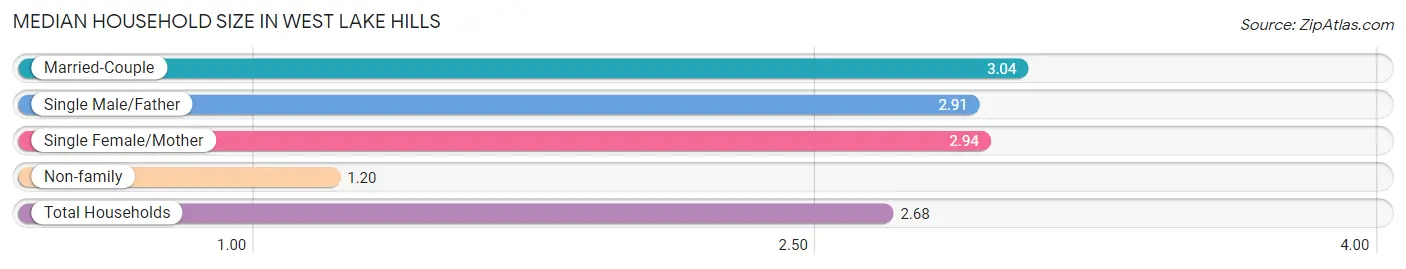
| Household Type | # Households | Household Size |
| Married-Couple | 830 (67.3%) | 3.04 |
| Single Male/Father | 32 (2.6%) | 2.91 |
| Single Female/Mother | 145 (11.7%) | 2.94 |
| Non-family | 227 (18.4%) | 1.20 |
| Total Households | 1,234 (100.0%) | 2.68 |
Household Size by Marriage Status in West Lake Hills
Out of a total of 1,234 households in West Lake Hills, 1,007 (81.6%) are family households, while 227 (18.4%) are nonfamily households. The most numerous type of family households are 2-person households, comprising 440, and the most common type of nonfamily households are 1-person households, comprising 183.
| Household Size | Family Households | Nonfamily Households |
| 1-Person Households | - | 183 (14.8%) |
| 2-Person Households | 440 (35.7%) | 44 (3.6%) |
| 3-Person Households | 187 (15.1%) | 0 (0.0%) |
| 4-Person Households | 282 (22.9%) | 0 (0.0%) |
| 5-Person Households | 89 (7.2%) | 0 (0.0%) |
| 6-Person Households | 9 (0.7%) | 0 (0.0%) |
| 7+ Person Households | 0 (0.0%) | 0 (0.0%) |
| Total | 1,007 (81.6%) | 227 (18.4%) |
Female Fertility in West Lake Hills
Fertility by Age in West Lake Hills
Average fertility rate in West Lake Hills is 17.0 births per 1,000 women. Women in the age bracket of 35 to 50 years have the highest fertility rate with 29.0 births per 1,000 women. Women in the age bracket of 35 to 50 years acount for 100.0% of all women with births.
| Age Bracket | Women with Births | Births / 1,000 Women |
| 15 to 19 years | 0 (0.0%) | 0.0 |
| 20 to 34 years | 0 (0.0%) | 0.0 |
| 35 to 50 years | 11 (100.0%) | 29.0 |
| Total | 11 (100.0%) | 17.0 |
Fertility by Age by Marriage Status in West Lake Hills
| Age Bracket | Married | Unmarried |
| 15 to 19 years | 0 (0.0%) | 0 (0.0%) |
| 20 to 34 years | 0 (0.0%) | 0 (0.0%) |
| 35 to 50 years | 11 (100.0%) | 0 (0.0%) |
| Total | 11 (100.0%) | 0 (0.0%) |
Fertility by Education in West Lake Hills
| Educational Attainment | Women with Births | Births / 1,000 Women |
| Less than High School | 0 (0.0%) | 0.0 |
| High School Diploma | 0 (0.0%) | 0.0 |
| College or Associate's Degree | 0 (0.0%) | 0.0 |
| Bachelor's Degree | 11 (100.0%) | 55.0 |
| Graduate Degree | 0 (0.0%) | 0.0 |
| Total | 11 (100.0%) | 17.0 |
Fertility by Education by Marriage Status in West Lake Hills
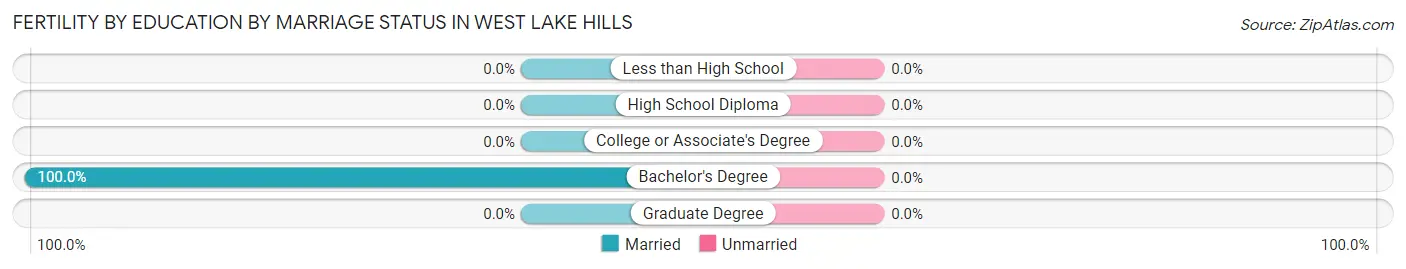
| Educational Attainment | Married | Unmarried |
| Less than High School | 0 (0.0%) | 0 (0.0%) |
| High School Diploma | 0 (0.0%) | 0 (0.0%) |
| College or Associate's Degree | 0 (0.0%) | 0 (0.0%) |
| Bachelor's Degree | 11 (100.0%) | 0 (0.0%) |
| Graduate Degree | 0 (0.0%) | 0 (0.0%) |
| Total | 11 (100.0%) | 0 (0.0%) |
Employment Characteristics in West Lake Hills
Employment by Class of Employer in West Lake Hills
Among the 1,268 employed individuals in West Lake Hills, private company employees (660 | 52.0%), self-employed (incorporated) (161 | 12.7%), and self-employed (not incorporated) (136 | 10.7%) make up the most common classes of employment.
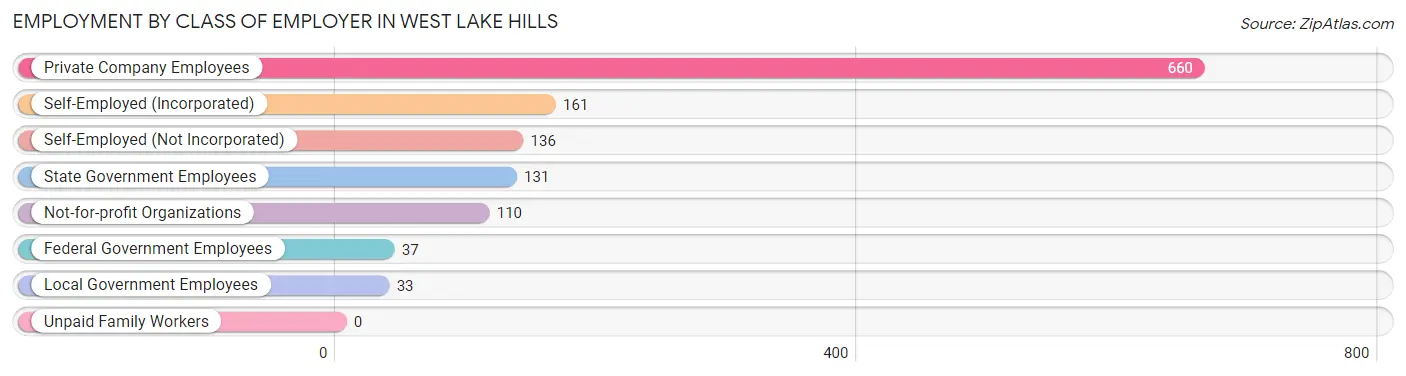
| Employer Class | # Employees | % Employees |
| Private Company Employees | 660 | 52.0% |
| Self-Employed (Incorporated) | 161 | 12.7% |
| Self-Employed (Not Incorporated) | 136 | 10.7% |
| Not-for-profit Organizations | 110 | 8.7% |
| Local Government Employees | 33 | 2.6% |
| State Government Employees | 131 | 10.3% |
| Federal Government Employees | 37 | 2.9% |
| Unpaid Family Workers | 0 | 0.0% |
| Total | 1,268 | 100.0% |
Employment Status by Age in West Lake Hills
According to the labor force statistics for West Lake Hills, out of the total population over 16 years of age (2,658), 51.4% or 1,366 individuals are in the labor force, with 4.5% or 61 of them unemployed. The age group with the highest labor force participation rate is 30 to 34 years, with 100.0% or 8 individuals in the labor force. Within the labor force, the 25 to 29 years age range has the highest percentage of unemployed individuals, with 100.0% or 8 of them being unemployed.
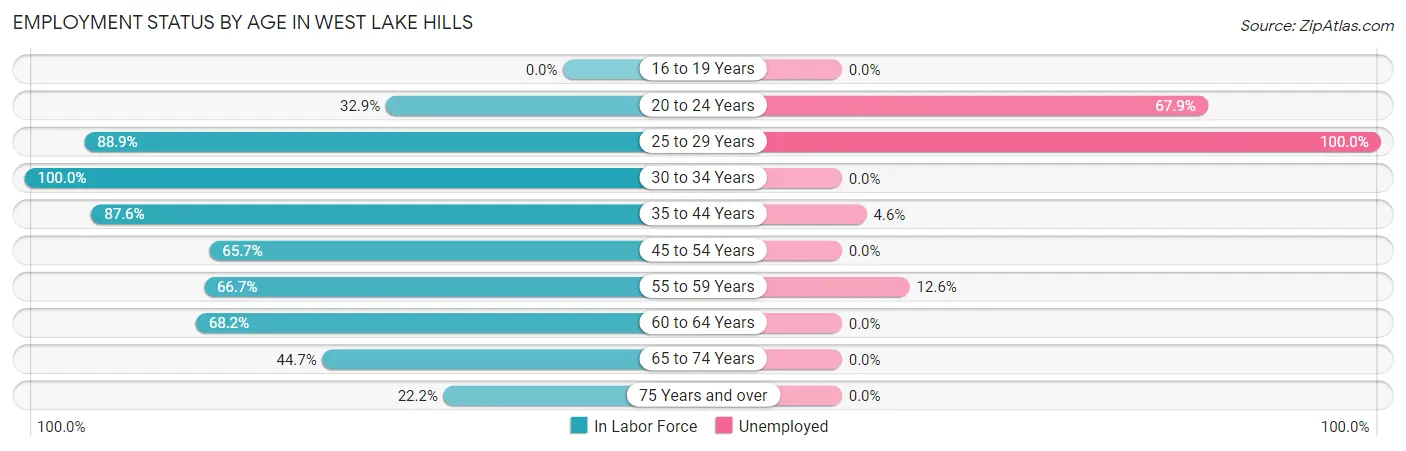
| Age Bracket | In Labor Force | Unemployed |
| 16 to 19 Years | 0 (0.0%) | 0 (0.0%) |
| 20 to 24 Years | 28 (32.9%) | 19 (67.9%) |
| 25 to 29 Years | 8 (88.9%) | 8 (100.0%) |
| 30 to 34 Years | 8 (100.0%) | 0 (0.0%) |
| 35 to 44 Years | 261 (87.6%) | 12 (4.6%) |
| 45 to 54 Years | 351 (65.7%) | 0 (0.0%) |
| 55 to 59 Years | 174 (66.7%) | 22 (12.6%) |
| 60 to 64 Years | 257 (68.2%) | 0 (0.0%) |
| 65 to 74 Years | 215 (44.7%) | 0 (0.0%) |
| 75 Years and over | 65 (22.2%) | 0 (0.0%) |
| Total | 1,366 (51.4%) | 61 (4.5%) |
Employment Status by Educational Attainment in West Lake Hills
According to labor force statistics for West Lake Hills, 71.2% of individuals (1,059) out of the total population between 25 and 64 years of age (1,487) are in the labor force, with 4.0% or 42 of them being unemployed. The group with the highest labor force participation rate are those with the educational attainment of bachelor's degree or higher, with 75.2% or 886 individuals in the labor force. Within the labor force, individuals with bachelor's degree or higher education have the highest percentage of unemployment, with 4.7% or 42 of them being unemployed.
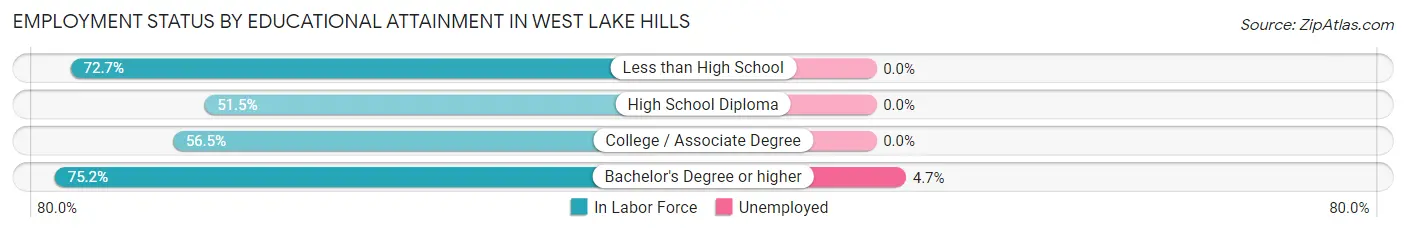
| Educational Attainment | In Labor Force | Unemployed |
| Less than High School | 8 (72.7%) | 0 (0.0%) |
| High School Diploma | 35 (51.5%) | 0 (0.0%) |
| College / Associate Degree | 130 (56.5%) | 0 (0.0%) |
| Bachelor's Degree or higher | 886 (75.2%) | 55 (4.7%) |
| Total | 1,059 (71.2%) | 59 (4.0%) |
Employment Occupations by Sex in West Lake Hills
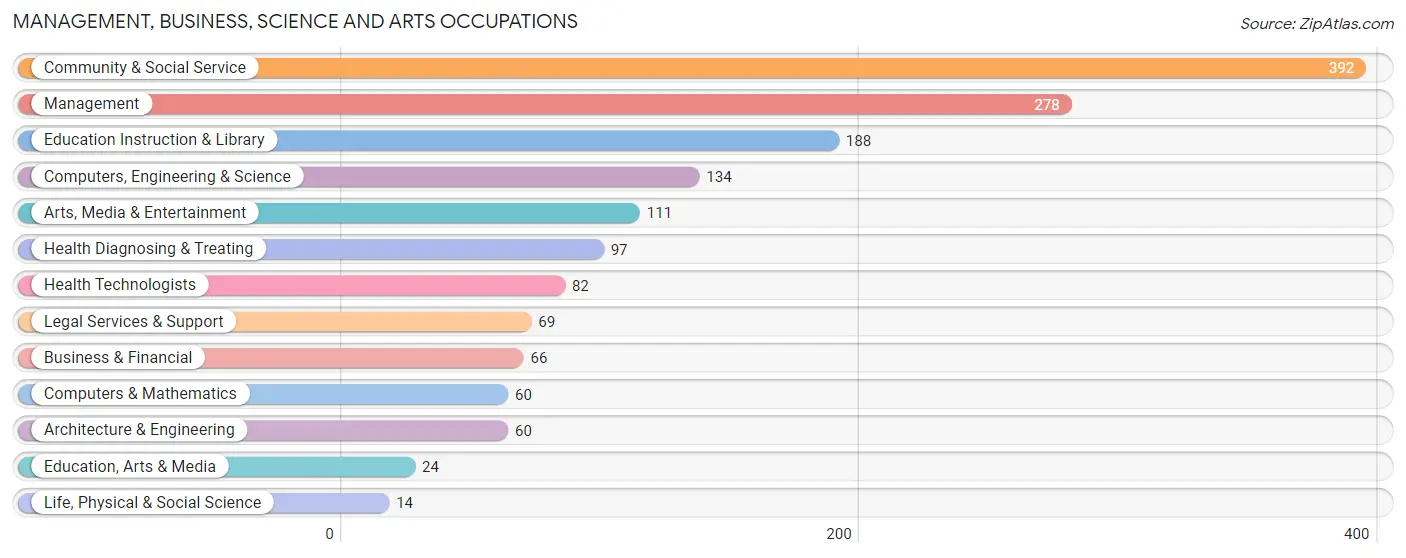
Management, Business, Science and Arts Occupations
The most common Management, Business, Science and Arts occupations in West Lake Hills are Community & Social Service (392 | 30.0%), Management (278 | 21.3%), Education Instruction & Library (188 | 14.4%), Computers, Engineering & Science (134 | 10.3%), and Arts, Media & Entertainment (111 | 8.5%).
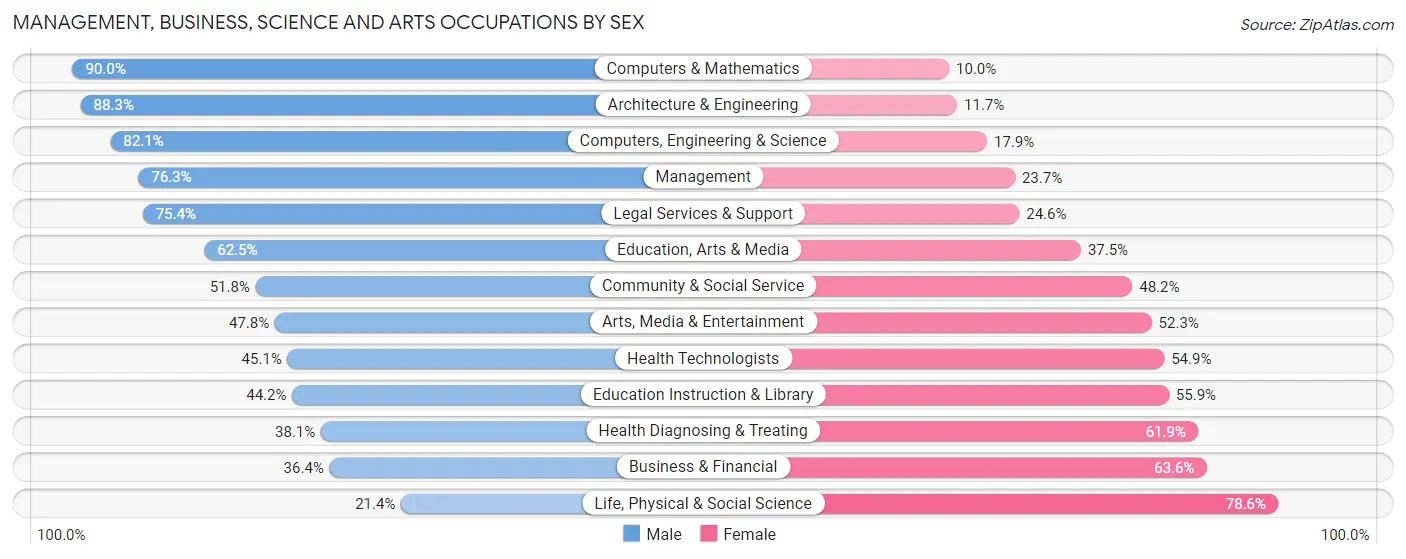
Management, Business, Science and Arts Occupations by Sex
Within the Management, Business, Science and Arts occupations in West Lake Hills, the most male-oriented occupations are Computers & Mathematics (90.0%), Architecture & Engineering (88.3%), and Computers, Engineering & Science (82.1%), while the most female-oriented occupations are Life, Physical & Social Science (78.6%), Business & Financial (63.6%), and Health Diagnosing & Treating (61.9%).
| Occupation | Male | Female |
| Management | 212 (76.3%) | 66 (23.7%) |
| Business & Financial | 24 (36.4%) | 42 (63.6%) |
| Computers, Engineering & Science | 110 (82.1%) | 24 (17.9%) |
| Computers & Mathematics | 54 (90.0%) | 6 (10.0%) |
| Architecture & Engineering | 53 (88.3%) | 7 (11.7%) |
| Life, Physical & Social Science | 3 (21.4%) | 11 (78.6%) |
| Community & Social Service | 203 (51.8%) | 189 (48.2%) |
| Education, Arts & Media | 15 (62.5%) | 9 (37.5%) |
| Legal Services & Support | 52 (75.4%) | 17 (24.6%) |
| Education Instruction & Library | 83 (44.2%) | 105 (55.8%) |
| Arts, Media & Entertainment | 53 (47.7%) | 58 (52.2%) |
| Health Diagnosing & Treating | 37 (38.1%) | 60 (61.9%) |
| Health Technologists | 37 (45.1%) | 45 (54.9%) |
| Total (Category) | 586 (60.6%) | 381 (39.4%) |
| Total (Overall) | 788 (60.3%) | 518 (39.7%) |
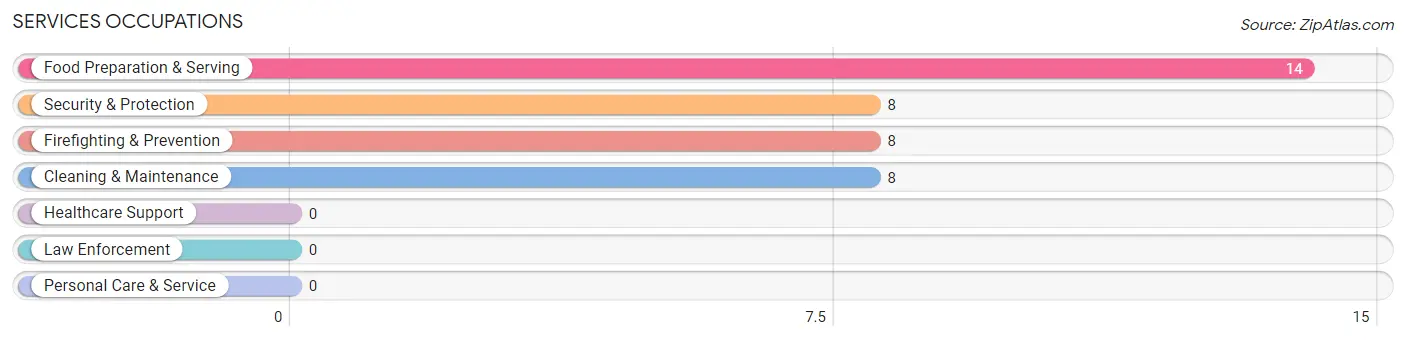
Services Occupations
The most common Services occupations in West Lake Hills are Food Preparation & Serving (14 | 1.1%), Security & Protection (8 | 0.6%), Firefighting & Prevention (8 | 0.6%), and Cleaning & Maintenance (8 | 0.6%).
Services Occupations by Sex
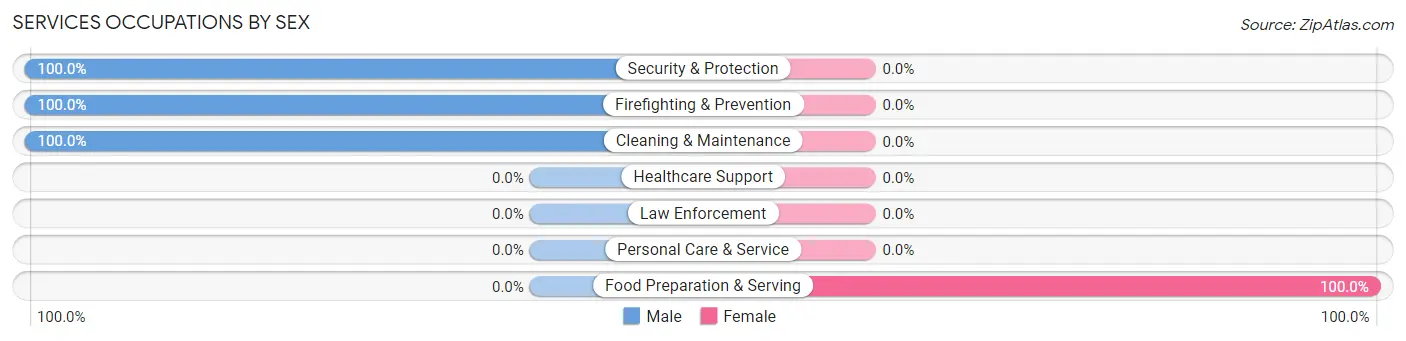
| Occupation | Male | Female |
| Healthcare Support | 0 (0.0%) | 0 (0.0%) |
| Security & Protection | 8 (100.0%) | 0 (0.0%) |
| Firefighting & Prevention | 8 (100.0%) | 0 (0.0%) |
| Law Enforcement | 0 (0.0%) | 0 (0.0%) |
| Food Preparation & Serving | 0 (0.0%) | 14 (100.0%) |
| Cleaning & Maintenance | 8 (100.0%) | 0 (0.0%) |
| Personal Care & Service | 0 (0.0%) | 0 (0.0%) |
| Total (Category) | 16 (53.3%) | 14 (46.7%) |
| Total (Overall) | 788 (60.3%) | 518 (39.7%) |
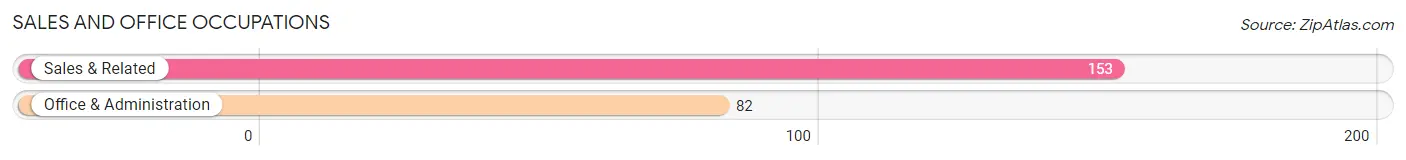
Sales and Office Occupations
The most common Sales and Office occupations in West Lake Hills are Sales & Related (153 | 11.7%), and Office & Administration (82 | 6.3%).
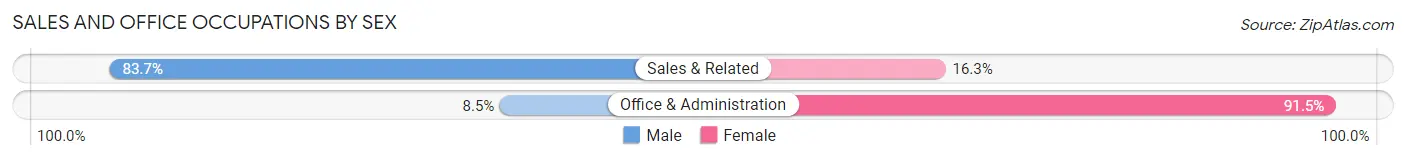
Sales and Office Occupations by Sex
| Occupation | Male | Female |
| Sales & Related | 128 (83.7%) | 25 (16.3%) |
| Office & Administration | 7 (8.5%) | 75 (91.5%) |
| Total (Category) | 135 (57.5%) | 100 (42.5%) |
| Total (Overall) | 788 (60.3%) | 518 (39.7%) |
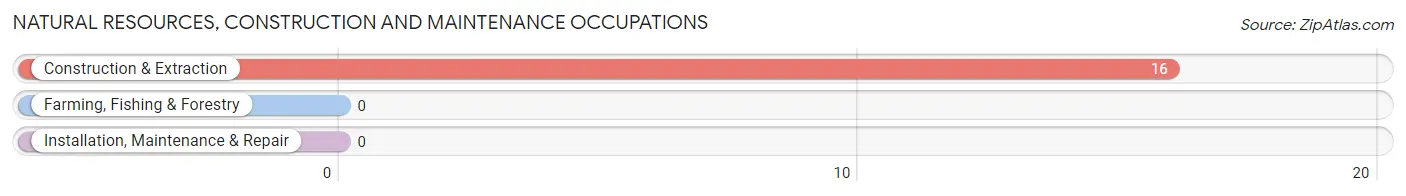
Natural Resources, Construction and Maintenance Occupations
The most common Natural Resources, Construction and Maintenance occupations in West Lake Hills are , and Construction & Extraction (16 | 1.2%).
Natural Resources, Construction and Maintenance Occupations by Sex
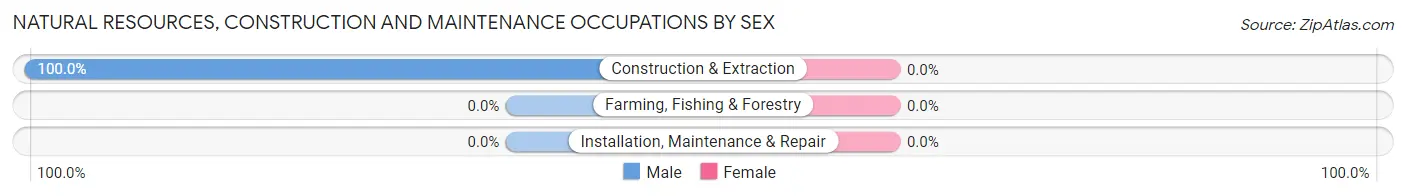
| Occupation | Male | Female |
| Farming, Fishing & Forestry | 0 (0.0%) | 0 (0.0%) |
| Construction & Extraction | 16 (100.0%) | 0 (0.0%) |
| Installation, Maintenance & Repair | 0 (0.0%) | 0 (0.0%) |
| Total (Category) | 16 (100.0%) | 0 (0.0%) |
| Total (Overall) | 788 (60.3%) | 518 (39.7%) |
Production, Transportation and Moving Occupations
The most common Production, Transportation and Moving occupations in West Lake Hills are Transportation (45 | 3.5%), and Production (13 | 1.0%).
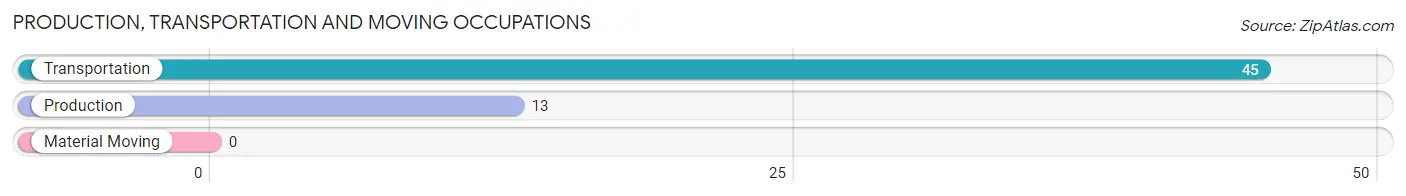
Production, Transportation and Moving Occupations by Sex
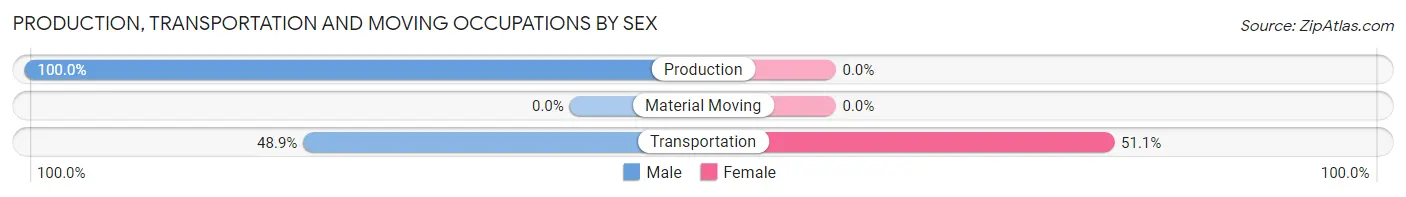
| Occupation | Male | Female |
| Production | 13 (100.0%) | 0 (0.0%) |
| Transportation | 22 (48.9%) | 23 (51.1%) |
| Material Moving | 0 (0.0%) | 0 (0.0%) |
| Total (Category) | 35 (60.3%) | 23 (39.7%) |
| Total (Overall) | 788 (60.3%) | 518 (39.7%) |
Employment Industries by Sex in West Lake Hills
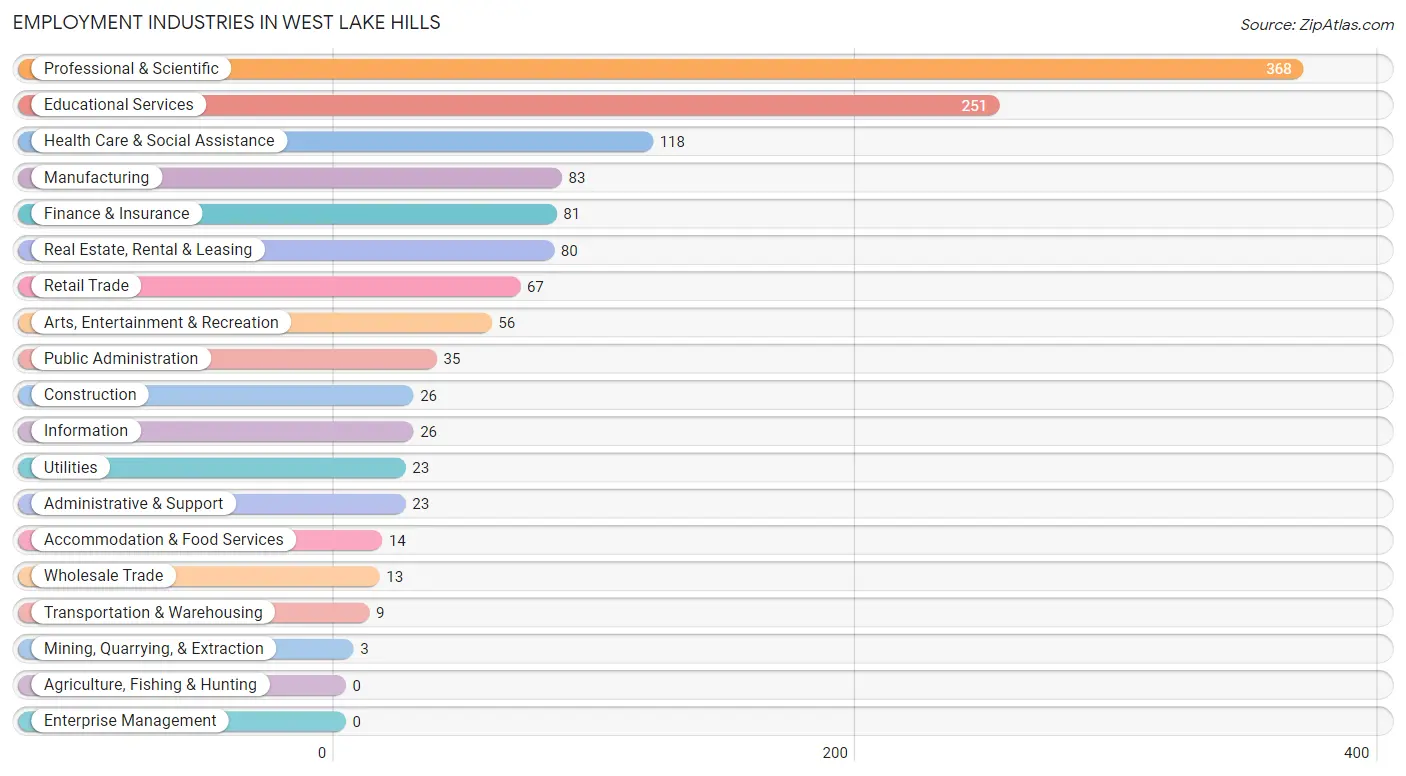
Employment Industries in West Lake Hills
The major employment industries in West Lake Hills include Professional & Scientific (368 | 28.2%), Educational Services (251 | 19.2%), Health Care & Social Assistance (118 | 9.0%), Manufacturing (83 | 6.4%), and Finance & Insurance (81 | 6.2%).
Employment Industries by Sex in West Lake Hills
The West Lake Hills industries that see more men than women are Mining, Quarrying, & Extraction (100.0%), Construction (100.0%), and Wholesale Trade (100.0%), whereas the industries that tend to have a higher number of women are Information (100.0%), Accommodation & Food Services (100.0%), and Arts, Entertainment & Recreation (66.1%).
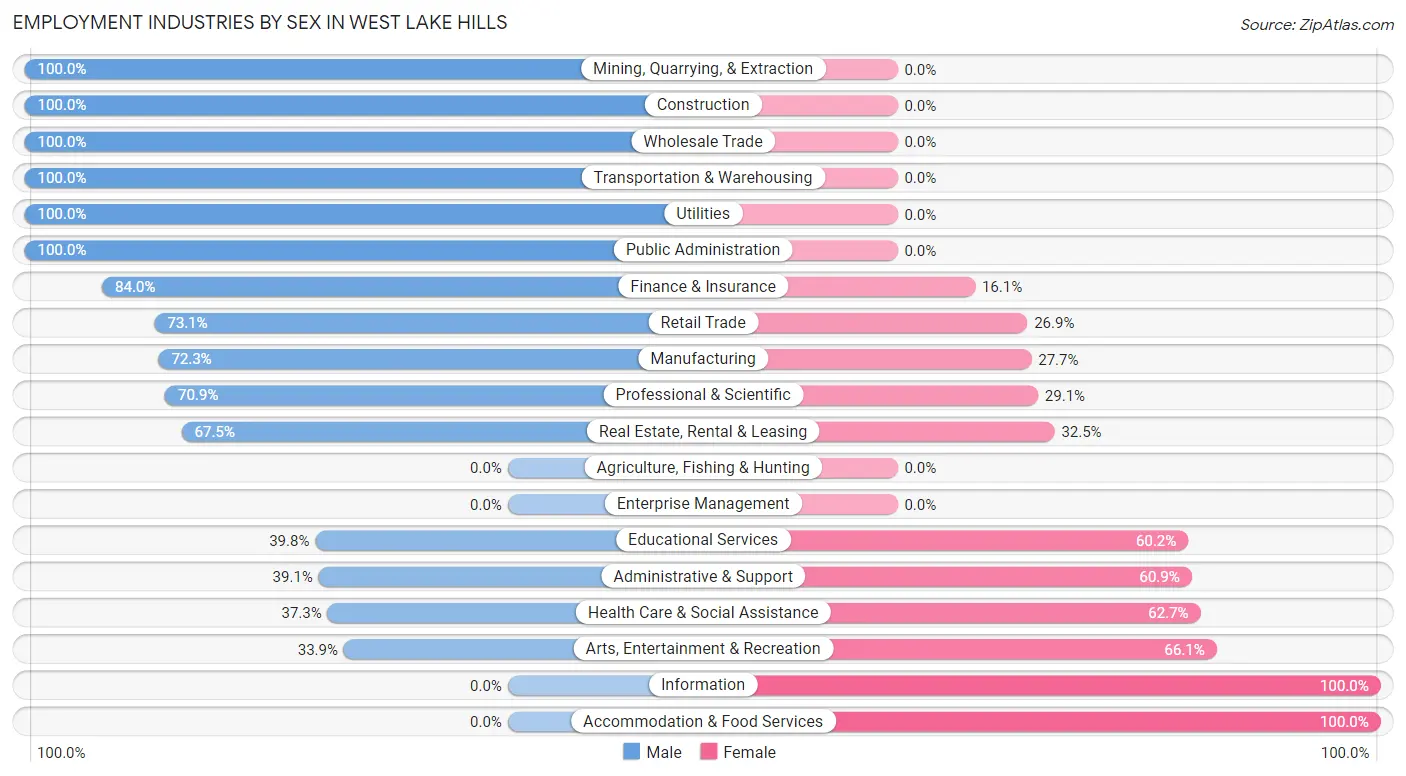
| Industry | Male | Female |
| Agriculture, Fishing & Hunting | 0 (0.0%) | 0 (0.0%) |
| Mining, Quarrying, & Extraction | 3 (100.0%) | 0 (0.0%) |
| Construction | 26 (100.0%) | 0 (0.0%) |
| Manufacturing | 60 (72.3%) | 23 (27.7%) |
| Wholesale Trade | 13 (100.0%) | 0 (0.0%) |
| Retail Trade | 49 (73.1%) | 18 (26.9%) |
| Transportation & Warehousing | 9 (100.0%) | 0 (0.0%) |
| Utilities | 23 (100.0%) | 0 (0.0%) |
| Information | 0 (0.0%) | 26 (100.0%) |
| Finance & Insurance | 68 (84.0%) | 13 (16.1%) |
| Real Estate, Rental & Leasing | 54 (67.5%) | 26 (32.5%) |
| Professional & Scientific | 261 (70.9%) | 107 (29.1%) |
| Enterprise Management | 0 (0.0%) | 0 (0.0%) |
| Administrative & Support | 9 (39.1%) | 14 (60.9%) |
| Educational Services | 100 (39.8%) | 151 (60.2%) |
| Health Care & Social Assistance | 44 (37.3%) | 74 (62.7%) |
| Arts, Entertainment & Recreation | 19 (33.9%) | 37 (66.1%) |
| Accommodation & Food Services | 0 (0.0%) | 14 (100.0%) |
| Public Administration | 35 (100.0%) | 0 (0.0%) |
| Total | 788 (60.3%) | 518 (39.7%) |
Education in West Lake Hills
School Enrollment in West Lake Hills
The most common levels of schooling among the 1,004 students in West Lake Hills are high school (300 | 29.9%), middle school (261 | 26.0%), and elementary school (187 | 18.6%).
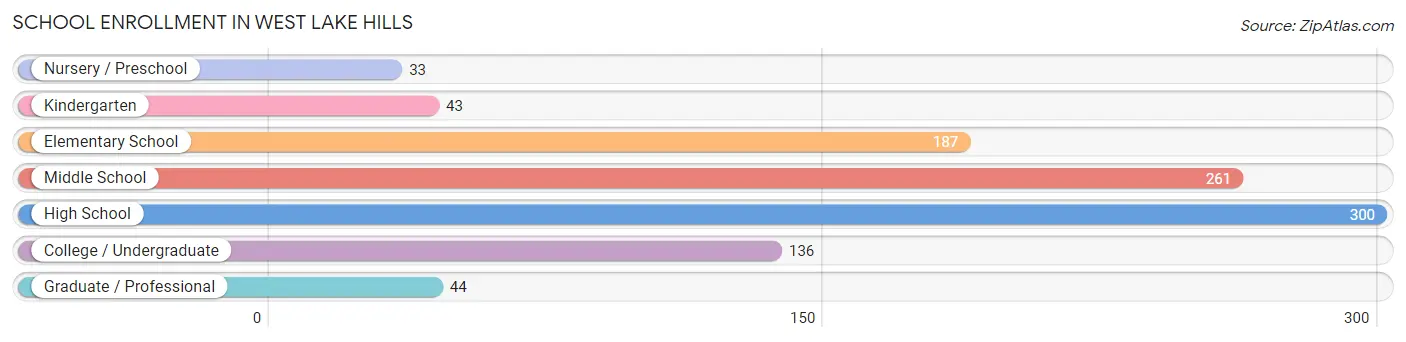
| School Level | # Students | % Students |
| Nursery / Preschool | 33 | 3.3% |
| Kindergarten | 43 | 4.3% |
| Elementary School | 187 | 18.6% |
| Middle School | 261 | 26.0% |
| High School | 300 | 29.9% |
| College / Undergraduate | 136 | 13.6% |
| Graduate / Professional | 44 | 4.4% |
| Total | 1,004 | 100.0% |
School Enrollment by Age by Funding Source in West Lake Hills
Out of a total of 1,004 students who are enrolled in schools in West Lake Hills, 340 (33.9%) attend a private institution, while the remaining 664 (66.1%) are enrolled in public schools. The age group of 3 to 4 year olds has the highest likelihood of being enrolled in private schools, with 33 (100.0% in the age bracket) enrolled. Conversely, the age group of 5 to 9 year old has the lowest likelihood of being enrolled in a private school, with 189 (92.2% in the age bracket) attending a public institution.
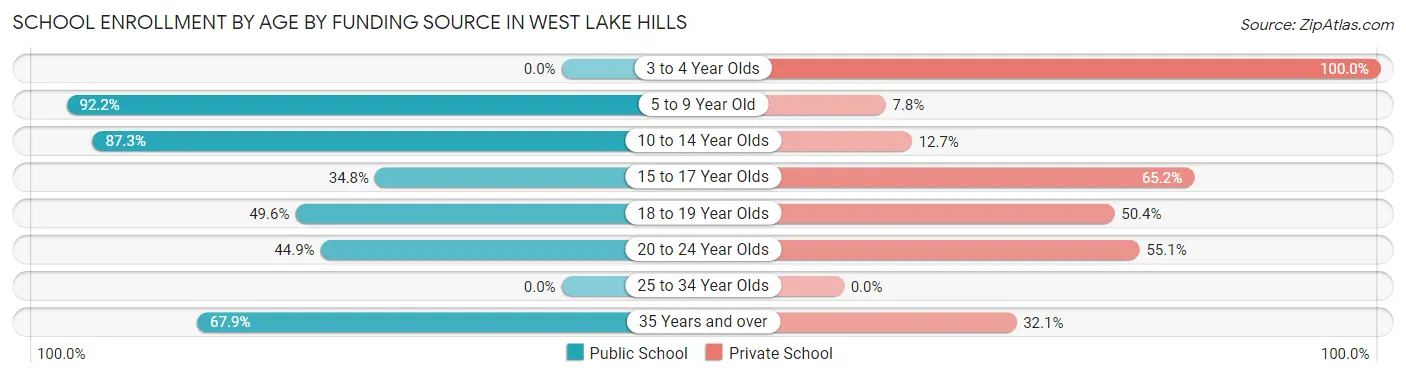
| Age Bracket | Public School | Private School |
| 3 to 4 Year Olds | 0 (0.0%) | 33 (100.0%) |
| 5 to 9 Year Old | 189 (92.2%) | 16 (7.8%) |
| 10 to 14 Year Olds | 262 (87.3%) | 38 (12.7%) |
| 15 to 17 Year Olds | 73 (34.8%) | 137 (65.2%) |
| 18 to 19 Year Olds | 61 (49.6%) | 62 (50.4%) |
| 20 to 24 Year Olds | 22 (44.9%) | 27 (55.1%) |
| 25 to 34 Year Olds | 0 (0.0%) | 0 (0.0%) |
| 35 Years and over | 57 (67.9%) | 27 (32.1%) |
| Total | 664 (66.1%) | 340 (33.9%) |
Educational Attainment by Field of Study in West Lake Hills
Business (495 | 24.5%), social sciences (246 | 12.2%), engineering (207 | 10.2%), literature & languages (206 | 10.2%), and science & technology (154 | 7.6%) are the most common fields of study among 2,019 individuals in West Lake Hills who have obtained a bachelor's degree or higher.
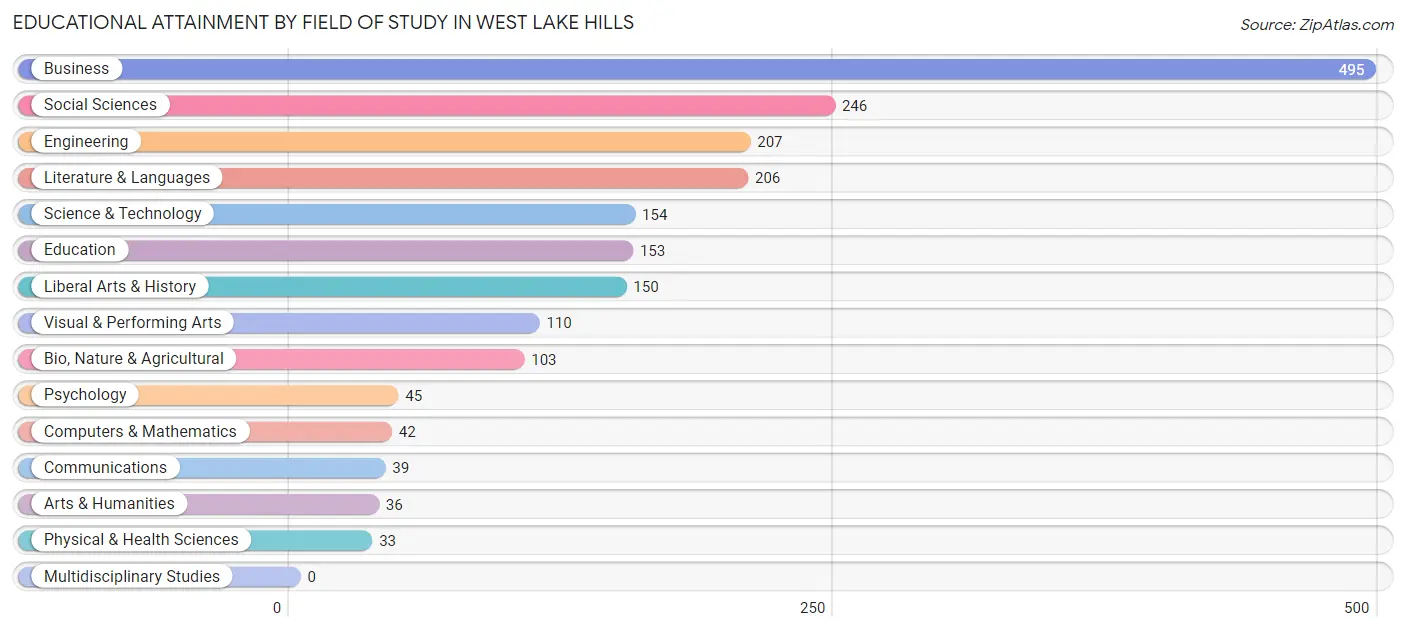
| Field of Study | # Graduates | % Graduates |
| Computers & Mathematics | 42 | 2.1% |
| Bio, Nature & Agricultural | 103 | 5.1% |
| Physical & Health Sciences | 33 | 1.6% |
| Psychology | 45 | 2.2% |
| Social Sciences | 246 | 12.2% |
| Engineering | 207 | 10.2% |
| Multidisciplinary Studies | 0 | 0.0% |
| Science & Technology | 154 | 7.6% |
| Business | 495 | 24.5% |
| Education | 153 | 7.6% |
| Literature & Languages | 206 | 10.2% |
| Liberal Arts & History | 150 | 7.4% |
| Visual & Performing Arts | 110 | 5.4% |
| Communications | 39 | 1.9% |
| Arts & Humanities | 36 | 1.8% |
| Total | 2,019 | 100.0% |
Transportation & Commute in West Lake Hills
Vehicle Availability by Sex in West Lake Hills
The most prevalent vehicle ownership categories in West Lake Hills are males with 2 vehicles (481, accounting for 63.4%) and females with 2 vehicles (343, making up 94.5%).
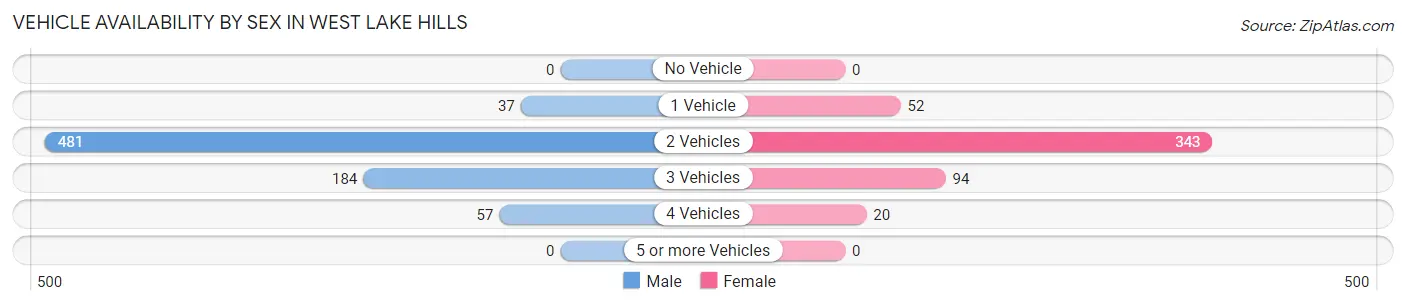
| Vehicles Available | Male | Female |
| No Vehicle | 0 (0.0%) | 0 (0.0%) |
| 1 Vehicle | 37 (4.9%) | 52 (10.2%) |
| 2 Vehicles | 481 (63.4%) | 343 (67.4%) |
| 3 Vehicles | 184 (24.2%) | 94 (18.5%) |
| 4 Vehicles | 57 (7.5%) | 20 (3.9%) |
| 5 or more Vehicles | 0 (0.0%) | 0 (0.0%) |
| Total | 759 (100.0%) | 509 (100.0%) |
Commute Time in West Lake Hills
The most frequently occuring commute durations in West Lake Hills are 15 to 19 minutes (188 commuters, 24.1%), 20 to 24 minutes (169 commuters, 21.7%), and 30 to 34 minutes (111 commuters, 14.2%).
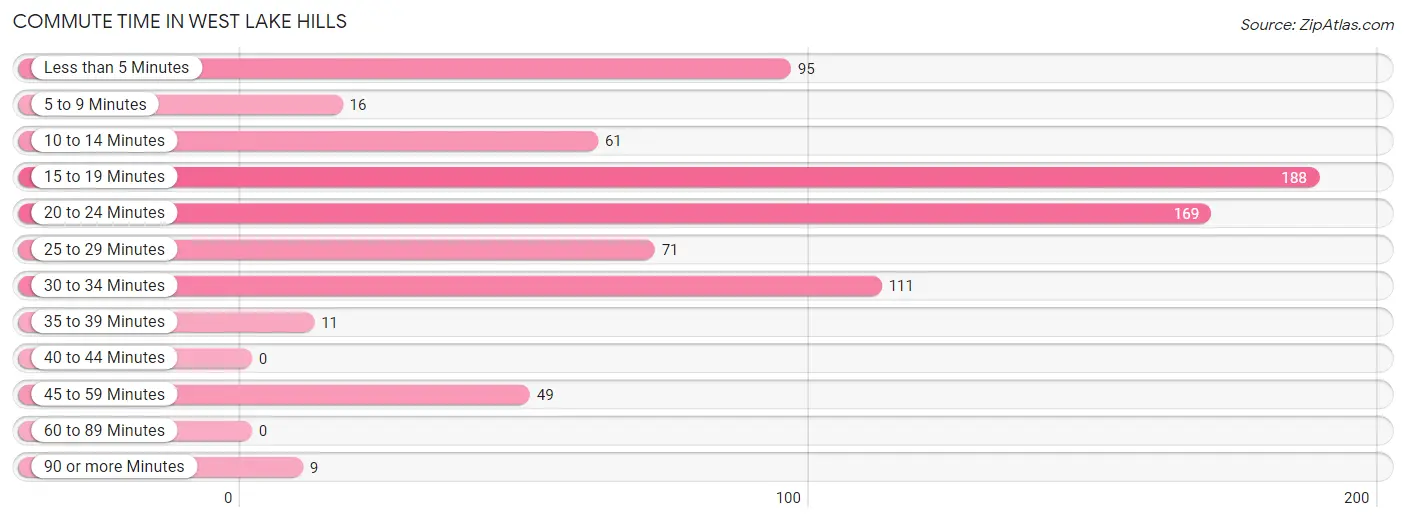
| Commute Time | # Commuters | % Commuters |
| Less than 5 Minutes | 95 | 12.2% |
| 5 to 9 Minutes | 16 | 2.1% |
| 10 to 14 Minutes | 61 | 7.8% |
| 15 to 19 Minutes | 188 | 24.1% |
| 20 to 24 Minutes | 169 | 21.7% |
| 25 to 29 Minutes | 71 | 9.1% |
| 30 to 34 Minutes | 111 | 14.2% |
| 35 to 39 Minutes | 11 | 1.4% |
| 40 to 44 Minutes | 0 | 0.0% |
| 45 to 59 Minutes | 49 | 6.3% |
| 60 to 89 Minutes | 0 | 0.0% |
| 90 or more Minutes | 9 | 1.1% |
Commute Time by Sex in West Lake Hills
The most common commute times in West Lake Hills are 20 to 24 minutes (139 commuters, 28.6%) for males and 15 to 19 minutes (94 commuters, 32.0%) for females.
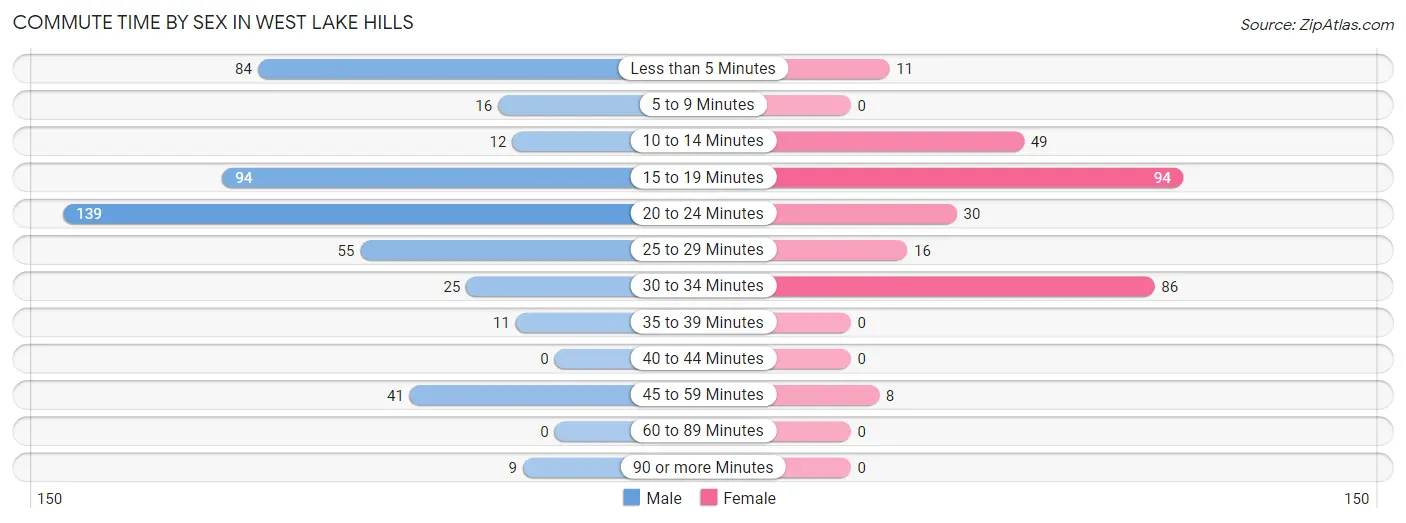
| Commute Time | Male | Female |
| Less than 5 Minutes | 84 (17.3%) | 11 (3.7%) |
| 5 to 9 Minutes | 16 (3.3%) | 0 (0.0%) |
| 10 to 14 Minutes | 12 (2.5%) | 49 (16.7%) |
| 15 to 19 Minutes | 94 (19.3%) | 94 (32.0%) |
| 20 to 24 Minutes | 139 (28.6%) | 30 (10.2%) |
| 25 to 29 Minutes | 55 (11.3%) | 16 (5.4%) |
| 30 to 34 Minutes | 25 (5.1%) | 86 (29.2%) |
| 35 to 39 Minutes | 11 (2.3%) | 0 (0.0%) |
| 40 to 44 Minutes | 0 (0.0%) | 0 (0.0%) |
| 45 to 59 Minutes | 41 (8.4%) | 8 (2.7%) |
| 60 to 89 Minutes | 0 (0.0%) | 0 (0.0%) |
| 90 or more Minutes | 9 (1.8%) | 0 (0.0%) |
Time of Departure to Work by Sex in West Lake Hills
The most frequent times of departure to work in West Lake Hills are 8:00 AM to 8:29 AM (125, 25.7%) for males and 8:00 AM to 8:29 AM (63, 21.4%) for females.
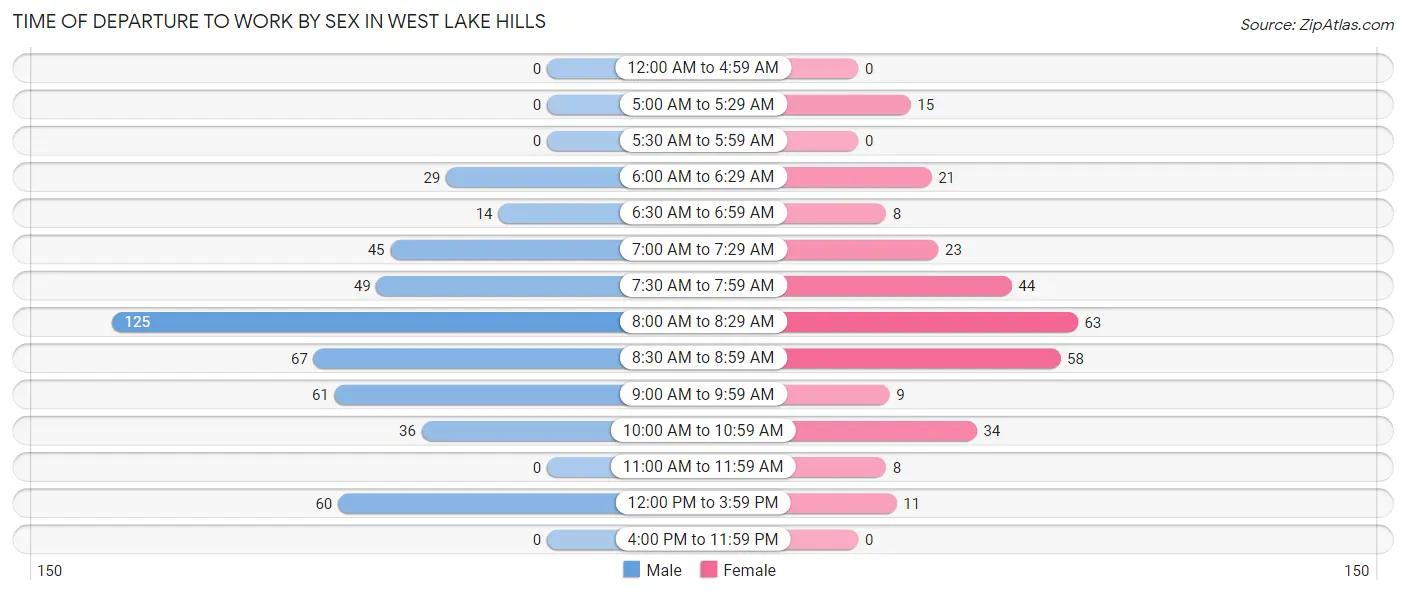
| Time of Departure | Male | Female |
| 12:00 AM to 4:59 AM | 0 (0.0%) | 0 (0.0%) |
| 5:00 AM to 5:29 AM | 0 (0.0%) | 15 (5.1%) |
| 5:30 AM to 5:59 AM | 0 (0.0%) | 0 (0.0%) |
| 6:00 AM to 6:29 AM | 29 (6.0%) | 21 (7.1%) |
| 6:30 AM to 6:59 AM | 14 (2.9%) | 8 (2.7%) |
| 7:00 AM to 7:29 AM | 45 (9.3%) | 23 (7.8%) |
| 7:30 AM to 7:59 AM | 49 (10.1%) | 44 (15.0%) |
| 8:00 AM to 8:29 AM | 125 (25.7%) | 63 (21.4%) |
| 8:30 AM to 8:59 AM | 67 (13.8%) | 58 (19.7%) |
| 9:00 AM to 9:59 AM | 61 (12.6%) | 9 (3.1%) |
| 10:00 AM to 10:59 AM | 36 (7.4%) | 34 (11.6%) |
| 11:00 AM to 11:59 AM | 0 (0.0%) | 8 (2.7%) |
| 12:00 PM to 3:59 PM | 60 (12.3%) | 11 (3.7%) |
| 4:00 PM to 11:59 PM | 0 (0.0%) | 0 (0.0%) |
| Total | 486 (100.0%) | 294 (100.0%) |
Housing Occupancy in West Lake Hills
Occupancy by Ownership in West Lake Hills
Of the total 1,234 dwellings in West Lake Hills, owner-occupied units account for 1,088 (88.2%), while renter-occupied units make up 146 (11.8%).
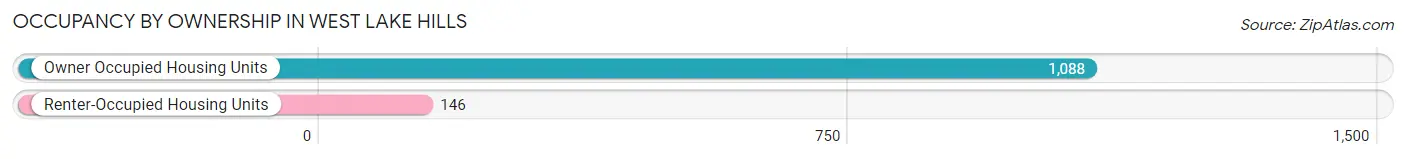
| Occupancy | # Housing Units | % Housing Units |
| Owner Occupied Housing Units | 1,088 | 88.2% |
| Renter-Occupied Housing Units | 146 | 11.8% |
| Total Occupied Housing Units | 1,234 | 100.0% |
Occupancy by Household Size in West Lake Hills
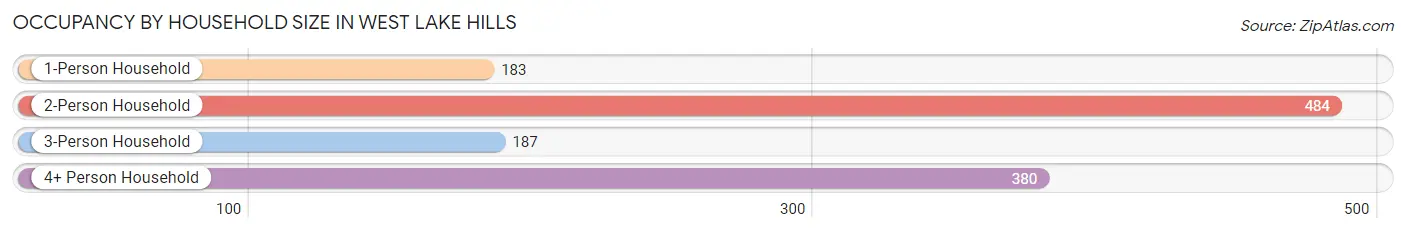
| Household Size | # Housing Units | % Housing Units |
| 1-Person Household | 183 | 14.8% |
| 2-Person Household | 484 | 39.2% |
| 3-Person Household | 187 | 15.1% |
| 4+ Person Household | 380 | 30.8% |
| Total Housing Units | 1,234 | 100.0% |
Occupancy by Ownership by Household Size in West Lake Hills
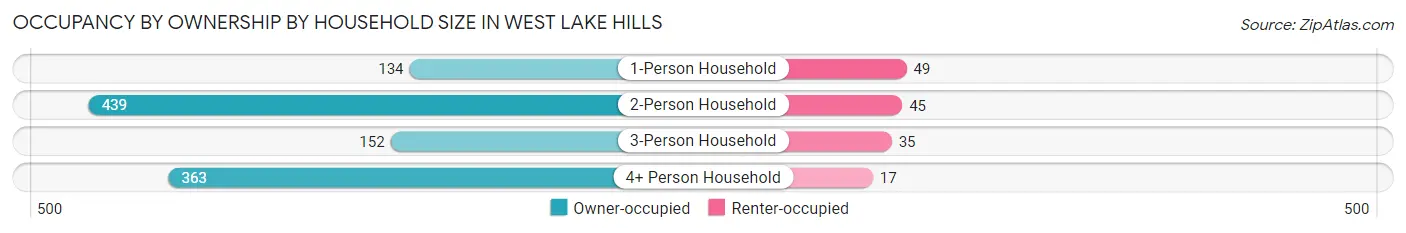
| Household Size | Owner-occupied | Renter-occupied |
| 1-Person Household | 134 (73.2%) | 49 (26.8%) |
| 2-Person Household | 439 (90.7%) | 45 (9.3%) |
| 3-Person Household | 152 (81.3%) | 35 (18.7%) |
| 4+ Person Household | 363 (95.5%) | 17 (4.5%) |
| Total Housing Units | 1,088 (88.2%) | 146 (11.8%) |
Occupancy by Educational Attainment in West Lake Hills
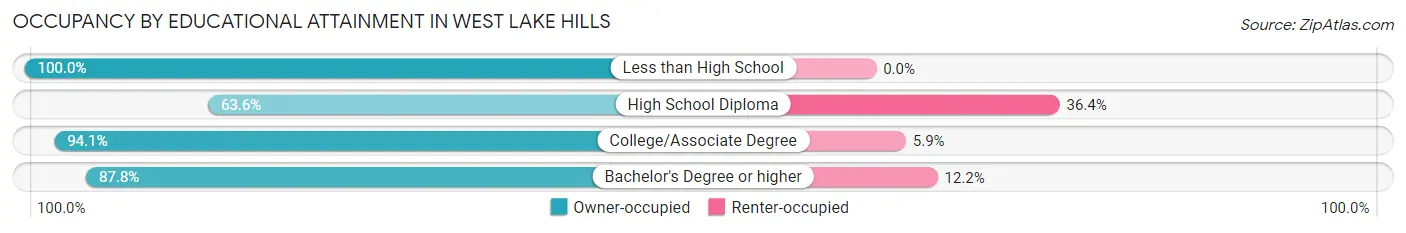
| Household Size | Owner-occupied | Renter-occupied |
| Less than High School | 8 (100.0%) | 0 (0.0%) |
| High School Diploma | 14 (63.6%) | 8 (36.4%) |
| College/Associate Degree | 128 (94.1%) | 8 (5.9%) |
| Bachelor's Degree or higher | 938 (87.8%) | 130 (12.2%) |
Occupancy by Age of Householder in West Lake Hills
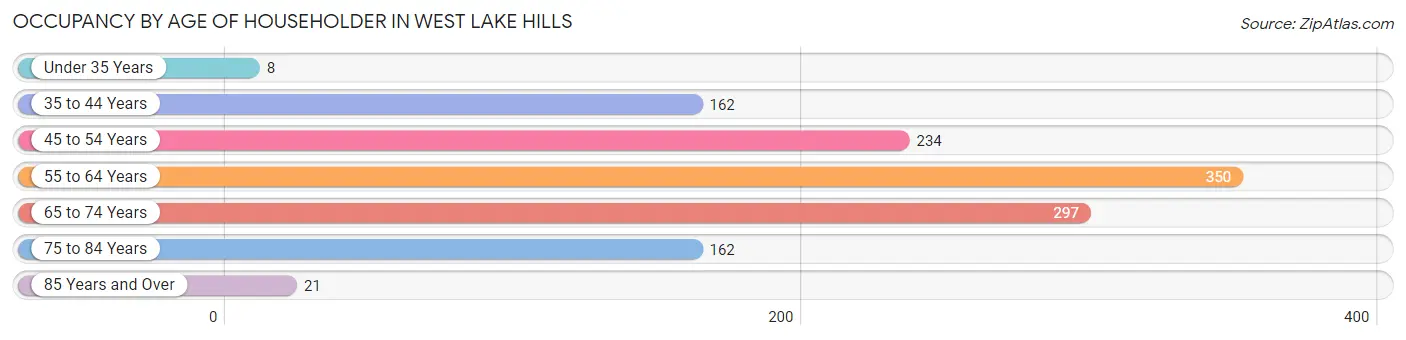
| Age Bracket | # Households | % Households |
| Under 35 Years | 8 | 0.6% |
| 35 to 44 Years | 162 | 13.1% |
| 45 to 54 Years | 234 | 19.0% |
| 55 to 64 Years | 350 | 28.4% |
| 65 to 74 Years | 297 | 24.1% |
| 75 to 84 Years | 162 | 13.1% |
| 85 Years and Over | 21 | 1.7% |
| Total | 1,234 | 100.0% |
Housing Finances in West Lake Hills
Median Income by Occupancy in West Lake Hills
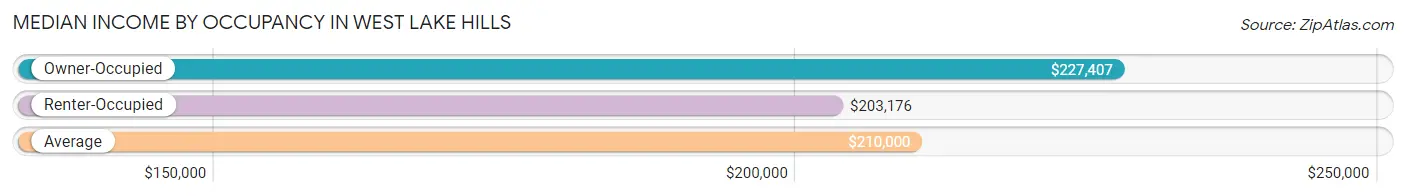
| Occupancy Type | # Households | Median Income |
| Owner-Occupied | 1,088 (88.2%) | $227,407 |
| Renter-Occupied | 146 (11.8%) | $203,176 |
| Average | 1,234 (100.0%) | $210,000 |
Occupancy by Householder Income Bracket in West Lake Hills
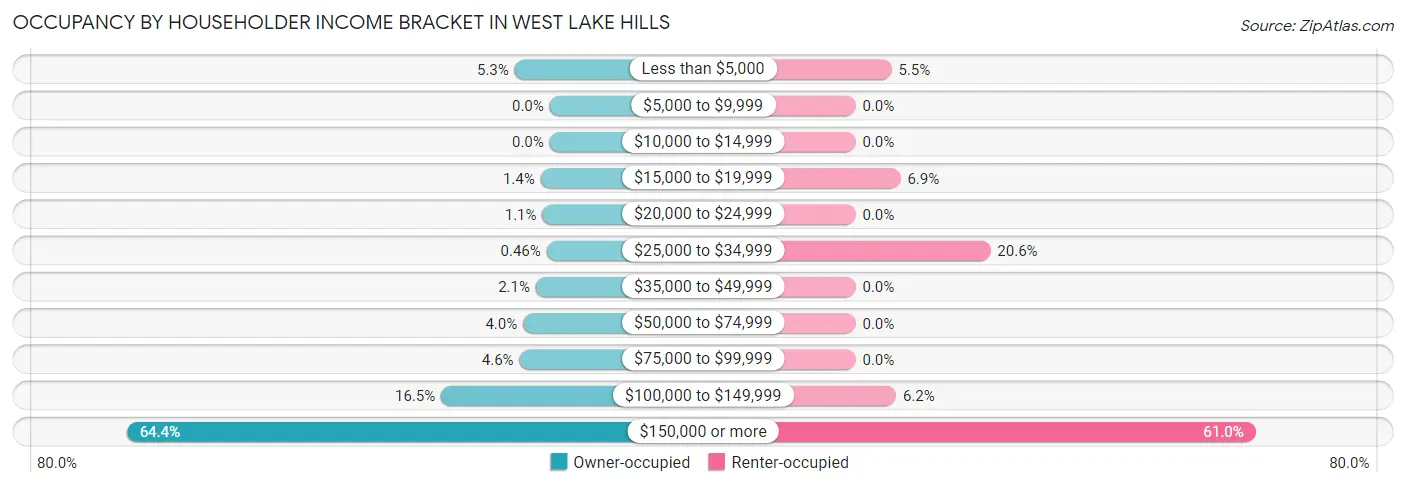
| Income Bracket | Owner-occupied | Renter-occupied |
| Less than $5,000 | 58 (5.3%) | 8 (5.5%) |
| $5,000 to $9,999 | 0 (0.0%) | 0 (0.0%) |
| $10,000 to $14,999 | 0 (0.0%) | 0 (0.0%) |
| $15,000 to $19,999 | 15 (1.4%) | 10 (6.9%) |
| $20,000 to $24,999 | 12 (1.1%) | 0 (0.0%) |
| $25,000 to $34,999 | 5 (0.5%) | 30 (20.5%) |
| $35,000 to $49,999 | 23 (2.1%) | 0 (0.0%) |
| $50,000 to $74,999 | 44 (4.0%) | 0 (0.0%) |
| $75,000 to $99,999 | 50 (4.6%) | 0 (0.0%) |
| $100,000 to $149,999 | 180 (16.5%) | 9 (6.2%) |
| $150,000 or more | 701 (64.4%) | 89 (61.0%) |
| Total | 1,088 (100.0%) | 146 (100.0%) |
Monthly Housing Cost Tiers in West Lake Hills
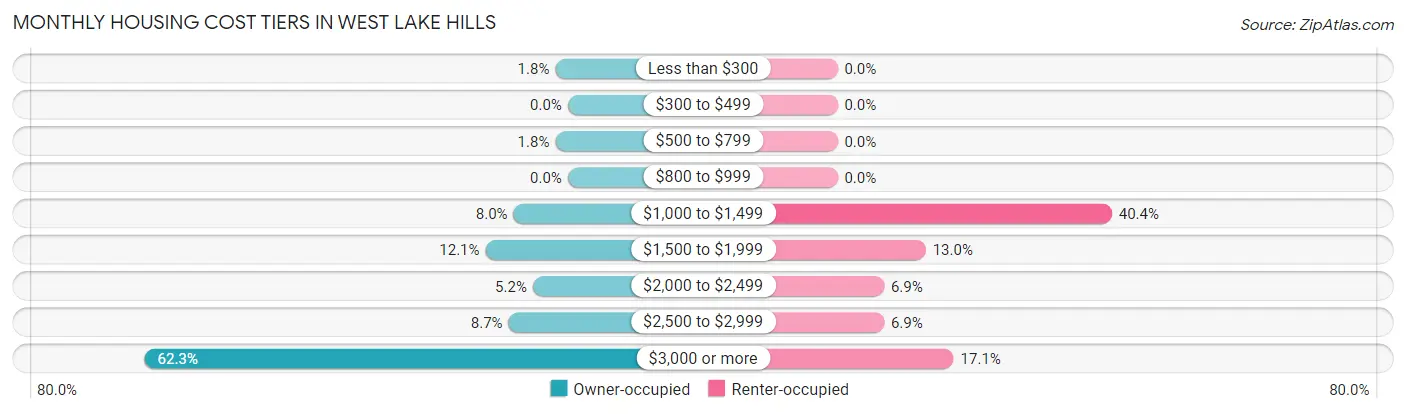
| Monthly Cost | Owner-occupied | Renter-occupied |
| Less than $300 | 20 (1.8%) | 0 (0.0%) |
| $300 to $499 | 0 (0.0%) | 0 (0.0%) |
| $500 to $799 | 20 (1.8%) | 0 (0.0%) |
| $800 to $999 | 0 (0.0%) | 0 (0.0%) |
| $1,000 to $1,499 | 87 (8.0%) | 59 (40.4%) |
| $1,500 to $1,999 | 132 (12.1%) | 19 (13.0%) |
| $2,000 to $2,499 | 56 (5.1%) | 10 (6.9%) |
| $2,500 to $2,999 | 95 (8.7%) | 10 (6.9%) |
| $3,000 or more | 678 (62.3%) | 25 (17.1%) |
| Total | 1,088 (100.0%) | 146 (100.0%) |
Physical Housing Characteristics in West Lake Hills
Housing Structures in West Lake Hills
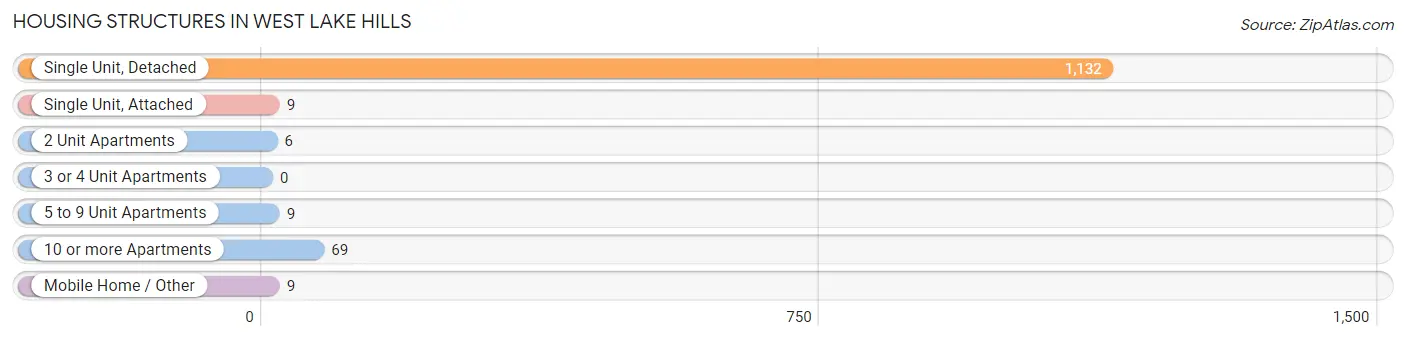
| Structure Type | # Housing Units | % Housing Units |
| Single Unit, Detached | 1,132 | 91.7% |
| Single Unit, Attached | 9 | 0.7% |
| 2 Unit Apartments | 6 | 0.5% |
| 3 or 4 Unit Apartments | 0 | 0.0% |
| 5 to 9 Unit Apartments | 9 | 0.7% |
| 10 or more Apartments | 69 | 5.6% |
| Mobile Home / Other | 9 | 0.7% |
| Total | 1,234 | 100.0% |
Housing Structures by Occupancy in West Lake Hills
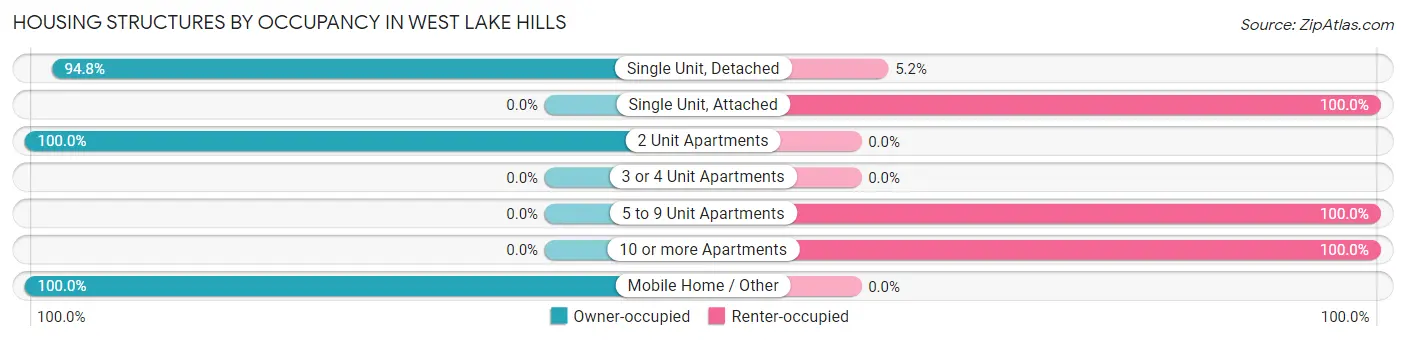
| Structure Type | Owner-occupied | Renter-occupied |
| Single Unit, Detached | 1,073 (94.8%) | 59 (5.2%) |
| Single Unit, Attached | 0 (0.0%) | 9 (100.0%) |
| 2 Unit Apartments | 6 (100.0%) | 0 (0.0%) |
| 3 or 4 Unit Apartments | 0 (0.0%) | 0 (0.0%) |
| 5 to 9 Unit Apartments | 0 (0.0%) | 9 (100.0%) |
| 10 or more Apartments | 0 (0.0%) | 69 (100.0%) |
| Mobile Home / Other | 9 (100.0%) | 0 (0.0%) |
| Total | 1,088 (88.2%) | 146 (11.8%) |
Housing Structures by Number of Rooms in West Lake Hills
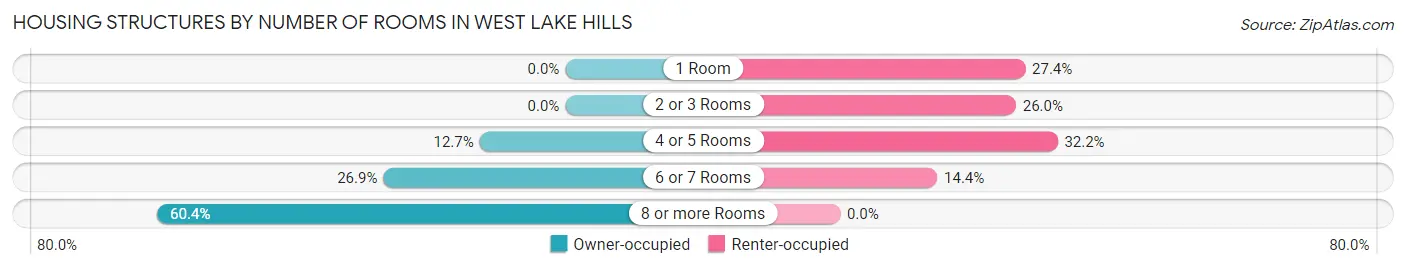
| Number of Rooms | Owner-occupied | Renter-occupied |
| 1 Room | 0 (0.0%) | 40 (27.4%) |
| 2 or 3 Rooms | 0 (0.0%) | 38 (26.0%) |
| 4 or 5 Rooms | 138 (12.7%) | 47 (32.2%) |
| 6 or 7 Rooms | 293 (26.9%) | 21 (14.4%) |
| 8 or more Rooms | 657 (60.4%) | 0 (0.0%) |
| Total | 1,088 (100.0%) | 146 (100.0%) |
Housing Structure by Heating Type in West Lake Hills
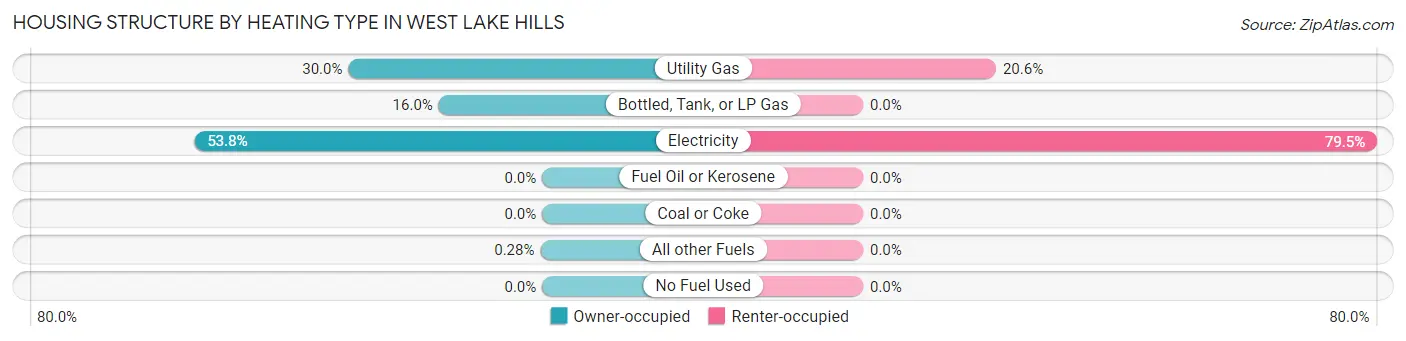
| Heating Type | Owner-occupied | Renter-occupied |
| Utility Gas | 326 (30.0%) | 30 (20.5%) |
| Bottled, Tank, or LP Gas | 174 (16.0%) | 0 (0.0%) |
| Electricity | 585 (53.8%) | 116 (79.4%) |
| Fuel Oil or Kerosene | 0 (0.0%) | 0 (0.0%) |
| Coal or Coke | 0 (0.0%) | 0 (0.0%) |
| All other Fuels | 3 (0.3%) | 0 (0.0%) |
| No Fuel Used | 0 (0.0%) | 0 (0.0%) |
| Total | 1,088 (100.0%) | 146 (100.0%) |
Household Vehicle Usage in West Lake Hills
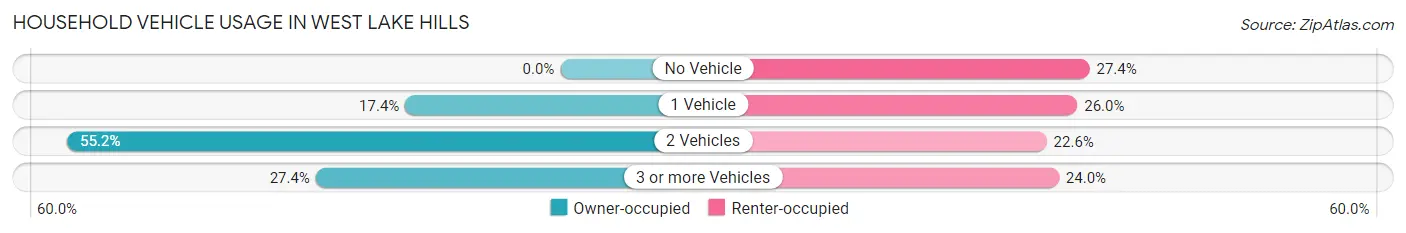
| Vehicles per Household | Owner-occupied | Renter-occupied |
| No Vehicle | 0 (0.0%) | 40 (27.4%) |
| 1 Vehicle | 189 (17.4%) | 38 (26.0%) |
| 2 Vehicles | 601 (55.2%) | 33 (22.6%) |
| 3 or more Vehicles | 298 (27.4%) | 35 (24.0%) |
| Total | 1,088 (100.0%) | 146 (100.0%) |
Real Estate & Mortgages in West Lake Hills
Real Estate and Mortgage Overview in West Lake Hills
| Characteristic | Without Mortgage | With Mortgage |
| Housing Units | 597 | 491 |
| Median Property Value | $1,562,500 | $1,393,900 |
| Median Household Income | $127,269 | $434 |
| Monthly Housing Costs | $1,501 | $459 |
| Real Estate Taxes | $10,001 | $0 |
Property Value by Mortgage Status in West Lake Hills
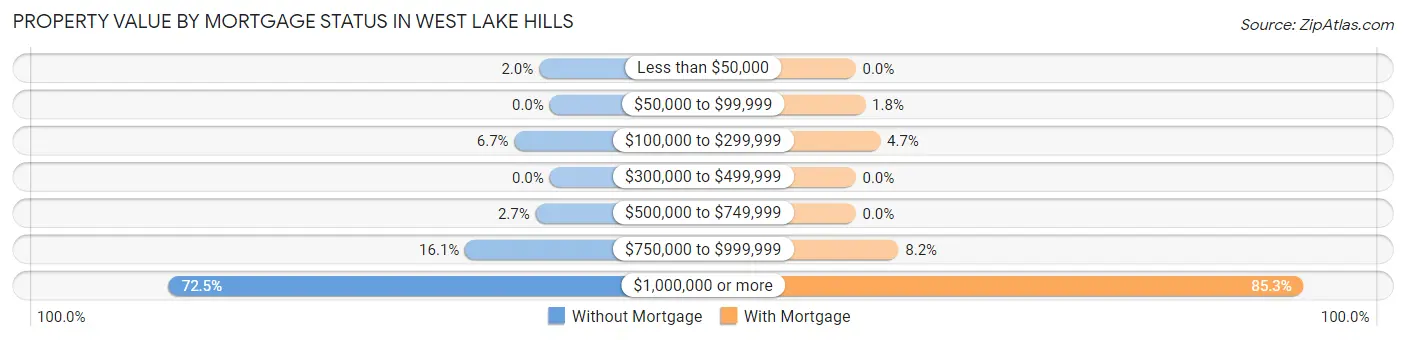
| Property Value | Without Mortgage | With Mortgage |
| Less than $50,000 | 12 (2.0%) | 0 (0.0%) |
| $50,000 to $99,999 | 0 (0.0%) | 9 (1.8%) |
| $100,000 to $299,999 | 40 (6.7%) | 23 (4.7%) |
| $300,000 to $499,999 | 0 (0.0%) | 0 (0.0%) |
| $500,000 to $749,999 | 16 (2.7%) | 0 (0.0%) |
| $750,000 to $999,999 | 96 (16.1%) | 40 (8.2%) |
| $1,000,000 or more | 433 (72.5%) | 419 (85.3%) |
| Total | 597 (100.0%) | 491 (100.0%) |
Household Income by Mortgage Status in West Lake Hills
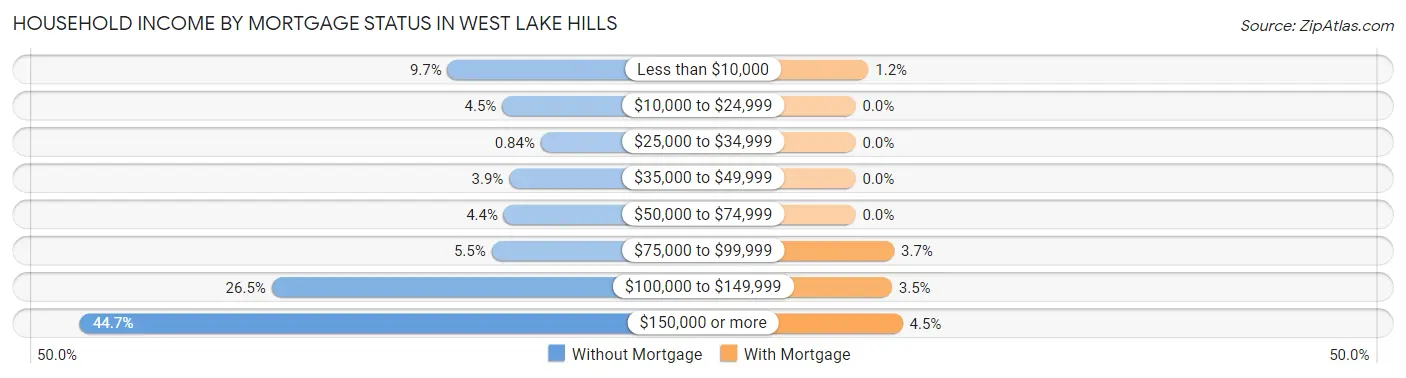
| Household Income | Without Mortgage | With Mortgage |
| Less than $10,000 | 58 (9.7%) | 6 (1.2%) |
| $10,000 to $24,999 | 27 (4.5%) | 0 (0.0%) |
| $25,000 to $34,999 | 5 (0.8%) | 0 (0.0%) |
| $35,000 to $49,999 | 23 (3.8%) | 0 (0.0%) |
| $50,000 to $74,999 | 26 (4.4%) | 0 (0.0%) |
| $75,000 to $99,999 | 33 (5.5%) | 18 (3.7%) |
| $100,000 to $149,999 | 158 (26.5%) | 17 (3.5%) |
| $150,000 or more | 267 (44.7%) | 22 (4.5%) |
| Total | 597 (100.0%) | 491 (100.0%) |
Property Value to Household Income Ratio in West Lake Hills
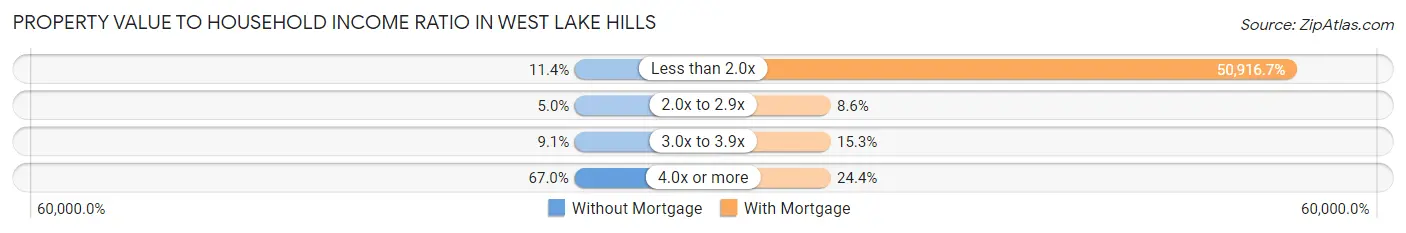
| Value-to-Income Ratio | Without Mortgage | With Mortgage |
| Less than 2.0x | 68 (11.4%) | 250,001 (50,916.7%) |
| 2.0x to 2.9x | 30 (5.0%) | 42 (8.6%) |
| 3.0x to 3.9x | 54 (9.0%) | 75 (15.3%) |
| 4.0x or more | 400 (67.0%) | 120 (24.4%) |
| Total | 597 (100.0%) | 491 (100.0%) |
Real Estate Taxes by Mortgage Status in West Lake Hills
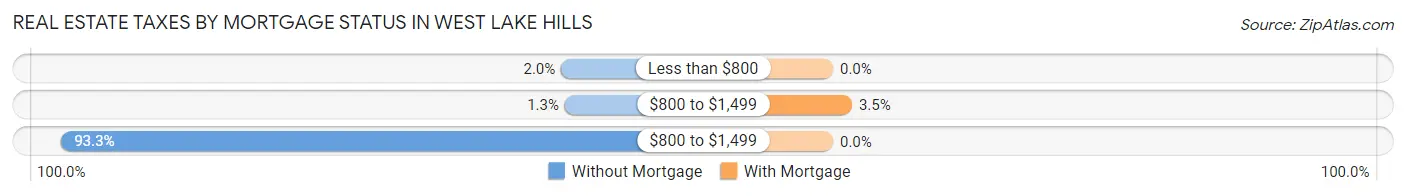
| Property Taxes | Without Mortgage | With Mortgage |
| Less than $800 | 12 (2.0%) | 0 (0.0%) |
| $800 to $1,499 | 8 (1.3%) | 17 (3.5%) |
| $800 to $1,499 | 557 (93.3%) | 0 (0.0%) |
| Total | 597 (100.0%) | 491 (100.0%) |
Health & Disability in West Lake Hills
Health Insurance Coverage by Age in West Lake Hills
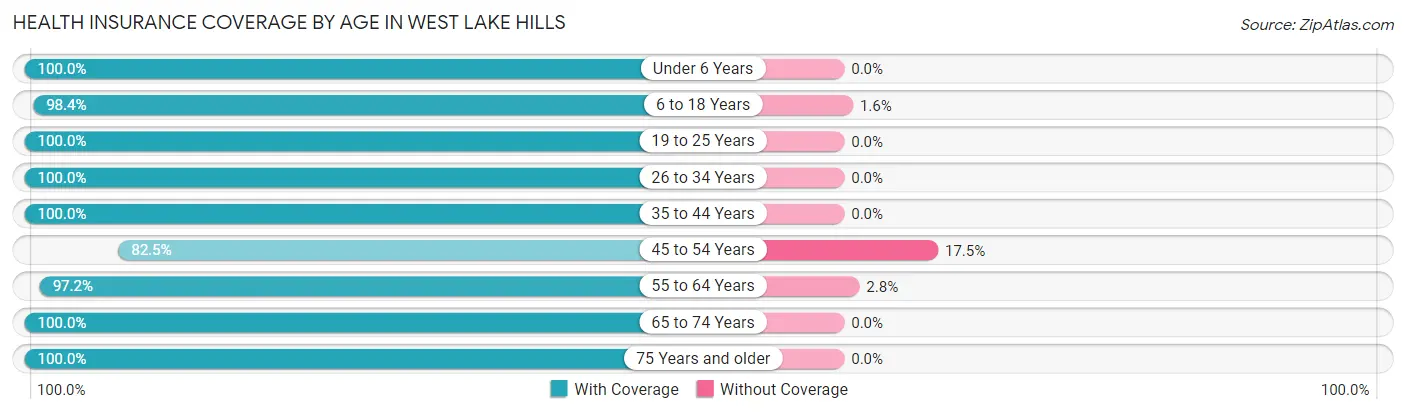
| Age Bracket | With Coverage | Without Coverage |
| Under 6 Years | 100 (100.0%) | 0 (0.0%) |
| 6 to 18 Years | 852 (98.4%) | 14 (1.6%) |
| 19 to 25 Years | 132 (100.0%) | 0 (0.0%) |
| 26 to 34 Years | 16 (100.0%) | 0 (0.0%) |
| 35 to 44 Years | 298 (100.0%) | 0 (0.0%) |
| 45 to 54 Years | 439 (82.5%) | 93 (17.5%) |
| 55 to 64 Years | 620 (97.2%) | 18 (2.8%) |
| 65 to 74 Years | 447 (100.0%) | 0 (0.0%) |
| 75 Years and older | 293 (100.0%) | 0 (0.0%) |
| Total | 3,197 (96.2%) | 125 (3.8%) |
Health Insurance Coverage by Citizenship Status in West Lake Hills
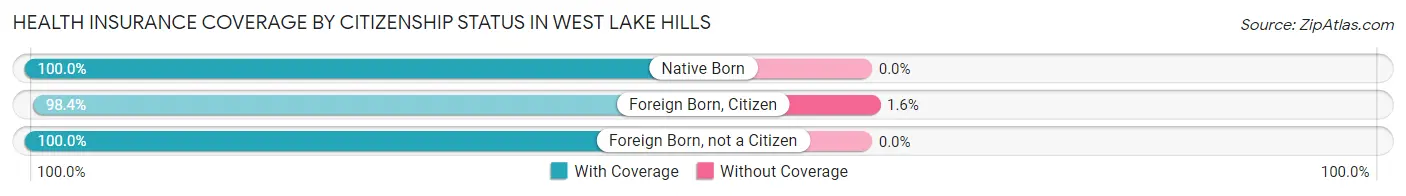
| Citizenship Status | With Coverage | Without Coverage |
| Native Born | 100 (100.0%) | 0 (0.0%) |
| Foreign Born, Citizen | 852 (98.4%) | 14 (1.6%) |
| Foreign Born, not a Citizen | 132 (100.0%) | 0 (0.0%) |
Health Insurance Coverage by Household Income in West Lake Hills
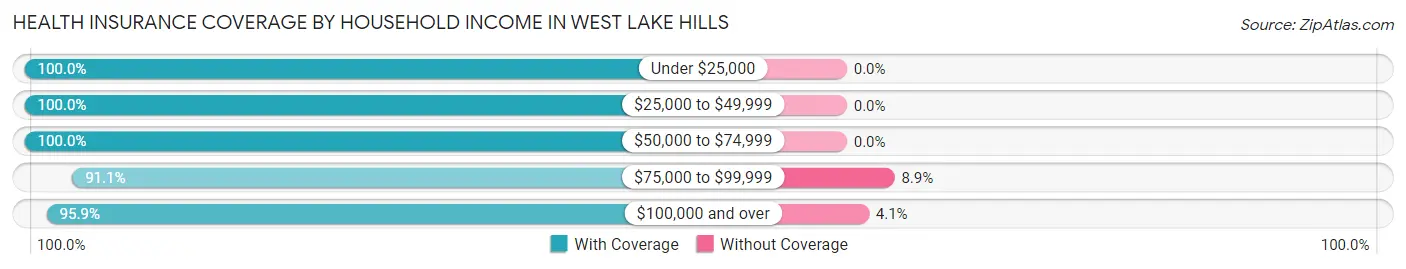
| Household Income | With Coverage | Without Coverage |
| Under $25,000 | 277 (100.0%) | 0 (0.0%) |
| $25,000 to $49,999 | 72 (100.0%) | 0 (0.0%) |
| $50,000 to $74,999 | 66 (100.0%) | 0 (0.0%) |
| $75,000 to $99,999 | 102 (91.1%) | 10 (8.9%) |
| $100,000 and over | 2,669 (95.9%) | 115 (4.1%) |
Public vs Private Health Insurance Coverage by Age in West Lake Hills
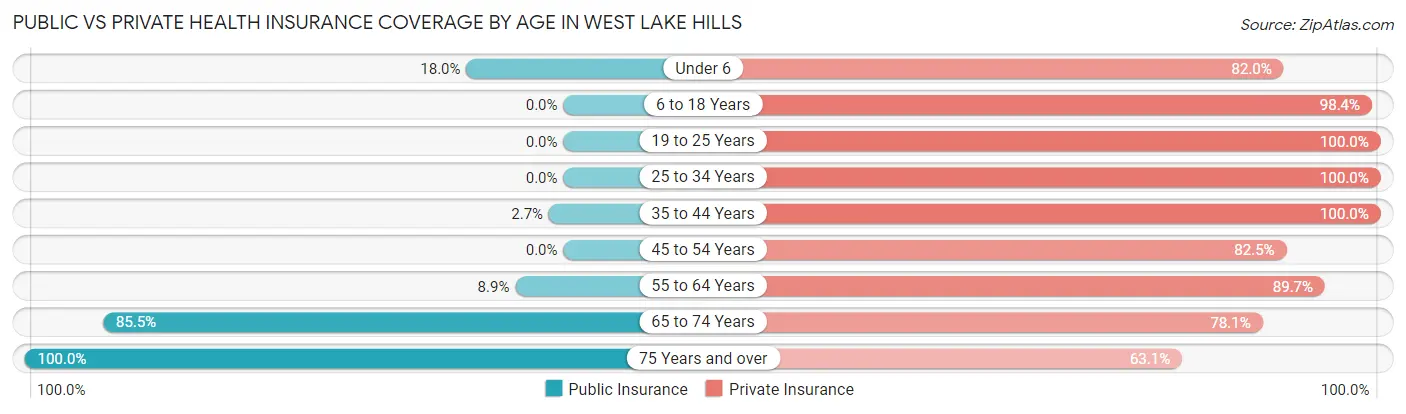
| Age Bracket | Public Insurance | Private Insurance |
| Under 6 | 18 (18.0%) | 82 (82.0%) |
| 6 to 18 Years | 0 (0.0%) | 852 (98.4%) |
| 19 to 25 Years | 0 (0.0%) | 132 (100.0%) |
| 25 to 34 Years | 0 (0.0%) | 16 (100.0%) |
| 35 to 44 Years | 8 (2.7%) | 298 (100.0%) |
| 45 to 54 Years | 0 (0.0%) | 439 (82.5%) |
| 55 to 64 Years | 57 (8.9%) | 572 (89.7%) |
| 65 to 74 Years | 382 (85.5%) | 349 (78.1%) |
| 75 Years and over | 293 (100.0%) | 185 (63.1%) |
| Total | 758 (22.8%) | 2,925 (88.0%) |
Disability Status by Sex by Age in West Lake Hills
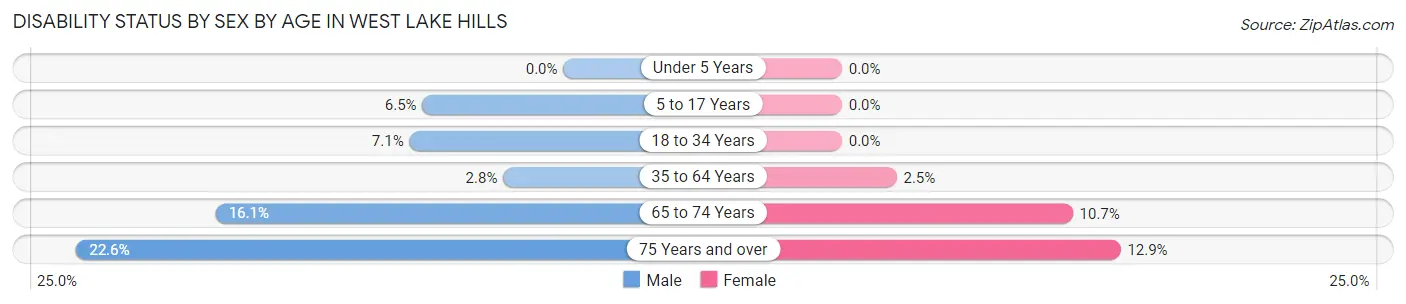
| Age Bracket | Male | Female |
| Under 5 Years | 0 (0.0%) | 0 (0.0%) |
| 5 to 17 Years | 21 (6.5%) | 0 (0.0%) |
| 18 to 34 Years | 8 (7.1%) | 0 (0.0%) |
| 35 to 64 Years | 19 (2.8%) | 20 (2.5%) |
| 65 to 74 Years | 45 (16.1%) | 18 (10.7%) |
| 75 Years and over | 33 (22.6%) | 19 (12.9%) |
Disability Class by Sex by Age in West Lake Hills
Disability Class: Hearing Difficulty
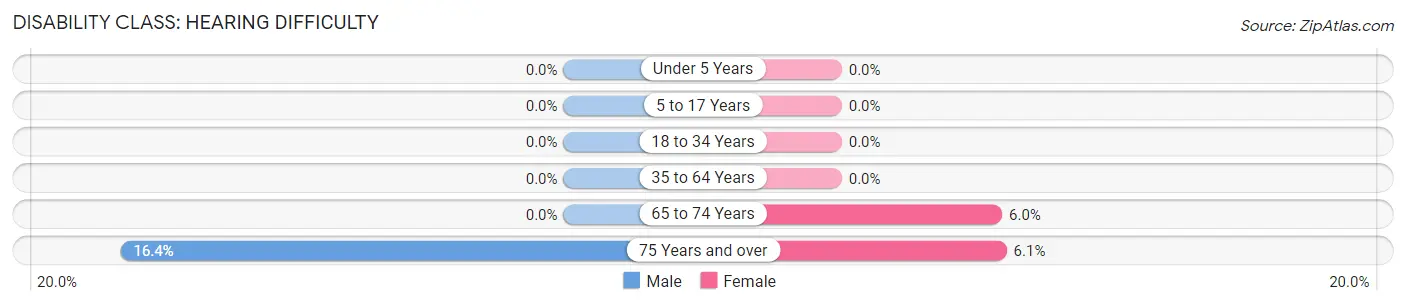
| Age Bracket | Male | Female |
| Under 5 Years | 0 (0.0%) | 0 (0.0%) |
| 5 to 17 Years | 0 (0.0%) | 0 (0.0%) |
| 18 to 34 Years | 0 (0.0%) | 0 (0.0%) |
| 35 to 64 Years | 0 (0.0%) | 0 (0.0%) |
| 65 to 74 Years | 0 (0.0%) | 10 (5.9%) |
| 75 Years and over | 24 (16.4%) | 9 (6.1%) |
Disability Class: Vision Difficulty
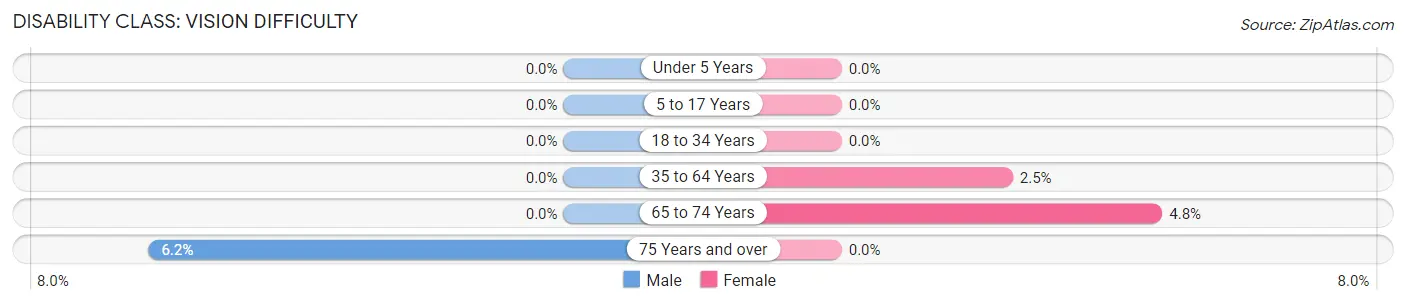
| Age Bracket | Male | Female |
| Under 5 Years | 0 (0.0%) | 0 (0.0%) |
| 5 to 17 Years | 0 (0.0%) | 0 (0.0%) |
| 18 to 34 Years | 0 (0.0%) | 0 (0.0%) |
| 35 to 64 Years | 0 (0.0%) | 20 (2.5%) |
| 65 to 74 Years | 0 (0.0%) | 8 (4.8%) |
| 75 Years and over | 9 (6.2%) | 0 (0.0%) |
Disability Class: Cognitive Difficulty
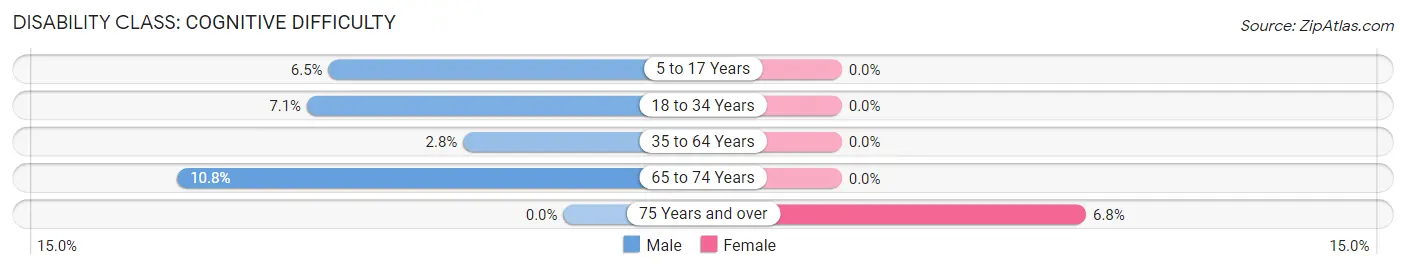
| Age Bracket | Male | Female |
| 5 to 17 Years | 21 (6.5%) | 0 (0.0%) |
| 18 to 34 Years | 8 (7.1%) | 0 (0.0%) |
| 35 to 64 Years | 19 (2.8%) | 0 (0.0%) |
| 65 to 74 Years | 30 (10.7%) | 0 (0.0%) |
| 75 Years and over | 0 (0.0%) | 10 (6.8%) |
Disability Class: Ambulatory Difficulty
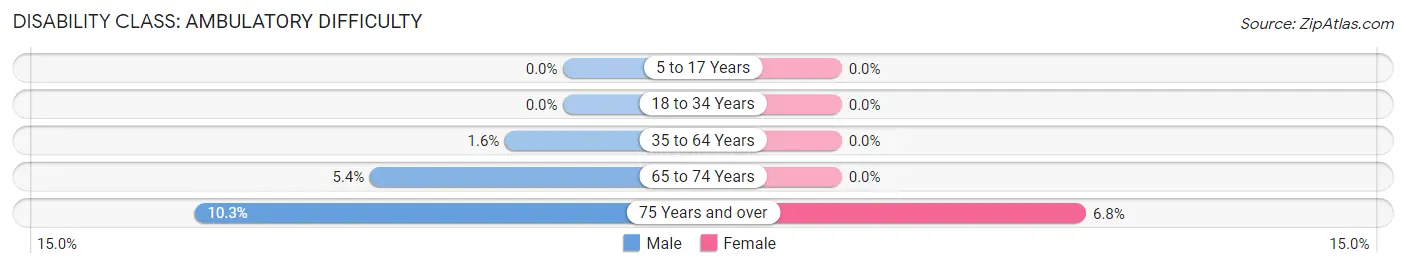
| Age Bracket | Male | Female |
| 5 to 17 Years | 0 (0.0%) | 0 (0.0%) |
| 18 to 34 Years | 0 (0.0%) | 0 (0.0%) |
| 35 to 64 Years | 11 (1.6%) | 0 (0.0%) |
| 65 to 74 Years | 15 (5.4%) | 0 (0.0%) |
| 75 Years and over | 15 (10.3%) | 10 (6.8%) |
Disability Class: Self-Care Difficulty
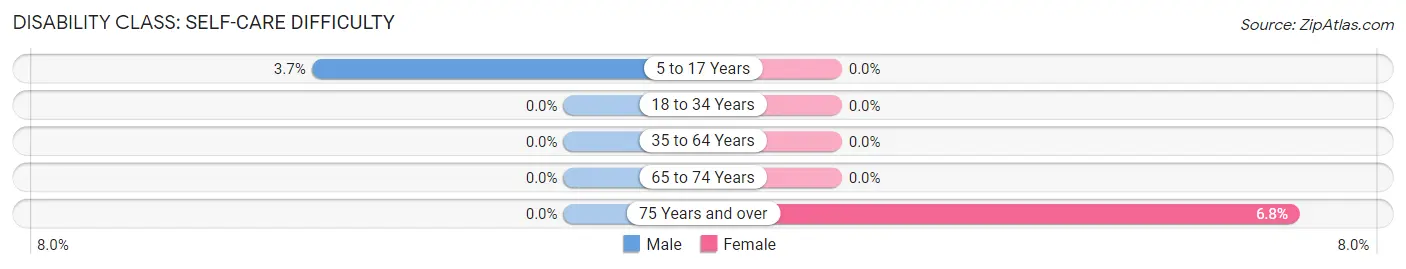
| Age Bracket | Male | Female |
| 5 to 17 Years | 12 (3.7%) | 0 (0.0%) |
| 18 to 34 Years | 0 (0.0%) | 0 (0.0%) |
| 35 to 64 Years | 0 (0.0%) | 0 (0.0%) |
| 65 to 74 Years | 0 (0.0%) | 0 (0.0%) |
| 75 Years and over | 0 (0.0%) | 10 (6.8%) |
Technology Access in West Lake Hills
Computing Device Access in West Lake Hills
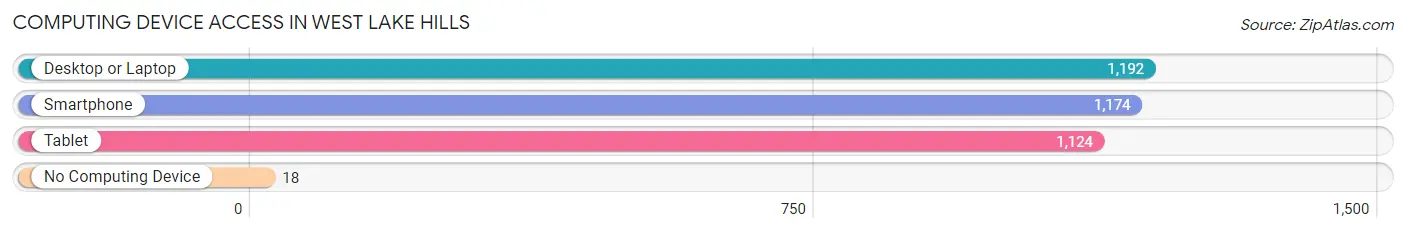
| Device Type | # Households | % Households |
| Desktop or Laptop | 1,192 | 96.6% |
| Smartphone | 1,174 | 95.1% |
| Tablet | 1,124 | 91.1% |
| No Computing Device | 18 | 1.5% |
| Total | 1,234 | 100.0% |
Internet Access in West Lake Hills
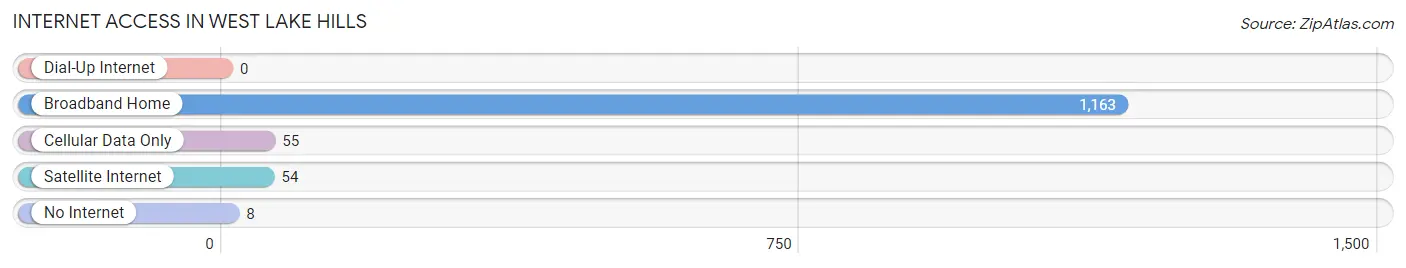
| Internet Type | # Households | % Households |
| Dial-Up Internet | 0 | 0.0% |
| Broadband Home | 1,163 | 94.3% |
| Cellular Data Only | 55 | 4.5% |
| Satellite Internet | 54 | 4.4% |
| No Internet | 8 | 0.6% |
| Total | 1,234 | 100.0% |
West Lake Hills Summary
History
West Lake Hills is a city located in Travis County, Texas, United States. It is a suburb of Austin, the state capital. The population was 3,063 at the 2010 census.
West Lake Hills was originally part of the Austin area, but was annexed by the City of Austin in the late 1950s. The area was known as Westlake until the early 1990s, when it was incorporated as a city. The city was named after the nearby West Lake, which is now part of the City of Austin.
The area was originally inhabited by the Tonkawa Native American tribe. The first settlers in the area were German immigrants who arrived in the late 1800s. The area was primarily used for ranching and farming until the 1950s, when the population began to grow rapidly due to the influx of people moving to Austin for work.
The city was officially incorporated in 1993 and has since grown to become one of the most affluent suburbs of Austin. The city is known for its high quality of life, excellent schools, and beautiful natural surroundings.
Geography
West Lake Hills is located in Travis County, Texas, United States. It is a suburb of Austin, the state capital. The city is located in the Hill Country region of Central Texas, and is situated on the western edge of the Edwards Plateau.
The city is bordered by the City of Austin to the east, the City of Rollingwood to the south, and the City of Bee Cave to the west. The city is located approximately 15 miles (24 km) west of downtown Austin.
The terrain of West Lake Hills is hilly and rugged, with elevations ranging from 500 to 1,000 feet (150 to 300 m). The city is located in the Barton Creek watershed, and is home to several creeks and streams, including Barton Creek, Bull Creek, and West Lake Creek.
Economy
West Lake Hills is a wealthy suburb of Austin, and the city’s economy is largely based on the service industry. The city is home to several large employers, including Dell, Apple, and IBM. The city is also home to several small businesses, including restaurants, retail stores, and professional services.
The city’s median household income is $133,945, which is significantly higher than the national median of $60,336. The city’s unemployment rate is 2.7%, which is lower than the national average of 3.7%.
Demographics
As of the 2010 census, there were 3,063 people, 1,093 households, and 890 families residing in the city. The population density was 1,845.3 people per square mile (711.7/km2). There were 1,164 housing units at an average density of 709.3 per square mile (273.9/km2).
The racial makeup of the city was 92.2% White, 1.3% African American, 0.2% Native American, 4.2% Asian, 0.1% Pacific Islander, 0.7% from other races, and 1.4% from two or more races. Hispanic or Latino of any race were 4.2% of the population.
The median age in the city was 44.2 years. 22.2% of residents were under the age of 18; 5.2% were between the ages of 18 and 24; 22.7% were from 25 to 44; 33.2% were from 45 to 64; and 16.7% were 65 years of age or older. The gender makeup of the city was 48.2% male and 51.8% female.
Conclusion
West Lake Hills is a city located in Travis County, Texas, United States. It is a suburb of Austin, the state capital. The city was originally part of the Austin area, but was annexed by the City of Austin in the late 1950s. The city is known for its high quality of life, excellent schools, and beautiful natural surroundings. The city’s economy is largely based on the service industry, and the city’s median household income is significantly higher than the national median. The population of West Lake Hills is diverse, with a majority of the population being White, followed by Asian, African American, and Hispanic or Latino.
Common Questions
What is Per Capita Income in West Lake Hills?
Per Capita income in West Lake Hills is $105,273.
What is the Median Family Income in West Lake Hills?
Median Family Income in West Lake Hills is $231,528.
What is the Median Household income in West Lake Hills?
Median Household Income in West Lake Hills is $210,000.
What is Income or Wage Gap in West Lake Hills?
Income or Wage Gap in West Lake Hills is 39.6%.
Women in West Lake Hills earn 60.4 cents for every dollar earned by a man.
What is Inequality or Gini Index in West Lake Hills?
Inequality or Gini Index in West Lake Hills is 0.47.
What is the Total Population of West Lake Hills?
Total Population of West Lake Hills is 3,360.
What is the Total Male Population of West Lake Hills?
Total Male Population of West Lake Hills is 1,600.
What is the Total Female Population of West Lake Hills?
Total Female Population of West Lake Hills is 1,760.
What is the Ratio of Males per 100 Females in West Lake Hills?
There are 90.91 Males per 100 Females in West Lake Hills.
What is the Ratio of Females per 100 Males in West Lake Hills?
There are 110.00 Females per 100 Males in West Lake Hills.
What is the Median Population Age in West Lake Hills?
Median Population Age in West Lake Hills is 49.7 Years.
What is the Average Family Size in West Lake Hills
Average Family Size in West Lake Hills is 3.0 People.
What is the Average Household Size in West Lake Hills
Average Household Size in West Lake Hills is 2.7 People.
How Large is the Labor Force in West Lake Hills?
There are 1,366 People in the Labor Forcein in West Lake Hills.
What is the Percentage of People in the Labor Force in West Lake Hills?
51.4% of People are in the Labor Force in West Lake Hills.
What is the Unemployment Rate in West Lake Hills?
Unemployment Rate in West Lake Hills is 4.5%.