Pittman, FL Map & Demographics
Pittman Map
Pittman Overview
$41,320
PER CAPITA INCOME
$59,048
AVG FAMILY INCOME
$58,571
AVG HOUSEHOLD INCOME
0.55
INEQUALITY / GINI INDEX
214
TOTAL POPULATION
157
MALE POPULATION
57
FEMALE POPULATION
275.44
MALES / 100 FEMALES
36.31
FEMALES / 100 MALES
57.7
MEDIAN AGE
2.5
AVG FAMILY SIZE
2.4
AVG HOUSEHOLD SIZE
46
LABOR FORCE [ PEOPLE ]
23.8%
PERCENT IN LABOR FORCE
Income in Pittman
Income Overview in Pittman
Per Capita Income in Pittman is $41,320, while median incomes of families and households are $59,048 and $58,571 respectively.
| Characteristic | Number | Measure |
| Per Capita Income | 214 | $41,320 |
| Median Family Income | 82 | $59,048 |
| Mean Family Income | 82 | $101,895 |
| Median Household Income | 90 | $58,571 |
| Mean Household Income | 90 | $96,822 |
| Income Deficit | 82 | $0 |
| Wage / Income Gap (%) | 214 | 0.00% |
| Wage / Income Gap ($) | 214 | 100.00¢ per $1 |
| Gini / Inequality Index | 214 | 0.55 |
Earnings by Sex in Pittman
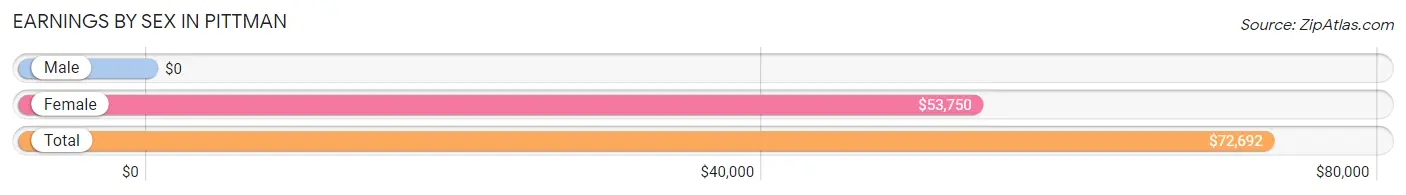
| Sex | Number | Average Earnings |
| Male | 27 (58.7%) | $0 |
| Female | 19 (41.3%) | $53,750 |
| Total | 46 (100.0%) | $72,692 |
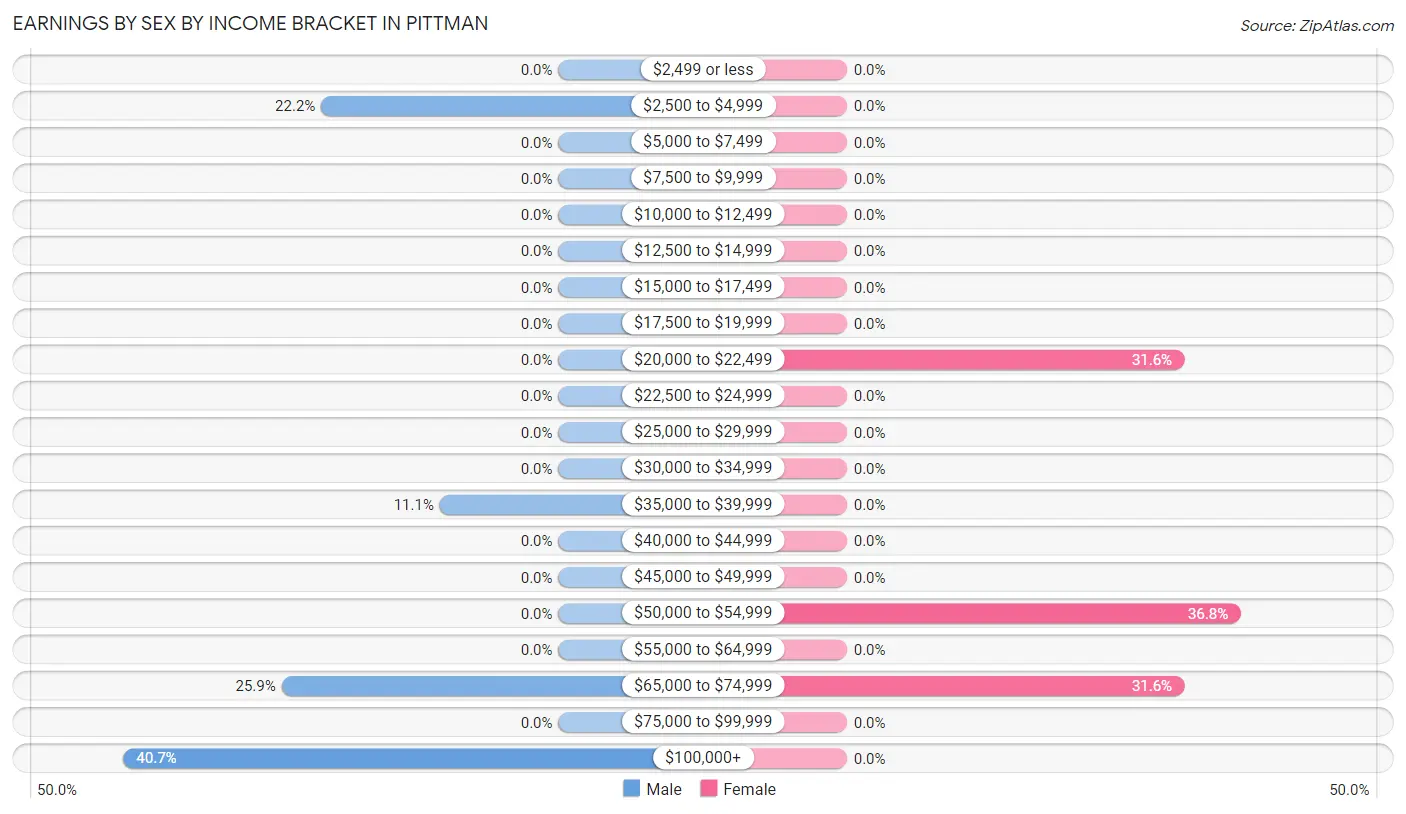
Earnings by Sex by Income Bracket in Pittman
The most common earnings brackets in Pittman are $100,000+ for men (11 | 40.7%) and $50,000 to $54,999 for women (7 | 36.8%).
| Income | Male | Female |
| $2,499 or less | 0 (0.0%) | 0 (0.0%) |
| $2,500 to $4,999 | 6 (22.2%) | 0 (0.0%) |
| $5,000 to $7,499 | 0 (0.0%) | 0 (0.0%) |
| $7,500 to $9,999 | 0 (0.0%) | 0 (0.0%) |
| $10,000 to $12,499 | 0 (0.0%) | 0 (0.0%) |
| $12,500 to $14,999 | 0 (0.0%) | 0 (0.0%) |
| $15,000 to $17,499 | 0 (0.0%) | 0 (0.0%) |
| $17,500 to $19,999 | 0 (0.0%) | 0 (0.0%) |
| $20,000 to $22,499 | 0 (0.0%) | 6 (31.6%) |
| $22,500 to $24,999 | 0 (0.0%) | 0 (0.0%) |
| $25,000 to $29,999 | 0 (0.0%) | 0 (0.0%) |
| $30,000 to $34,999 | 0 (0.0%) | 0 (0.0%) |
| $35,000 to $39,999 | 3 (11.1%) | 0 (0.0%) |
| $40,000 to $44,999 | 0 (0.0%) | 0 (0.0%) |
| $45,000 to $49,999 | 0 (0.0%) | 0 (0.0%) |
| $50,000 to $54,999 | 0 (0.0%) | 7 (36.8%) |
| $55,000 to $64,999 | 0 (0.0%) | 0 (0.0%) |
| $65,000 to $74,999 | 7 (25.9%) | 6 (31.6%) |
| $75,000 to $99,999 | 0 (0.0%) | 0 (0.0%) |
| $100,000+ | 11 (40.7%) | 0 (0.0%) |
| Total | 27 (100.0%) | 19 (100.0%) |
Earnings by Sex by Educational Attainment in Pittman
| Educational Attainment | Male Income | Female Income |
| Less than High School | - | - |
| High School Diploma | - | - |
| College or Associate's Degree | - | - |
| Bachelor's Degree | - | - |
| Graduate Degree | - | - |
| Total | - | - |
Family Income in Pittman
Family Income Brackets in Pittman
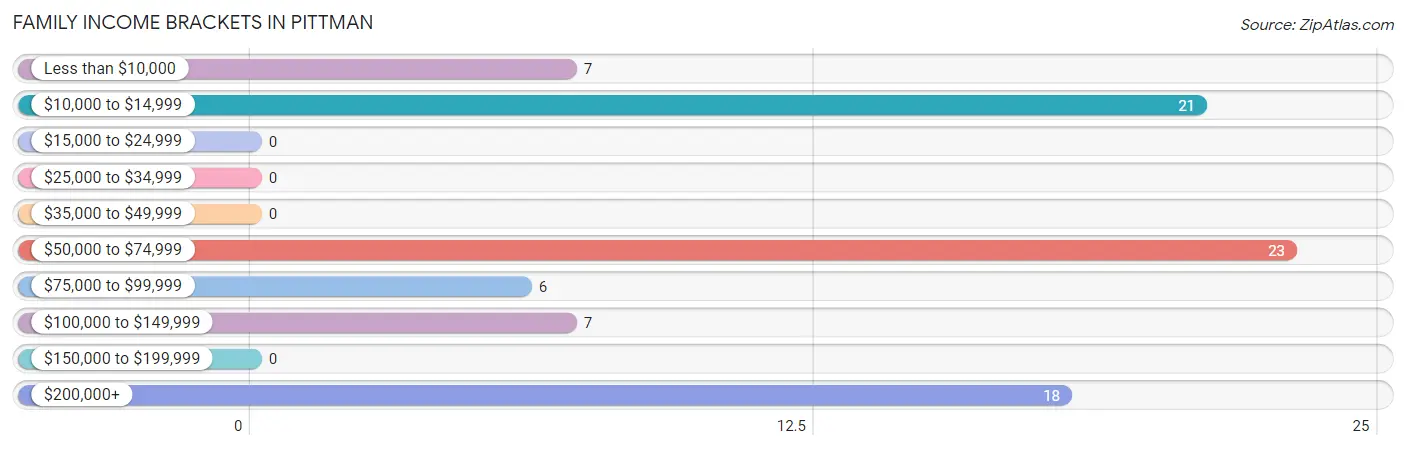
According to the Pittman family income data, there are 23 families falling into the $50,000 to $74,999 income range, which is the most common income bracket and makes up 28.1% of all families.
| Income Bracket | # Families | % Families |
| Less than $10,000 | 7 | 8.5% |
| $10,000 to $14,999 | 21 | 25.6% |
| $15,000 to $24,999 | 0 | 0.0% |
| $25,000 to $34,999 | 0 | 0.0% |
| $35,000 to $49,999 | 0 | 0.0% |
| $50,000 to $74,999 | 23 | 28.0% |
| $75,000 to $99,999 | 6 | 7.3% |
| $100,000 to $149,999 | 7 | 8.5% |
| $150,000 to $199,999 | 0 | 0.0% |
| $200,000+ | 18 | 22.0% |
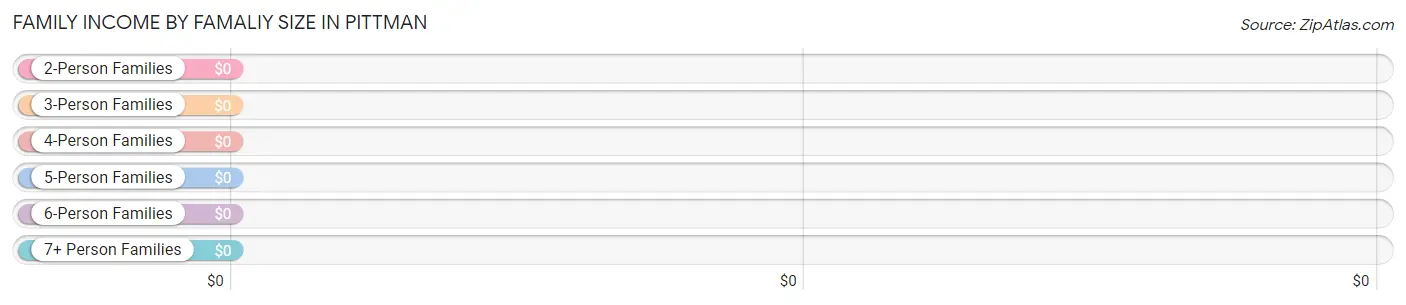
Family Income by Famaliy Size in Pittman
| Income Bracket | # Families | Median Income |
| 2-Person Families | 61 (74.4%) | $0 |
| 3-Person Families | 21 (25.6%) | $0 |
| 4-Person Families | 0 (0.0%) | $0 |
| 5-Person Families | 0 (0.0%) | $0 |
| 6-Person Families | 0 (0.0%) | $0 |
| 7+ Person Families | 0 (0.0%) | $0 |
| Total | 82 (100.0%) | $59,048 |
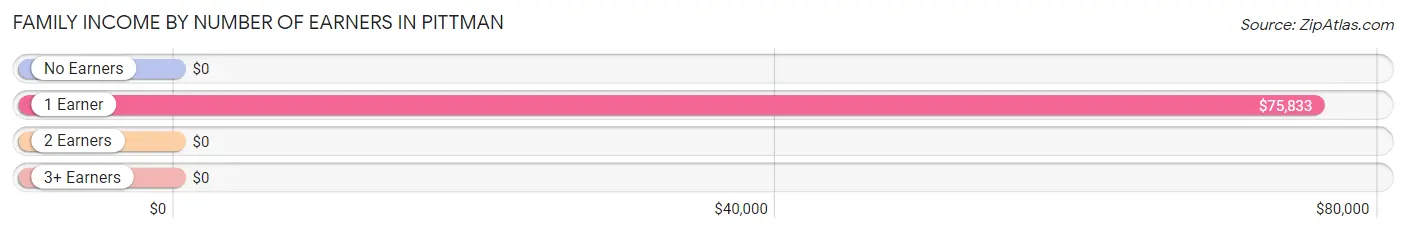
Family Income by Number of Earners in Pittman
| Number of Earners | # Families | Median Income |
| No Earners | 49 (59.8%) | $0 |
| 1 Earner | 22 (26.8%) | $75,833 |
| 2 Earners | 11 (13.4%) | $0 |
| 3+ Earners | 0 (0.0%) | $0 |
| Total | 82 (100.0%) | $59,048 |
Household Income in Pittman
Household Income Brackets in Pittman
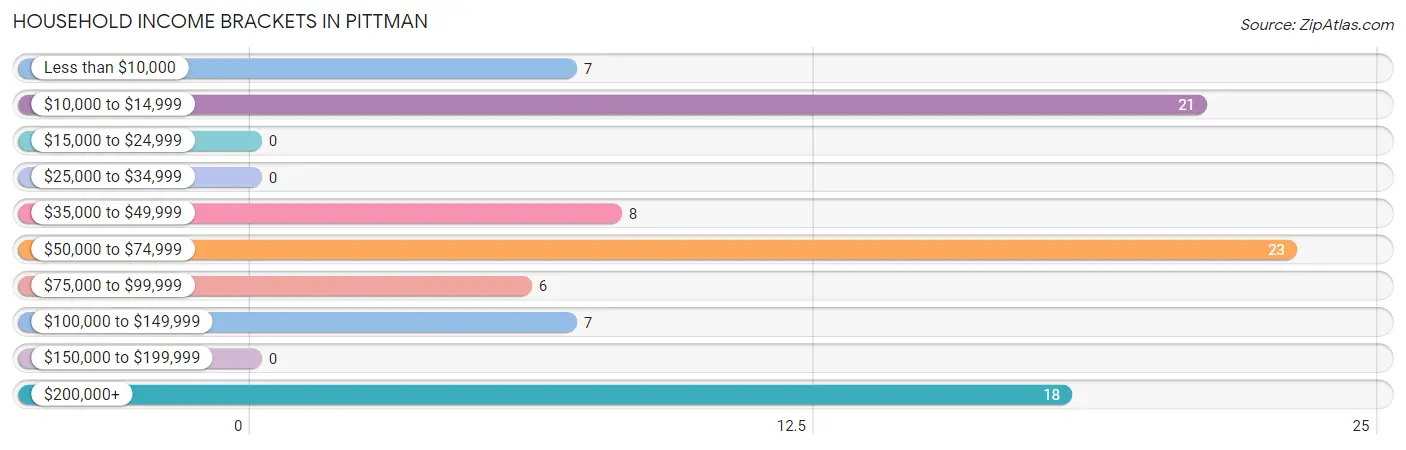
With 23 households falling in the category, the $50,000 to $74,999 income range is the most frequent in Pittman, accounting for 25.6% of all households.
| Income Bracket | # Households | % Households |
| Less than $10,000 | 7 | 7.8% |
| $10,000 to $14,999 | 21 | 23.3% |
| $15,000 to $24,999 | 0 | 0.0% |
| $25,000 to $34,999 | 0 | 0.0% |
| $35,000 to $49,999 | 8 | 8.9% |
| $50,000 to $74,999 | 23 | 25.6% |
| $75,000 to $99,999 | 6 | 6.7% |
| $100,000 to $149,999 | 7 | 7.8% |
| $150,000 to $199,999 | 0 | 0.0% |
| $200,000+ | 18 | 20.0% |
Household Income by Householder Age in Pittman
The median household income in Pittman is $58,571, with the highest median household income of $59,464 found in the 65+ years age bracket for the primary householder. A total of 63 households (70.0%) fall into this category. Meanwhile, the 15 to 24 years age bracket for the primary householder has the lowest median household income of $0, with 21 households (23.3%) in this group.
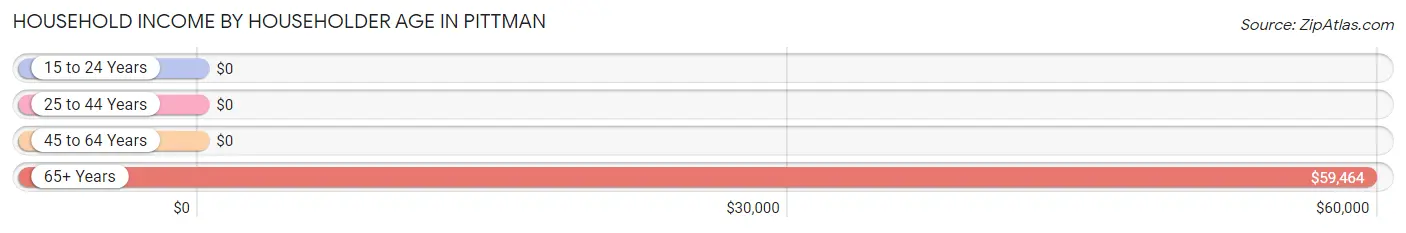
| Income Bracket | # Households | Median Income |
| 15 to 24 Years | 21 (23.3%) | $0 |
| 25 to 44 Years | 0 (0.0%) | $0 |
| 45 to 64 Years | 6 (6.7%) | $0 |
| 65+ Years | 63 (70.0%) | $59,464 |
| Total | 90 (100.0%) | $58,571 |
Poverty in Pittman
Income Below Poverty by Sex and Age in Pittman
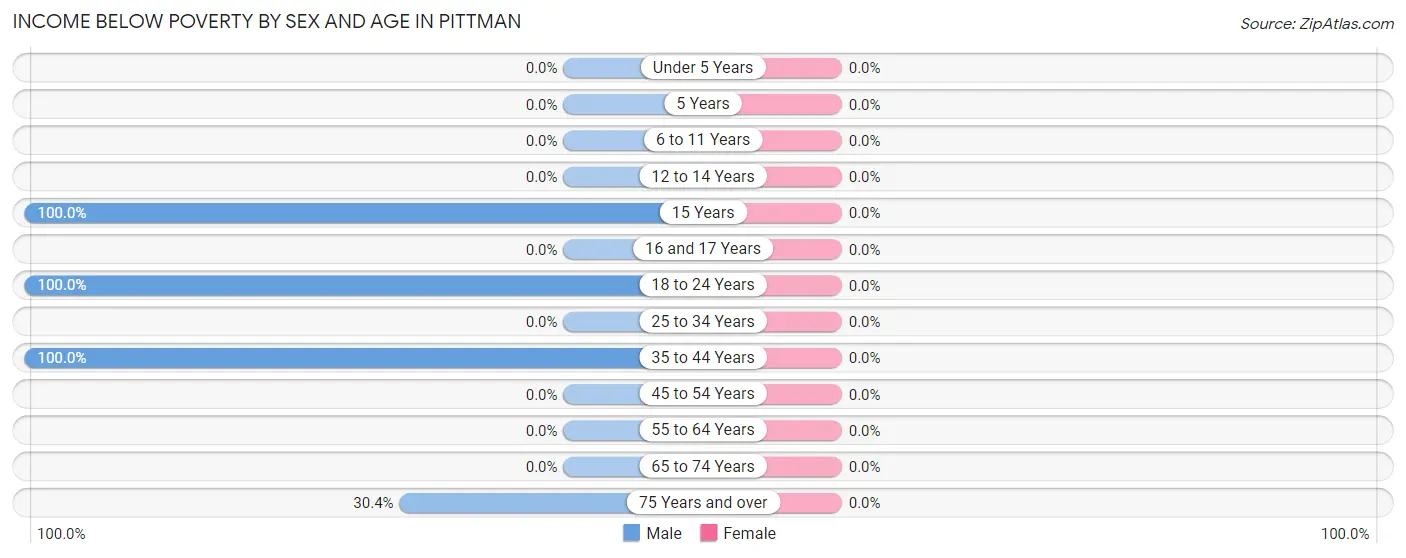
| Age Bracket | Male | Female |
| Under 5 Years | 0 (0.0%) | 0 (0.0%) |
| 5 Years | 0 (0.0%) | 0 (0.0%) |
| 6 to 11 Years | 0 (0.0%) | 0 (0.0%) |
| 12 to 14 Years | 0 (0.0%) | 0 (0.0%) |
| 15 Years | 21 (100.0%) | 0 (0.0%) |
| 16 and 17 Years | 0 (0.0%) | 0 (0.0%) |
| 18 to 24 Years | 66 (100.0%) | 0 (0.0%) |
| 25 to 34 Years | 0 (0.0%) | 0 (0.0%) |
| 35 to 44 Years | 6 (100.0%) | 0 (0.0%) |
| 45 to 54 Years | 0 (0.0%) | 0 (0.0%) |
| 55 to 64 Years | 0 (0.0%) | 0 (0.0%) |
| 65 to 74 Years | 0 (0.0%) | 0 (0.0%) |
| 75 Years and over | 7 (30.4%) | 0 (0.0%) |
| Total | 100 (63.7%) | 0 (0.0%) |
Income Above Poverty by Sex and Age in Pittman
According to the poverty statistics in Pittman, males aged 25 to 34 years and females aged 45 to 54 years are the age groups that are most secure financially, with 100.0% of males and 100.0% of females in these age groups living above the poverty line.
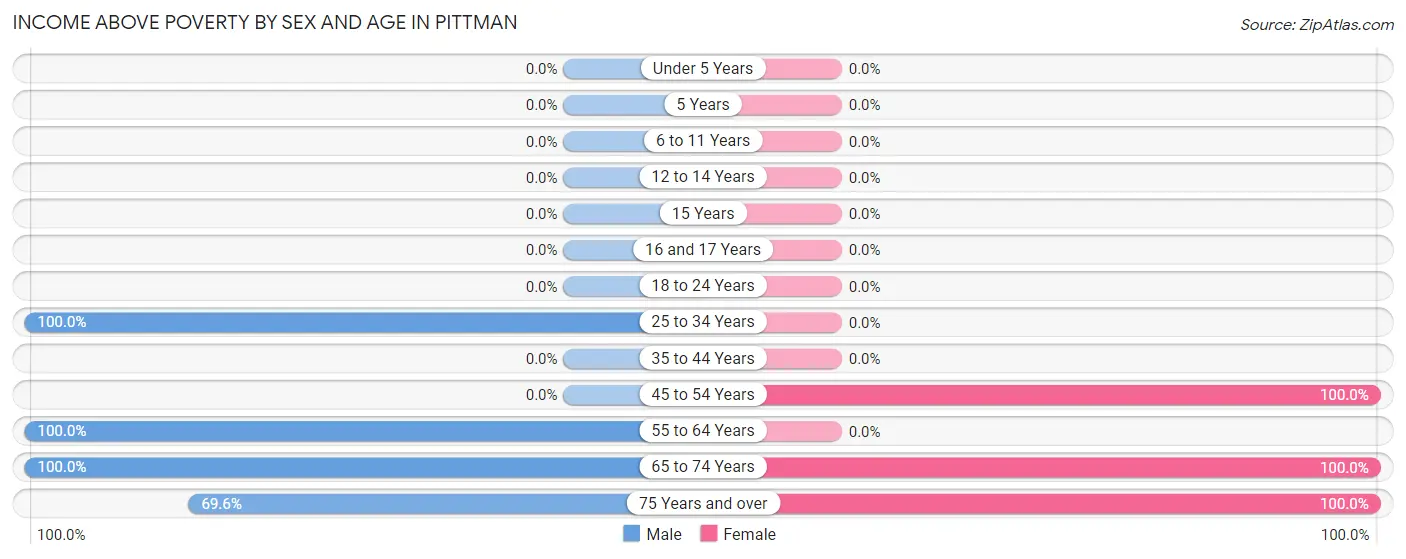
| Age Bracket | Male | Female |
| Under 5 Years | 0 (0.0%) | 0 (0.0%) |
| 5 Years | 0 (0.0%) | 0 (0.0%) |
| 6 to 11 Years | 0 (0.0%) | 0 (0.0%) |
| 12 to 14 Years | 0 (0.0%) | 0 (0.0%) |
| 15 Years | 0 (0.0%) | 0 (0.0%) |
| 16 and 17 Years | 0 (0.0%) | 0 (0.0%) |
| 18 to 24 Years | 0 (0.0%) | 0 (0.0%) |
| 25 to 34 Years | 3 (100.0%) | 0 (0.0%) |
| 35 to 44 Years | 0 (0.0%) | 0 (0.0%) |
| 45 to 54 Years | 0 (0.0%) | 7 (100.0%) |
| 55 to 64 Years | 6 (100.0%) | 0 (0.0%) |
| 65 to 74 Years | 32 (100.0%) | 42 (100.0%) |
| 75 Years and over | 16 (69.6%) | 8 (100.0%) |
| Total | 57 (36.3%) | 57 (100.0%) |
Income Below Poverty Among Married-Couple Families in Pittman
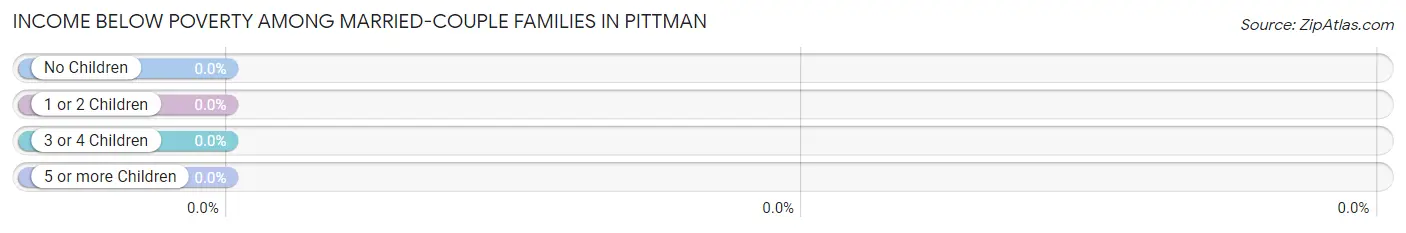
| Children | Above Poverty | Below Poverty |
| No Children | 52 (100.0%) | 0 (0.0%) |
| 1 or 2 Children | 0 (0.0%) | 0 (0.0%) |
| 3 or 4 Children | 0 (0.0%) | 0 (0.0%) |
| 5 or more Children | 0 (0.0%) | 0 (0.0%) |
| Total | 52 (100.0%) | 0 (0.0%) |
Income Below Poverty Among Single-Parent Households in Pittman
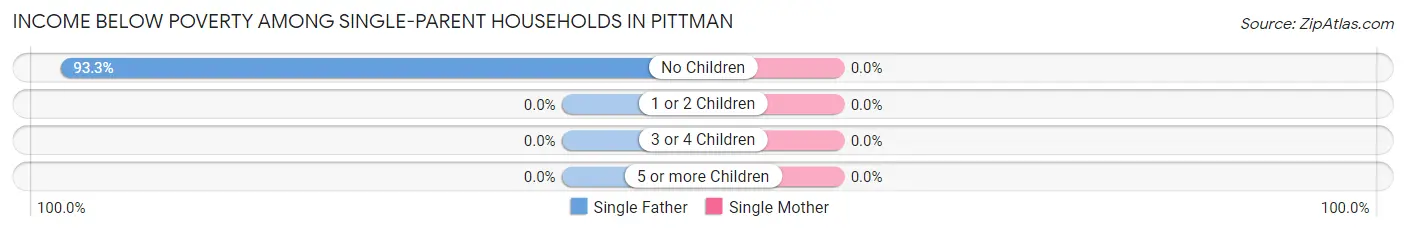
| Children | Single Father | Single Mother |
| No Children | 28 (93.3%) | 0 (0.0%) |
| 1 or 2 Children | 0 (0.0%) | 0 (0.0%) |
| 3 or 4 Children | 0 (0.0%) | 0 (0.0%) |
| 5 or more Children | 0 (0.0%) | 0 (0.0%) |
| Total | 28 (93.3%) | 0 (0.0%) |
Income Below Poverty Among Married-Couple vs Single-Parent Households in Pittman
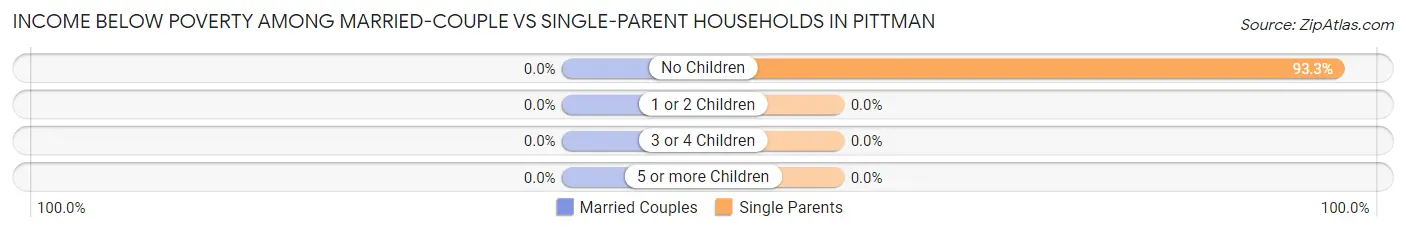
| Children | Married-Couple Families | Single-Parent Households |
| No Children | 0 (0.0%) | 28 (93.3%) |
| 1 or 2 Children | 0 (0.0%) | 0 (0.0%) |
| 3 or 4 Children | 0 (0.0%) | 0 (0.0%) |
| 5 or more Children | 0 (0.0%) | 0 (0.0%) |
| Total | 0 (0.0%) | 28 (93.3%) |
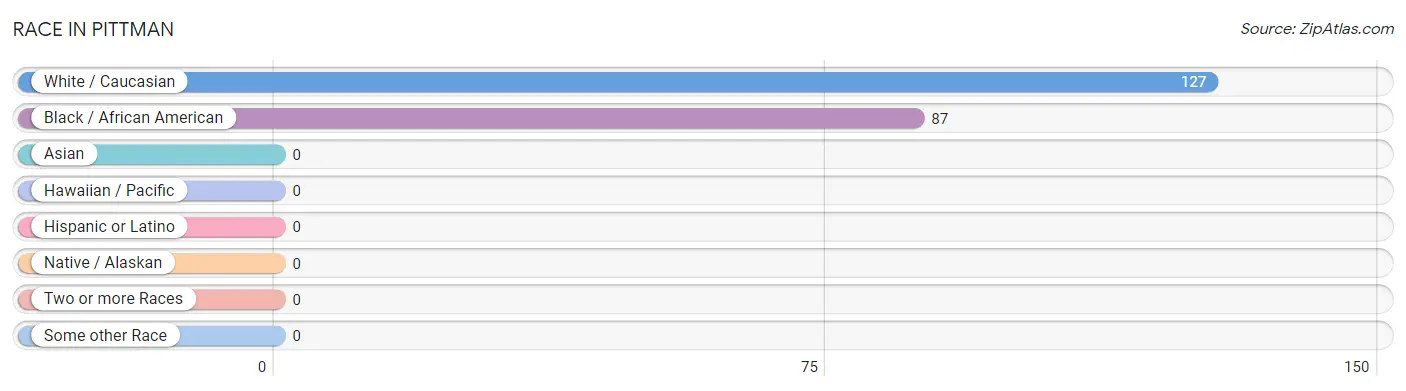
Race in Pittman
The most populous races in Pittman are White / Caucasian (127 | 59.4%), and Black / African American (87 | 40.6%).
| Race | # Population | % Population |
| Asian | 0 | 0.0% |
| Black / African American | 87 | 40.6% |
| Hawaiian / Pacific | 0 | 0.0% |
| Hispanic or Latino | 0 | 0.0% |
| Native / Alaskan | 0 | 0.0% |
| White / Caucasian | 127 | 59.4% |
| Two or more Races | 0 | 0.0% |
| Some other Race | 0 | 0.0% |
| Total | 214 | 100.0% |
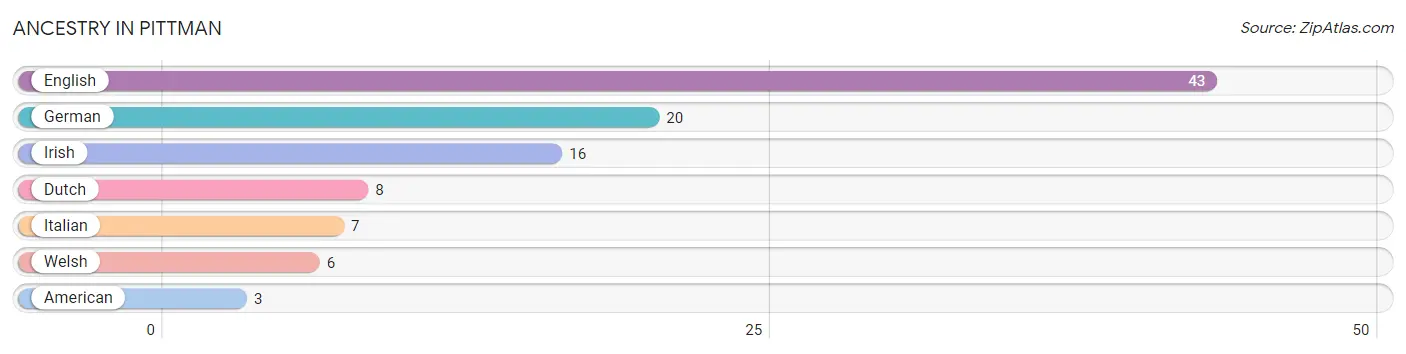
Ancestry in Pittman
The most populous ancestries reported in Pittman are English (43 | 20.1%), German (20 | 9.3%), Irish (16 | 7.5%), Dutch (8 | 3.7%), and Italian (7 | 3.3%), together accounting for 43.9% of all Pittman residents.
| Ancestry | # Population | % Population |
| American | 3 | 1.4% |
| Dutch | 8 | 3.7% |
| English | 43 | 20.1% |
| German | 20 | 9.3% |
| Irish | 16 | 7.5% |
| Italian | 7 | 3.3% |
| Welsh | 6 | 2.8% | View All 7 Rows |
Immigrants in Pittman
The most numerous immigrant groups reported in Pittman came from Europe (7 | 3.3%), Italy (7 | 3.3%), and Southern Europe (7 | 3.3%), together accounting for 9.8% of all Pittman residents.
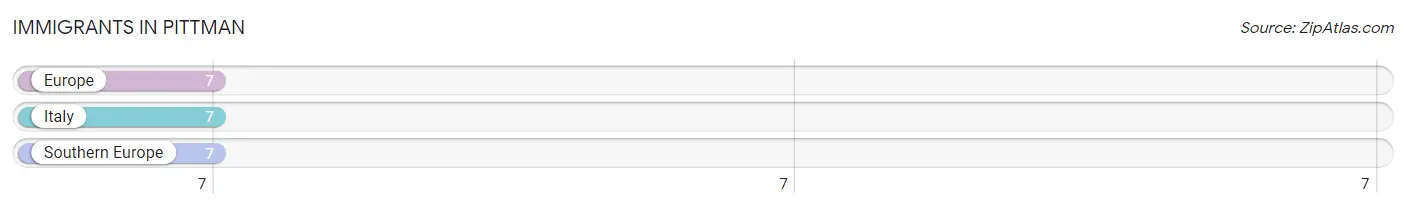
| Immigration Origin | # Population | % Population |
| Europe | 7 | 3.3% |
| Italy | 7 | 3.3% |
| Southern Europe | 7 | 3.3% | View All 3 Rows |
Sex and Age in Pittman
Sex and Age in Pittman
The most populous age groups in Pittman are 15 to 19 Years (54 | 34.4%) for men and 65 to 69 Years (26 | 45.6%) for women.
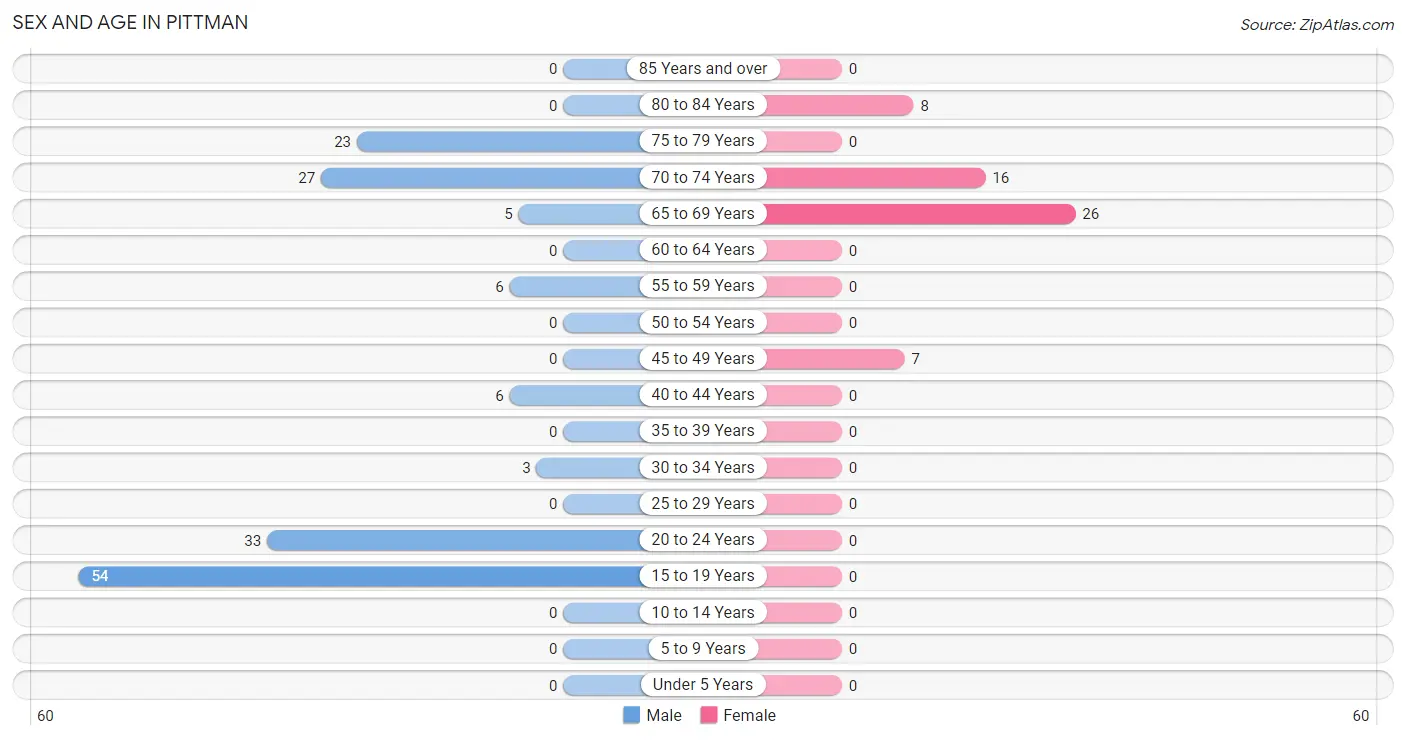
| Age Bracket | Male | Female |
| Under 5 Years | 0 (0.0%) | 0 (0.0%) |
| 5 to 9 Years | 0 (0.0%) | 0 (0.0%) |
| 10 to 14 Years | 0 (0.0%) | 0 (0.0%) |
| 15 to 19 Years | 54 (34.4%) | 0 (0.0%) |
| 20 to 24 Years | 33 (21.0%) | 0 (0.0%) |
| 25 to 29 Years | 0 (0.0%) | 0 (0.0%) |
| 30 to 34 Years | 3 (1.9%) | 0 (0.0%) |
| 35 to 39 Years | 0 (0.0%) | 0 (0.0%) |
| 40 to 44 Years | 6 (3.8%) | 0 (0.0%) |
| 45 to 49 Years | 0 (0.0%) | 7 (12.3%) |
| 50 to 54 Years | 0 (0.0%) | 0 (0.0%) |
| 55 to 59 Years | 6 (3.8%) | 0 (0.0%) |
| 60 to 64 Years | 0 (0.0%) | 0 (0.0%) |
| 65 to 69 Years | 5 (3.2%) | 26 (45.6%) |
| 70 to 74 Years | 27 (17.2%) | 16 (28.1%) |
| 75 to 79 Years | 23 (14.6%) | 0 (0.0%) |
| 80 to 84 Years | 0 (0.0%) | 8 (14.0%) |
| 85 Years and over | 0 (0.0%) | 0 (0.0%) |
| Total | 157 (100.0%) | 57 (100.0%) |
Families and Households in Pittman
Median Family Size in Pittman
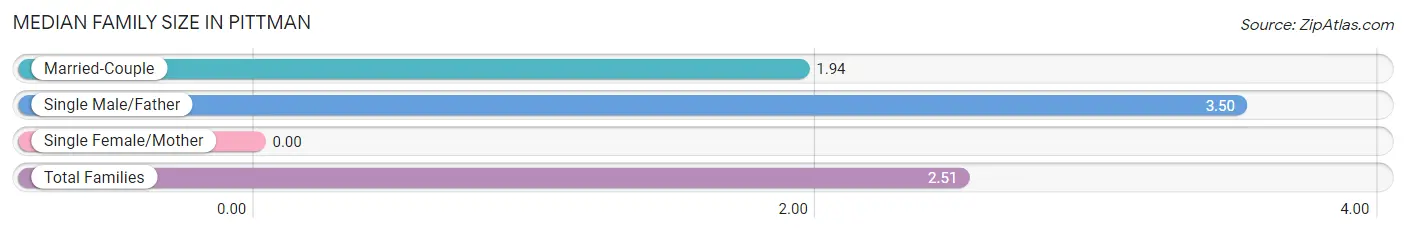
| Family Type | # Families | Family Size |
| Married-Couple | 52 (63.4%) | 1.94 |
| Single Male/Father | 30 (36.6%) | 3.50 |
| Single Female/Mother | 0 (0.0%) | - |
| Total Families | 82 (100.0%) | 2.51 |
Median Household Size in Pittman
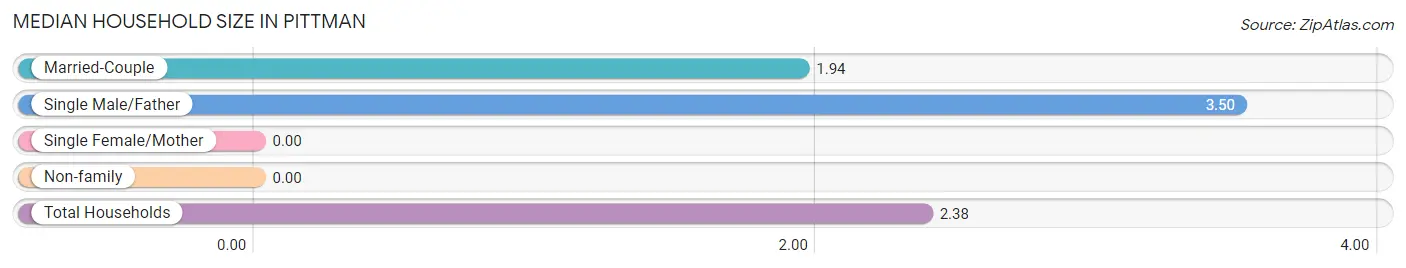
| Household Type | # Households | Household Size |
| Married-Couple | 52 (57.8%) | 1.94 |
| Single Male/Father | 30 (33.3%) | 3.50 |
| Single Female/Mother | 0 (0.0%) | - |
| Non-family | 8 (8.9%) | - |
| Total Households | 90 (100.0%) | 2.38 |
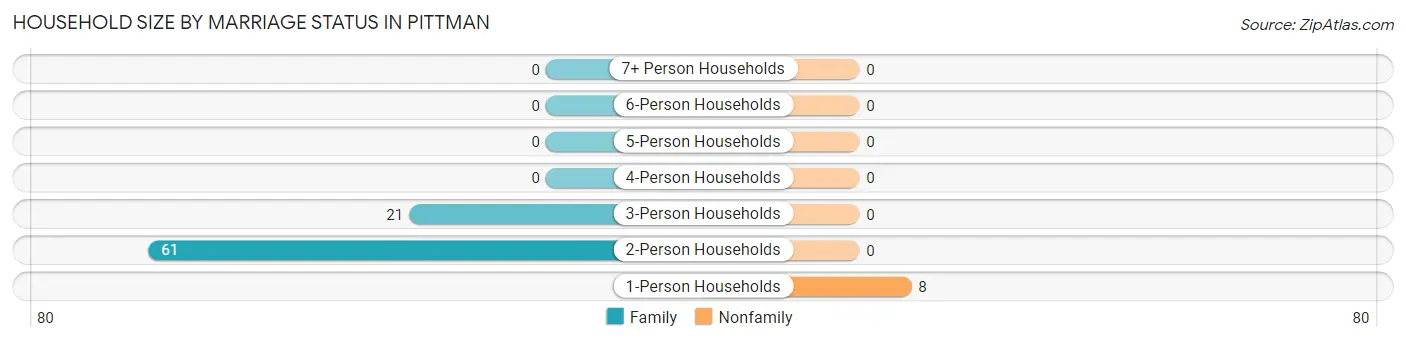
Household Size by Marriage Status in Pittman
Out of a total of 90 households in Pittman, 82 (91.1%) are family households, while 8 (8.9%) are nonfamily households. The most numerous type of family households are 2-person households, comprising 61, and the most common type of nonfamily households are 1-person households, comprising 8.
| Household Size | Family Households | Nonfamily Households |
| 1-Person Households | - | 8 (8.9%) |
| 2-Person Households | 61 (67.8%) | 0 (0.0%) |
| 3-Person Households | 21 (23.3%) | 0 (0.0%) |
| 4-Person Households | 0 (0.0%) | 0 (0.0%) |
| 5-Person Households | 0 (0.0%) | 0 (0.0%) |
| 6-Person Households | 0 (0.0%) | 0 (0.0%) |
| 7+ Person Households | 0 (0.0%) | 0 (0.0%) |
| Total | 82 (91.1%) | 8 (8.9%) |
Female Fertility in Pittman
Fertility by Age in Pittman
| Age Bracket | Women with Births | Births / 1,000 Women |
| 15 to 19 years | 0 (0.0%) | 0.0 |
| 20 to 34 years | 0 (0.0%) | 0.0 |
| 35 to 50 years | 0 (0.0%) | 0.0 |
| Total | 0 (0.0%) | 0.0 |
Fertility by Age by Marriage Status in Pittman
| Age Bracket | Married | Unmarried |
| 15 to 19 years | 0 (0.0%) | 0 (0.0%) |
| 20 to 34 years | 0 (0.0%) | 0 (0.0%) |
| 35 to 50 years | 0 (0.0%) | 0 (0.0%) |
| Total | 0 (0.0%) | 0 (0.0%) |
Fertility by Education in Pittman
| Educational Attainment | Women with Births | Births / 1,000 Women |
| Less than High School | 0 (0.0%) | 0.0 |
| High School Diploma | 0 (0.0%) | 0.0 |
| College or Associate's Degree | 0 (0.0%) | 0.0 |
| Bachelor's Degree | 0 (0.0%) | 0.0 |
| Graduate Degree | 0 (0.0%) | 0.0 |
| Total | 0 (0.0%) | 0.0 |
Fertility by Education by Marriage Status in Pittman
| Educational Attainment | Married | Unmarried |
| Less than High School | 0 (0.0%) | 0 (0.0%) |
| High School Diploma | 0 (0.0%) | 0 (0.0%) |
| College or Associate's Degree | 0 (0.0%) | 0 (0.0%) |
| Bachelor's Degree | 0 (0.0%) | 0 (0.0%) |
| Graduate Degree | 0 (0.0%) | 0 (0.0%) |
| Total | 0 (0.0%) | 0 (0.0%) |
Employment Characteristics in Pittman
Employment by Class of Employer in Pittman
Among the 46 employed individuals in Pittman, private company employees (27 | 58.7%), self-employed (incorporated) (13 | 28.3%), and local government employees (6 | 13.0%) make up the most common classes of employment.
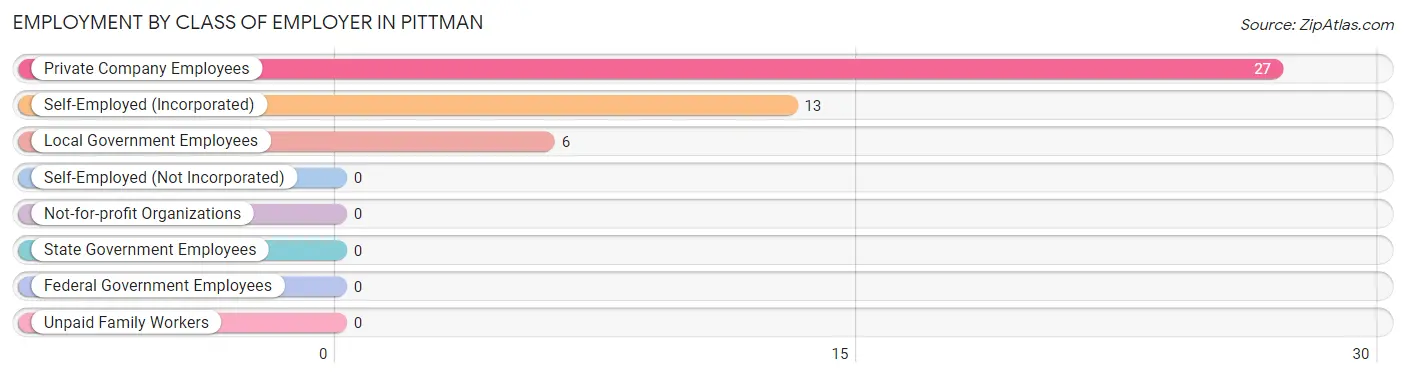
| Employer Class | # Employees | % Employees |
| Private Company Employees | 27 | 58.7% |
| Self-Employed (Incorporated) | 13 | 28.3% |
| Self-Employed (Not Incorporated) | 0 | 0.0% |
| Not-for-profit Organizations | 0 | 0.0% |
| Local Government Employees | 6 | 13.0% |
| State Government Employees | 0 | 0.0% |
| Federal Government Employees | 0 | 0.0% |
| Unpaid Family Workers | 0 | 0.0% |
| Total | 46 | 100.0% |
Employment Status by Age in Pittman

| Age Bracket | In Labor Force | Unemployed |
| 16 to 19 Years | 0 (0.0%) | 0 (0.0%) |
| 20 to 24 Years | 0 (0.0%) | 0 (0.0%) |
| 25 to 29 Years | 0 (0.0%) | 0 (0.0%) |
| 30 to 34 Years | 3 (100.0%) | 0 (0.0%) |
| 35 to 44 Years | 6 (100.0%) | 0 (0.0%) |
| 45 to 54 Years | 7 (100.0%) | 0 (0.0%) |
| 55 to 59 Years | 6 (100.0%) | 0 (0.0%) |
| 60 to 64 Years | 0 (0.0%) | 0 (0.0%) |
| 65 to 74 Years | 17 (23.0%) | 0 (0.0%) |
| 75 Years and over | 7 (22.6%) | 0 (0.0%) |
| Total | 46 (23.8%) | 0 (0.0%) |
Employment Status by Educational Attainment in Pittman
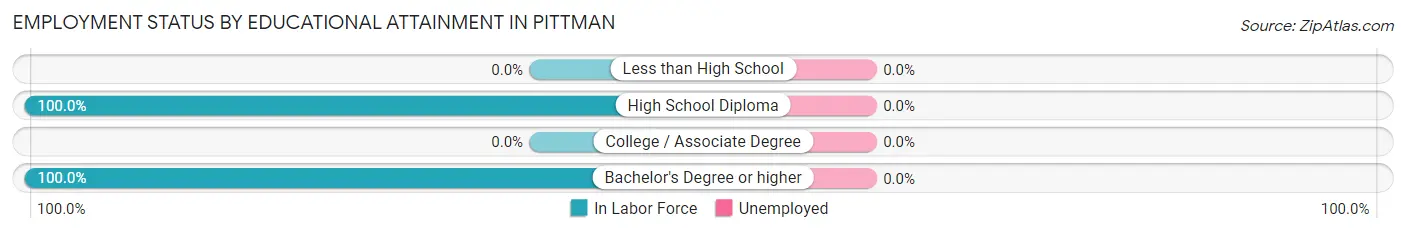
| Educational Attainment | In Labor Force | Unemployed |
| Less than High School | 0 (0.0%) | 0 (0.0%) |
| High School Diploma | 16 (100.0%) | 0 (0.0%) |
| College / Associate Degree | 0 (0.0%) | 0 (0.0%) |
| Bachelor's Degree or higher | 6 (100.0%) | 0 (0.0%) |
| Total | 22 (100.0%) | 0 (0.0%) |
Employment Occupations by Sex in Pittman
Management, Business, Science and Arts Occupations
The most common Management, Business, Science and Arts occupations in Pittman are , and Management (12 | 26.1%).
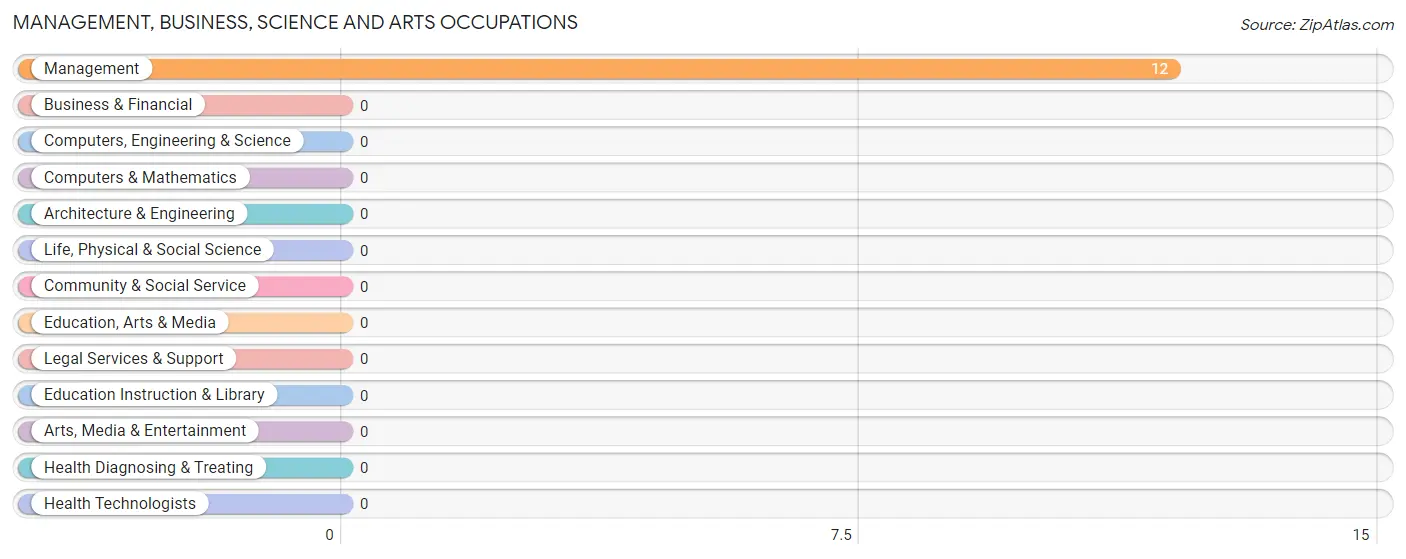
Management, Business, Science and Arts Occupations by Sex
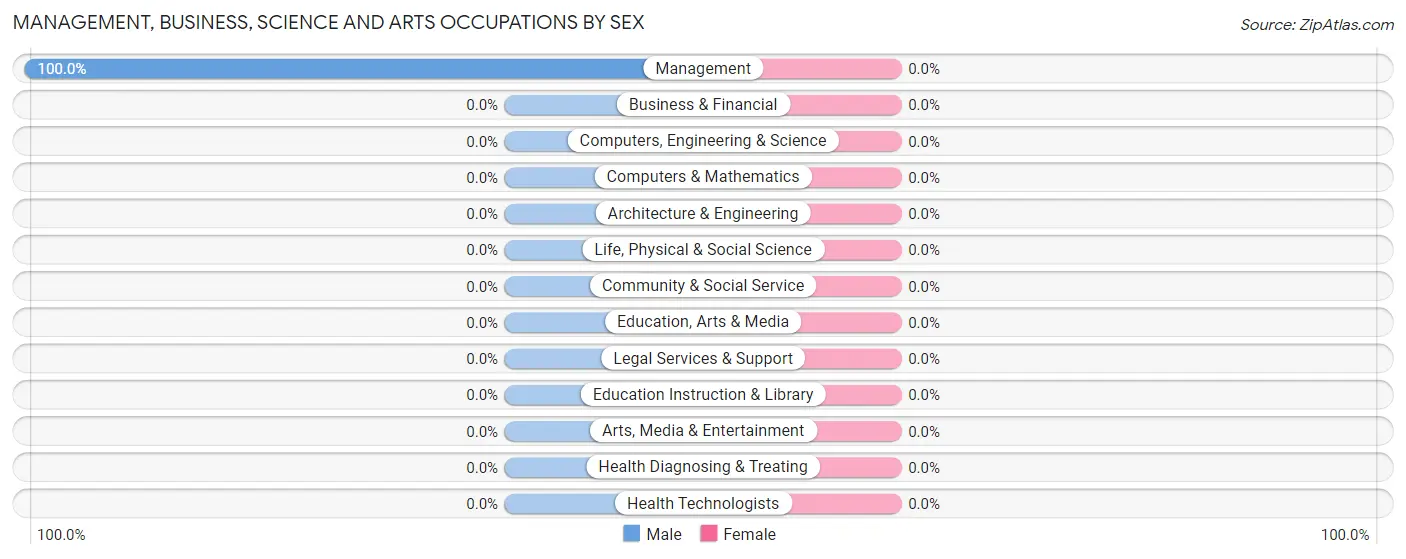
| Occupation | Male | Female |
| Management | 12 (100.0%) | 0 (0.0%) |
| Business & Financial | 0 (0.0%) | 0 (0.0%) |
| Computers, Engineering & Science | 0 (0.0%) | 0 (0.0%) |
| Computers & Mathematics | 0 (0.0%) | 0 (0.0%) |
| Architecture & Engineering | 0 (0.0%) | 0 (0.0%) |
| Life, Physical & Social Science | 0 (0.0%) | 0 (0.0%) |
| Community & Social Service | 0 (0.0%) | 0 (0.0%) |
| Education, Arts & Media | 0 (0.0%) | 0 (0.0%) |
| Legal Services & Support | 0 (0.0%) | 0 (0.0%) |
| Education Instruction & Library | 0 (0.0%) | 0 (0.0%) |
| Arts, Media & Entertainment | 0 (0.0%) | 0 (0.0%) |
| Health Diagnosing & Treating | 0 (0.0%) | 0 (0.0%) |
| Health Technologists | 0 (0.0%) | 0 (0.0%) |
| Total (Category) | 12 (100.0%) | 0 (0.0%) |
| Total (Overall) | 27 (58.7%) | 19 (41.3%) |
Services Occupations
Services Occupations by Sex
| Occupation | Male | Female |
| Healthcare Support | 0 (0.0%) | 0 (0.0%) |
| Security & Protection | 0 (0.0%) | 0 (0.0%) |
| Firefighting & Prevention | 0 (0.0%) | 0 (0.0%) |
| Law Enforcement | 0 (0.0%) | 0 (0.0%) |
| Food Preparation & Serving | 0 (0.0%) | 0 (0.0%) |
| Cleaning & Maintenance | 0 (0.0%) | 0 (0.0%) |
| Personal Care & Service | 0 (0.0%) | 0 (0.0%) |
| Total (Category) | 0 (0.0%) | 0 (0.0%) |
| Total (Overall) | 27 (58.7%) | 19 (41.3%) |
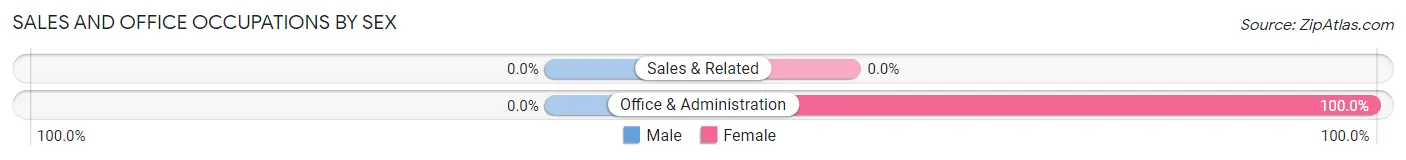
Sales and Office Occupations
The most common Sales and Office occupations in Pittman are , and Office & Administration (12 | 26.1%).
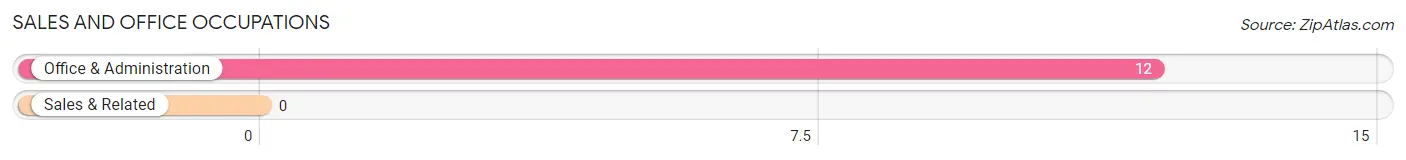
Sales and Office Occupations by Sex
| Occupation | Male | Female |
| Sales & Related | 0 (0.0%) | 0 (0.0%) |
| Office & Administration | 0 (0.0%) | 12 (100.0%) |
| Total (Category) | 0 (0.0%) | 12 (100.0%) |
| Total (Overall) | 27 (58.7%) | 19 (41.3%) |
Natural Resources, Construction and Maintenance Occupations
The most common Natural Resources, Construction and Maintenance occupations in Pittman are , and Installation, Maintenance & Repair (6 | 13.0%).
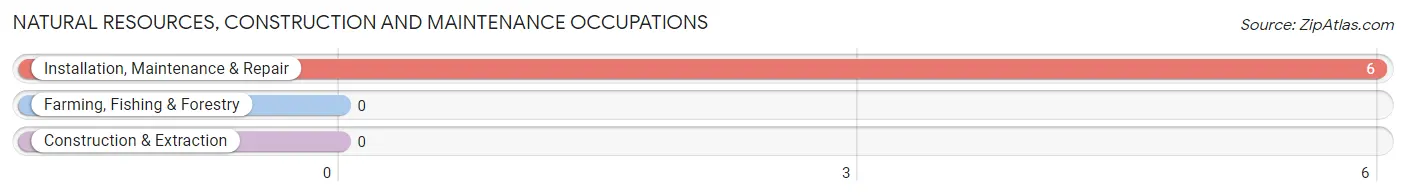
Natural Resources, Construction and Maintenance Occupations by Sex
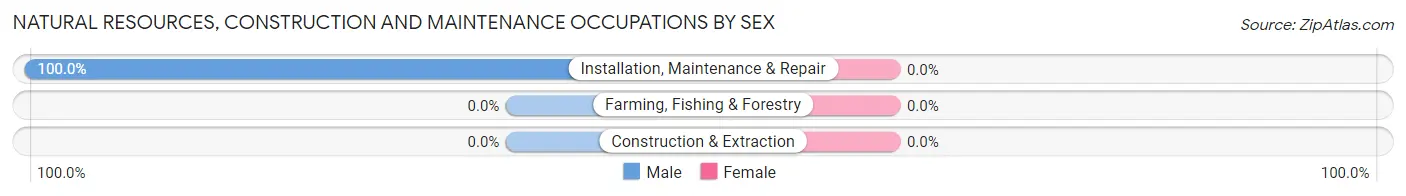
| Occupation | Male | Female |
| Farming, Fishing & Forestry | 0 (0.0%) | 0 (0.0%) |
| Construction & Extraction | 0 (0.0%) | 0 (0.0%) |
| Installation, Maintenance & Repair | 6 (100.0%) | 0 (0.0%) |
| Total (Category) | 6 (100.0%) | 0 (0.0%) |
| Total (Overall) | 27 (58.7%) | 19 (41.3%) |
Production, Transportation and Moving Occupations
The most common Production, Transportation and Moving occupations in Pittman are Transportation (13 | 28.3%), and Production (3 | 6.5%).
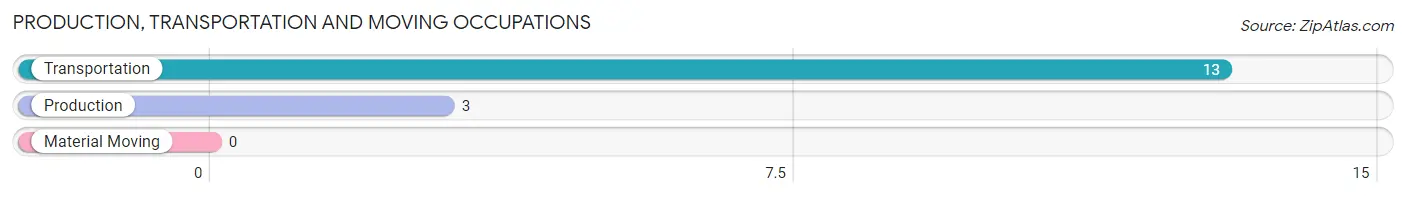
Production, Transportation and Moving Occupations by Sex
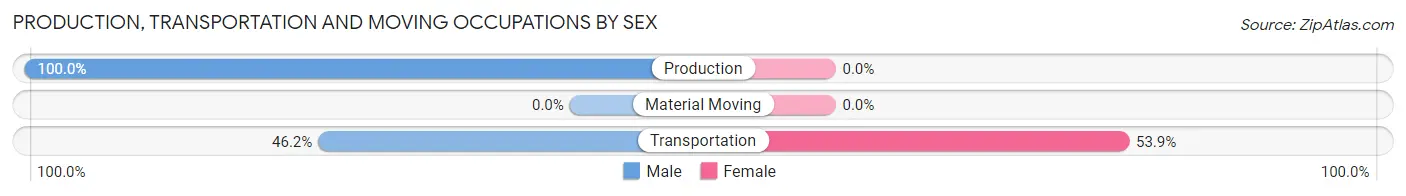
| Occupation | Male | Female |
| Production | 3 (100.0%) | 0 (0.0%) |
| Transportation | 6 (46.2%) | 7 (53.8%) |
| Material Moving | 0 (0.0%) | 0 (0.0%) |
| Total (Category) | 9 (56.2%) | 7 (43.8%) |
| Total (Overall) | 27 (58.7%) | 19 (41.3%) |
Employment Industries by Sex in Pittman
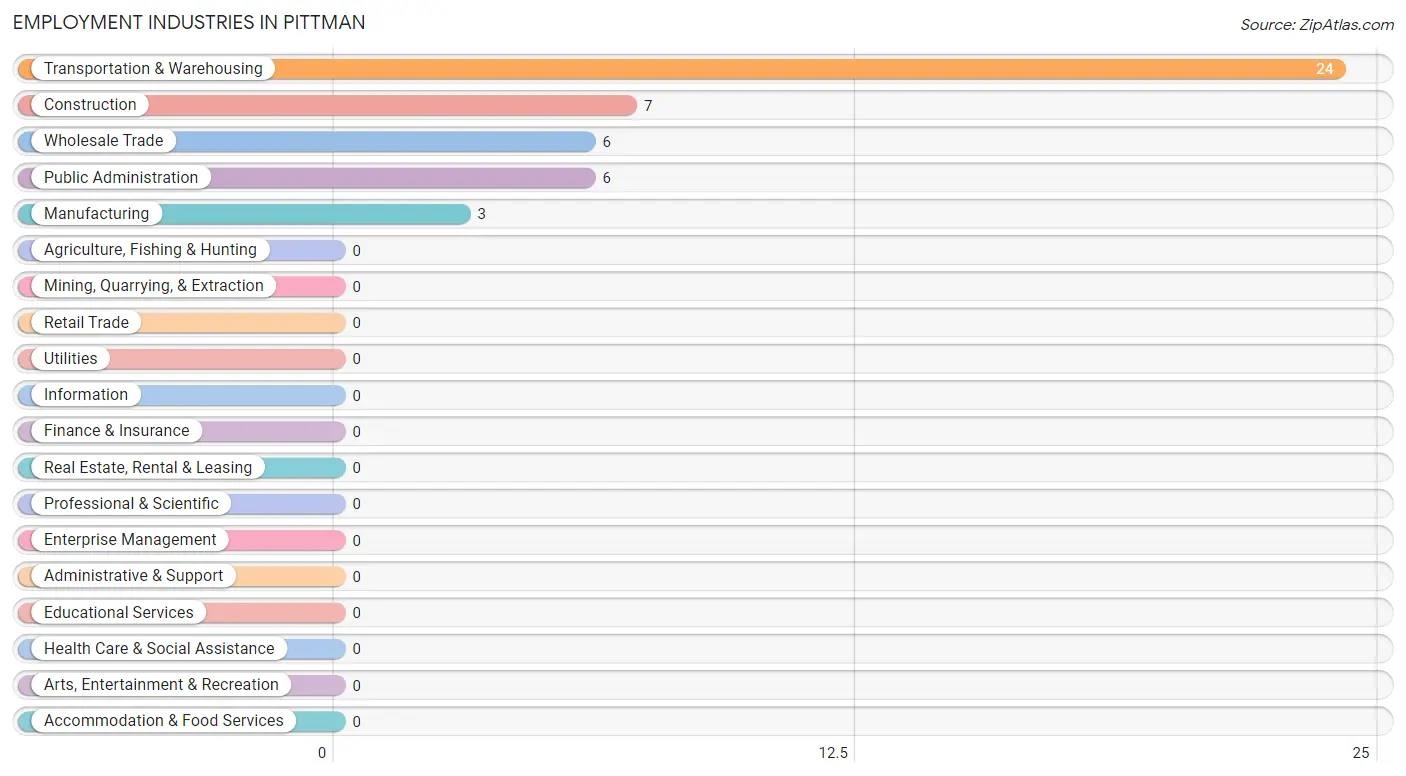
Employment Industries in Pittman
The major employment industries in Pittman include Transportation & Warehousing (24 | 52.2%), Construction (7 | 15.2%), Wholesale Trade (6 | 13.0%), Public Administration (6 | 13.0%), and Manufacturing (3 | 6.5%).
Employment Industries by Sex in Pittman
The Pittman industries that see more men than women are Construction (100.0%), Manufacturing (100.0%), and Public Administration (100.0%), whereas the industries that tend to have a higher number of women are Wholesale Trade (100.0%), and Transportation & Warehousing (54.2%).
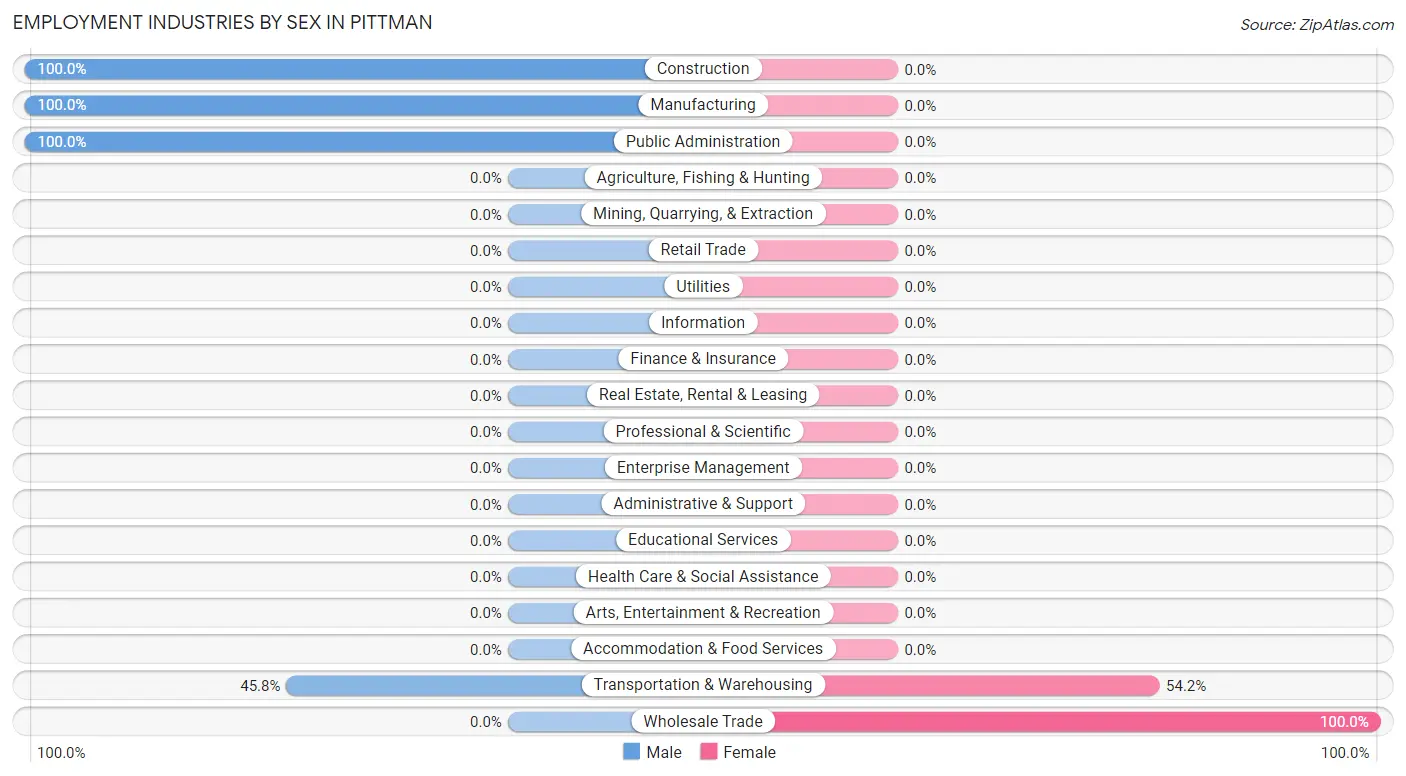
| Industry | Male | Female |
| Agriculture, Fishing & Hunting | 0 (0.0%) | 0 (0.0%) |
| Mining, Quarrying, & Extraction | 0 (0.0%) | 0 (0.0%) |
| Construction | 7 (100.0%) | 0 (0.0%) |
| Manufacturing | 3 (100.0%) | 0 (0.0%) |
| Wholesale Trade | 0 (0.0%) | 6 (100.0%) |
| Retail Trade | 0 (0.0%) | 0 (0.0%) |
| Transportation & Warehousing | 11 (45.8%) | 13 (54.2%) |
| Utilities | 0 (0.0%) | 0 (0.0%) |
| Information | 0 (0.0%) | 0 (0.0%) |
| Finance & Insurance | 0 (0.0%) | 0 (0.0%) |
| Real Estate, Rental & Leasing | 0 (0.0%) | 0 (0.0%) |
| Professional & Scientific | 0 (0.0%) | 0 (0.0%) |
| Enterprise Management | 0 (0.0%) | 0 (0.0%) |
| Administrative & Support | 0 (0.0%) | 0 (0.0%) |
| Educational Services | 0 (0.0%) | 0 (0.0%) |
| Health Care & Social Assistance | 0 (0.0%) | 0 (0.0%) |
| Arts, Entertainment & Recreation | 0 (0.0%) | 0 (0.0%) |
| Accommodation & Food Services | 0 (0.0%) | 0 (0.0%) |
| Public Administration | 6 (100.0%) | 0 (0.0%) |
| Total | 27 (58.7%) | 19 (41.3%) |
Education in Pittman
School Enrollment in Pittman
| School Level | # Students | % Students |
| Nursery / Preschool | 0 | 0.0% |
| Kindergarten | 0 | 0.0% |
| Elementary School | 0 | 0.0% |
| Middle School | 0 | 0.0% |
| High School | 0 | 0.0% |
| College / Undergraduate | 0 | 0.0% |
| Graduate / Professional | 0 | 0.0% |
| Total | 0 | 0.0% |
School Enrollment by Age by Funding Source in Pittman
| Age Bracket | Public School | Private School |
| 3 to 4 Year Olds | 0 (0.0%) | 0 (0.0%) |
| 5 to 9 Year Old | 0 (0.0%) | 0 (0.0%) |
| 10 to 14 Year Olds | 0 (0.0%) | 0 (0.0%) |
| 15 to 17 Year Olds | 0 (0.0%) | 0 (0.0%) |
| 18 to 19 Year Olds | 0 (0.0%) | 0 (0.0%) |
| 20 to 24 Year Olds | 0 (0.0%) | 0 (0.0%) |
| 25 to 34 Year Olds | 0 (0.0%) | 0 (0.0%) |
| 35 Years and over | 0 (0.0%) | 0 (0.0%) |
| Total | 0 (0.0%) | 0 (0.0%) |
Educational Attainment by Field of Study in Pittman
Social sciences (13 | 50.0%), bio, nature & agricultural (7 | 26.9%), and science & technology (6 | 23.1%) are the most common fields of study among 26 individuals in Pittman who have obtained a bachelor's degree or higher.

| Field of Study | # Graduates | % Graduates |
| Computers & Mathematics | 0 | 0.0% |
| Bio, Nature & Agricultural | 7 | 26.9% |
| Physical & Health Sciences | 0 | 0.0% |
| Psychology | 0 | 0.0% |
| Social Sciences | 13 | 50.0% |
| Engineering | 0 | 0.0% |
| Multidisciplinary Studies | 0 | 0.0% |
| Science & Technology | 6 | 23.1% |
| Business | 0 | 0.0% |
| Education | 0 | 0.0% |
| Literature & Languages | 0 | 0.0% |
| Liberal Arts & History | 0 | 0.0% |
| Visual & Performing Arts | 0 | 0.0% |
| Communications | 0 | 0.0% |
| Arts & Humanities | 0 | 0.0% |
| Total | 26 | 100.0% |
Transportation & Commute in Pittman
Vehicle Availability by Sex in Pittman
The most prevalent vehicle ownership categories in Pittman are males with 2 vehicles (16, accounting for 59.3%) and females with 2 vehicles (13, making up 84.2%).
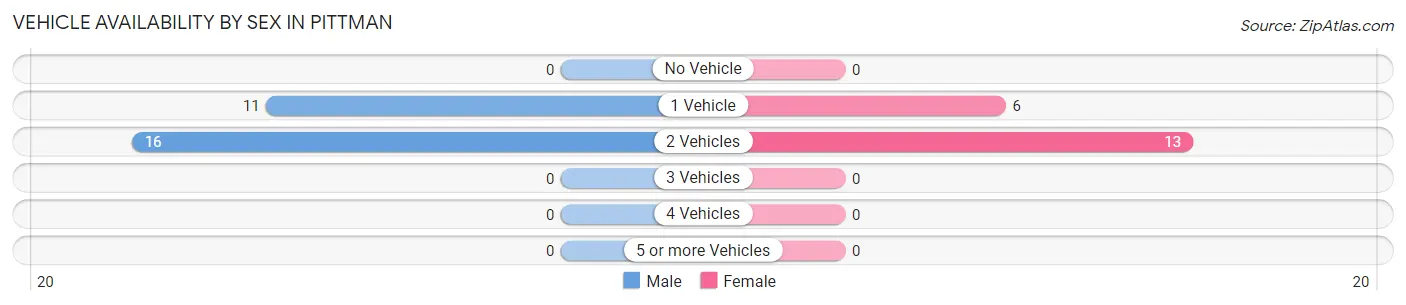
| Vehicles Available | Male | Female |
| No Vehicle | 0 (0.0%) | 0 (0.0%) |
| 1 Vehicle | 11 (40.7%) | 6 (31.6%) |
| 2 Vehicles | 16 (59.3%) | 13 (68.4%) |
| 3 Vehicles | 0 (0.0%) | 0 (0.0%) |
| 4 Vehicles | 0 (0.0%) | 0 (0.0%) |
| 5 or more Vehicles | 0 (0.0%) | 0 (0.0%) |
| Total | 27 (100.0%) | 19 (100.0%) |
Commute Time in Pittman
The most frequently occuring commute durations in Pittman are 60 to 89 minutes (13 commuters, 33.3%), 35 to 39 minutes (11 commuters, 28.2%), and less than 5 minutes (6 commuters, 15.4%).
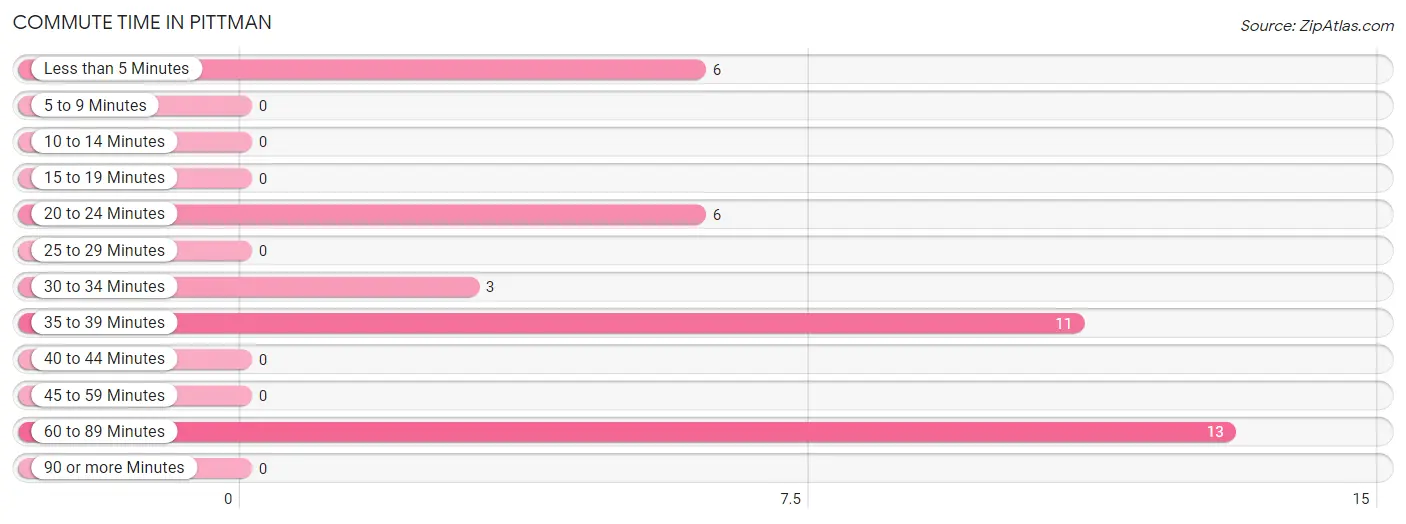
| Commute Time | # Commuters | % Commuters |
| Less than 5 Minutes | 6 | 15.4% |
| 5 to 9 Minutes | 0 | 0.0% |
| 10 to 14 Minutes | 0 | 0.0% |
| 15 to 19 Minutes | 0 | 0.0% |
| 20 to 24 Minutes | 6 | 15.4% |
| 25 to 29 Minutes | 0 | 0.0% |
| 30 to 34 Minutes | 3 | 7.7% |
| 35 to 39 Minutes | 11 | 28.2% |
| 40 to 44 Minutes | 0 | 0.0% |
| 45 to 59 Minutes | 0 | 0.0% |
| 60 to 89 Minutes | 13 | 33.3% |
| 90 or more Minutes | 0 | 0.0% |
Commute Time by Sex in Pittman
The most common commute times in Pittman are 20 to 24 minutes (6 commuters, 30.0%) for males and 60 to 89 minutes (7 commuters, 36.8%) for females.
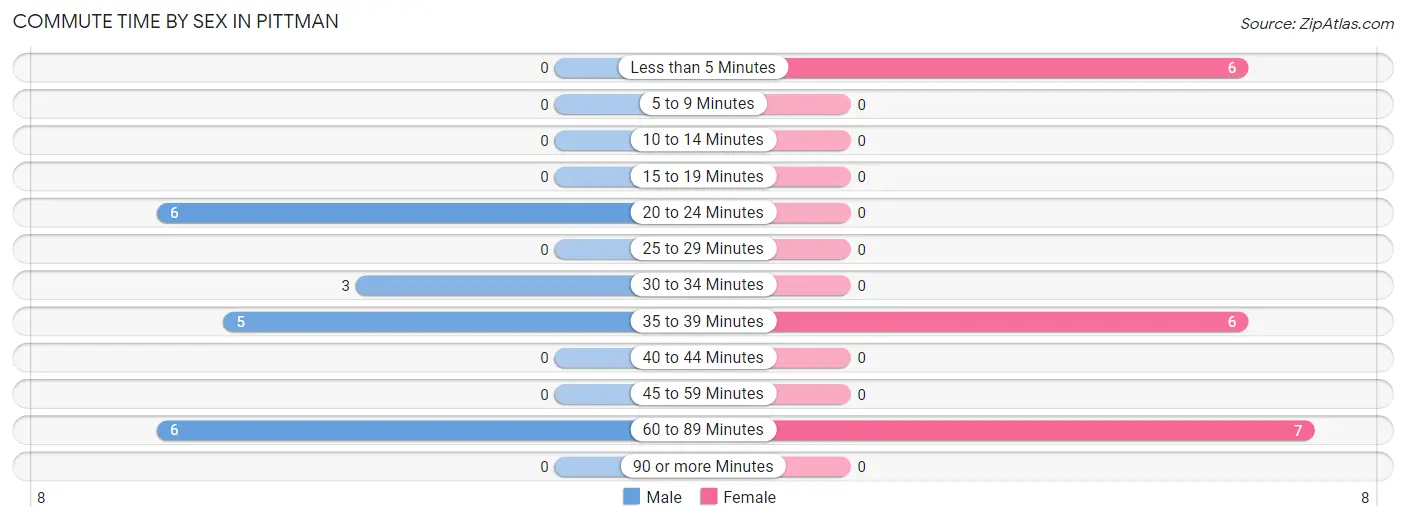
| Commute Time | Male | Female |
| Less than 5 Minutes | 0 (0.0%) | 6 (31.6%) |
| 5 to 9 Minutes | 0 (0.0%) | 0 (0.0%) |
| 10 to 14 Minutes | 0 (0.0%) | 0 (0.0%) |
| 15 to 19 Minutes | 0 (0.0%) | 0 (0.0%) |
| 20 to 24 Minutes | 6 (30.0%) | 0 (0.0%) |
| 25 to 29 Minutes | 0 (0.0%) | 0 (0.0%) |
| 30 to 34 Minutes | 3 (15.0%) | 0 (0.0%) |
| 35 to 39 Minutes | 5 (25.0%) | 6 (31.6%) |
| 40 to 44 Minutes | 0 (0.0%) | 0 (0.0%) |
| 45 to 59 Minutes | 0 (0.0%) | 0 (0.0%) |
| 60 to 89 Minutes | 6 (30.0%) | 7 (36.8%) |
| 90 or more Minutes | 0 (0.0%) | 0 (0.0%) |
Time of Departure to Work by Sex in Pittman
The most frequent times of departure to work in Pittman are 8:00 AM to 8:29 AM (6, 30.0%) for males and 12:00 PM to 3:59 PM (7, 36.8%) for females.
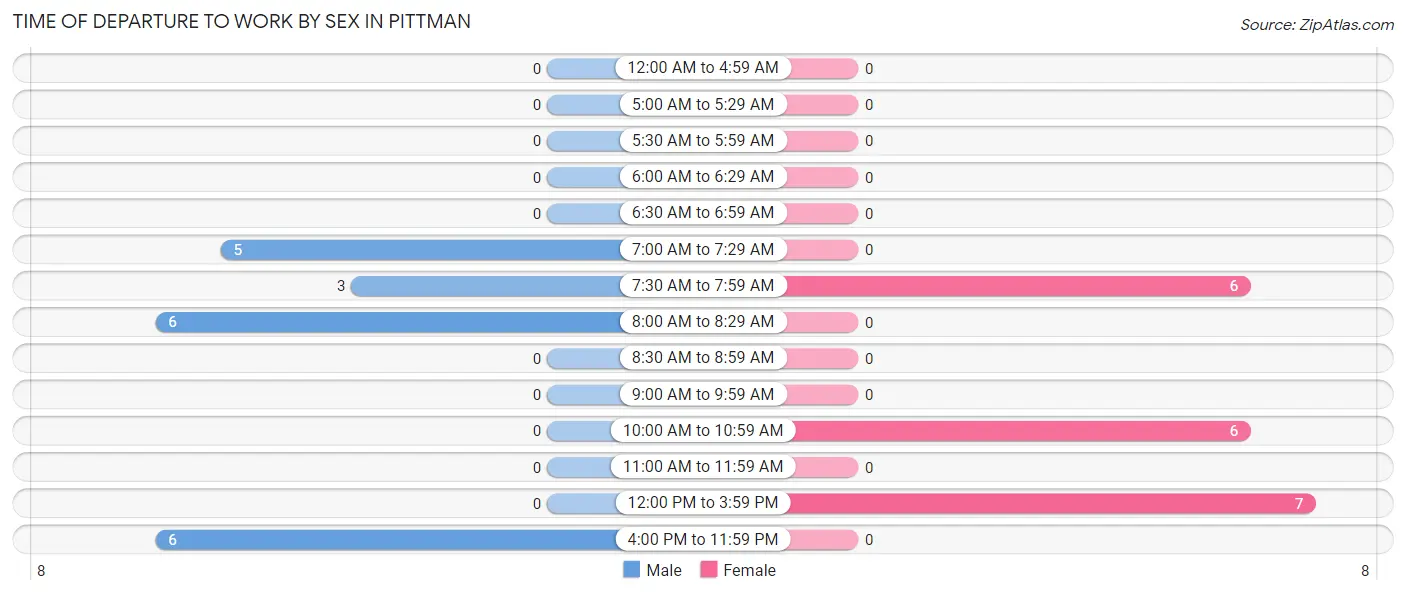
| Time of Departure | Male | Female |
| 12:00 AM to 4:59 AM | 0 (0.0%) | 0 (0.0%) |
| 5:00 AM to 5:29 AM | 0 (0.0%) | 0 (0.0%) |
| 5:30 AM to 5:59 AM | 0 (0.0%) | 0 (0.0%) |
| 6:00 AM to 6:29 AM | 0 (0.0%) | 0 (0.0%) |
| 6:30 AM to 6:59 AM | 0 (0.0%) | 0 (0.0%) |
| 7:00 AM to 7:29 AM | 5 (25.0%) | 0 (0.0%) |
| 7:30 AM to 7:59 AM | 3 (15.0%) | 6 (31.6%) |
| 8:00 AM to 8:29 AM | 6 (30.0%) | 0 (0.0%) |
| 8:30 AM to 8:59 AM | 0 (0.0%) | 0 (0.0%) |
| 9:00 AM to 9:59 AM | 0 (0.0%) | 0 (0.0%) |
| 10:00 AM to 10:59 AM | 0 (0.0%) | 6 (31.6%) |
| 11:00 AM to 11:59 AM | 0 (0.0%) | 0 (0.0%) |
| 12:00 PM to 3:59 PM | 0 (0.0%) | 7 (36.8%) |
| 4:00 PM to 11:59 PM | 6 (30.0%) | 0 (0.0%) |
| Total | 20 (100.0%) | 19 (100.0%) |
Housing Occupancy in Pittman
Occupancy by Ownership in Pittman
Of the total 90 dwellings in Pittman, owner-occupied units account for 69 (76.7%), while renter-occupied units make up 21 (23.3%).
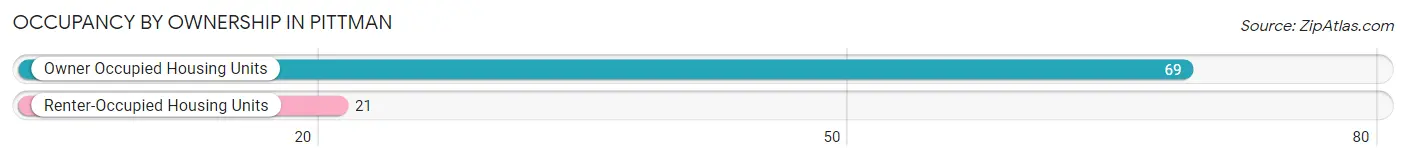
| Occupancy | # Housing Units | % Housing Units |
| Owner Occupied Housing Units | 69 | 76.7% |
| Renter-Occupied Housing Units | 21 | 23.3% |
| Total Occupied Housing Units | 90 | 100.0% |
Occupancy by Household Size in Pittman
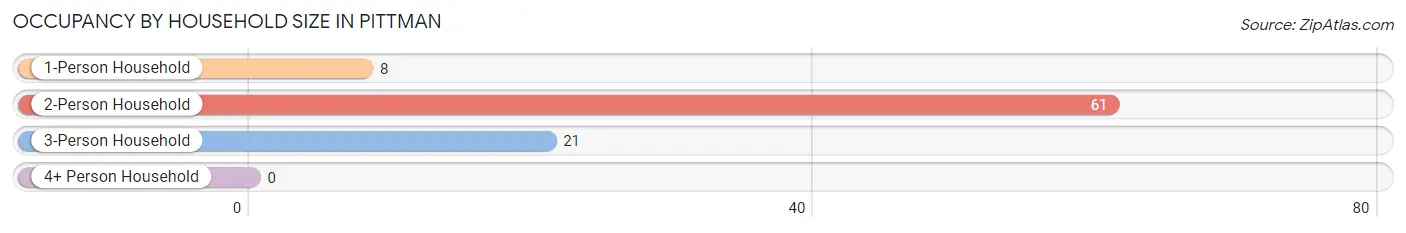
| Household Size | # Housing Units | % Housing Units |
| 1-Person Household | 8 | 8.9% |
| 2-Person Household | 61 | 67.8% |
| 3-Person Household | 21 | 23.3% |
| 4+ Person Household | 0 | 0.0% |
| Total Housing Units | 90 | 100.0% |
Occupancy by Ownership by Household Size in Pittman
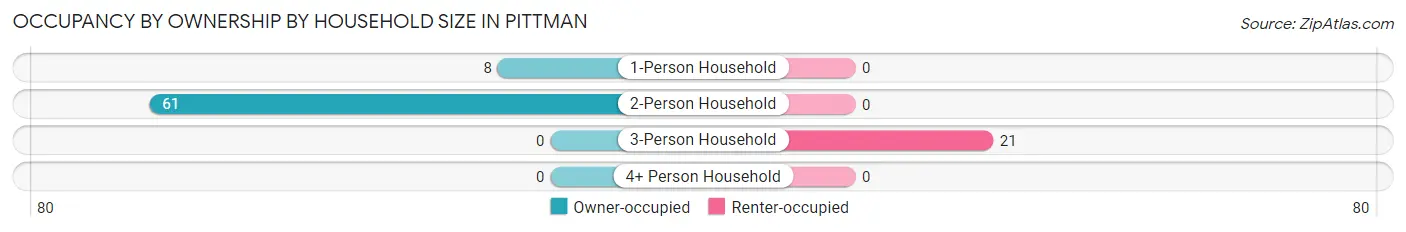
| Household Size | Owner-occupied | Renter-occupied |
| 1-Person Household | 8 (100.0%) | 0 (0.0%) |
| 2-Person Household | 61 (100.0%) | 0 (0.0%) |
| 3-Person Household | 0 (0.0%) | 21 (100.0%) |
| 4+ Person Household | 0 (0.0%) | 0 (0.0%) |
| Total Housing Units | 69 (76.7%) | 21 (23.3%) |
Occupancy by Educational Attainment in Pittman
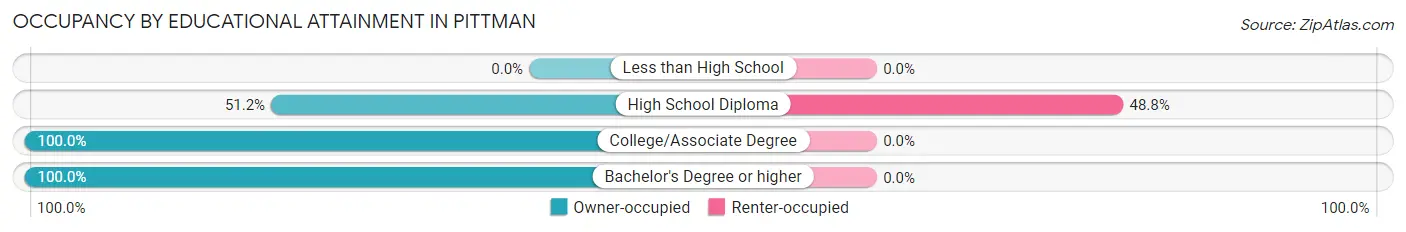
| Household Size | Owner-occupied | Renter-occupied |
| Less than High School | 0 (0.0%) | 0 (0.0%) |
| High School Diploma | 22 (51.2%) | 21 (48.8%) |
| College/Associate Degree | 34 (100.0%) | 0 (0.0%) |
| Bachelor's Degree or higher | 13 (100.0%) | 0 (0.0%) |
Occupancy by Age of Householder in Pittman
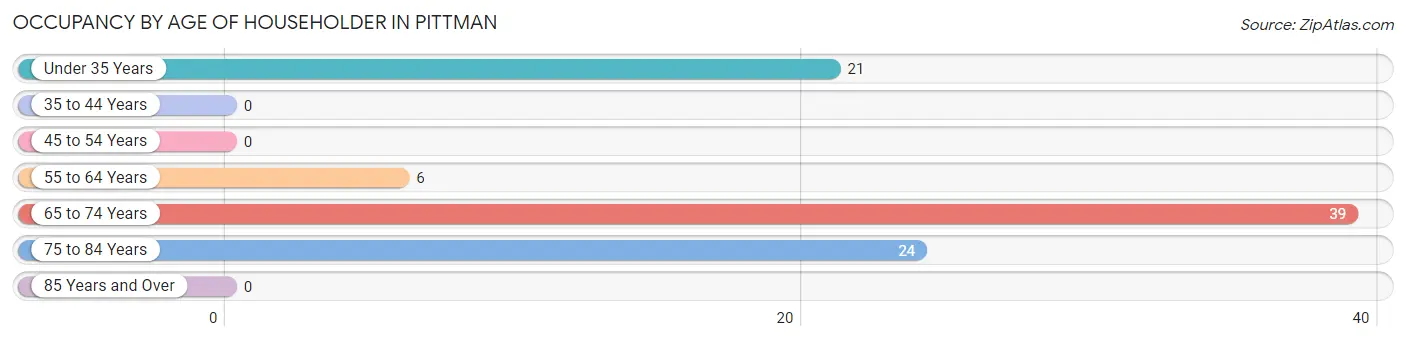
| Age Bracket | # Households | % Households |
| Under 35 Years | 21 | 23.3% |
| 35 to 44 Years | 0 | 0.0% |
| 45 to 54 Years | 0 | 0.0% |
| 55 to 64 Years | 6 | 6.7% |
| 65 to 74 Years | 39 | 43.3% |
| 75 to 84 Years | 24 | 26.7% |
| 85 Years and Over | 0 | 0.0% |
| Total | 90 | 100.0% |
Housing Finances in Pittman
Median Income by Occupancy in Pittman
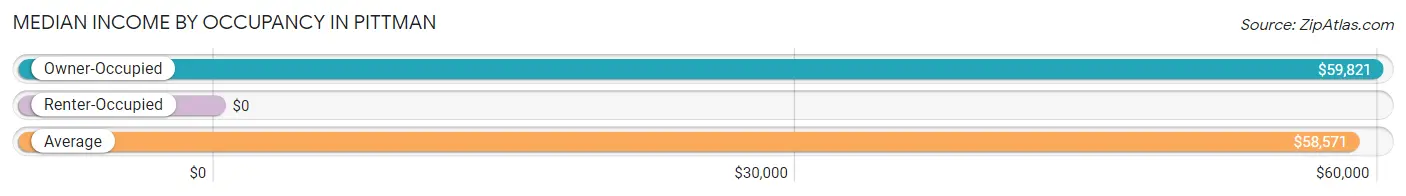
| Occupancy Type | # Households | Median Income |
| Owner-Occupied | 69 (76.7%) | $59,821 |
| Renter-Occupied | 21 (23.3%) | $0 |
| Average | 90 (100.0%) | $58,571 |
Occupancy by Householder Income Bracket in Pittman
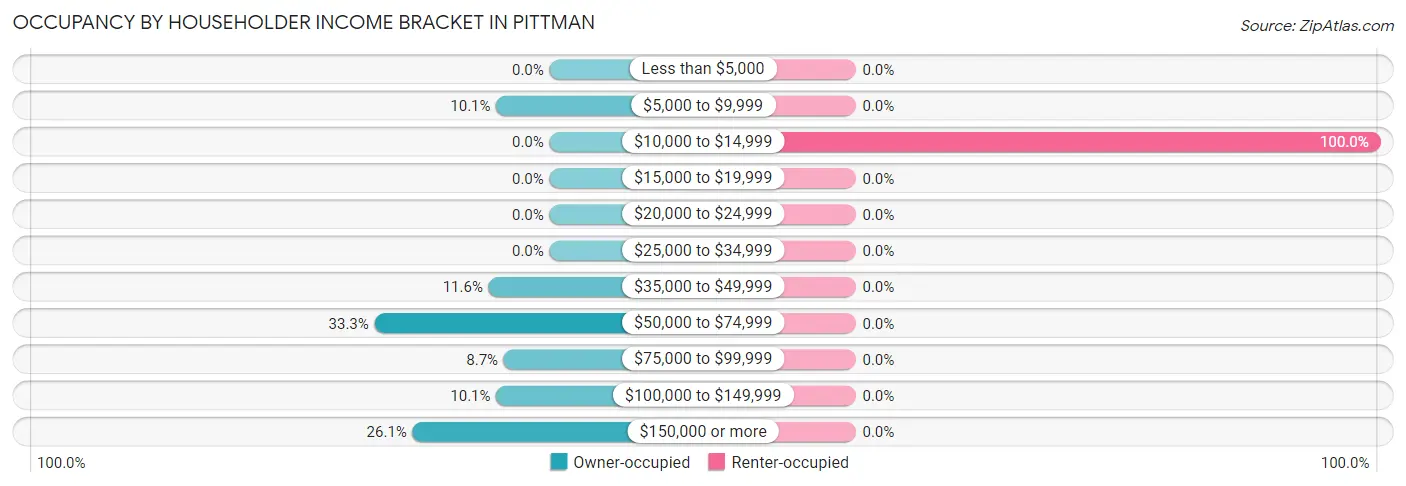
| Income Bracket | Owner-occupied | Renter-occupied |
| Less than $5,000 | 0 (0.0%) | 0 (0.0%) |
| $5,000 to $9,999 | 7 (10.1%) | 0 (0.0%) |
| $10,000 to $14,999 | 0 (0.0%) | 21 (100.0%) |
| $15,000 to $19,999 | 0 (0.0%) | 0 (0.0%) |
| $20,000 to $24,999 | 0 (0.0%) | 0 (0.0%) |
| $25,000 to $34,999 | 0 (0.0%) | 0 (0.0%) |
| $35,000 to $49,999 | 8 (11.6%) | 0 (0.0%) |
| $50,000 to $74,999 | 23 (33.3%) | 0 (0.0%) |
| $75,000 to $99,999 | 6 (8.7%) | 0 (0.0%) |
| $100,000 to $149,999 | 7 (10.1%) | 0 (0.0%) |
| $150,000 or more | 18 (26.1%) | 0 (0.0%) |
| Total | 69 (100.0%) | 21 (100.0%) |
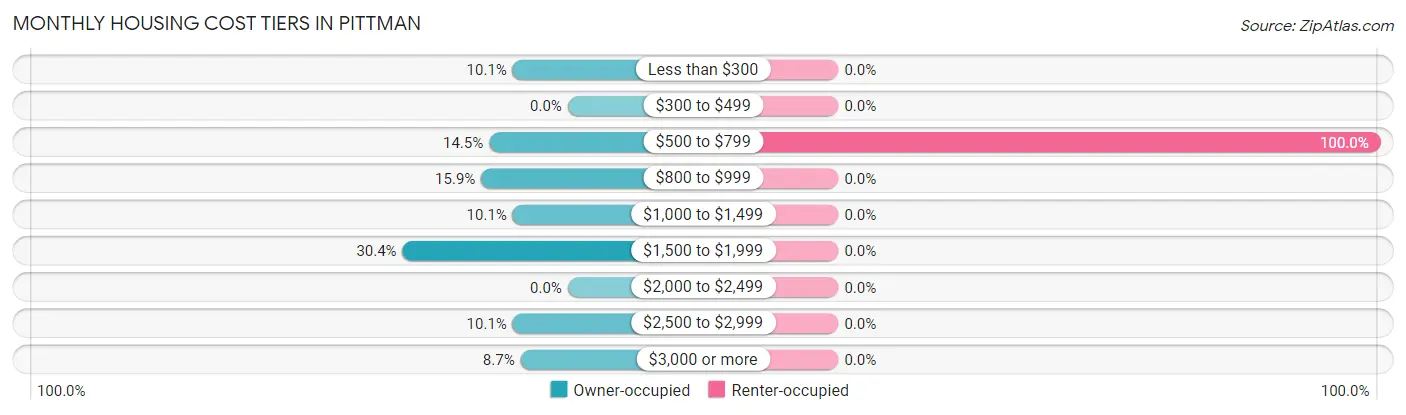
Monthly Housing Cost Tiers in Pittman
| Monthly Cost | Owner-occupied | Renter-occupied |
| Less than $300 | 7 (10.1%) | 0 (0.0%) |
| $300 to $499 | 0 (0.0%) | 0 (0.0%) |
| $500 to $799 | 10 (14.5%) | 21 (100.0%) |
| $800 to $999 | 11 (15.9%) | 0 (0.0%) |
| $1,000 to $1,499 | 7 (10.1%) | 0 (0.0%) |
| $1,500 to $1,999 | 21 (30.4%) | 0 (0.0%) |
| $2,000 to $2,499 | 0 (0.0%) | 0 (0.0%) |
| $2,500 to $2,999 | 7 (10.1%) | 0 (0.0%) |
| $3,000 or more | 6 (8.7%) | 0 (0.0%) |
| Total | 69 (100.0%) | 21 (100.0%) |
Physical Housing Characteristics in Pittman
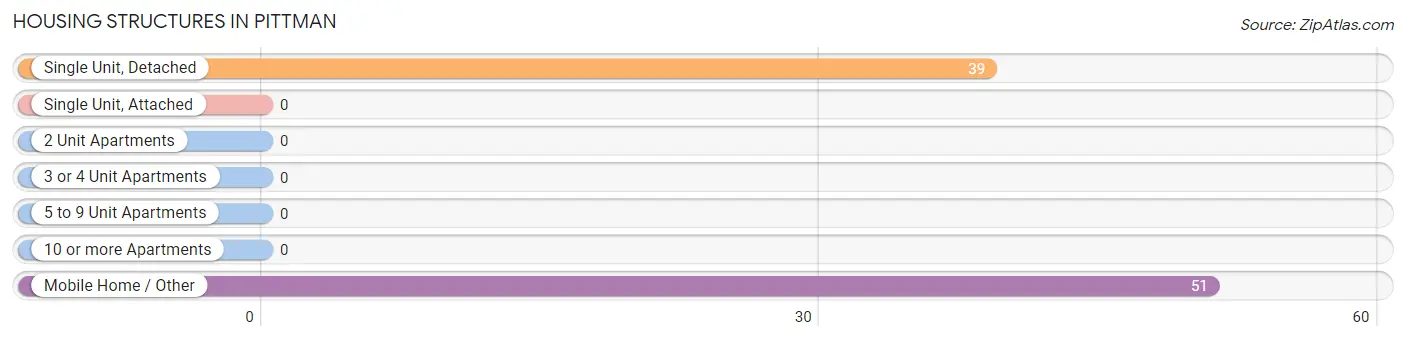
Housing Structures in Pittman
| Structure Type | # Housing Units | % Housing Units |
| Single Unit, Detached | 39 | 43.3% |
| Single Unit, Attached | 0 | 0.0% |
| 2 Unit Apartments | 0 | 0.0% |
| 3 or 4 Unit Apartments | 0 | 0.0% |
| 5 to 9 Unit Apartments | 0 | 0.0% |
| 10 or more Apartments | 0 | 0.0% |
| Mobile Home / Other | 51 | 56.7% |
| Total | 90 | 100.0% |
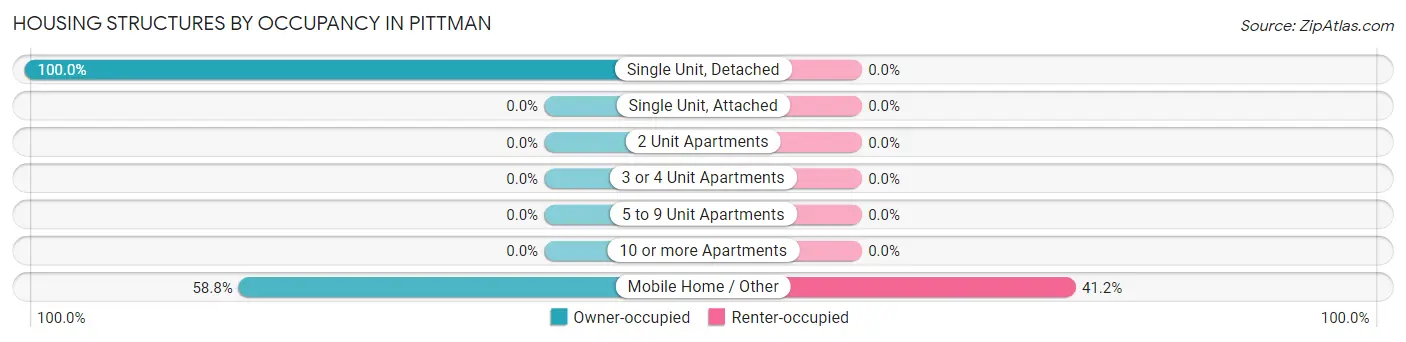
Housing Structures by Occupancy in Pittman
| Structure Type | Owner-occupied | Renter-occupied |
| Single Unit, Detached | 39 (100.0%) | 0 (0.0%) |
| Single Unit, Attached | 0 (0.0%) | 0 (0.0%) |
| 2 Unit Apartments | 0 (0.0%) | 0 (0.0%) |
| 3 or 4 Unit Apartments | 0 (0.0%) | 0 (0.0%) |
| 5 to 9 Unit Apartments | 0 (0.0%) | 0 (0.0%) |
| 10 or more Apartments | 0 (0.0%) | 0 (0.0%) |
| Mobile Home / Other | 30 (58.8%) | 21 (41.2%) |
| Total | 69 (76.7%) | 21 (23.3%) |
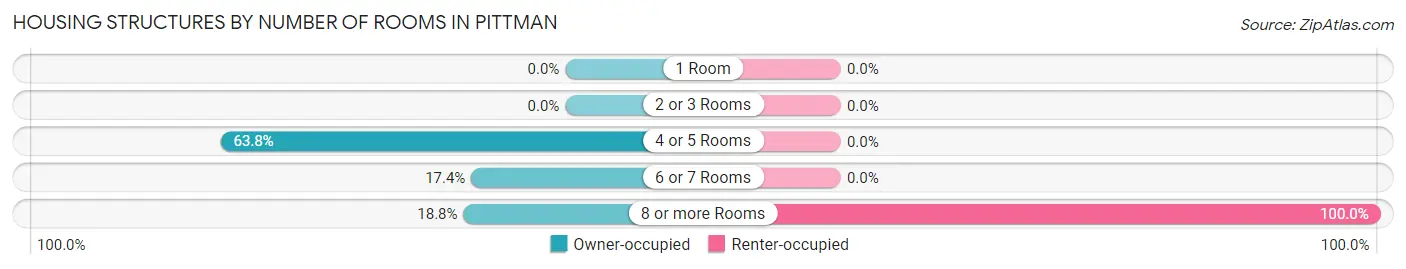
Housing Structures by Number of Rooms in Pittman
| Number of Rooms | Owner-occupied | Renter-occupied |
| 1 Room | 0 (0.0%) | 0 (0.0%) |
| 2 or 3 Rooms | 0 (0.0%) | 0 (0.0%) |
| 4 or 5 Rooms | 44 (63.8%) | 0 (0.0%) |
| 6 or 7 Rooms | 12 (17.4%) | 0 (0.0%) |
| 8 or more Rooms | 13 (18.8%) | 21 (100.0%) |
| Total | 69 (100.0%) | 21 (100.0%) |
Housing Structure by Heating Type in Pittman
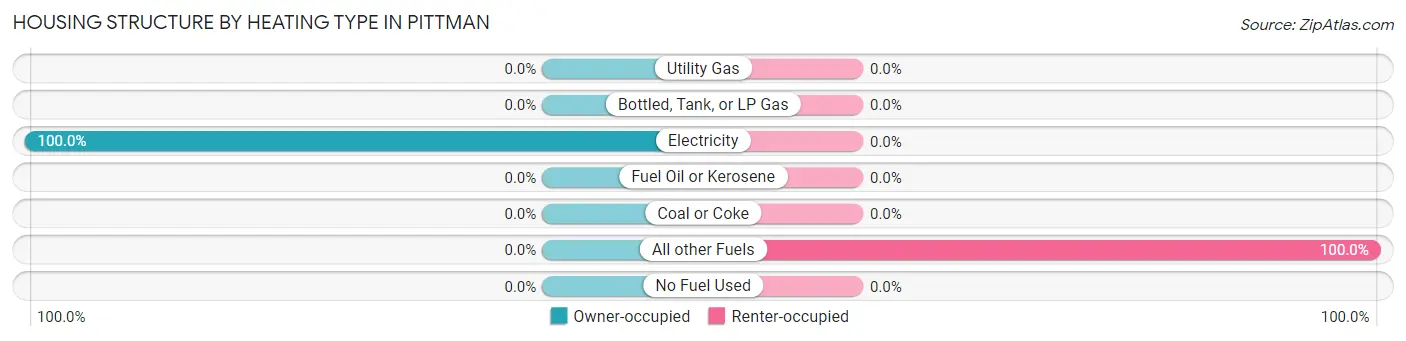
| Heating Type | Owner-occupied | Renter-occupied |
| Utility Gas | 0 (0.0%) | 0 (0.0%) |
| Bottled, Tank, or LP Gas | 0 (0.0%) | 0 (0.0%) |
| Electricity | 69 (100.0%) | 0 (0.0%) |
| Fuel Oil or Kerosene | 0 (0.0%) | 0 (0.0%) |
| Coal or Coke | 0 (0.0%) | 0 (0.0%) |
| All other Fuels | 0 (0.0%) | 21 (100.0%) |
| No Fuel Used | 0 (0.0%) | 0 (0.0%) |
| Total | 69 (100.0%) | 21 (100.0%) |
Household Vehicle Usage in Pittman
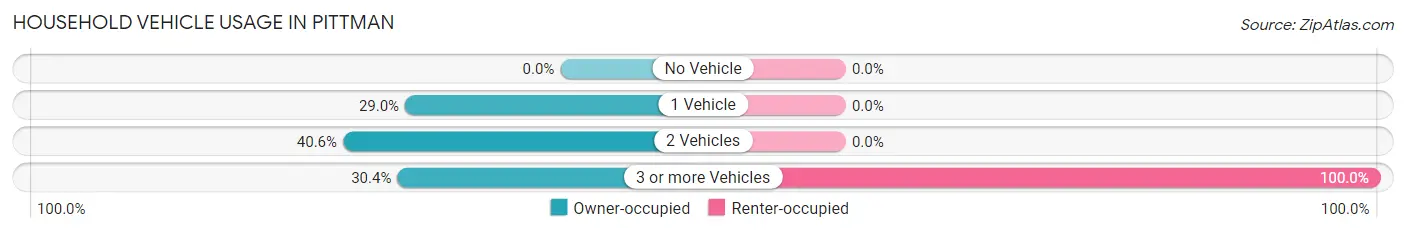
| Vehicles per Household | Owner-occupied | Renter-occupied |
| No Vehicle | 0 (0.0%) | 0 (0.0%) |
| 1 Vehicle | 20 (29.0%) | 0 (0.0%) |
| 2 Vehicles | 28 (40.6%) | 0 (0.0%) |
| 3 or more Vehicles | 21 (30.4%) | 21 (100.0%) |
| Total | 69 (100.0%) | 21 (100.0%) |
Real Estate & Mortgages in Pittman
Real Estate and Mortgage Overview in Pittman
| Characteristic | Without Mortgage | With Mortgage |
| Housing Units | 42 | 27 |
| Median Property Value | - | - |
| Median Household Income | - | - |
| Monthly Housing Costs | $880 | $6 |
| Real Estate Taxes | $3,667 | $0 |
Property Value by Mortgage Status in Pittman
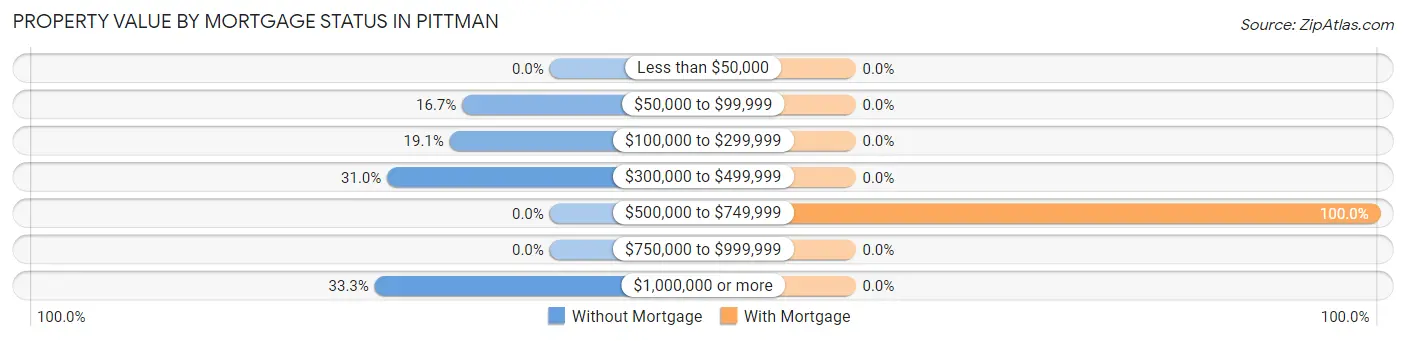
| Property Value | Without Mortgage | With Mortgage |
| Less than $50,000 | 0 (0.0%) | 0 (0.0%) |
| $50,000 to $99,999 | 7 (16.7%) | 0 (0.0%) |
| $100,000 to $299,999 | 8 (19.1%) | 0 (0.0%) |
| $300,000 to $499,999 | 13 (30.9%) | 0 (0.0%) |
| $500,000 to $749,999 | 0 (0.0%) | 27 (100.0%) |
| $750,000 to $999,999 | 0 (0.0%) | 0 (0.0%) |
| $1,000,000 or more | 14 (33.3%) | 0 (0.0%) |
| Total | 42 (100.0%) | 27 (100.0%) |
Household Income by Mortgage Status in Pittman
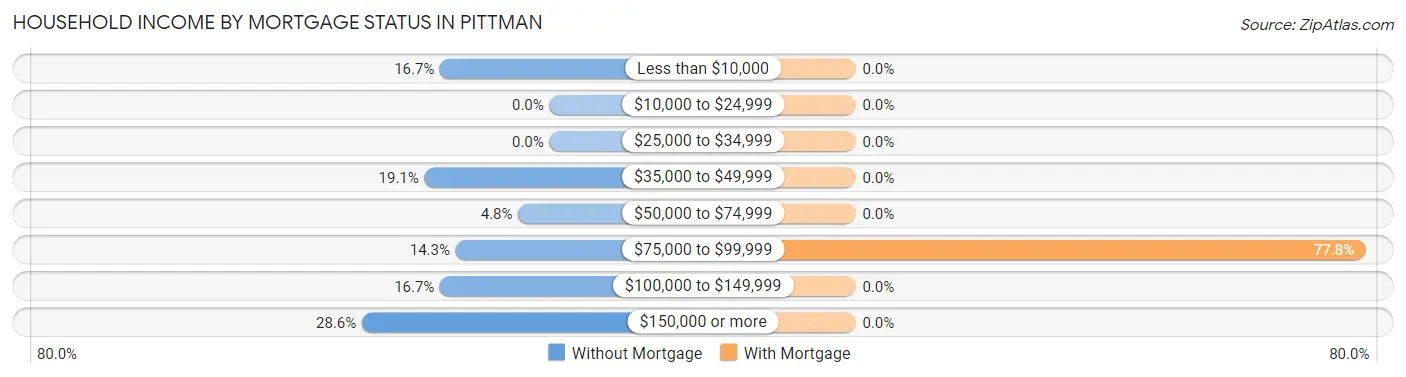
| Household Income | Without Mortgage | With Mortgage |
| Less than $10,000 | 7 (16.7%) | 0 (0.0%) |
| $10,000 to $24,999 | 0 (0.0%) | 0 (0.0%) |
| $25,000 to $34,999 | 0 (0.0%) | 0 (0.0%) |
| $35,000 to $49,999 | 8 (19.1%) | 0 (0.0%) |
| $50,000 to $74,999 | 2 (4.8%) | 0 (0.0%) |
| $75,000 to $99,999 | 6 (14.3%) | 21 (77.8%) |
| $100,000 to $149,999 | 7 (16.7%) | 0 (0.0%) |
| $150,000 or more | 12 (28.6%) | 0 (0.0%) |
| Total | 42 (100.0%) | 27 (100.0%) |
Property Value to Household Income Ratio in Pittman
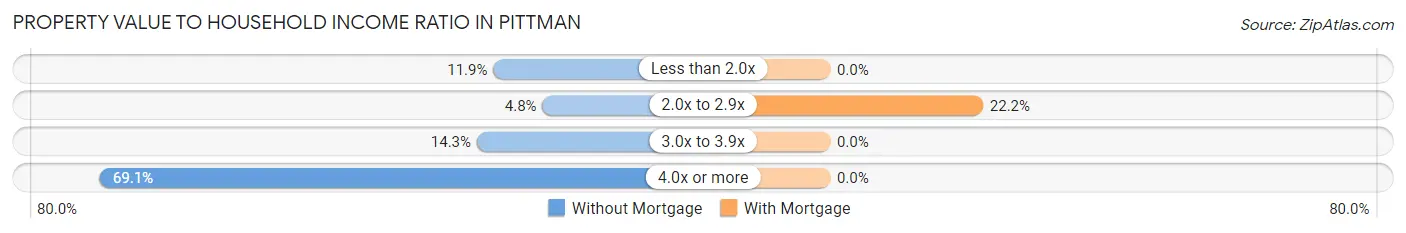
| Value-to-Income Ratio | Without Mortgage | With Mortgage |
| Less than 2.0x | 5 (11.9%) | 0 (0.0%) |
| 2.0x to 2.9x | 2 (4.8%) | 6 (22.2%) |
| 3.0x to 3.9x | 6 (14.3%) | 0 (0.0%) |
| 4.0x or more | 29 (69.1%) | 0 (0.0%) |
| Total | 42 (100.0%) | 27 (100.0%) |
Real Estate Taxes by Mortgage Status in Pittman
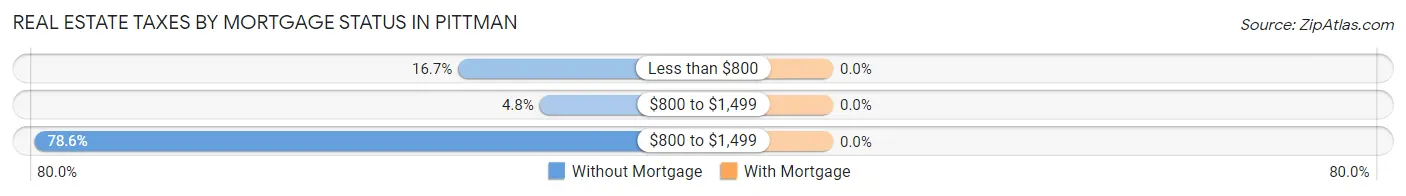
| Property Taxes | Without Mortgage | With Mortgage |
| Less than $800 | 7 (16.7%) | 0 (0.0%) |
| $800 to $1,499 | 2 (4.8%) | 0 (0.0%) |
| $800 to $1,499 | 33 (78.6%) | 0 (0.0%) |
| Total | 42 (100.0%) | 27 (100.0%) |
Health & Disability in Pittman
Health Insurance Coverage by Age in Pittman
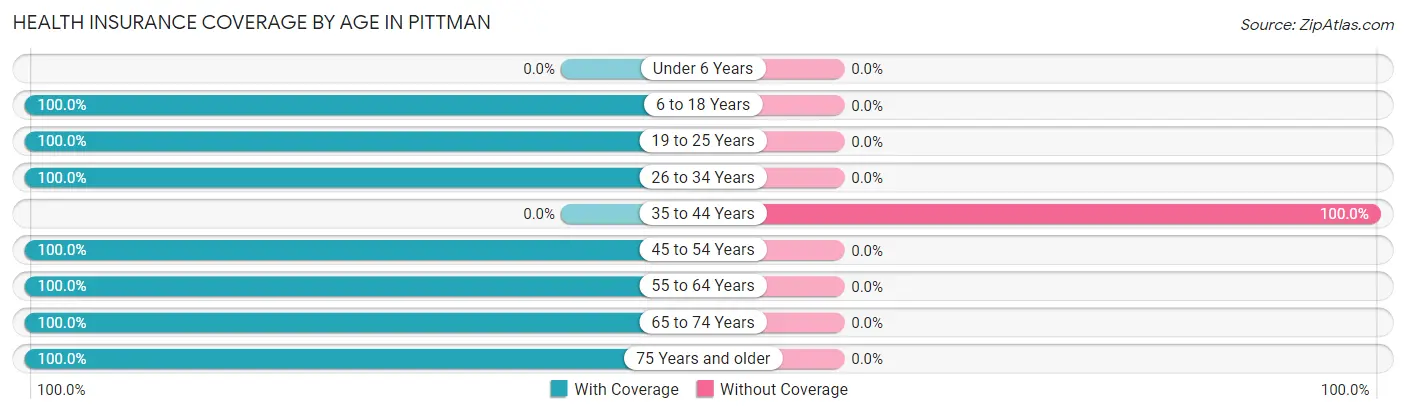
| Age Bracket | With Coverage | Without Coverage |
| Under 6 Years | 0 (0.0%) | 0 (0.0%) |
| 6 to 18 Years | 21 (100.0%) | 0 (0.0%) |
| 19 to 25 Years | 66 (100.0%) | 0 (0.0%) |
| 26 to 34 Years | 3 (100.0%) | 0 (0.0%) |
| 35 to 44 Years | 0 (0.0%) | 6 (100.0%) |
| 45 to 54 Years | 7 (100.0%) | 0 (0.0%) |
| 55 to 64 Years | 6 (100.0%) | 0 (0.0%) |
| 65 to 74 Years | 74 (100.0%) | 0 (0.0%) |
| 75 Years and older | 31 (100.0%) | 0 (0.0%) |
| Total | 208 (97.2%) | 6 (2.8%) |
Health Insurance Coverage by Citizenship Status in Pittman
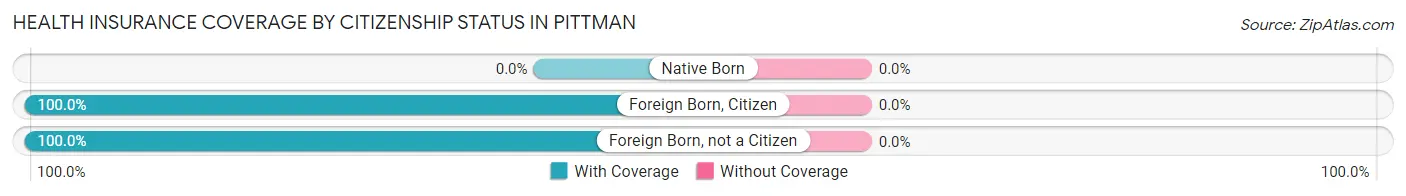
| Citizenship Status | With Coverage | Without Coverage |
| Native Born | 0 (0.0%) | 0 (0.0%) |
| Foreign Born, Citizen | 21 (100.0%) | 0 (0.0%) |
| Foreign Born, not a Citizen | 66 (100.0%) | 0 (0.0%) |
Health Insurance Coverage by Household Income in Pittman
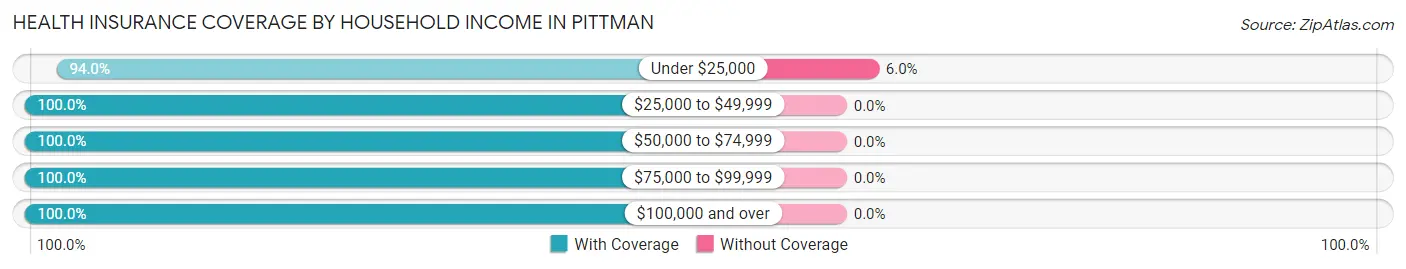
| Household Income | With Coverage | Without Coverage |
| Under $25,000 | 94 (94.0%) | 6 (6.0%) |
| $25,000 to $49,999 | 8 (100.0%) | 0 (0.0%) |
| $50,000 to $74,999 | 42 (100.0%) | 0 (0.0%) |
| $75,000 to $99,999 | 12 (100.0%) | 0 (0.0%) |
| $100,000 and over | 52 (100.0%) | 0 (0.0%) |
Public vs Private Health Insurance Coverage by Age in Pittman
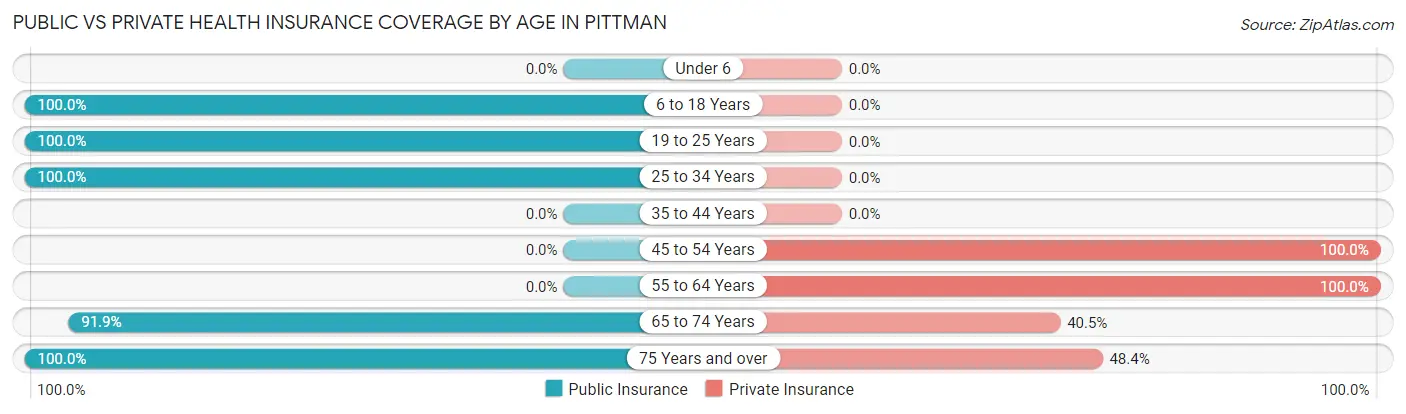
| Age Bracket | Public Insurance | Private Insurance |
| Under 6 | 0 (0.0%) | 0 (0.0%) |
| 6 to 18 Years | 21 (100.0%) | 0 (0.0%) |
| 19 to 25 Years | 66 (100.0%) | 0 (0.0%) |
| 25 to 34 Years | 3 (100.0%) | 0 (0.0%) |
| 35 to 44 Years | 0 (0.0%) | 0 (0.0%) |
| 45 to 54 Years | 0 (0.0%) | 7 (100.0%) |
| 55 to 64 Years | 0 (0.0%) | 6 (100.0%) |
| 65 to 74 Years | 68 (91.9%) | 30 (40.5%) |
| 75 Years and over | 31 (100.0%) | 15 (48.4%) |
| Total | 189 (88.3%) | 58 (27.1%) |
Disability Status by Sex by Age in Pittman
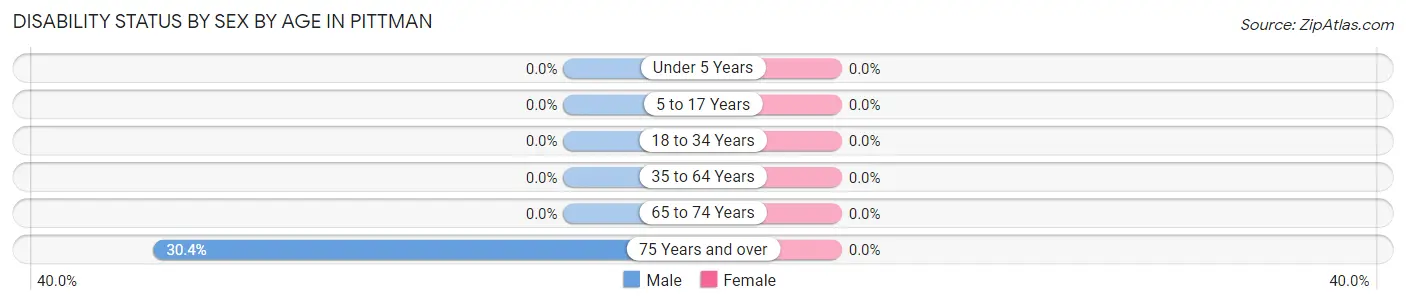
| Age Bracket | Male | Female |
| Under 5 Years | 0 (0.0%) | 0 (0.0%) |
| 5 to 17 Years | 0 (0.0%) | 0 (0.0%) |
| 18 to 34 Years | 0 (0.0%) | 0 (0.0%) |
| 35 to 64 Years | 0 (0.0%) | 0 (0.0%) |
| 65 to 74 Years | 0 (0.0%) | 0 (0.0%) |
| 75 Years and over | 7 (30.4%) | 0 (0.0%) |
Disability Class by Sex by Age in Pittman
Disability Class: Hearing Difficulty
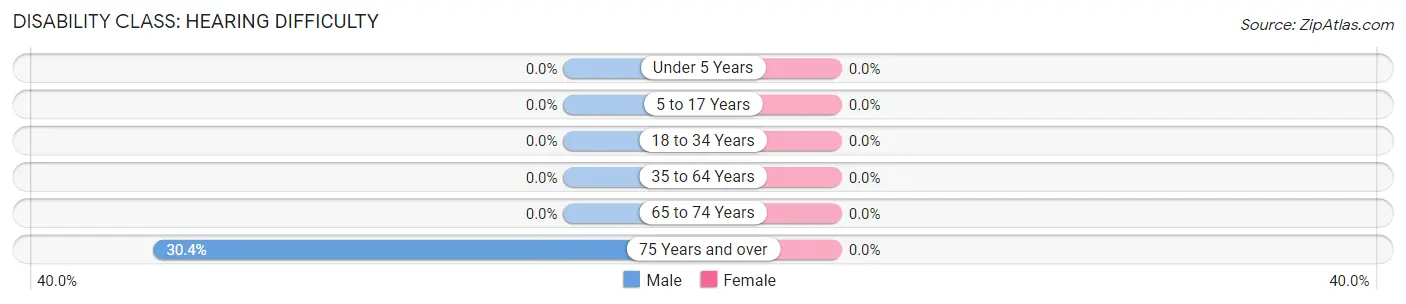
| Age Bracket | Male | Female |
| Under 5 Years | 0 (0.0%) | 0 (0.0%) |
| 5 to 17 Years | 0 (0.0%) | 0 (0.0%) |
| 18 to 34 Years | 0 (0.0%) | 0 (0.0%) |
| 35 to 64 Years | 0 (0.0%) | 0 (0.0%) |
| 65 to 74 Years | 0 (0.0%) | 0 (0.0%) |
| 75 Years and over | 7 (30.4%) | 0 (0.0%) |
Disability Class: Vision Difficulty
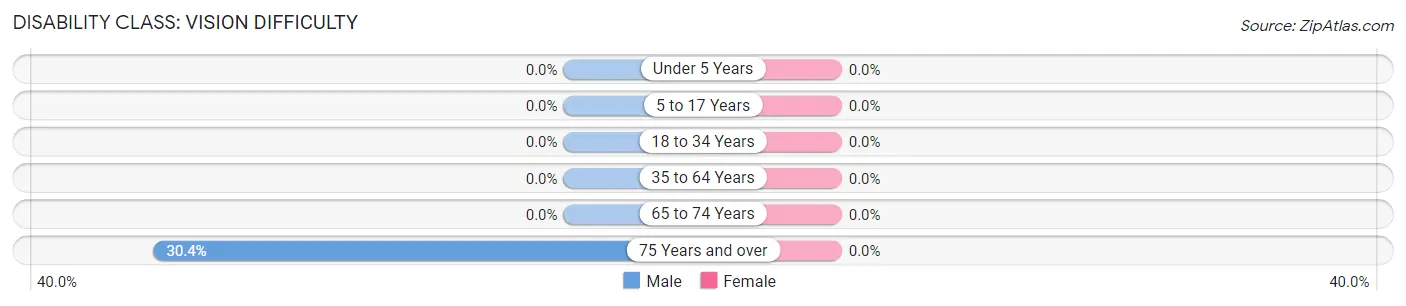
| Age Bracket | Male | Female |
| Under 5 Years | 0 (0.0%) | 0 (0.0%) |
| 5 to 17 Years | 0 (0.0%) | 0 (0.0%) |
| 18 to 34 Years | 0 (0.0%) | 0 (0.0%) |
| 35 to 64 Years | 0 (0.0%) | 0 (0.0%) |
| 65 to 74 Years | 0 (0.0%) | 0 (0.0%) |
| 75 Years and over | 7 (30.4%) | 0 (0.0%) |
Disability Class: Cognitive Difficulty
| Age Bracket | Male | Female |
| 5 to 17 Years | 0 (0.0%) | 0 (0.0%) |
| 18 to 34 Years | 0 (0.0%) | 0 (0.0%) |
| 35 to 64 Years | 0 (0.0%) | 0 (0.0%) |
| 65 to 74 Years | 0 (0.0%) | 0 (0.0%) |
| 75 Years and over | 0 (0.0%) | 0 (0.0%) |
Disability Class: Ambulatory Difficulty
| Age Bracket | Male | Female |
| 5 to 17 Years | 0 (0.0%) | 0 (0.0%) |
| 18 to 34 Years | 0 (0.0%) | 0 (0.0%) |
| 35 to 64 Years | 0 (0.0%) | 0 (0.0%) |
| 65 to 74 Years | 0 (0.0%) | 0 (0.0%) |
| 75 Years and over | 0 (0.0%) | 0 (0.0%) |
Disability Class: Self-Care Difficulty
| Age Bracket | Male | Female |
| 5 to 17 Years | 0 (0.0%) | 0 (0.0%) |
| 18 to 34 Years | 0 (0.0%) | 0 (0.0%) |
| 35 to 64 Years | 0 (0.0%) | 0 (0.0%) |
| 65 to 74 Years | 0 (0.0%) | 0 (0.0%) |
| 75 Years and over | 0 (0.0%) | 0 (0.0%) |
Technology Access in Pittman
Computing Device Access in Pittman
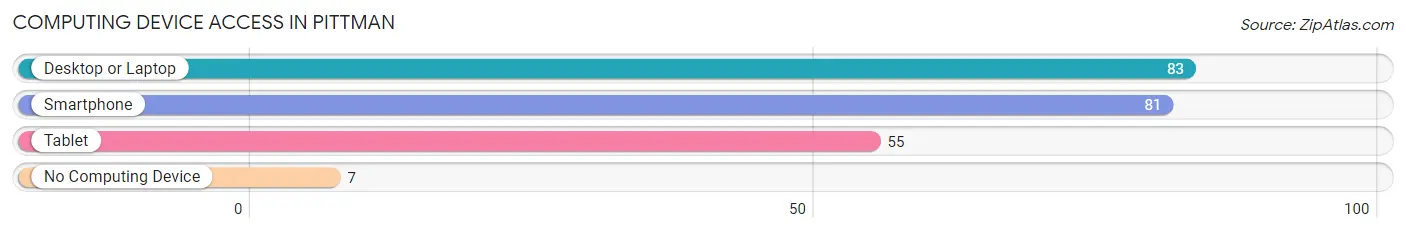
| Device Type | # Households | % Households |
| Desktop or Laptop | 83 | 92.2% |
| Smartphone | 81 | 90.0% |
| Tablet | 55 | 61.1% |
| No Computing Device | 7 | 7.8% |
| Total | 90 | 100.0% |
Internet Access in Pittman
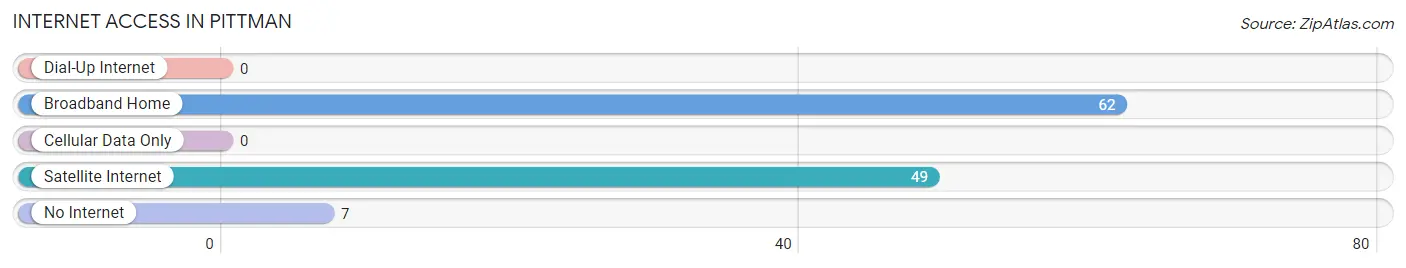
| Internet Type | # Households | % Households |
| Dial-Up Internet | 0 | 0.0% |
| Broadband Home | 62 | 68.9% |
| Cellular Data Only | 0 | 0.0% |
| Satellite Internet | 49 | 54.4% |
| No Internet | 7 | 7.8% |
| Total | 90 | 100.0% |
Pittman Summary
Pittman, Florida is a small town located in the northern part of the state, in Santa Rosa County. It is situated on the banks of the Blackwater River, and is home to a population of just over 1,000 people. The town was founded in 1887 by William Pittman, a former Confederate soldier, and was named after him.
Geography
Pittman is located in the northern part of Santa Rosa County, Florida, and is situated on the banks of the Blackwater River. The town is located about 25 miles east of Pensacola, and is bordered by the towns of Milton and Pace. The town is located in a rural area, and is surrounded by forests and wetlands. The town is located at an elevation of about 30 feet above sea level.
Economy
The economy of Pittman is largely based on agriculture and forestry. The town is home to several farms, and the surrounding area is home to a variety of timber and paper mills. The town is also home to a number of small businesses, including restaurants, convenience stores, and other retail establishments.
Demographics
As of the 2010 census, the population of Pittman was 1,072. The racial makeup of the town was 94.3% White, 2.2% African American, 0.7% Native American, 0.3% Asian, 0.1% Pacific Islander, and 2.4% from other races. The median household income in the town was $37,917, and the median family income was $45,625. The per capita income in the town was $19,845.
Education
The town is served by the Santa Rosa County School District, and is home to Pittman Elementary School. The school serves students in grades K-5, and is part of the district's elementary school system. The town is also home to a number of private schools, including the Pittman Christian Academy and the Pittman Academy of Arts and Sciences.
Conclusion
Pittman, Florida is a small town located in the northern part of the state, in Santa Rosa County. It is situated on the banks of the Blackwater River, and is home to a population of just over 1,000 people. The town was founded in 1887 by William Pittman, a former Confederate soldier, and was named after him. The economy of Pittman is largely based on agriculture and forestry, and the town is served by the Santa Rosa County School District. Pittman is a small, rural town with a rich history and a diverse population.
Common Questions
What is Per Capita Income in Pittman?
Per Capita income in Pittman is $41,320.
What is the Median Family Income in Pittman?
Median Family Income in Pittman is $59,048.
What is the Median Household income in Pittman?
Median Household Income in Pittman is $58,571.
What is Inequality or Gini Index in Pittman?
Inequality or Gini Index in Pittman is 0.55.
What is the Total Population of Pittman?
Total Population of Pittman is 214.
What is the Total Male Population of Pittman?
Total Male Population of Pittman is 157.
What is the Total Female Population of Pittman?
Total Female Population of Pittman is 57.
What is the Ratio of Males per 100 Females in Pittman?
There are 275.44 Males per 100 Females in Pittman.
What is the Ratio of Females per 100 Males in Pittman?
There are 36.31 Females per 100 Males in Pittman.
What is the Median Population Age in Pittman?
Median Population Age in Pittman is 57.7 Years.
What is the Average Family Size in Pittman
Average Family Size in Pittman is 2.5 People.
What is the Average Household Size in Pittman
Average Household Size in Pittman is 2.4 People.
How Large is the Labor Force in Pittman?
There are 46 People in the Labor Forcein in Pittman.
What is the Percentage of People in the Labor Force in Pittman?
23.8% of People are in the Labor Force in Pittman.