Lely, FL Map & Demographics
Lely Map
Lely Overview
$43,936
PER CAPITA INCOME
$77,031
AVG FAMILY INCOME
$59,167
AVG HOUSEHOLD INCOME
10.3%
WAGE / INCOME GAP [ % ]
89.7¢/ $1
WAGE / INCOME GAP [ $ ]
0.44
INEQUALITY / GINI INDEX
3,548
TOTAL POPULATION
1,672
MALE POPULATION
1,876
FEMALE POPULATION
89.13
MALES / 100 FEMALES
112.20
FEMALES / 100 MALES
66.6
MEDIAN AGE
2.4
AVG FAMILY SIZE
1.9
AVG HOUSEHOLD SIZE
1,459
LABOR FORCE [ PEOPLE ]
43.6%
PERCENT IN LABOR FORCE
2.9%
UNEMPLOYMENT RATE
Income in Lely
Income Overview in Lely
Per Capita Income in Lely is $43,936, while median incomes of families and households are $77,031 and $59,167 respectively.
| Characteristic | Number | Measure |
| Per Capita Income | 3,548 | $43,936 |
| Median Family Income | 1,020 | $77,031 |
| Mean Family Income | 1,020 | $100,902 |
| Median Household Income | 1,736 | $59,167 |
| Mean Household Income | 1,736 | $83,188 |
| Income Deficit | 1,020 | $0 |
| Wage / Income Gap (%) | 3,548 | 10.30% |
| Wage / Income Gap ($) | 3,548 | 89.70¢ per $1 |
| Gini / Inequality Index | 3,548 | 0.44 |
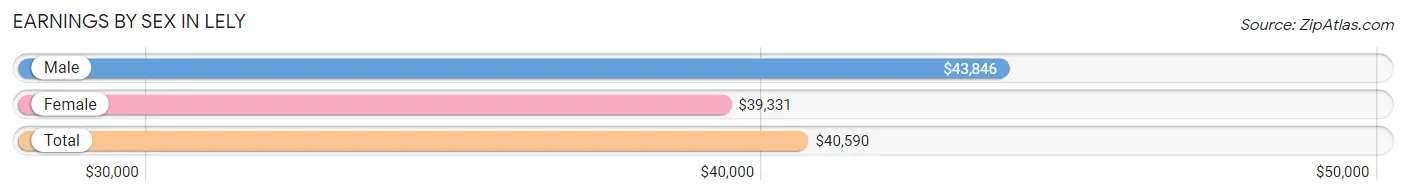
Earnings by Sex in Lely
Average Earnings in Lely are $40,590, $43,846 for men and $39,331 for women, a difference of 10.3%.
| Sex | Number | Average Earnings |
| Male | 828 (52.2%) | $43,846 |
| Female | 759 (47.8%) | $39,331 |
| Total | 1,587 (100.0%) | $40,590 |
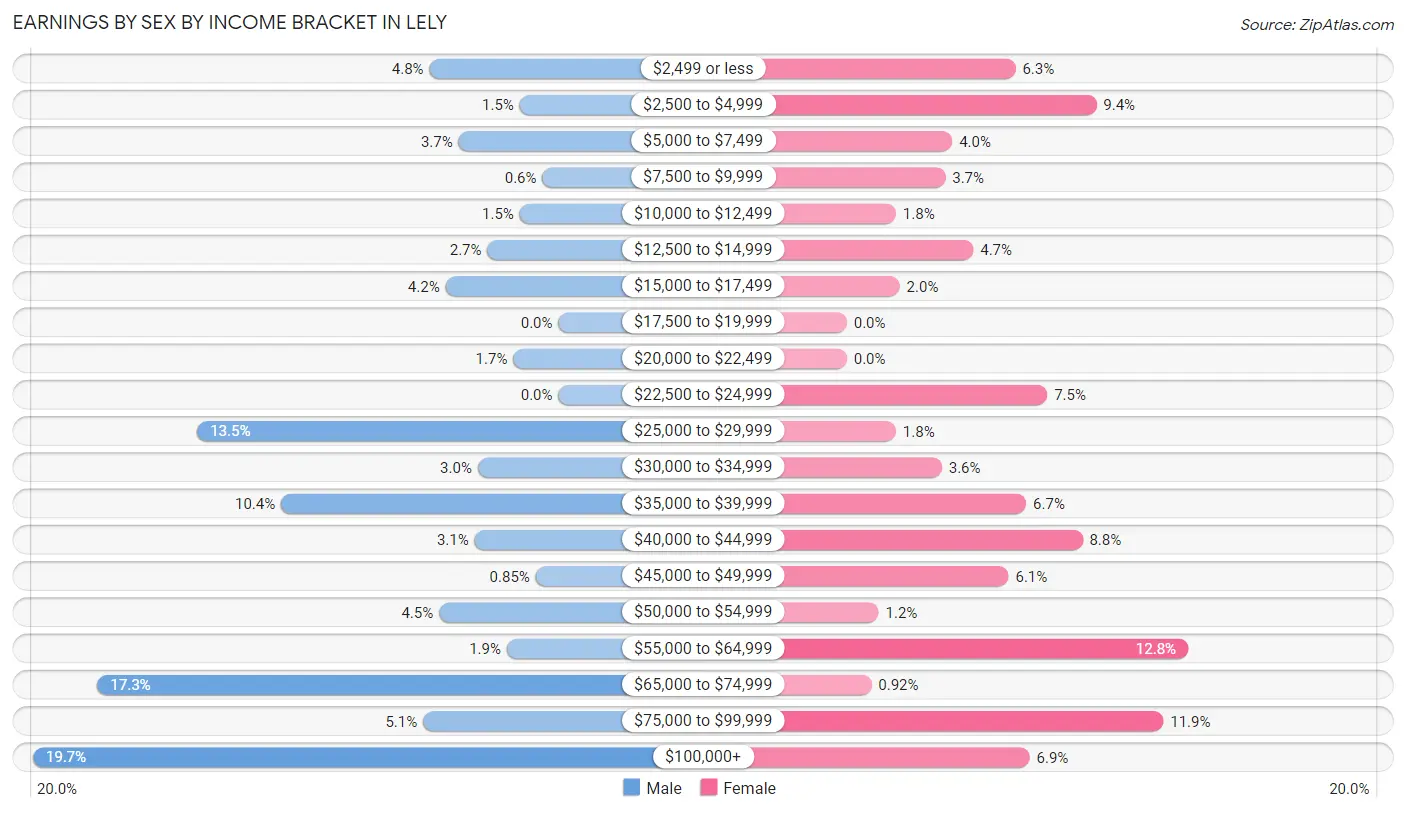
Earnings by Sex by Income Bracket in Lely
The most common earnings brackets in Lely are $100,000+ for men (163 | 19.7%) and $55,000 to $64,999 for women (97 | 12.8%).
| Income | Male | Female |
| $2,499 or less | 40 (4.8%) | 48 (6.3%) |
| $2,500 to $4,999 | 12 (1.5%) | 71 (9.3%) |
| $5,000 to $7,499 | 31 (3.7%) | 30 (4.0%) |
| $7,500 to $9,999 | 5 (0.6%) | 28 (3.7%) |
| $10,000 to $12,499 | 12 (1.5%) | 14 (1.8%) |
| $12,500 to $14,999 | 22 (2.7%) | 36 (4.7%) |
| $15,000 to $17,499 | 35 (4.2%) | 15 (2.0%) |
| $17,500 to $19,999 | 0 (0.0%) | 0 (0.0%) |
| $20,000 to $22,499 | 14 (1.7%) | 0 (0.0%) |
| $22,500 to $24,999 | 0 (0.0%) | 57 (7.5%) |
| $25,000 to $29,999 | 112 (13.5%) | 14 (1.8%) |
| $30,000 to $34,999 | 25 (3.0%) | 27 (3.6%) |
| $35,000 to $39,999 | 86 (10.4%) | 51 (6.7%) |
| $40,000 to $44,999 | 26 (3.1%) | 67 (8.8%) |
| $45,000 to $49,999 | 7 (0.9%) | 46 (6.1%) |
| $50,000 to $54,999 | 37 (4.5%) | 9 (1.2%) |
| $55,000 to $64,999 | 16 (1.9%) | 97 (12.8%) |
| $65,000 to $74,999 | 143 (17.3%) | 7 (0.9%) |
| $75,000 to $99,999 | 42 (5.1%) | 90 (11.9%) |
| $100,000+ | 163 (19.7%) | 52 (6.9%) |
| Total | 828 (100.0%) | 759 (100.0%) |
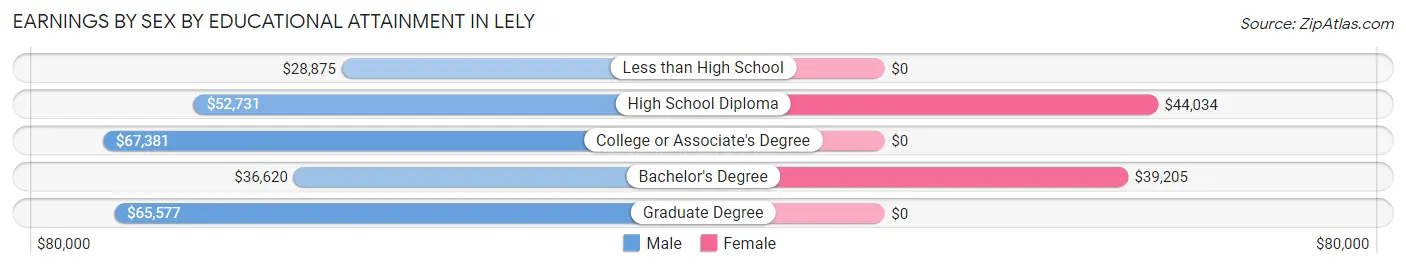
Earnings by Sex by Educational Attainment in Lely
Average earnings in Lely are $50,125 for men and $40,326 for women, a difference of 19.6%. Men with an educational attainment of college or associate's degree enjoy the highest average annual earnings of $67,381, while those with less than high school education earn the least with $28,875. Women with an educational attainment of high school diploma earn the most with the average annual earnings of $44,034, while those with bachelor's degree education have the smallest earnings of $39,205.
| Educational Attainment | Male Income | Female Income |
| Less than High School | $28,875 | $0 |
| High School Diploma | $52,731 | $44,034 |
| College or Associate's Degree | $67,381 | $0 |
| Bachelor's Degree | $36,620 | $39,205 |
| Graduate Degree | $65,577 | $0 |
| Total | $50,125 | $40,326 |
Family Income in Lely
Family Income Brackets in Lely
According to the Lely family income data, there are 197 families falling into the $35,000 to $49,999 income range, which is the most common income bracket and makes up 19.3% of all families.
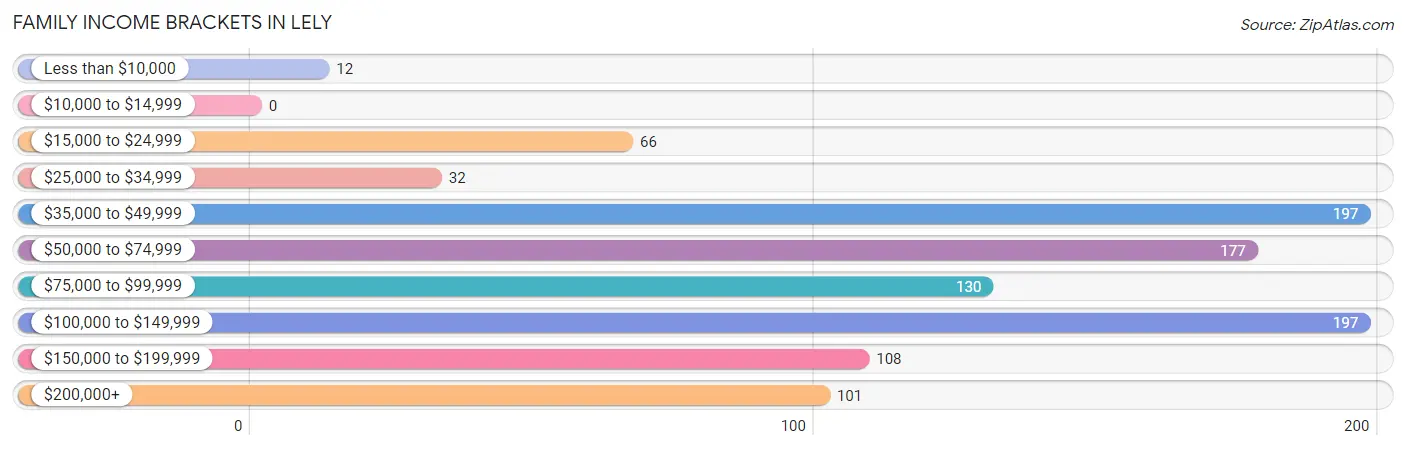
| Income Bracket | # Families | % Families |
| Less than $10,000 | 12 | 1.2% |
| $10,000 to $14,999 | 0 | 0.0% |
| $15,000 to $24,999 | 66 | 6.5% |
| $25,000 to $34,999 | 32 | 3.1% |
| $35,000 to $49,999 | 197 | 19.3% |
| $50,000 to $74,999 | 177 | 17.4% |
| $75,000 to $99,999 | 130 | 12.7% |
| $100,000 to $149,999 | 197 | 19.3% |
| $150,000 to $199,999 | 108 | 10.6% |
| $200,000+ | 101 | 9.9% |
Family Income by Famaliy Size in Lely
4-person families (89 | 8.7%) account for the highest median family income in Lely with $117,731 per family, while 2-person families (853 | 83.6%) have the highest median income of $37,378 per family member.
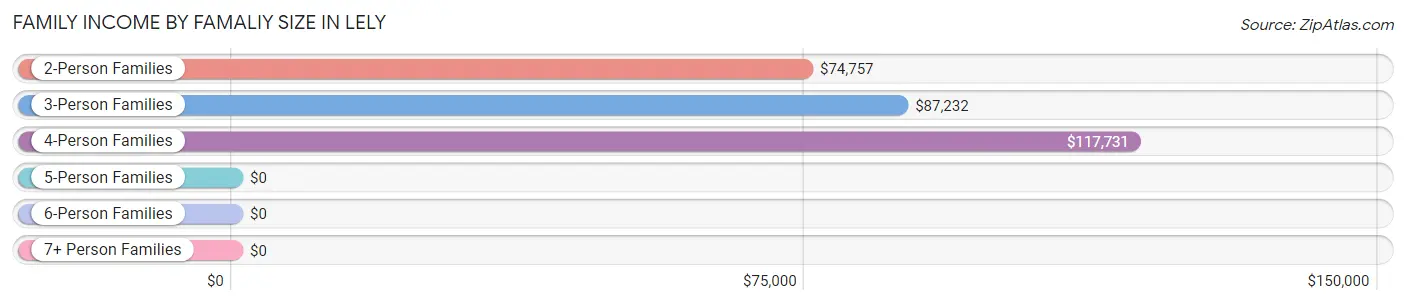
| Income Bracket | # Families | Median Income |
| 2-Person Families | 853 (83.6%) | $74,757 |
| 3-Person Families | 69 (6.8%) | $87,232 |
| 4-Person Families | 89 (8.7%) | $117,731 |
| 5-Person Families | 9 (0.9%) | $0 |
| 6-Person Families | 0 (0.0%) | $0 |
| 7+ Person Families | 0 (0.0%) | $0 |
| Total | 1,020 (100.0%) | $77,031 |
Family Income by Number of Earners in Lely
The median family income in Lely is $77,031, with families comprising 3+ earners (23) having the highest median family income of $193,083, while families with no earners (311) have the lowest median family income of $49,425, accounting for 2.2% and 30.5% of families, respectively.
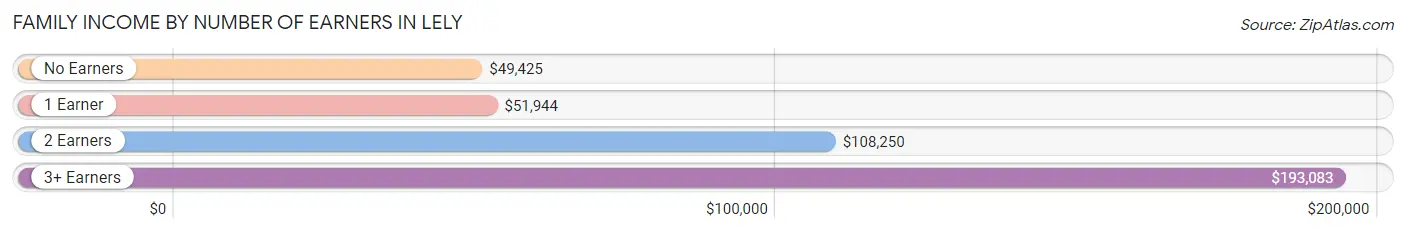
| Number of Earners | # Families | Median Income |
| No Earners | 311 (30.5%) | $49,425 |
| 1 Earner | 260 (25.5%) | $51,944 |
| 2 Earners | 426 (41.8%) | $108,250 |
| 3+ Earners | 23 (2.2%) | $193,083 |
| Total | 1,020 (100.0%) | $77,031 |
Household Income in Lely
Household Income Brackets in Lely
With 399 households falling in the category, the $50,000 to $74,999 income range is the most frequent in Lely, accounting for 23.0% of all households. In contrast, only 14 households (0.8%) fall into the $10,000 to $14,999 income bracket, making it the least populous group.
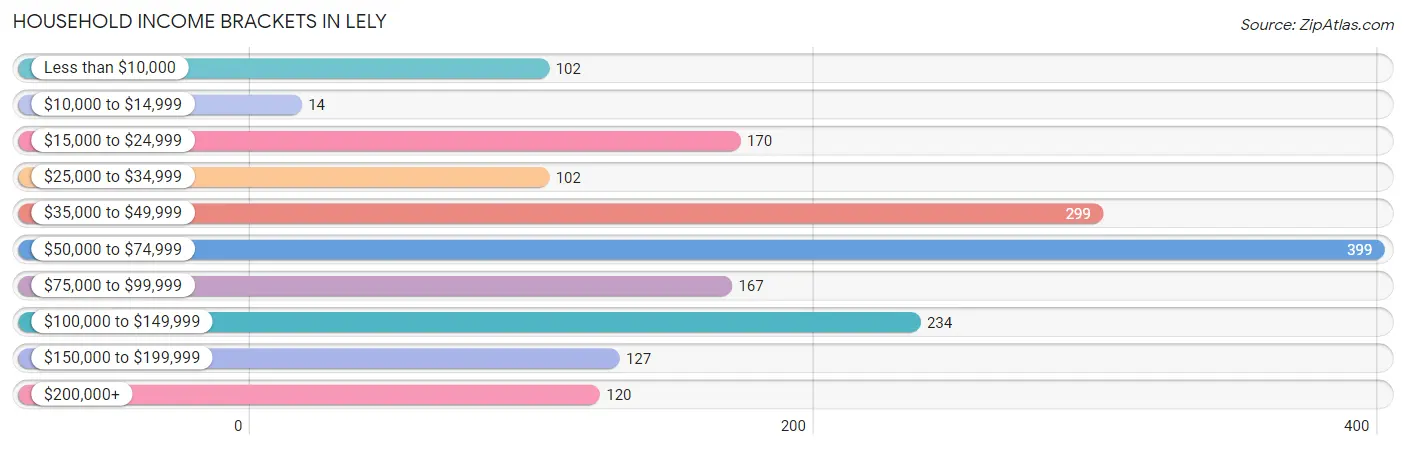
| Income Bracket | # Households | % Households |
| Less than $10,000 | 102 | 5.9% |
| $10,000 to $14,999 | 14 | 0.8% |
| $15,000 to $24,999 | 170 | 9.8% |
| $25,000 to $34,999 | 102 | 5.9% |
| $35,000 to $49,999 | 299 | 17.2% |
| $50,000 to $74,999 | 399 | 23.0% |
| $75,000 to $99,999 | 167 | 9.6% |
| $100,000 to $149,999 | 234 | 13.5% |
| $150,000 to $199,999 | 127 | 7.3% |
| $200,000+ | 120 | 6.9% |
Household Income by Householder Age in Lely
The median household income in Lely is $59,167, with the highest median household income of $75,795 found in the 45 to 64 years age bracket for the primary householder. A total of 485 households (27.9%) fall into this category. Meanwhile, the 15 to 24 years age bracket for the primary householder has the lowest median household income of $0, with 11 households (0.6%) in this group.
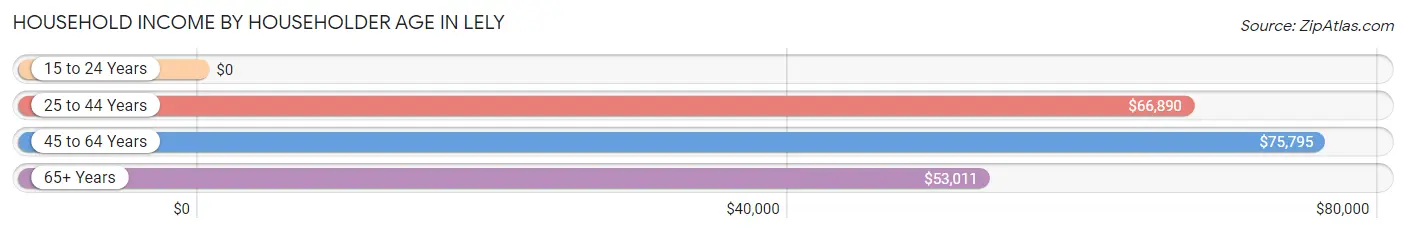
| Income Bracket | # Households | Median Income |
| 15 to 24 Years | 11 (0.6%) | $0 |
| 25 to 44 Years | 144 (8.3%) | $66,890 |
| 45 to 64 Years | 485 (27.9%) | $75,795 |
| 65+ Years | 1,096 (63.1%) | $53,011 |
| Total | 1,736 (100.0%) | $59,167 |
Poverty in Lely
Income Below Poverty by Sex and Age in Lely
With 5.1% poverty level for males and 11.5% for females among the residents of Lely, 25 to 34 year old males and 75 year old and over females are the most vulnerable to poverty, with 23 males (37.7%) and 86 females (16.0%) in their respective age groups living below the poverty level.
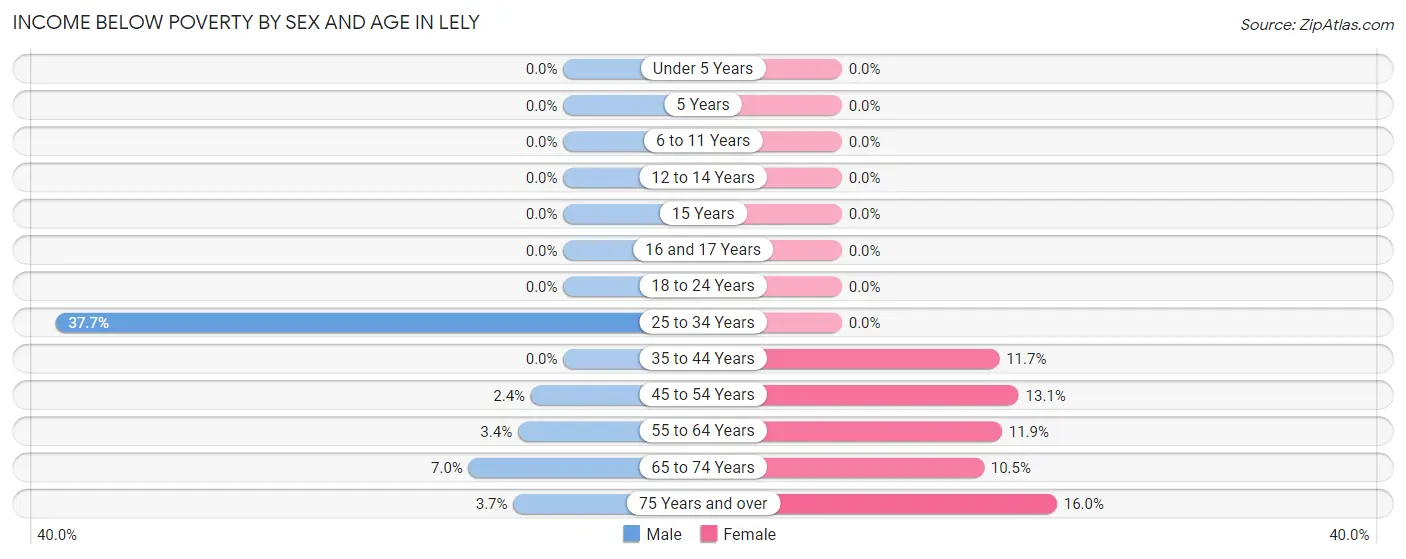
| Age Bracket | Male | Female |
| Under 5 Years | 0 (0.0%) | 0 (0.0%) |
| 5 Years | 0 (0.0%) | 0 (0.0%) |
| 6 to 11 Years | 0 (0.0%) | 0 (0.0%) |
| 12 to 14 Years | 0 (0.0%) | 0 (0.0%) |
| 15 Years | 0 (0.0%) | 0 (0.0%) |
| 16 and 17 Years | 0 (0.0%) | 0 (0.0%) |
| 18 to 24 Years | 0 (0.0%) | 0 (0.0%) |
| 25 to 34 Years | 23 (37.7%) | 0 (0.0%) |
| 35 to 44 Years | 0 (0.0%) | 9 (11.7%) |
| 45 to 54 Years | 7 (2.4%) | 34 (13.1%) |
| 55 to 64 Years | 7 (3.4%) | 31 (11.9%) |
| 65 to 74 Years | 27 (7.0%) | 41 (10.5%) |
| 75 Years and over | 15 (3.7%) | 86 (16.0%) |
| Total | 79 (5.1%) | 201 (11.5%) |
Income Above Poverty by Sex and Age in Lely
According to the poverty statistics in Lely, males aged under 5 years and females aged under 5 years are the age groups that are most secure financially, with 100.0% of males and 100.0% of females in these age groups living above the poverty line.
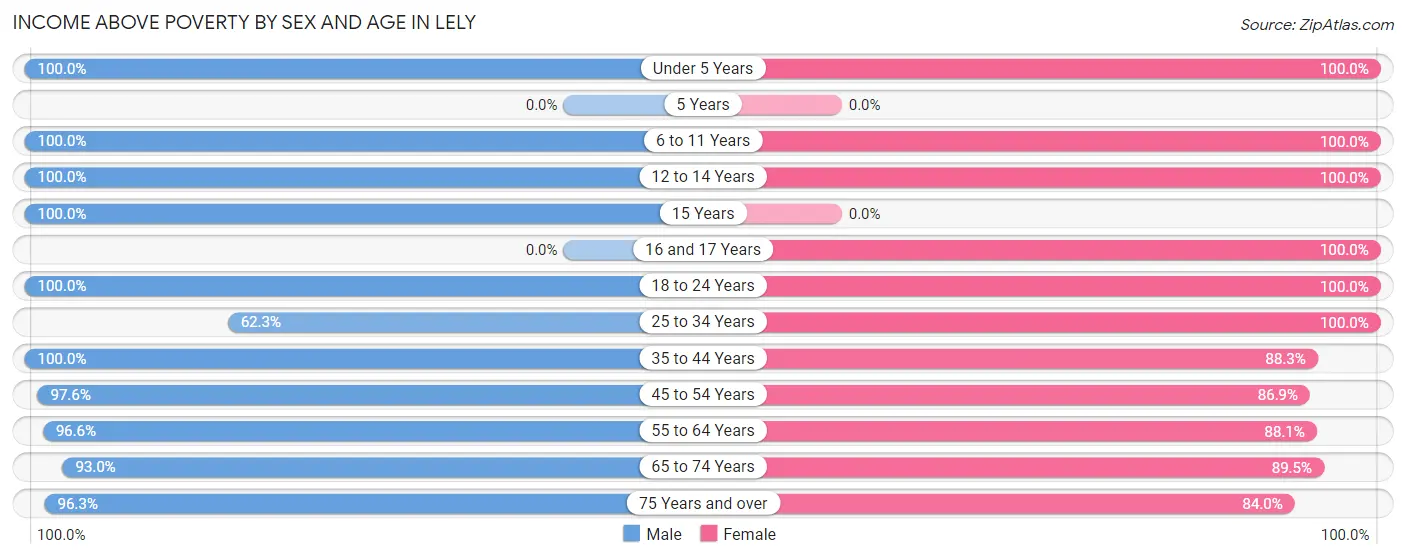
| Age Bracket | Male | Female |
| Under 5 Years | 25 (100.0%) | 19 (100.0%) |
| 5 Years | 0 (0.0%) | 0 (0.0%) |
| 6 to 11 Years | 3 (100.0%) | 69 (100.0%) |
| 12 to 14 Years | 45 (100.0%) | 13 (100.0%) |
| 15 Years | 28 (100.0%) | 0 (0.0%) |
| 16 and 17 Years | 0 (0.0%) | 10 (100.0%) |
| 18 to 24 Years | 30 (100.0%) | 59 (100.0%) |
| 25 to 34 Years | 38 (62.3%) | 56 (100.0%) |
| 35 to 44 Years | 75 (100.0%) | 68 (88.3%) |
| 45 to 54 Years | 283 (97.6%) | 225 (86.9%) |
| 55 to 64 Years | 201 (96.6%) | 230 (88.1%) |
| 65 to 74 Years | 357 (93.0%) | 348 (89.5%) |
| 75 Years and over | 389 (96.3%) | 453 (84.0%) |
| Total | 1,474 (94.9%) | 1,550 (88.5%) |
Income Below Poverty Among Married-Couple Families in Lely
The poverty statistics for married-couple families in Lely show that 4.3% or 37 of the total 850 families live below the poverty line. Families with no children have the highest poverty rate of 4.7%, comprising of 37 families. On the other hand, families with 1 or 2 children have the lowest poverty rate of 0.0%, which includes 0 families.
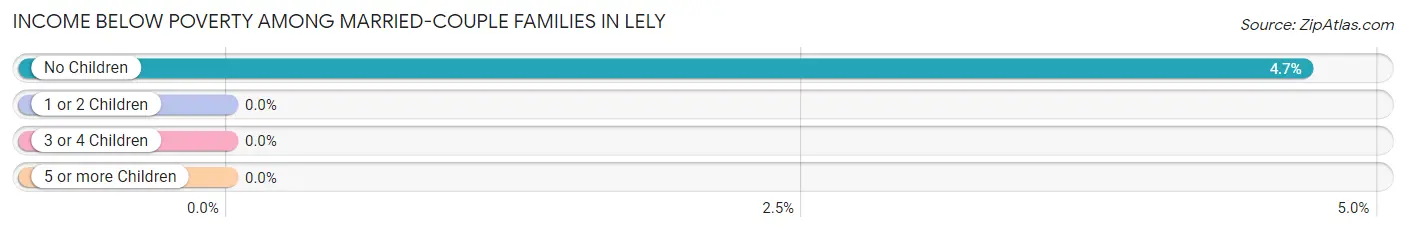
| Children | Above Poverty | Below Poverty |
| No Children | 754 (95.3%) | 37 (4.7%) |
| 1 or 2 Children | 56 (100.0%) | 0 (0.0%) |
| 3 or 4 Children | 3 (100.0%) | 0 (0.0%) |
| 5 or more Children | 0 (0.0%) | 0 (0.0%) |
| Total | 813 (95.7%) | 37 (4.3%) |
Income Below Poverty Among Single-Parent Households in Lely
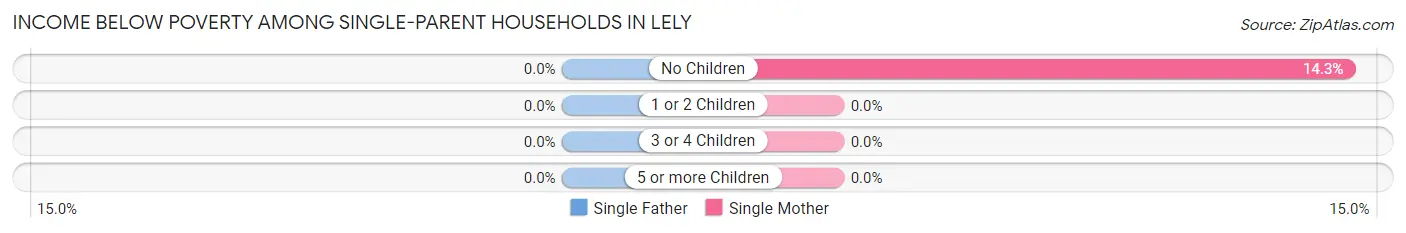
| Children | Single Father | Single Mother |
| No Children | 0 (0.0%) | 12 (14.3%) |
| 1 or 2 Children | 0 (0.0%) | 0 (0.0%) |
| 3 or 4 Children | 0 (0.0%) | 0 (0.0%) |
| 5 or more Children | 0 (0.0%) | 0 (0.0%) |
| Total | 0 (0.0%) | 12 (10.2%) |
Income Below Poverty Among Married-Couple vs Single-Parent Households in Lely
The poverty data for Lely shows that 37 of the married-couple family households (4.3%) and 12 of the single-parent households (7.1%) are living below the poverty level. Within the married-couple family households, those with no children have the highest poverty rate, with 37 households (4.7%) falling below the poverty line. Among the single-parent households, those with no children have the highest poverty rate, with 12 household (9.8%) living below poverty.
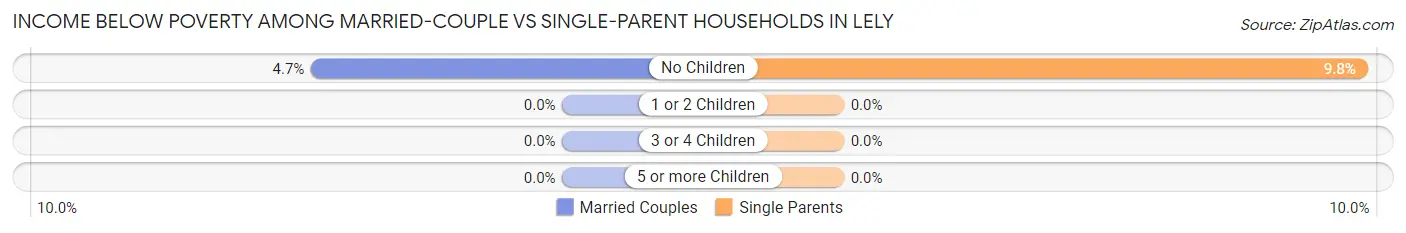
| Children | Married-Couple Families | Single-Parent Households |
| No Children | 37 (4.7%) | 12 (9.8%) |
| 1 or 2 Children | 0 (0.0%) | 0 (0.0%) |
| 3 or 4 Children | 0 (0.0%) | 0 (0.0%) |
| 5 or more Children | 0 (0.0%) | 0 (0.0%) |
| Total | 37 (4.3%) | 12 (7.1%) |
Race in Lely
The most populous races in Lely are White / Caucasian (3,194 | 90.0%), Hispanic or Latino (423 | 11.9%), and Two or more Races (178 | 5.0%).
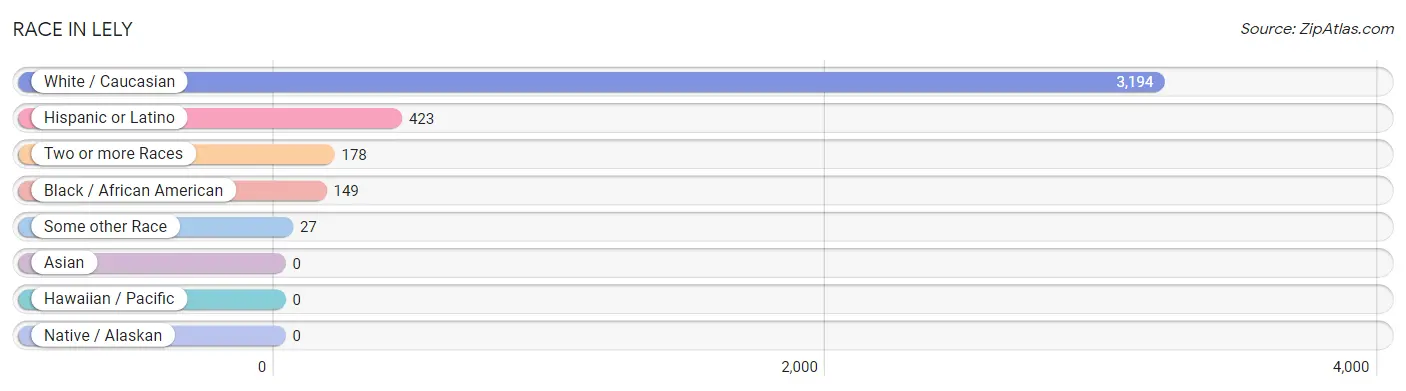
| Race | # Population | % Population |
| Asian | 0 | 0.0% |
| Black / African American | 149 | 4.2% |
| Hawaiian / Pacific | 0 | 0.0% |
| Hispanic or Latino | 423 | 11.9% |
| Native / Alaskan | 0 | 0.0% |
| White / Caucasian | 3,194 | 90.0% |
| Two or more Races | 178 | 5.0% |
| Some other Race | 27 | 0.8% |
| Total | 3,548 | 100.0% |
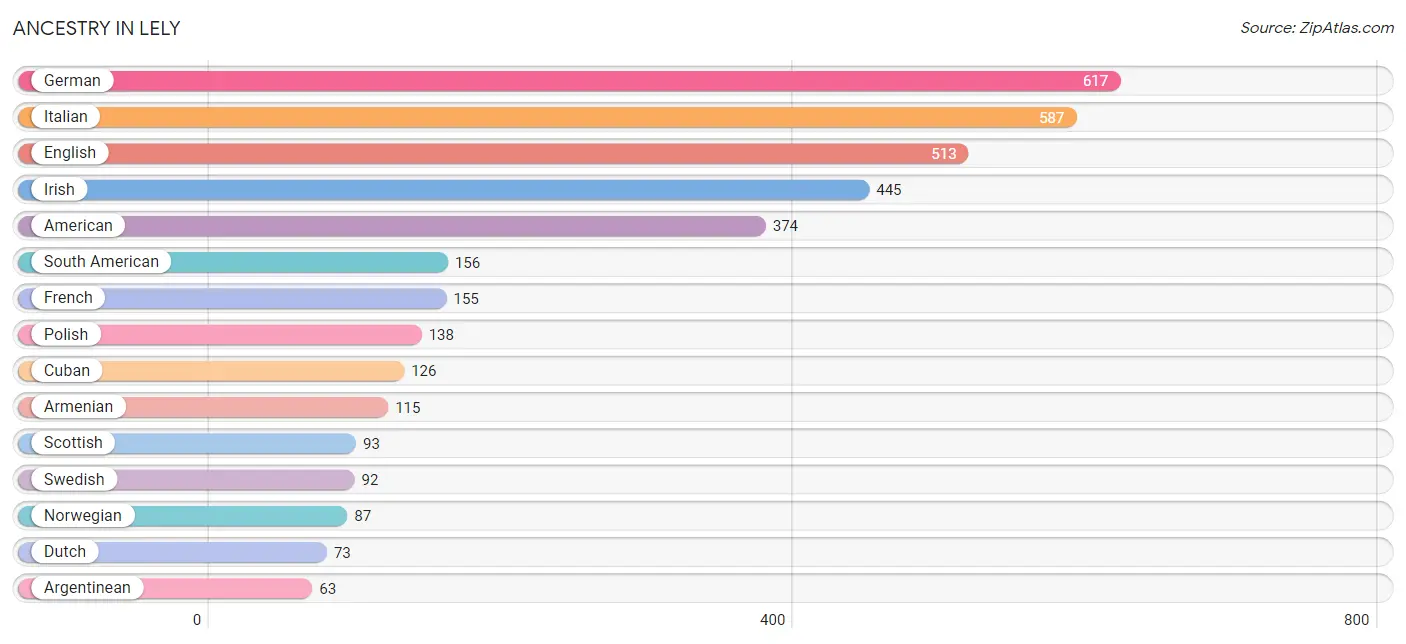
Ancestry in Lely
The most populous ancestries reported in Lely are German (617 | 17.4%), Italian (587 | 16.5%), English (513 | 14.5%), Irish (445 | 12.5%), and American (374 | 10.5%), together accounting for 71.5% of all Lely residents.
| Ancestry | # Population | % Population |
| American | 374 | 10.5% |
| Argentinean | 63 | 1.8% |
| Armenian | 115 | 3.2% |
| Belgian | 13 | 0.4% |
| British | 37 | 1.0% |
| Canadian | 56 | 1.6% |
| Central American | 21 | 0.6% |
| Cherokee | 49 | 1.4% |
| Colombian | 42 | 1.2% |
| Cuban | 126 | 3.5% |
| Czechoslovakian | 15 | 0.4% |
| Dominican | 29 | 0.8% |
| Dutch | 73 | 2.1% |
| Eastern European | 21 | 0.6% |
| Ecuadorian | 51 | 1.4% |
| English | 513 | 14.5% |
| European | 34 | 1.0% |
| French | 155 | 4.4% |
| French Canadian | 10 | 0.3% |
| German | 617 | 17.4% |
| Greek | 35 | 1.0% |
| Guatemalan | 21 | 0.6% |
| Hungarian | 8 | 0.2% |
| Irish | 445 | 12.5% |
| Italian | 587 | 16.5% |
| Korean | 7 | 0.2% |
| Mexican | 55 | 1.5% |
| Norwegian | 87 | 2.5% |
| Polish | 138 | 3.9% |
| Portuguese | 20 | 0.6% |
| Puerto Rican | 26 | 0.7% |
| Russian | 16 | 0.4% |
| Scandinavian | 34 | 1.0% |
| Scotch-Irish | 49 | 1.4% |
| Scottish | 93 | 2.6% |
| Slovak | 53 | 1.5% |
| South American | 156 | 4.4% |
| Spaniard | 8 | 0.2% |
| Swedish | 92 | 2.6% |
| Swiss | 10 | 0.3% |
| Turkish | 26 | 0.7% |
| Welsh | 44 | 1.2% | View All 42 Rows |
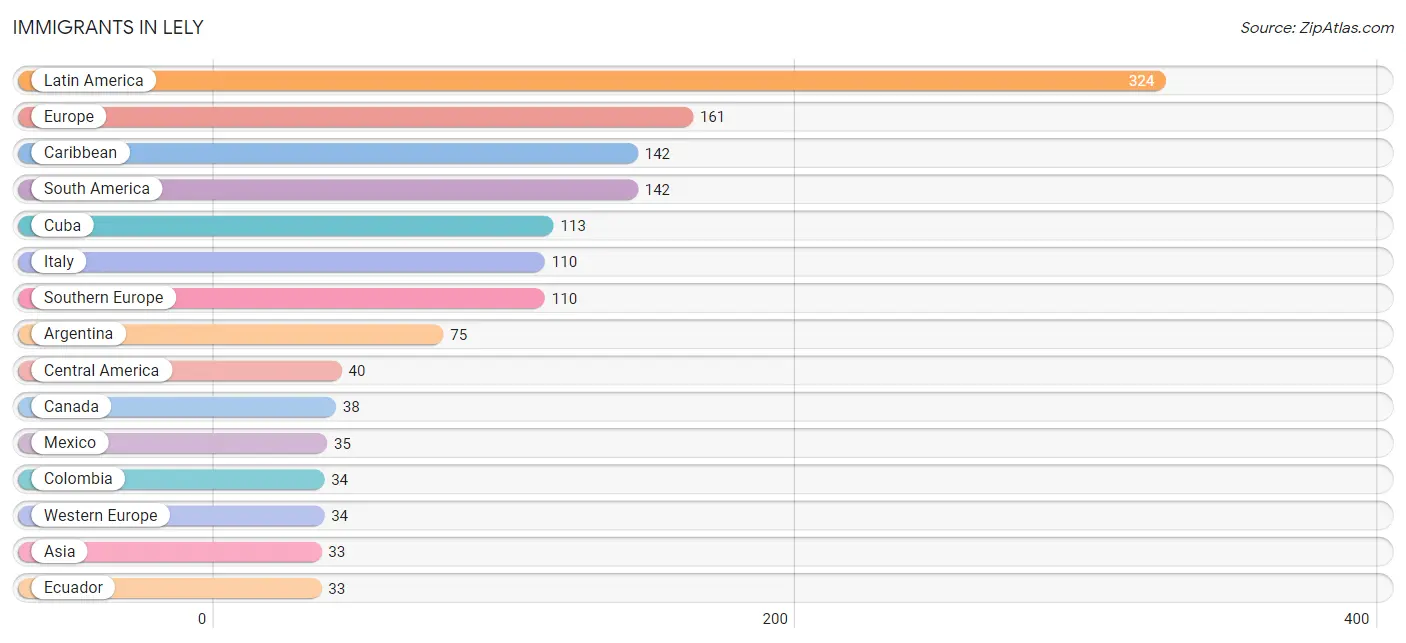
Immigrants in Lely
The most numerous immigrant groups reported in Lely came from Latin America (324 | 9.1%), Europe (161 | 4.5%), Caribbean (142 | 4.0%), South America (142 | 4.0%), and Cuba (113 | 3.2%), together accounting for 24.9% of all Lely residents.
| Immigration Origin | # Population | % Population |
| Argentina | 75 | 2.1% |
| Asia | 33 | 0.9% |
| Canada | 38 | 1.1% |
| Caribbean | 142 | 4.0% |
| Central America | 40 | 1.1% |
| Colombia | 34 | 1.0% |
| Cuba | 113 | 3.2% |
| Dominican Republic | 29 | 0.8% |
| Ecuador | 33 | 0.9% |
| El Salvador | 5 | 0.1% |
| Europe | 161 | 4.5% |
| France | 22 | 0.6% |
| Germany | 12 | 0.3% |
| Ireland | 5 | 0.1% |
| Italy | 110 | 3.1% |
| Latin America | 324 | 9.1% |
| Lebanon | 33 | 0.9% |
| Mexico | 35 | 1.0% |
| Northern Europe | 17 | 0.5% |
| Scotland | 12 | 0.3% |
| South America | 142 | 4.0% |
| Southern Europe | 110 | 3.1% |
| Western Asia | 33 | 0.9% |
| Western Europe | 34 | 1.0% | View All 24 Rows |
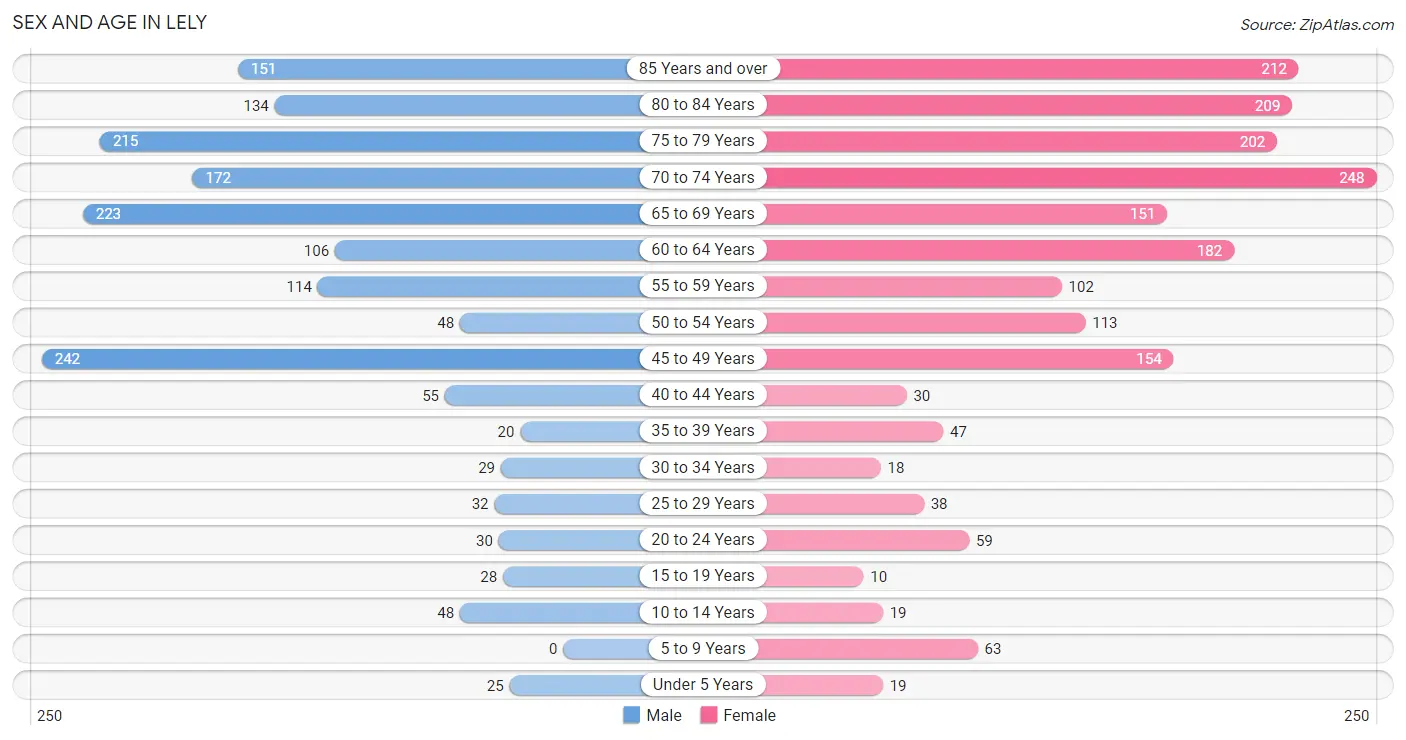
Sex and Age in Lely
Sex and Age in Lely
The most populous age groups in Lely are 45 to 49 Years (242 | 14.5%) for men and 70 to 74 Years (248 | 13.2%) for women.
| Age Bracket | Male | Female |
| Under 5 Years | 25 (1.5%) | 19 (1.0%) |
| 5 to 9 Years | 0 (0.0%) | 63 (3.4%) |
| 10 to 14 Years | 48 (2.9%) | 19 (1.0%) |
| 15 to 19 Years | 28 (1.7%) | 10 (0.5%) |
| 20 to 24 Years | 30 (1.8%) | 59 (3.1%) |
| 25 to 29 Years | 32 (1.9%) | 38 (2.0%) |
| 30 to 34 Years | 29 (1.7%) | 18 (1.0%) |
| 35 to 39 Years | 20 (1.2%) | 47 (2.5%) |
| 40 to 44 Years | 55 (3.3%) | 30 (1.6%) |
| 45 to 49 Years | 242 (14.5%) | 154 (8.2%) |
| 50 to 54 Years | 48 (2.9%) | 113 (6.0%) |
| 55 to 59 Years | 114 (6.8%) | 102 (5.4%) |
| 60 to 64 Years | 106 (6.3%) | 182 (9.7%) |
| 65 to 69 Years | 223 (13.3%) | 151 (8.1%) |
| 70 to 74 Years | 172 (10.3%) | 248 (13.2%) |
| 75 to 79 Years | 215 (12.9%) | 202 (10.8%) |
| 80 to 84 Years | 134 (8.0%) | 209 (11.1%) |
| 85 Years and over | 151 (9.0%) | 212 (11.3%) |
| Total | 1,672 (100.0%) | 1,876 (100.0%) |
Families and Households in Lely
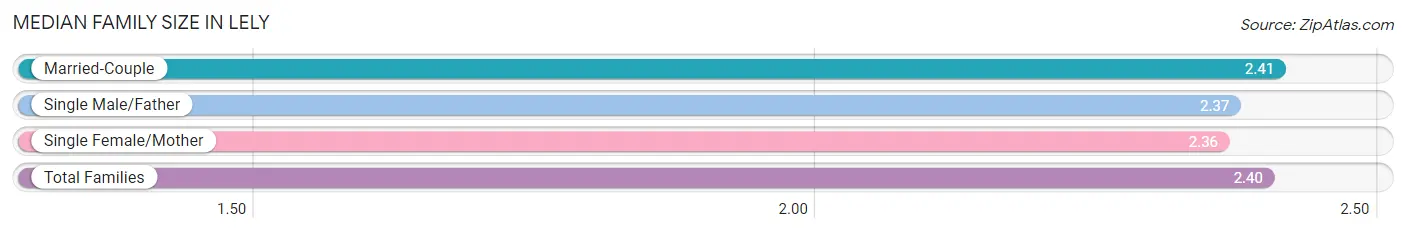
Median Family Size in Lely
The median family size in Lely is 2.40 persons per family, with married-couple families (850 | 83.3%) accounting for the largest median family size of 2.41 persons per family. On the other hand, single female/mother families (118 | 11.6%) represent the smallest median family size with 2.36 persons per family.
| Family Type | # Families | Family Size |
| Married-Couple | 850 (83.3%) | 2.41 |
| Single Male/Father | 52 (5.1%) | 2.37 |
| Single Female/Mother | 118 (11.6%) | 2.36 |
| Total Families | 1,020 (100.0%) | 2.40 |
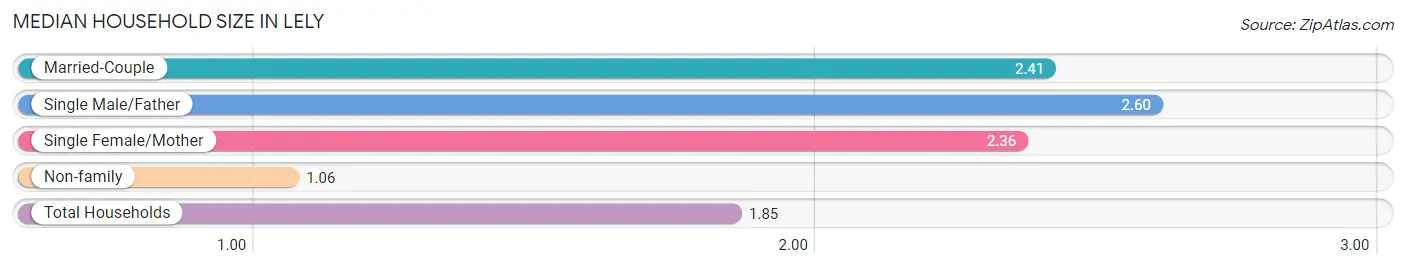
Median Household Size in Lely
The median household size in Lely is 1.85 persons per household, with single male/father households (52 | 3.0%) accounting for the largest median household size of 2.6 persons per household. non-family households (716 | 41.2%) represent the smallest median household size with 1.06 persons per household.
| Household Type | # Households | Household Size |
| Married-Couple | 850 (49.0%) | 2.41 |
| Single Male/Father | 52 (3.0%) | 2.60 |
| Single Female/Mother | 118 (6.8%) | 2.36 |
| Non-family | 716 (41.2%) | 1.06 |
| Total Households | 1,736 (100.0%) | 1.85 |
Household Size by Marriage Status in Lely
Out of a total of 1,736 households in Lely, 1,020 (58.8%) are family households, while 716 (41.2%) are nonfamily households. The most numerous type of family households are 2-person households, comprising 840, and the most common type of nonfamily households are 1-person households, comprising 674.
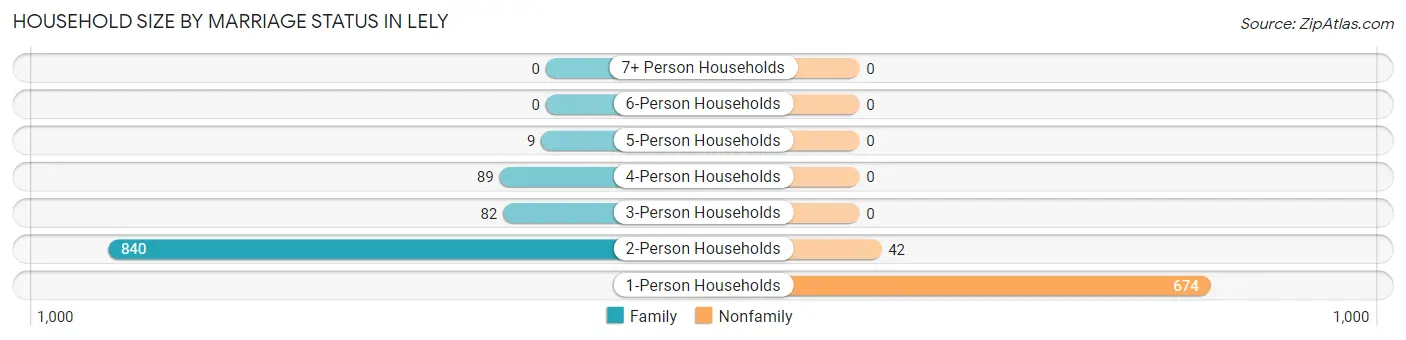
| Household Size | Family Households | Nonfamily Households |
| 1-Person Households | - | 674 (38.8%) |
| 2-Person Households | 840 (48.4%) | 42 (2.4%) |
| 3-Person Households | 82 (4.7%) | 0 (0.0%) |
| 4-Person Households | 89 (5.1%) | 0 (0.0%) |
| 5-Person Households | 9 (0.5%) | 0 (0.0%) |
| 6-Person Households | 0 (0.0%) | 0 (0.0%) |
| 7+ Person Households | 0 (0.0%) | 0 (0.0%) |
| Total | 1,020 (58.8%) | 716 (41.2%) |
Female Fertility in Lely
Fertility by Age in Lely
Average fertility rate in Lely is 66.0 births per 1,000 women. Women in the age bracket of 35 to 50 years have the highest fertility rate with 100.0 births per 1,000 women. Women in the age bracket of 35 to 50 years acount for 100.0% of all women with births.
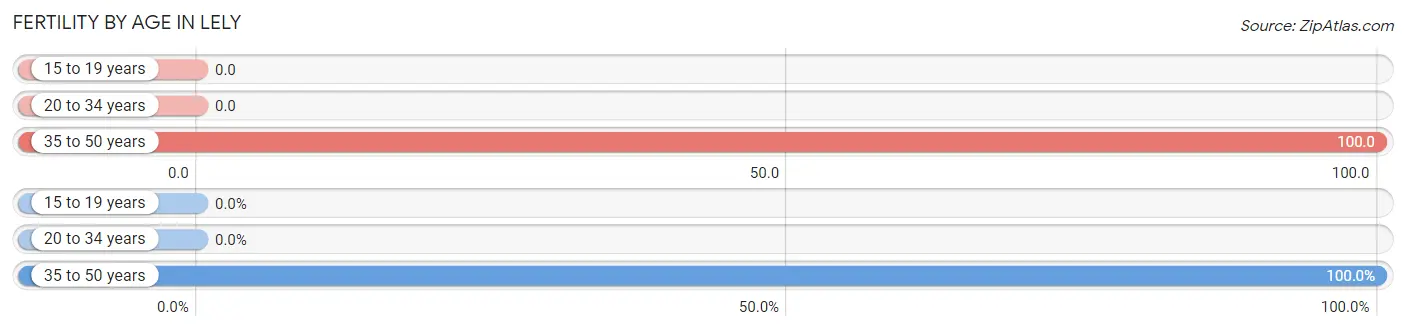
| Age Bracket | Women with Births | Births / 1,000 Women |
| 15 to 19 years | 0 (0.0%) | 0.0 |
| 20 to 34 years | 0 (0.0%) | 0.0 |
| 35 to 50 years | 24 (100.0%) | 100.0 |
| Total | 24 (100.0%) | 66.0 |
Fertility by Age by Marriage Status in Lely
66.7% of women with births (24) in Lely are married. The highest percentage of unmarried women with births falls into 35 to 50 years age bracket with 33.3% of them unmarried at the time of birth, while the lowest percentage of unmarried women with births belong to 35 to 50 years age bracket with 33.3% of them unmarried.
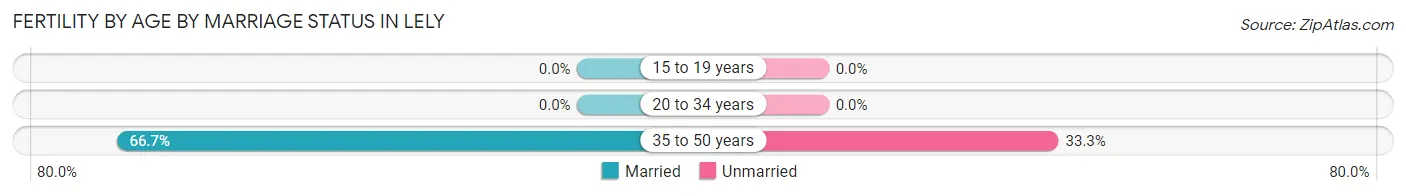
| Age Bracket | Married | Unmarried |
| 15 to 19 years | 0 (0.0%) | 0 (0.0%) |
| 20 to 34 years | 0 (0.0%) | 0 (0.0%) |
| 35 to 50 years | 16 (66.7%) | 8 (33.3%) |
| Total | 16 (66.7%) | 8 (33.3%) |
Fertility by Education in Lely
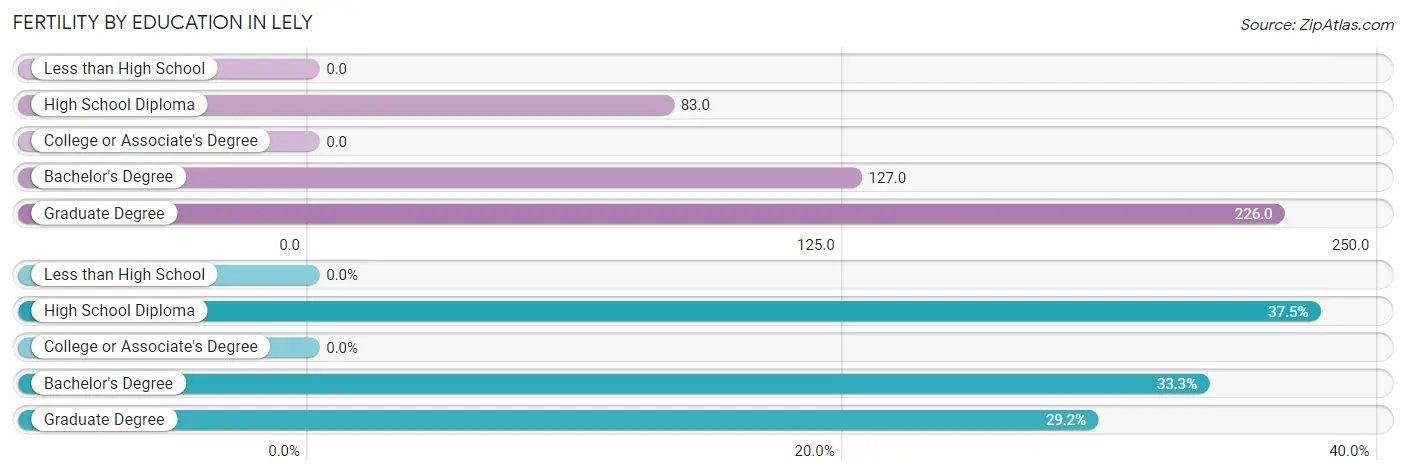
| Educational Attainment | Women with Births | Births / 1,000 Women |
| Less than High School | 0 (0.0%) | 0.0 |
| High School Diploma | 9 (37.5%) | 83.0 |
| College or Associate's Degree | 0 (0.0%) | 0.0 |
| Bachelor's Degree | 8 (33.3%) | 127.0 |
| Graduate Degree | 7 (29.2%) | 226.0 |
| Total | 24 (100.0%) | 66.0 |
Fertility by Education by Marriage Status in Lely
33.3% of women with births in Lely are unmarried. Women with the educational attainment of high school diploma are most likely to be married with 100.0% of them married at childbirth, while women with the educational attainment of bachelor's degree are least likely to be married with 100.0% of them unmarried at childbirth.
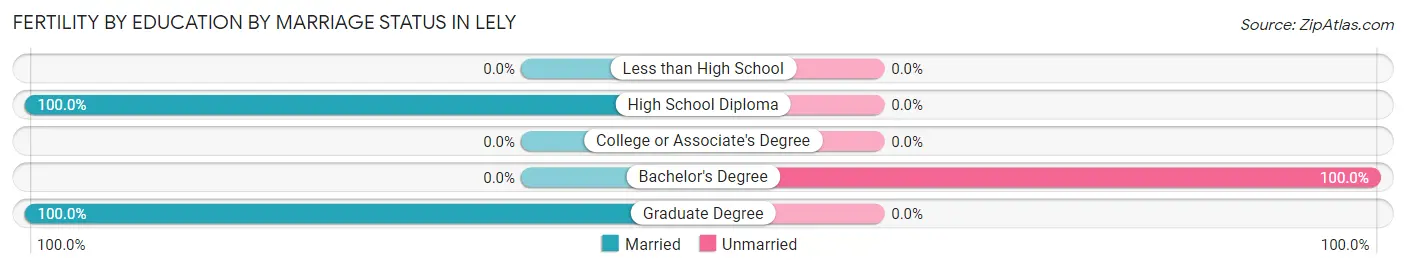
| Educational Attainment | Married | Unmarried |
| Less than High School | 0 (0.0%) | 0 (0.0%) |
| High School Diploma | 9 (100.0%) | 0 (0.0%) |
| College or Associate's Degree | 0 (0.0%) | 0 (0.0%) |
| Bachelor's Degree | 0 (0.0%) | 8 (100.0%) |
| Graduate Degree | 7 (100.0%) | 0 (0.0%) |
| Total | 16 (66.7%) | 8 (33.3%) |
Employment Characteristics in Lely
Employment by Class of Employer in Lely
Among the 1,378 employed individuals in Lely, private company employees (842 | 61.1%), self-employed (incorporated) (149 | 10.8%), and not-for-profit organizations (104 | 7.5%) make up the most common classes of employment.
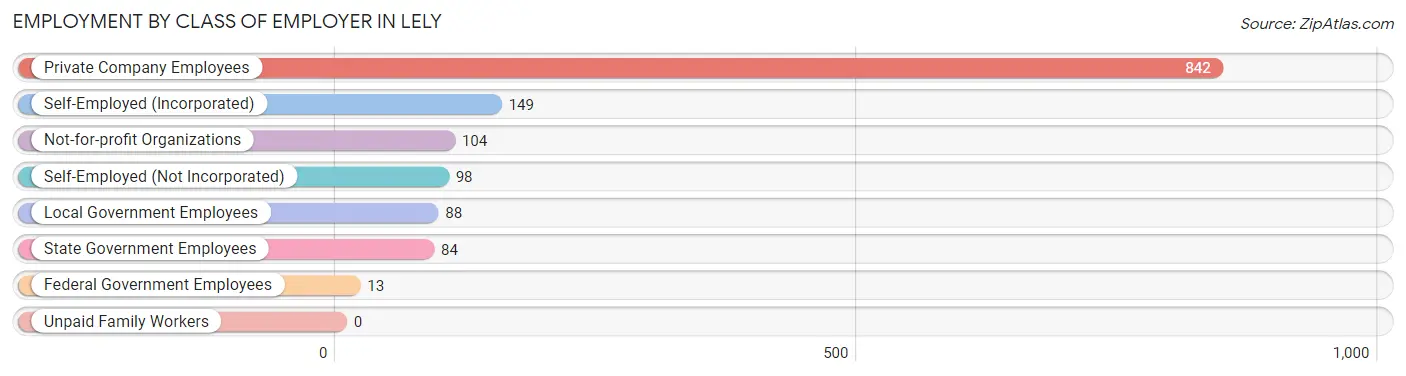
| Employer Class | # Employees | % Employees |
| Private Company Employees | 842 | 61.1% |
| Self-Employed (Incorporated) | 149 | 10.8% |
| Self-Employed (Not Incorporated) | 98 | 7.1% |
| Not-for-profit Organizations | 104 | 7.5% |
| Local Government Employees | 88 | 6.4% |
| State Government Employees | 84 | 6.1% |
| Federal Government Employees | 13 | 0.9% |
| Unpaid Family Workers | 0 | 0.0% |
| Total | 1,378 | 100.0% |
Employment Status by Age in Lely
According to the labor force statistics for Lely, out of the total population over 16 years of age (3,346), 43.6% or 1,459 individuals are in the labor force, with 2.9% or 42 of them unemployed. The age group with the highest labor force participation rate is 16 to 19 years, with 100.0% or 10 individuals in the labor force. Within the labor force, the 65 to 74 years age range has the highest percentage of unemployed individuals, with 11.2% or 25 of them being unemployed.
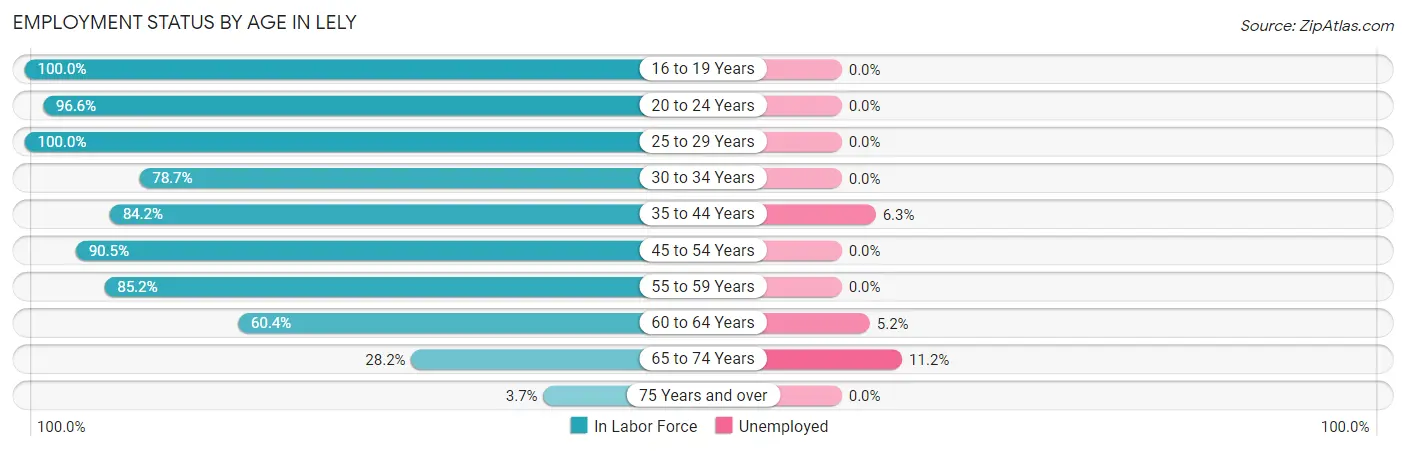
| Age Bracket | In Labor Force | Unemployed |
| 16 to 19 Years | 10 (100.0%) | 0 (0.0%) |
| 20 to 24 Years | 86 (96.6%) | 0 (0.0%) |
| 25 to 29 Years | 70 (100.0%) | 0 (0.0%) |
| 30 to 34 Years | 37 (78.7%) | 0 (0.0%) |
| 35 to 44 Years | 128 (84.2%) | 8 (6.3%) |
| 45 to 54 Years | 504 (90.5%) | 0 (0.0%) |
| 55 to 59 Years | 184 (85.2%) | 0 (0.0%) |
| 60 to 64 Years | 174 (60.4%) | 9 (5.2%) |
| 65 to 74 Years | 224 (28.2%) | 25 (11.2%) |
| 75 Years and over | 42 (3.7%) | 0 (0.0%) |
| Total | 1,459 (43.6%) | 42 (2.9%) |
Employment Status by Educational Attainment in Lely
According to labor force statistics for Lely, 82.5% of individuals (1,097) out of the total population between 25 and 64 years of age (1,330) are in the labor force, with 1.5% or 16 of them being unemployed. The group with the highest labor force participation rate are those with the educational attainment of college / associate degree, with 89.2% or 453 individuals in the labor force. Within the labor force, individuals with bachelor's degree or higher education have the highest percentage of unemployment, with 3.2% or 8 of them being unemployed.
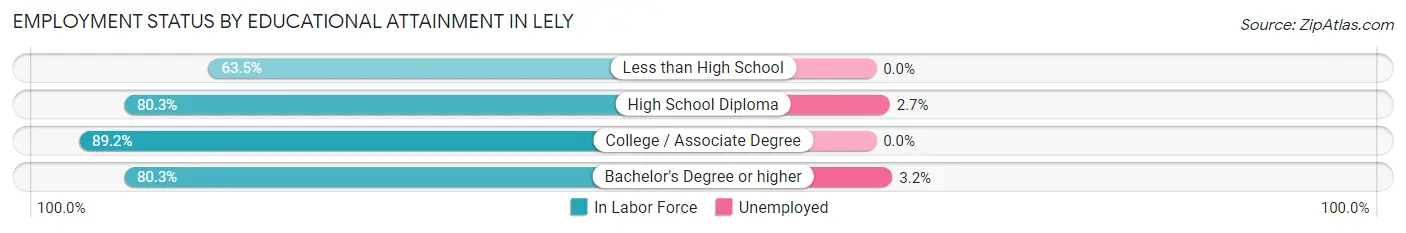
| Educational Attainment | In Labor Force | Unemployed |
| Less than High School | 61 (63.5%) | 0 (0.0%) |
| High School Diploma | 335 (80.3%) | 11 (2.7%) |
| College / Associate Degree | 453 (89.2%) | 0 (0.0%) |
| Bachelor's Degree or higher | 248 (80.3%) | 10 (3.2%) |
| Total | 1,097 (82.5%) | 20 (1.5%) |
Employment Occupations by Sex in Lely
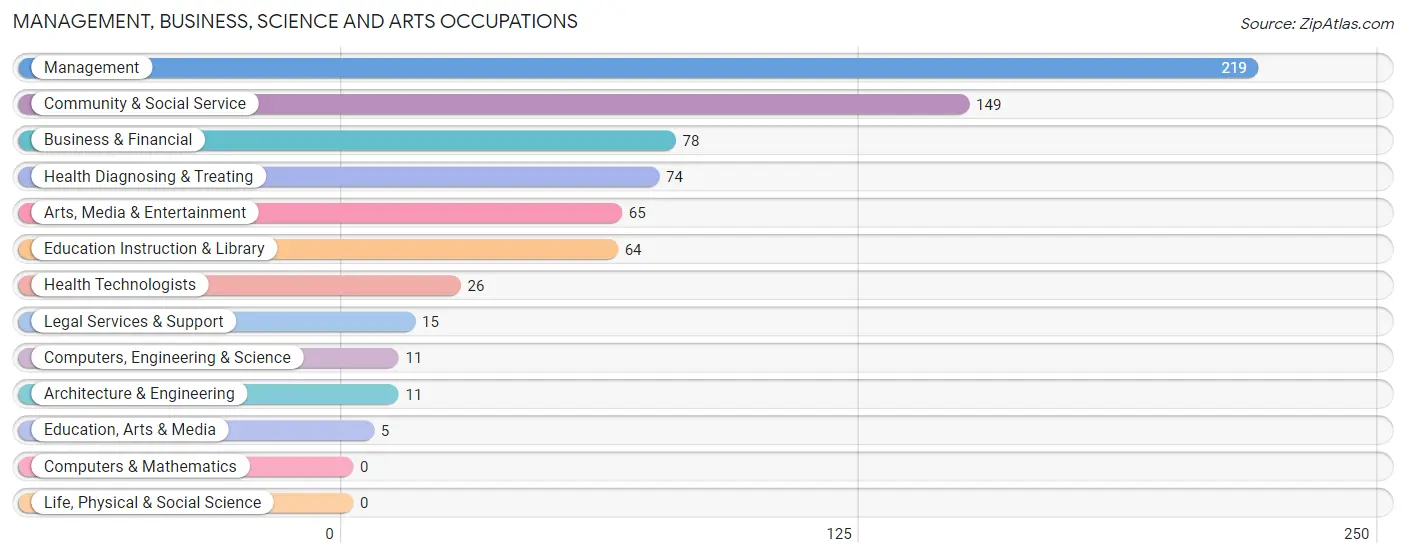
Management, Business, Science and Arts Occupations
The most common Management, Business, Science and Arts occupations in Lely are Management (219 | 15.5%), Community & Social Service (149 | 10.5%), Business & Financial (78 | 5.5%), Health Diagnosing & Treating (74 | 5.2%), and Arts, Media & Entertainment (65 | 4.6%).
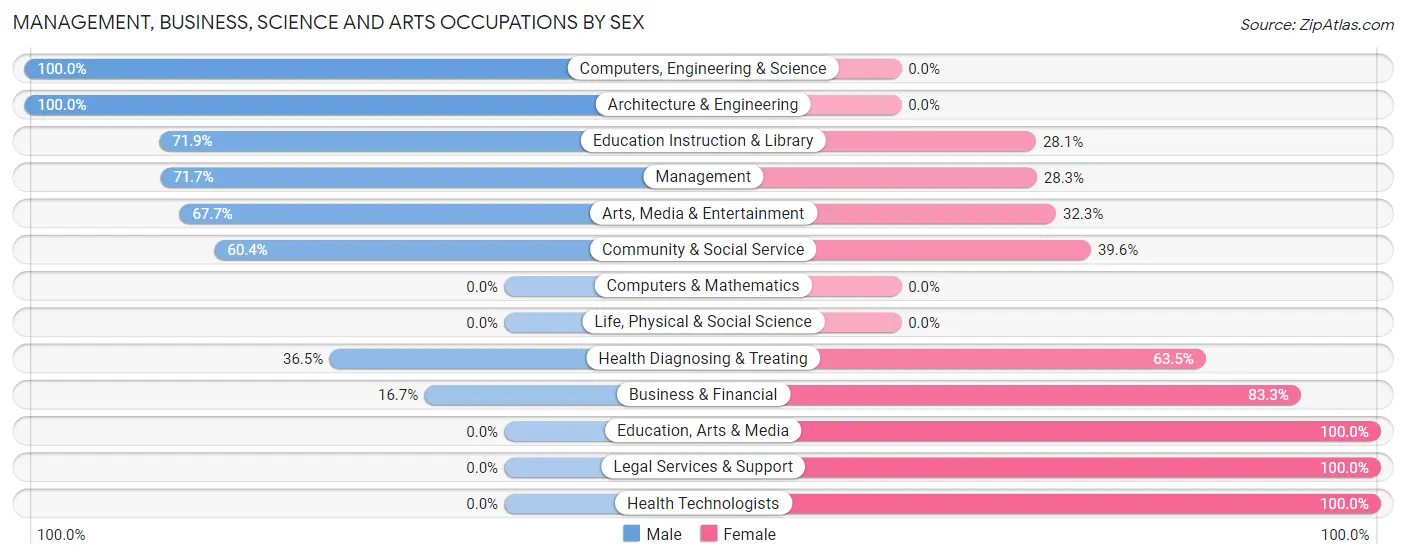
Management, Business, Science and Arts Occupations by Sex
Within the Management, Business, Science and Arts occupations in Lely, the most male-oriented occupations are Computers, Engineering & Science (100.0%), Architecture & Engineering (100.0%), and Education Instruction & Library (71.9%), while the most female-oriented occupations are Education, Arts & Media (100.0%), Legal Services & Support (100.0%), and Health Technologists (100.0%).
| Occupation | Male | Female |
| Management | 157 (71.7%) | 62 (28.3%) |
| Business & Financial | 13 (16.7%) | 65 (83.3%) |
| Computers, Engineering & Science | 11 (100.0%) | 0 (0.0%) |
| Computers & Mathematics | 0 (0.0%) | 0 (0.0%) |
| Architecture & Engineering | 11 (100.0%) | 0 (0.0%) |
| Life, Physical & Social Science | 0 (0.0%) | 0 (0.0%) |
| Community & Social Service | 90 (60.4%) | 59 (39.6%) |
| Education, Arts & Media | 0 (0.0%) | 5 (100.0%) |
| Legal Services & Support | 0 (0.0%) | 15 (100.0%) |
| Education Instruction & Library | 46 (71.9%) | 18 (28.1%) |
| Arts, Media & Entertainment | 44 (67.7%) | 21 (32.3%) |
| Health Diagnosing & Treating | 27 (36.5%) | 47 (63.5%) |
| Health Technologists | 0 (0.0%) | 26 (100.0%) |
| Total (Category) | 298 (56.1%) | 233 (43.9%) |
| Total (Overall) | 715 (50.5%) | 702 (49.5%) |
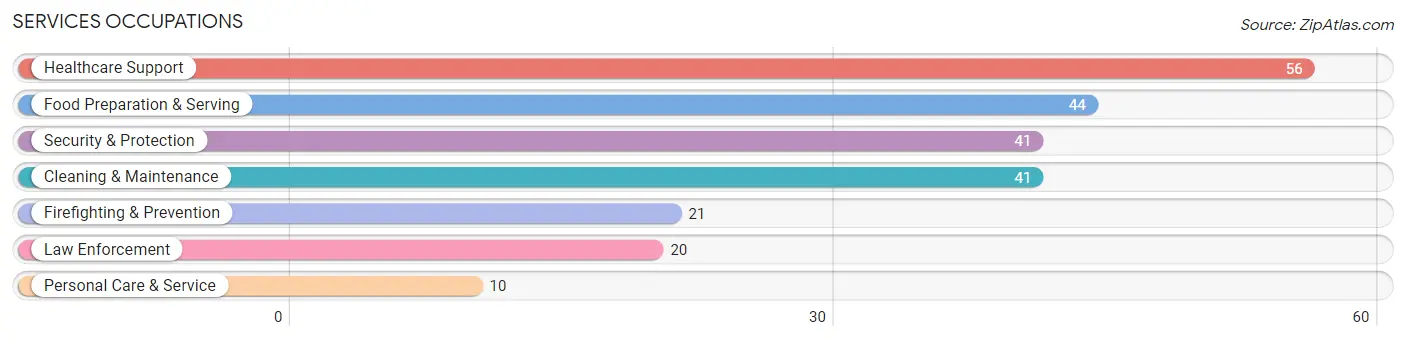
Services Occupations
The most common Services occupations in Lely are Healthcare Support (56 | 4.0%), Food Preparation & Serving (44 | 3.1%), Security & Protection (41 | 2.9%), Cleaning & Maintenance (41 | 2.9%), and Firefighting & Prevention (21 | 1.5%).
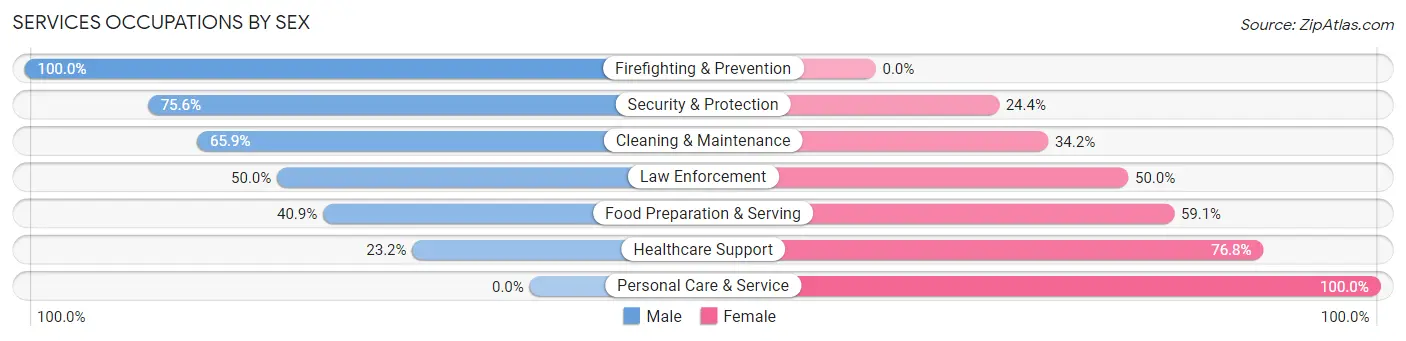
Services Occupations by Sex
Within the Services occupations in Lely, the most male-oriented occupations are Firefighting & Prevention (100.0%), Security & Protection (75.6%), and Cleaning & Maintenance (65.8%), while the most female-oriented occupations are Personal Care & Service (100.0%), Healthcare Support (76.8%), and Food Preparation & Serving (59.1%).
| Occupation | Male | Female |
| Healthcare Support | 13 (23.2%) | 43 (76.8%) |
| Security & Protection | 31 (75.6%) | 10 (24.4%) |
| Firefighting & Prevention | 21 (100.0%) | 0 (0.0%) |
| Law Enforcement | 10 (50.0%) | 10 (50.0%) |
| Food Preparation & Serving | 18 (40.9%) | 26 (59.1%) |
| Cleaning & Maintenance | 27 (65.8%) | 14 (34.2%) |
| Personal Care & Service | 0 (0.0%) | 10 (100.0%) |
| Total (Category) | 89 (46.4%) | 103 (53.6%) |
| Total (Overall) | 715 (50.5%) | 702 (49.5%) |
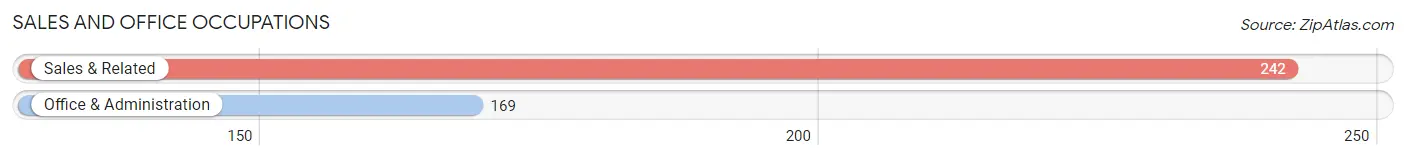
Sales and Office Occupations
The most common Sales and Office occupations in Lely are Sales & Related (242 | 17.1%), and Office & Administration (169 | 11.9%).
Sales and Office Occupations by Sex
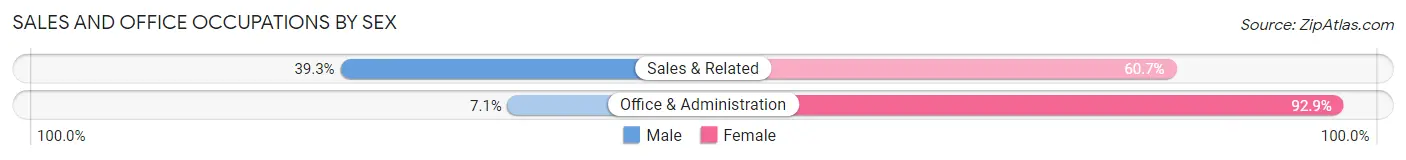
| Occupation | Male | Female |
| Sales & Related | 95 (39.3%) | 147 (60.7%) |
| Office & Administration | 12 (7.1%) | 157 (92.9%) |
| Total (Category) | 107 (26.0%) | 304 (74.0%) |
| Total (Overall) | 715 (50.5%) | 702 (49.5%) |
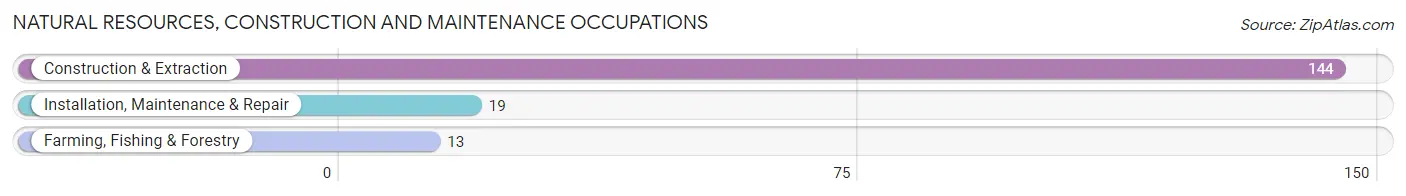
Natural Resources, Construction and Maintenance Occupations
The most common Natural Resources, Construction and Maintenance occupations in Lely are Construction & Extraction (144 | 10.2%), Installation, Maintenance & Repair (19 | 1.3%), and Farming, Fishing & Forestry (13 | 0.9%).
Natural Resources, Construction and Maintenance Occupations by Sex
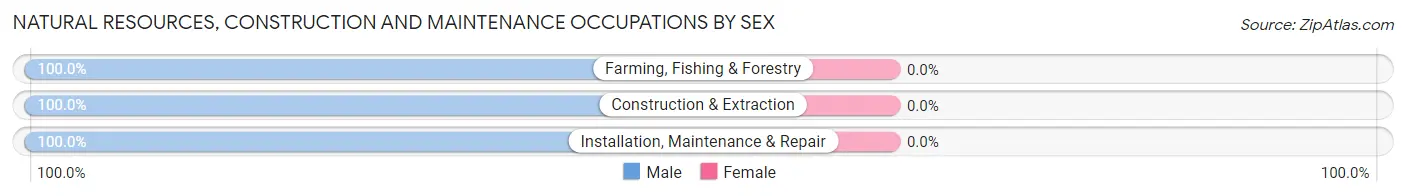
| Occupation | Male | Female |
| Farming, Fishing & Forestry | 13 (100.0%) | 0 (0.0%) |
| Construction & Extraction | 144 (100.0%) | 0 (0.0%) |
| Installation, Maintenance & Repair | 19 (100.0%) | 0 (0.0%) |
| Total (Category) | 176 (100.0%) | 0 (0.0%) |
| Total (Overall) | 715 (50.5%) | 702 (49.5%) |
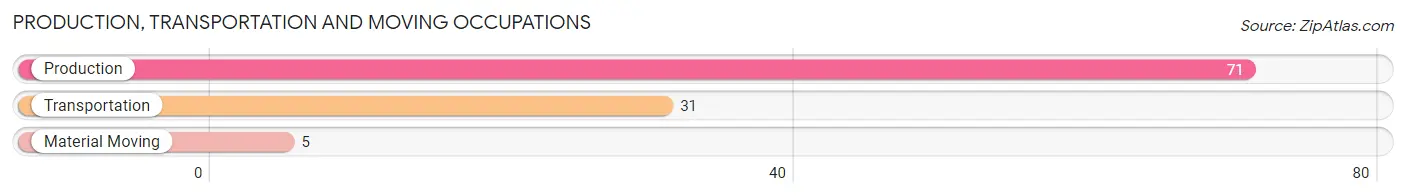
Production, Transportation and Moving Occupations
The most common Production, Transportation and Moving occupations in Lely are Production (71 | 5.0%), Transportation (31 | 2.2%), and Material Moving (5 | 0.4%).
Production, Transportation and Moving Occupations by Sex
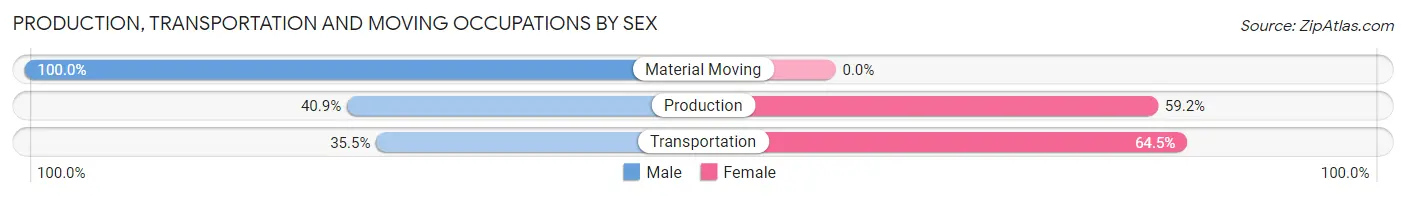
| Occupation | Male | Female |
| Production | 29 (40.8%) | 42 (59.2%) |
| Transportation | 11 (35.5%) | 20 (64.5%) |
| Material Moving | 5 (100.0%) | 0 (0.0%) |
| Total (Category) | 45 (42.1%) | 62 (57.9%) |
| Total (Overall) | 715 (50.5%) | 702 (49.5%) |
Employment Industries by Sex in Lely
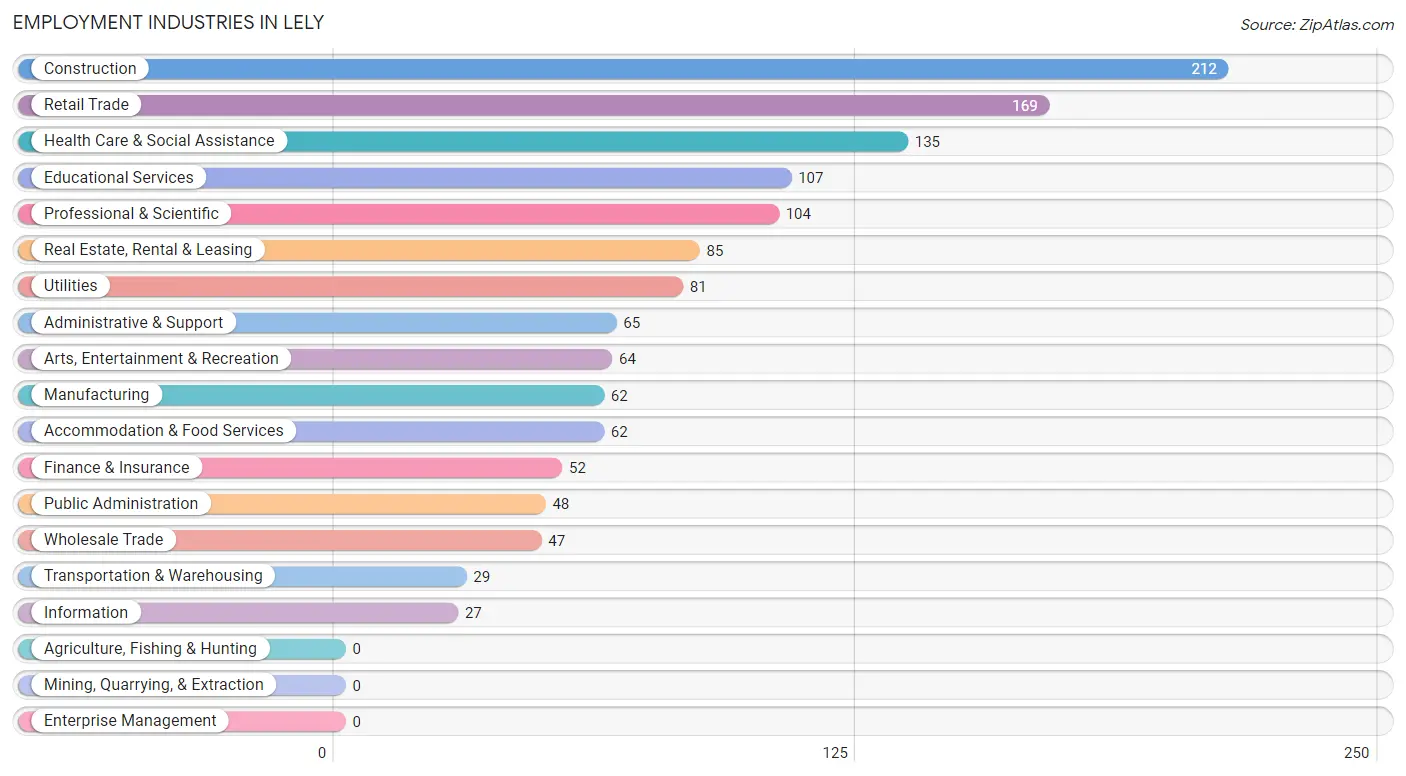
Employment Industries in Lely
The major employment industries in Lely include Construction (212 | 15.0%), Retail Trade (169 | 11.9%), Health Care & Social Assistance (135 | 9.5%), Educational Services (107 | 7.5%), and Professional & Scientific (104 | 7.3%).
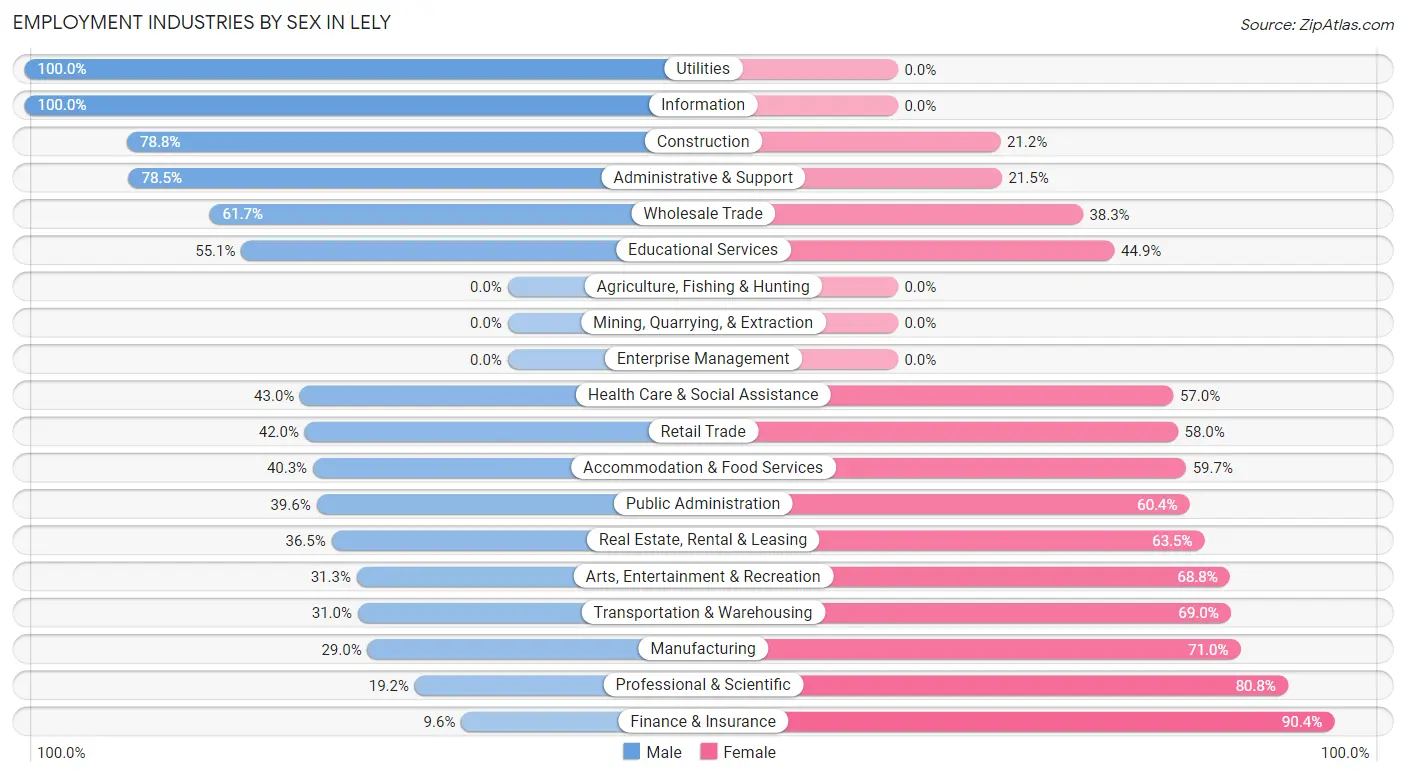
Employment Industries by Sex in Lely
The Lely industries that see more men than women are Utilities (100.0%), Information (100.0%), and Construction (78.8%), whereas the industries that tend to have a higher number of women are Finance & Insurance (90.4%), Professional & Scientific (80.8%), and Manufacturing (71.0%).
| Industry | Male | Female |
| Agriculture, Fishing & Hunting | 0 (0.0%) | 0 (0.0%) |
| Mining, Quarrying, & Extraction | 0 (0.0%) | 0 (0.0%) |
| Construction | 167 (78.8%) | 45 (21.2%) |
| Manufacturing | 18 (29.0%) | 44 (71.0%) |
| Wholesale Trade | 29 (61.7%) | 18 (38.3%) |
| Retail Trade | 71 (42.0%) | 98 (58.0%) |
| Transportation & Warehousing | 9 (31.0%) | 20 (69.0%) |
| Utilities | 81 (100.0%) | 0 (0.0%) |
| Information | 27 (100.0%) | 0 (0.0%) |
| Finance & Insurance | 5 (9.6%) | 47 (90.4%) |
| Real Estate, Rental & Leasing | 31 (36.5%) | 54 (63.5%) |
| Professional & Scientific | 20 (19.2%) | 84 (80.8%) |
| Enterprise Management | 0 (0.0%) | 0 (0.0%) |
| Administrative & Support | 51 (78.5%) | 14 (21.5%) |
| Educational Services | 59 (55.1%) | 48 (44.9%) |
| Health Care & Social Assistance | 58 (43.0%) | 77 (57.0%) |
| Arts, Entertainment & Recreation | 20 (31.2%) | 44 (68.8%) |
| Accommodation & Food Services | 25 (40.3%) | 37 (59.7%) |
| Public Administration | 19 (39.6%) | 29 (60.4%) |
| Total | 715 (50.5%) | 702 (49.5%) |
Education in Lely
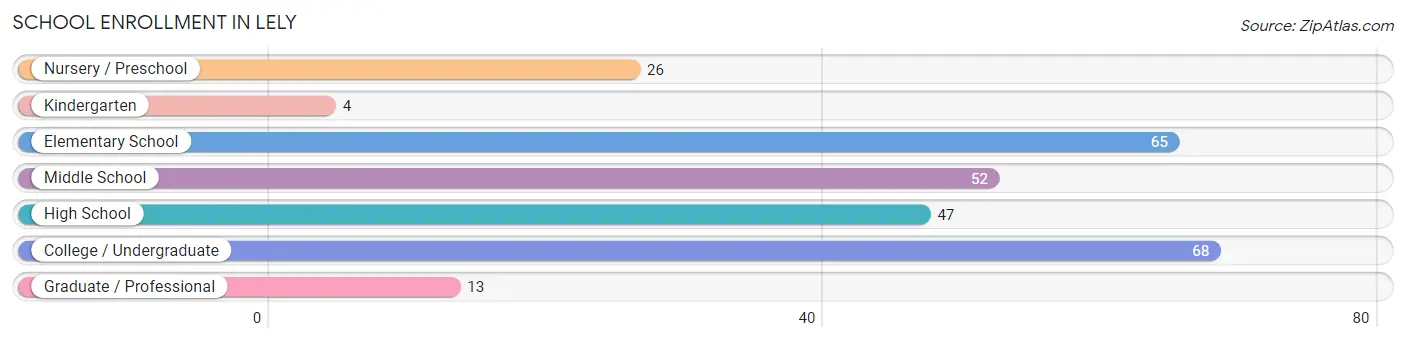
School Enrollment in Lely
The most common levels of schooling among the 275 students in Lely are college / undergraduate (68 | 24.7%), elementary school (65 | 23.6%), and middle school (52 | 18.9%).
| School Level | # Students | % Students |
| Nursery / Preschool | 26 | 9.5% |
| Kindergarten | 4 | 1.5% |
| Elementary School | 65 | 23.6% |
| Middle School | 52 | 18.9% |
| High School | 47 | 17.1% |
| College / Undergraduate | 68 | 24.7% |
| Graduate / Professional | 13 | 4.7% |
| Total | 275 | 100.0% |
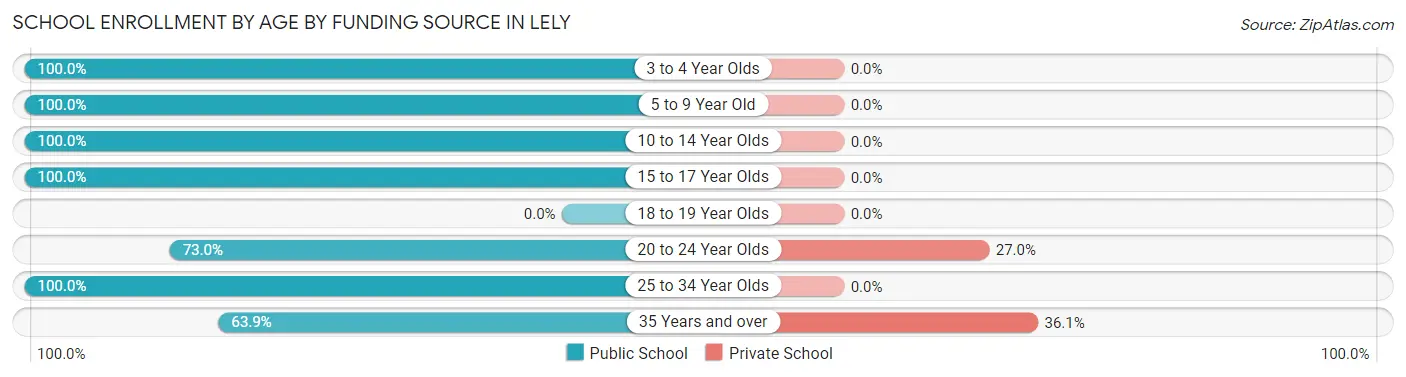
School Enrollment by Age by Funding Source in Lely
Out of a total of 275 students who are enrolled in schools in Lely, 23 (8.4%) attend a private institution, while the remaining 252 (91.6%) are enrolled in public schools. The age group of 35 years and over has the highest likelihood of being enrolled in private schools, with 13 (36.1% in the age bracket) enrolled. Conversely, the age group of 3 to 4 year olds has the lowest likelihood of being enrolled in a private school, with 26 (100.0% in the age bracket) attending a public institution.
| Age Bracket | Public School | Private School |
| 3 to 4 Year Olds | 26 (100.0%) | 0 (0.0%) |
| 5 to 9 Year Old | 63 (100.0%) | 0 (0.0%) |
| 10 to 14 Year Olds | 67 (100.0%) | 0 (0.0%) |
| 15 to 17 Year Olds | 38 (100.0%) | 0 (0.0%) |
| 18 to 19 Year Olds | 0 (0.0%) | 0 (0.0%) |
| 20 to 24 Year Olds | 27 (73.0%) | 10 (27.0%) |
| 25 to 34 Year Olds | 8 (100.0%) | 0 (0.0%) |
| 35 Years and over | 23 (63.9%) | 13 (36.1%) |
| Total | 252 (91.6%) | 23 (8.4%) |
Educational Attainment by Field of Study in Lely
Education (298 | 26.1%), business (269 | 23.6%), science & technology (144 | 12.6%), arts & humanities (134 | 11.7%), and social sciences (49 | 4.3%) are the most common fields of study among 1,142 individuals in Lely who have obtained a bachelor's degree or higher.
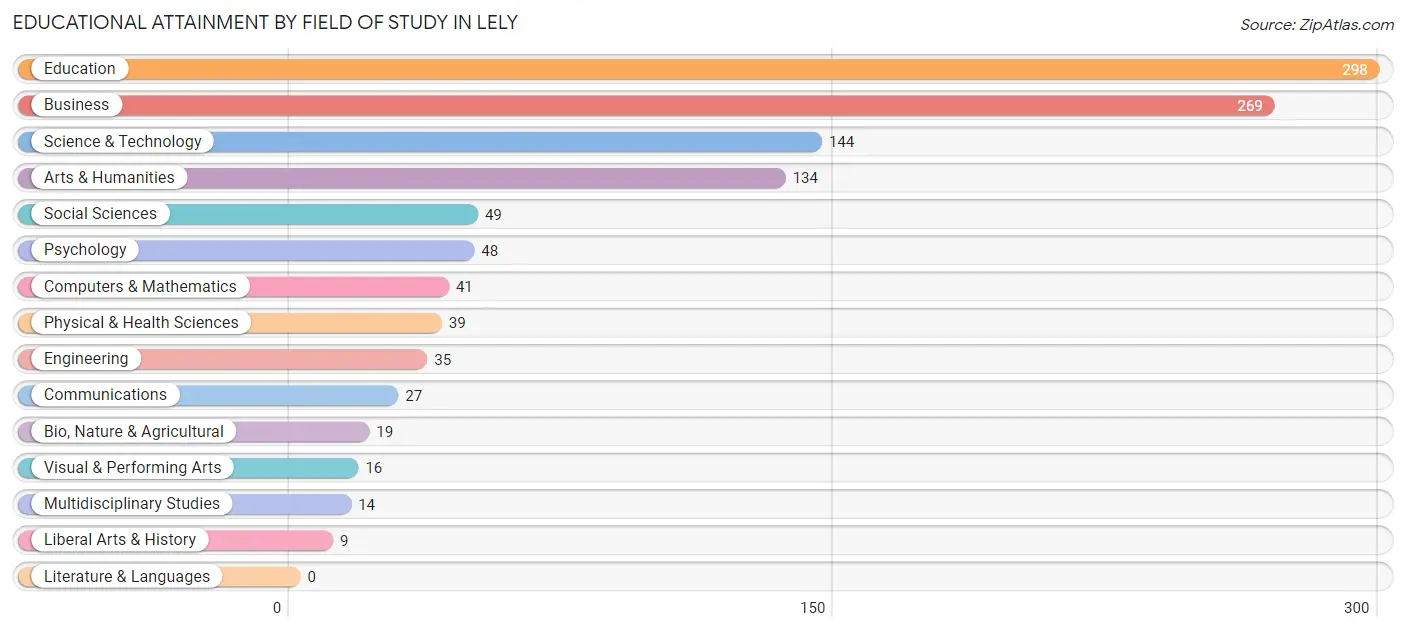
| Field of Study | # Graduates | % Graduates |
| Computers & Mathematics | 41 | 3.6% |
| Bio, Nature & Agricultural | 19 | 1.7% |
| Physical & Health Sciences | 39 | 3.4% |
| Psychology | 48 | 4.2% |
| Social Sciences | 49 | 4.3% |
| Engineering | 35 | 3.1% |
| Multidisciplinary Studies | 14 | 1.2% |
| Science & Technology | 144 | 12.6% |
| Business | 269 | 23.6% |
| Education | 298 | 26.1% |
| Literature & Languages | 0 | 0.0% |
| Liberal Arts & History | 9 | 0.8% |
| Visual & Performing Arts | 16 | 1.4% |
| Communications | 27 | 2.4% |
| Arts & Humanities | 134 | 11.7% |
| Total | 1,142 | 100.0% |
Transportation & Commute in Lely
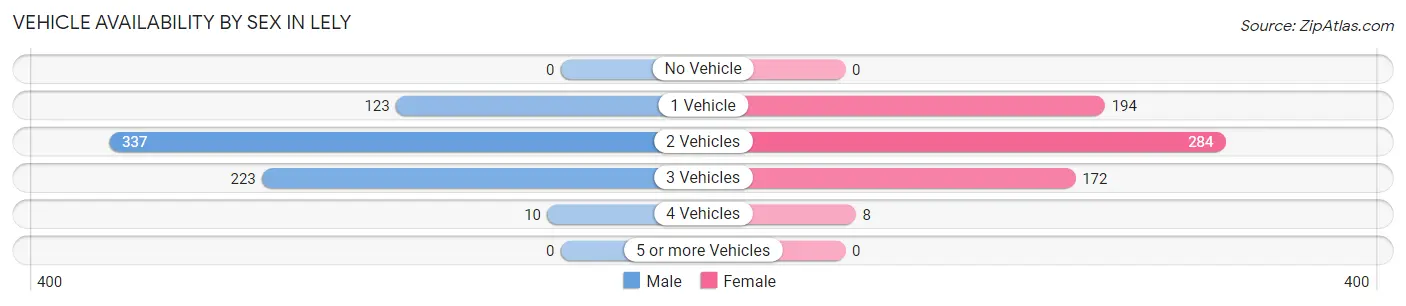
Vehicle Availability by Sex in Lely
The most prevalent vehicle ownership categories in Lely are males with 2 vehicles (337, accounting for 48.6%) and females with 2 vehicles (284, making up 51.2%).
| Vehicles Available | Male | Female |
| No Vehicle | 0 (0.0%) | 0 (0.0%) |
| 1 Vehicle | 123 (17.7%) | 194 (29.5%) |
| 2 Vehicles | 337 (48.6%) | 284 (43.2%) |
| 3 Vehicles | 223 (32.2%) | 172 (26.1%) |
| 4 Vehicles | 10 (1.4%) | 8 (1.2%) |
| 5 or more Vehicles | 0 (0.0%) | 0 (0.0%) |
| Total | 693 (100.0%) | 658 (100.0%) |
Commute Time in Lely
The most frequently occuring commute durations in Lely are 25 to 29 minutes (232 commuters, 18.7%), 15 to 19 minutes (204 commuters, 16.5%), and 5 to 9 minutes (203 commuters, 16.4%).
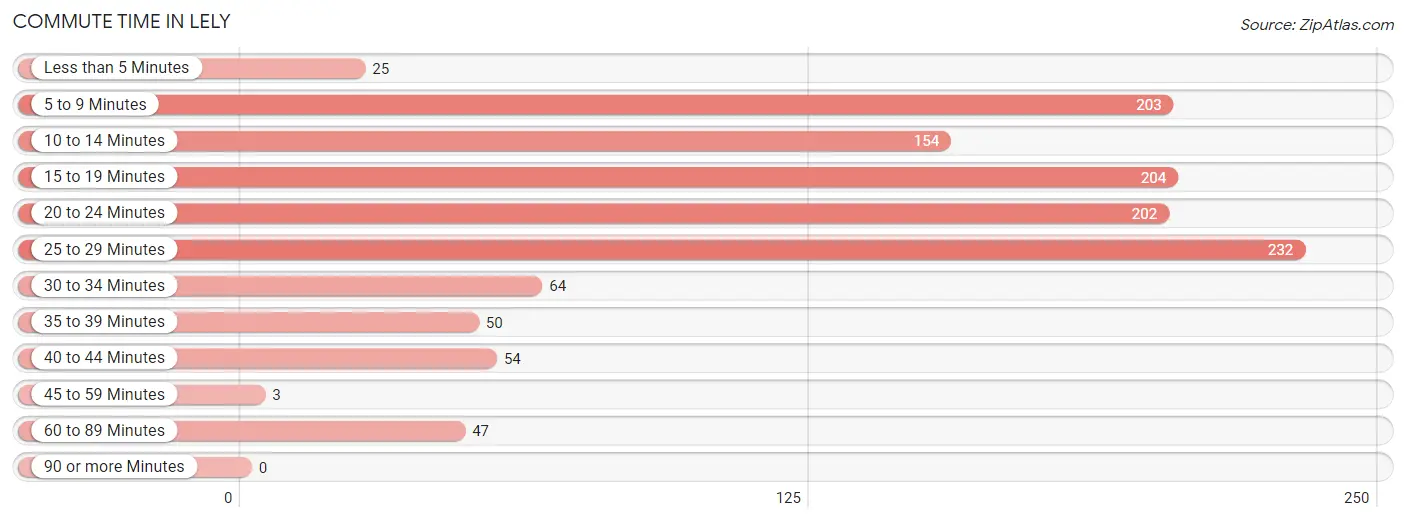
| Commute Time | # Commuters | % Commuters |
| Less than 5 Minutes | 25 | 2.0% |
| 5 to 9 Minutes | 203 | 16.4% |
| 10 to 14 Minutes | 154 | 12.4% |
| 15 to 19 Minutes | 204 | 16.5% |
| 20 to 24 Minutes | 202 | 16.3% |
| 25 to 29 Minutes | 232 | 18.7% |
| 30 to 34 Minutes | 64 | 5.2% |
| 35 to 39 Minutes | 50 | 4.0% |
| 40 to 44 Minutes | 54 | 4.4% |
| 45 to 59 Minutes | 3 | 0.2% |
| 60 to 89 Minutes | 47 | 3.8% |
| 90 or more Minutes | 0 | 0.0% |
Commute Time by Sex in Lely
The most common commute times in Lely are 25 to 29 minutes (128 commuters, 19.7%) for males and 5 to 9 minutes (117 commuters, 19.9%) for females.
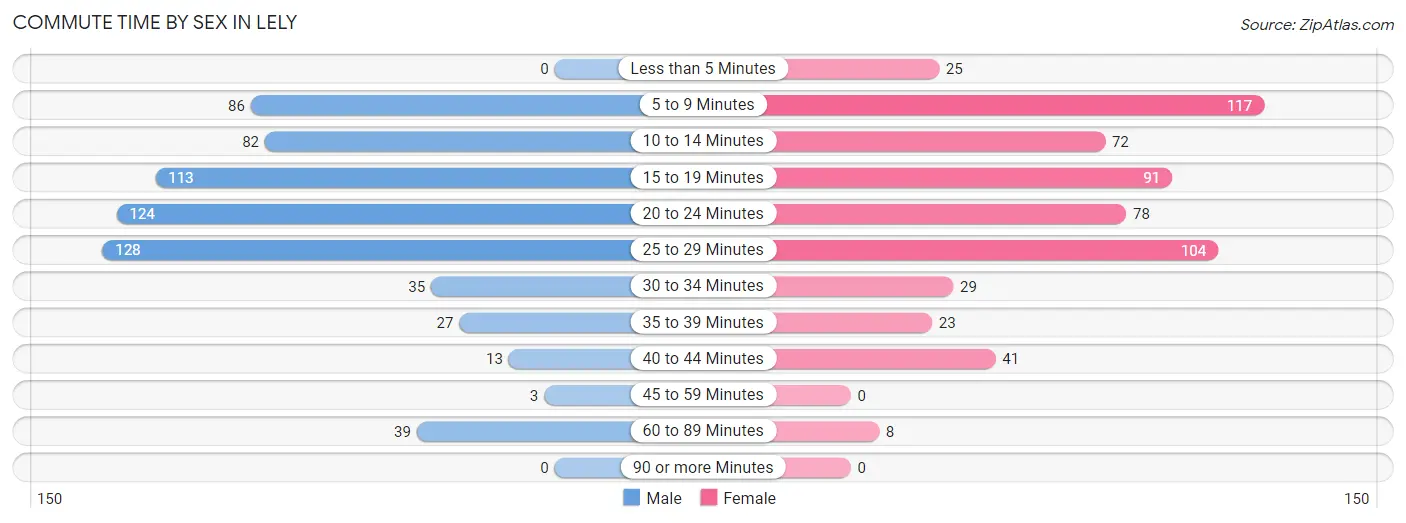
| Commute Time | Male | Female |
| Less than 5 Minutes | 0 (0.0%) | 25 (4.3%) |
| 5 to 9 Minutes | 86 (13.2%) | 117 (19.9%) |
| 10 to 14 Minutes | 82 (12.6%) | 72 (12.2%) |
| 15 to 19 Minutes | 113 (17.4%) | 91 (15.5%) |
| 20 to 24 Minutes | 124 (19.1%) | 78 (13.3%) |
| 25 to 29 Minutes | 128 (19.7%) | 104 (17.7%) |
| 30 to 34 Minutes | 35 (5.4%) | 29 (4.9%) |
| 35 to 39 Minutes | 27 (4.2%) | 23 (3.9%) |
| 40 to 44 Minutes | 13 (2.0%) | 41 (7.0%) |
| 45 to 59 Minutes | 3 (0.5%) | 0 (0.0%) |
| 60 to 89 Minutes | 39 (6.0%) | 8 (1.4%) |
| 90 or more Minutes | 0 (0.0%) | 0 (0.0%) |
Time of Departure to Work by Sex in Lely
The most frequent times of departure to work in Lely are 7:30 AM to 7:59 AM (101, 15.5%) for males and 7:00 AM to 7:29 AM (124, 21.1%) for females.
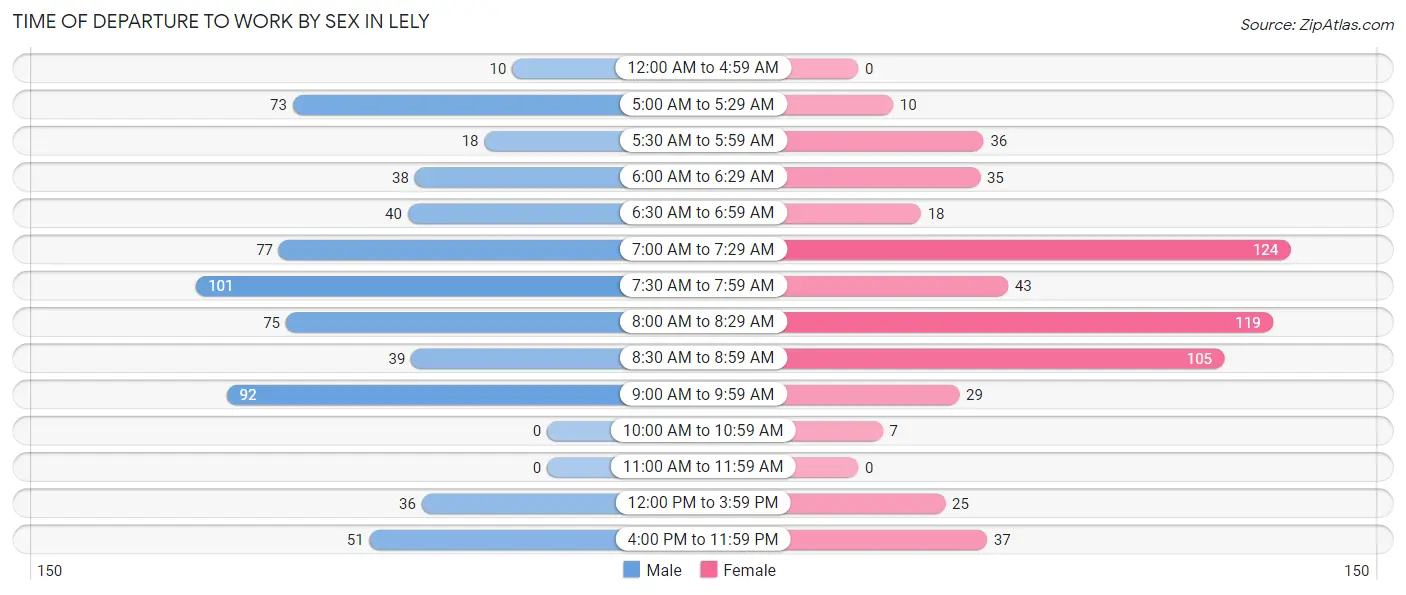
| Time of Departure | Male | Female |
| 12:00 AM to 4:59 AM | 10 (1.5%) | 0 (0.0%) |
| 5:00 AM to 5:29 AM | 73 (11.2%) | 10 (1.7%) |
| 5:30 AM to 5:59 AM | 18 (2.8%) | 36 (6.1%) |
| 6:00 AM to 6:29 AM | 38 (5.9%) | 35 (5.9%) |
| 6:30 AM to 6:59 AM | 40 (6.1%) | 18 (3.1%) |
| 7:00 AM to 7:29 AM | 77 (11.8%) | 124 (21.1%) |
| 7:30 AM to 7:59 AM | 101 (15.5%) | 43 (7.3%) |
| 8:00 AM to 8:29 AM | 75 (11.5%) | 119 (20.2%) |
| 8:30 AM to 8:59 AM | 39 (6.0%) | 105 (17.9%) |
| 9:00 AM to 9:59 AM | 92 (14.1%) | 29 (4.9%) |
| 10:00 AM to 10:59 AM | 0 (0.0%) | 7 (1.2%) |
| 11:00 AM to 11:59 AM | 0 (0.0%) | 0 (0.0%) |
| 12:00 PM to 3:59 PM | 36 (5.5%) | 25 (4.3%) |
| 4:00 PM to 11:59 PM | 51 (7.9%) | 37 (6.3%) |
| Total | 650 (100.0%) | 588 (100.0%) |
Housing Occupancy in Lely
Occupancy by Ownership in Lely
Of the total 1,736 dwellings in Lely, owner-occupied units account for 1,385 (79.8%), while renter-occupied units make up 351 (20.2%).
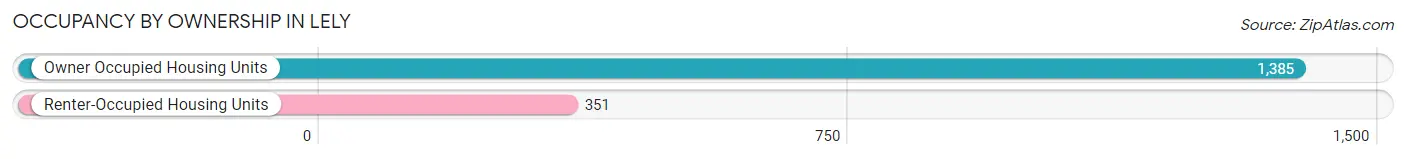
| Occupancy | # Housing Units | % Housing Units |
| Owner Occupied Housing Units | 1,385 | 79.8% |
| Renter-Occupied Housing Units | 351 | 20.2% |
| Total Occupied Housing Units | 1,736 | 100.0% |
Occupancy by Household Size in Lely
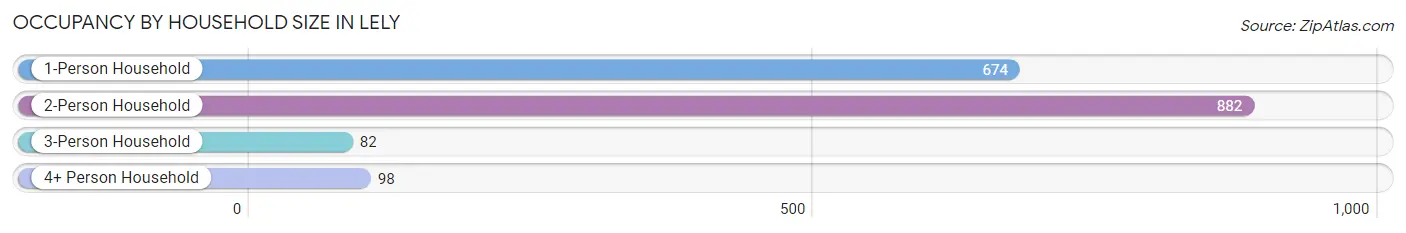
| Household Size | # Housing Units | % Housing Units |
| 1-Person Household | 674 | 38.8% |
| 2-Person Household | 882 | 50.8% |
| 3-Person Household | 82 | 4.7% |
| 4+ Person Household | 98 | 5.7% |
| Total Housing Units | 1,736 | 100.0% |
Occupancy by Ownership by Household Size in Lely
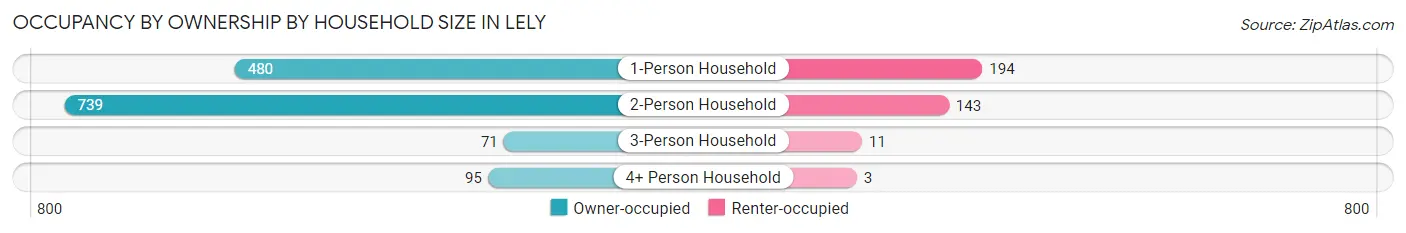
| Household Size | Owner-occupied | Renter-occupied |
| 1-Person Household | 480 (71.2%) | 194 (28.8%) |
| 2-Person Household | 739 (83.8%) | 143 (16.2%) |
| 3-Person Household | 71 (86.6%) | 11 (13.4%) |
| 4+ Person Household | 95 (96.9%) | 3 (3.1%) |
| Total Housing Units | 1,385 (79.8%) | 351 (20.2%) |
Occupancy by Educational Attainment in Lely
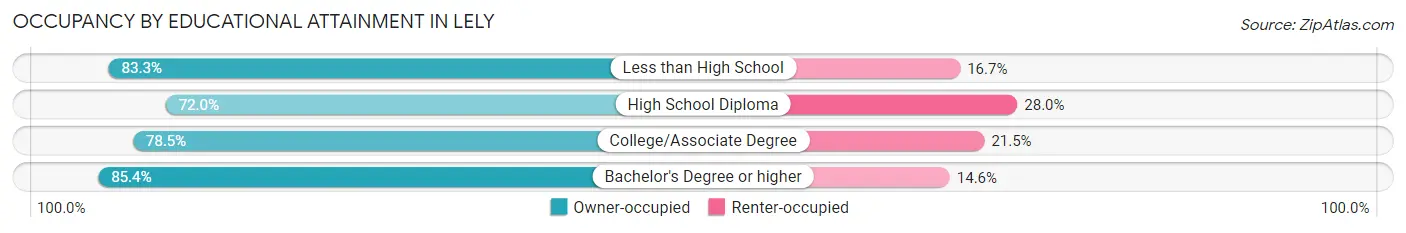
| Household Size | Owner-occupied | Renter-occupied |
| Less than High School | 50 (83.3%) | 10 (16.7%) |
| High School Diploma | 301 (72.0%) | 117 (28.0%) |
| College/Associate Degree | 461 (78.5%) | 126 (21.5%) |
| Bachelor's Degree or higher | 573 (85.4%) | 98 (14.6%) |
Occupancy by Age of Householder in Lely
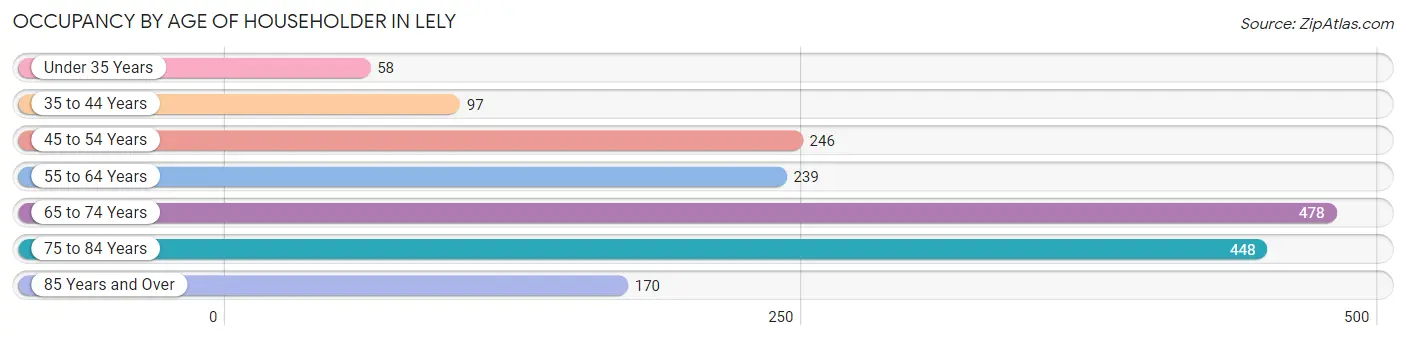
| Age Bracket | # Households | % Households |
| Under 35 Years | 58 | 3.3% |
| 35 to 44 Years | 97 | 5.6% |
| 45 to 54 Years | 246 | 14.2% |
| 55 to 64 Years | 239 | 13.8% |
| 65 to 74 Years | 478 | 27.5% |
| 75 to 84 Years | 448 | 25.8% |
| 85 Years and Over | 170 | 9.8% |
| Total | 1,736 | 100.0% |
Housing Finances in Lely
Median Income by Occupancy in Lely
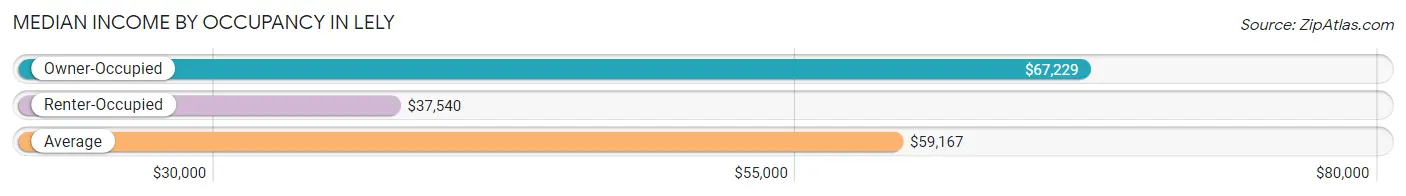
| Occupancy Type | # Households | Median Income |
| Owner-Occupied | 1,385 (79.8%) | $67,229 |
| Renter-Occupied | 351 (20.2%) | $37,540 |
| Average | 1,736 (100.0%) | $59,167 |
Occupancy by Householder Income Bracket in Lely
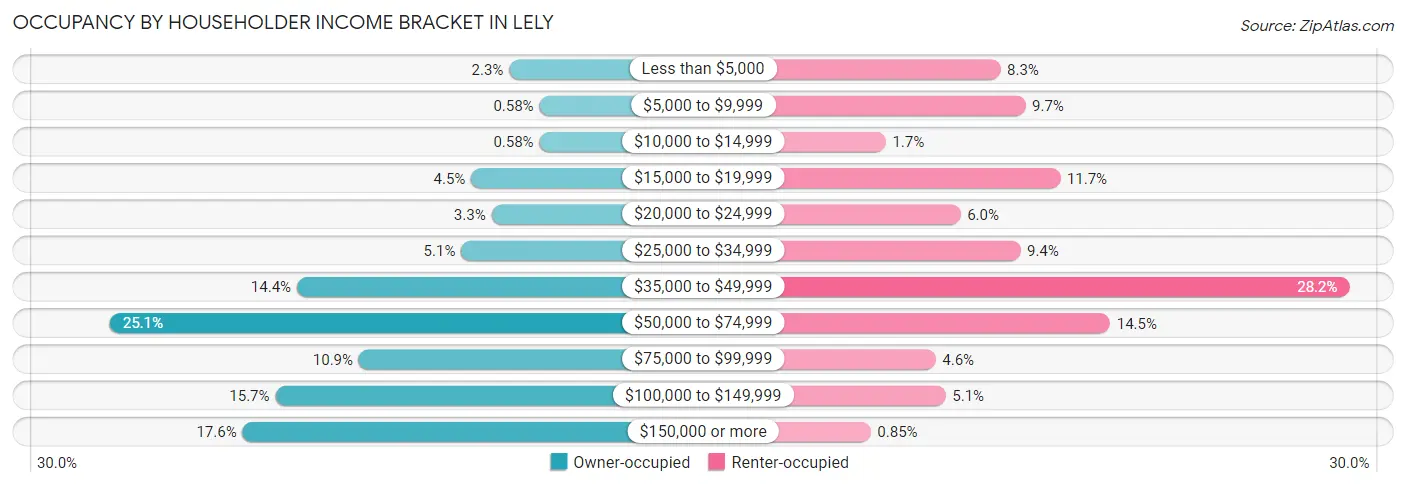
| Income Bracket | Owner-occupied | Renter-occupied |
| Less than $5,000 | 32 (2.3%) | 29 (8.3%) |
| $5,000 to $9,999 | 8 (0.6%) | 34 (9.7%) |
| $10,000 to $14,999 | 8 (0.6%) | 6 (1.7%) |
| $15,000 to $19,999 | 62 (4.5%) | 41 (11.7%) |
| $20,000 to $24,999 | 46 (3.3%) | 21 (6.0%) |
| $25,000 to $34,999 | 70 (5.1%) | 33 (9.4%) |
| $35,000 to $49,999 | 200 (14.4%) | 99 (28.2%) |
| $50,000 to $74,999 | 348 (25.1%) | 51 (14.5%) |
| $75,000 to $99,999 | 151 (10.9%) | 16 (4.6%) |
| $100,000 to $149,999 | 217 (15.7%) | 18 (5.1%) |
| $150,000 or more | 243 (17.5%) | 3 (0.9%) |
| Total | 1,385 (100.0%) | 351 (100.0%) |
Monthly Housing Cost Tiers in Lely
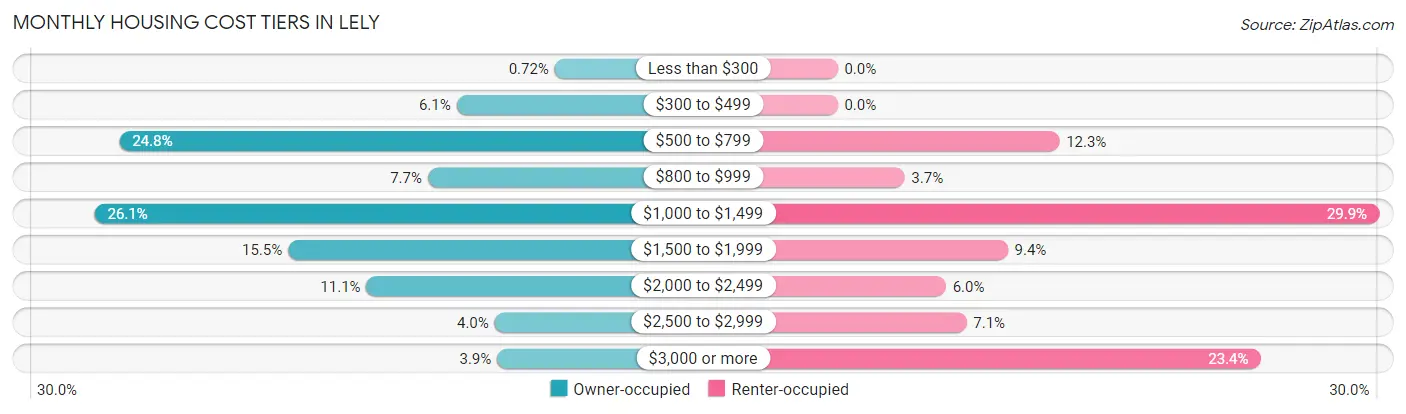
| Monthly Cost | Owner-occupied | Renter-occupied |
| Less than $300 | 10 (0.7%) | 0 (0.0%) |
| $300 to $499 | 85 (6.1%) | 0 (0.0%) |
| $500 to $799 | 343 (24.8%) | 43 (12.2%) |
| $800 to $999 | 107 (7.7%) | 13 (3.7%) |
| $1,000 to $1,499 | 362 (26.1%) | 105 (29.9%) |
| $1,500 to $1,999 | 214 (15.4%) | 33 (9.4%) |
| $2,000 to $2,499 | 154 (11.1%) | 21 (6.0%) |
| $2,500 to $2,999 | 56 (4.0%) | 25 (7.1%) |
| $3,000 or more | 54 (3.9%) | 82 (23.4%) |
| Total | 1,385 (100.0%) | 351 (100.0%) |
Physical Housing Characteristics in Lely
Housing Structures in Lely
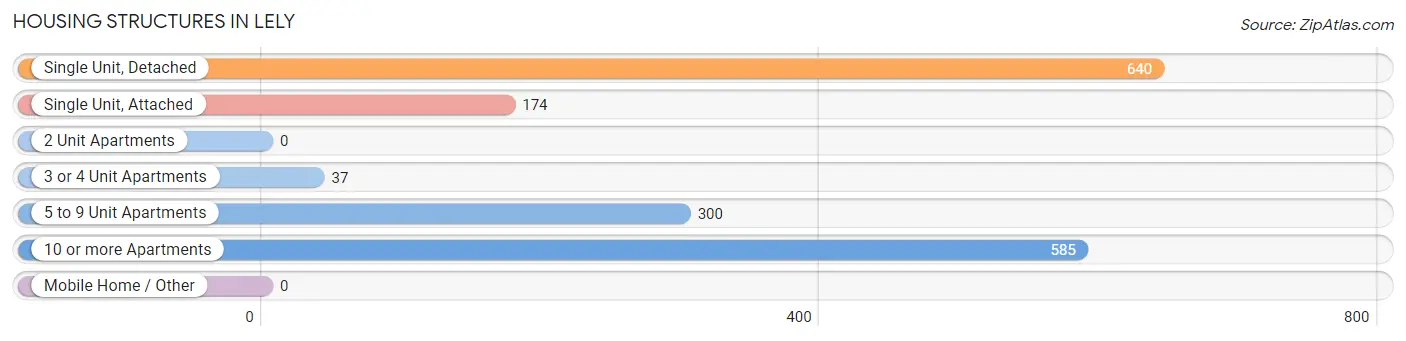
| Structure Type | # Housing Units | % Housing Units |
| Single Unit, Detached | 640 | 36.9% |
| Single Unit, Attached | 174 | 10.0% |
| 2 Unit Apartments | 0 | 0.0% |
| 3 or 4 Unit Apartments | 37 | 2.1% |
| 5 to 9 Unit Apartments | 300 | 17.3% |
| 10 or more Apartments | 585 | 33.7% |
| Mobile Home / Other | 0 | 0.0% |
| Total | 1,736 | 100.0% |
Housing Structures by Occupancy in Lely
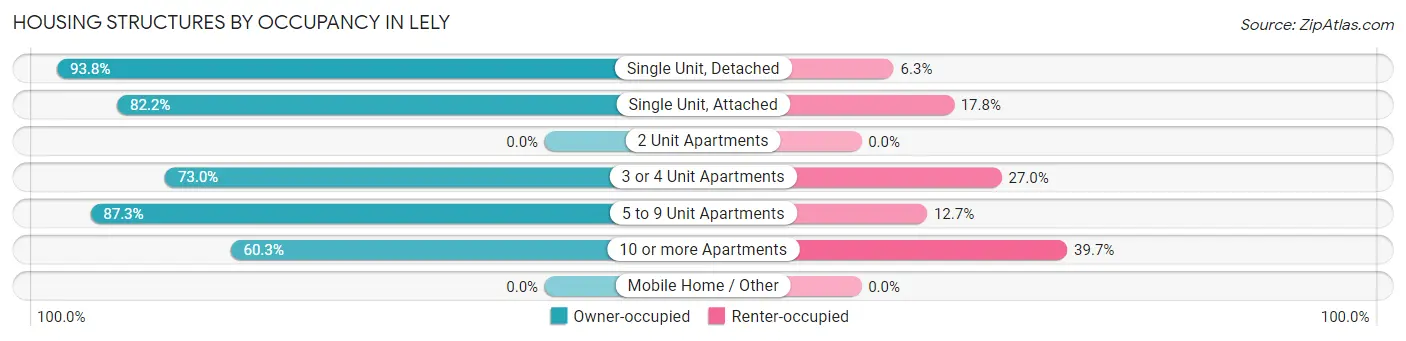
| Structure Type | Owner-occupied | Renter-occupied |
| Single Unit, Detached | 600 (93.8%) | 40 (6.2%) |
| Single Unit, Attached | 143 (82.2%) | 31 (17.8%) |
| 2 Unit Apartments | 0 (0.0%) | 0 (0.0%) |
| 3 or 4 Unit Apartments | 27 (73.0%) | 10 (27.0%) |
| 5 to 9 Unit Apartments | 262 (87.3%) | 38 (12.7%) |
| 10 or more Apartments | 353 (60.3%) | 232 (39.7%) |
| Mobile Home / Other | 0 (0.0%) | 0 (0.0%) |
| Total | 1,385 (79.8%) | 351 (20.2%) |
Housing Structures by Number of Rooms in Lely
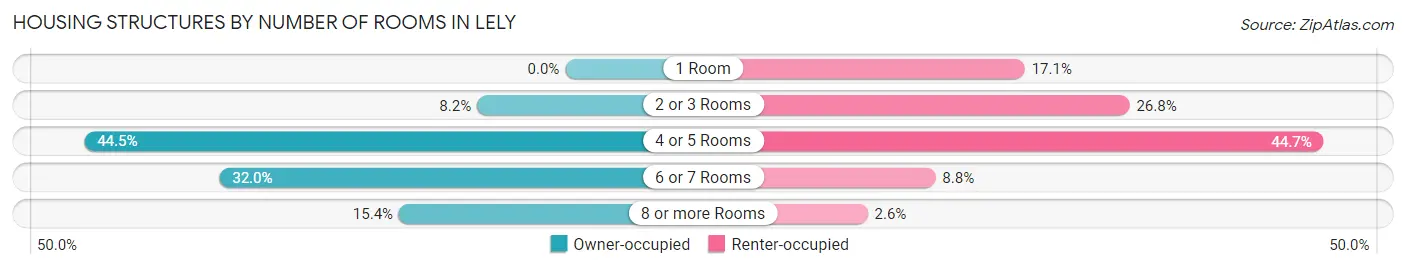
| Number of Rooms | Owner-occupied | Renter-occupied |
| 1 Room | 0 (0.0%) | 60 (17.1%) |
| 2 or 3 Rooms | 113 (8.2%) | 94 (26.8%) |
| 4 or 5 Rooms | 616 (44.5%) | 157 (44.7%) |
| 6 or 7 Rooms | 443 (32.0%) | 31 (8.8%) |
| 8 or more Rooms | 213 (15.4%) | 9 (2.6%) |
| Total | 1,385 (100.0%) | 351 (100.0%) |
Housing Structure by Heating Type in Lely
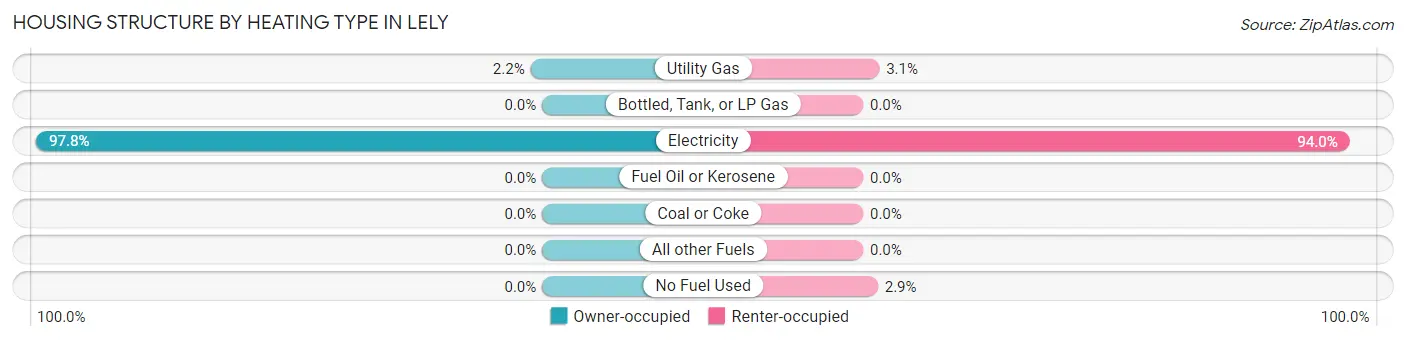
| Heating Type | Owner-occupied | Renter-occupied |
| Utility Gas | 31 (2.2%) | 11 (3.1%) |
| Bottled, Tank, or LP Gas | 0 (0.0%) | 0 (0.0%) |
| Electricity | 1,354 (97.8%) | 330 (94.0%) |
| Fuel Oil or Kerosene | 0 (0.0%) | 0 (0.0%) |
| Coal or Coke | 0 (0.0%) | 0 (0.0%) |
| All other Fuels | 0 (0.0%) | 0 (0.0%) |
| No Fuel Used | 0 (0.0%) | 10 (2.9%) |
| Total | 1,385 (100.0%) | 351 (100.0%) |
Household Vehicle Usage in Lely
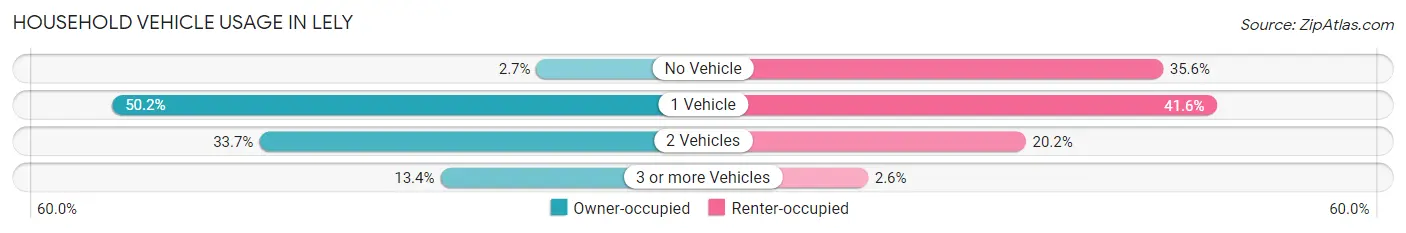
| Vehicles per Household | Owner-occupied | Renter-occupied |
| No Vehicle | 37 (2.7%) | 125 (35.6%) |
| 1 Vehicle | 695 (50.2%) | 146 (41.6%) |
| 2 Vehicles | 467 (33.7%) | 71 (20.2%) |
| 3 or more Vehicles | 186 (13.4%) | 9 (2.6%) |
| Total | 1,385 (100.0%) | 351 (100.0%) |
Real Estate & Mortgages in Lely
Real Estate and Mortgage Overview in Lely
| Characteristic | Without Mortgage | With Mortgage |
| Housing Units | 590 | 795 |
| Median Property Value | $245,700 | $277,100 |
| Median Household Income | $63,750 | $106 |
| Monthly Housing Costs | $667 | $54 |
| Real Estate Taxes | $1,973 | $10 |
Property Value by Mortgage Status in Lely
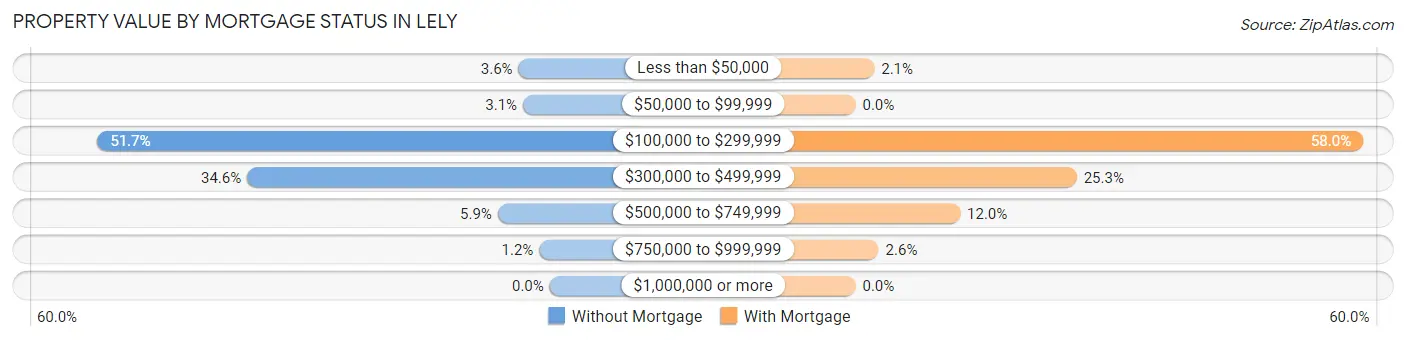
| Property Value | Without Mortgage | With Mortgage |
| Less than $50,000 | 21 (3.6%) | 17 (2.1%) |
| $50,000 to $99,999 | 18 (3.0%) | 0 (0.0%) |
| $100,000 to $299,999 | 305 (51.7%) | 461 (58.0%) |
| $300,000 to $499,999 | 204 (34.6%) | 201 (25.3%) |
| $500,000 to $749,999 | 35 (5.9%) | 95 (11.9%) |
| $750,000 to $999,999 | 7 (1.2%) | 21 (2.6%) |
| $1,000,000 or more | 0 (0.0%) | 0 (0.0%) |
| Total | 590 (100.0%) | 795 (100.0%) |
Household Income by Mortgage Status in Lely
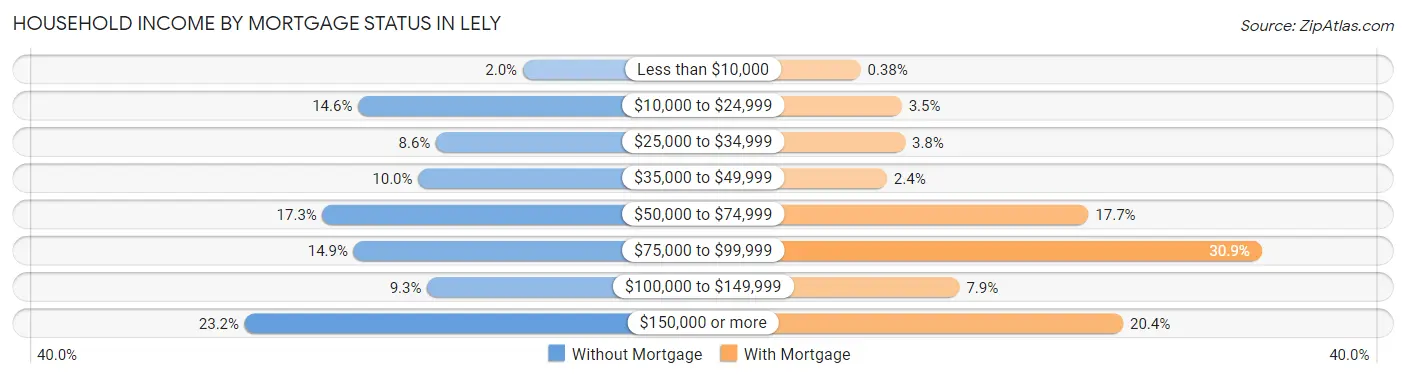
| Household Income | Without Mortgage | With Mortgage |
| Less than $10,000 | 12 (2.0%) | 3 (0.4%) |
| $10,000 to $24,999 | 86 (14.6%) | 28 (3.5%) |
| $25,000 to $34,999 | 51 (8.6%) | 30 (3.8%) |
| $35,000 to $49,999 | 59 (10.0%) | 19 (2.4%) |
| $50,000 to $74,999 | 102 (17.3%) | 141 (17.7%) |
| $75,000 to $99,999 | 88 (14.9%) | 246 (30.9%) |
| $100,000 to $149,999 | 55 (9.3%) | 63 (7.9%) |
| $150,000 or more | 137 (23.2%) | 162 (20.4%) |
| Total | 590 (100.0%) | 795 (100.0%) |
Property Value to Household Income Ratio in Lely
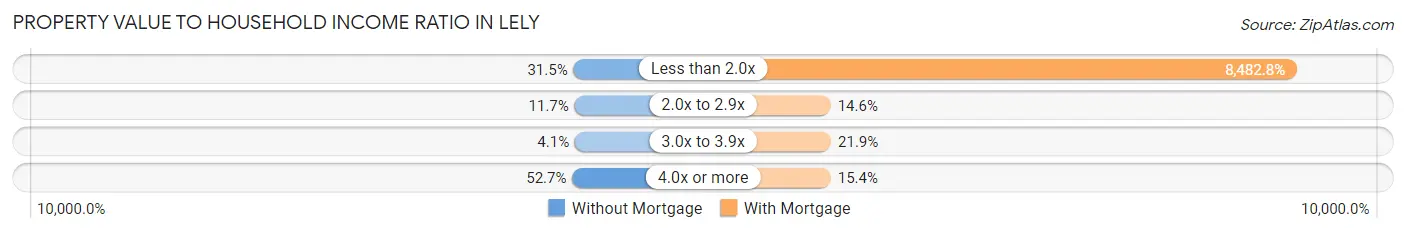
| Value-to-Income Ratio | Without Mortgage | With Mortgage |
| Less than 2.0x | 186 (31.5%) | 67,438 (8,482.8%) |
| 2.0x to 2.9x | 69 (11.7%) | 116 (14.6%) |
| 3.0x to 3.9x | 24 (4.1%) | 174 (21.9%) |
| 4.0x or more | 311 (52.7%) | 122 (15.3%) |
| Total | 590 (100.0%) | 795 (100.0%) |
Real Estate Taxes by Mortgage Status in Lely
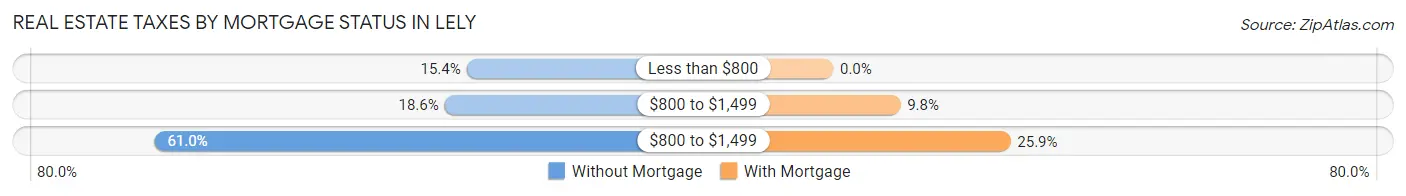
| Property Taxes | Without Mortgage | With Mortgage |
| Less than $800 | 91 (15.4%) | 0 (0.0%) |
| $800 to $1,499 | 110 (18.6%) | 78 (9.8%) |
| $800 to $1,499 | 360 (61.0%) | 206 (25.9%) |
| Total | 590 (100.0%) | 795 (100.0%) |
Health & Disability in Lely
Health Insurance Coverage by Age in Lely
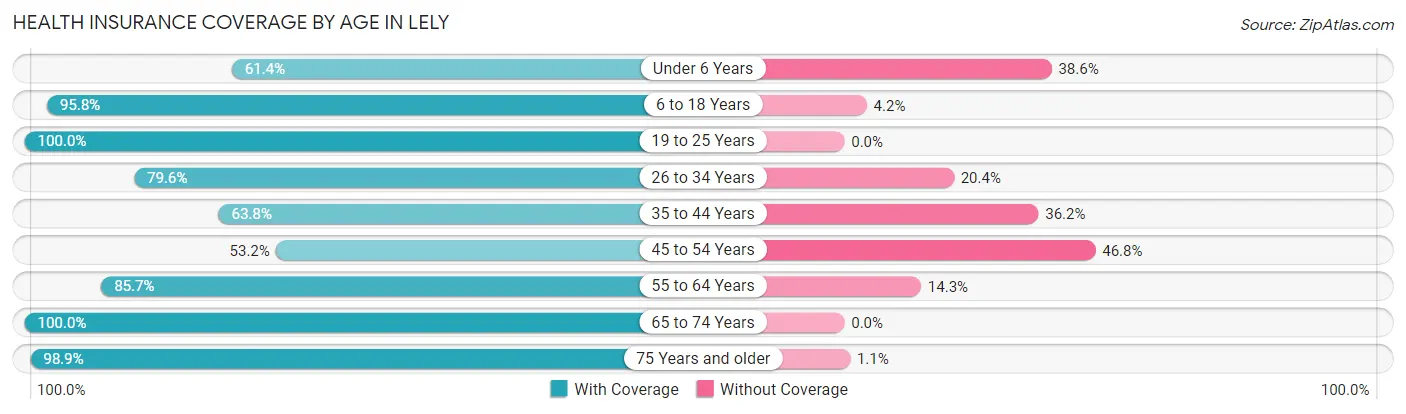
| Age Bracket | With Coverage | Without Coverage |
| Under 6 Years | 27 (61.4%) | 17 (38.6%) |
| 6 to 18 Years | 161 (95.8%) | 7 (4.2%) |
| 19 to 25 Years | 108 (100.0%) | 0 (0.0%) |
| 26 to 34 Years | 78 (79.6%) | 20 (20.4%) |
| 35 to 44 Years | 97 (63.8%) | 55 (36.2%) |
| 45 to 54 Years | 292 (53.2%) | 257 (46.8%) |
| 55 to 64 Years | 402 (85.7%) | 67 (14.3%) |
| 65 to 74 Years | 773 (100.0%) | 0 (0.0%) |
| 75 Years and older | 933 (98.9%) | 10 (1.1%) |
| Total | 2,871 (86.9%) | 433 (13.1%) |
Health Insurance Coverage by Citizenship Status in Lely
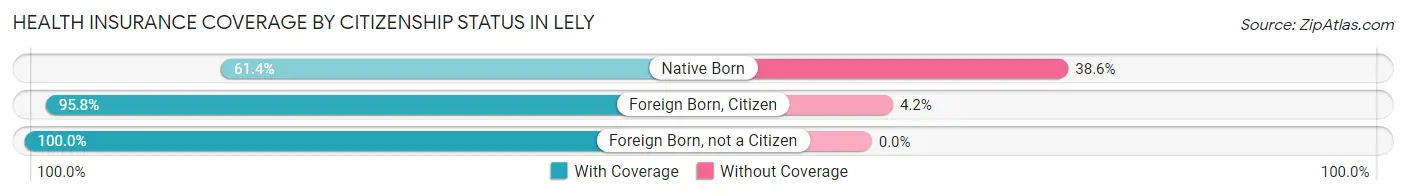
| Citizenship Status | With Coverage | Without Coverage |
| Native Born | 27 (61.4%) | 17 (38.6%) |
| Foreign Born, Citizen | 161 (95.8%) | 7 (4.2%) |
| Foreign Born, not a Citizen | 108 (100.0%) | 0 (0.0%) |
Health Insurance Coverage by Household Income in Lely
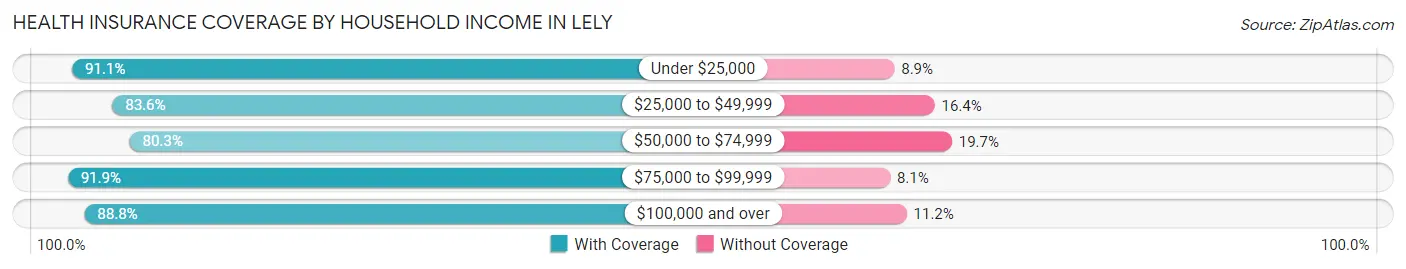
| Household Income | With Coverage | Without Coverage |
| Under $25,000 | 348 (91.1%) | 34 (8.9%) |
| $25,000 to $49,999 | 554 (83.6%) | 109 (16.4%) |
| $50,000 to $74,999 | 539 (80.3%) | 132 (19.7%) |
| $75,000 to $99,999 | 307 (91.9%) | 27 (8.1%) |
| $100,000 and over | 1,038 (88.8%) | 131 (11.2%) |
Public vs Private Health Insurance Coverage by Age in Lely
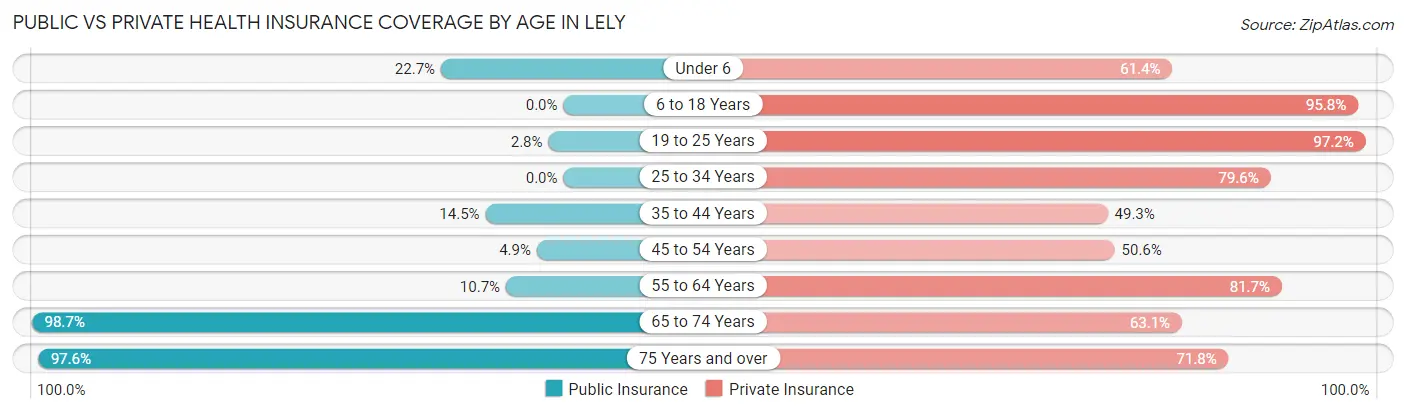
| Age Bracket | Public Insurance | Private Insurance |
| Under 6 | 10 (22.7%) | 27 (61.4%) |
| 6 to 18 Years | 0 (0.0%) | 161 (95.8%) |
| 19 to 25 Years | 3 (2.8%) | 105 (97.2%) |
| 25 to 34 Years | 0 (0.0%) | 78 (79.6%) |
| 35 to 44 Years | 22 (14.5%) | 75 (49.3%) |
| 45 to 54 Years | 27 (4.9%) | 278 (50.6%) |
| 55 to 64 Years | 50 (10.7%) | 383 (81.7%) |
| 65 to 74 Years | 763 (98.7%) | 488 (63.1%) |
| 75 Years and over | 920 (97.6%) | 677 (71.8%) |
| Total | 1,795 (54.3%) | 2,272 (68.8%) |
Disability Status by Sex by Age in Lely
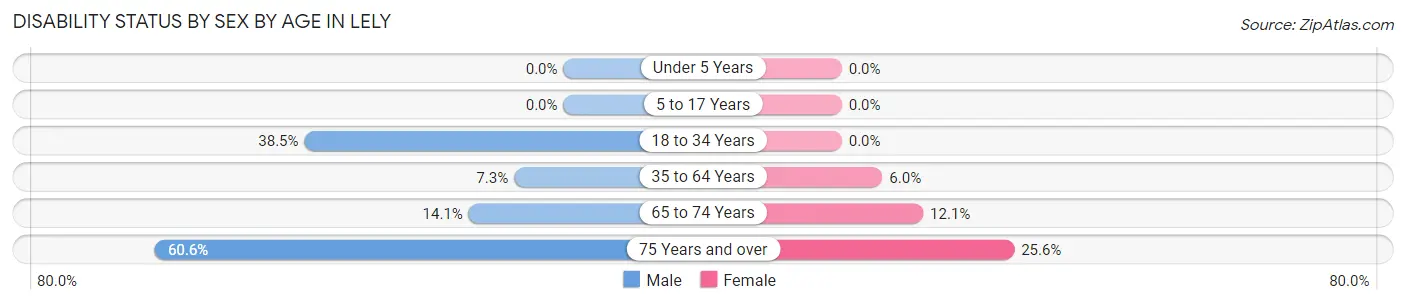
| Age Bracket | Male | Female |
| Under 5 Years | 0 (0.0%) | 0 (0.0%) |
| 5 to 17 Years | 0 (0.0%) | 0 (0.0%) |
| 18 to 34 Years | 35 (38.5%) | 0 (0.0%) |
| 35 to 64 Years | 42 (7.3%) | 36 (6.0%) |
| 65 to 74 Years | 54 (14.1%) | 47 (12.1%) |
| 75 Years and over | 245 (60.6%) | 138 (25.6%) |
Disability Class by Sex by Age in Lely
Disability Class: Hearing Difficulty
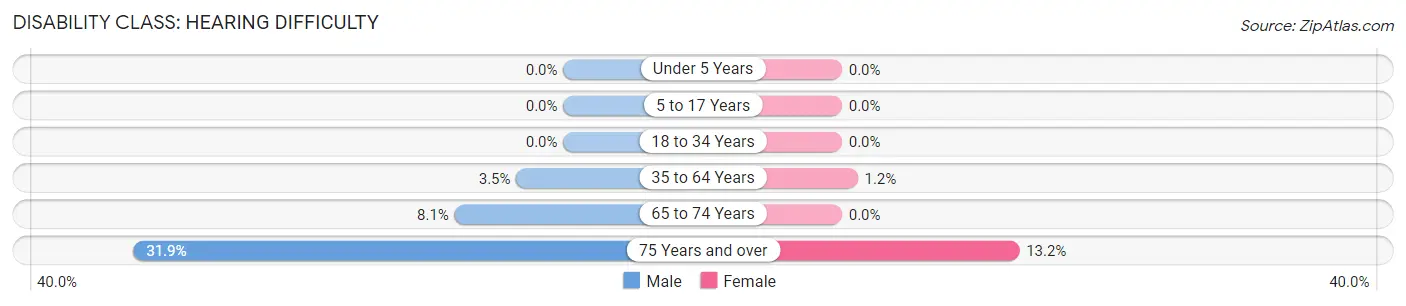
| Age Bracket | Male | Female |
| Under 5 Years | 0 (0.0%) | 0 (0.0%) |
| 5 to 17 Years | 0 (0.0%) | 0 (0.0%) |
| 18 to 34 Years | 0 (0.0%) | 0 (0.0%) |
| 35 to 64 Years | 20 (3.5%) | 7 (1.2%) |
| 65 to 74 Years | 31 (8.1%) | 0 (0.0%) |
| 75 Years and over | 129 (31.9%) | 71 (13.2%) |
Disability Class: Vision Difficulty
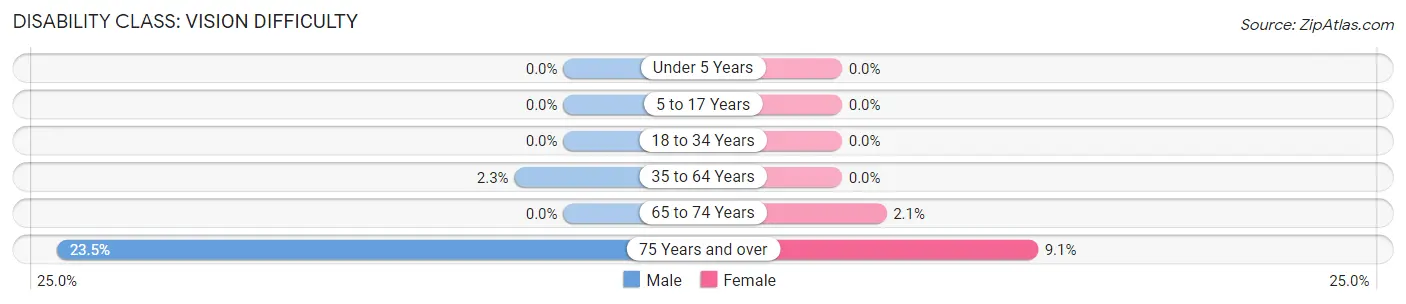
| Age Bracket | Male | Female |
| Under 5 Years | 0 (0.0%) | 0 (0.0%) |
| 5 to 17 Years | 0 (0.0%) | 0 (0.0%) |
| 18 to 34 Years | 0 (0.0%) | 0 (0.0%) |
| 35 to 64 Years | 13 (2.3%) | 0 (0.0%) |
| 65 to 74 Years | 0 (0.0%) | 8 (2.1%) |
| 75 Years and over | 95 (23.5%) | 49 (9.1%) |
Disability Class: Cognitive Difficulty
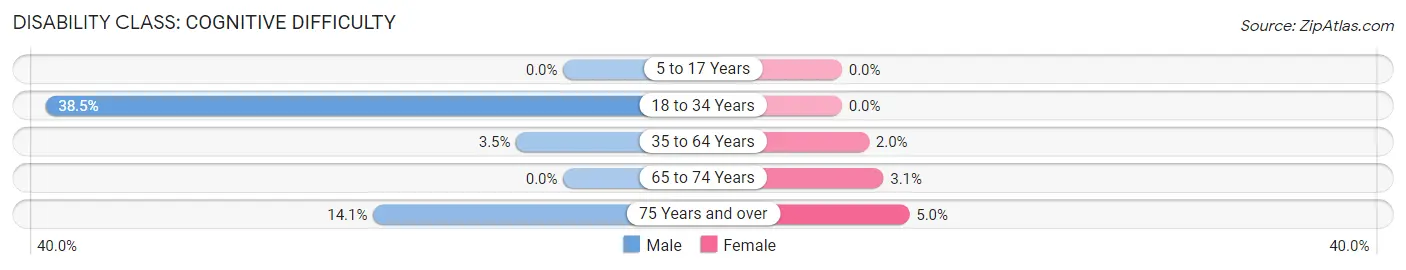
| Age Bracket | Male | Female |
| 5 to 17 Years | 0 (0.0%) | 0 (0.0%) |
| 18 to 34 Years | 35 (38.5%) | 0 (0.0%) |
| 35 to 64 Years | 20 (3.5%) | 12 (2.0%) |
| 65 to 74 Years | 0 (0.0%) | 12 (3.1%) |
| 75 Years and over | 57 (14.1%) | 27 (5.0%) |
Disability Class: Ambulatory Difficulty
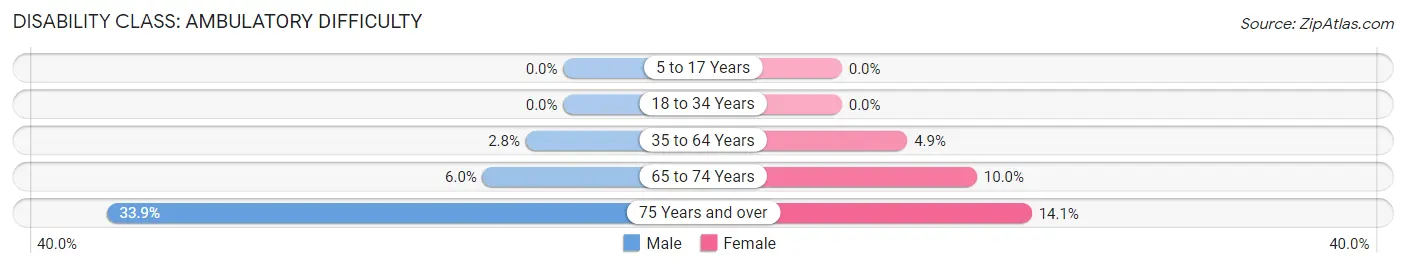
| Age Bracket | Male | Female |
| 5 to 17 Years | 0 (0.0%) | 0 (0.0%) |
| 18 to 34 Years | 0 (0.0%) | 0 (0.0%) |
| 35 to 64 Years | 16 (2.8%) | 29 (4.9%) |
| 65 to 74 Years | 23 (6.0%) | 39 (10.0%) |
| 75 Years and over | 137 (33.9%) | 76 (14.1%) |
Disability Class: Self-Care Difficulty
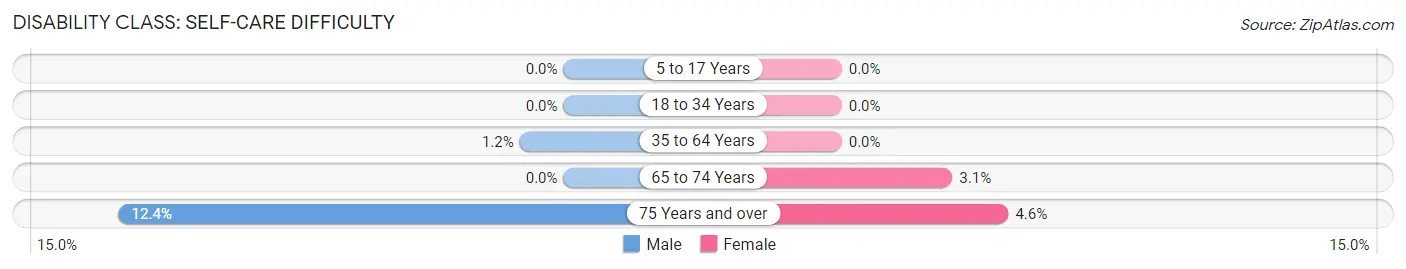
| Age Bracket | Male | Female |
| 5 to 17 Years | 0 (0.0%) | 0 (0.0%) |
| 18 to 34 Years | 0 (0.0%) | 0 (0.0%) |
| 35 to 64 Years | 7 (1.2%) | 0 (0.0%) |
| 65 to 74 Years | 0 (0.0%) | 12 (3.1%) |
| 75 Years and over | 50 (12.4%) | 25 (4.6%) |
Technology Access in Lely
Computing Device Access in Lely
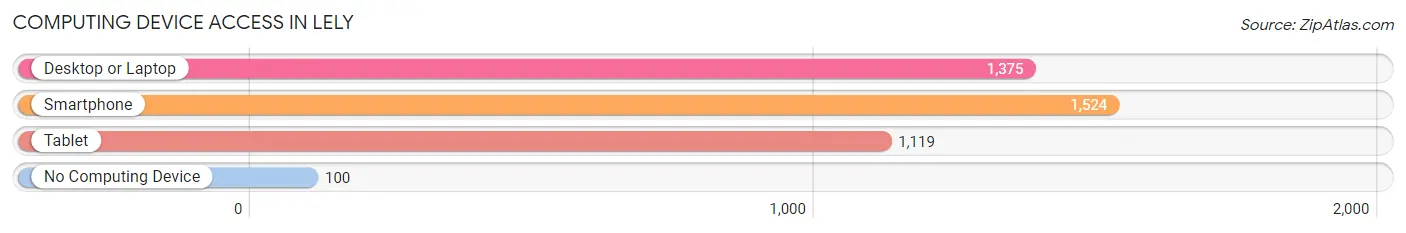
| Device Type | # Households | % Households |
| Desktop or Laptop | 1,375 | 79.2% |
| Smartphone | 1,524 | 87.8% |
| Tablet | 1,119 | 64.5% |
| No Computing Device | 100 | 5.8% |
| Total | 1,736 | 100.0% |
Internet Access in Lely
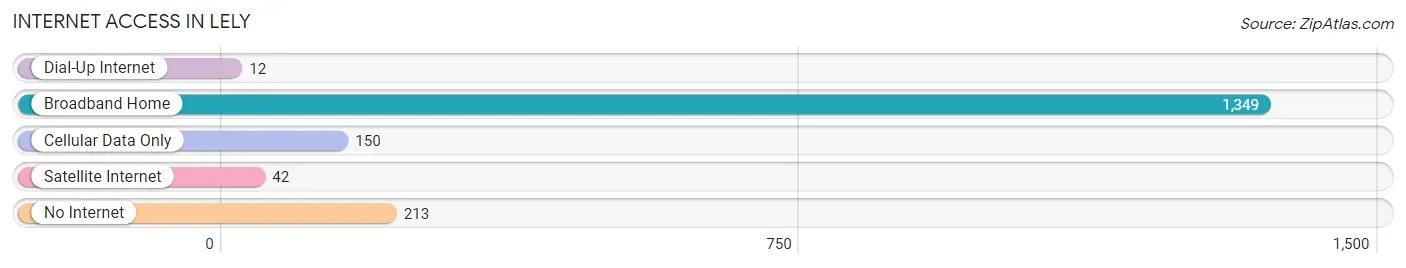
| Internet Type | # Households | % Households |
| Dial-Up Internet | 12 | 0.7% |
| Broadband Home | 1,349 | 77.7% |
| Cellular Data Only | 150 | 8.6% |
| Satellite Internet | 42 | 2.4% |
| No Internet | 213 | 12.3% |
| Total | 1,736 | 100.0% |
Lely Summary
Lely is a census-designated place (CDP) located in Collier County, Florida, United States. It is part of the Naples–Marco Island Metropolitan Statistical Area. The population was 5,072 at the 2010 census.
History
Lely was founded in the early 1900s by the Lely family, who were originally from Holland. The family purchased a large tract of land in the area and began to develop it. The town was named after the family and was incorporated in 1925.
The town was originally a farming community, but in the 1950s, the Lely family began to develop the area into a residential community. The first homes were built in the late 1950s and early 1960s. The town has grown steadily since then and is now home to a variety of businesses, including a golf course, shopping centers, and restaurants.
Geography
Lely is located at 26°10'25" North, 81°37'17" West (26.173611, -81.621389). According to the United States Census Bureau, the CDP has a total area of 4.2 square miles (10.8 km2), of which 4.1 square miles (10.6 km2) is land and 0.1 square miles (0.2 km2) is water.
Economy
Lely is home to a variety of businesses, including a golf course, shopping centers, and restaurants. The town is also home to a number of manufacturing and industrial businesses, including a plastics factory and a metal fabrication plant.
Demographics
As of the census of 2000, there were 5,072 people, 2,072 households, and 1,521 families residing in the CDP. The population density was 1,233.2 people per square mile (476.2/km2). There were 2,279 housing units at an average density of 556.3/sq mi (214.9/km2). The racial makeup of the CDP was 94.90% White, 0.94% African American, 0.14% Native American, 1.37% Asian, 0.02% Pacific Islander, 1.37% from other races, and 1.25% from two or more races. Hispanic or Latino of any race were 5.45% of the population.
There were 2,072 households, out of which 28.2% had children under the age of 18 living with them, 59.2% were married couples living together, 8.2% had a female householder with no husband present, and 29.2% were non-families. 24.2% of all households were made up of individuals, and 11.2% had someone living alone who was 65 years of age or older. The average household size was 2.44 and the average family size was 2.90.
In the CDP, the population was spread out, with 22.2% under the age of 18, 5.2% from 18 to 24, 25.2% from 25 to 44, 27.2% from 45 to 64, and 20.2% who were 65 years of age or older. The median age was 43 years. For every 100 females, there were 94.2 males. For every 100 females age 18 and over, there were 91.2 males.
The median income for a household in the CDP was $50,938, and the median income for a family was $58,906. Males had a median income of $41,964 versus $30,938 for females. The per capita income for the CDP was $25,945. About 4.2% of families and 5.7% of the population were below the poverty line, including 6.2% of those under age 18 and 4.2% of those age 65 or over.
Common Questions
What is Per Capita Income in Lely?
Per Capita income in Lely is $43,936.
What is the Median Family Income in Lely?
Median Family Income in Lely is $77,031.
What is the Median Household income in Lely?
Median Household Income in Lely is $59,167.
What is Income or Wage Gap in Lely?
Income or Wage Gap in Lely is 10.3%.
Women in Lely earn 89.7 cents for every dollar earned by a man.
What is Inequality or Gini Index in Lely?
Inequality or Gini Index in Lely is 0.44.
What is the Total Population of Lely?
Total Population of Lely is 3,548.
What is the Total Male Population of Lely?
Total Male Population of Lely is 1,672.
What is the Total Female Population of Lely?
Total Female Population of Lely is 1,876.
What is the Ratio of Males per 100 Females in Lely?
There are 89.13 Males per 100 Females in Lely.
What is the Ratio of Females per 100 Males in Lely?
There are 112.20 Females per 100 Males in Lely.
What is the Median Population Age in Lely?
Median Population Age in Lely is 66.6 Years.
What is the Average Family Size in Lely
Average Family Size in Lely is 2.4 People.
What is the Average Household Size in Lely
Average Household Size in Lely is 1.9 People.
How Large is the Labor Force in Lely?
There are 1,459 People in the Labor Forcein in Lely.
What is the Percentage of People in the Labor Force in Lely?
43.6% of People are in the Labor Force in Lely.
What is the Unemployment Rate in Lely?
Unemployment Rate in Lely is 2.9%.