Orangetree, FL Map & Demographics
Orangetree Map
Orangetree Overview
$34,423
PER CAPITA INCOME
$109,103
AVG FAMILY INCOME
$107,109
AVG HOUSEHOLD INCOME
44.8%
WAGE / INCOME GAP [ % ]
55.2¢/ $1
WAGE / INCOME GAP [ $ ]
0.32
INEQUALITY / GINI INDEX
4,929
TOTAL POPULATION
2,337
MALE POPULATION
2,592
FEMALE POPULATION
90.16
MALES / 100 FEMALES
110.91
FEMALES / 100 MALES
43.4
MEDIAN AGE
3.2
AVG FAMILY SIZE
3.1
AVG HOUSEHOLD SIZE
2,431
LABOR FORCE [ PEOPLE ]
62.0%
PERCENT IN LABOR FORCE
3.2%
UNEMPLOYMENT RATE
Income in Orangetree
Income Overview in Orangetree
Per Capita Income in Orangetree is $34,423, while median incomes of families and households are $109,103 and $107,109 respectively.
| Characteristic | Number | Measure |
| Per Capita Income | 4,929 | $34,423 |
| Median Family Income | 1,380 | $109,103 |
| Mean Family Income | 1,380 | $111,762 |
| Median Household Income | 1,611 | $107,109 |
| Mean Household Income | 1,611 | $103,793 |
| Income Deficit | 1,380 | $0 |
| Wage / Income Gap (%) | 4,929 | 44.81% |
| Wage / Income Gap ($) | 4,929 | 55.19¢ per $1 |
| Gini / Inequality Index | 4,929 | 0.32 |
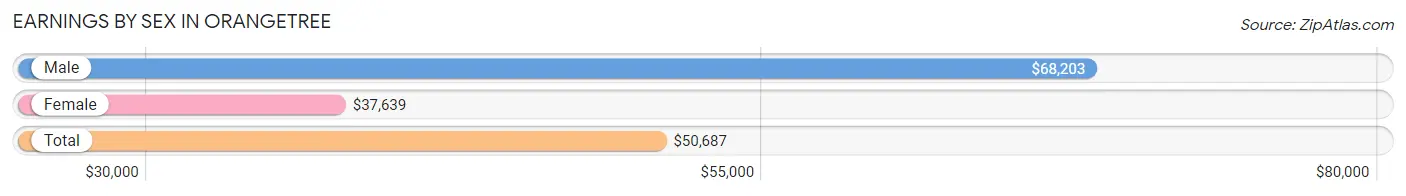
Earnings by Sex in Orangetree
Average Earnings in Orangetree are $50,687, $68,203 for men and $37,639 for women, a difference of 44.8%.
| Sex | Number | Average Earnings |
| Male | 1,339 (54.1%) | $68,203 |
| Female | 1,135 (45.9%) | $37,639 |
| Total | 2,474 (100.0%) | $50,687 |
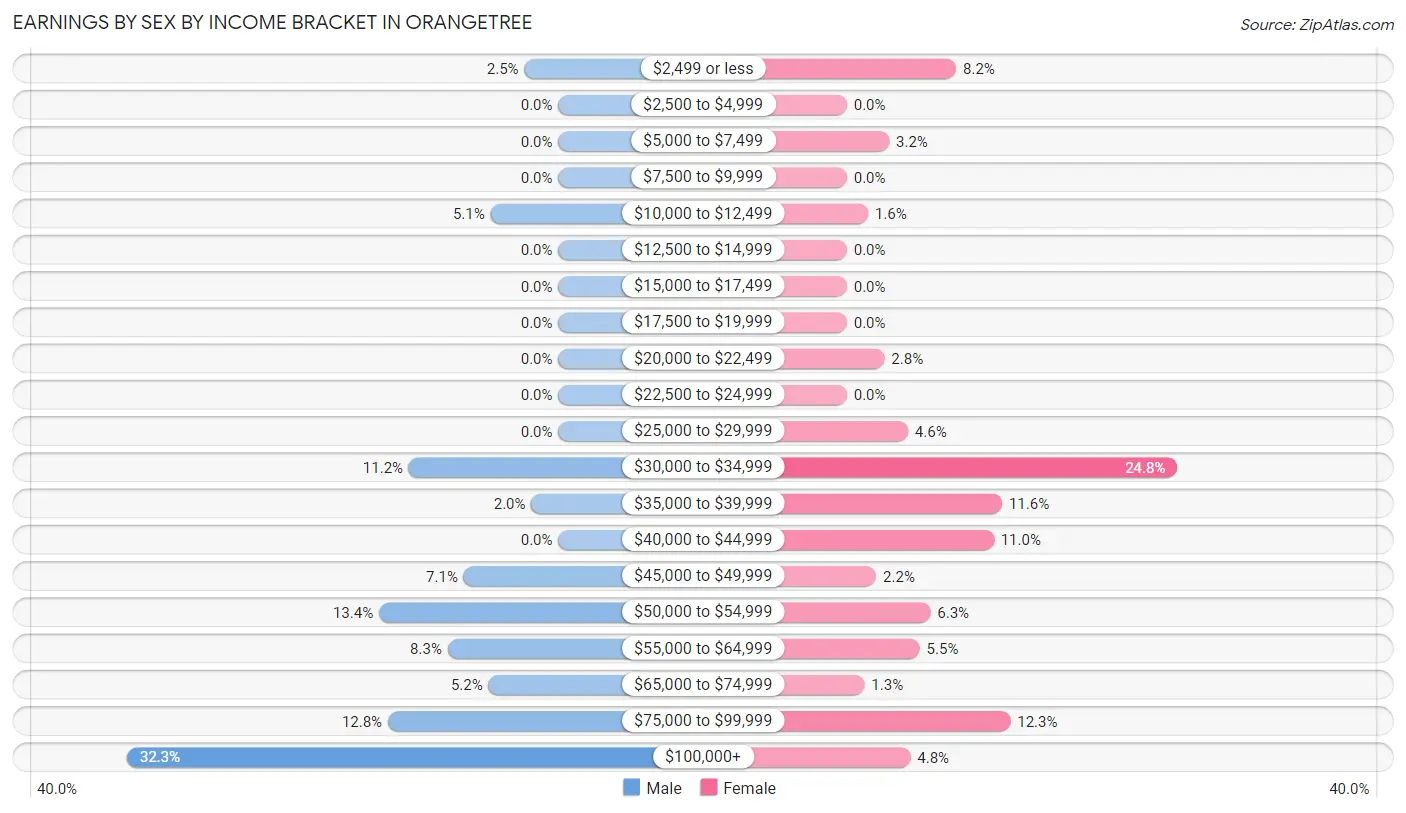
Earnings by Sex by Income Bracket in Orangetree
The most common earnings brackets in Orangetree are $100,000+ for men (433 | 32.3%) and $30,000 to $34,999 for women (281 | 24.8%).
| Income | Male | Female |
| $2,499 or less | 34 (2.5%) | 93 (8.2%) |
| $2,500 to $4,999 | 0 (0.0%) | 0 (0.0%) |
| $5,000 to $7,499 | 0 (0.0%) | 36 (3.2%) |
| $7,500 to $9,999 | 0 (0.0%) | 0 (0.0%) |
| $10,000 to $12,499 | 68 (5.1%) | 18 (1.6%) |
| $12,500 to $14,999 | 0 (0.0%) | 0 (0.0%) |
| $15,000 to $17,499 | 0 (0.0%) | 0 (0.0%) |
| $17,500 to $19,999 | 0 (0.0%) | 0 (0.0%) |
| $20,000 to $22,499 | 0 (0.0%) | 32 (2.8%) |
| $22,500 to $24,999 | 0 (0.0%) | 0 (0.0%) |
| $25,000 to $29,999 | 0 (0.0%) | 52 (4.6%) |
| $30,000 to $34,999 | 150 (11.2%) | 281 (24.8%) |
| $35,000 to $39,999 | 27 (2.0%) | 132 (11.6%) |
| $40,000 to $44,999 | 0 (0.0%) | 125 (11.0%) |
| $45,000 to $49,999 | 95 (7.1%) | 25 (2.2%) |
| $50,000 to $54,999 | 180 (13.4%) | 71 (6.3%) |
| $55,000 to $64,999 | 111 (8.3%) | 62 (5.5%) |
| $65,000 to $74,999 | 70 (5.2%) | 15 (1.3%) |
| $75,000 to $99,999 | 171 (12.8%) | 139 (12.2%) |
| $100,000+ | 433 (32.3%) | 54 (4.8%) |
| Total | 1,339 (100.0%) | 1,135 (100.0%) |
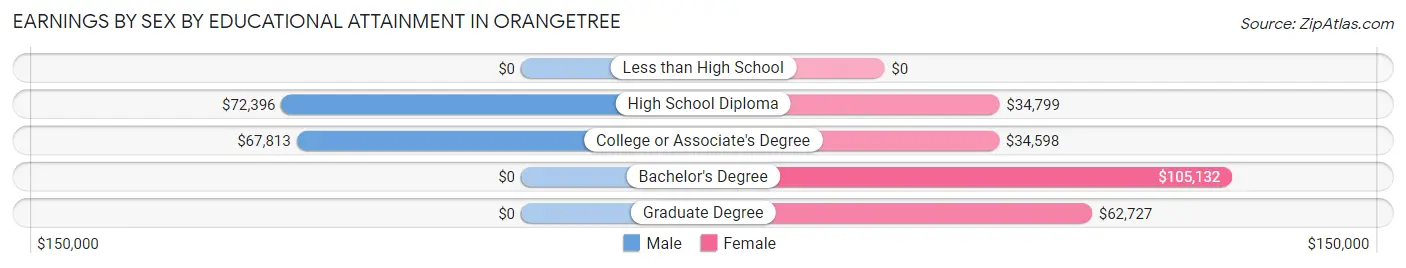
Earnings by Sex by Educational Attainment in Orangetree
Average earnings in Orangetree are $71,505 for men and $39,028 for women, a difference of 45.4%. Men with an educational attainment of high school diploma enjoy the highest average annual earnings of $72,396, while those with college or associate's degree education earn the least with $67,813. Women with an educational attainment of bachelor's degree earn the most with the average annual earnings of $105,132, while those with college or associate's degree education have the smallest earnings of $34,598.
| Educational Attainment | Male Income | Female Income |
| Less than High School | - | - |
| High School Diploma | $72,396 | $34,799 |
| College or Associate's Degree | $67,813 | $34,598 |
| Bachelor's Degree | - | - |
| Graduate Degree | - | - |
| Total | $71,505 | $39,028 |
Family Income in Orangetree
Family Income Brackets in Orangetree
According to the Orangetree family income data, there are 455 families falling into the $100,000 to $149,999 income range, which is the most common income bracket and makes up 33.0% of all families.
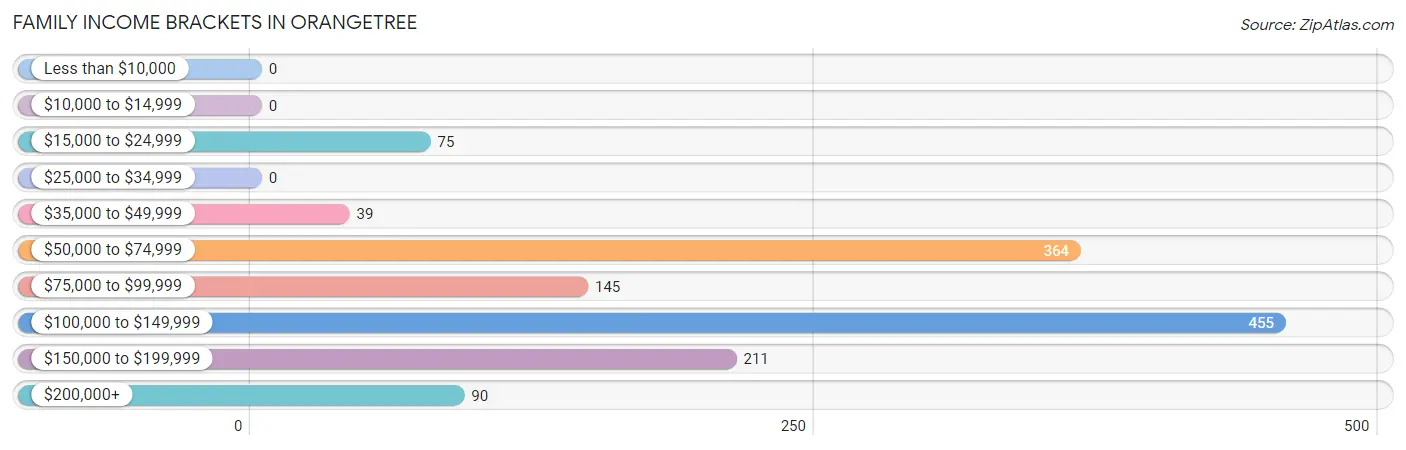
| Income Bracket | # Families | % Families |
| Less than $10,000 | 0 | 0.0% |
| $10,000 to $14,999 | 0 | 0.0% |
| $15,000 to $24,999 | 75 | 5.4% |
| $25,000 to $34,999 | 0 | 0.0% |
| $35,000 to $49,999 | 39 | 2.8% |
| $50,000 to $74,999 | 364 | 26.4% |
| $75,000 to $99,999 | 145 | 10.5% |
| $100,000 to $149,999 | 455 | 33.0% |
| $150,000 to $199,999 | 211 | 15.3% |
| $200,000+ | 90 | 6.5% |
Family Income by Famaliy Size in Orangetree
4-person families (272 | 19.7%) account for the highest median family income in Orangetree with $172,095 per family, while 4-person families (272 | 19.7%) have the highest median income of $43,024 per family member.
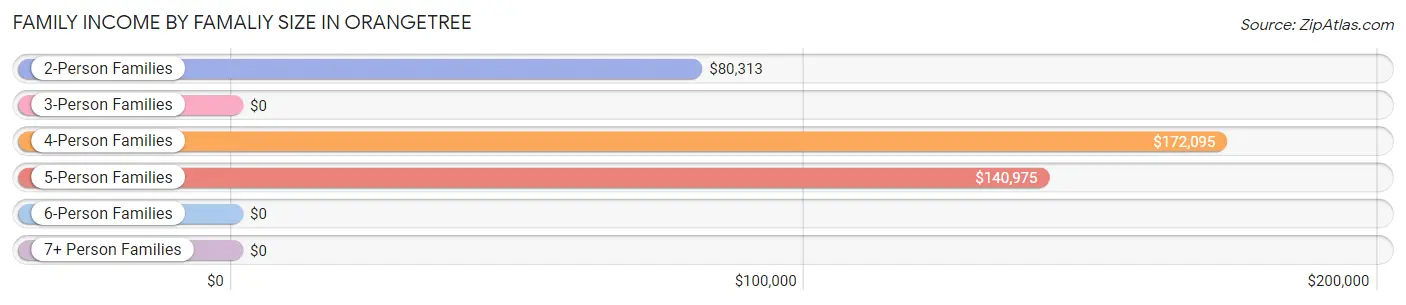
| Income Bracket | # Families | Median Income |
| 2-Person Families | 511 (37.0%) | $80,313 |
| 3-Person Families | 298 (21.6%) | $0 |
| 4-Person Families | 272 (19.7%) | $172,095 |
| 5-Person Families | 242 (17.5%) | $140,975 |
| 6-Person Families | 57 (4.1%) | $0 |
| 7+ Person Families | 0 (0.0%) | $0 |
| Total | 1,380 (100.0%) | $109,103 |
Family Income by Number of Earners in Orangetree
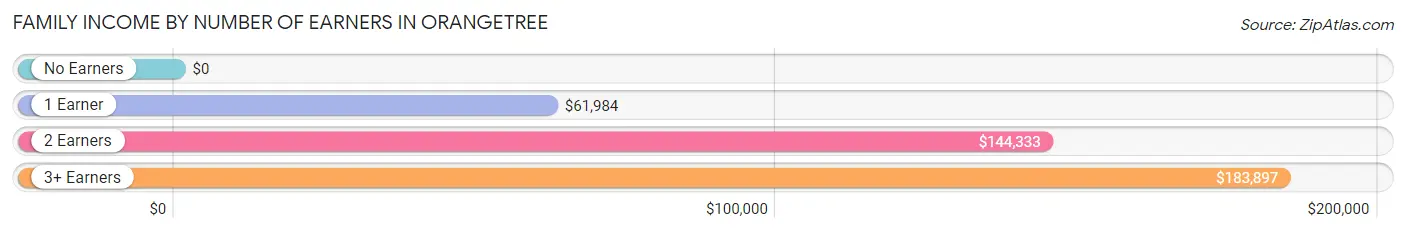
| Number of Earners | # Families | Median Income |
| No Earners | 165 (12.0%) | $0 |
| 1 Earner | 490 (35.5%) | $61,984 |
| 2 Earners | 604 (43.8%) | $144,333 |
| 3+ Earners | 121 (8.8%) | $183,897 |
| Total | 1,380 (100.0%) | $109,103 |
Household Income in Orangetree
Household Income Brackets in Orangetree
With 454 households falling in the category, the $100,000 to $149,999 income range is the most frequent in Orangetree, accounting for 28.2% of all households.
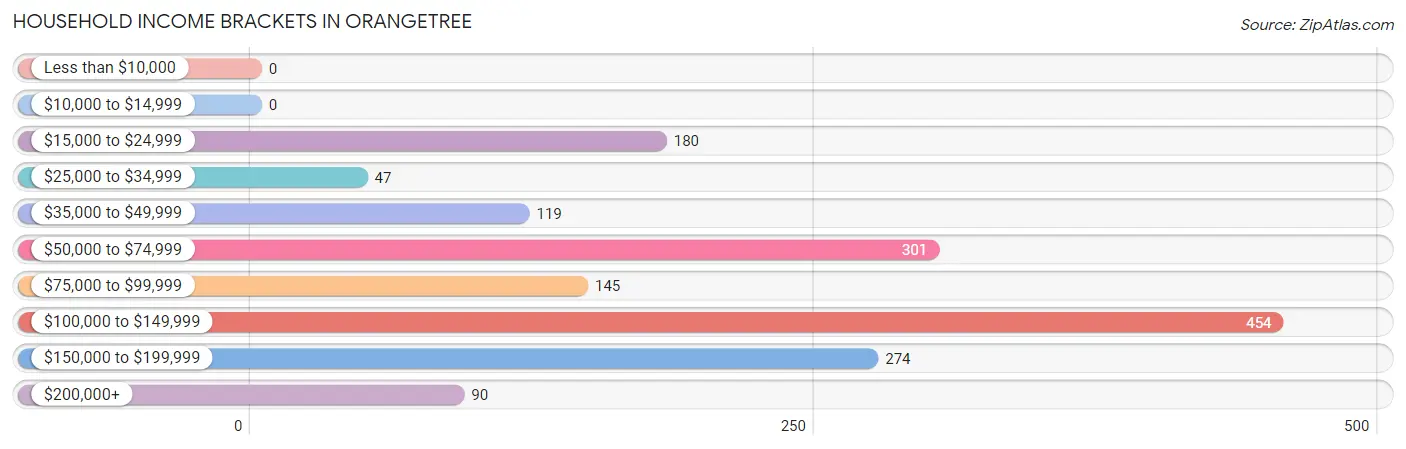
| Income Bracket | # Households | % Households |
| Less than $10,000 | 0 | 0.0% |
| $10,000 to $14,999 | 0 | 0.0% |
| $15,000 to $24,999 | 180 | 11.2% |
| $25,000 to $34,999 | 47 | 2.9% |
| $35,000 to $49,999 | 119 | 7.4% |
| $50,000 to $74,999 | 301 | 18.7% |
| $75,000 to $99,999 | 145 | 9.0% |
| $100,000 to $149,999 | 454 | 28.2% |
| $150,000 to $199,999 | 274 | 17.0% |
| $200,000+ | 90 | 5.6% |
Household Income by Householder Age in Orangetree
The median household income in Orangetree is $107,109, with the highest median household income of $141,844 found in the 25 to 44 years age bracket for the primary householder. A total of 526 households (32.7%) fall into this category.
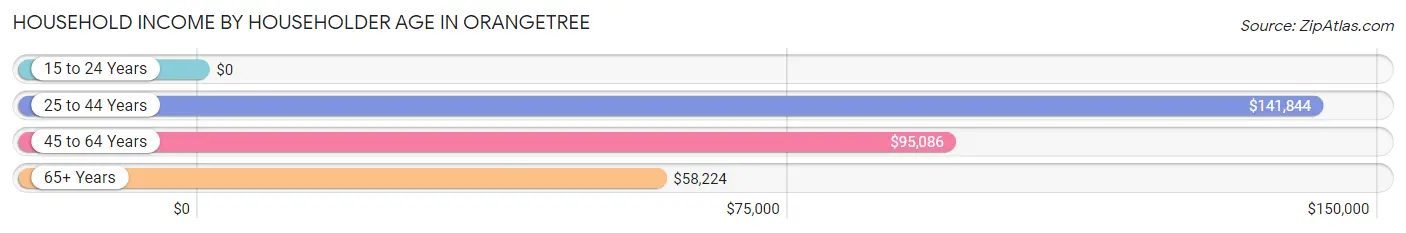
| Income Bracket | # Households | Median Income |
| 15 to 24 Years | 0 (0.0%) | $0 |
| 25 to 44 Years | 526 (32.7%) | $141,844 |
| 45 to 64 Years | 679 (42.1%) | $95,086 |
| 65+ Years | 406 (25.2%) | $58,224 |
| Total | 1,611 (100.0%) | $107,109 |
Poverty in Orangetree
Income Below Poverty by Sex and Age in Orangetree
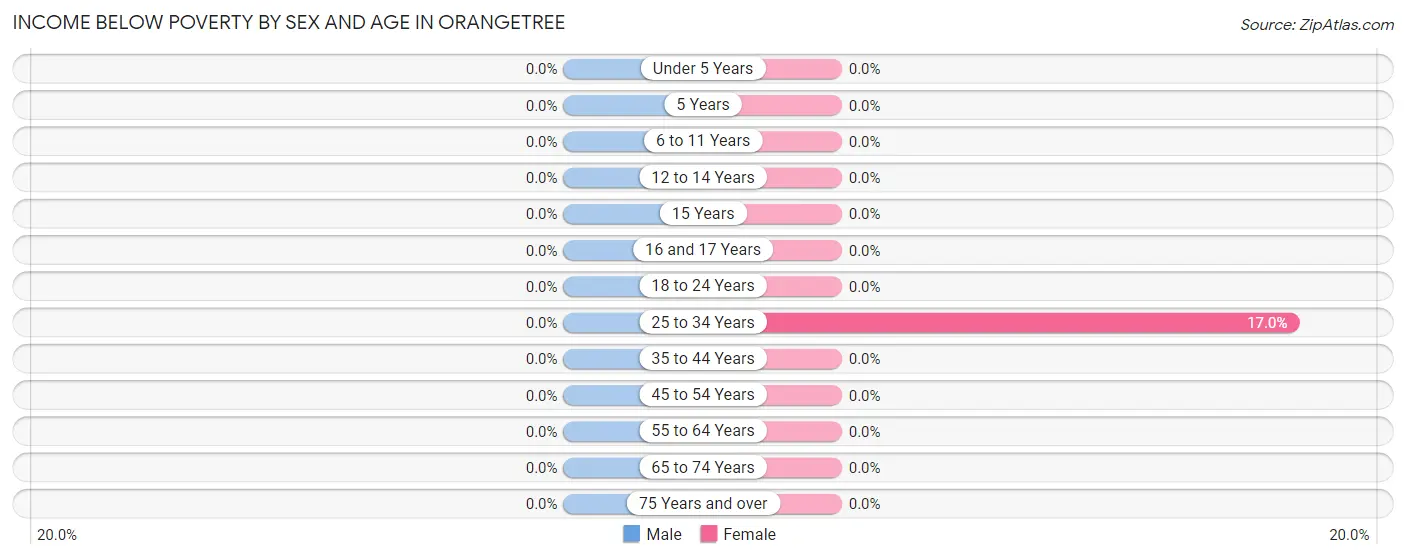
| Age Bracket | Male | Female |
| Under 5 Years | 0 (0.0%) | 0 (0.0%) |
| 5 Years | 0 (0.0%) | 0 (0.0%) |
| 6 to 11 Years | 0 (0.0%) | 0 (0.0%) |
| 12 to 14 Years | 0 (0.0%) | 0 (0.0%) |
| 15 Years | 0 (0.0%) | 0 (0.0%) |
| 16 and 17 Years | 0 (0.0%) | 0 (0.0%) |
| 18 to 24 Years | 0 (0.0%) | 0 (0.0%) |
| 25 to 34 Years | 0 (0.0%) | 64 (17.0%) |
| 35 to 44 Years | 0 (0.0%) | 0 (0.0%) |
| 45 to 54 Years | 0 (0.0%) | 0 (0.0%) |
| 55 to 64 Years | 0 (0.0%) | 0 (0.0%) |
| 65 to 74 Years | 0 (0.0%) | 0 (0.0%) |
| 75 Years and over | 0 (0.0%) | 0 (0.0%) |
| Total | 0 (0.0%) | 64 (2.5%) |
Income Above Poverty by Sex and Age in Orangetree
According to the poverty statistics in Orangetree, males aged under 5 years and females aged under 5 years are the age groups that are most secure financially, with 100.0% of males and 100.0% of females in these age groups living above the poverty line.
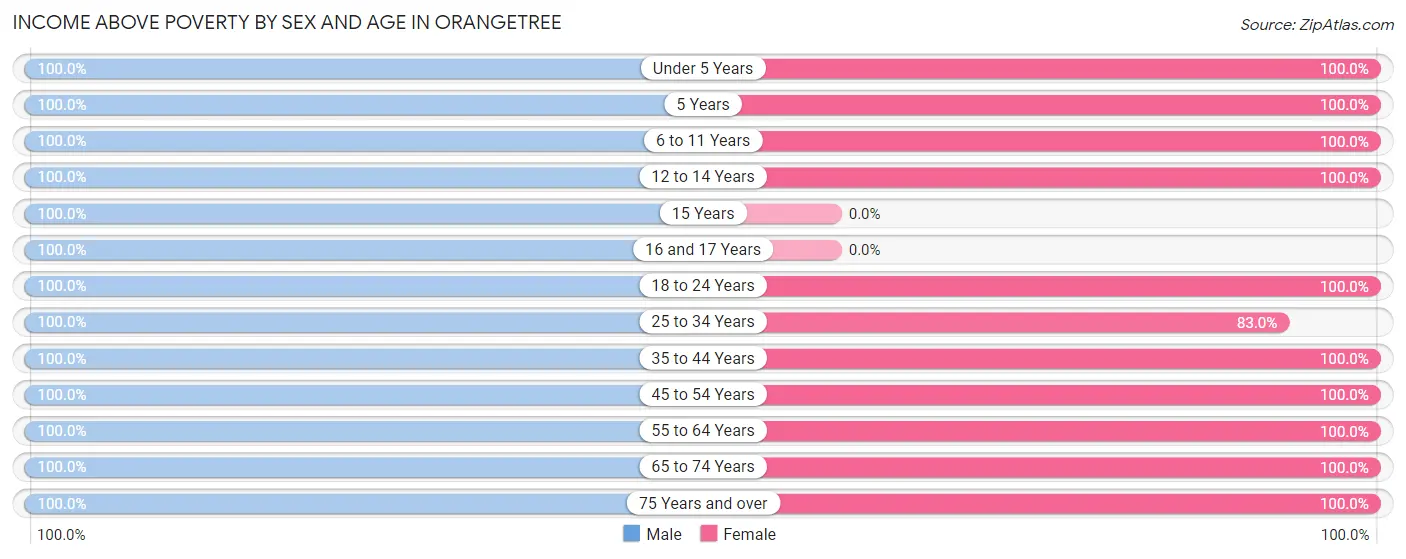
| Age Bracket | Male | Female |
| Under 5 Years | 118 (100.0%) | 167 (100.0%) |
| 5 Years | 67 (100.0%) | 58 (100.0%) |
| 6 to 11 Years | 208 (100.0%) | 189 (100.0%) |
| 12 to 14 Years | 26 (100.0%) | 126 (100.0%) |
| 15 Years | 49 (100.0%) | 0 (0.0%) |
| 16 and 17 Years | 63 (100.0%) | 0 (0.0%) |
| 18 to 24 Years | 80 (100.0%) | 90 (100.0%) |
| 25 to 34 Years | 320 (100.0%) | 313 (83.0%) |
| 35 to 44 Years | 362 (100.0%) | 237 (100.0%) |
| 45 to 54 Years | 251 (100.0%) | 422 (100.0%) |
| 55 to 64 Years | 342 (100.0%) | 327 (100.0%) |
| 65 to 74 Years | 219 (100.0%) | 221 (100.0%) |
| 75 Years and over | 232 (100.0%) | 378 (100.0%) |
| Total | 2,337 (100.0%) | 2,528 (97.5%) |
Income Below Poverty Among Married-Couple Families in Orangetree
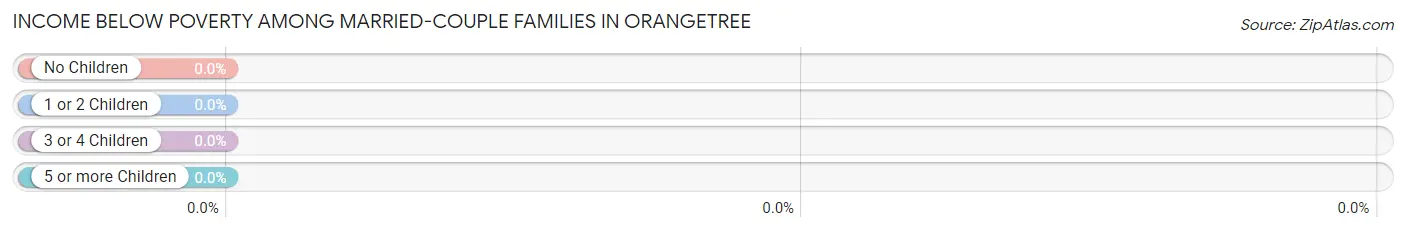
| Children | Above Poverty | Below Poverty |
| No Children | 671 (100.0%) | 0 (0.0%) |
| 1 or 2 Children | 487 (100.0%) | 0 (0.0%) |
| 3 or 4 Children | 78 (100.0%) | 0 (0.0%) |
| 5 or more Children | 0 (0.0%) | 0 (0.0%) |
| Total | 1,236 (100.0%) | 0 (0.0%) |
Income Below Poverty Among Single-Parent Households in Orangetree
| Children | Single Father | Single Mother |
| No Children | 0 (0.0%) | 0 (0.0%) |
| 1 or 2 Children | 0 (0.0%) | 0 (0.0%) |
| 3 or 4 Children | 0 (0.0%) | 0 (0.0%) |
| 5 or more Children | 0 (0.0%) | 0 (0.0%) |
| Total | 0 (0.0%) | 0 (0.0%) |
Income Below Poverty Among Married-Couple vs Single-Parent Households in Orangetree
| Children | Married-Couple Families | Single-Parent Households |
| No Children | 0 (0.0%) | 0 (0.0%) |
| 1 or 2 Children | 0 (0.0%) | 0 (0.0%) |
| 3 or 4 Children | 0 (0.0%) | 0 (0.0%) |
| 5 or more Children | 0 (0.0%) | 0 (0.0%) |
| Total | 0 (0.0%) | 0 (0.0%) |
Race in Orangetree
The most populous races in Orangetree are White / Caucasian (3,340 | 67.8%), Hispanic or Latino (1,564 | 31.7%), and Two or more Races (768 | 15.6%).
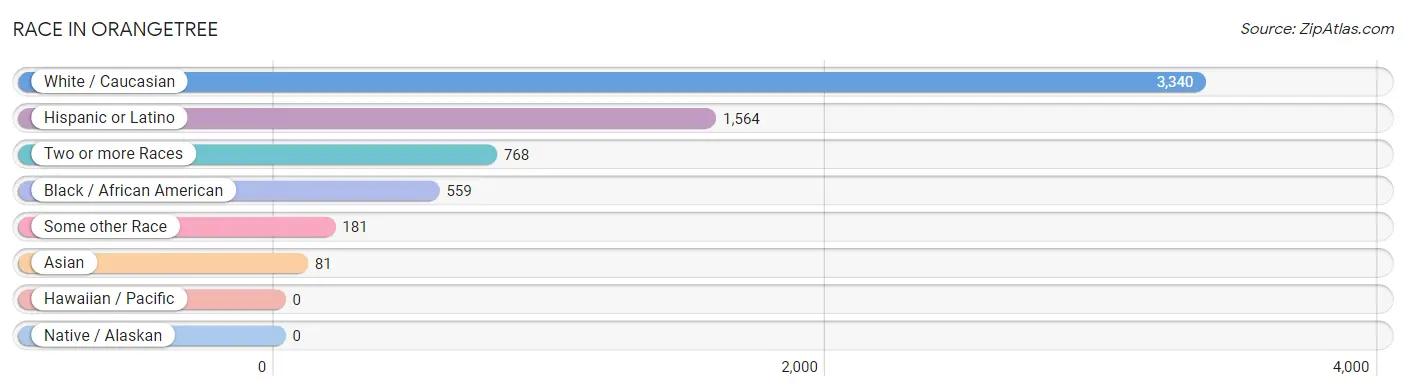
| Race | # Population | % Population |
| Asian | 81 | 1.6% |
| Black / African American | 559 | 11.3% |
| Hawaiian / Pacific | 0 | 0.0% |
| Hispanic or Latino | 1,564 | 31.7% |
| Native / Alaskan | 0 | 0.0% |
| White / Caucasian | 3,340 | 67.8% |
| Two or more Races | 768 | 15.6% |
| Some other Race | 181 | 3.7% |
| Total | 4,929 | 100.0% |
Ancestry in Orangetree
The most populous ancestries reported in Orangetree are Cuban (853 | 17.3%), Italian (567 | 11.5%), American (546 | 11.1%), German (538 | 10.9%), and Mexican (426 | 8.6%), together accounting for 59.4% of all Orangetree residents.
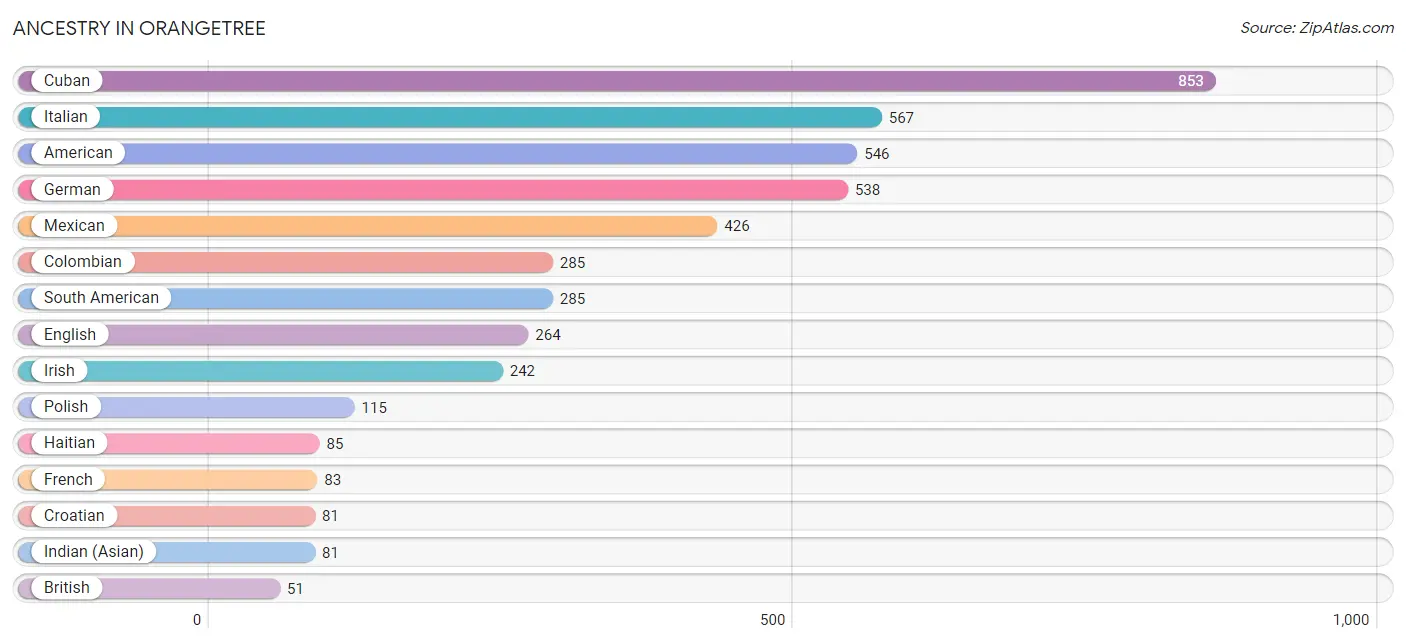
| Ancestry | # Population | % Population |
| American | 546 | 11.1% |
| Arab | 15 | 0.3% |
| British | 51 | 1.0% |
| Colombian | 285 | 5.8% |
| Croatian | 81 | 1.6% |
| Cuban | 853 | 17.3% |
| English | 264 | 5.4% |
| Finnish | 42 | 0.9% |
| French | 83 | 1.7% |
| German | 538 | 10.9% |
| Haitian | 85 | 1.7% |
| Hungarian | 18 | 0.4% |
| Indian (Asian) | 81 | 1.6% |
| Irish | 242 | 4.9% |
| Italian | 567 | 11.5% |
| Mexican | 426 | 8.6% |
| Norwegian | 14 | 0.3% |
| Polish | 115 | 2.3% |
| Scandinavian | 15 | 0.3% |
| South American | 285 | 5.8% |
| Swedish | 20 | 0.4% |
| Swiss | 30 | 0.6% | View All 22 Rows |
Immigrants in Orangetree
The most numerous immigrant groups reported in Orangetree came from Latin America (917 | 18.6%), Caribbean (707 | 14.3%), Cuba (453 | 9.2%), Haiti (254 | 5.1%), and Europe (233 | 4.7%), together accounting for 52.0% of all Orangetree residents.
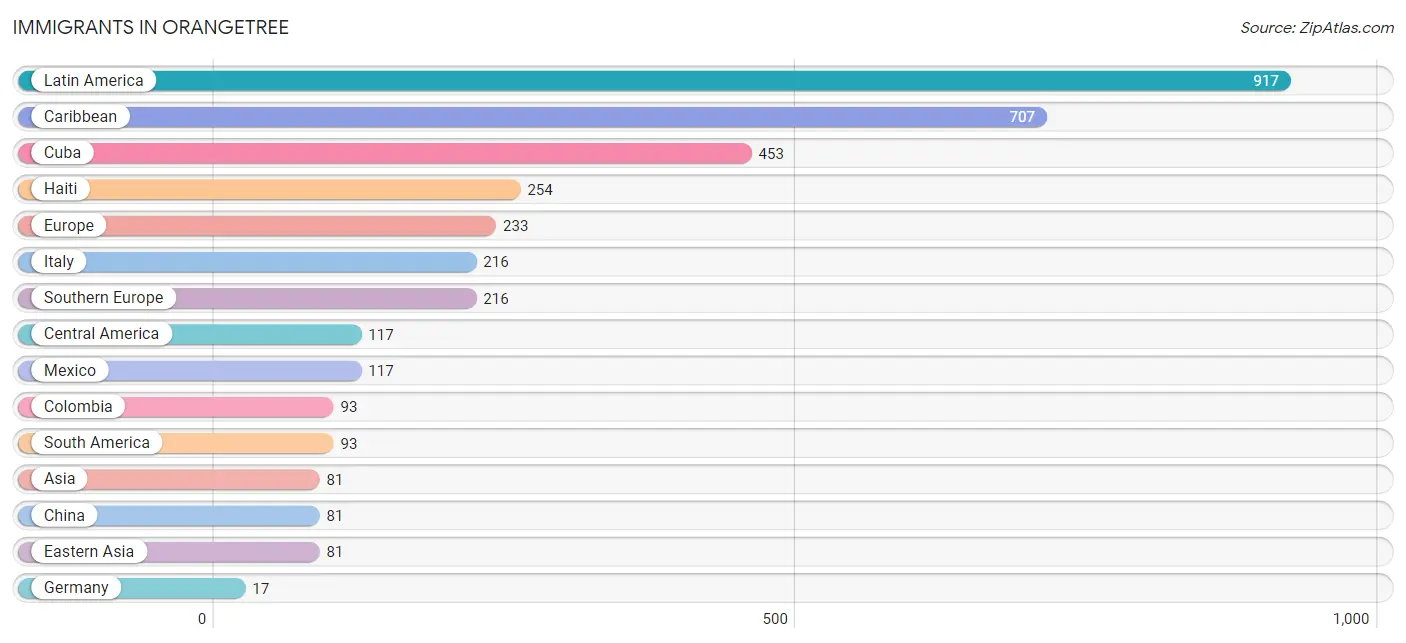
| Immigration Origin | # Population | % Population |
| Asia | 81 | 1.6% |
| Canada | 12 | 0.2% |
| Caribbean | 707 | 14.3% |
| Central America | 117 | 2.4% |
| China | 81 | 1.6% |
| Colombia | 93 | 1.9% |
| Cuba | 453 | 9.2% |
| Eastern Asia | 81 | 1.6% |
| Europe | 233 | 4.7% |
| Germany | 17 | 0.3% |
| Haiti | 254 | 5.1% |
| Italy | 216 | 4.4% |
| Latin America | 917 | 18.6% |
| Mexico | 117 | 2.4% |
| South America | 93 | 1.9% |
| Southern Europe | 216 | 4.4% |
| Western Europe | 17 | 0.3% | View All 17 Rows |
Sex and Age in Orangetree
Sex and Age in Orangetree
The most populous age groups in Orangetree are 5 to 9 Years (275 | 11.8%) for men and 50 to 54 Years (310 | 12.0%) for women.
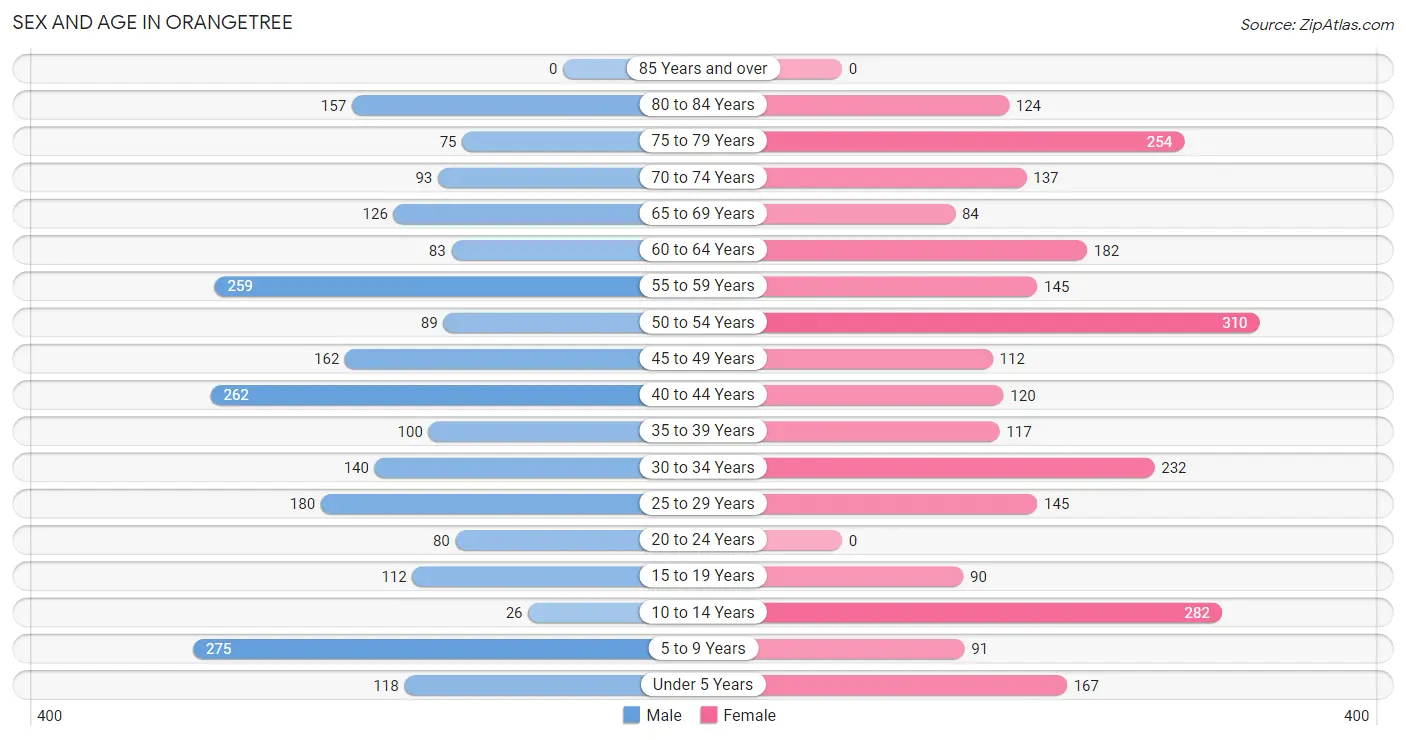
| Age Bracket | Male | Female |
| Under 5 Years | 118 (5.1%) | 167 (6.4%) |
| 5 to 9 Years | 275 (11.8%) | 91 (3.5%) |
| 10 to 14 Years | 26 (1.1%) | 282 (10.9%) |
| 15 to 19 Years | 112 (4.8%) | 90 (3.5%) |
| 20 to 24 Years | 80 (3.4%) | 0 (0.0%) |
| 25 to 29 Years | 180 (7.7%) | 145 (5.6%) |
| 30 to 34 Years | 140 (6.0%) | 232 (8.9%) |
| 35 to 39 Years | 100 (4.3%) | 117 (4.5%) |
| 40 to 44 Years | 262 (11.2%) | 120 (4.6%) |
| 45 to 49 Years | 162 (6.9%) | 112 (4.3%) |
| 50 to 54 Years | 89 (3.8%) | 310 (12.0%) |
| 55 to 59 Years | 259 (11.1%) | 145 (5.6%) |
| 60 to 64 Years | 83 (3.5%) | 182 (7.0%) |
| 65 to 69 Years | 126 (5.4%) | 84 (3.2%) |
| 70 to 74 Years | 93 (4.0%) | 137 (5.3%) |
| 75 to 79 Years | 75 (3.2%) | 254 (9.8%) |
| 80 to 84 Years | 157 (6.7%) | 124 (4.8%) |
| 85 Years and over | 0 (0.0%) | 0 (0.0%) |
| Total | 2,337 (100.0%) | 2,592 (100.0%) |
Families and Households in Orangetree
Median Family Size in Orangetree
The median family size in Orangetree is 3.24 persons per family, with single male/father families (36 | 2.6%) accounting for the largest median family size of 4.33 persons per family. On the other hand, married-couple families (1,236 | 89.6%) represent the smallest median family size with 3.20 persons per family.
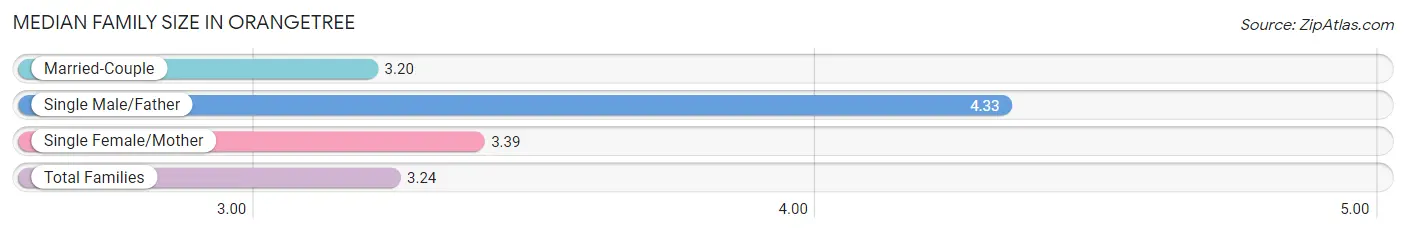
| Family Type | # Families | Family Size |
| Married-Couple | 1,236 (89.6%) | 3.20 |
| Single Male/Father | 36 (2.6%) | 4.33 |
| Single Female/Mother | 108 (7.8%) | 3.39 |
| Total Families | 1,380 (100.0%) | 3.24 |
Median Household Size in Orangetree
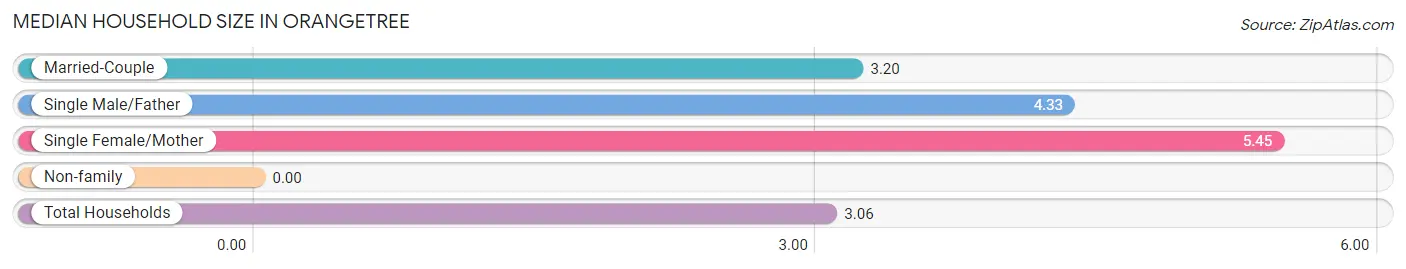
| Household Type | # Households | Household Size |
| Married-Couple | 1,236 (76.7%) | 3.20 |
| Single Male/Father | 36 (2.2%) | 4.33 |
| Single Female/Mother | 108 (6.7%) | 5.45 |
| Non-family | 231 (14.3%) | - |
| Total Households | 1,611 (100.0%) | 3.06 |
Household Size by Marriage Status in Orangetree
Out of a total of 1,611 households in Orangetree, 1,380 (85.7%) are family households, while 231 (14.3%) are nonfamily households. The most numerous type of family households are 2-person households, comprising 448, and the most common type of nonfamily households are 1-person households, comprising 231.
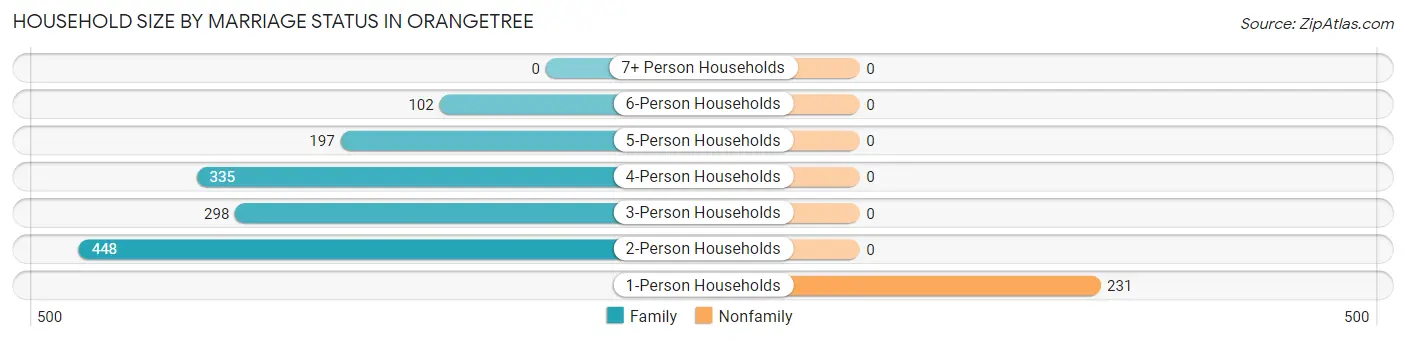
| Household Size | Family Households | Nonfamily Households |
| 1-Person Households | - | 231 (14.3%) |
| 2-Person Households | 448 (27.8%) | 0 (0.0%) |
| 3-Person Households | 298 (18.5%) | 0 (0.0%) |
| 4-Person Households | 335 (20.8%) | 0 (0.0%) |
| 5-Person Households | 197 (12.2%) | 0 (0.0%) |
| 6-Person Households | 102 (6.3%) | 0 (0.0%) |
| 7+ Person Households | 0 (0.0%) | 0 (0.0%) |
| Total | 1,380 (85.7%) | 231 (14.3%) |
Female Fertility in Orangetree
Fertility by Age in Orangetree
Average fertility rate in Orangetree is 133.0 births per 1,000 women. Women in the age bracket of 35 to 50 years have the highest fertility rate with 162.0 births per 1,000 women. Women in the age bracket of 35 to 50 years acount for 58.3% of all women with births.
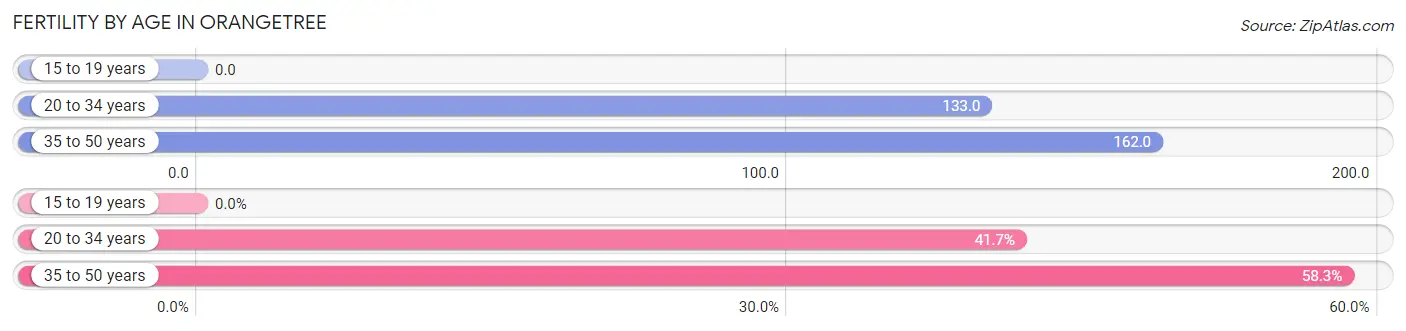
| Age Bracket | Women with Births | Births / 1,000 Women |
| 15 to 19 years | 0 (0.0%) | 0.0 |
| 20 to 34 years | 50 (41.7%) | 133.0 |
| 35 to 50 years | 70 (58.3%) | 162.0 |
| Total | 120 (100.0%) | 133.0 |
Fertility by Age by Marriage Status in Orangetree
62.5% of women with births (120) in Orangetree are married. The highest percentage of unmarried women with births falls into 35 to 50 years age bracket with 64.3% of them unmarried at the time of birth, while the lowest percentage of unmarried women with births belong to 20 to 34 years age bracket with 0.0% of them unmarried.
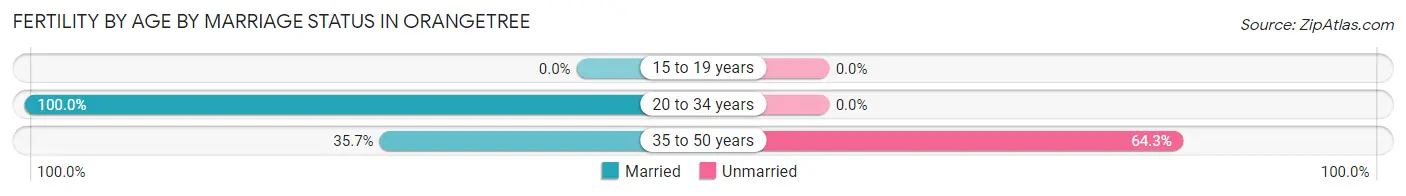
| Age Bracket | Married | Unmarried |
| 15 to 19 years | 0 (0.0%) | 0 (0.0%) |
| 20 to 34 years | 50 (100.0%) | 0 (0.0%) |
| 35 to 50 years | 25 (35.7%) | 45 (64.3%) |
| Total | 75 (62.5%) | 45 (37.5%) |
Fertility by Education in Orangetree
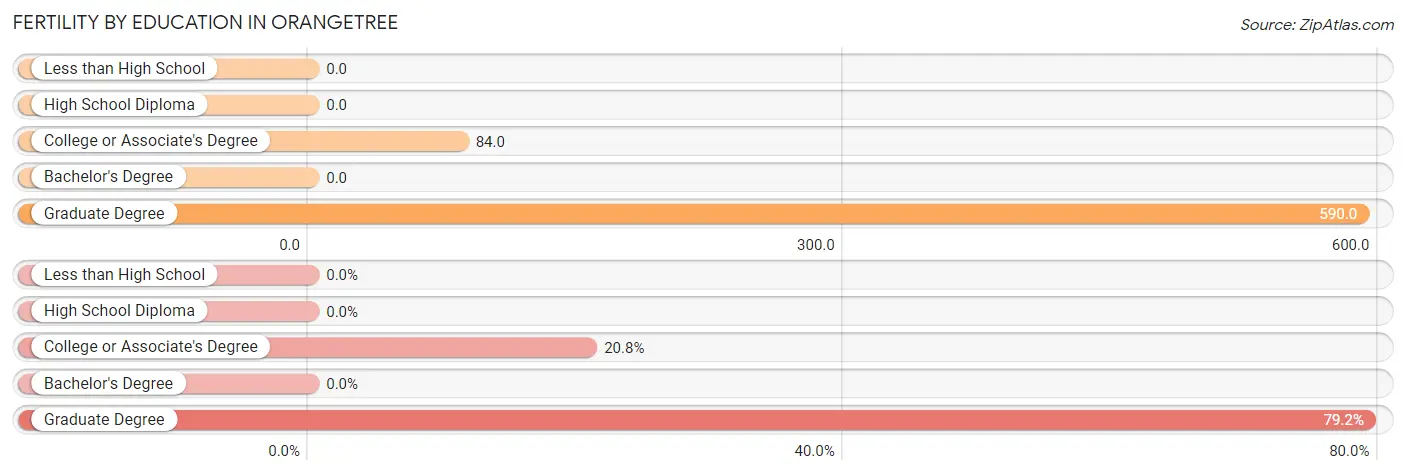
| Educational Attainment | Women with Births | Births / 1,000 Women |
| Less than High School | 0 (0.0%) | 0.0 |
| High School Diploma | 0 (0.0%) | 0.0 |
| College or Associate's Degree | 25 (20.8%) | 84.0 |
| Bachelor's Degree | 0 (0.0%) | 0.0 |
| Graduate Degree | 95 (79.2%) | 590.0 |
| Total | 120 (100.0%) | 133.0 |
Fertility by Education by Marriage Status in Orangetree
37.5% of women with births in Orangetree are unmarried. Women with the educational attainment of college or associate's degree are most likely to be married with 100.0% of them married at childbirth, while women with the educational attainment of graduate degree are least likely to be married with 47.4% of them unmarried at childbirth.
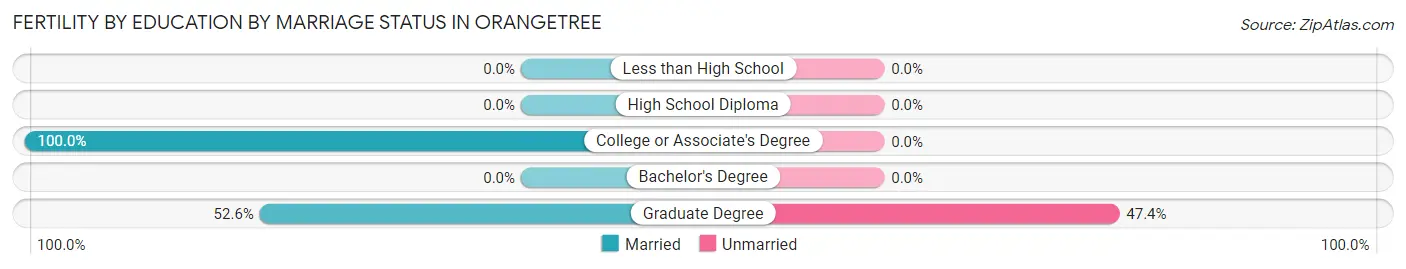
| Educational Attainment | Married | Unmarried |
| Less than High School | 0 (0.0%) | 0 (0.0%) |
| High School Diploma | 0 (0.0%) | 0 (0.0%) |
| College or Associate's Degree | 25 (100.0%) | 0 (0.0%) |
| Bachelor's Degree | 0 (0.0%) | 0 (0.0%) |
| Graduate Degree | 50 (52.6%) | 45 (47.4%) |
| Total | 75 (62.5%) | 45 (37.5%) |
Employment Characteristics in Orangetree
Employment by Class of Employer in Orangetree
Among the 2,354 employed individuals in Orangetree, private company employees (1,933 | 82.1%), local government employees (160 | 6.8%), and self-employed (incorporated) (87 | 3.7%) make up the most common classes of employment.
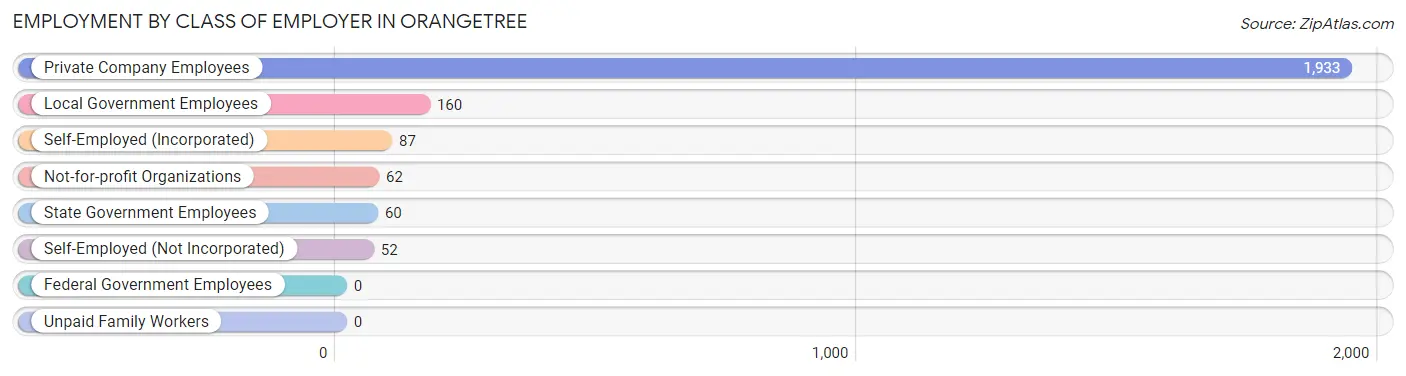
| Employer Class | # Employees | % Employees |
| Private Company Employees | 1,933 | 82.1% |
| Self-Employed (Incorporated) | 87 | 3.7% |
| Self-Employed (Not Incorporated) | 52 | 2.2% |
| Not-for-profit Organizations | 62 | 2.6% |
| Local Government Employees | 160 | 6.8% |
| State Government Employees | 60 | 2.5% |
| Federal Government Employees | 0 | 0.0% |
| Unpaid Family Workers | 0 | 0.0% |
| Total | 2,354 | 100.0% |
Employment Status by Age in Orangetree
According to the labor force statistics for Orangetree, out of the total population over 16 years of age (3,921), 62.0% or 2,431 individuals are in the labor force, with 3.2% or 78 of them unemployed. The age group with the highest labor force participation rate is 55 to 59 years, with 100.0% or 404 individuals in the labor force. Within the labor force, the 55 to 59 years age range has the highest percentage of unemployed individuals, with 19.3% or 78 of them being unemployed.
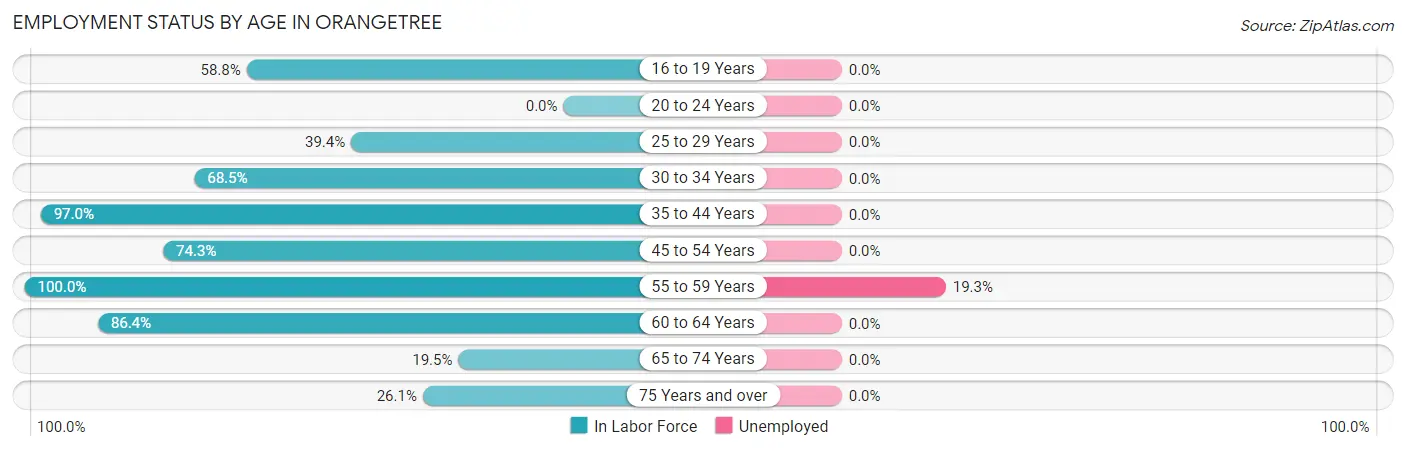
| Age Bracket | In Labor Force | Unemployed |
| 16 to 19 Years | 90 (58.8%) | 0 (0.0%) |
| 20 to 24 Years | 0 (0.0%) | 0 (0.0%) |
| 25 to 29 Years | 128 (39.4%) | 0 (0.0%) |
| 30 to 34 Years | 255 (68.5%) | 0 (0.0%) |
| 35 to 44 Years | 581 (97.0%) | 0 (0.0%) |
| 45 to 54 Years | 500 (74.3%) | 0 (0.0%) |
| 55 to 59 Years | 404 (100.0%) | 78 (19.3%) |
| 60 to 64 Years | 229 (86.4%) | 0 (0.0%) |
| 65 to 74 Years | 86 (19.5%) | 0 (0.0%) |
| 75 Years and over | 159 (26.1%) | 0 (0.0%) |
| Total | 2,431 (62.0%) | 78 (3.2%) |
Employment Status by Educational Attainment in Orangetree
According to labor force statistics for Orangetree, 79.5% of individuals (2,097) out of the total population between 25 and 64 years of age (2,638) are in the labor force, with 3.7% or 78 of them being unemployed. The group with the highest labor force participation rate are those with the educational attainment of bachelor's degree or higher, with 100.0% or 749 individuals in the labor force. Within the labor force, individuals with college / associate degree education have the highest percentage of unemployment, with 8.6% or 78 of them being unemployed.
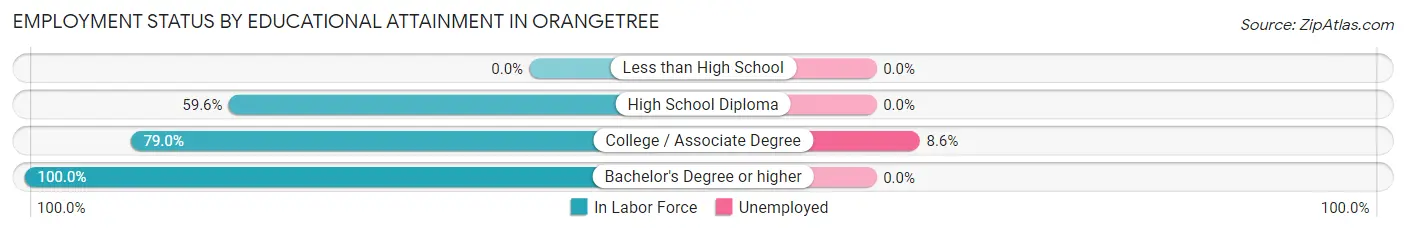
| Educational Attainment | In Labor Force | Unemployed |
| Less than High School | 0 (0.0%) | 0 (0.0%) |
| High School Diploma | 442 (59.6%) | 0 (0.0%) |
| College / Associate Degree | 906 (79.0%) | 99 (8.6%) |
| Bachelor's Degree or higher | 749 (100.0%) | 0 (0.0%) |
| Total | 2,097 (79.5%) | 98 (3.7%) |
Employment Occupations by Sex in Orangetree
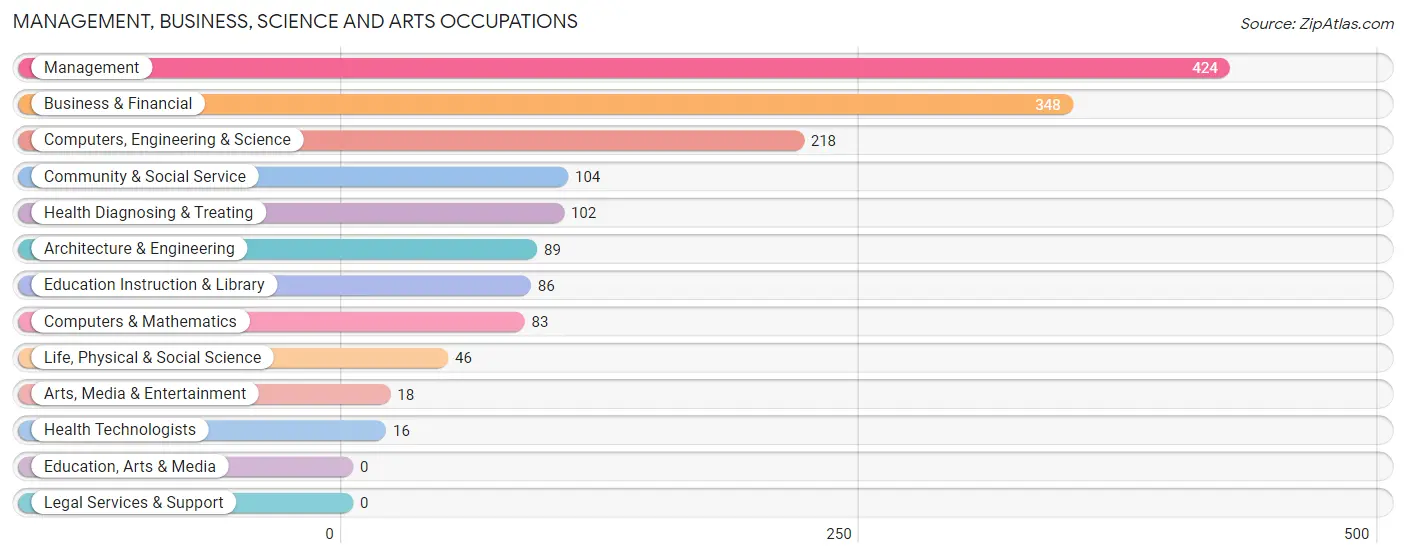
Management, Business, Science and Arts Occupations
The most common Management, Business, Science and Arts occupations in Orangetree are Management (424 | 18.0%), Business & Financial (348 | 14.8%), Computers, Engineering & Science (218 | 9.3%), Community & Social Service (104 | 4.4%), and Health Diagnosing & Treating (102 | 4.3%).
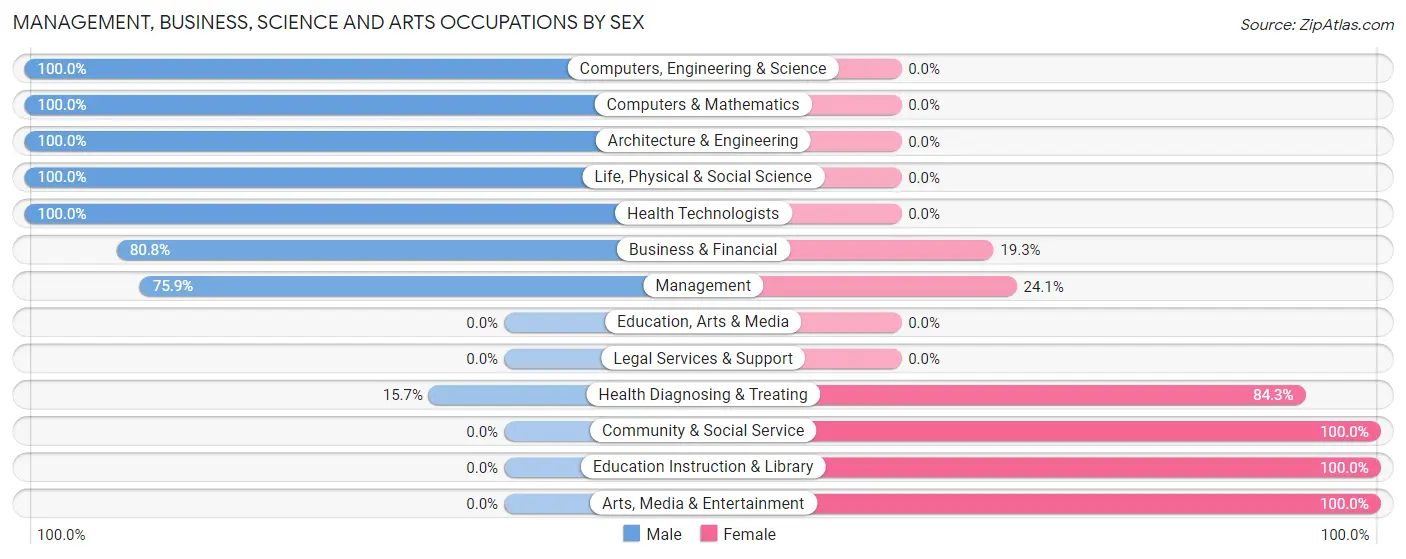
Management, Business, Science and Arts Occupations by Sex
Within the Management, Business, Science and Arts occupations in Orangetree, the most male-oriented occupations are Computers, Engineering & Science (100.0%), Computers & Mathematics (100.0%), and Architecture & Engineering (100.0%), while the most female-oriented occupations are Community & Social Service (100.0%), Education Instruction & Library (100.0%), and Arts, Media & Entertainment (100.0%).
| Occupation | Male | Female |
| Management | 322 (75.9%) | 102 (24.1%) |
| Business & Financial | 281 (80.7%) | 67 (19.3%) |
| Computers, Engineering & Science | 218 (100.0%) | 0 (0.0%) |
| Computers & Mathematics | 83 (100.0%) | 0 (0.0%) |
| Architecture & Engineering | 89 (100.0%) | 0 (0.0%) |
| Life, Physical & Social Science | 46 (100.0%) | 0 (0.0%) |
| Community & Social Service | 0 (0.0%) | 104 (100.0%) |
| Education, Arts & Media | 0 (0.0%) | 0 (0.0%) |
| Legal Services & Support | 0 (0.0%) | 0 (0.0%) |
| Education Instruction & Library | 0 (0.0%) | 86 (100.0%) |
| Arts, Media & Entertainment | 0 (0.0%) | 18 (100.0%) |
| Health Diagnosing & Treating | 16 (15.7%) | 86 (84.3%) |
| Health Technologists | 16 (100.0%) | 0 (0.0%) |
| Total (Category) | 837 (70.0%) | 359 (30.0%) |
| Total (Overall) | 1,251 (53.1%) | 1,103 (46.9%) |
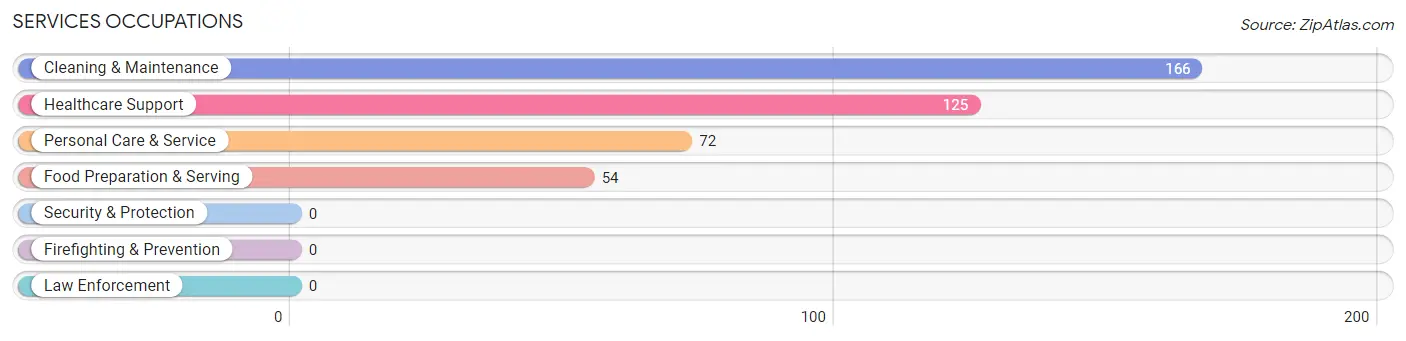
Services Occupations
The most common Services occupations in Orangetree are Cleaning & Maintenance (166 | 7.0%), Healthcare Support (125 | 5.3%), Personal Care & Service (72 | 3.1%), and Food Preparation & Serving (54 | 2.3%).
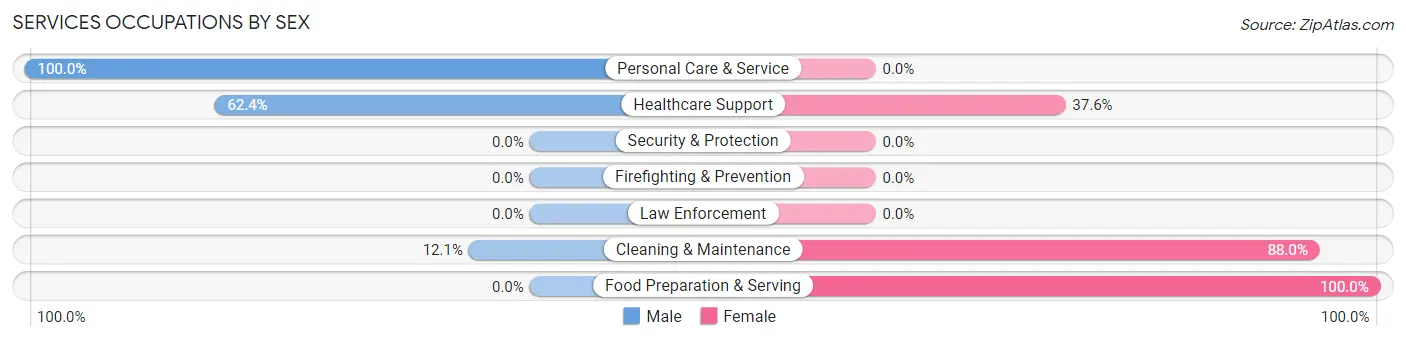
Services Occupations by Sex
Within the Services occupations in Orangetree, the most male-oriented occupations are Personal Care & Service (100.0%), Healthcare Support (62.4%), and Cleaning & Maintenance (12.0%), while the most female-oriented occupations are Food Preparation & Serving (100.0%), Cleaning & Maintenance (87.9%), and Healthcare Support (37.6%).
| Occupation | Male | Female |
| Healthcare Support | 78 (62.4%) | 47 (37.6%) |
| Security & Protection | 0 (0.0%) | 0 (0.0%) |
| Firefighting & Prevention | 0 (0.0%) | 0 (0.0%) |
| Law Enforcement | 0 (0.0%) | 0 (0.0%) |
| Food Preparation & Serving | 0 (0.0%) | 54 (100.0%) |
| Cleaning & Maintenance | 20 (12.0%) | 146 (87.9%) |
| Personal Care & Service | 72 (100.0%) | 0 (0.0%) |
| Total (Category) | 170 (40.8%) | 247 (59.2%) |
| Total (Overall) | 1,251 (53.1%) | 1,103 (46.9%) |
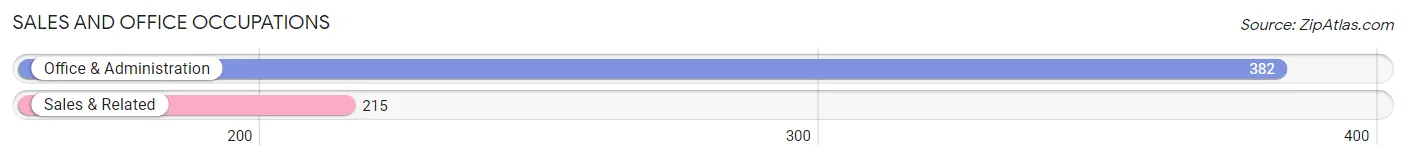
Sales and Office Occupations
The most common Sales and Office occupations in Orangetree are Office & Administration (382 | 16.2%), and Sales & Related (215 | 9.1%).
Sales and Office Occupations by Sex
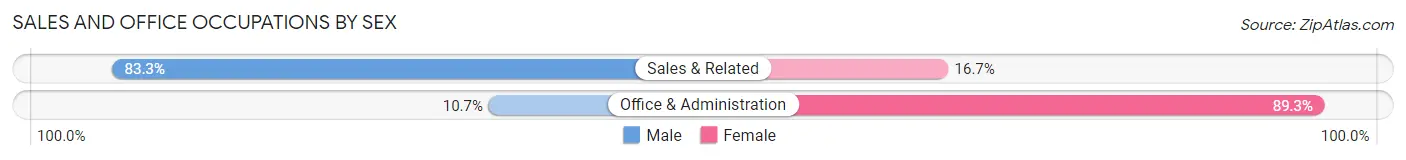
| Occupation | Male | Female |
| Sales & Related | 179 (83.3%) | 36 (16.7%) |
| Office & Administration | 41 (10.7%) | 341 (89.3%) |
| Total (Category) | 220 (36.8%) | 377 (63.1%) |
| Total (Overall) | 1,251 (53.1%) | 1,103 (46.9%) |
Natural Resources, Construction and Maintenance Occupations
Natural Resources, Construction and Maintenance Occupations by Sex
| Occupation | Male | Female |
| Farming, Fishing & Forestry | 0 (0.0%) | 0 (0.0%) |
| Construction & Extraction | 0 (0.0%) | 0 (0.0%) |
| Installation, Maintenance & Repair | 0 (0.0%) | 0 (0.0%) |
| Total (Category) | 0 (0.0%) | 0 (0.0%) |
| Total (Overall) | 1,251 (53.1%) | 1,103 (46.9%) |
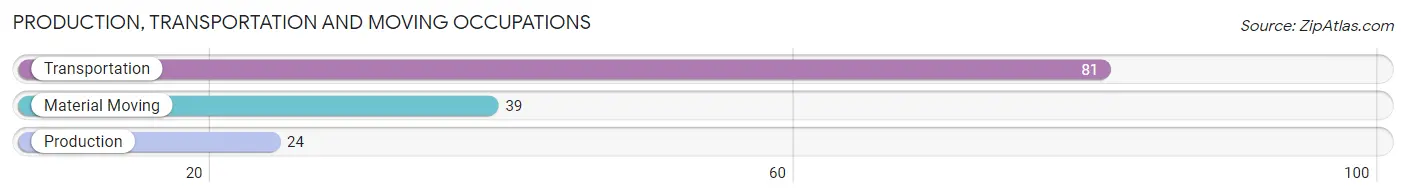
Production, Transportation and Moving Occupations
The most common Production, Transportation and Moving occupations in Orangetree are Transportation (81 | 3.4%), Material Moving (39 | 1.7%), and Production (24 | 1.0%).
Production, Transportation and Moving Occupations by Sex
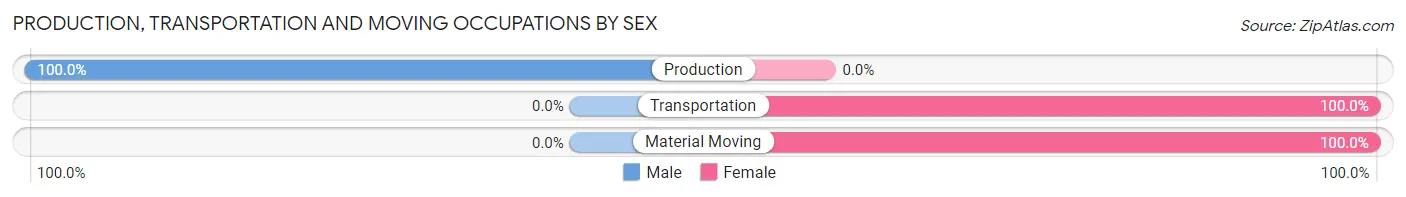
| Occupation | Male | Female |
| Production | 24 (100.0%) | 0 (0.0%) |
| Transportation | 0 (0.0%) | 81 (100.0%) |
| Material Moving | 0 (0.0%) | 39 (100.0%) |
| Total (Category) | 24 (16.7%) | 120 (83.3%) |
| Total (Overall) | 1,251 (53.1%) | 1,103 (46.9%) |
Employment Industries by Sex in Orangetree
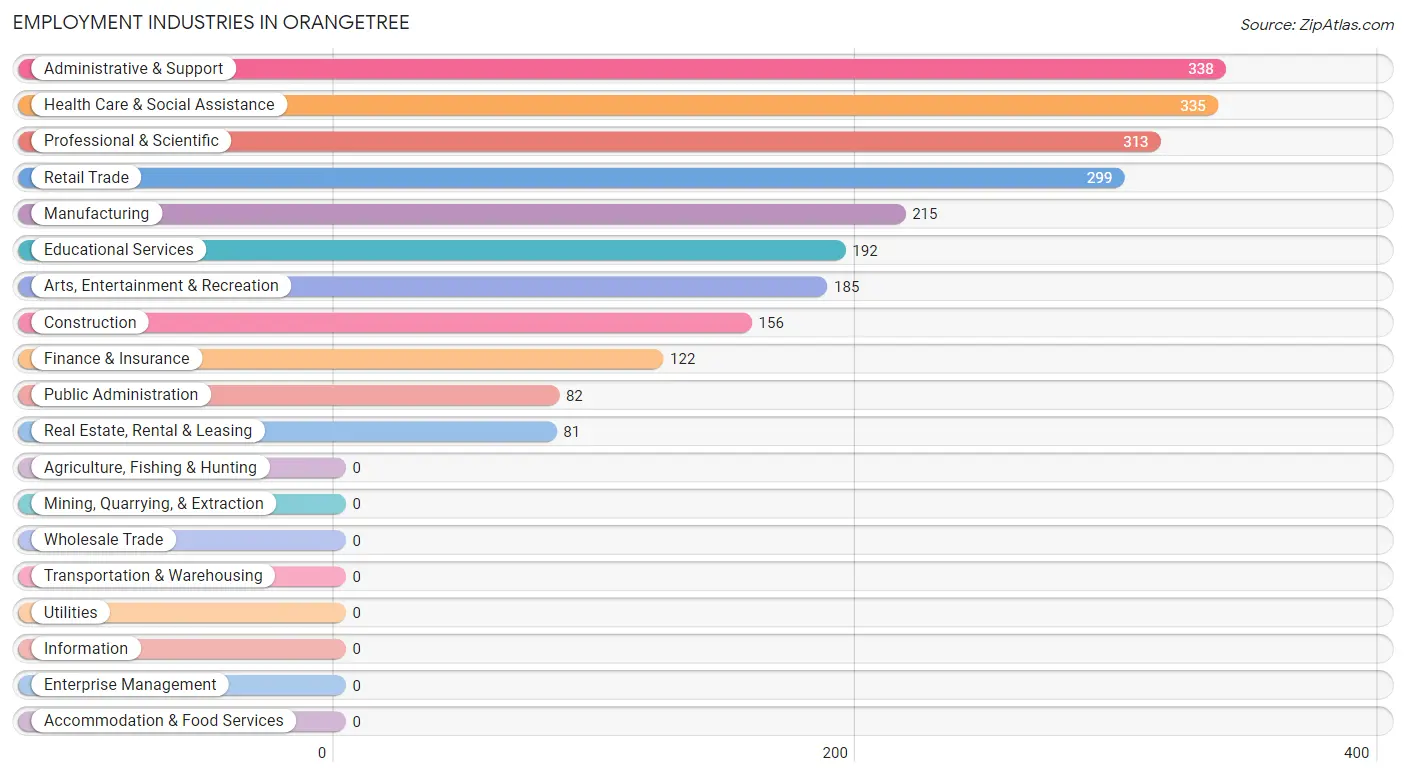
Employment Industries in Orangetree
The major employment industries in Orangetree include Administrative & Support (338 | 14.4%), Health Care & Social Assistance (335 | 14.2%), Professional & Scientific (313 | 13.3%), Retail Trade (299 | 12.7%), and Manufacturing (215 | 9.1%).
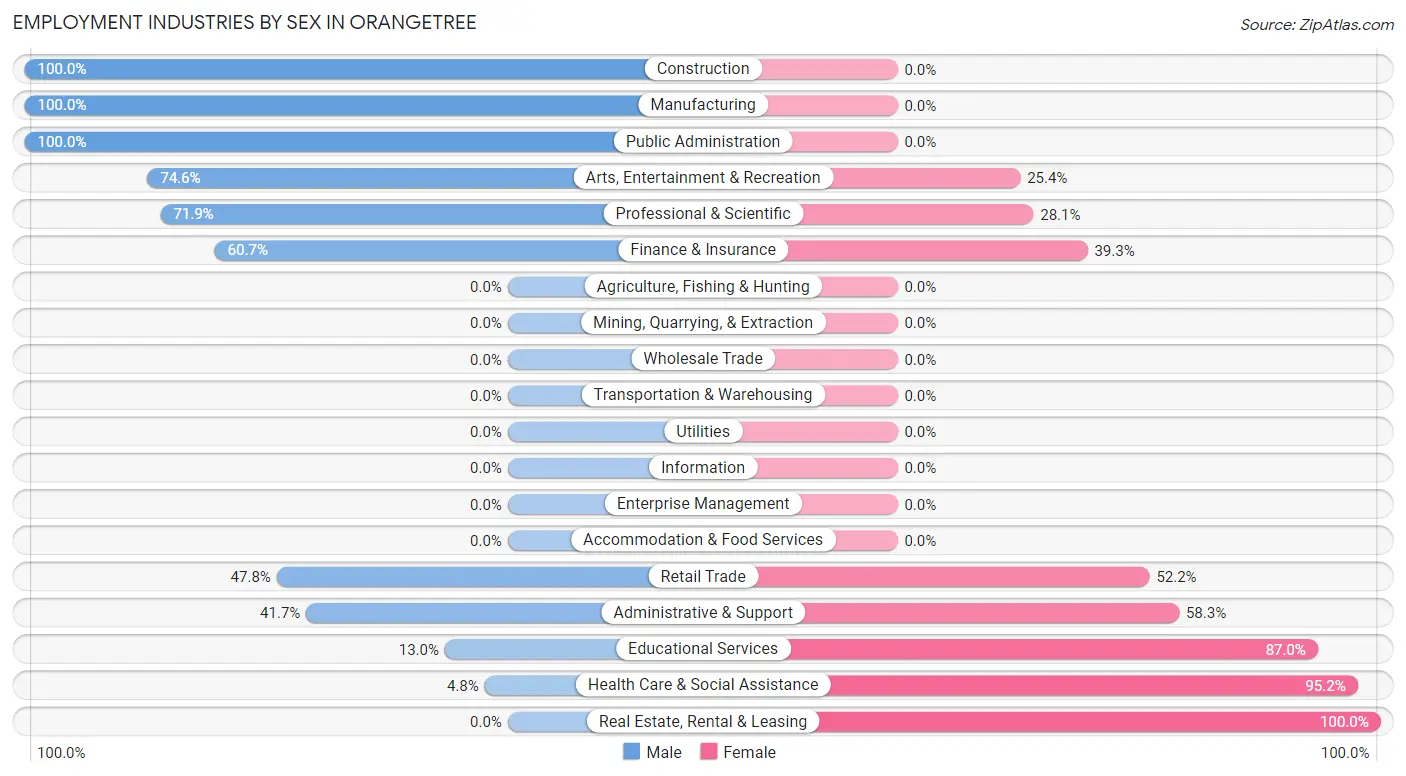
Employment Industries by Sex in Orangetree
The Orangetree industries that see more men than women are Construction (100.0%), Manufacturing (100.0%), and Public Administration (100.0%), whereas the industries that tend to have a higher number of women are Real Estate, Rental & Leasing (100.0%), Health Care & Social Assistance (95.2%), and Educational Services (87.0%).
| Industry | Male | Female |
| Agriculture, Fishing & Hunting | 0 (0.0%) | 0 (0.0%) |
| Mining, Quarrying, & Extraction | 0 (0.0%) | 0 (0.0%) |
| Construction | 156 (100.0%) | 0 (0.0%) |
| Manufacturing | 215 (100.0%) | 0 (0.0%) |
| Wholesale Trade | 0 (0.0%) | 0 (0.0%) |
| Retail Trade | 143 (47.8%) | 156 (52.2%) |
| Transportation & Warehousing | 0 (0.0%) | 0 (0.0%) |
| Utilities | 0 (0.0%) | 0 (0.0%) |
| Information | 0 (0.0%) | 0 (0.0%) |
| Finance & Insurance | 74 (60.7%) | 48 (39.3%) |
| Real Estate, Rental & Leasing | 0 (0.0%) | 81 (100.0%) |
| Professional & Scientific | 225 (71.9%) | 88 (28.1%) |
| Enterprise Management | 0 (0.0%) | 0 (0.0%) |
| Administrative & Support | 141 (41.7%) | 197 (58.3%) |
| Educational Services | 25 (13.0%) | 167 (87.0%) |
| Health Care & Social Assistance | 16 (4.8%) | 319 (95.2%) |
| Arts, Entertainment & Recreation | 138 (74.6%) | 47 (25.4%) |
| Accommodation & Food Services | 0 (0.0%) | 0 (0.0%) |
| Public Administration | 82 (100.0%) | 0 (0.0%) |
| Total | 1,251 (53.1%) | 1,103 (46.9%) |
Education in Orangetree
School Enrollment in Orangetree
The most common levels of schooling among the 906 students in Orangetree are middle school (308 | 34.0%), elementary school (216 | 23.8%), and high school (166 | 18.3%).
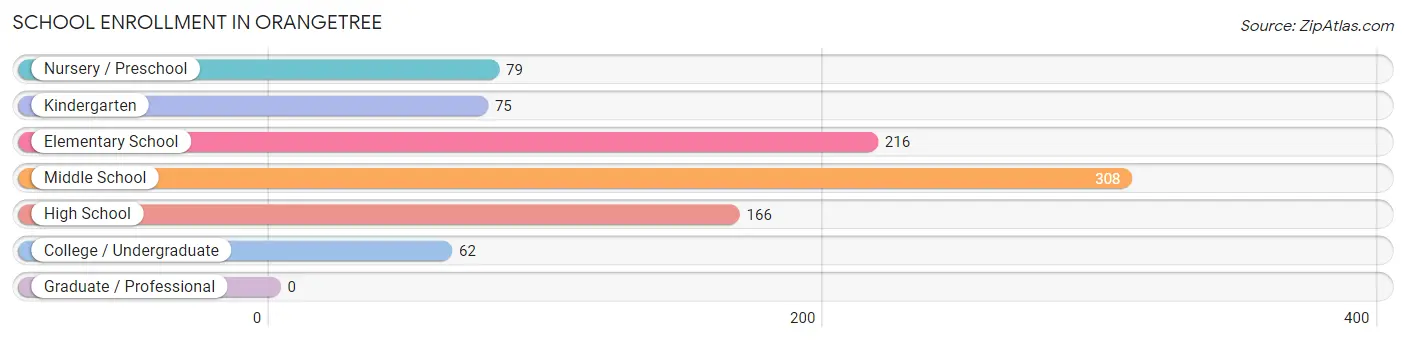
| School Level | # Students | % Students |
| Nursery / Preschool | 79 | 8.7% |
| Kindergarten | 75 | 8.3% |
| Elementary School | 216 | 23.8% |
| Middle School | 308 | 34.0% |
| High School | 166 | 18.3% |
| College / Undergraduate | 62 | 6.8% |
| Graduate / Professional | 0 | 0.0% |
| Total | 906 | 100.0% |
School Enrollment by Age by Funding Source in Orangetree
Out of a total of 906 students who are enrolled in schools in Orangetree, 31 (3.4%) attend a private institution, while the remaining 875 (96.6%) are enrolled in public schools. The age group of 5 to 9 year old has the highest likelihood of being enrolled in private schools, with 31 (9.6% in the age bracket) enrolled. Conversely, the age group of 3 to 4 year olds has the lowest likelihood of being enrolled in a private school, with 48 (100.0% in the age bracket) attending a public institution.
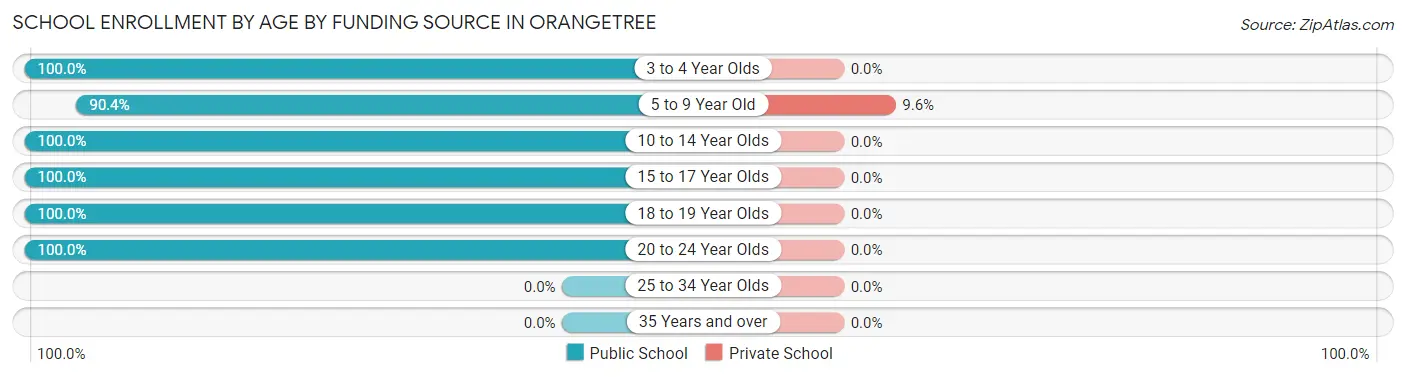
| Age Bracket | Public School | Private School |
| 3 to 4 Year Olds | 48 (100.0%) | 0 (0.0%) |
| 5 to 9 Year Old | 291 (90.4%) | 31 (9.6%) |
| 10 to 14 Year Olds | 308 (100.0%) | 0 (0.0%) |
| 15 to 17 Year Olds | 112 (100.0%) | 0 (0.0%) |
| 18 to 19 Year Olds | 90 (100.0%) | 0 (0.0%) |
| 20 to 24 Year Olds | 26 (100.0%) | 0 (0.0%) |
| 25 to 34 Year Olds | 0 (0.0%) | 0 (0.0%) |
| 35 Years and over | 0 (0.0%) | 0 (0.0%) |
| Total | 875 (96.6%) | 31 (3.4%) |
Educational Attainment by Field of Study in Orangetree
Business (253 | 24.0%), engineering (230 | 21.8%), education (162 | 15.4%), social sciences (139 | 13.2%), and computers & mathematics (99 | 9.4%) are the most common fields of study among 1,053 individuals in Orangetree who have obtained a bachelor's degree or higher.
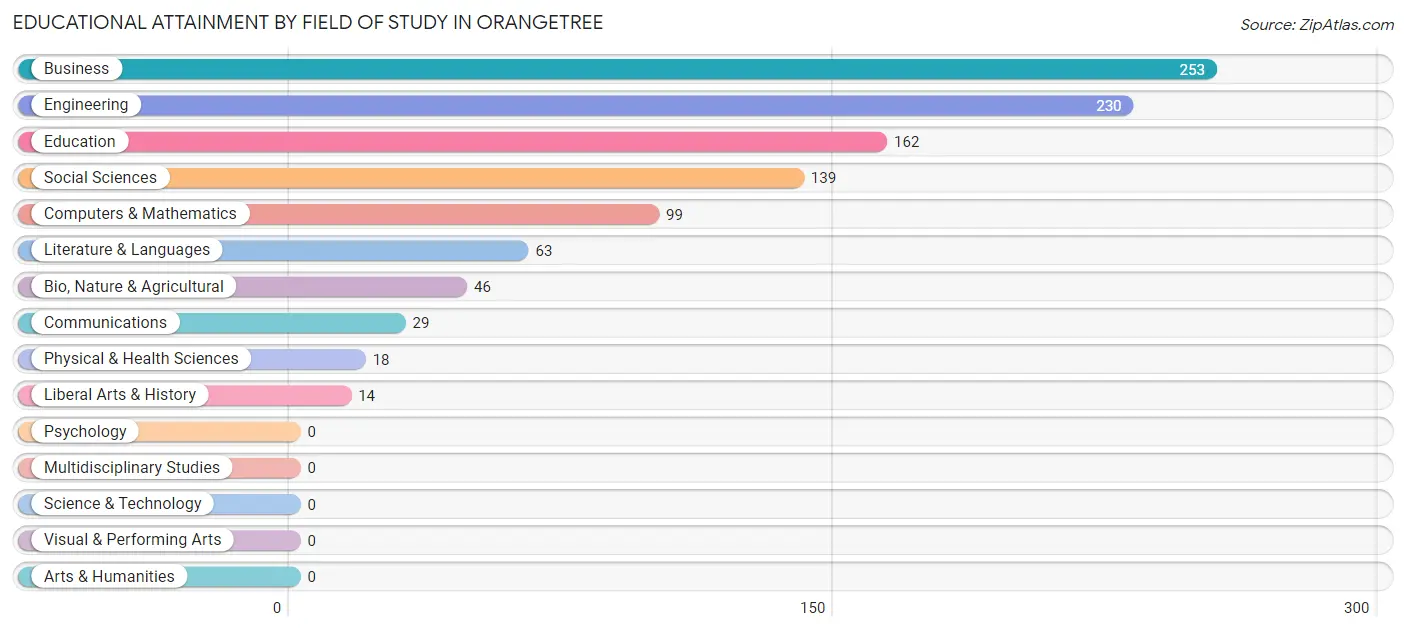
| Field of Study | # Graduates | % Graduates |
| Computers & Mathematics | 99 | 9.4% |
| Bio, Nature & Agricultural | 46 | 4.4% |
| Physical & Health Sciences | 18 | 1.7% |
| Psychology | 0 | 0.0% |
| Social Sciences | 139 | 13.2% |
| Engineering | 230 | 21.8% |
| Multidisciplinary Studies | 0 | 0.0% |
| Science & Technology | 0 | 0.0% |
| Business | 253 | 24.0% |
| Education | 162 | 15.4% |
| Literature & Languages | 63 | 6.0% |
| Liberal Arts & History | 14 | 1.3% |
| Visual & Performing Arts | 0 | 0.0% |
| Communications | 29 | 2.8% |
| Arts & Humanities | 0 | 0.0% |
| Total | 1,053 | 100.0% |
Transportation & Commute in Orangetree
Vehicle Availability by Sex in Orangetree
The most prevalent vehicle ownership categories in Orangetree are males with 2 vehicles (752, accounting for 60.1%) and females with 2 vehicles (500, making up 68.2%).
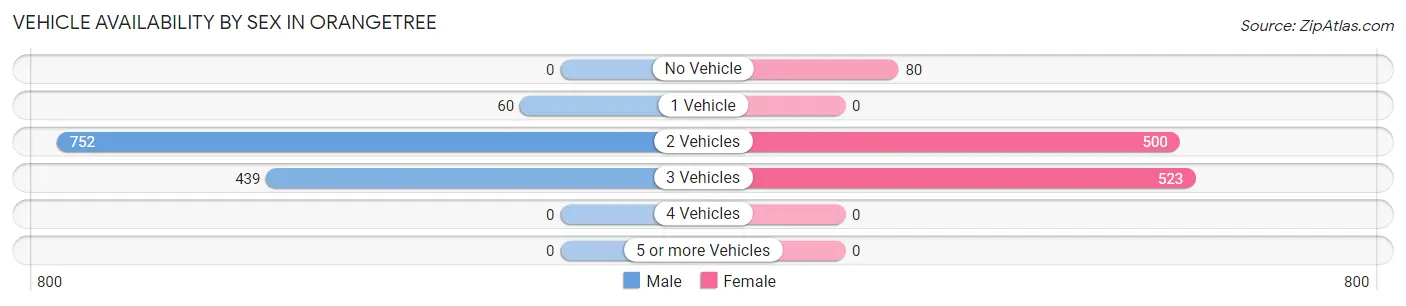
| Vehicles Available | Male | Female |
| No Vehicle | 0 (0.0%) | 80 (7.2%) |
| 1 Vehicle | 60 (4.8%) | 0 (0.0%) |
| 2 Vehicles | 752 (60.1%) | 500 (45.3%) |
| 3 Vehicles | 439 (35.1%) | 523 (47.4%) |
| 4 Vehicles | 0 (0.0%) | 0 (0.0%) |
| 5 or more Vehicles | 0 (0.0%) | 0 (0.0%) |
| Total | 1,251 (100.0%) | 1,103 (100.0%) |
Commute Time in Orangetree
The most frequently occuring commute durations in Orangetree are 45 to 59 minutes (485 commuters, 23.6%), 20 to 24 minutes (344 commuters, 16.7%), and 30 to 34 minutes (304 commuters, 14.8%).
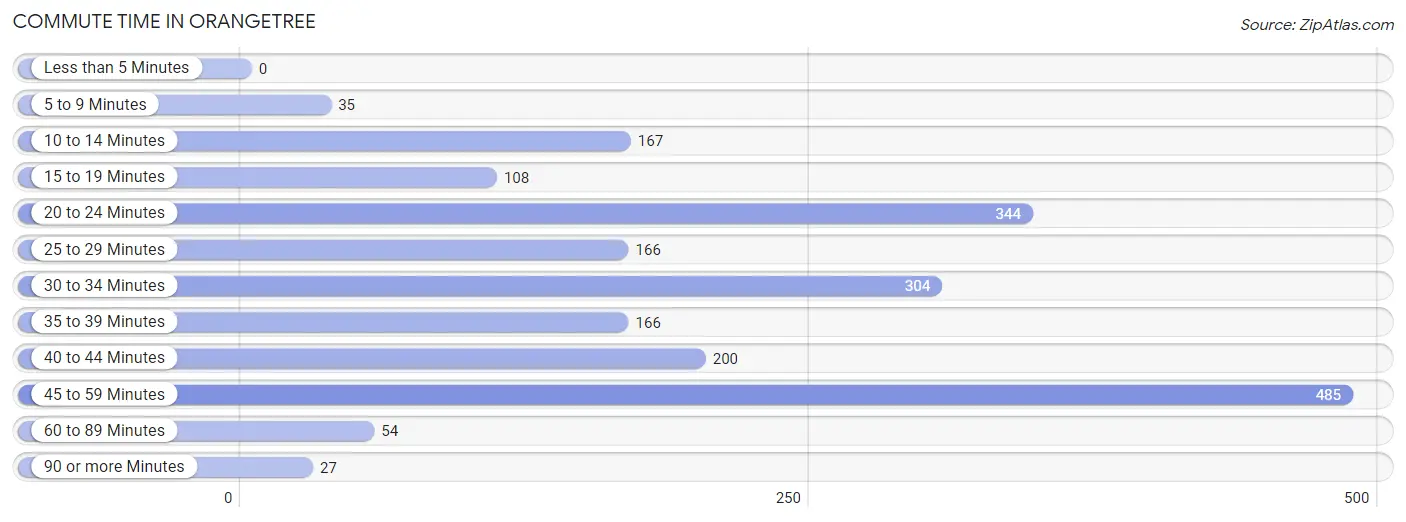
| Commute Time | # Commuters | % Commuters |
| Less than 5 Minutes | 0 | 0.0% |
| 5 to 9 Minutes | 35 | 1.7% |
| 10 to 14 Minutes | 167 | 8.1% |
| 15 to 19 Minutes | 108 | 5.2% |
| 20 to 24 Minutes | 344 | 16.7% |
| 25 to 29 Minutes | 166 | 8.1% |
| 30 to 34 Minutes | 304 | 14.8% |
| 35 to 39 Minutes | 166 | 8.1% |
| 40 to 44 Minutes | 200 | 9.7% |
| 45 to 59 Minutes | 485 | 23.6% |
| 60 to 89 Minutes | 54 | 2.6% |
| 90 or more Minutes | 27 | 1.3% |
Commute Time by Sex in Orangetree
The most common commute times in Orangetree are 20 to 24 minutes (253 commuters, 23.3%) for males and 45 to 59 minutes (290 commuters, 29.9%) for females.
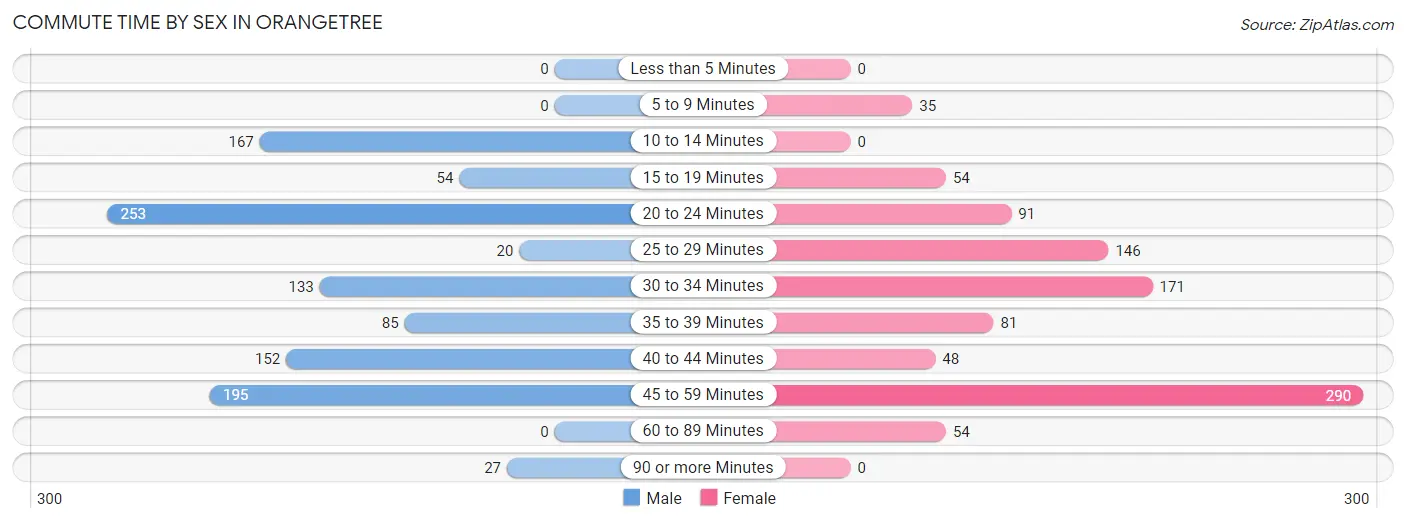
| Commute Time | Male | Female |
| Less than 5 Minutes | 0 (0.0%) | 0 (0.0%) |
| 5 to 9 Minutes | 0 (0.0%) | 35 (3.6%) |
| 10 to 14 Minutes | 167 (15.4%) | 0 (0.0%) |
| 15 to 19 Minutes | 54 (5.0%) | 54 (5.6%) |
| 20 to 24 Minutes | 253 (23.3%) | 91 (9.4%) |
| 25 to 29 Minutes | 20 (1.8%) | 146 (15.0%) |
| 30 to 34 Minutes | 133 (12.2%) | 171 (17.6%) |
| 35 to 39 Minutes | 85 (7.8%) | 81 (8.4%) |
| 40 to 44 Minutes | 152 (14.0%) | 48 (5.0%) |
| 45 to 59 Minutes | 195 (18.0%) | 290 (29.9%) |
| 60 to 89 Minutes | 0 (0.0%) | 54 (5.6%) |
| 90 or more Minutes | 27 (2.5%) | 0 (0.0%) |
Time of Departure to Work by Sex in Orangetree
The most frequent times of departure to work in Orangetree are 12:00 PM to 3:59 PM (241, 22.2%) for males and 7:30 AM to 7:59 AM (274, 28.2%) for females.
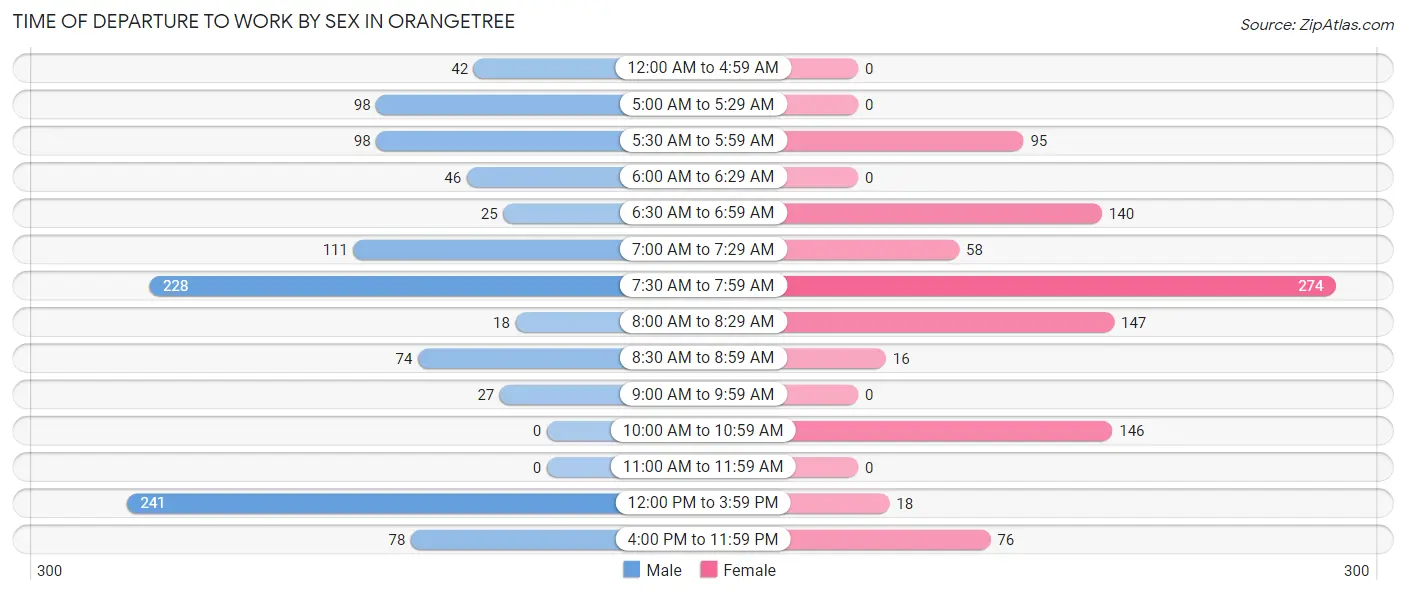
| Time of Departure | Male | Female |
| 12:00 AM to 4:59 AM | 42 (3.9%) | 0 (0.0%) |
| 5:00 AM to 5:29 AM | 98 (9.0%) | 0 (0.0%) |
| 5:30 AM to 5:59 AM | 98 (9.0%) | 95 (9.8%) |
| 6:00 AM to 6:29 AM | 46 (4.2%) | 0 (0.0%) |
| 6:30 AM to 6:59 AM | 25 (2.3%) | 140 (14.4%) |
| 7:00 AM to 7:29 AM | 111 (10.2%) | 58 (6.0%) |
| 7:30 AM to 7:59 AM | 228 (21.0%) | 274 (28.2%) |
| 8:00 AM to 8:29 AM | 18 (1.7%) | 147 (15.1%) |
| 8:30 AM to 8:59 AM | 74 (6.8%) | 16 (1.7%) |
| 9:00 AM to 9:59 AM | 27 (2.5%) | 0 (0.0%) |
| 10:00 AM to 10:59 AM | 0 (0.0%) | 146 (15.0%) |
| 11:00 AM to 11:59 AM | 0 (0.0%) | 0 (0.0%) |
| 12:00 PM to 3:59 PM | 241 (22.2%) | 18 (1.9%) |
| 4:00 PM to 11:59 PM | 78 (7.2%) | 76 (7.8%) |
| Total | 1,086 (100.0%) | 970 (100.0%) |
Housing Occupancy in Orangetree
Occupancy by Ownership in Orangetree
Of the total 1,611 dwellings in Orangetree, owner-occupied units account for 1,386 (86.0%), while renter-occupied units make up 225 (14.0%).
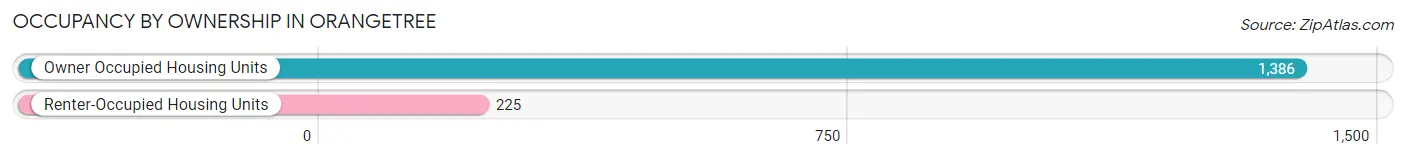
| Occupancy | # Housing Units | % Housing Units |
| Owner Occupied Housing Units | 1,386 | 86.0% |
| Renter-Occupied Housing Units | 225 | 14.0% |
| Total Occupied Housing Units | 1,611 | 100.0% |
Occupancy by Household Size in Orangetree
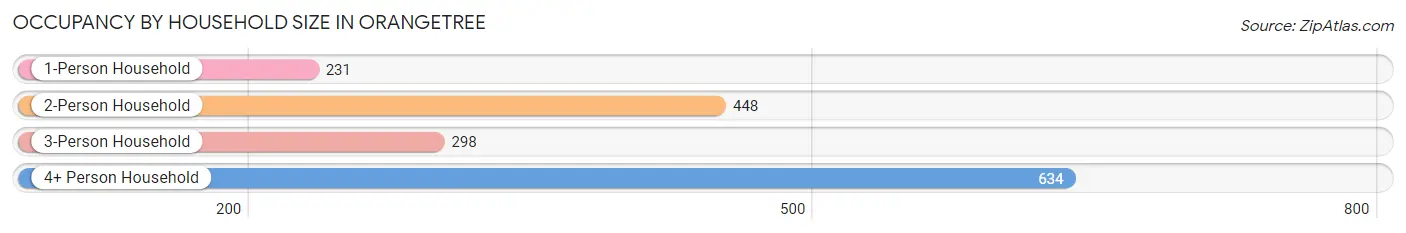
| Household Size | # Housing Units | % Housing Units |
| 1-Person Household | 231 | 14.3% |
| 2-Person Household | 448 | 27.8% |
| 3-Person Household | 298 | 18.5% |
| 4+ Person Household | 634 | 39.4% |
| Total Housing Units | 1,611 | 100.0% |
Occupancy by Ownership by Household Size in Orangetree
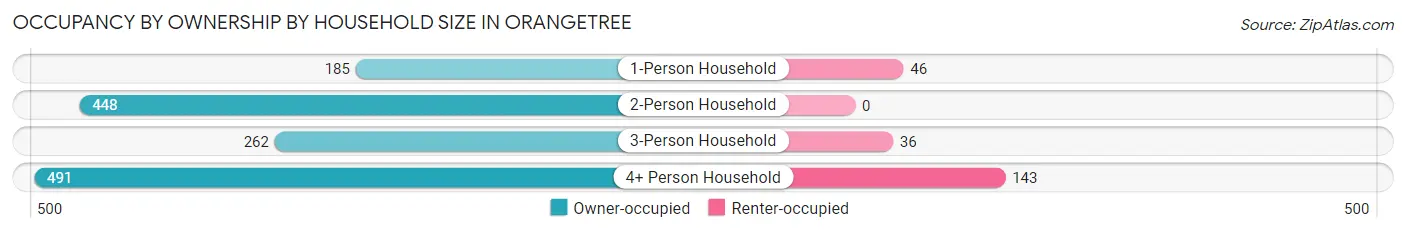
| Household Size | Owner-occupied | Renter-occupied |
| 1-Person Household | 185 (80.1%) | 46 (19.9%) |
| 2-Person Household | 448 (100.0%) | 0 (0.0%) |
| 3-Person Household | 262 (87.9%) | 36 (12.1%) |
| 4+ Person Household | 491 (77.4%) | 143 (22.6%) |
| Total Housing Units | 1,386 (86.0%) | 225 (14.0%) |
Occupancy by Educational Attainment in Orangetree
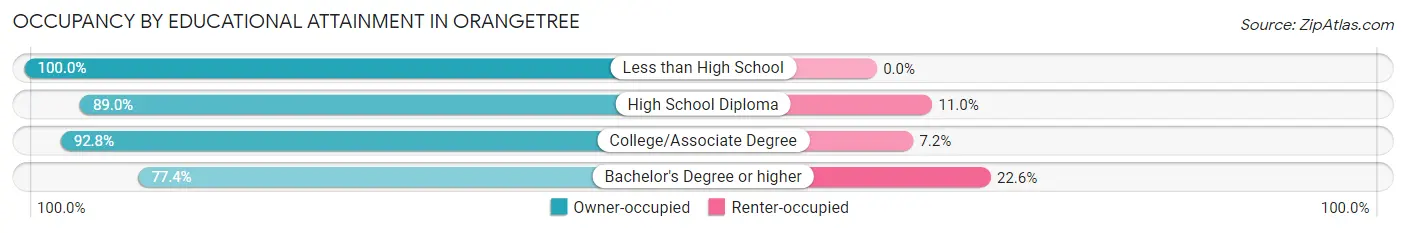
| Household Size | Owner-occupied | Renter-occupied |
| Less than High School | 114 (100.0%) | 0 (0.0%) |
| High School Diploma | 292 (89.0%) | 36 (11.0%) |
| College/Associate Degree | 452 (92.8%) | 35 (7.2%) |
| Bachelor's Degree or higher | 528 (77.4%) | 154 (22.6%) |
Occupancy by Age of Householder in Orangetree
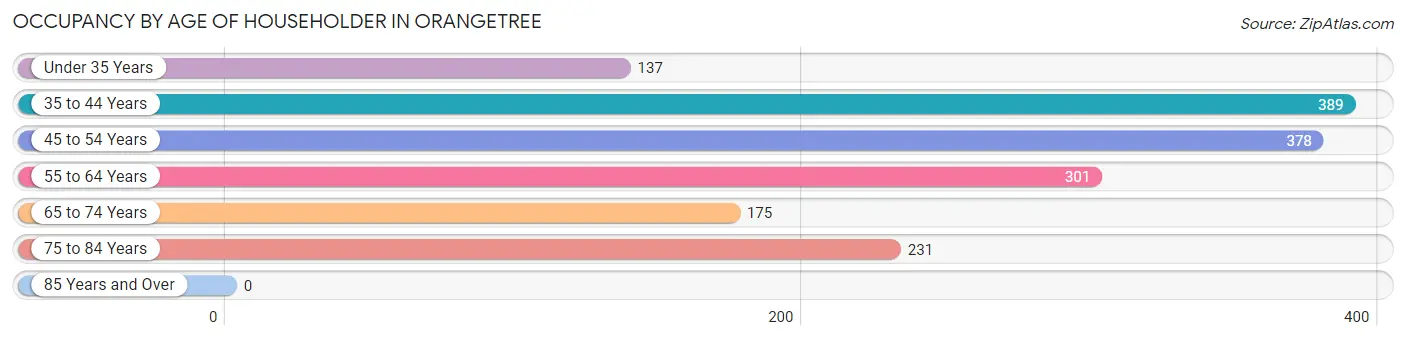
| Age Bracket | # Households | % Households |
| Under 35 Years | 137 | 8.5% |
| 35 to 44 Years | 389 | 24.1% |
| 45 to 54 Years | 378 | 23.5% |
| 55 to 64 Years | 301 | 18.7% |
| 65 to 74 Years | 175 | 10.9% |
| 75 to 84 Years | 231 | 14.3% |
| 85 Years and Over | 0 | 0.0% |
| Total | 1,611 | 100.0% |
Housing Finances in Orangetree
Median Income by Occupancy in Orangetree
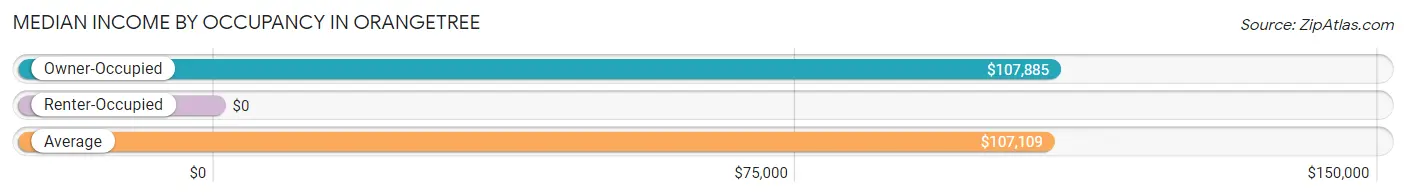
| Occupancy Type | # Households | Median Income |
| Owner-Occupied | 1,386 (86.0%) | $107,885 |
| Renter-Occupied | 225 (14.0%) | $0 |
| Average | 1,611 (100.0%) | $107,109 |
Occupancy by Householder Income Bracket in Orangetree
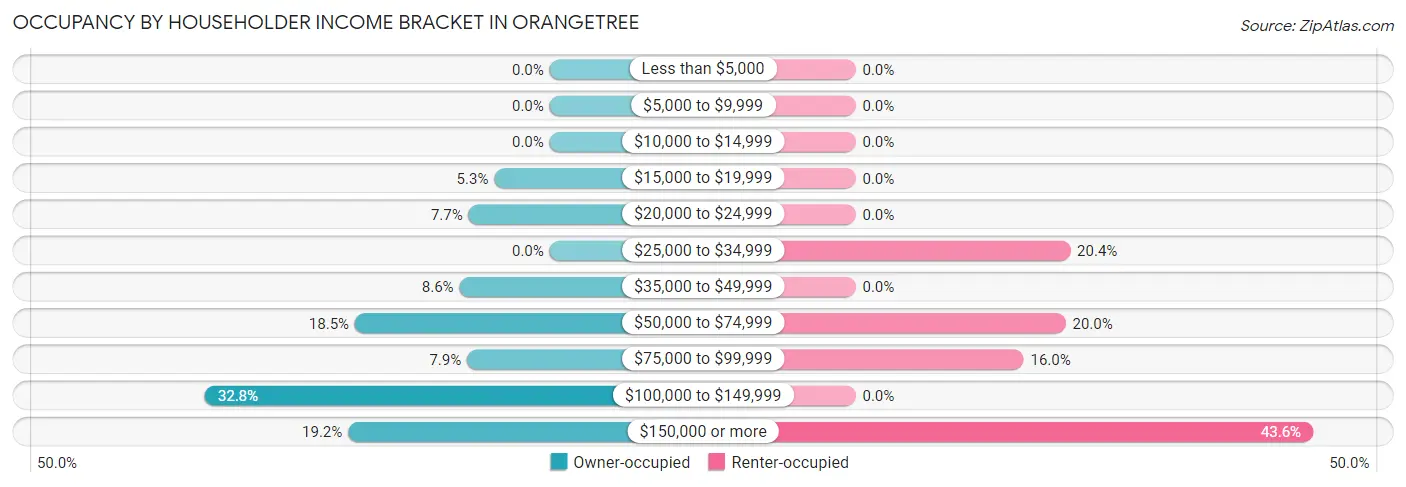
| Income Bracket | Owner-occupied | Renter-occupied |
| Less than $5,000 | 0 (0.0%) | 0 (0.0%) |
| $5,000 to $9,999 | 0 (0.0%) | 0 (0.0%) |
| $10,000 to $14,999 | 0 (0.0%) | 0 (0.0%) |
| $15,000 to $19,999 | 73 (5.3%) | 0 (0.0%) |
| $20,000 to $24,999 | 107 (7.7%) | 0 (0.0%) |
| $25,000 to $34,999 | 0 (0.0%) | 46 (20.4%) |
| $35,000 to $49,999 | 119 (8.6%) | 0 (0.0%) |
| $50,000 to $74,999 | 257 (18.5%) | 45 (20.0%) |
| $75,000 to $99,999 | 109 (7.9%) | 36 (16.0%) |
| $100,000 to $149,999 | 455 (32.8%) | 0 (0.0%) |
| $150,000 or more | 266 (19.2%) | 98 (43.6%) |
| Total | 1,386 (100.0%) | 225 (100.0%) |
Monthly Housing Cost Tiers in Orangetree
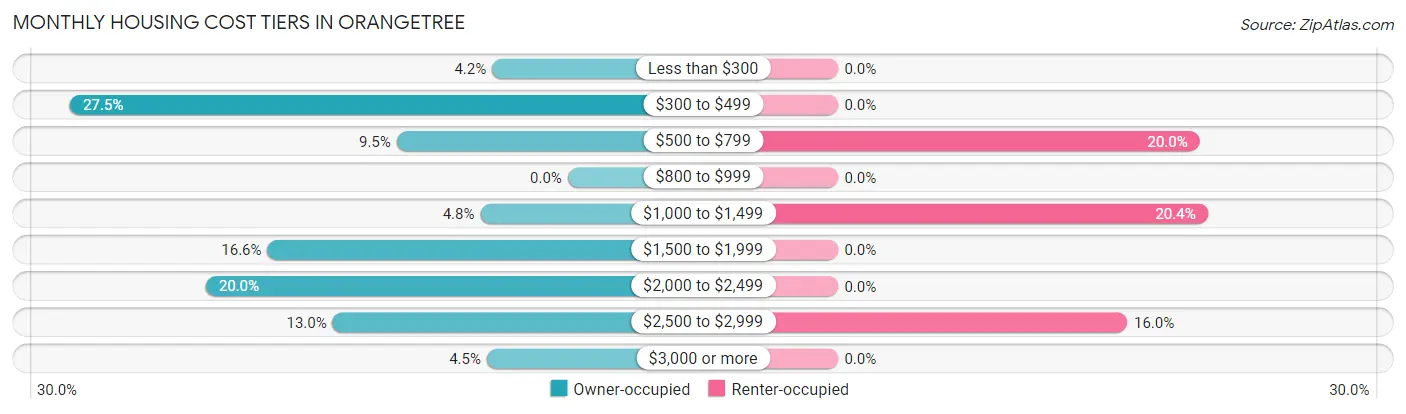
| Monthly Cost | Owner-occupied | Renter-occupied |
| Less than $300 | 58 (4.2%) | 0 (0.0%) |
| $300 to $499 | 381 (27.5%) | 0 (0.0%) |
| $500 to $799 | 131 (9.5%) | 45 (20.0%) |
| $800 to $999 | 0 (0.0%) | 0 (0.0%) |
| $1,000 to $1,499 | 67 (4.8%) | 46 (20.4%) |
| $1,500 to $1,999 | 230 (16.6%) | 0 (0.0%) |
| $2,000 to $2,499 | 277 (20.0%) | 0 (0.0%) |
| $2,500 to $2,999 | 180 (13.0%) | 36 (16.0%) |
| $3,000 or more | 62 (4.5%) | 0 (0.0%) |
| Total | 1,386 (100.0%) | 225 (100.0%) |
Physical Housing Characteristics in Orangetree
Housing Structures in Orangetree
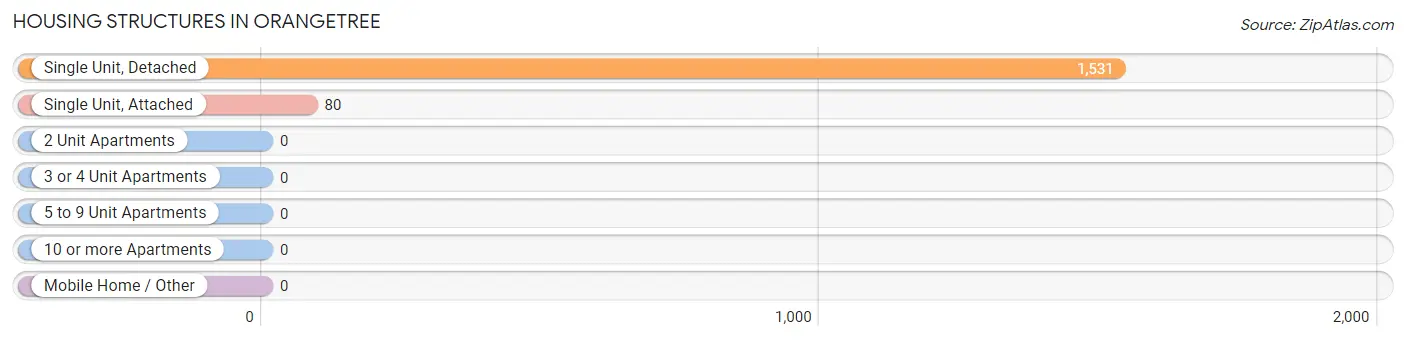
| Structure Type | # Housing Units | % Housing Units |
| Single Unit, Detached | 1,531 | 95.0% |
| Single Unit, Attached | 80 | 5.0% |
| 2 Unit Apartments | 0 | 0.0% |
| 3 or 4 Unit Apartments | 0 | 0.0% |
| 5 to 9 Unit Apartments | 0 | 0.0% |
| 10 or more Apartments | 0 | 0.0% |
| Mobile Home / Other | 0 | 0.0% |
| Total | 1,611 | 100.0% |
Housing Structures by Occupancy in Orangetree
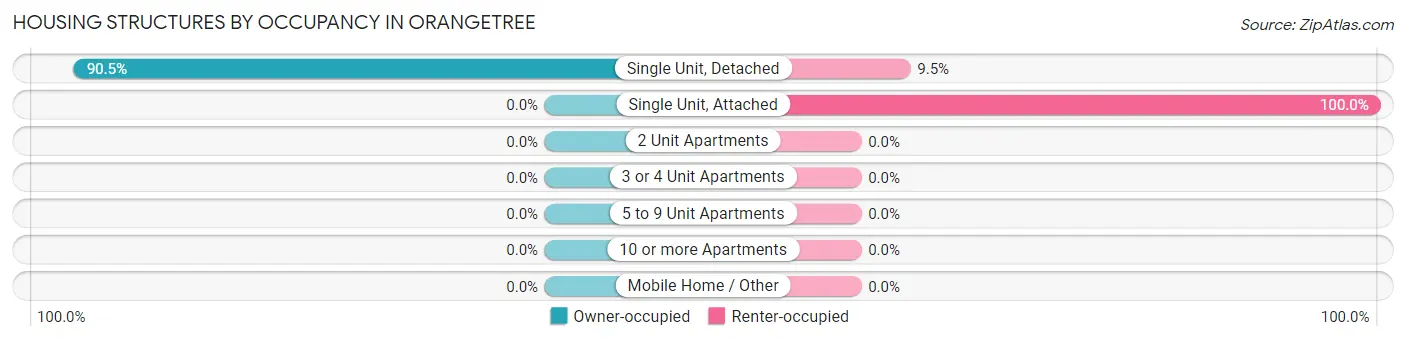
| Structure Type | Owner-occupied | Renter-occupied |
| Single Unit, Detached | 1,386 (90.5%) | 145 (9.5%) |
| Single Unit, Attached | 0 (0.0%) | 80 (100.0%) |
| 2 Unit Apartments | 0 (0.0%) | 0 (0.0%) |
| 3 or 4 Unit Apartments | 0 (0.0%) | 0 (0.0%) |
| 5 to 9 Unit Apartments | 0 (0.0%) | 0 (0.0%) |
| 10 or more Apartments | 0 (0.0%) | 0 (0.0%) |
| Mobile Home / Other | 0 (0.0%) | 0 (0.0%) |
| Total | 1,386 (86.0%) | 225 (14.0%) |
Housing Structures by Number of Rooms in Orangetree
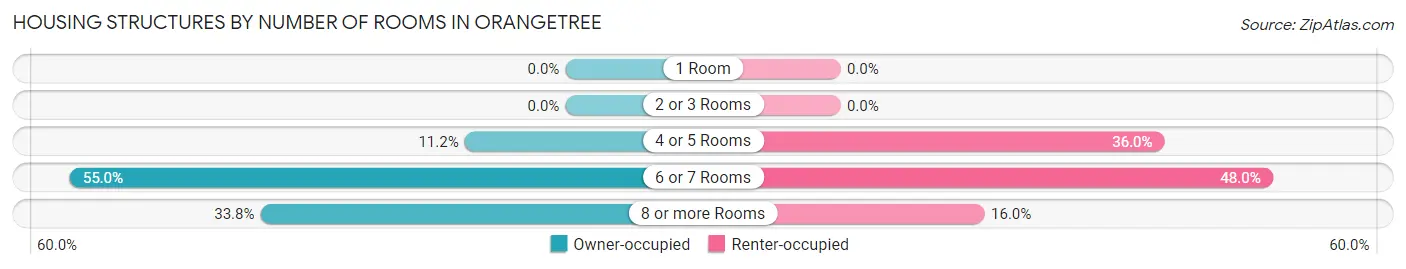
| Number of Rooms | Owner-occupied | Renter-occupied |
| 1 Room | 0 (0.0%) | 0 (0.0%) |
| 2 or 3 Rooms | 0 (0.0%) | 0 (0.0%) |
| 4 or 5 Rooms | 155 (11.2%) | 81 (36.0%) |
| 6 or 7 Rooms | 762 (55.0%) | 108 (48.0%) |
| 8 or more Rooms | 469 (33.8%) | 36 (16.0%) |
| Total | 1,386 (100.0%) | 225 (100.0%) |
Housing Structure by Heating Type in Orangetree
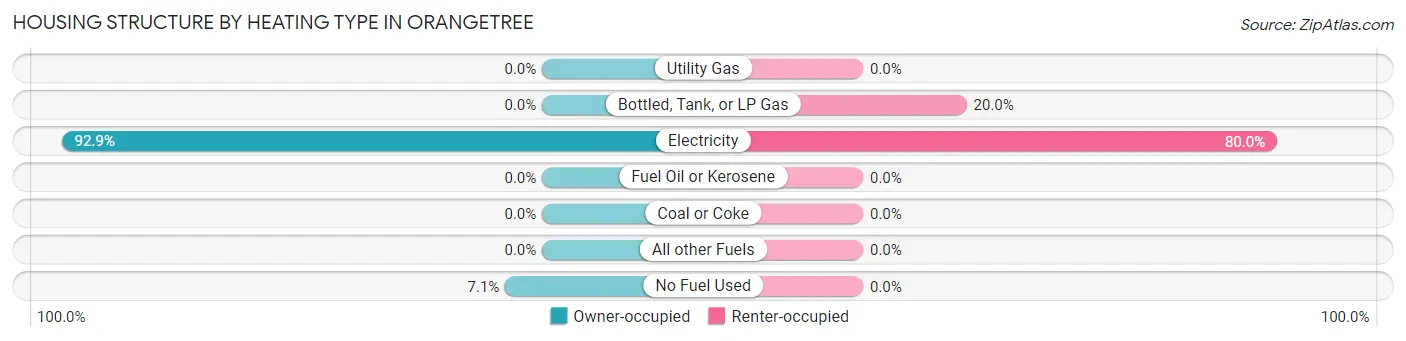
| Heating Type | Owner-occupied | Renter-occupied |
| Utility Gas | 0 (0.0%) | 0 (0.0%) |
| Bottled, Tank, or LP Gas | 0 (0.0%) | 45 (20.0%) |
| Electricity | 1,287 (92.9%) | 180 (80.0%) |
| Fuel Oil or Kerosene | 0 (0.0%) | 0 (0.0%) |
| Coal or Coke | 0 (0.0%) | 0 (0.0%) |
| All other Fuels | 0 (0.0%) | 0 (0.0%) |
| No Fuel Used | 99 (7.1%) | 0 (0.0%) |
| Total | 1,386 (100.0%) | 225 (100.0%) |
Household Vehicle Usage in Orangetree
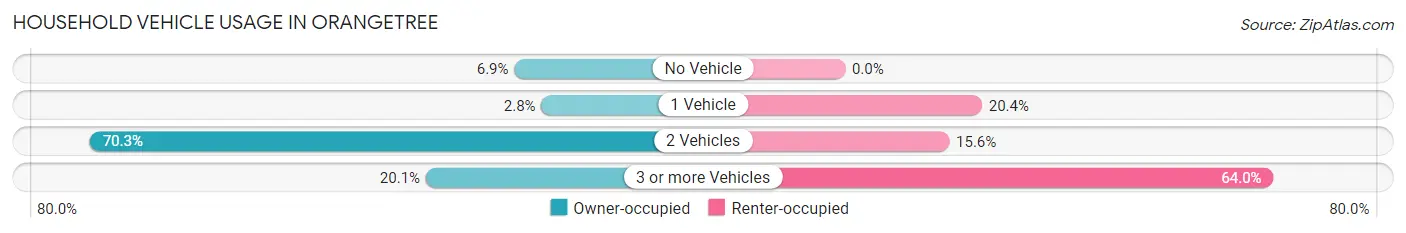
| Vehicles per Household | Owner-occupied | Renter-occupied |
| No Vehicle | 95 (6.9%) | 0 (0.0%) |
| 1 Vehicle | 39 (2.8%) | 46 (20.4%) |
| 2 Vehicles | 974 (70.3%) | 35 (15.6%) |
| 3 or more Vehicles | 278 (20.1%) | 144 (64.0%) |
| Total | 1,386 (100.0%) | 225 (100.0%) |
Real Estate & Mortgages in Orangetree
Real Estate and Mortgage Overview in Orangetree
| Characteristic | Without Mortgage | With Mortgage |
| Housing Units | 570 | 816 |
| Median Property Value | - | - |
| Median Household Income | $51,522 | $175 |
| Monthly Housing Costs | $350 | $62 |
| Real Estate Taxes | - | - |
Property Value by Mortgage Status in Orangetree
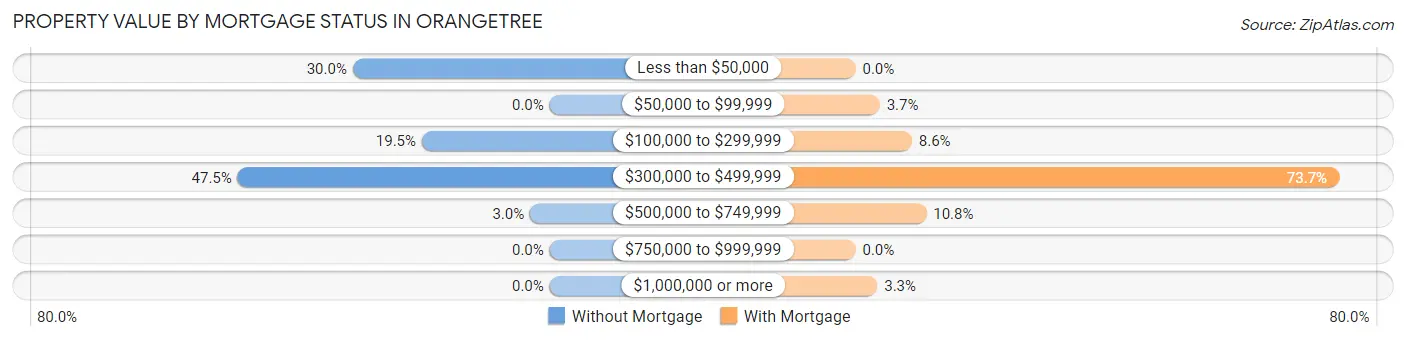
| Property Value | Without Mortgage | With Mortgage |
| Less than $50,000 | 171 (30.0%) | 0 (0.0%) |
| $50,000 to $99,999 | 0 (0.0%) | 30 (3.7%) |
| $100,000 to $299,999 | 111 (19.5%) | 70 (8.6%) |
| $300,000 to $499,999 | 271 (47.5%) | 601 (73.7%) |
| $500,000 to $749,999 | 17 (3.0%) | 88 (10.8%) |
| $750,000 to $999,999 | 0 (0.0%) | 0 (0.0%) |
| $1,000,000 or more | 0 (0.0%) | 27 (3.3%) |
| Total | 570 (100.0%) | 816 (100.0%) |
Household Income by Mortgage Status in Orangetree
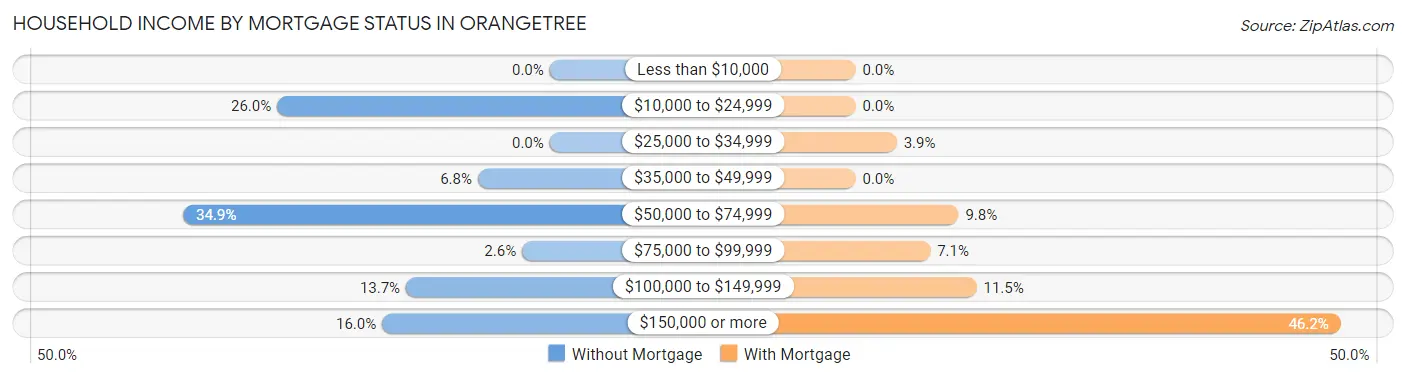
| Household Income | Without Mortgage | With Mortgage |
| Less than $10,000 | 0 (0.0%) | 0 (0.0%) |
| $10,000 to $24,999 | 148 (26.0%) | 0 (0.0%) |
| $25,000 to $34,999 | 0 (0.0%) | 32 (3.9%) |
| $35,000 to $49,999 | 39 (6.8%) | 0 (0.0%) |
| $50,000 to $74,999 | 199 (34.9%) | 80 (9.8%) |
| $75,000 to $99,999 | 15 (2.6%) | 58 (7.1%) |
| $100,000 to $149,999 | 78 (13.7%) | 94 (11.5%) |
| $150,000 or more | 91 (16.0%) | 377 (46.2%) |
| Total | 570 (100.0%) | 816 (100.0%) |
Property Value to Household Income Ratio in Orangetree
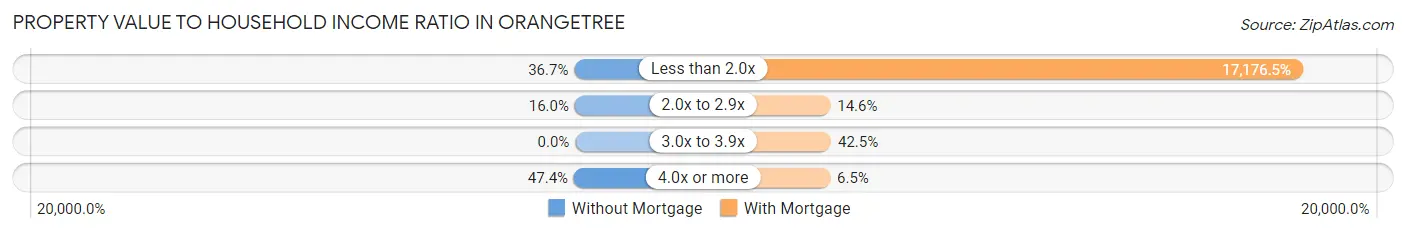
| Value-to-Income Ratio | Without Mortgage | With Mortgage |
| Less than 2.0x | 209 (36.7%) | 140,160 (17,176.5%) |
| 2.0x to 2.9x | 91 (16.0%) | 119 (14.6%) |
| 3.0x to 3.9x | 0 (0.0%) | 347 (42.5%) |
| 4.0x or more | 270 (47.4%) | 53 (6.5%) |
| Total | 570 (100.0%) | 816 (100.0%) |
Real Estate Taxes by Mortgage Status in Orangetree
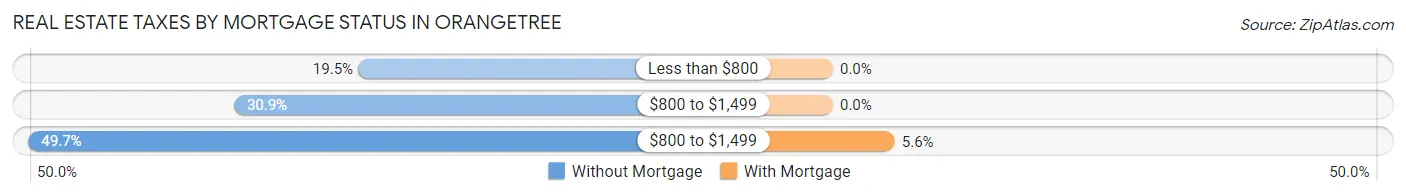
| Property Taxes | Without Mortgage | With Mortgage |
| Less than $800 | 111 (19.5%) | 0 (0.0%) |
| $800 to $1,499 | 176 (30.9%) | 0 (0.0%) |
| $800 to $1,499 | 283 (49.6%) | 46 (5.6%) |
| Total | 570 (100.0%) | 816 (100.0%) |
Health & Disability in Orangetree
Health Insurance Coverage by Age in Orangetree
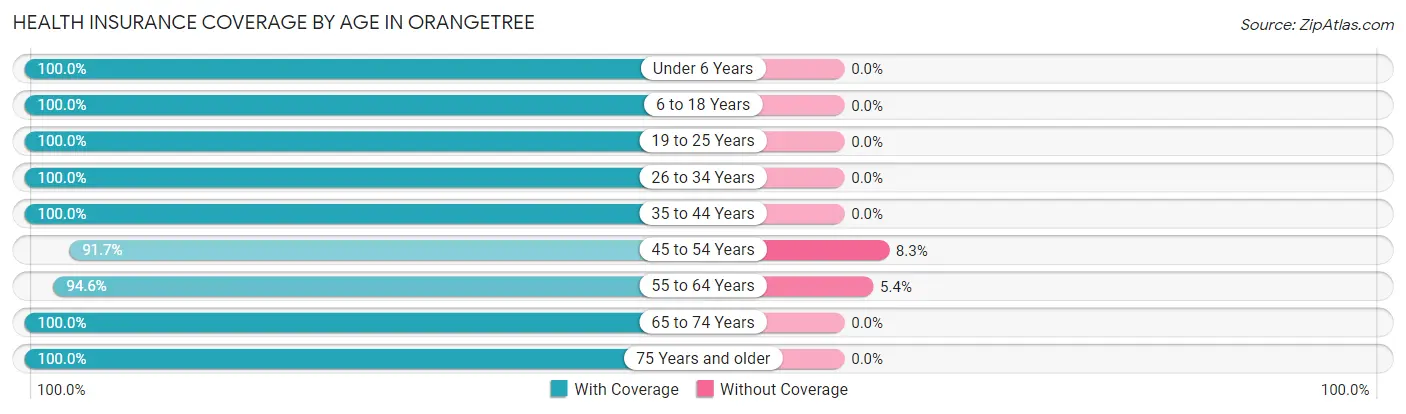
| Age Bracket | With Coverage | Without Coverage |
| Under 6 Years | 410 (100.0%) | 0 (0.0%) |
| 6 to 18 Years | 751 (100.0%) | 0 (0.0%) |
| 19 to 25 Years | 213 (100.0%) | 0 (0.0%) |
| 26 to 34 Years | 564 (100.0%) | 0 (0.0%) |
| 35 to 44 Years | 599 (100.0%) | 0 (0.0%) |
| 45 to 54 Years | 617 (91.7%) | 56 (8.3%) |
| 55 to 64 Years | 633 (94.6%) | 36 (5.4%) |
| 65 to 74 Years | 440 (100.0%) | 0 (0.0%) |
| 75 Years and older | 610 (100.0%) | 0 (0.0%) |
| Total | 4,837 (98.1%) | 92 (1.9%) |
Health Insurance Coverage by Citizenship Status in Orangetree
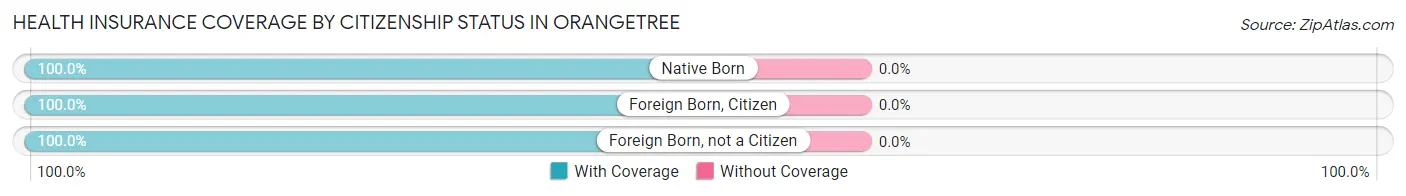
| Citizenship Status | With Coverage | Without Coverage |
| Native Born | 410 (100.0%) | 0 (0.0%) |
| Foreign Born, Citizen | 751 (100.0%) | 0 (0.0%) |
| Foreign Born, not a Citizen | 213 (100.0%) | 0 (0.0%) |
Health Insurance Coverage by Household Income in Orangetree
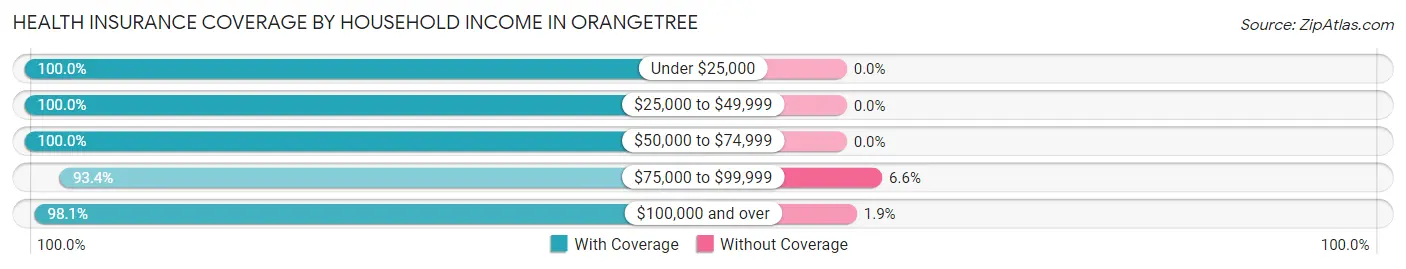
| Household Income | With Coverage | Without Coverage |
| Under $25,000 | 243 (100.0%) | 0 (0.0%) |
| $25,000 to $49,999 | 204 (100.0%) | 0 (0.0%) |
| $50,000 to $74,999 | 956 (100.0%) | 0 (0.0%) |
| $75,000 to $99,999 | 507 (93.4%) | 36 (6.6%) |
| $100,000 and over | 2,927 (98.1%) | 56 (1.9%) |
Public vs Private Health Insurance Coverage by Age in Orangetree
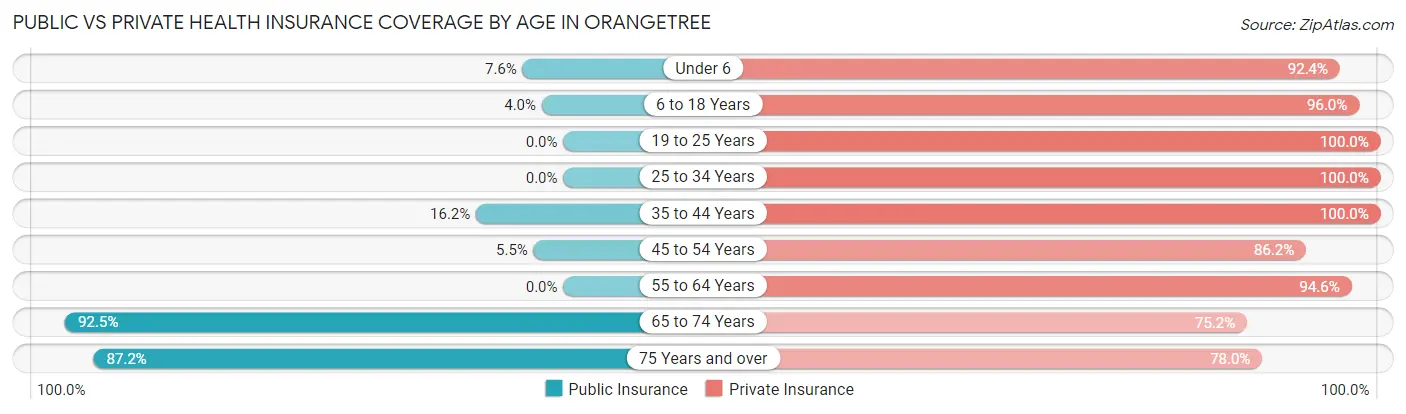
| Age Bracket | Public Insurance | Private Insurance |
| Under 6 | 31 (7.6%) | 379 (92.4%) |
| 6 to 18 Years | 30 (4.0%) | 721 (96.0%) |
| 19 to 25 Years | 0 (0.0%) | 213 (100.0%) |
| 25 to 34 Years | 0 (0.0%) | 564 (100.0%) |
| 35 to 44 Years | 97 (16.2%) | 599 (100.0%) |
| 45 to 54 Years | 37 (5.5%) | 580 (86.2%) |
| 55 to 64 Years | 0 (0.0%) | 633 (94.6%) |
| 65 to 74 Years | 407 (92.5%) | 331 (75.2%) |
| 75 Years and over | 532 (87.2%) | 476 (78.0%) |
| Total | 1,134 (23.0%) | 4,496 (91.2%) |
Disability Status by Sex by Age in Orangetree
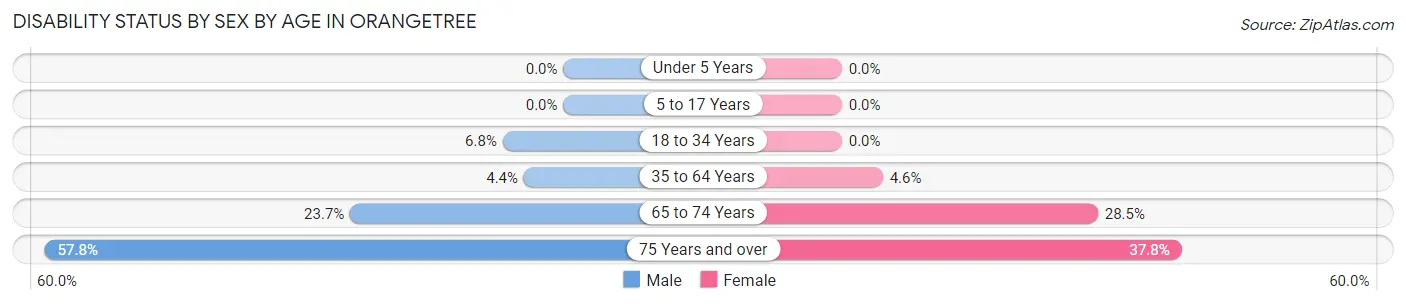
| Age Bracket | Male | Female |
| Under 5 Years | 0 (0.0%) | 0 (0.0%) |
| 5 to 17 Years | 0 (0.0%) | 0 (0.0%) |
| 18 to 34 Years | 27 (6.8%) | 0 (0.0%) |
| 35 to 64 Years | 42 (4.4%) | 45 (4.6%) |
| 65 to 74 Years | 52 (23.7%) | 63 (28.5%) |
| 75 Years and over | 134 (57.8%) | 143 (37.8%) |
Disability Class by Sex by Age in Orangetree
Disability Class: Hearing Difficulty
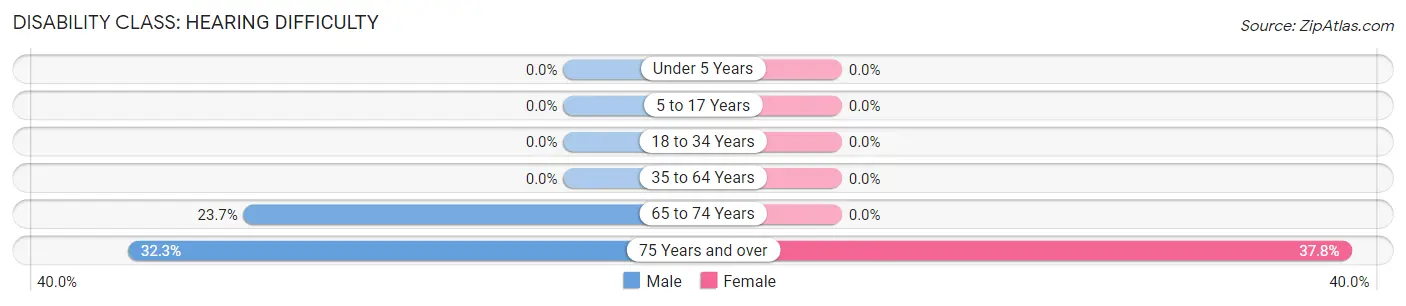
| Age Bracket | Male | Female |
| Under 5 Years | 0 (0.0%) | 0 (0.0%) |
| 5 to 17 Years | 0 (0.0%) | 0 (0.0%) |
| 18 to 34 Years | 0 (0.0%) | 0 (0.0%) |
| 35 to 64 Years | 0 (0.0%) | 0 (0.0%) |
| 65 to 74 Years | 52 (23.7%) | 0 (0.0%) |
| 75 Years and over | 75 (32.3%) | 143 (37.8%) |
Disability Class: Vision Difficulty
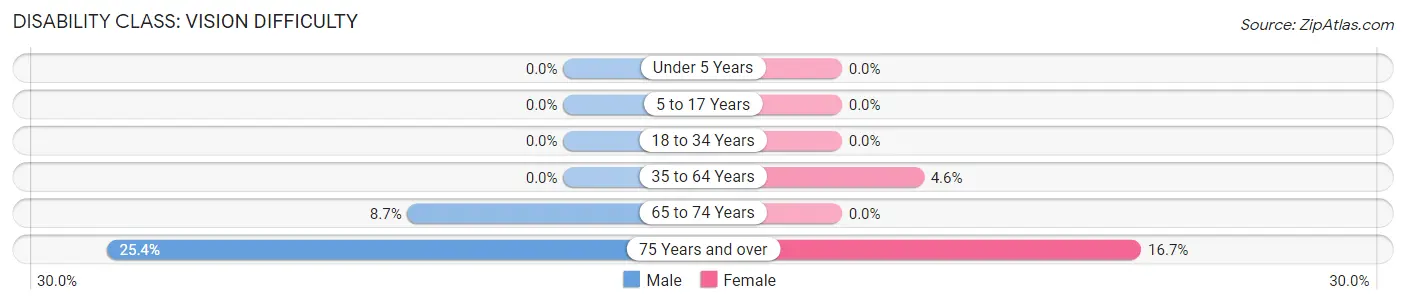
| Age Bracket | Male | Female |
| Under 5 Years | 0 (0.0%) | 0 (0.0%) |
| 5 to 17 Years | 0 (0.0%) | 0 (0.0%) |
| 18 to 34 Years | 0 (0.0%) | 0 (0.0%) |
| 35 to 64 Years | 0 (0.0%) | 45 (4.6%) |
| 65 to 74 Years | 19 (8.7%) | 0 (0.0%) |
| 75 Years and over | 59 (25.4%) | 63 (16.7%) |
Disability Class: Cognitive Difficulty
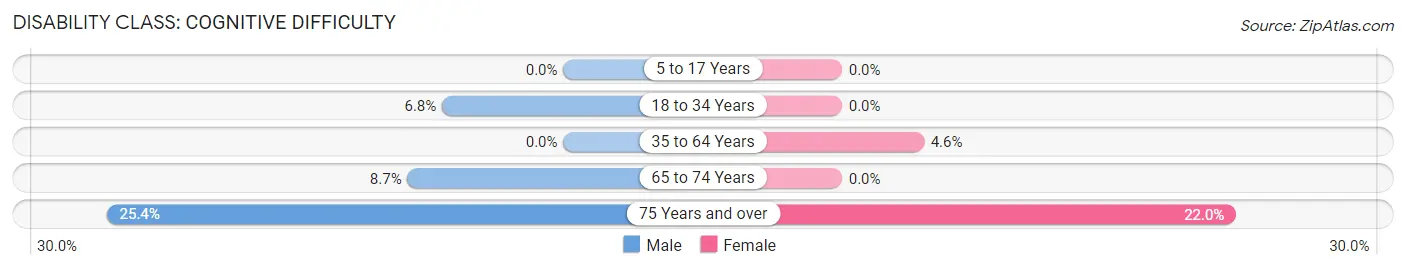
| Age Bracket | Male | Female |
| 5 to 17 Years | 0 (0.0%) | 0 (0.0%) |
| 18 to 34 Years | 27 (6.8%) | 0 (0.0%) |
| 35 to 64 Years | 0 (0.0%) | 45 (4.6%) |
| 65 to 74 Years | 19 (8.7%) | 0 (0.0%) |
| 75 Years and over | 59 (25.4%) | 83 (22.0%) |
Disability Class: Ambulatory Difficulty
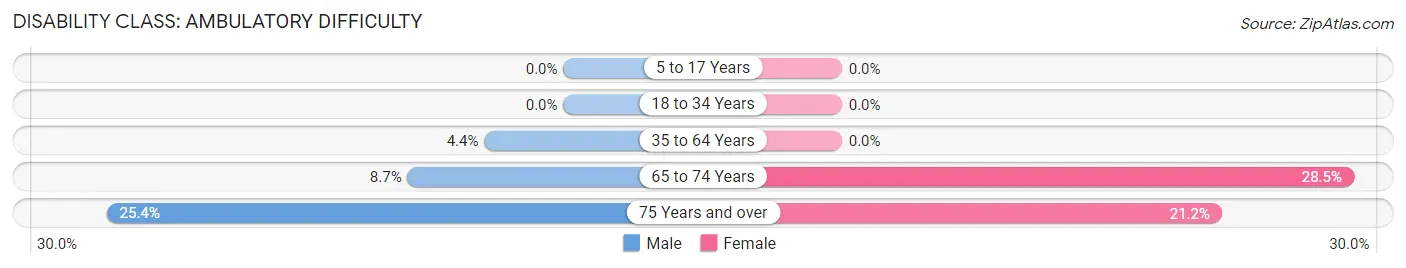
| Age Bracket | Male | Female |
| 5 to 17 Years | 0 (0.0%) | 0 (0.0%) |
| 18 to 34 Years | 0 (0.0%) | 0 (0.0%) |
| 35 to 64 Years | 42 (4.4%) | 0 (0.0%) |
| 65 to 74 Years | 19 (8.7%) | 63 (28.5%) |
| 75 Years and over | 59 (25.4%) | 80 (21.2%) |
Disability Class: Self-Care Difficulty
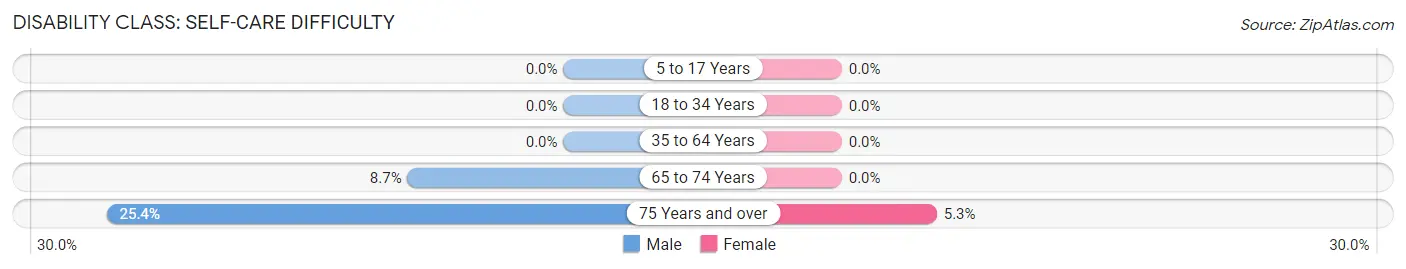
| Age Bracket | Male | Female |
| 5 to 17 Years | 0 (0.0%) | 0 (0.0%) |
| 18 to 34 Years | 0 (0.0%) | 0 (0.0%) |
| 35 to 64 Years | 0 (0.0%) | 0 (0.0%) |
| 65 to 74 Years | 19 (8.7%) | 0 (0.0%) |
| 75 Years and over | 59 (25.4%) | 20 (5.3%) |
Technology Access in Orangetree
Computing Device Access in Orangetree
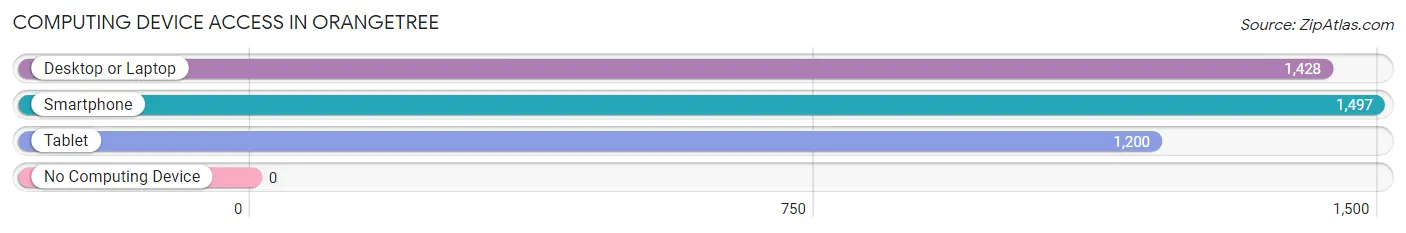
| Device Type | # Households | % Households |
| Desktop or Laptop | 1,428 | 88.6% |
| Smartphone | 1,497 | 92.9% |
| Tablet | 1,200 | 74.5% |
| No Computing Device | 0 | 0.0% |
| Total | 1,611 | 100.0% |
Internet Access in Orangetree
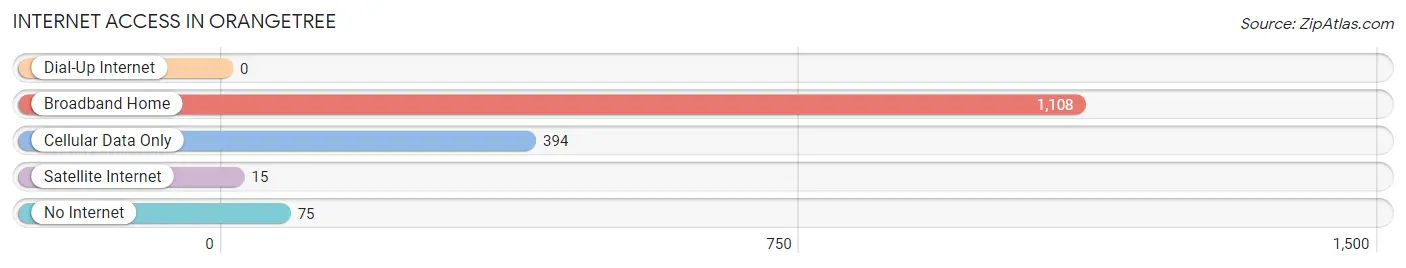
| Internet Type | # Households | % Households |
| Dial-Up Internet | 0 | 0.0% |
| Broadband Home | 1,108 | 68.8% |
| Cellular Data Only | 394 | 24.5% |
| Satellite Internet | 15 | 0.9% |
| No Internet | 75 | 4.7% |
| Total | 1,611 | 100.0% |
Orangetree Summary
Orangetree is an unincorporated community located in the western part of Broward County, Florida. It is located just south of the city of Sunrise and is part of the Miami metropolitan area. The population of Orangetree was estimated to be 1,845 in 2019.
Geography
Orangetree is located at 26°10'25" North, 80°17'45" West (26.173611, -80.295833). It is situated at an elevation of 8 feet (2.4 m) above sea level. The community is located in the western part of Broward County, just south of the city of Sunrise. It is part of the Miami metropolitan area.
Climate
Orangetree has a tropical monsoon climate, with hot and humid summers and mild winters. The average temperature in the summer is around 90°F (32°C), while in the winter it is around 70°F (21°C). The average annual precipitation is around 60 inches (152 cm).
Demographics
As of the 2010 census, there were 1,845 people living in Orangetree. The racial makeup of the community was 57.3% White, 28.2% African American, 0.3% Native American, 5.2% Asian, 0.1% Pacific Islander, 5.2% from other races, and 3.9% from two or more races. Hispanic or Latino of any race were 15.2% of the population.
Economy
Orangetree is primarily a residential community, with most of its residents commuting to nearby cities for work. The main industries in the area are retail, healthcare, and hospitality. The largest employers in the area are the Broward County Public Schools, Broward Health, and the City of Sunrise.
Education
Orangetree is served by the Broward County Public Schools system. The closest schools are Westpine Middle School and Westpine Elementary School.
Transportation
Orangetree is served by the Broward County Transit bus system. The closest major airport is Fort Lauderdale-Hollywood International Airport, located about 20 miles (32 km) away.
Culture
Orangetree is home to a variety of cultural attractions, including the Orangetree Arts Center, which hosts a variety of art classes and workshops. The community also hosts a variety of festivals and events throughout the year, including the Orangetree Festival, which features live music, food, and art.
Conclusion
Orangetree is a small unincorporated community located in the western part of Broward County, Florida. It is part of the Miami metropolitan area and has a population of 1,845. The community is primarily residential, with most of its residents commuting to nearby cities for work. Orangetree is served by the Broward County Public Schools system and is home to a variety of cultural attractions, including the Orangetree Arts Center. The community also hosts a variety of festivals and events throughout the year.
Common Questions
What is Per Capita Income in Orangetree?
Per Capita income in Orangetree is $34,423.
What is the Median Family Income in Orangetree?
Median Family Income in Orangetree is $109,103.
What is the Median Household income in Orangetree?
Median Household Income in Orangetree is $107,109.
What is Income or Wage Gap in Orangetree?
Income or Wage Gap in Orangetree is 44.8%.
Women in Orangetree earn 55.2 cents for every dollar earned by a man.
What is Inequality or Gini Index in Orangetree?
Inequality or Gini Index in Orangetree is 0.32.
What is the Total Population of Orangetree?
Total Population of Orangetree is 4,929.
What is the Total Male Population of Orangetree?
Total Male Population of Orangetree is 2,337.
What is the Total Female Population of Orangetree?
Total Female Population of Orangetree is 2,592.
What is the Ratio of Males per 100 Females in Orangetree?
There are 90.16 Males per 100 Females in Orangetree.
What is the Ratio of Females per 100 Males in Orangetree?
There are 110.91 Females per 100 Males in Orangetree.
What is the Median Population Age in Orangetree?
Median Population Age in Orangetree is 43.4 Years.
What is the Average Family Size in Orangetree
Average Family Size in Orangetree is 3.2 People.
What is the Average Household Size in Orangetree
Average Household Size in Orangetree is 3.1 People.
How Large is the Labor Force in Orangetree?
There are 2,431 People in the Labor Forcein in Orangetree.
What is the Percentage of People in the Labor Force in Orangetree?
62.0% of People are in the Labor Force in Orangetree.
What is the Unemployment Rate in Orangetree?
Unemployment Rate in Orangetree is 3.2%.