Crane, OR Map & Demographics
Crane Map
Crane Overview
$20,264
PER CAPITA INCOME
$33,393
AVG FAMILY INCOME
$31,923
AVG HOUSEHOLD INCOME
0.53
INEQUALITY / GINI INDEX
160
TOTAL POPULATION
79
MALE POPULATION
81
FEMALE POPULATION
97.53
MALES / 100 FEMALES
102.53
FEMALES / 100 MALES
44.3
MEDIAN AGE
3.5
AVG FAMILY SIZE
2.4
AVG HOUSEHOLD SIZE
90
LABOR FORCE [ PEOPLE ]
63.8%
PERCENT IN LABOR FORCE
Crane Zip Codes
Crane Area Codes
Income in Crane
Income Overview in Crane
Per Capita Income in Crane is $20,264, while median incomes of families and households are $33,393 and $31,923 respectively.
| Characteristic | Number | Measure |
| Per Capita Income | 160 | $20,264 |
| Median Family Income | 33 | $33,393 |
| Mean Family Income | 33 | $46,185 |
| Median Household Income | 68 | $31,923 |
| Mean Household Income | 68 | $35,894 |
| Income Deficit | 33 | $0 |
| Wage / Income Gap (%) | 160 | 0.00% |
| Wage / Income Gap ($) | 160 | 100.00¢ per $1 |
| Gini / Inequality Index | 160 | 0.53 |
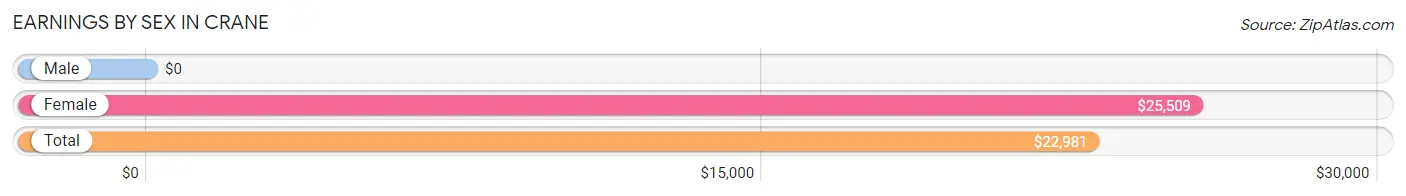
Earnings by Sex in Crane
| Sex | Number | Average Earnings |
| Male | 48 (50.5%) | $0 |
| Female | 47 (49.5%) | $25,509 |
| Total | 95 (100.0%) | $22,981 |
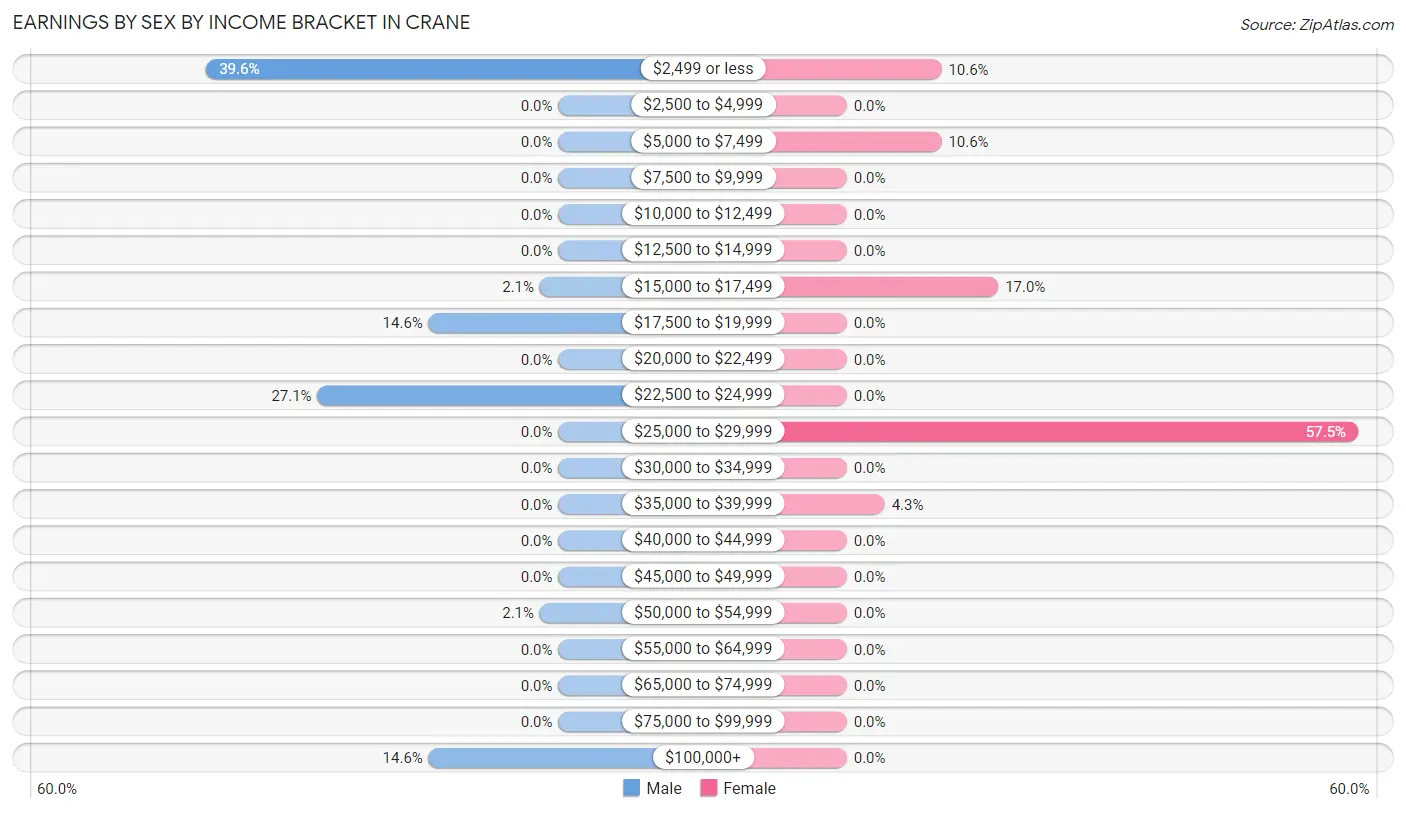
Earnings by Sex by Income Bracket in Crane
The most common earnings brackets in Crane are $2,499 or less for men (19 | 39.6%) and $25,000 to $29,999 for women (27 | 57.5%).
| Income | Male | Female |
| $2,499 or less | 19 (39.6%) | 5 (10.6%) |
| $2,500 to $4,999 | 0 (0.0%) | 0 (0.0%) |
| $5,000 to $7,499 | 0 (0.0%) | 5 (10.6%) |
| $7,500 to $9,999 | 0 (0.0%) | 0 (0.0%) |
| $10,000 to $12,499 | 0 (0.0%) | 0 (0.0%) |
| $12,500 to $14,999 | 0 (0.0%) | 0 (0.0%) |
| $15,000 to $17,499 | 1 (2.1%) | 8 (17.0%) |
| $17,500 to $19,999 | 7 (14.6%) | 0 (0.0%) |
| $20,000 to $22,499 | 0 (0.0%) | 0 (0.0%) |
| $22,500 to $24,999 | 13 (27.1%) | 0 (0.0%) |
| $25,000 to $29,999 | 0 (0.0%) | 27 (57.5%) |
| $30,000 to $34,999 | 0 (0.0%) | 0 (0.0%) |
| $35,000 to $39,999 | 0 (0.0%) | 2 (4.3%) |
| $40,000 to $44,999 | 0 (0.0%) | 0 (0.0%) |
| $45,000 to $49,999 | 0 (0.0%) | 0 (0.0%) |
| $50,000 to $54,999 | 1 (2.1%) | 0 (0.0%) |
| $55,000 to $64,999 | 0 (0.0%) | 0 (0.0%) |
| $65,000 to $74,999 | 0 (0.0%) | 0 (0.0%) |
| $75,000 to $99,999 | 0 (0.0%) | 0 (0.0%) |
| $100,000+ | 7 (14.6%) | 0 (0.0%) |
| Total | 48 (100.0%) | 47 (100.0%) |
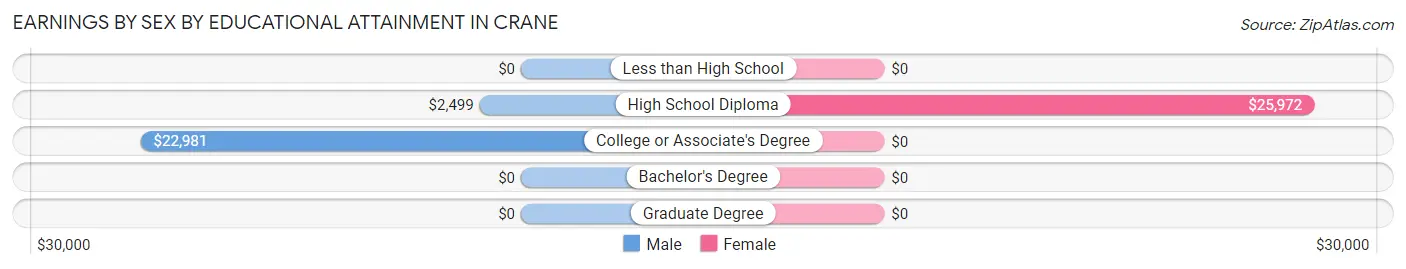
Earnings by Sex by Educational Attainment in Crane
| Educational Attainment | Male Income | Female Income |
| Less than High School | - | - |
| High School Diploma | $2,499 | $25,972 |
| College or Associate's Degree | $22,981 | $0 |
| Bachelor's Degree | - | - |
| Graduate Degree | - | - |
| Total | - | - |
Family Income in Crane
Family Income Brackets in Crane
According to the Crane family income data, there are 19 families falling into the $25,000 to $34,999 income range, which is the most common income bracket and makes up 57.6% of all families.
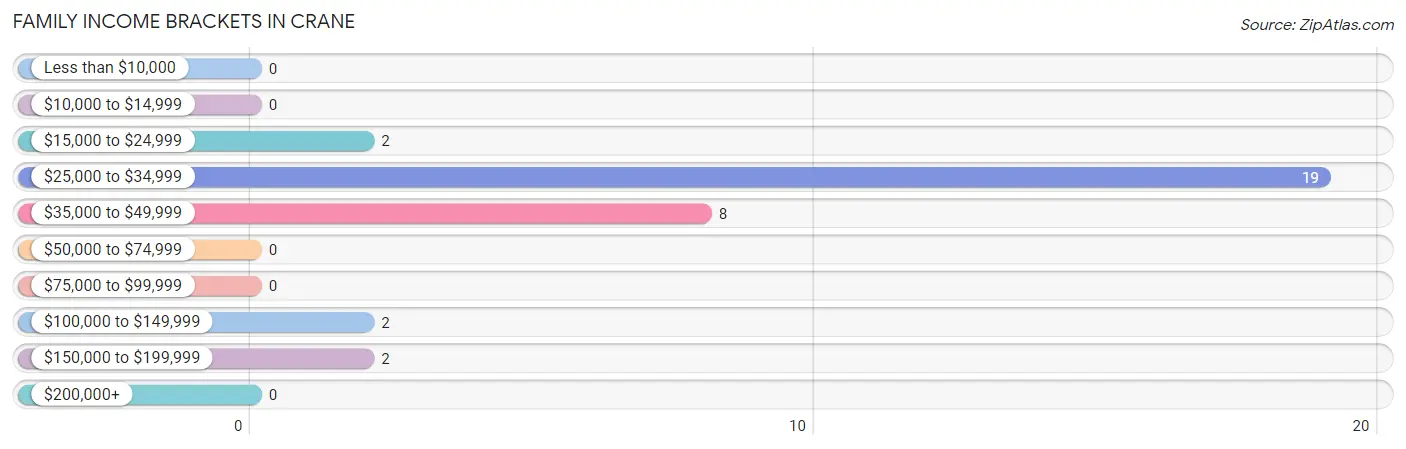
| Income Bracket | # Families | % Families |
| Less than $10,000 | 0 | 0.0% |
| $10,000 to $14,999 | 0 | 0.0% |
| $15,000 to $24,999 | 2 | 6.1% |
| $25,000 to $34,999 | 19 | 57.6% |
| $35,000 to $49,999 | 8 | 24.2% |
| $50,000 to $74,999 | 0 | 0.0% |
| $75,000 to $99,999 | 0 | 0.0% |
| $100,000 to $149,999 | 2 | 6.1% |
| $150,000 to $199,999 | 2 | 6.1% |
| $200,000+ | 0 | 0.0% |
Family Income by Famaliy Size in Crane
2-person families (16 | 48.5%) account for the highest median family income in Crane with $35,000 per family, while 2-person families (16 | 48.5%) have the highest median income of $17,500 per family member.
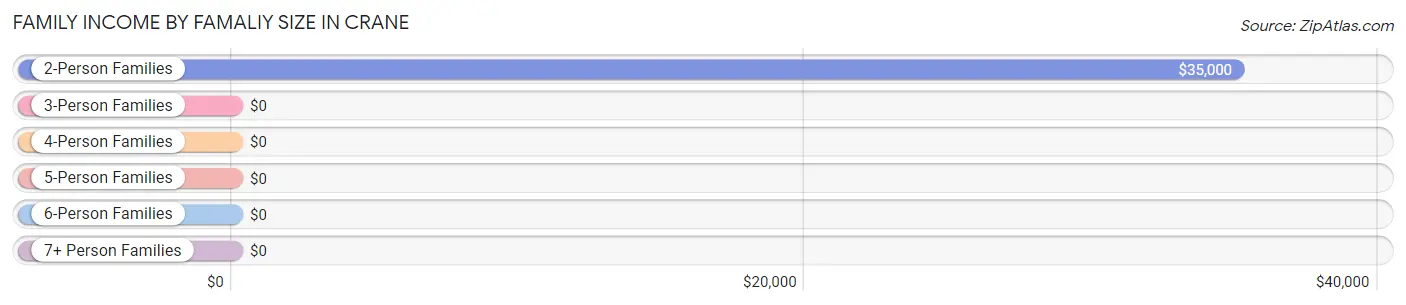
| Income Bracket | # Families | Median Income |
| 2-Person Families | 16 (48.5%) | $35,000 |
| 3-Person Families | 2 (6.1%) | $0 |
| 4-Person Families | 15 (45.5%) | $0 |
| 5-Person Families | 0 (0.0%) | $0 |
| 6-Person Families | 0 (0.0%) | $0 |
| 7+ Person Families | 0 (0.0%) | $0 |
| Total | 33 (100.0%) | $33,393 |
Family Income by Number of Earners in Crane
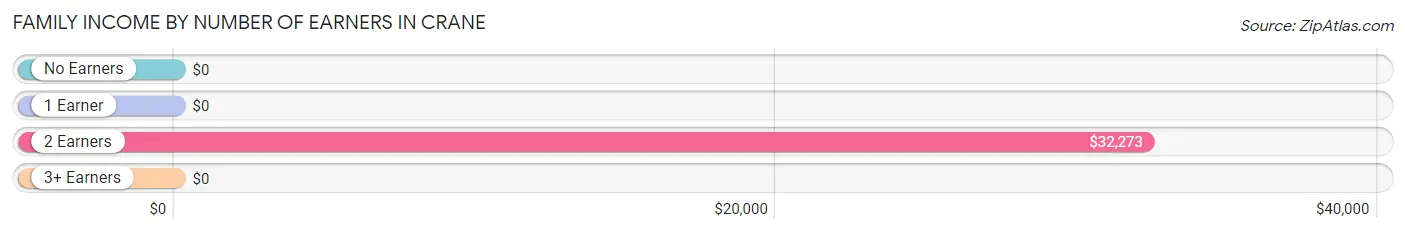
| Number of Earners | # Families | Median Income |
| No Earners | 8 (24.2%) | $0 |
| 1 Earner | 5 (15.1%) | $0 |
| 2 Earners | 20 (60.6%) | $32,273 |
| 3+ Earners | 0 (0.0%) | $0 |
| Total | 33 (100.0%) | $33,393 |
Household Income in Crane
Household Income Brackets in Crane
With 24 households falling in the category, the less than $10,000 income range is the most frequent in Crane, accounting for 35.3% of all households.
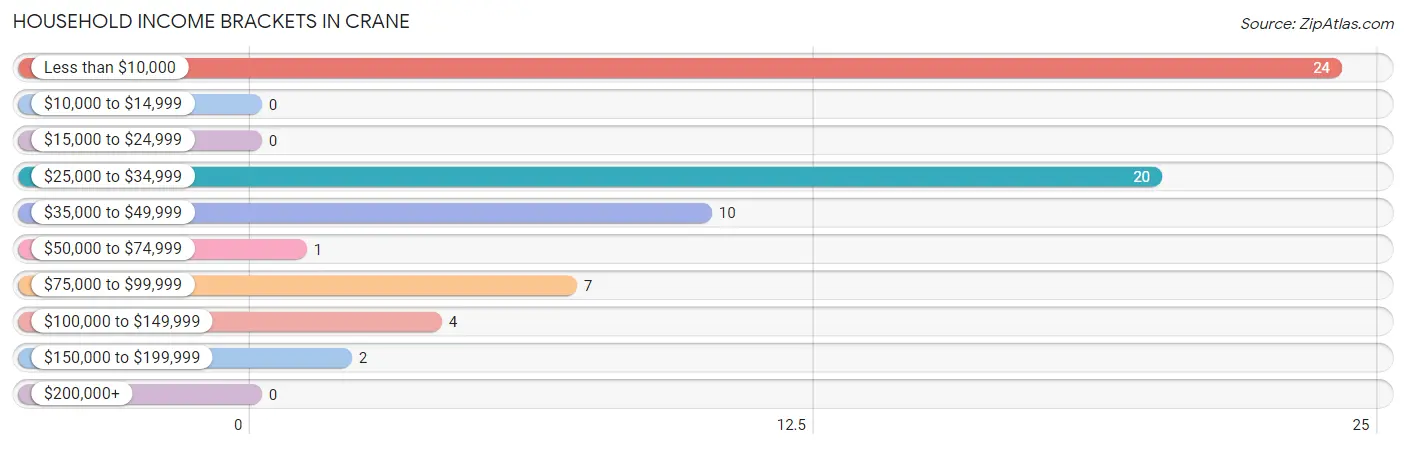
| Income Bracket | # Households | % Households |
| Less than $10,000 | 24 | 35.3% |
| $10,000 to $14,999 | 0 | 0.0% |
| $15,000 to $24,999 | 0 | 0.0% |
| $25,000 to $34,999 | 20 | 29.4% |
| $35,000 to $49,999 | 10 | 14.7% |
| $50,000 to $74,999 | 1 | 1.5% |
| $75,000 to $99,999 | 7 | 10.3% |
| $100,000 to $149,999 | 4 | 5.9% |
| $150,000 to $199,999 | 2 | 2.9% |
| $200,000+ | 0 | 0.0% |
Household Income by Householder Age in Crane
The median household income in Crane is $31,923, with the highest median household income of $2,499 found in the 45 to 64 years age bracket for the primary householder. A total of 36 households (52.9%) fall into this category.
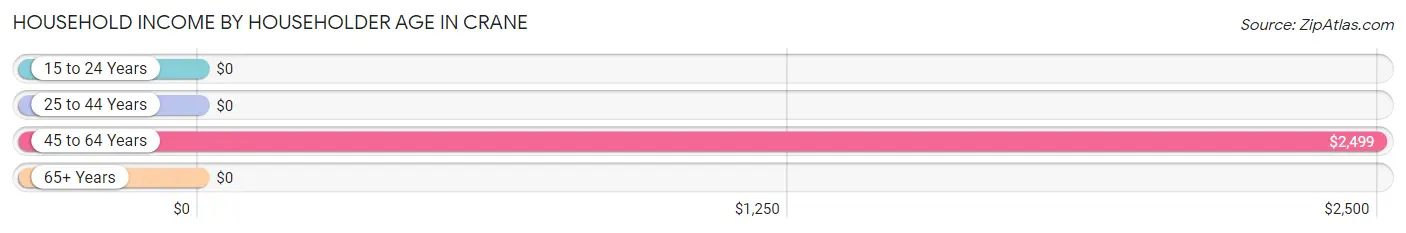
| Income Bracket | # Households | Median Income |
| 15 to 24 Years | 0 (0.0%) | $0 |
| 25 to 44 Years | 16 (23.5%) | $0 |
| 45 to 64 Years | 36 (52.9%) | $2,499 |
| 65+ Years | 16 (23.5%) | $0 |
| Total | 68 (100.0%) | $31,923 |
Poverty in Crane
Income Below Poverty by Sex and Age in Crane
With 24.0% poverty level for males and 6.2% for females among the residents of Crane, 45 to 54 year old males and 25 to 34 year old females are the most vulnerable to poverty, with 19 males (63.3%) and 5 females (11.9%) in their respective age groups living below the poverty level.
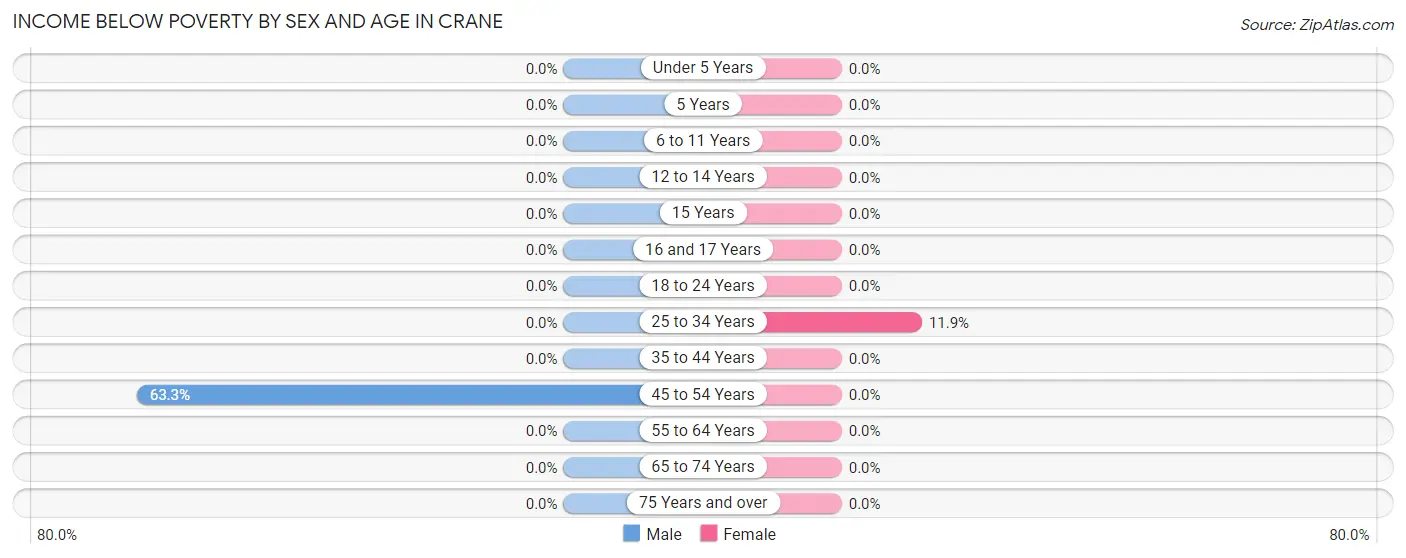
| Age Bracket | Male | Female |
| Under 5 Years | 0 (0.0%) | 0 (0.0%) |
| 5 Years | 0 (0.0%) | 0 (0.0%) |
| 6 to 11 Years | 0 (0.0%) | 0 (0.0%) |
| 12 to 14 Years | 0 (0.0%) | 0 (0.0%) |
| 15 Years | 0 (0.0%) | 0 (0.0%) |
| 16 and 17 Years | 0 (0.0%) | 0 (0.0%) |
| 18 to 24 Years | 0 (0.0%) | 0 (0.0%) |
| 25 to 34 Years | 0 (0.0%) | 5 (11.9%) |
| 35 to 44 Years | 0 (0.0%) | 0 (0.0%) |
| 45 to 54 Years | 19 (63.3%) | 0 (0.0%) |
| 55 to 64 Years | 0 (0.0%) | 0 (0.0%) |
| 65 to 74 Years | 0 (0.0%) | 0 (0.0%) |
| 75 Years and over | 0 (0.0%) | 0 (0.0%) |
| Total | 19 (24.0%) | 5 (6.2%) |
Income Above Poverty by Sex and Age in Crane
According to the poverty statistics in Crane, males aged under 5 years and females aged under 5 years are the age groups that are most secure financially, with 100.0% of males and 100.0% of females in these age groups living above the poverty line.
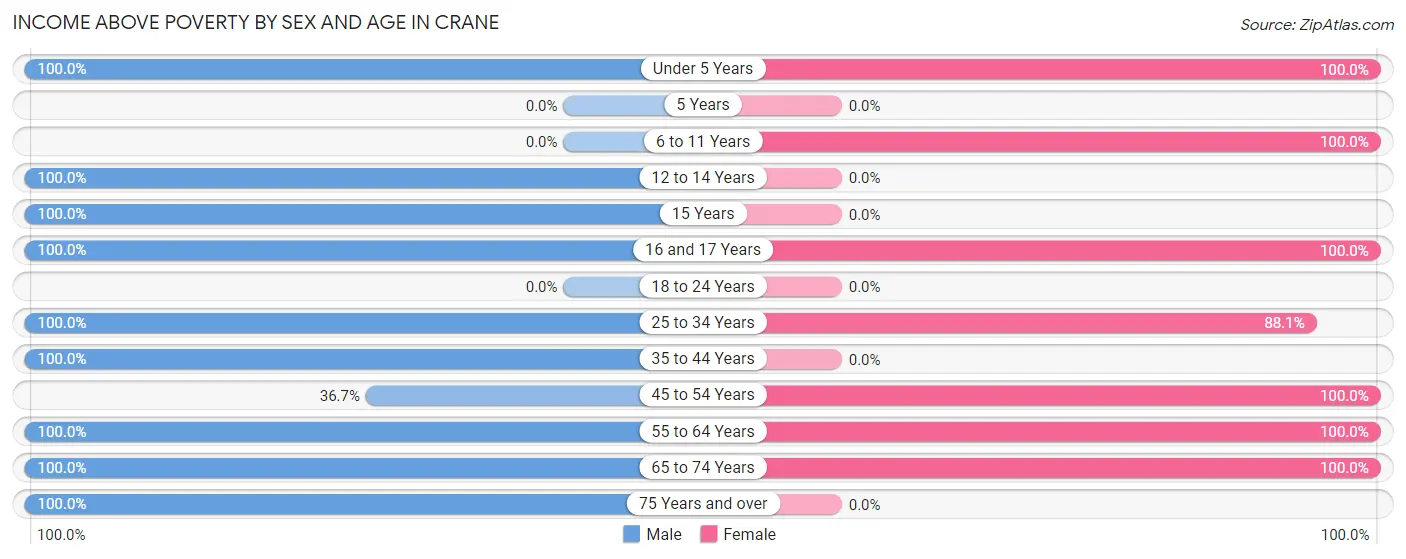
| Age Bracket | Male | Female |
| Under 5 Years | 3 (100.0%) | 4 (100.0%) |
| 5 Years | 0 (0.0%) | 0 (0.0%) |
| 6 to 11 Years | 0 (0.0%) | 2 (100.0%) |
| 12 to 14 Years | 8 (100.0%) | 0 (0.0%) |
| 15 Years | 2 (100.0%) | 0 (0.0%) |
| 16 and 17 Years | 2 (100.0%) | 5 (100.0%) |
| 18 to 24 Years | 0 (0.0%) | 0 (0.0%) |
| 25 to 34 Years | 11 (100.0%) | 37 (88.1%) |
| 35 to 44 Years | 3 (100.0%) | 0 (0.0%) |
| 45 to 54 Years | 11 (36.7%) | 9 (100.0%) |
| 55 to 64 Years | 5 (100.0%) | 16 (100.0%) |
| 65 to 74 Years | 8 (100.0%) | 3 (100.0%) |
| 75 Years and over | 7 (100.0%) | 0 (0.0%) |
| Total | 60 (75.9%) | 76 (93.8%) |
Income Below Poverty Among Married-Couple Families in Crane
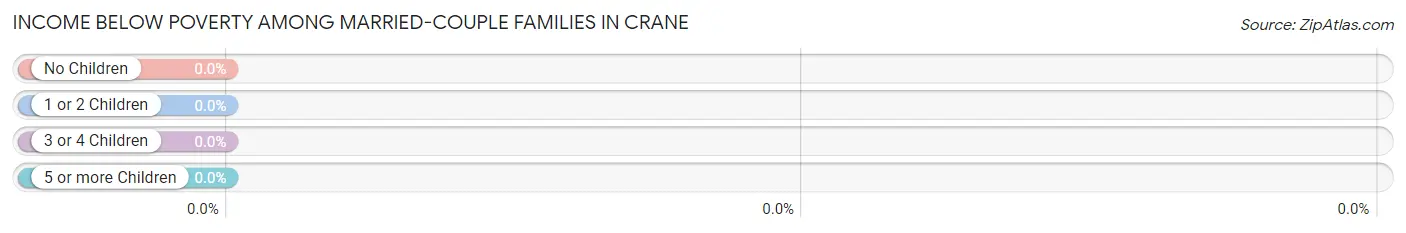
| Children | Above Poverty | Below Poverty |
| No Children | 16 (100.0%) | 0 (0.0%) |
| 1 or 2 Children | 15 (100.0%) | 0 (0.0%) |
| 3 or 4 Children | 0 (0.0%) | 0 (0.0%) |
| 5 or more Children | 0 (0.0%) | 0 (0.0%) |
| Total | 31 (100.0%) | 0 (0.0%) |
Income Below Poverty Among Single-Parent Households in Crane
| Children | Single Father | Single Mother |
| No Children | 0 (0.0%) | 0 (0.0%) |
| 1 or 2 Children | 0 (0.0%) | 0 (0.0%) |
| 3 or 4 Children | 0 (0.0%) | 0 (0.0%) |
| 5 or more Children | 0 (0.0%) | 0 (0.0%) |
| Total | 0 (0.0%) | 0 (0.0%) |
Income Below Poverty Among Married-Couple vs Single-Parent Households in Crane
| Children | Married-Couple Families | Single-Parent Households |
| No Children | 0 (0.0%) | 0 (0.0%) |
| 1 or 2 Children | 0 (0.0%) | 0 (0.0%) |
| 3 or 4 Children | 0 (0.0%) | 0 (0.0%) |
| 5 or more Children | 0 (0.0%) | 0 (0.0%) |
| Total | 0 (0.0%) | 0 (0.0%) |
Race in Crane
The most populous races in Crane are White / Caucasian (157 | 98.1%), and Two or more Races (3 | 1.9%).
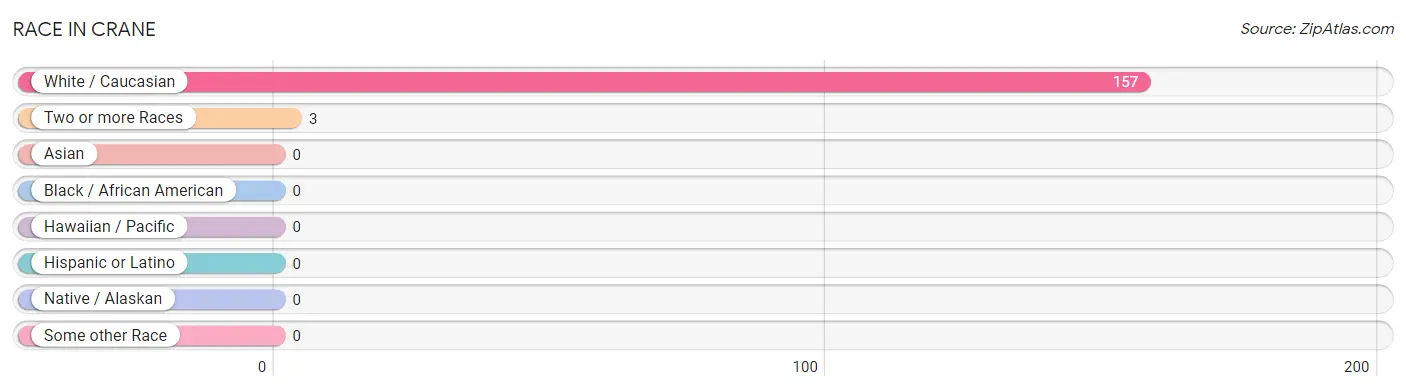
| Race | # Population | % Population |
| Asian | 0 | 0.0% |
| Black / African American | 0 | 0.0% |
| Hawaiian / Pacific | 0 | 0.0% |
| Hispanic or Latino | 0 | 0.0% |
| Native / Alaskan | 0 | 0.0% |
| White / Caucasian | 157 | 98.1% |
| Two or more Races | 3 | 1.9% |
| Some other Race | 0 | 0.0% |
| Total | 160 | 100.0% |
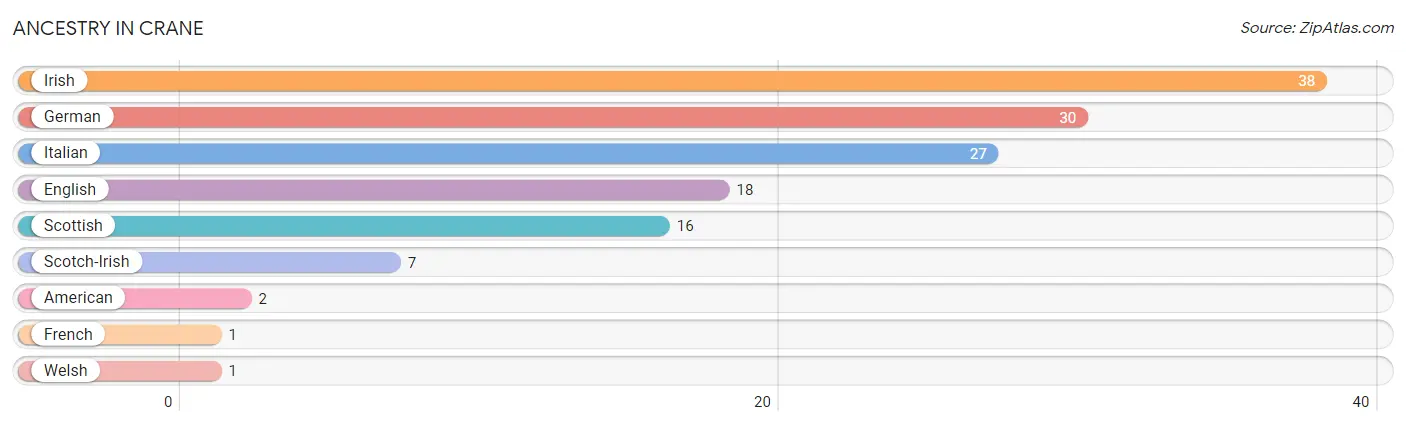
Ancestry in Crane
The most populous ancestries reported in Crane are Irish (38 | 23.7%), German (30 | 18.8%), Italian (27 | 16.9%), English (18 | 11.3%), and Scottish (16 | 10.0%), together accounting for 80.6% of all Crane residents.
| Ancestry | # Population | % Population |
| American | 2 | 1.3% |
| English | 18 | 11.3% |
| French | 1 | 0.6% |
| German | 30 | 18.8% |
| Irish | 38 | 23.7% |
| Italian | 27 | 16.9% |
| Scotch-Irish | 7 | 4.4% |
| Scottish | 16 | 10.0% |
| Welsh | 1 | 0.6% | View All 9 Rows |
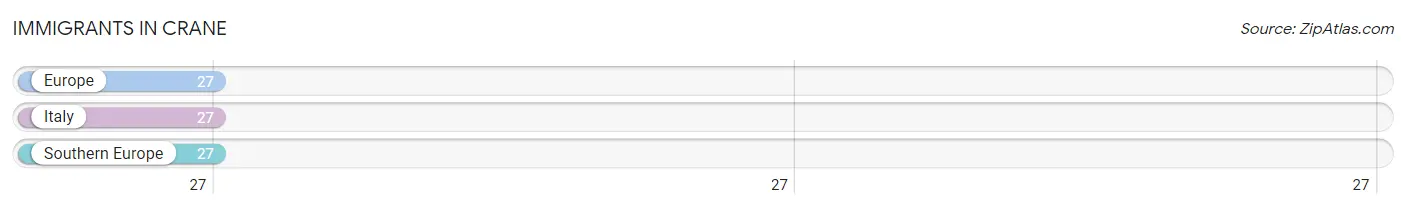
Immigrants in Crane
The most numerous immigrant groups reported in Crane came from Europe (27 | 16.9%), Italy (27 | 16.9%), and Southern Europe (27 | 16.9%), together accounting for 50.6% of all Crane residents.
| Immigration Origin | # Population | % Population |
| Europe | 27 | 16.9% |
| Italy | 27 | 16.9% |
| Southern Europe | 27 | 16.9% | View All 3 Rows |
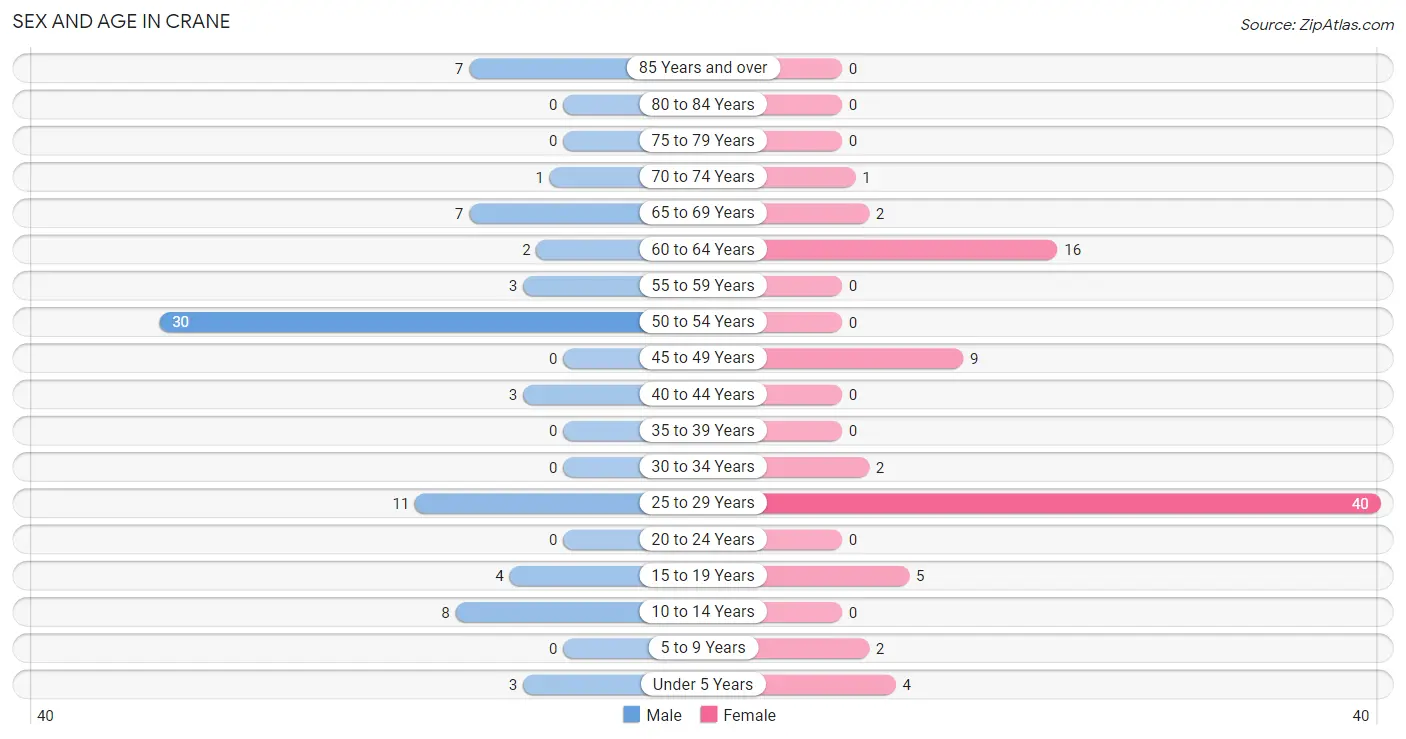
Sex and Age in Crane
Sex and Age in Crane
The most populous age groups in Crane are 50 to 54 Years (30 | 38.0%) for men and 25 to 29 Years (40 | 49.4%) for women.
| Age Bracket | Male | Female |
| Under 5 Years | 3 (3.8%) | 4 (4.9%) |
| 5 to 9 Years | 0 (0.0%) | 2 (2.5%) |
| 10 to 14 Years | 8 (10.1%) | 0 (0.0%) |
| 15 to 19 Years | 4 (5.1%) | 5 (6.2%) |
| 20 to 24 Years | 0 (0.0%) | 0 (0.0%) |
| 25 to 29 Years | 11 (13.9%) | 40 (49.4%) |
| 30 to 34 Years | 0 (0.0%) | 2 (2.5%) |
| 35 to 39 Years | 0 (0.0%) | 0 (0.0%) |
| 40 to 44 Years | 3 (3.8%) | 0 (0.0%) |
| 45 to 49 Years | 0 (0.0%) | 9 (11.1%) |
| 50 to 54 Years | 30 (38.0%) | 0 (0.0%) |
| 55 to 59 Years | 3 (3.8%) | 0 (0.0%) |
| 60 to 64 Years | 2 (2.5%) | 16 (19.8%) |
| 65 to 69 Years | 7 (8.9%) | 2 (2.5%) |
| 70 to 74 Years | 1 (1.3%) | 1 (1.2%) |
| 75 to 79 Years | 0 (0.0%) | 0 (0.0%) |
| 80 to 84 Years | 0 (0.0%) | 0 (0.0%) |
| 85 Years and over | 7 (8.9%) | 0 (0.0%) |
| Total | 79 (100.0%) | 81 (100.0%) |
Families and Households in Crane
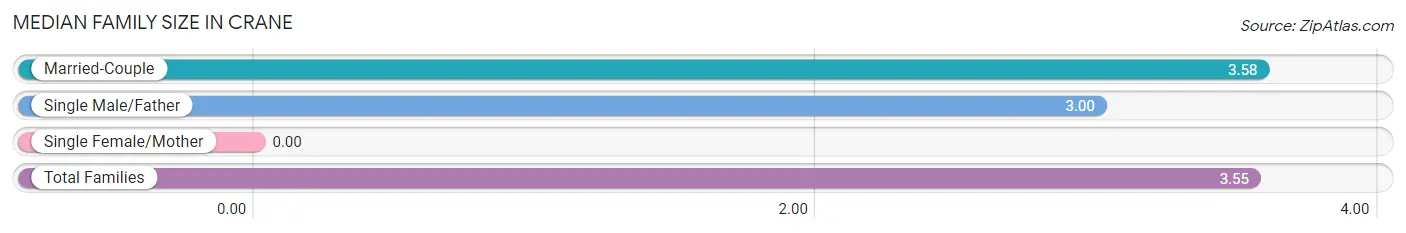
Median Family Size in Crane
| Family Type | # Families | Family Size |
| Married-Couple | 31 (93.9%) | 3.58 |
| Single Male/Father | 2 (6.1%) | 3.00 |
| Single Female/Mother | 0 (0.0%) | - |
| Total Families | 33 (100.0%) | 3.55 |
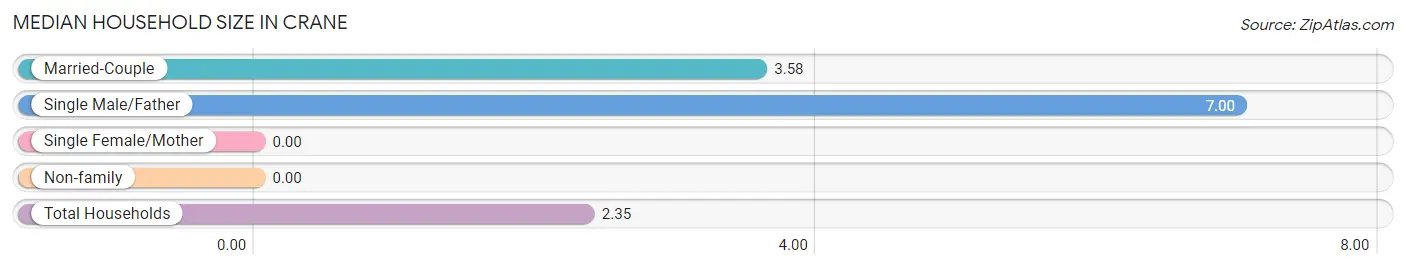
Median Household Size in Crane
| Household Type | # Households | Household Size |
| Married-Couple | 31 (45.6%) | 3.58 |
| Single Male/Father | 2 (2.9%) | 7.00 |
| Single Female/Mother | 0 (0.0%) | - |
| Non-family | 35 (51.5%) | - |
| Total Households | 68 (100.0%) | 2.35 |
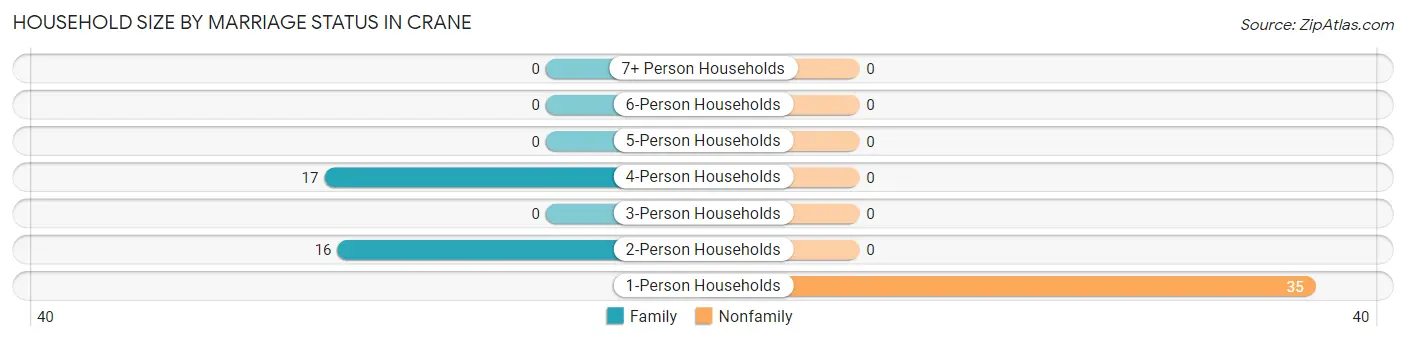
Household Size by Marriage Status in Crane
Out of a total of 68 households in Crane, 33 (48.5%) are family households, while 35 (51.5%) are nonfamily households. The most numerous type of family households are 4-person households, comprising 17, and the most common type of nonfamily households are 1-person households, comprising 35.
| Household Size | Family Households | Nonfamily Households |
| 1-Person Households | - | 35 (51.5%) |
| 2-Person Households | 16 (23.5%) | 0 (0.0%) |
| 3-Person Households | 0 (0.0%) | 0 (0.0%) |
| 4-Person Households | 17 (25.0%) | 0 (0.0%) |
| 5-Person Households | 0 (0.0%) | 0 (0.0%) |
| 6-Person Households | 0 (0.0%) | 0 (0.0%) |
| 7+ Person Households | 0 (0.0%) | 0 (0.0%) |
| Total | 33 (48.5%) | 35 (51.5%) |
Female Fertility in Crane
Fertility by Age in Crane
| Age Bracket | Women with Births | Births / 1,000 Women |
| 15 to 19 years | 0 (0.0%) | 0.0 |
| 20 to 34 years | 0 (0.0%) | 0.0 |
| 35 to 50 years | 0 (0.0%) | 0.0 |
| Total | 0 (0.0%) | 0.0 |
Fertility by Age by Marriage Status in Crane
| Age Bracket | Married | Unmarried |
| 15 to 19 years | 0 (0.0%) | 0 (0.0%) |
| 20 to 34 years | 0 (0.0%) | 0 (0.0%) |
| 35 to 50 years | 0 (0.0%) | 0 (0.0%) |
| Total | 0 (0.0%) | 0 (0.0%) |
Fertility by Education in Crane
| Educational Attainment | Women with Births | Births / 1,000 Women |
| Less than High School | 0 (0.0%) | 0.0 |
| High School Diploma | 0 (0.0%) | 0.0 |
| College or Associate's Degree | 0 (0.0%) | 0.0 |
| Bachelor's Degree | 0 (0.0%) | 0.0 |
| Graduate Degree | 0 (0.0%) | 0.0 |
| Total | 0 (0.0%) | 0.0 |
Fertility by Education by Marriage Status in Crane
| Educational Attainment | Married | Unmarried |
| Less than High School | 0 (0.0%) | 0 (0.0%) |
| High School Diploma | 0 (0.0%) | 0 (0.0%) |
| College or Associate's Degree | 0 (0.0%) | 0 (0.0%) |
| Bachelor's Degree | 0 (0.0%) | 0 (0.0%) |
| Graduate Degree | 0 (0.0%) | 0 (0.0%) |
| Total | 0 (0.0%) | 0 (0.0%) |
Employment Characteristics in Crane
Employment by Class of Employer in Crane
Among the 82 employed individuals in Crane, private company employees (72 | 87.8%), local government employees (5 | 6.1%), and self-employed (not incorporated) (3 | 3.7%) make up the most common classes of employment.
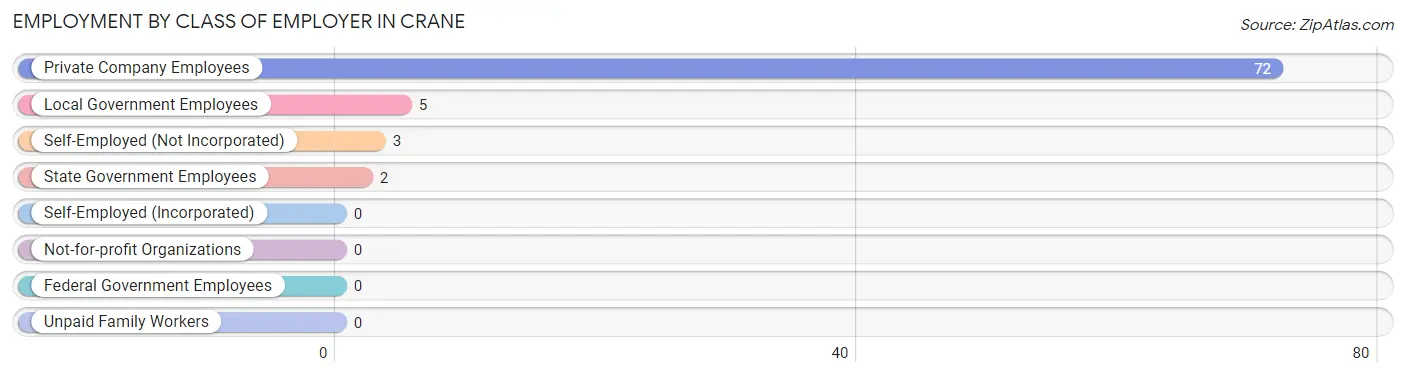
| Employer Class | # Employees | % Employees |
| Private Company Employees | 72 | 87.8% |
| Self-Employed (Incorporated) | 0 | 0.0% |
| Self-Employed (Not Incorporated) | 3 | 3.7% |
| Not-for-profit Organizations | 0 | 0.0% |
| Local Government Employees | 5 | 6.1% |
| State Government Employees | 2 | 2.4% |
| Federal Government Employees | 0 | 0.0% |
| Unpaid Family Workers | 0 | 0.0% |
| Total | 82 | 100.0% |
Employment Status by Age in Crane
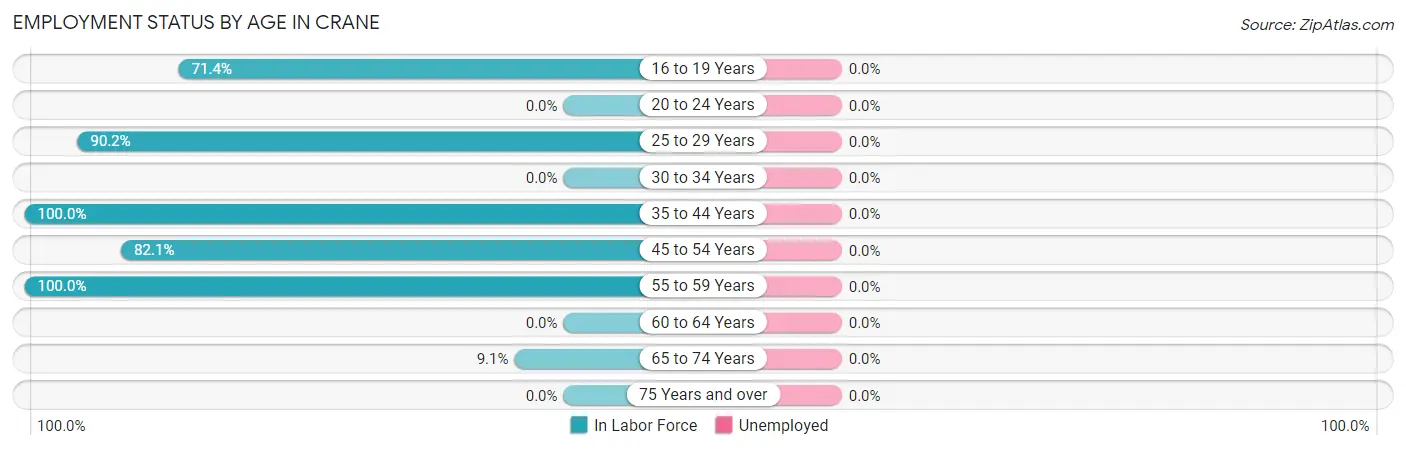
| Age Bracket | In Labor Force | Unemployed |
| 16 to 19 Years | 5 (71.4%) | 0 (0.0%) |
| 20 to 24 Years | 0 (0.0%) | 0 (0.0%) |
| 25 to 29 Years | 46 (90.2%) | 0 (0.0%) |
| 30 to 34 Years | 0 (0.0%) | 0 (0.0%) |
| 35 to 44 Years | 3 (100.0%) | 0 (0.0%) |
| 45 to 54 Years | 32 (82.1%) | 0 (0.0%) |
| 55 to 59 Years | 3 (100.0%) | 0 (0.0%) |
| 60 to 64 Years | 0 (0.0%) | 0 (0.0%) |
| 65 to 74 Years | 1 (9.1%) | 0 (0.0%) |
| 75 Years and over | 0 (0.0%) | 0 (0.0%) |
| Total | 90 (63.8%) | 0 (0.0%) |
Employment Status by Educational Attainment in Crane
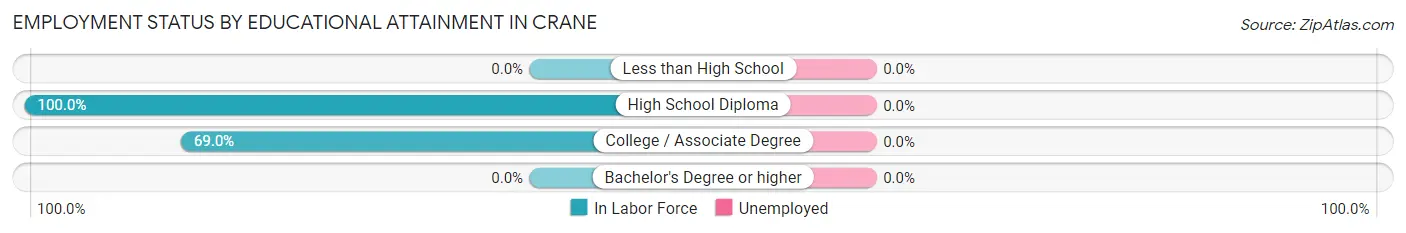
| Educational Attainment | In Labor Force | Unemployed |
| Less than High School | 0 (0.0%) | 0 (0.0%) |
| High School Diploma | 64 (100.0%) | 0 (0.0%) |
| College / Associate Degree | 20 (69.0%) | 0 (0.0%) |
| Bachelor's Degree or higher | 0 (0.0%) | 0 (0.0%) |
| Total | 84 (72.4%) | 0 (0.0%) |
Employment Occupations by Sex in Crane
Management, Business, Science and Arts Occupations
The most common Management, Business, Science and Arts occupations in Crane are , and Management (1 | 1.1%).
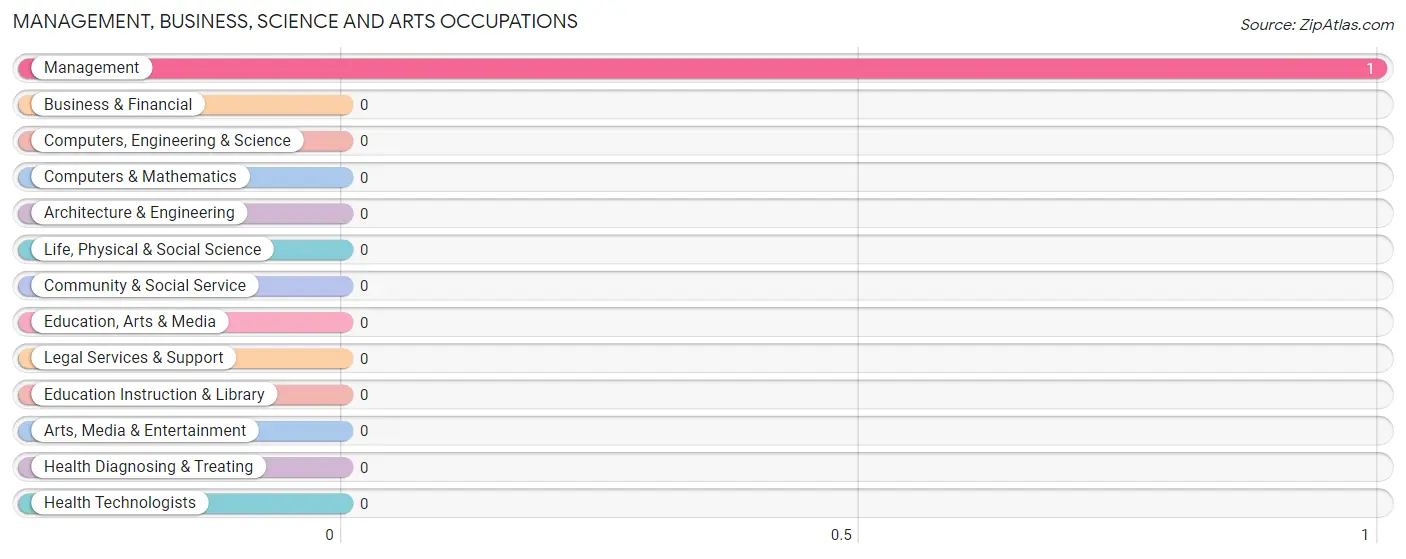
Management, Business, Science and Arts Occupations by Sex
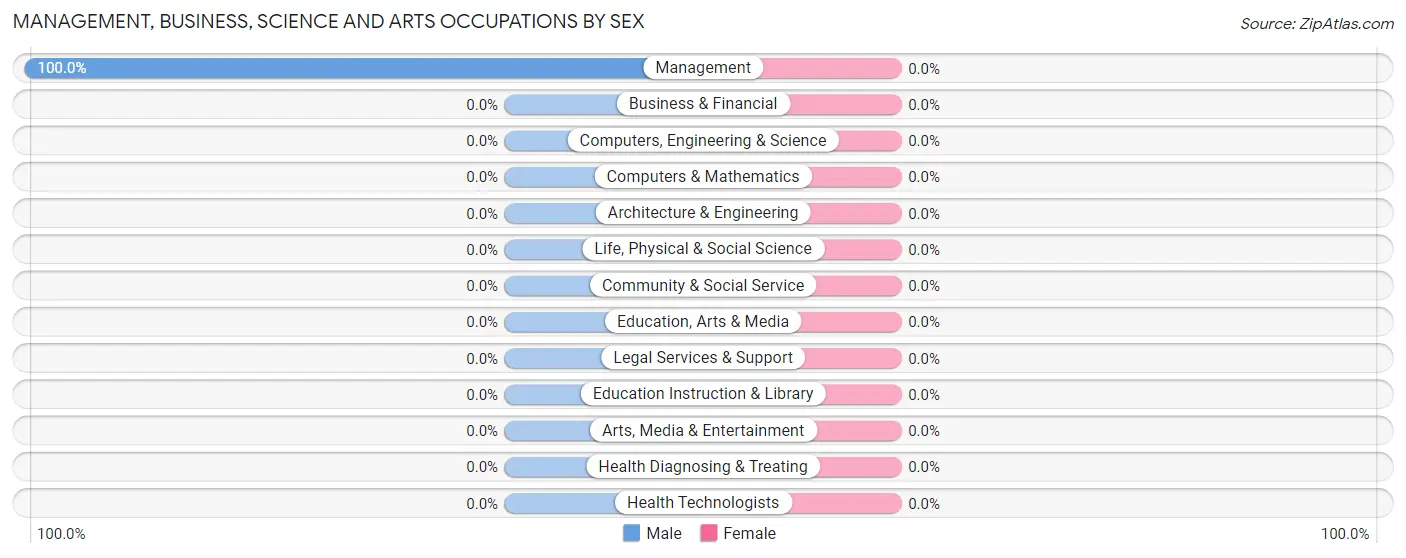
| Occupation | Male | Female |
| Management | 1 (100.0%) | 0 (0.0%) |
| Business & Financial | 0 (0.0%) | 0 (0.0%) |
| Computers, Engineering & Science | 0 (0.0%) | 0 (0.0%) |
| Computers & Mathematics | 0 (0.0%) | 0 (0.0%) |
| Architecture & Engineering | 0 (0.0%) | 0 (0.0%) |
| Life, Physical & Social Science | 0 (0.0%) | 0 (0.0%) |
| Community & Social Service | 0 (0.0%) | 0 (0.0%) |
| Education, Arts & Media | 0 (0.0%) | 0 (0.0%) |
| Legal Services & Support | 0 (0.0%) | 0 (0.0%) |
| Education Instruction & Library | 0 (0.0%) | 0 (0.0%) |
| Arts, Media & Entertainment | 0 (0.0%) | 0 (0.0%) |
| Health Diagnosing & Treating | 0 (0.0%) | 0 (0.0%) |
| Health Technologists | 0 (0.0%) | 0 (0.0%) |
| Total (Category) | 1 (100.0%) | 0 (0.0%) |
| Total (Overall) | 48 (53.3%) | 42 (46.7%) |
Services Occupations
The most common Services occupations in Crane are Food Preparation & Serving (27 | 30.0%), and Cleaning & Maintenance (16 | 17.8%).
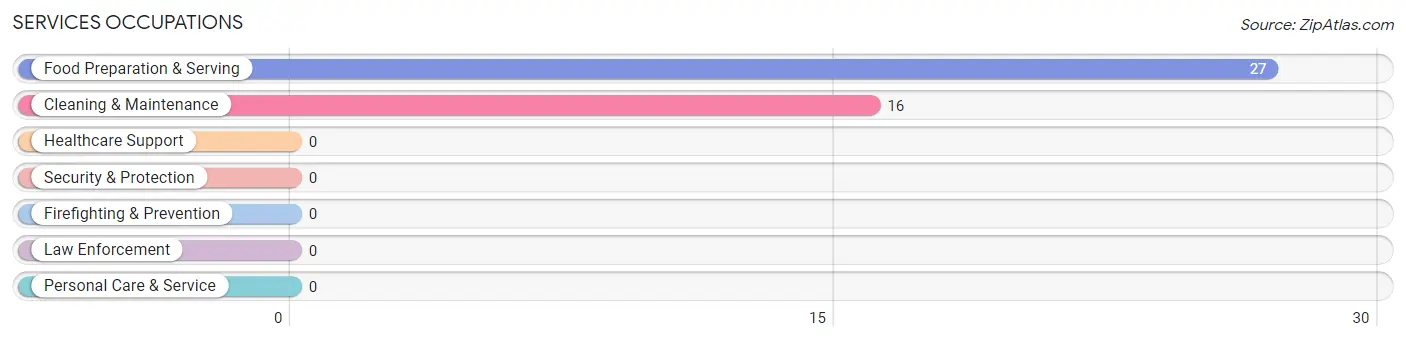
Services Occupations by Sex
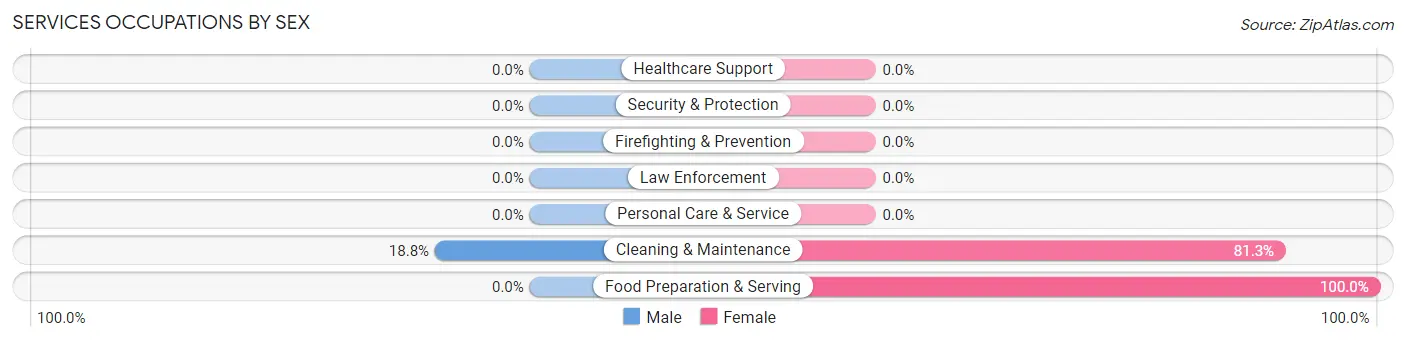
| Occupation | Male | Female |
| Healthcare Support | 0 (0.0%) | 0 (0.0%) |
| Security & Protection | 0 (0.0%) | 0 (0.0%) |
| Firefighting & Prevention | 0 (0.0%) | 0 (0.0%) |
| Law Enforcement | 0 (0.0%) | 0 (0.0%) |
| Food Preparation & Serving | 0 (0.0%) | 27 (100.0%) |
| Cleaning & Maintenance | 3 (18.8%) | 13 (81.2%) |
| Personal Care & Service | 0 (0.0%) | 0 (0.0%) |
| Total (Category) | 3 (7.0%) | 40 (93.0%) |
| Total (Overall) | 48 (53.3%) | 42 (46.7%) |
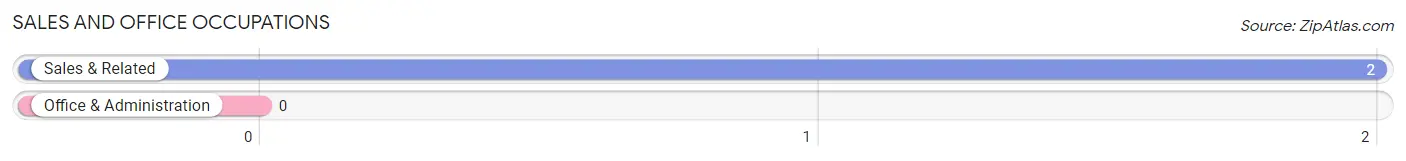
Sales and Office Occupations
The most common Sales and Office occupations in Crane are , and Sales & Related (2 | 2.2%).
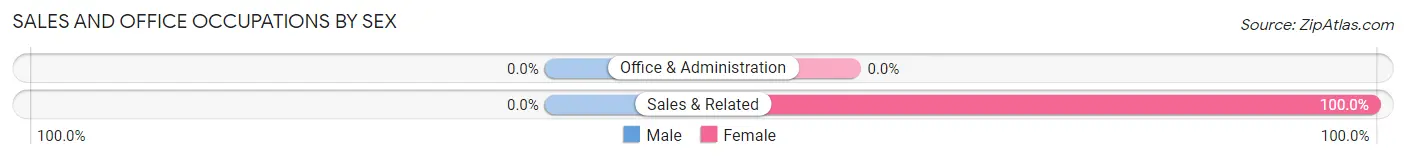
Sales and Office Occupations by Sex
| Occupation | Male | Female |
| Sales & Related | 0 (0.0%) | 2 (100.0%) |
| Office & Administration | 0 (0.0%) | 0 (0.0%) |
| Total (Category) | 0 (0.0%) | 2 (100.0%) |
| Total (Overall) | 48 (53.3%) | 42 (46.7%) |
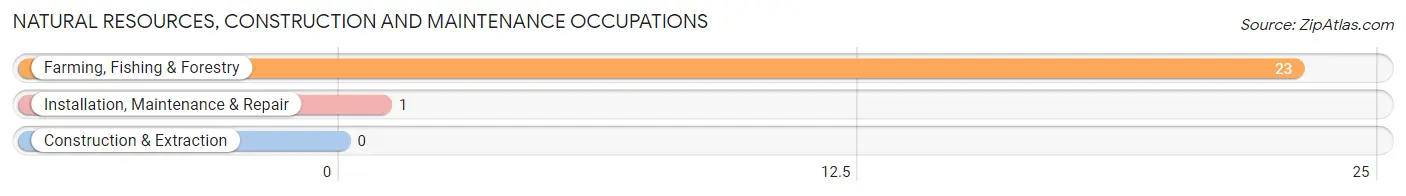
Natural Resources, Construction and Maintenance Occupations
The most common Natural Resources, Construction and Maintenance occupations in Crane are Farming, Fishing & Forestry (23 | 25.6%), and Installation, Maintenance & Repair (1 | 1.1%).
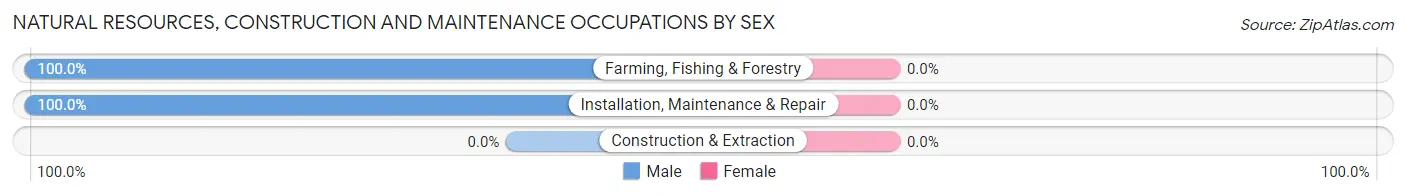
Natural Resources, Construction and Maintenance Occupations by Sex
| Occupation | Male | Female |
| Farming, Fishing & Forestry | 23 (100.0%) | 0 (0.0%) |
| Construction & Extraction | 0 (0.0%) | 0 (0.0%) |
| Installation, Maintenance & Repair | 1 (100.0%) | 0 (0.0%) |
| Total (Category) | 24 (100.0%) | 0 (0.0%) |
| Total (Overall) | 48 (53.3%) | 42 (46.7%) |
Production, Transportation and Moving Occupations
The most common Production, Transportation and Moving occupations in Crane are Material Moving (13 | 14.4%), and Transportation (7 | 7.8%).
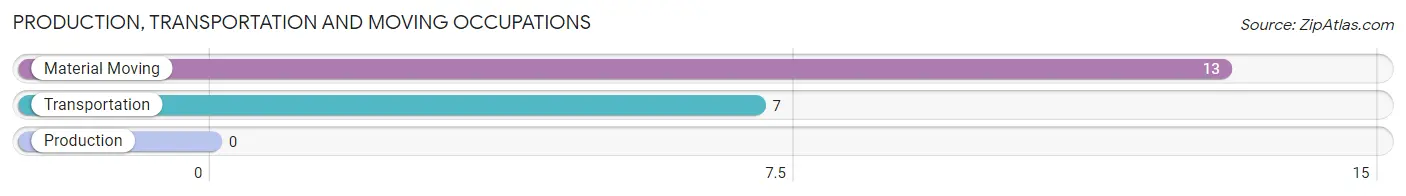
Production, Transportation and Moving Occupations by Sex
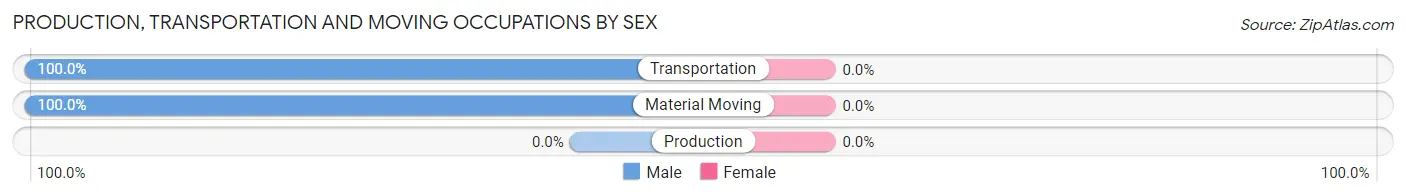
| Occupation | Male | Female |
| Production | 0 (0.0%) | 0 (0.0%) |
| Transportation | 7 (100.0%) | 0 (0.0%) |
| Material Moving | 13 (100.0%) | 0 (0.0%) |
| Total (Category) | 20 (100.0%) | 0 (0.0%) |
| Total (Overall) | 48 (53.3%) | 42 (46.7%) |
Employment Industries by Sex in Crane
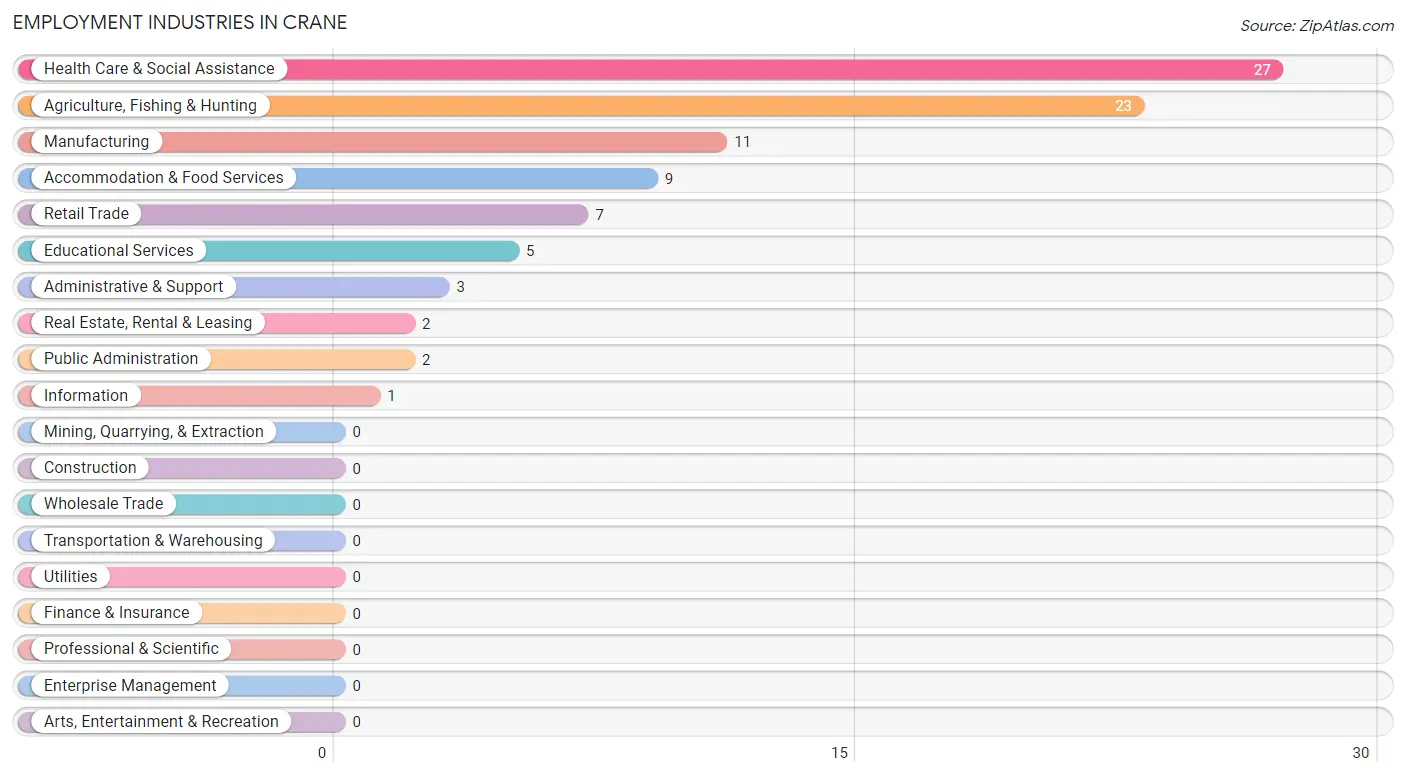
Employment Industries in Crane
The major employment industries in Crane include Health Care & Social Assistance (27 | 30.0%), Agriculture, Fishing & Hunting (23 | 25.6%), Manufacturing (11 | 12.2%), Accommodation & Food Services (9 | 10.0%), and Retail Trade (7 | 7.8%).
Employment Industries by Sex in Crane
The Crane industries that see more men than women are Agriculture, Fishing & Hunting (100.0%), Manufacturing (100.0%), and Retail Trade (100.0%), whereas the industries that tend to have a higher number of women are Real Estate, Rental & Leasing (100.0%), Educational Services (100.0%), and Health Care & Social Assistance (100.0%).
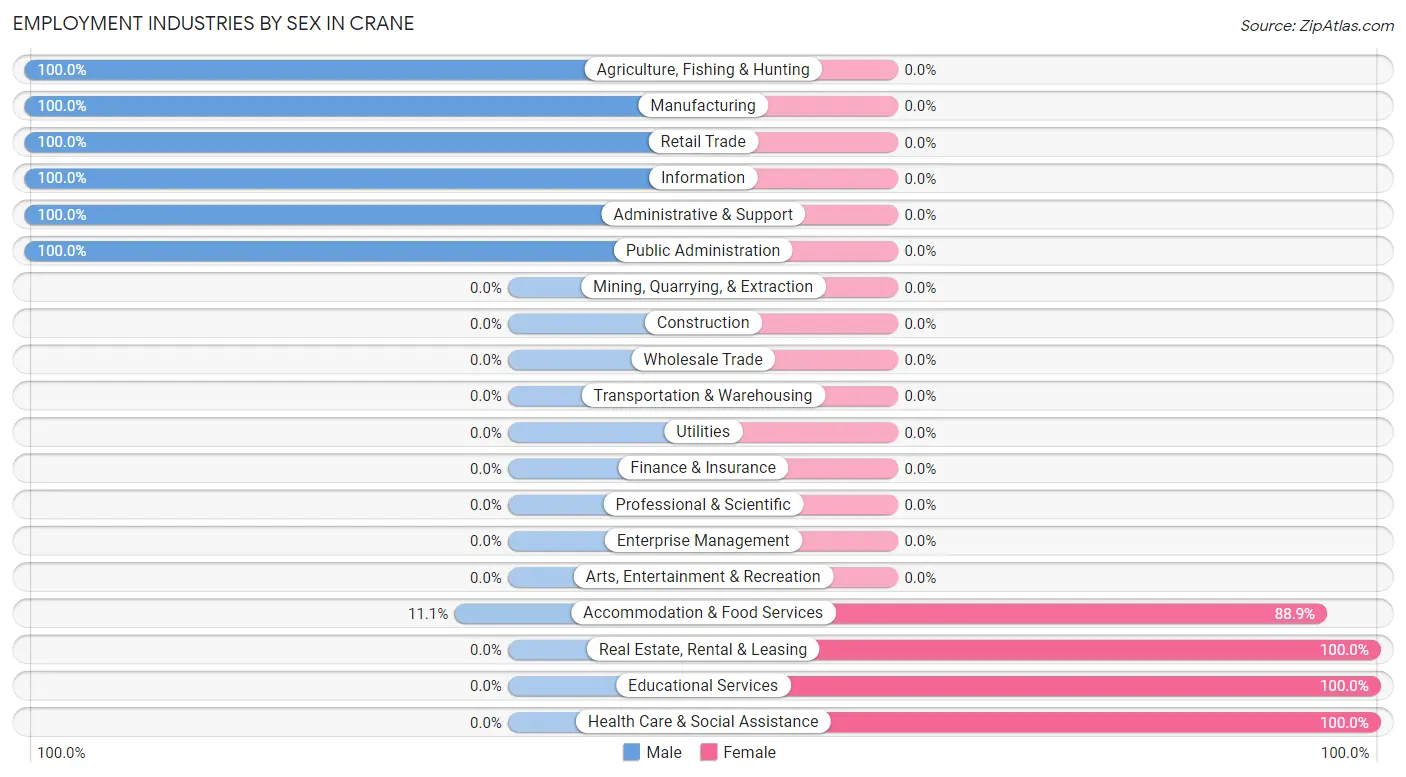
| Industry | Male | Female |
| Agriculture, Fishing & Hunting | 23 (100.0%) | 0 (0.0%) |
| Mining, Quarrying, & Extraction | 0 (0.0%) | 0 (0.0%) |
| Construction | 0 (0.0%) | 0 (0.0%) |
| Manufacturing | 11 (100.0%) | 0 (0.0%) |
| Wholesale Trade | 0 (0.0%) | 0 (0.0%) |
| Retail Trade | 7 (100.0%) | 0 (0.0%) |
| Transportation & Warehousing | 0 (0.0%) | 0 (0.0%) |
| Utilities | 0 (0.0%) | 0 (0.0%) |
| Information | 1 (100.0%) | 0 (0.0%) |
| Finance & Insurance | 0 (0.0%) | 0 (0.0%) |
| Real Estate, Rental & Leasing | 0 (0.0%) | 2 (100.0%) |
| Professional & Scientific | 0 (0.0%) | 0 (0.0%) |
| Enterprise Management | 0 (0.0%) | 0 (0.0%) |
| Administrative & Support | 3 (100.0%) | 0 (0.0%) |
| Educational Services | 0 (0.0%) | 5 (100.0%) |
| Health Care & Social Assistance | 0 (0.0%) | 27 (100.0%) |
| Arts, Entertainment & Recreation | 0 (0.0%) | 0 (0.0%) |
| Accommodation & Food Services | 1 (11.1%) | 8 (88.9%) |
| Public Administration | 2 (100.0%) | 0 (0.0%) |
| Total | 48 (53.3%) | 42 (46.7%) |
Education in Crane
School Enrollment in Crane
The most common levels of schooling among the 21 students in Crane are middle school (8 | 38.1%), high school (7 | 33.3%), and nursery / preschool (4 | 19.1%).
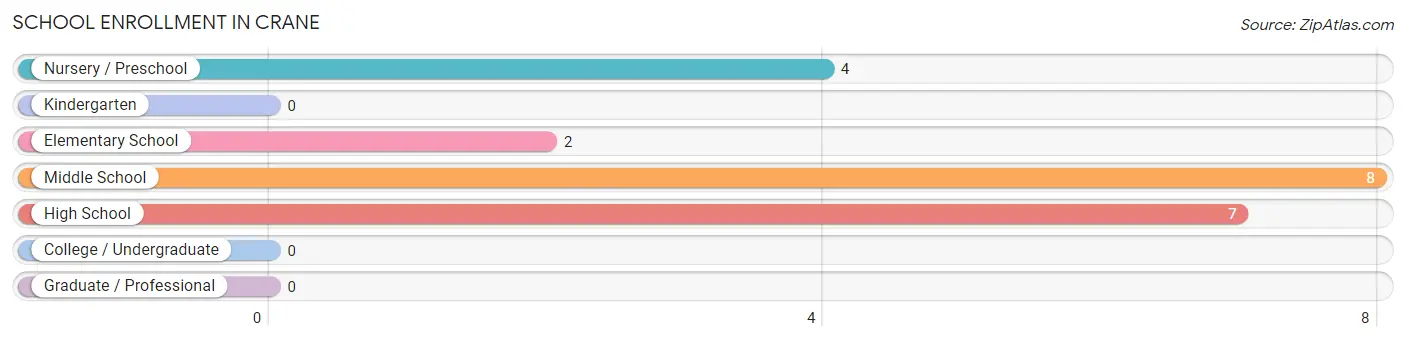
| School Level | # Students | % Students |
| Nursery / Preschool | 4 | 19.1% |
| Kindergarten | 0 | 0.0% |
| Elementary School | 2 | 9.5% |
| Middle School | 8 | 38.1% |
| High School | 7 | 33.3% |
| College / Undergraduate | 0 | 0.0% |
| Graduate / Professional | 0 | 0.0% |
| Total | 21 | 100.0% |
School Enrollment by Age by Funding Source in Crane
Out of a total of 21 students who are enrolled in schools in Crane, 2 (9.5%) attend a private institution, while the remaining 19 (90.5%) are enrolled in public schools. The age group of 3 to 4 year olds has the highest likelihood of being enrolled in private schools, with 2 (50.0% in the age bracket) enrolled. Conversely, the age group of 5 to 9 year old has the lowest likelihood of being enrolled in a private school, with 2 (100.0% in the age bracket) attending a public institution.
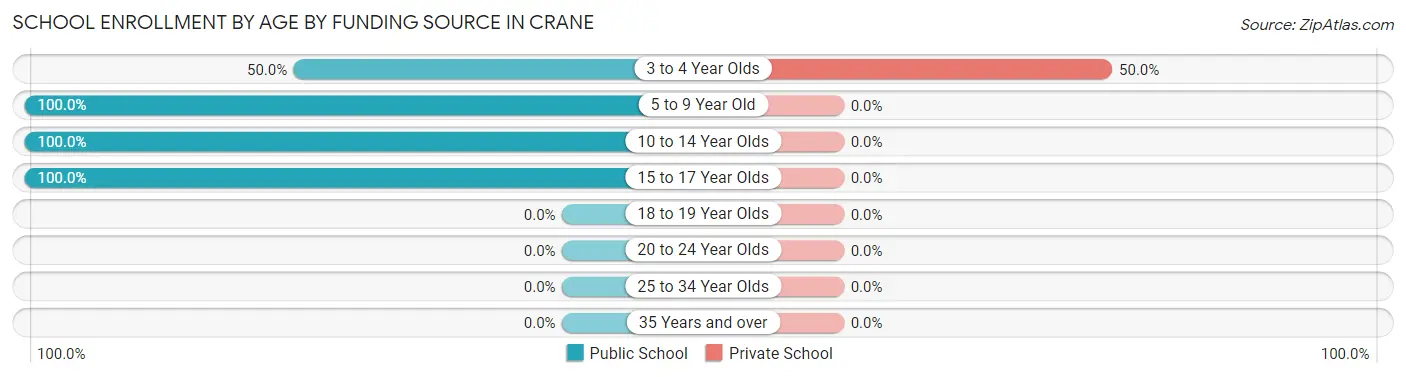
| Age Bracket | Public School | Private School |
| 3 to 4 Year Olds | 2 (50.0%) | 2 (50.0%) |
| 5 to 9 Year Old | 2 (100.0%) | 0 (0.0%) |
| 10 to 14 Year Olds | 8 (100.0%) | 0 (0.0%) |
| 15 to 17 Year Olds | 7 (100.0%) | 0 (0.0%) |
| 18 to 19 Year Olds | 0 (0.0%) | 0 (0.0%) |
| 20 to 24 Year Olds | 0 (0.0%) | 0 (0.0%) |
| 25 to 34 Year Olds | 0 (0.0%) | 0 (0.0%) |
| 35 Years and over | 0 (0.0%) | 0 (0.0%) |
| Total | 19 (90.5%) | 2 (9.5%) |
Educational Attainment by Field of Study in Crane
, and literature & languages (5 | 100.0%) are the most common fields of study among 5 individuals in Crane who have obtained a bachelor's degree or higher.
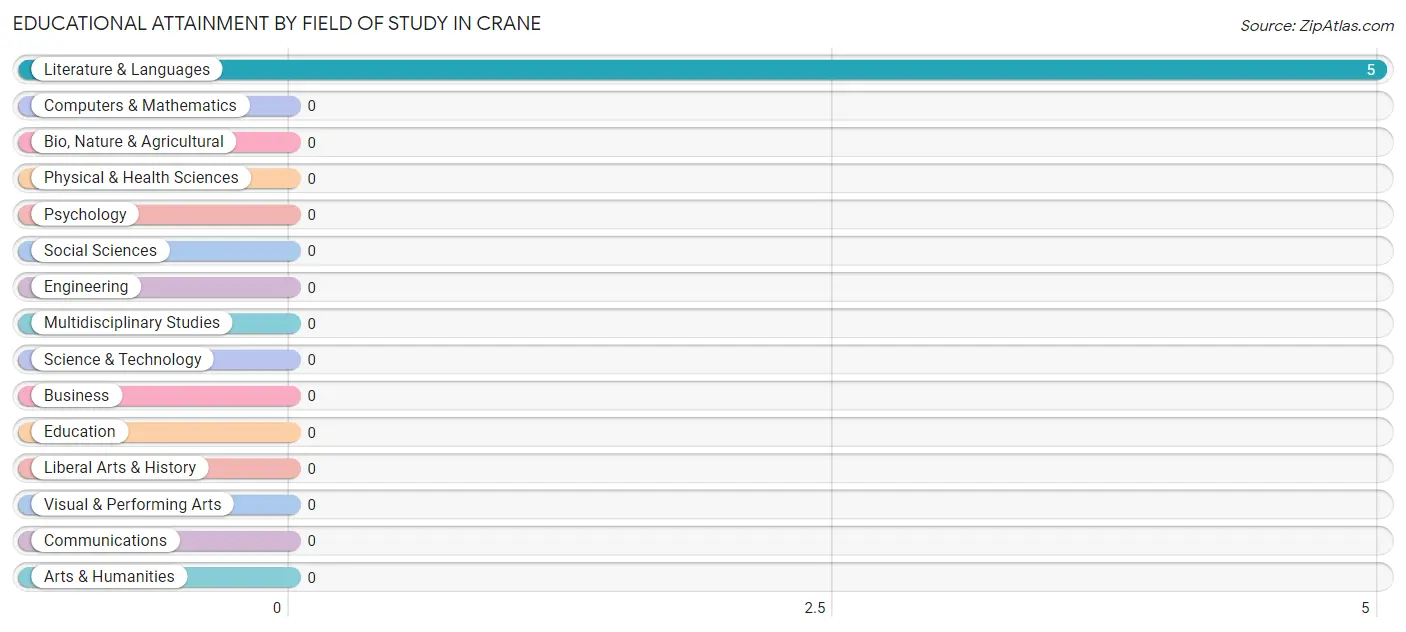
| Field of Study | # Graduates | % Graduates |
| Computers & Mathematics | 0 | 0.0% |
| Bio, Nature & Agricultural | 0 | 0.0% |
| Physical & Health Sciences | 0 | 0.0% |
| Psychology | 0 | 0.0% |
| Social Sciences | 0 | 0.0% |
| Engineering | 0 | 0.0% |
| Multidisciplinary Studies | 0 | 0.0% |
| Science & Technology | 0 | 0.0% |
| Business | 0 | 0.0% |
| Education | 0 | 0.0% |
| Literature & Languages | 5 | 100.0% |
| Liberal Arts & History | 0 | 0.0% |
| Visual & Performing Arts | 0 | 0.0% |
| Communications | 0 | 0.0% |
| Arts & Humanities | 0 | 0.0% |
| Total | 5 | 100.0% |
Transportation & Commute in Crane
Vehicle Availability by Sex in Crane
The most prevalent vehicle ownership categories in Crane are males with 3 vehicles (23, accounting for 47.9%) and females with 3 vehicles (0, making up 67.6%).
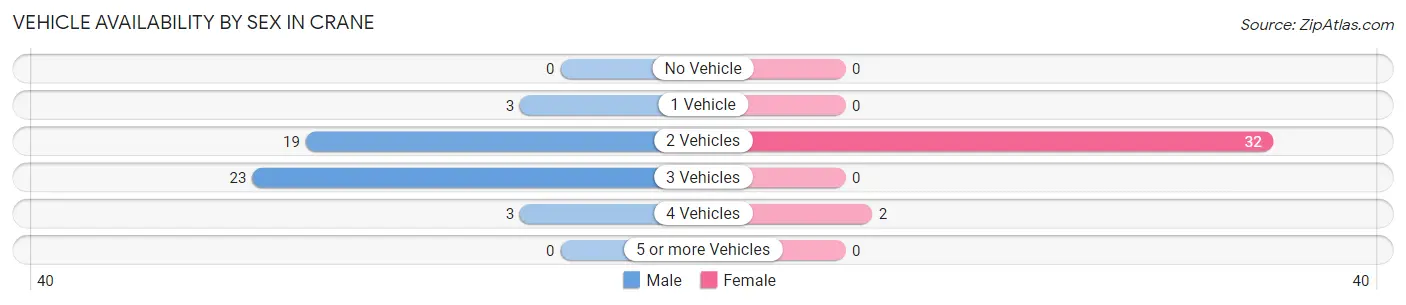
| Vehicles Available | Male | Female |
| No Vehicle | 0 (0.0%) | 0 (0.0%) |
| 1 Vehicle | 3 (6.2%) | 0 (0.0%) |
| 2 Vehicles | 19 (39.6%) | 32 (94.1%) |
| 3 Vehicles | 23 (47.9%) | 0 (0.0%) |
| 4 Vehicles | 3 (6.2%) | 2 (5.9%) |
| 5 or more Vehicles | 0 (0.0%) | 0 (0.0%) |
| Total | 48 (100.0%) | 34 (100.0%) |
Commute Time in Crane
The most frequently occuring commute durations in Crane are 30 to 34 minutes (34 commuters, 44.2%), 5 to 9 minutes (20 commuters, 26.0%), and 20 to 24 minutes (18 commuters, 23.4%).
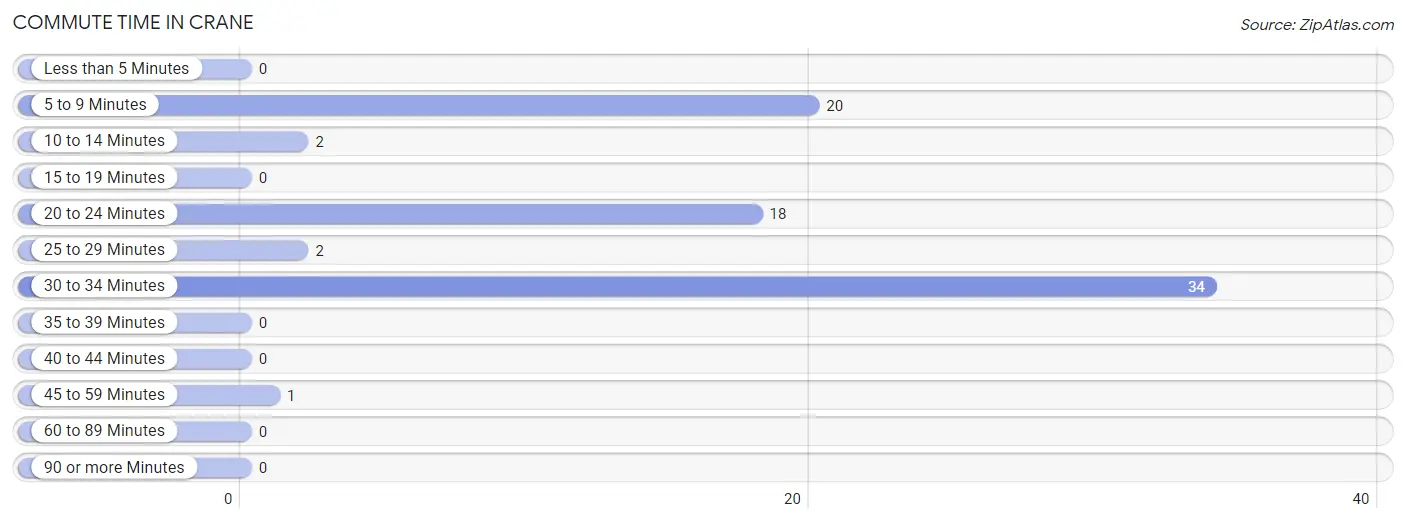
| Commute Time | # Commuters | % Commuters |
| Less than 5 Minutes | 0 | 0.0% |
| 5 to 9 Minutes | 20 | 26.0% |
| 10 to 14 Minutes | 2 | 2.6% |
| 15 to 19 Minutes | 0 | 0.0% |
| 20 to 24 Minutes | 18 | 23.4% |
| 25 to 29 Minutes | 2 | 2.6% |
| 30 to 34 Minutes | 34 | 44.2% |
| 35 to 39 Minutes | 0 | 0.0% |
| 40 to 44 Minutes | 0 | 0.0% |
| 45 to 59 Minutes | 1 | 1.3% |
| 60 to 89 Minutes | 0 | 0.0% |
| 90 or more Minutes | 0 | 0.0% |
Commute Time by Sex in Crane
The most common commute times in Crane are 5 to 9 minutes (20 commuters, 44.4%) for males and 30 to 34 minutes (32 commuters, 100.0%) for females.
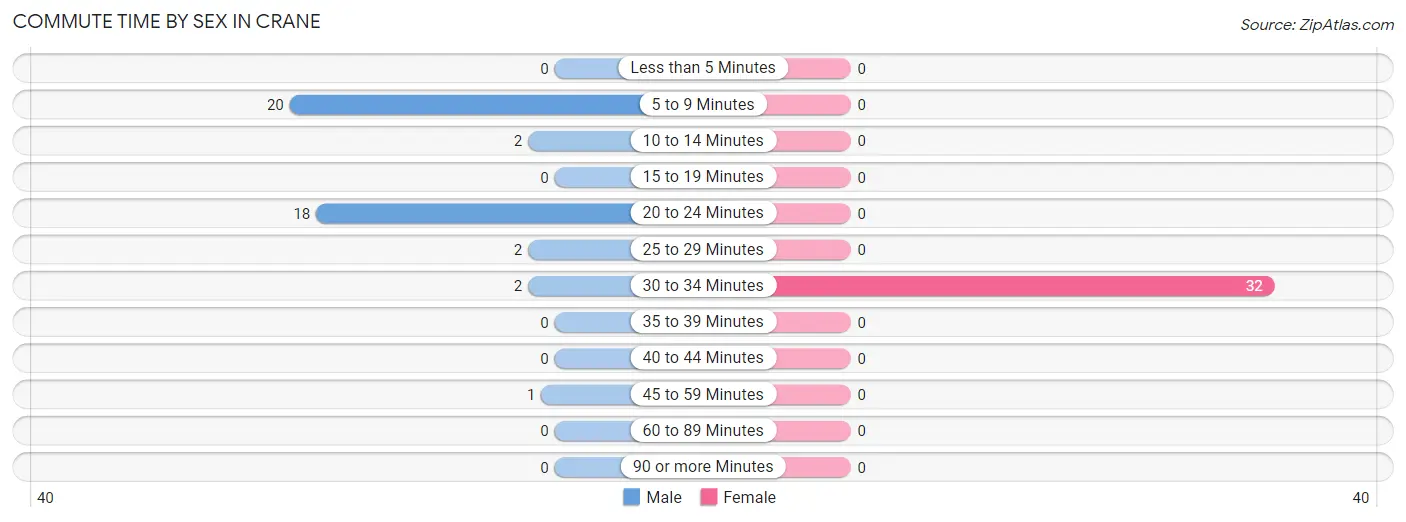
| Commute Time | Male | Female |
| Less than 5 Minutes | 0 (0.0%) | 0 (0.0%) |
| 5 to 9 Minutes | 20 (44.4%) | 0 (0.0%) |
| 10 to 14 Minutes | 2 (4.4%) | 0 (0.0%) |
| 15 to 19 Minutes | 0 (0.0%) | 0 (0.0%) |
| 20 to 24 Minutes | 18 (40.0%) | 0 (0.0%) |
| 25 to 29 Minutes | 2 (4.4%) | 0 (0.0%) |
| 30 to 34 Minutes | 2 (4.4%) | 32 (100.0%) |
| 35 to 39 Minutes | 0 (0.0%) | 0 (0.0%) |
| 40 to 44 Minutes | 0 (0.0%) | 0 (0.0%) |
| 45 to 59 Minutes | 1 (2.2%) | 0 (0.0%) |
| 60 to 89 Minutes | 0 (0.0%) | 0 (0.0%) |
| 90 or more Minutes | 0 (0.0%) | 0 (0.0%) |
Time of Departure to Work by Sex in Crane
The most frequent times of departure to work in Crane are 10:00 AM to 10:59 AM (19, 42.2%) for males and 6:30 AM to 6:59 AM (32, 100.0%) for females.
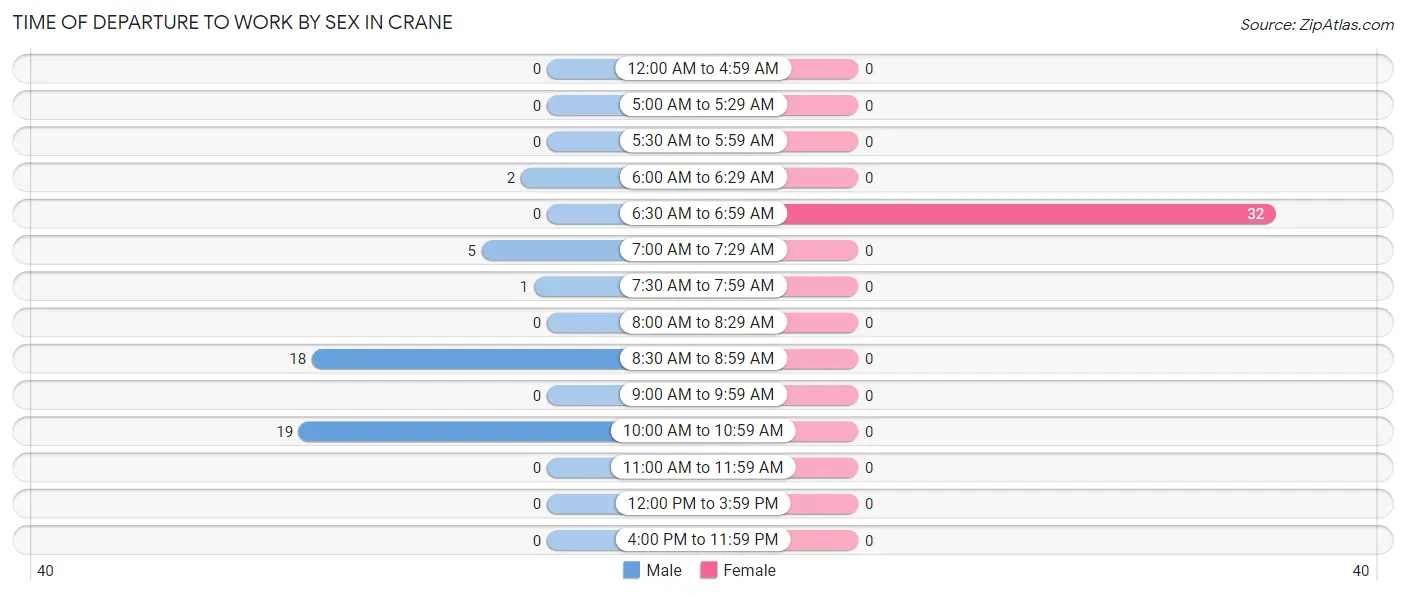
| Time of Departure | Male | Female |
| 12:00 AM to 4:59 AM | 0 (0.0%) | 0 (0.0%) |
| 5:00 AM to 5:29 AM | 0 (0.0%) | 0 (0.0%) |
| 5:30 AM to 5:59 AM | 0 (0.0%) | 0 (0.0%) |
| 6:00 AM to 6:29 AM | 2 (4.4%) | 0 (0.0%) |
| 6:30 AM to 6:59 AM | 0 (0.0%) | 32 (100.0%) |
| 7:00 AM to 7:29 AM | 5 (11.1%) | 0 (0.0%) |
| 7:30 AM to 7:59 AM | 1 (2.2%) | 0 (0.0%) |
| 8:00 AM to 8:29 AM | 0 (0.0%) | 0 (0.0%) |
| 8:30 AM to 8:59 AM | 18 (40.0%) | 0 (0.0%) |
| 9:00 AM to 9:59 AM | 0 (0.0%) | 0 (0.0%) |
| 10:00 AM to 10:59 AM | 19 (42.2%) | 0 (0.0%) |
| 11:00 AM to 11:59 AM | 0 (0.0%) | 0 (0.0%) |
| 12:00 PM to 3:59 PM | 0 (0.0%) | 0 (0.0%) |
| 4:00 PM to 11:59 PM | 0 (0.0%) | 0 (0.0%) |
| Total | 45 (100.0%) | 32 (100.0%) |
Housing Occupancy in Crane
Occupancy by Ownership in Crane
Of the total 68 dwellings in Crane, owner-occupied units account for 40 (58.8%), while renter-occupied units make up 28 (41.2%).
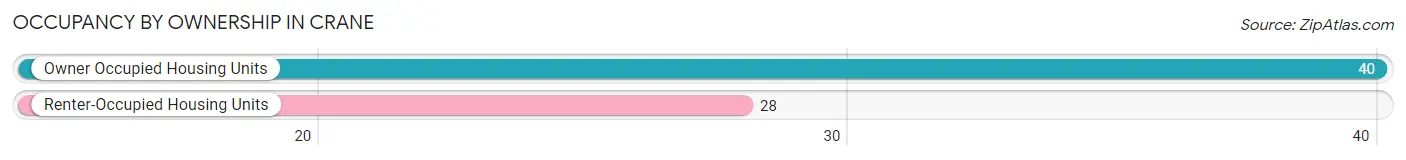
| Occupancy | # Housing Units | % Housing Units |
| Owner Occupied Housing Units | 40 | 58.8% |
| Renter-Occupied Housing Units | 28 | 41.2% |
| Total Occupied Housing Units | 68 | 100.0% |
Occupancy by Household Size in Crane
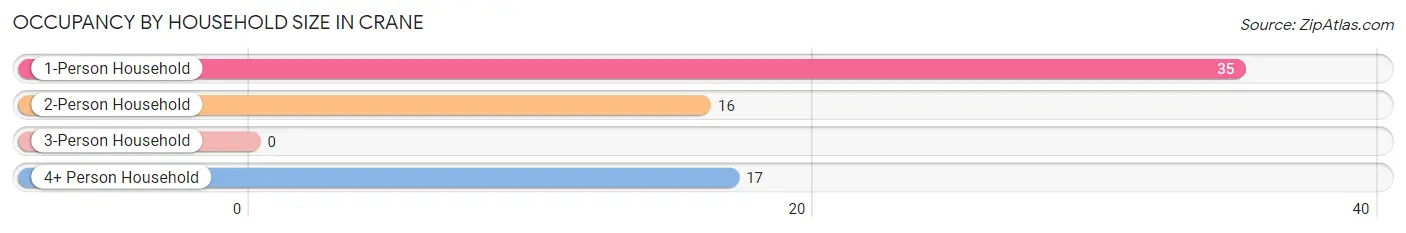
| Household Size | # Housing Units | % Housing Units |
| 1-Person Household | 35 | 51.5% |
| 2-Person Household | 16 | 23.5% |
| 3-Person Household | 0 | 0.0% |
| 4+ Person Household | 17 | 25.0% |
| Total Housing Units | 68 | 100.0% |
Occupancy by Ownership by Household Size in Crane
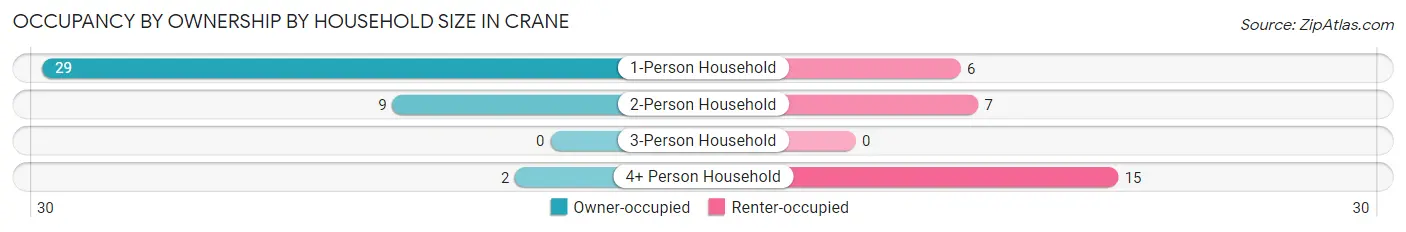
| Household Size | Owner-occupied | Renter-occupied |
| 1-Person Household | 29 (82.9%) | 6 (17.1%) |
| 2-Person Household | 9 (56.2%) | 7 (43.8%) |
| 3-Person Household | 0 (0.0%) | 0 (0.0%) |
| 4+ Person Household | 2 (11.8%) | 15 (88.2%) |
| Total Housing Units | 40 (58.8%) | 28 (41.2%) |
Occupancy by Educational Attainment in Crane
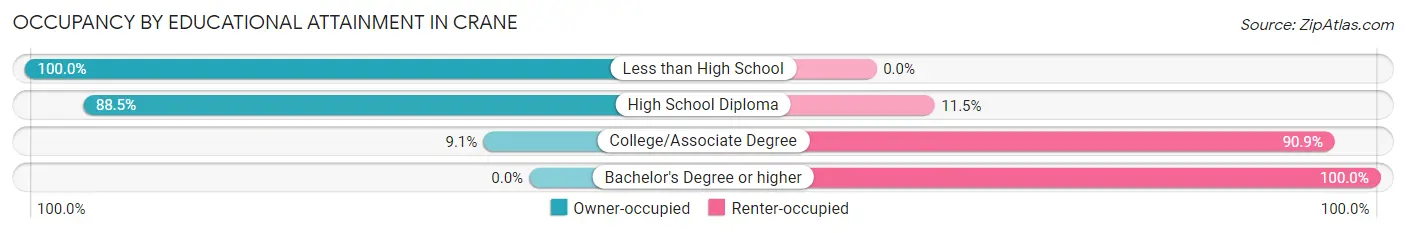
| Household Size | Owner-occupied | Renter-occupied |
| Less than High School | 15 (100.0%) | 0 (0.0%) |
| High School Diploma | 23 (88.5%) | 3 (11.5%) |
| College/Associate Degree | 2 (9.1%) | 20 (90.9%) |
| Bachelor's Degree or higher | 0 (0.0%) | 5 (100.0%) |
Occupancy by Age of Householder in Crane
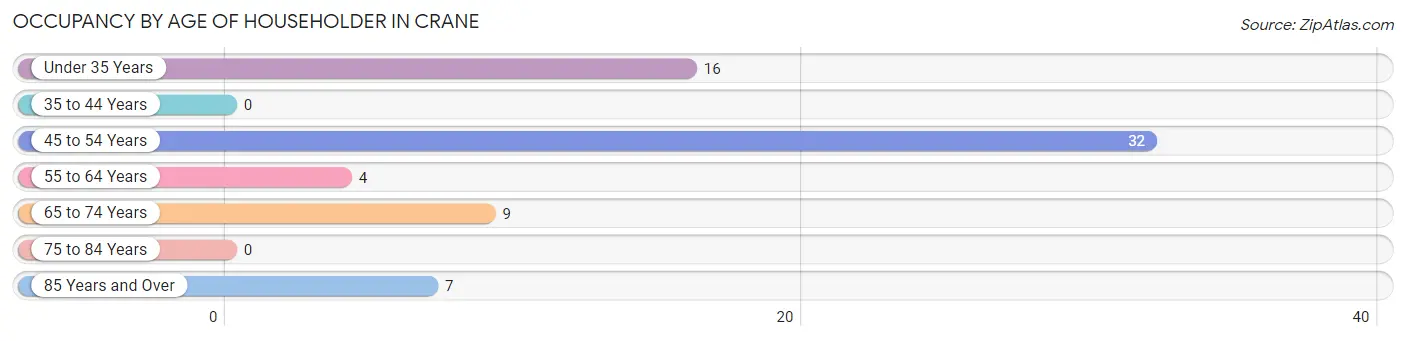
| Age Bracket | # Households | % Households |
| Under 35 Years | 16 | 23.5% |
| 35 to 44 Years | 0 | 0.0% |
| 45 to 54 Years | 32 | 47.1% |
| 55 to 64 Years | 4 | 5.9% |
| 65 to 74 Years | 9 | 13.2% |
| 75 to 84 Years | 0 | 0.0% |
| 85 Years and Over | 7 | 10.3% |
| Total | 68 | 100.0% |
Housing Finances in Crane
Median Income by Occupancy in Crane
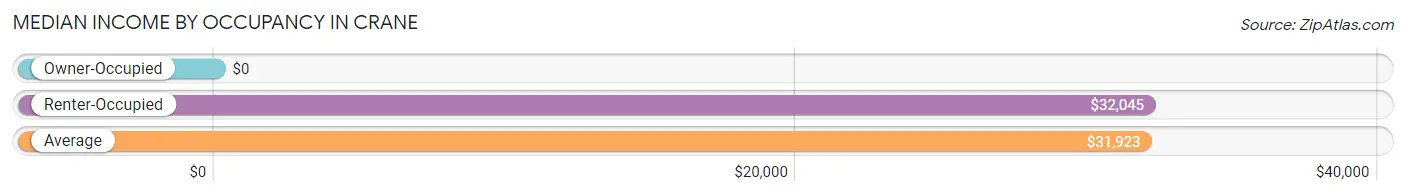
| Occupancy Type | # Households | Median Income |
| Owner-Occupied | 40 (58.8%) | $0 |
| Renter-Occupied | 28 (41.2%) | $32,045 |
| Average | 68 (100.0%) | $31,923 |
Occupancy by Householder Income Bracket in Crane
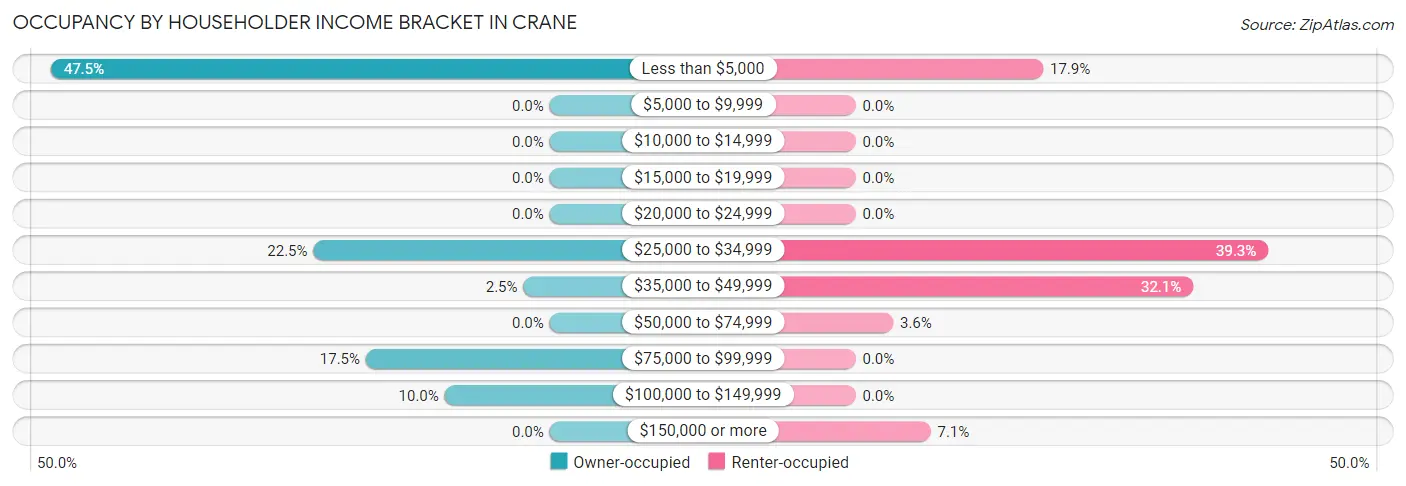
| Income Bracket | Owner-occupied | Renter-occupied |
| Less than $5,000 | 19 (47.5%) | 5 (17.9%) |
| $5,000 to $9,999 | 0 (0.0%) | 0 (0.0%) |
| $10,000 to $14,999 | 0 (0.0%) | 0 (0.0%) |
| $15,000 to $19,999 | 0 (0.0%) | 0 (0.0%) |
| $20,000 to $24,999 | 0 (0.0%) | 0 (0.0%) |
| $25,000 to $34,999 | 9 (22.5%) | 11 (39.3%) |
| $35,000 to $49,999 | 1 (2.5%) | 9 (32.1%) |
| $50,000 to $74,999 | 0 (0.0%) | 1 (3.6%) |
| $75,000 to $99,999 | 7 (17.5%) | 0 (0.0%) |
| $100,000 to $149,999 | 4 (10.0%) | 0 (0.0%) |
| $150,000 or more | 0 (0.0%) | 2 (7.1%) |
| Total | 40 (100.0%) | 28 (100.0%) |
Monthly Housing Cost Tiers in Crane
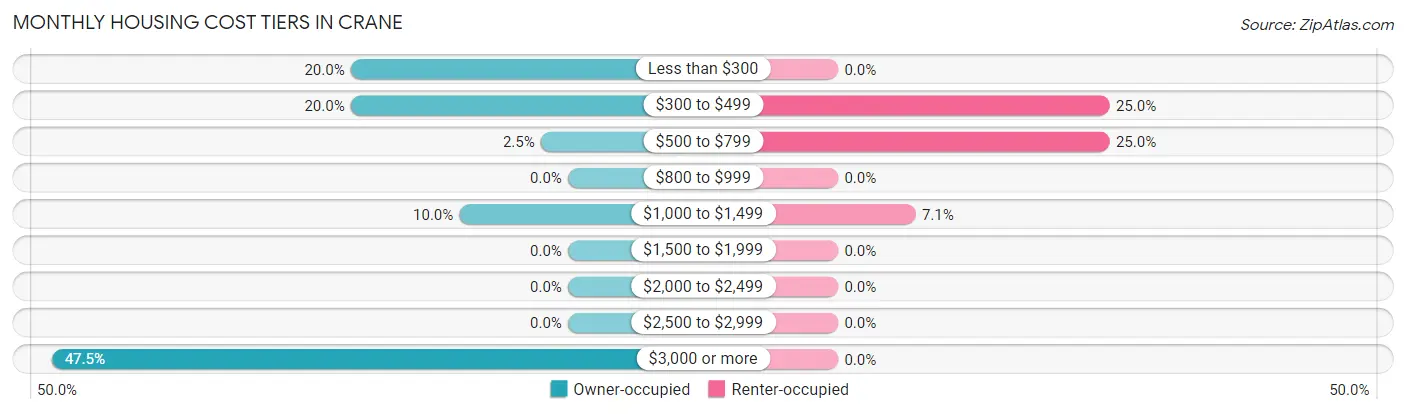
| Monthly Cost | Owner-occupied | Renter-occupied |
| Less than $300 | 8 (20.0%) | 0 (0.0%) |
| $300 to $499 | 8 (20.0%) | 7 (25.0%) |
| $500 to $799 | 1 (2.5%) | 7 (25.0%) |
| $800 to $999 | 0 (0.0%) | 0 (0.0%) |
| $1,000 to $1,499 | 4 (10.0%) | 2 (7.1%) |
| $1,500 to $1,999 | 0 (0.0%) | 0 (0.0%) |
| $2,000 to $2,499 | 0 (0.0%) | 0 (0.0%) |
| $2,500 to $2,999 | 0 (0.0%) | 0 (0.0%) |
| $3,000 or more | 19 (47.5%) | 0 (0.0%) |
| Total | 40 (100.0%) | 28 (100.0%) |
Physical Housing Characteristics in Crane
Housing Structures in Crane
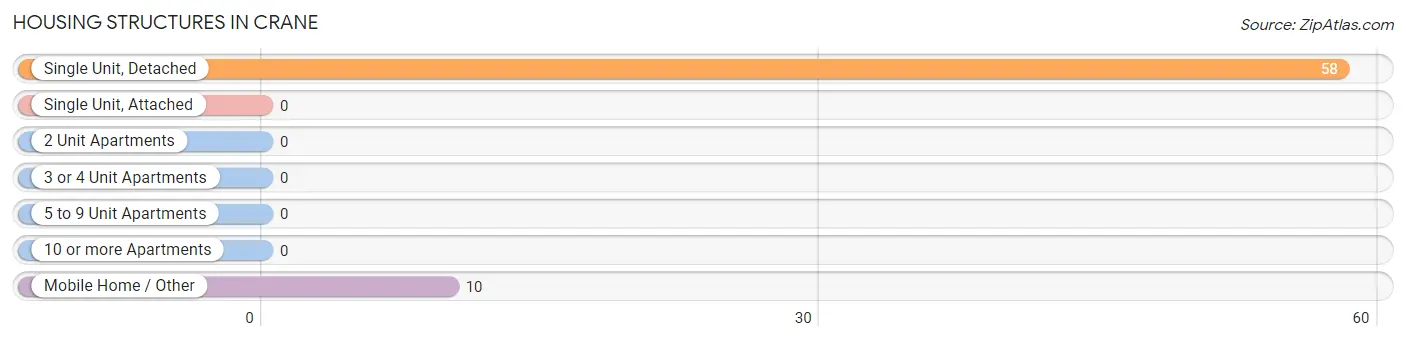
| Structure Type | # Housing Units | % Housing Units |
| Single Unit, Detached | 58 | 85.3% |
| Single Unit, Attached | 0 | 0.0% |
| 2 Unit Apartments | 0 | 0.0% |
| 3 or 4 Unit Apartments | 0 | 0.0% |
| 5 to 9 Unit Apartments | 0 | 0.0% |
| 10 or more Apartments | 0 | 0.0% |
| Mobile Home / Other | 10 | 14.7% |
| Total | 68 | 100.0% |
Housing Structures by Occupancy in Crane
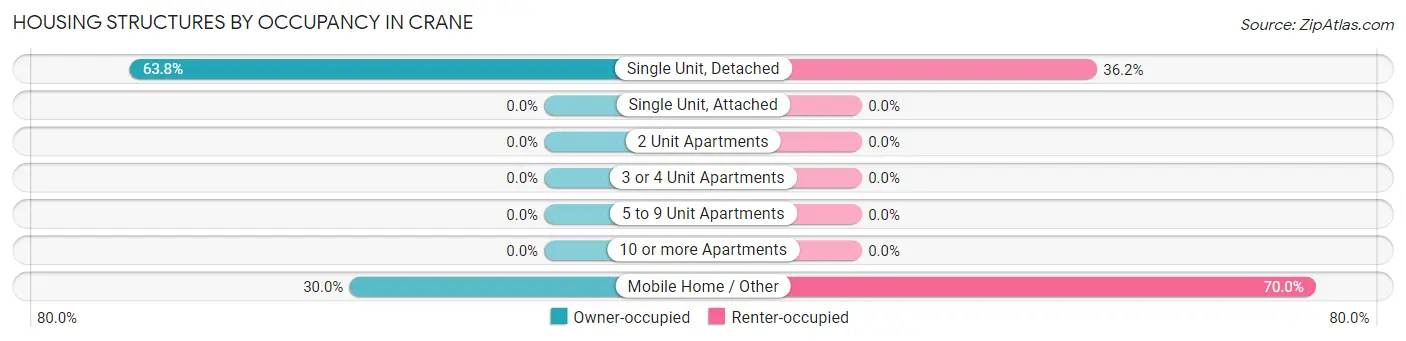
| Structure Type | Owner-occupied | Renter-occupied |
| Single Unit, Detached | 37 (63.8%) | 21 (36.2%) |
| Single Unit, Attached | 0 (0.0%) | 0 (0.0%) |
| 2 Unit Apartments | 0 (0.0%) | 0 (0.0%) |
| 3 or 4 Unit Apartments | 0 (0.0%) | 0 (0.0%) |
| 5 to 9 Unit Apartments | 0 (0.0%) | 0 (0.0%) |
| 10 or more Apartments | 0 (0.0%) | 0 (0.0%) |
| Mobile Home / Other | 3 (30.0%) | 7 (70.0%) |
| Total | 40 (58.8%) | 28 (41.2%) |
Housing Structures by Number of Rooms in Crane
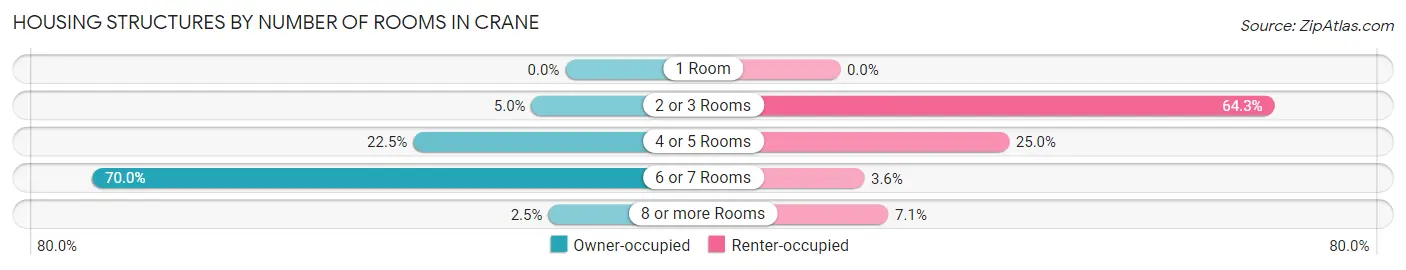
| Number of Rooms | Owner-occupied | Renter-occupied |
| 1 Room | 0 (0.0%) | 0 (0.0%) |
| 2 or 3 Rooms | 2 (5.0%) | 18 (64.3%) |
| 4 or 5 Rooms | 9 (22.5%) | 7 (25.0%) |
| 6 or 7 Rooms | 28 (70.0%) | 1 (3.6%) |
| 8 or more Rooms | 1 (2.5%) | 2 (7.1%) |
| Total | 40 (100.0%) | 28 (100.0%) |
Housing Structure by Heating Type in Crane
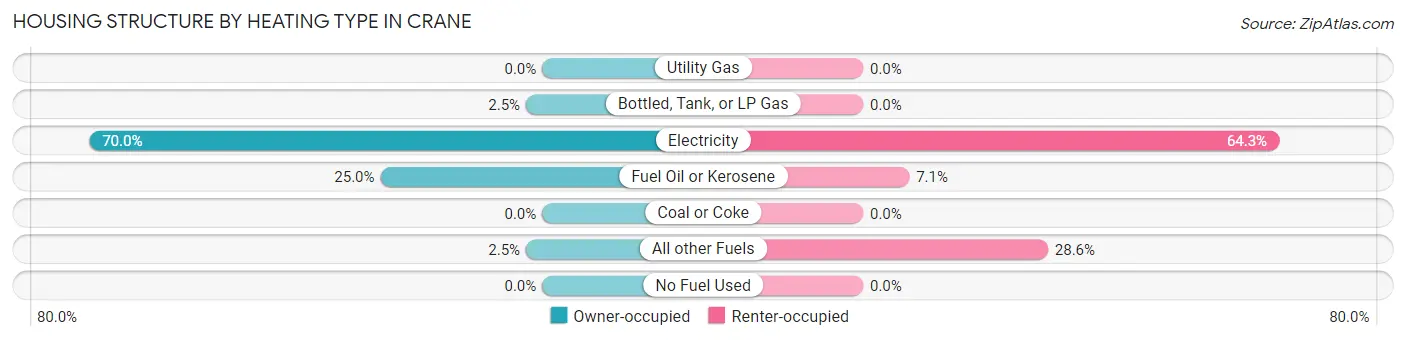
| Heating Type | Owner-occupied | Renter-occupied |
| Utility Gas | 0 (0.0%) | 0 (0.0%) |
| Bottled, Tank, or LP Gas | 1 (2.5%) | 0 (0.0%) |
| Electricity | 28 (70.0%) | 18 (64.3%) |
| Fuel Oil or Kerosene | 10 (25.0%) | 2 (7.1%) |
| Coal or Coke | 0 (0.0%) | 0 (0.0%) |
| All other Fuels | 1 (2.5%) | 8 (28.6%) |
| No Fuel Used | 0 (0.0%) | 0 (0.0%) |
| Total | 40 (100.0%) | 28 (100.0%) |
Household Vehicle Usage in Crane
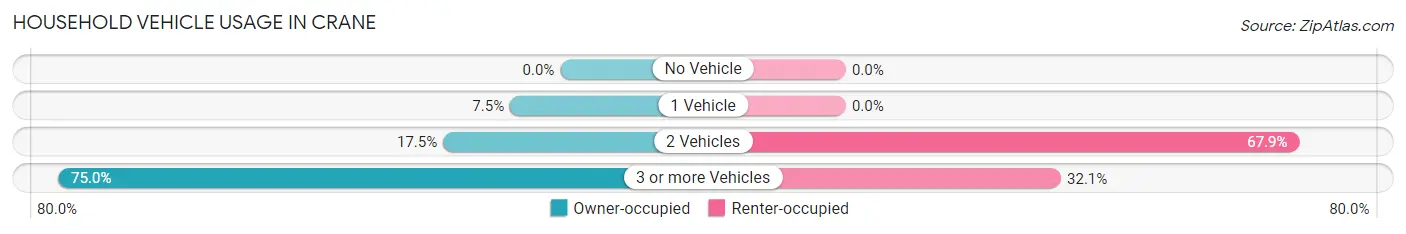
| Vehicles per Household | Owner-occupied | Renter-occupied |
| No Vehicle | 0 (0.0%) | 0 (0.0%) |
| 1 Vehicle | 3 (7.5%) | 0 (0.0%) |
| 2 Vehicles | 7 (17.5%) | 19 (67.9%) |
| 3 or more Vehicles | 30 (75.0%) | 9 (32.1%) |
| Total | 40 (100.0%) | 28 (100.0%) |
Real Estate & Mortgages in Crane
Real Estate and Mortgage Overview in Crane
| Characteristic | Without Mortgage | With Mortgage |
| Housing Units | 17 | 23 |
| Median Property Value | - | - |
| Median Household Income | - | - |
| Monthly Housing Costs | - | - |
| Real Estate Taxes | $613 | $0 |
Property Value by Mortgage Status in Crane
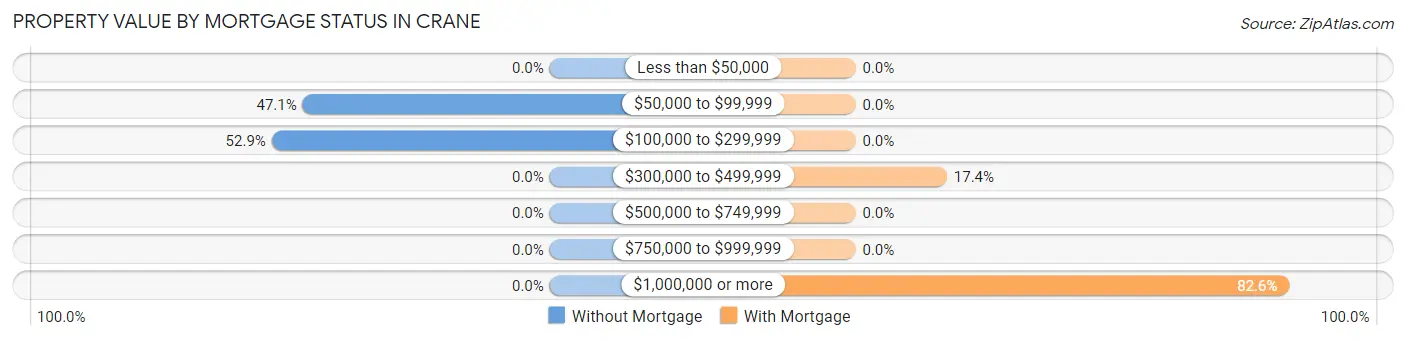
| Property Value | Without Mortgage | With Mortgage |
| Less than $50,000 | 0 (0.0%) | 0 (0.0%) |
| $50,000 to $99,999 | 8 (47.1%) | 0 (0.0%) |
| $100,000 to $299,999 | 9 (52.9%) | 0 (0.0%) |
| $300,000 to $499,999 | 0 (0.0%) | 4 (17.4%) |
| $500,000 to $749,999 | 0 (0.0%) | 0 (0.0%) |
| $750,000 to $999,999 | 0 (0.0%) | 0 (0.0%) |
| $1,000,000 or more | 0 (0.0%) | 19 (82.6%) |
| Total | 17 (100.0%) | 23 (100.0%) |
Household Income by Mortgage Status in Crane
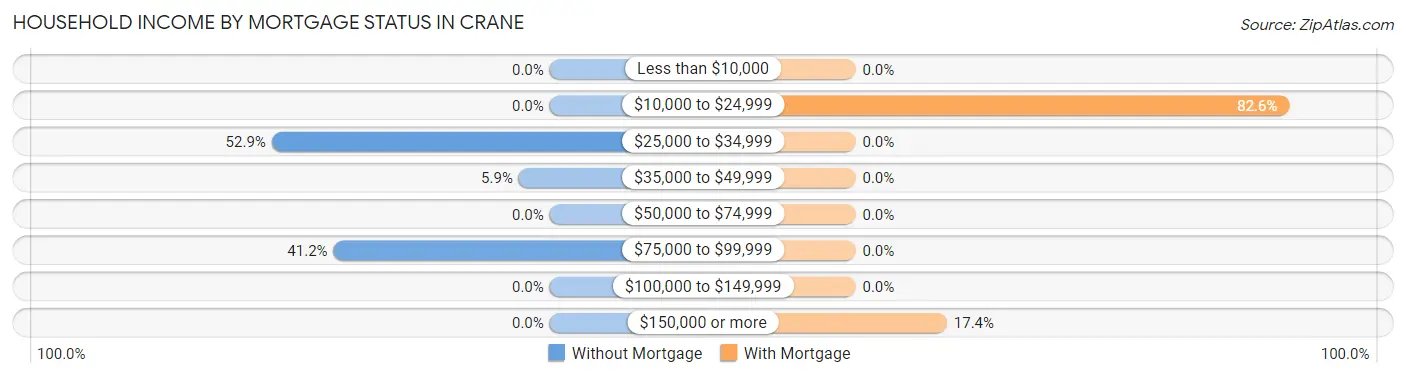
| Household Income | Without Mortgage | With Mortgage |
| Less than $10,000 | 0 (0.0%) | 0 (0.0%) |
| $10,000 to $24,999 | 0 (0.0%) | 19 (82.6%) |
| $25,000 to $34,999 | 9 (52.9%) | 0 (0.0%) |
| $35,000 to $49,999 | 1 (5.9%) | 0 (0.0%) |
| $50,000 to $74,999 | 0 (0.0%) | 0 (0.0%) |
| $75,000 to $99,999 | 7 (41.2%) | 0 (0.0%) |
| $100,000 to $149,999 | 0 (0.0%) | 0 (0.0%) |
| $150,000 or more | 0 (0.0%) | 4 (17.4%) |
| Total | 17 (100.0%) | 23 (100.0%) |
Property Value to Household Income Ratio in Crane
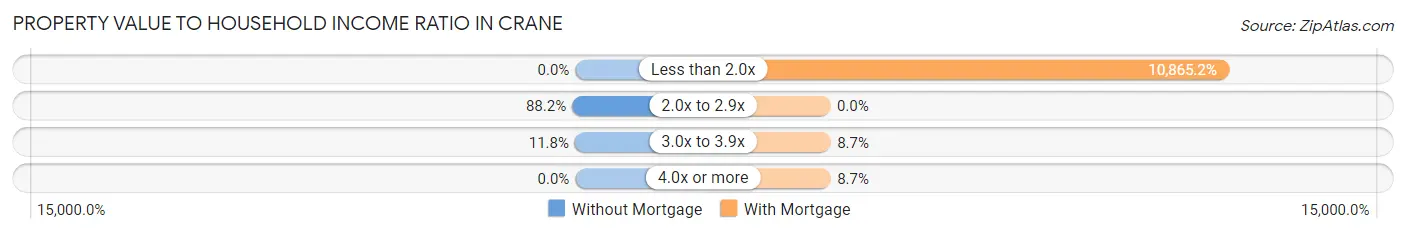
| Value-to-Income Ratio | Without Mortgage | With Mortgage |
| Less than 2.0x | 0 (0.0%) | 2,499 (10,865.2%) |
| 2.0x to 2.9x | 15 (88.2%) | 0 (0.0%) |
| 3.0x to 3.9x | 2 (11.8%) | 2 (8.7%) |
| 4.0x or more | 0 (0.0%) | 2 (8.7%) |
| Total | 17 (100.0%) | 23 (100.0%) |
Real Estate Taxes by Mortgage Status in Crane
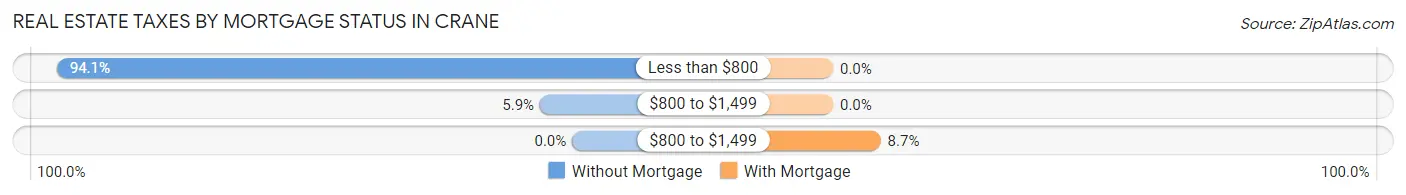
| Property Taxes | Without Mortgage | With Mortgage |
| Less than $800 | 16 (94.1%) | 0 (0.0%) |
| $800 to $1,499 | 1 (5.9%) | 0 (0.0%) |
| $800 to $1,499 | 0 (0.0%) | 2 (8.7%) |
| Total | 17 (100.0%) | 23 (100.0%) |
Health & Disability in Crane
Health Insurance Coverage by Age in Crane
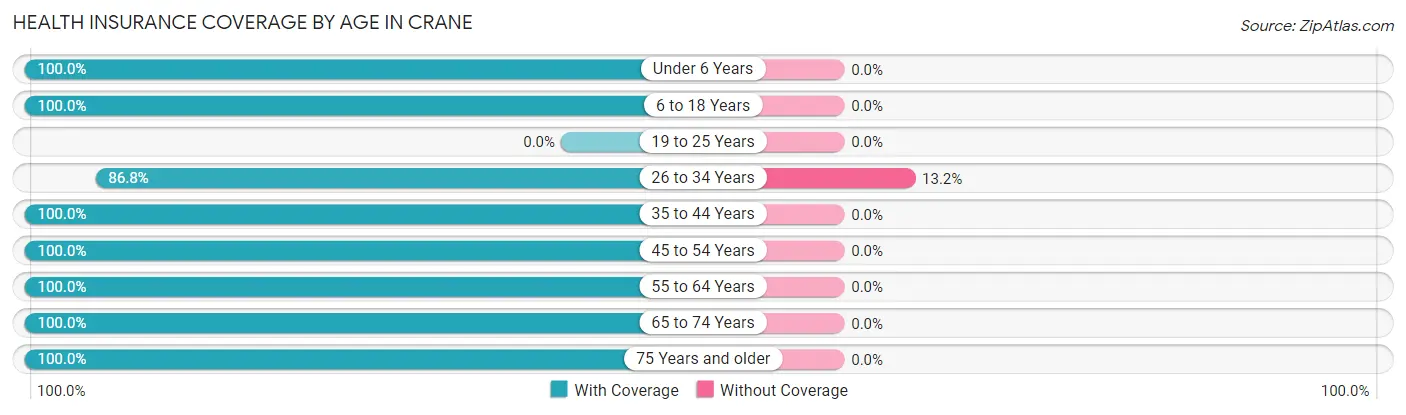
| Age Bracket | With Coverage | Without Coverage |
| Under 6 Years | 7 (100.0%) | 0 (0.0%) |
| 6 to 18 Years | 19 (100.0%) | 0 (0.0%) |
| 19 to 25 Years | 0 (0.0%) | 0 (0.0%) |
| 26 to 34 Years | 46 (86.8%) | 7 (13.2%) |
| 35 to 44 Years | 3 (100.0%) | 0 (0.0%) |
| 45 to 54 Years | 39 (100.0%) | 0 (0.0%) |
| 55 to 64 Years | 21 (100.0%) | 0 (0.0%) |
| 65 to 74 Years | 11 (100.0%) | 0 (0.0%) |
| 75 Years and older | 7 (100.0%) | 0 (0.0%) |
| Total | 153 (95.6%) | 7 (4.4%) |
Health Insurance Coverage by Citizenship Status in Crane
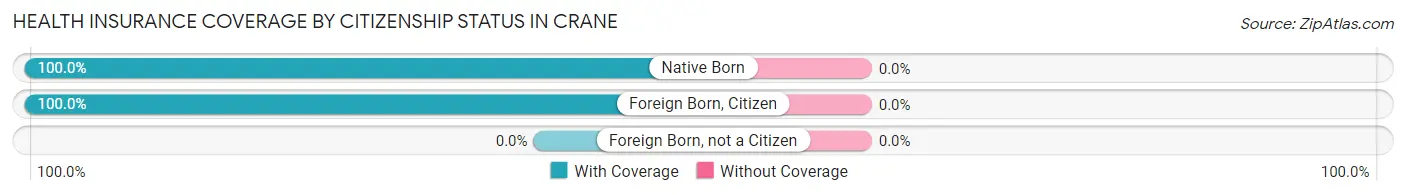
| Citizenship Status | With Coverage | Without Coverage |
| Native Born | 7 (100.0%) | 0 (0.0%) |
| Foreign Born, Citizen | 19 (100.0%) | 0 (0.0%) |
| Foreign Born, not a Citizen | 0 (0.0%) | 0 (0.0%) |
Health Insurance Coverage by Household Income in Crane
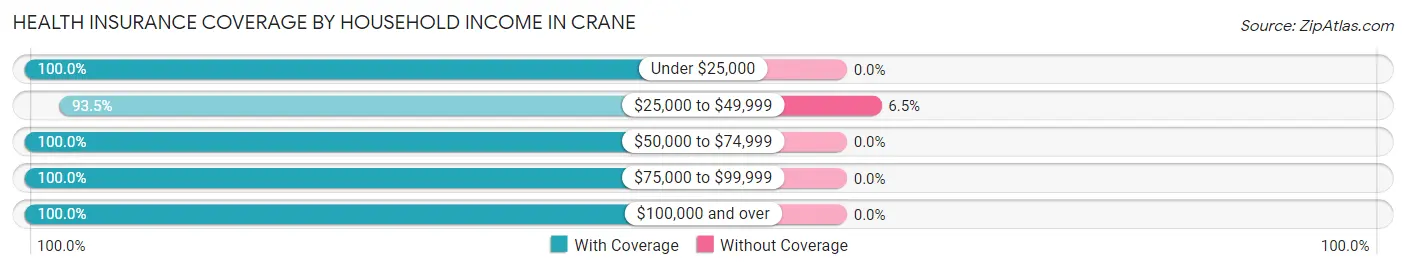
| Household Income | With Coverage | Without Coverage |
| Under $25,000 | 24 (100.0%) | 0 (0.0%) |
| $25,000 to $49,999 | 101 (93.5%) | 7 (6.5%) |
| $50,000 to $74,999 | 1 (100.0%) | 0 (0.0%) |
| $75,000 to $99,999 | 7 (100.0%) | 0 (0.0%) |
| $100,000 and over | 20 (100.0%) | 0 (0.0%) |
Public vs Private Health Insurance Coverage by Age in Crane
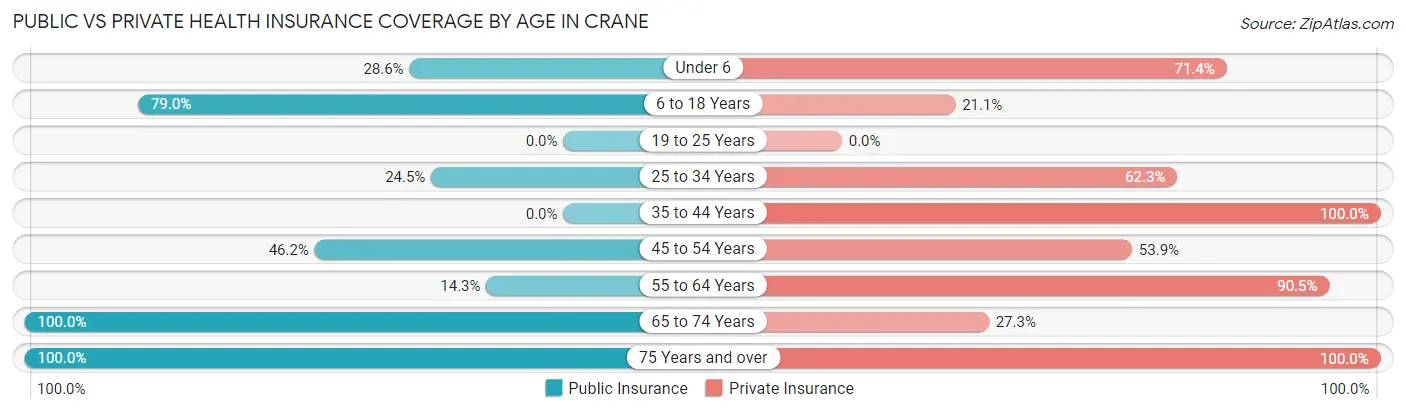
| Age Bracket | Public Insurance | Private Insurance |
| Under 6 | 2 (28.6%) | 5 (71.4%) |
| 6 to 18 Years | 15 (78.9%) | 4 (21.0%) |
| 19 to 25 Years | 0 (0.0%) | 0 (0.0%) |
| 25 to 34 Years | 13 (24.5%) | 33 (62.3%) |
| 35 to 44 Years | 0 (0.0%) | 3 (100.0%) |
| 45 to 54 Years | 18 (46.2%) | 21 (53.8%) |
| 55 to 64 Years | 3 (14.3%) | 19 (90.5%) |
| 65 to 74 Years | 11 (100.0%) | 3 (27.3%) |
| 75 Years and over | 7 (100.0%) | 7 (100.0%) |
| Total | 69 (43.1%) | 95 (59.4%) |
Disability Status by Sex by Age in Crane
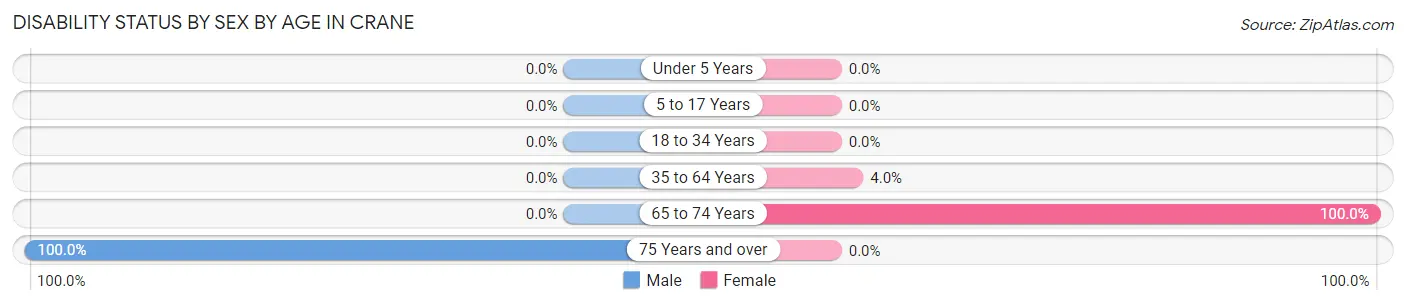
| Age Bracket | Male | Female |
| Under 5 Years | 0 (0.0%) | 0 (0.0%) |
| 5 to 17 Years | 0 (0.0%) | 0 (0.0%) |
| 18 to 34 Years | 0 (0.0%) | 0 (0.0%) |
| 35 to 64 Years | 0 (0.0%) | 1 (4.0%) |
| 65 to 74 Years | 0 (0.0%) | 3 (100.0%) |
| 75 Years and over | 7 (100.0%) | 0 (0.0%) |
Disability Class by Sex by Age in Crane
Disability Class: Hearing Difficulty
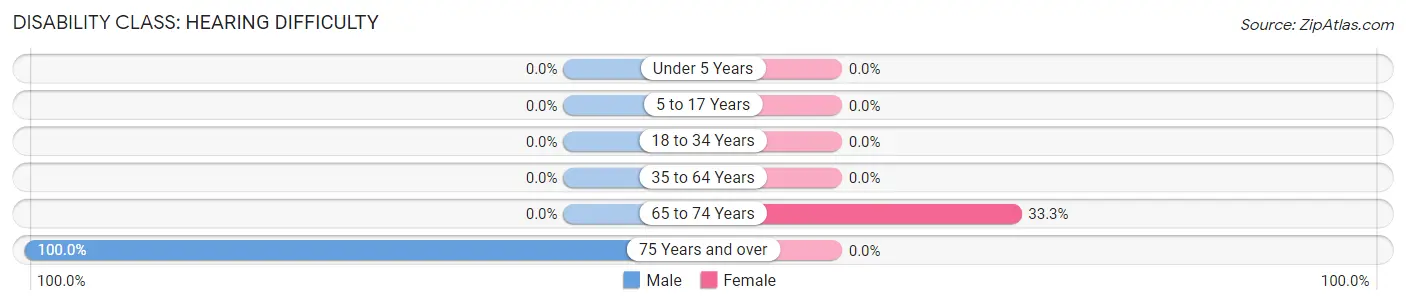
| Age Bracket | Male | Female |
| Under 5 Years | 0 (0.0%) | 0 (0.0%) |
| 5 to 17 Years | 0 (0.0%) | 0 (0.0%) |
| 18 to 34 Years | 0 (0.0%) | 0 (0.0%) |
| 35 to 64 Years | 0 (0.0%) | 0 (0.0%) |
| 65 to 74 Years | 0 (0.0%) | 1 (33.3%) |
| 75 Years and over | 7 (100.0%) | 0 (0.0%) |
Disability Class: Vision Difficulty
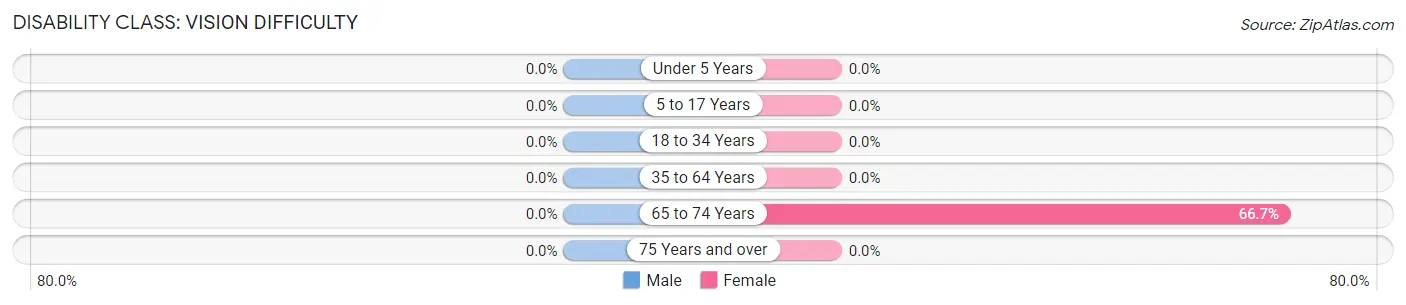
| Age Bracket | Male | Female |
| Under 5 Years | 0 (0.0%) | 0 (0.0%) |
| 5 to 17 Years | 0 (0.0%) | 0 (0.0%) |
| 18 to 34 Years | 0 (0.0%) | 0 (0.0%) |
| 35 to 64 Years | 0 (0.0%) | 0 (0.0%) |
| 65 to 74 Years | 0 (0.0%) | 2 (66.7%) |
| 75 Years and over | 0 (0.0%) | 0 (0.0%) |
Disability Class: Cognitive Difficulty
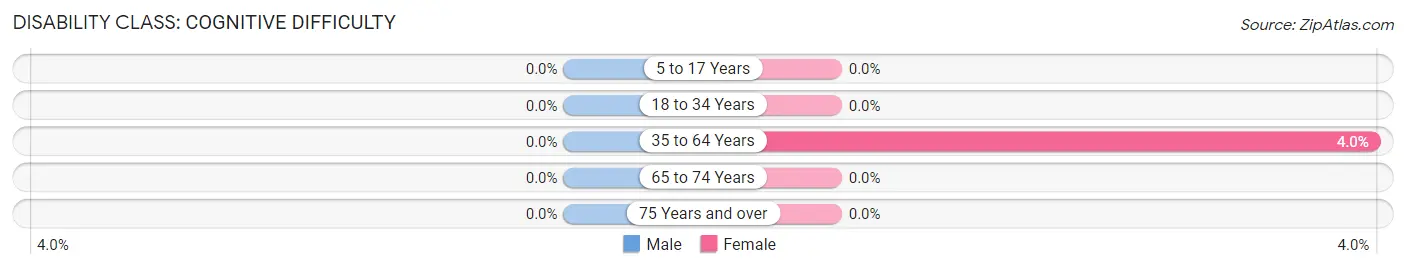
| Age Bracket | Male | Female |
| 5 to 17 Years | 0 (0.0%) | 0 (0.0%) |
| 18 to 34 Years | 0 (0.0%) | 0 (0.0%) |
| 35 to 64 Years | 0 (0.0%) | 1 (4.0%) |
| 65 to 74 Years | 0 (0.0%) | 0 (0.0%) |
| 75 Years and over | 0 (0.0%) | 0 (0.0%) |
Disability Class: Ambulatory Difficulty
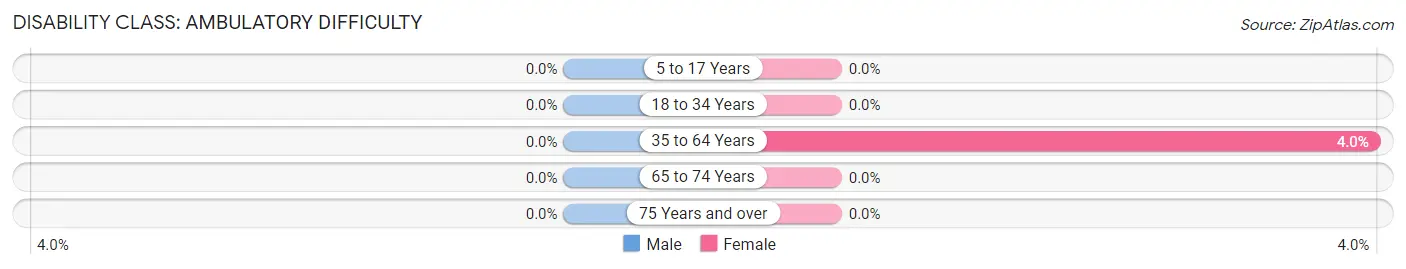
| Age Bracket | Male | Female |
| 5 to 17 Years | 0 (0.0%) | 0 (0.0%) |
| 18 to 34 Years | 0 (0.0%) | 0 (0.0%) |
| 35 to 64 Years | 0 (0.0%) | 1 (4.0%) |
| 65 to 74 Years | 0 (0.0%) | 0 (0.0%) |
| 75 Years and over | 0 (0.0%) | 0 (0.0%) |
Disability Class: Self-Care Difficulty
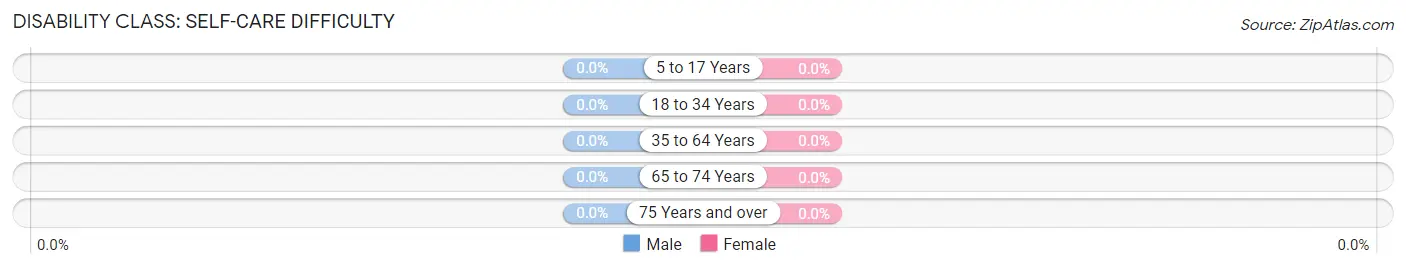
| Age Bracket | Male | Female |
| 5 to 17 Years | 0 (0.0%) | 0 (0.0%) |
| 18 to 34 Years | 0 (0.0%) | 0 (0.0%) |
| 35 to 64 Years | 0 (0.0%) | 0 (0.0%) |
| 65 to 74 Years | 0 (0.0%) | 0 (0.0%) |
| 75 Years and over | 0 (0.0%) | 0 (0.0%) |
Technology Access in Crane
Computing Device Access in Crane
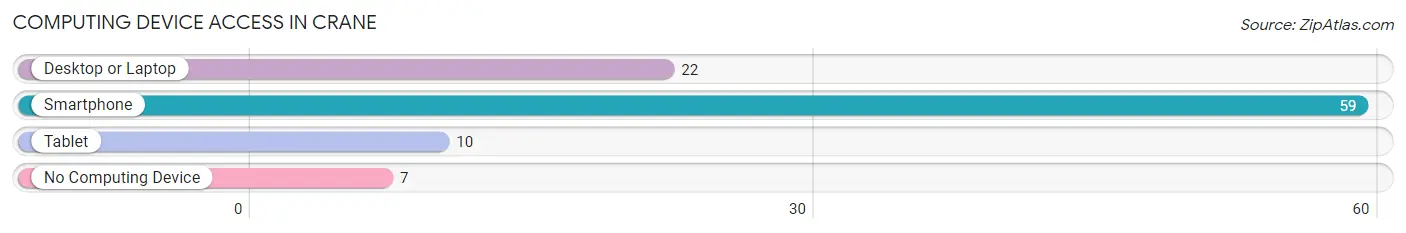
| Device Type | # Households | % Households |
| Desktop or Laptop | 22 | 32.4% |
| Smartphone | 59 | 86.8% |
| Tablet | 10 | 14.7% |
| No Computing Device | 7 | 10.3% |
| Total | 68 | 100.0% |
Internet Access in Crane
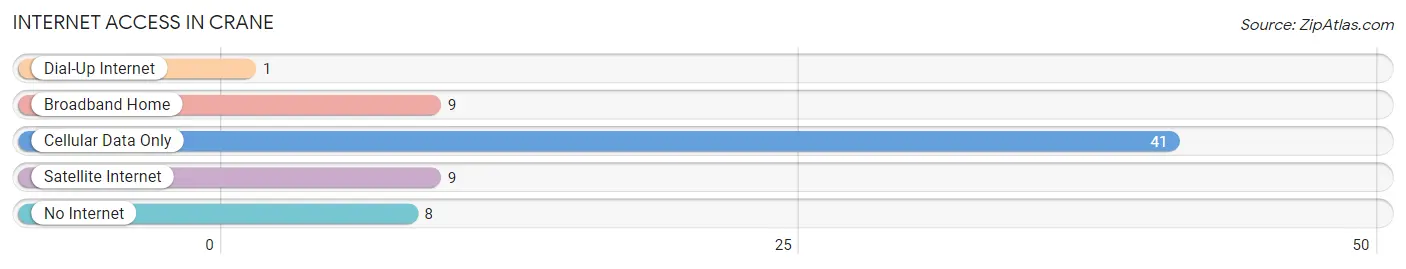
| Internet Type | # Households | % Households |
| Dial-Up Internet | 1 | 1.5% |
| Broadband Home | 9 | 13.2% |
| Cellular Data Only | 41 | 60.3% |
| Satellite Internet | 9 | 13.2% |
| No Internet | 8 | 11.8% |
| Total | 68 | 100.0% |
Crane Summary
Crane, Oregon is a small city located in the southeastern corner of the state, in Harney County. It is situated on the banks of the Malheur River, and is surrounded by the Malheur National Forest. The city has a population of just over 1,000 people, and is the county seat of Harney County.
History
The area around Crane was first inhabited by the Paiute and Bannock tribes, who used the area for hunting and gathering. The first white settlers arrived in the area in the late 1800s, and the town of Crane was established in 1887. The town was named after a local rancher, William Crane, who had a large ranch in the area.
The town grew slowly, and by the early 1900s, it had become a center for ranching and farming. The town was also home to a number of businesses, including a hotel, a general store, and a post office.
In the 1920s, the town began to experience a period of growth, as the nearby Malheur National Forest was established. This brought an influx of tourists to the area, and the town began to develop a reputation as a tourist destination.
In the 1950s, the town experienced a period of decline, as the local economy shifted away from ranching and farming. The town was also affected by the construction of the John Day Dam, which flooded much of the surrounding area.
In the 1970s, the town began to experience a resurgence, as the local economy shifted towards tourism and recreation. The town is now home to a number of tourist attractions, including the Malheur National Wildlife Refuge, the Malheur National Forest, and the John Day Dam.
Geography
Crane is located in the southeastern corner of Oregon, in Harney County. It is situated on the banks of the Malheur River, and is surrounded by the Malheur National Forest. The city has a total area of 1.2 square miles, all of which is land.
The city is located in a semi-arid climate, with hot summers and cold winters. The average annual temperature is around 50 degrees Fahrenheit, and the average annual precipitation is around 10 inches.
Economy
The economy of Crane is largely based on tourism and recreation. The city is home to a number of tourist attractions, including the Malheur National Wildlife Refuge, the Malheur National Forest, and the John Day Dam.
The city is also home to a number of businesses, including restaurants, hotels, and retail stores. The city is also home to a number of manufacturing and industrial businesses, including a lumber mill and a concrete plant.
Demographics
As of the 2010 census, the population of Crane was 1,039. The racial makeup of the city was 94.3% White, 0.7% Native American, 0.3% Asian, 0.2% African American, and 4.5% from other races. The median household income was $35,000, and the median family income was $41,000.
The city is home to a number of churches, including the Church of Jesus Christ of Latter-day Saints, the United Methodist Church, and the Catholic Church. The city is also home to a number of schools, including Crane High School and Crane Elementary School.
Common Questions
What is Per Capita Income in Crane?
Per Capita income in Crane is $20,264.
What is the Median Family Income in Crane?
Median Family Income in Crane is $33,393.
What is the Median Household income in Crane?
Median Household Income in Crane is $31,923.
What is Inequality or Gini Index in Crane?
Inequality or Gini Index in Crane is 0.53.
What is the Total Population of Crane?
Total Population of Crane is 160.
What is the Total Male Population of Crane?
Total Male Population of Crane is 79.
What is the Total Female Population of Crane?
Total Female Population of Crane is 81.
What is the Ratio of Males per 100 Females in Crane?
There are 97.53 Males per 100 Females in Crane.
What is the Ratio of Females per 100 Males in Crane?
There are 102.53 Females per 100 Males in Crane.
What is the Median Population Age in Crane?
Median Population Age in Crane is 44.3 Years.
What is the Average Family Size in Crane
Average Family Size in Crane is 3.5 People.
What is the Average Household Size in Crane
Average Household Size in Crane is 2.4 People.
How Large is the Labor Force in Crane?
There are 90 People in the Labor Forcein in Crane.
What is the Percentage of People in the Labor Force in Crane?
63.8% of People are in the Labor Force in Crane.