Vicksburg, AZ Map & Demographics
Vicksburg Map

Vicksburg Overview
$55,521
PER CAPITA INCOME
$89,750
AVG FAMILY INCOME
$66,923
AVG HOUSEHOLD INCOME
0.44
INEQUALITY / GINI INDEX
602
TOTAL POPULATION
287
MALE POPULATION
315
FEMALE POPULATION
91.11
MALES / 100 FEMALES
109.76
FEMALES / 100 MALES
70.4
MEDIAN AGE
1.8
AVG FAMILY SIZE
1.6
AVG HOUSEHOLD SIZE
227
LABOR FORCE [ PEOPLE ]
37.7%
PERCENT IN LABOR FORCE
3.5%
UNEMPLOYMENT RATE
Income in Vicksburg
Income Overview in Vicksburg
Per Capita Income in Vicksburg is $55,521, while median incomes of families and households are $89,750 and $66,923 respectively.
| Characteristic | Number | Measure |
| Per Capita Income | 602 | $55,521 |
| Median Family Income | 268 | $89,750 |
| Mean Family Income | 268 | $122,016 |
| Median Household Income | 368 | $66,923 |
| Mean Household Income | 368 | $100,681 |
| Income Deficit | 268 | $0 |
| Wage / Income Gap (%) | 602 | 0.00% |
| Wage / Income Gap ($) | 602 | 100.00¢ per $1 |
| Gini / Inequality Index | 602 | 0.44 |
Earnings by Sex in Vicksburg
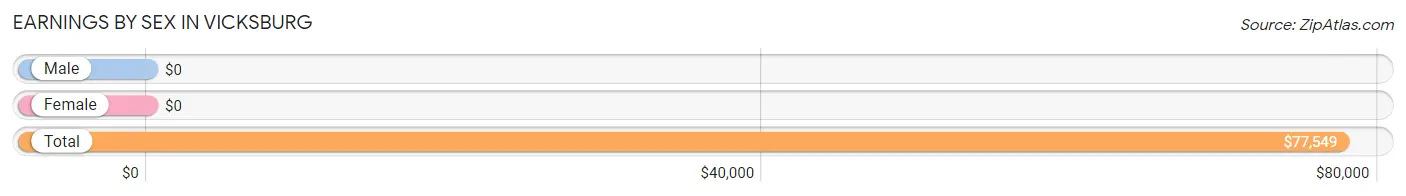
| Sex | Number | Average Earnings |
| Male | 96 (41.6%) | $0 |
| Female | 135 (58.4%) | $0 |
| Total | 231 (100.0%) | $77,549 |
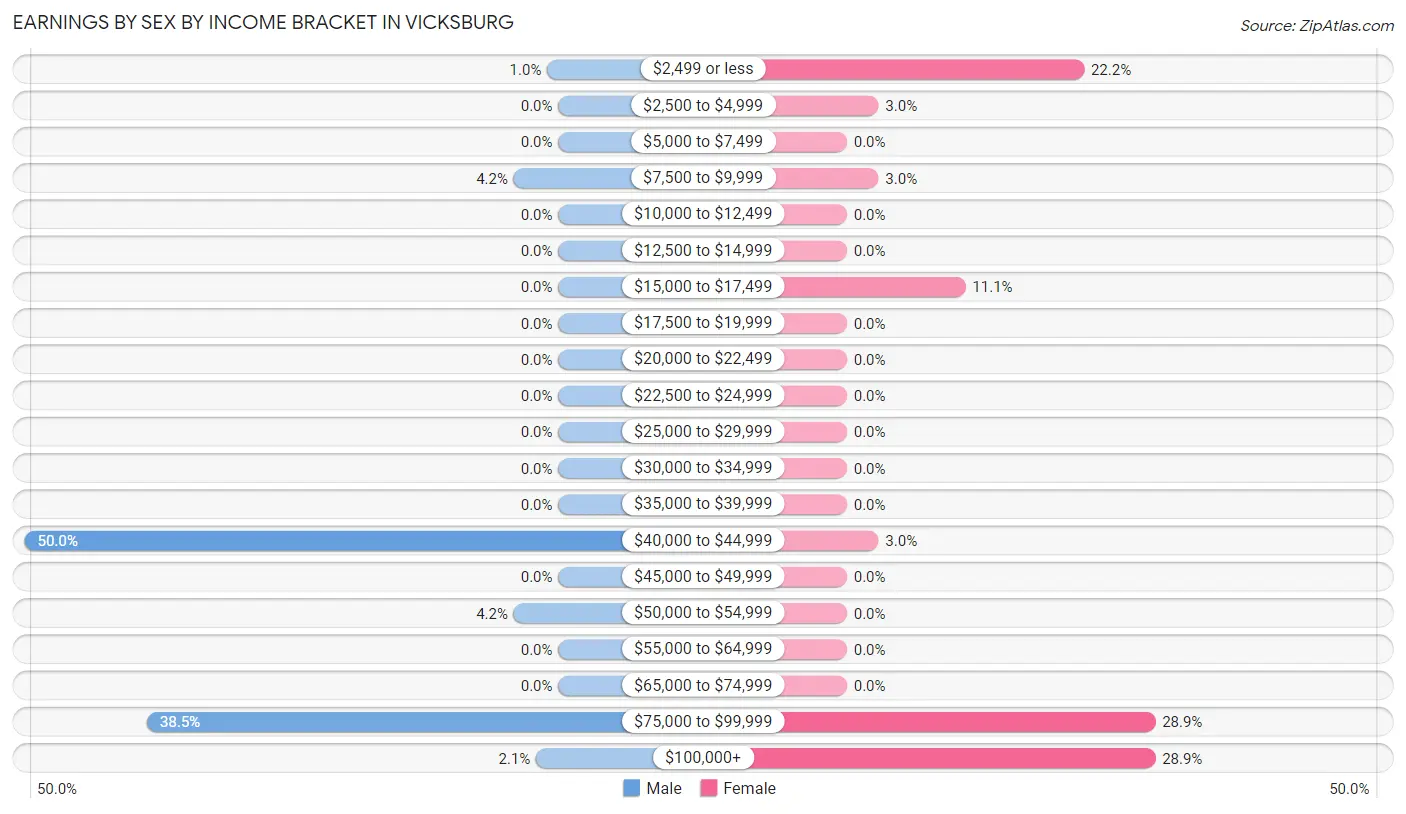
Earnings by Sex by Income Bracket in Vicksburg
The most common earnings brackets in Vicksburg are $40,000 to $44,999 for men (48 | 50.0%) and $75,000 to $99,999 for women (39 | 28.9%).
| Income | Male | Female |
| $2,499 or less | 1 (1.0%) | 30 (22.2%) |
| $2,500 to $4,999 | 0 (0.0%) | 4 (3.0%) |
| $5,000 to $7,499 | 0 (0.0%) | 0 (0.0%) |
| $7,500 to $9,999 | 4 (4.2%) | 4 (3.0%) |
| $10,000 to $12,499 | 0 (0.0%) | 0 (0.0%) |
| $12,500 to $14,999 | 0 (0.0%) | 0 (0.0%) |
| $15,000 to $17,499 | 0 (0.0%) | 15 (11.1%) |
| $17,500 to $19,999 | 0 (0.0%) | 0 (0.0%) |
| $20,000 to $22,499 | 0 (0.0%) | 0 (0.0%) |
| $22,500 to $24,999 | 0 (0.0%) | 0 (0.0%) |
| $25,000 to $29,999 | 0 (0.0%) | 0 (0.0%) |
| $30,000 to $34,999 | 0 (0.0%) | 0 (0.0%) |
| $35,000 to $39,999 | 0 (0.0%) | 0 (0.0%) |
| $40,000 to $44,999 | 48 (50.0%) | 4 (3.0%) |
| $45,000 to $49,999 | 0 (0.0%) | 0 (0.0%) |
| $50,000 to $54,999 | 4 (4.2%) | 0 (0.0%) |
| $55,000 to $64,999 | 0 (0.0%) | 0 (0.0%) |
| $65,000 to $74,999 | 0 (0.0%) | 0 (0.0%) |
| $75,000 to $99,999 | 37 (38.5%) | 39 (28.9%) |
| $100,000+ | 2 (2.1%) | 39 (28.9%) |
| Total | 96 (100.0%) | 135 (100.0%) |
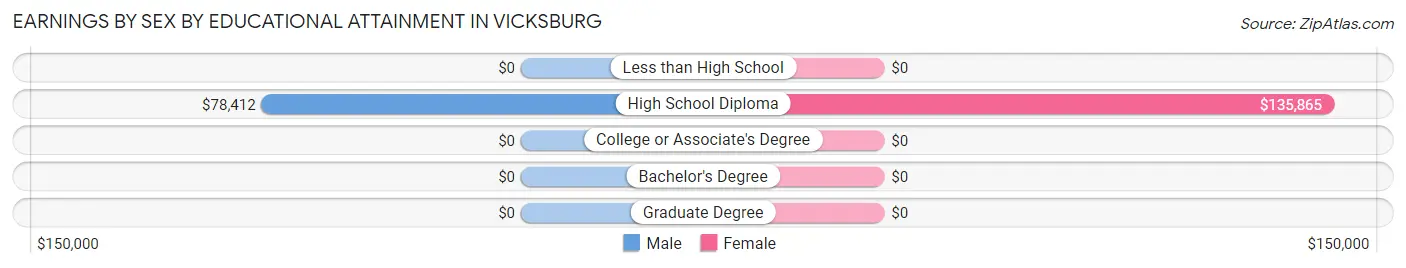
Earnings by Sex by Educational Attainment in Vicksburg
Average earnings in Vicksburg are $78,446 for men and $79,135 for women, a difference of 0.9%. Men with an educational attainment of high school diploma enjoy the highest average annual earnings of $78,412, while those with high school diploma education earn the least with $78,412. Women with an educational attainment of high school diploma earn the most with the average annual earnings of $135,865, while those with high school diploma education have the smallest earnings of $135,865.
| Educational Attainment | Male Income | Female Income |
| Less than High School | - | - |
| High School Diploma | $78,412 | $135,865 |
| College or Associate's Degree | - | - |
| Bachelor's Degree | - | - |
| Graduate Degree | - | - |
| Total | $78,446 | $79,135 |
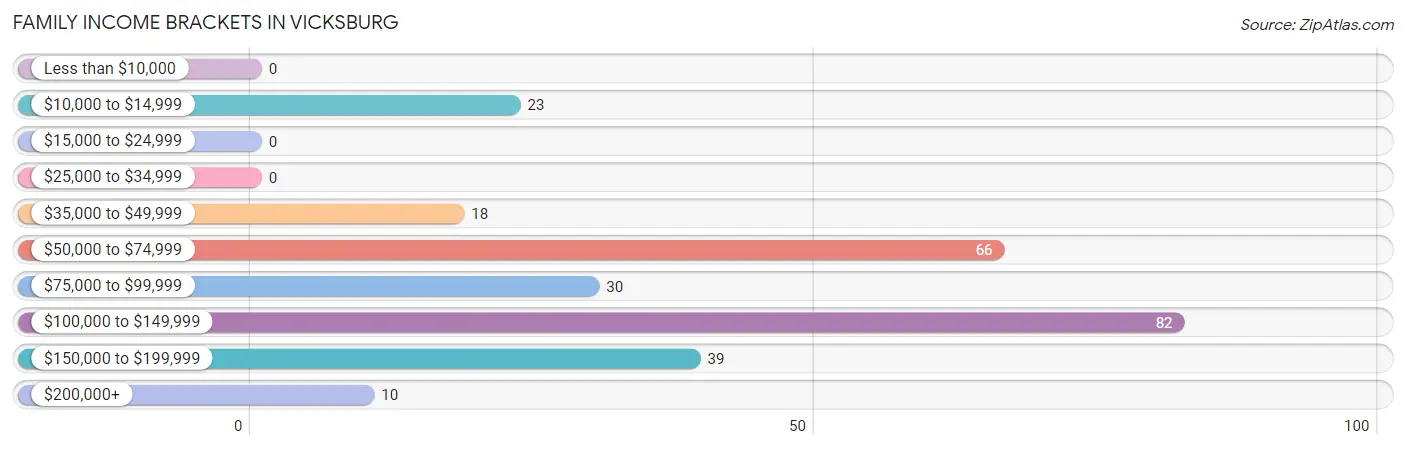
Family Income in Vicksburg
Family Income Brackets in Vicksburg
According to the Vicksburg family income data, there are 82 families falling into the $100,000 to $149,999 income range, which is the most common income bracket and makes up 30.6% of all families.
| Income Bracket | # Families | % Families |
| Less than $10,000 | 0 | 0.0% |
| $10,000 to $14,999 | 23 | 8.6% |
| $15,000 to $24,999 | 0 | 0.0% |
| $25,000 to $34,999 | 0 | 0.0% |
| $35,000 to $49,999 | 18 | 6.7% |
| $50,000 to $74,999 | 66 | 24.6% |
| $75,000 to $99,999 | 30 | 11.2% |
| $100,000 to $149,999 | 82 | 30.6% |
| $150,000 to $199,999 | 39 | 14.6% |
| $200,000+ | 10 | 3.7% |
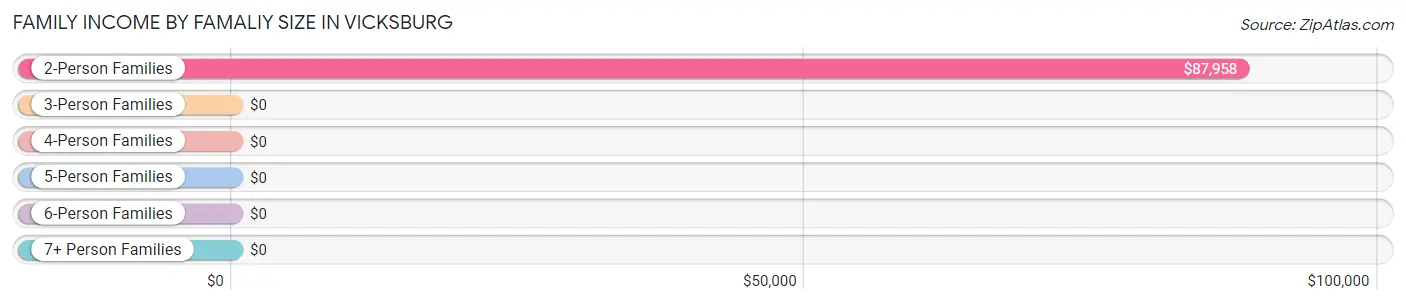
Family Income by Famaliy Size in Vicksburg
2-person families (225 | 84.0%) account for the highest median family income in Vicksburg with $87,958 per family, while 2-person families (225 | 84.0%) have the highest median income of $43,979 per family member.
| Income Bracket | # Families | Median Income |
| 2-Person Families | 225 (84.0%) | $87,958 |
| 3-Person Families | 43 (16.0%) | $0 |
| 4-Person Families | 0 (0.0%) | $0 |
| 5-Person Families | 0 (0.0%) | $0 |
| 6-Person Families | 0 (0.0%) | $0 |
| 7+ Person Families | 0 (0.0%) | $0 |
| Total | 268 (100.0%) | $89,750 |
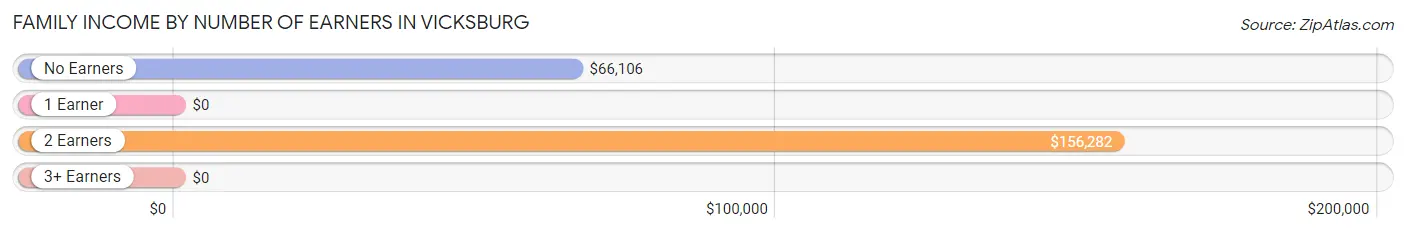
Family Income by Number of Earners in Vicksburg
| Number of Earners | # Families | Median Income |
| No Earners | 109 (40.7%) | $66,106 |
| 1 Earner | 73 (27.2%) | $0 |
| 2 Earners | 48 (17.9%) | $156,282 |
| 3+ Earners | 38 (14.2%) | $0 |
| Total | 268 (100.0%) | $89,750 |
Household Income in Vicksburg
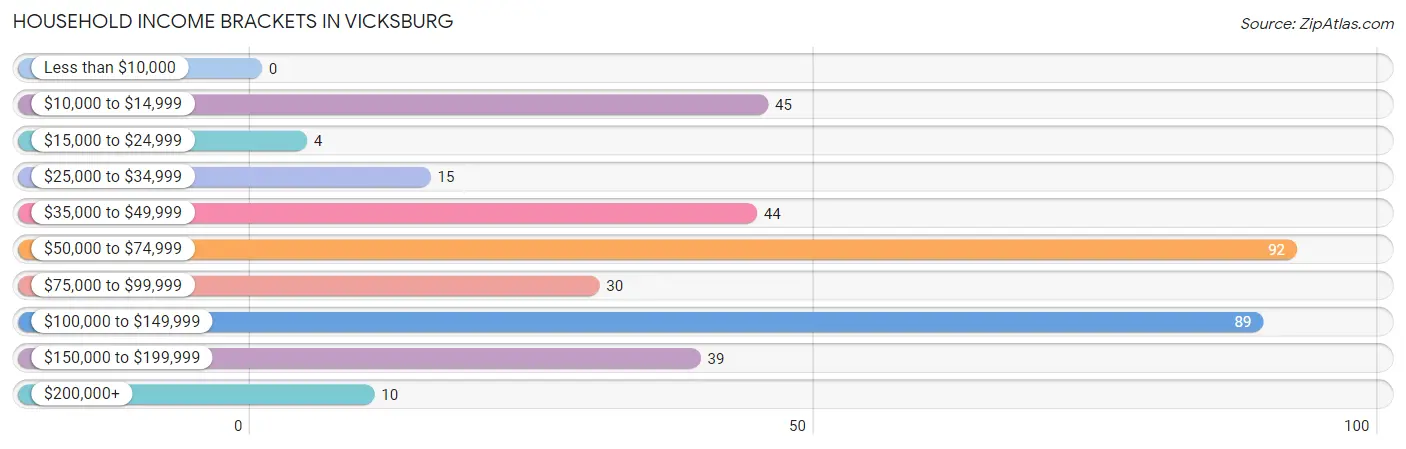
Household Income Brackets in Vicksburg
With 92 households falling in the category, the $50,000 to $74,999 income range is the most frequent in Vicksburg, accounting for 25.0% of all households.
| Income Bracket | # Households | % Households |
| Less than $10,000 | 0 | 0.0% |
| $10,000 to $14,999 | 45 | 12.2% |
| $15,000 to $24,999 | 4 | 1.1% |
| $25,000 to $34,999 | 15 | 4.1% |
| $35,000 to $49,999 | 44 | 12.0% |
| $50,000 to $74,999 | 92 | 25.0% |
| $75,000 to $99,999 | 30 | 8.2% |
| $100,000 to $149,999 | 89 | 24.2% |
| $150,000 to $199,999 | 39 | 10.6% |
| $200,000+ | 10 | 2.7% |
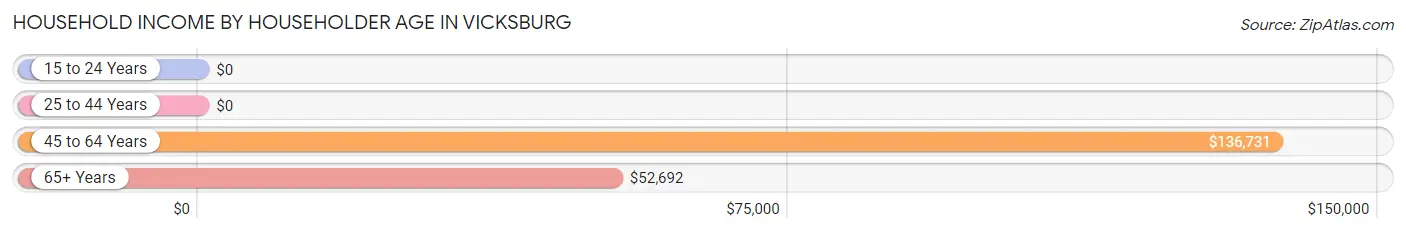
Household Income by Householder Age in Vicksburg
The median household income in Vicksburg is $66,923, with the highest median household income of $136,731 found in the 45 to 64 years age bracket for the primary householder. A total of 102 households (27.7%) fall into this category. Meanwhile, the 15 to 24 years age bracket for the primary householder has the lowest median household income of $0, with 38 households (10.3%) in this group.
| Income Bracket | # Households | Median Income |
| 15 to 24 Years | 38 (10.3%) | $0 |
| 25 to 44 Years | 0 (0.0%) | $0 |
| 45 to 64 Years | 102 (27.7%) | $136,731 |
| 65+ Years | 228 (62.0%) | $52,692 |
| Total | 368 (100.0%) | $66,923 |
Poverty in Vicksburg
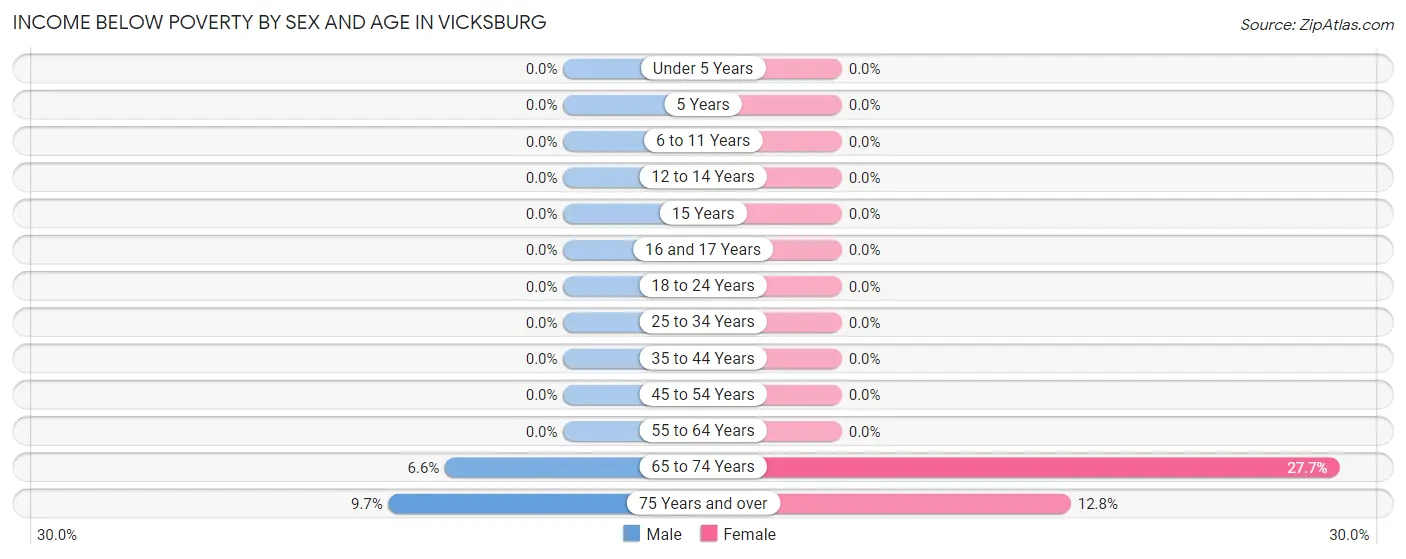
Income Below Poverty by Sex and Age in Vicksburg
With 5.6% poverty level for males and 11.4% for females among the residents of Vicksburg, 75 year old and over males and 65 to 74 year old females are the most vulnerable to poverty, with 11 males (9.7%) and 23 females (27.7%) in their respective age groups living below the poverty level.
| Age Bracket | Male | Female |
| Under 5 Years | 0 (0.0%) | 0 (0.0%) |
| 5 Years | 0 (0.0%) | 0 (0.0%) |
| 6 to 11 Years | 0 (0.0%) | 0 (0.0%) |
| 12 to 14 Years | 0 (0.0%) | 0 (0.0%) |
| 15 Years | 0 (0.0%) | 0 (0.0%) |
| 16 and 17 Years | 0 (0.0%) | 0 (0.0%) |
| 18 to 24 Years | 0 (0.0%) | 0 (0.0%) |
| 25 to 34 Years | 0 (0.0%) | 0 (0.0%) |
| 35 to 44 Years | 0 (0.0%) | 0 (0.0%) |
| 45 to 54 Years | 0 (0.0%) | 0 (0.0%) |
| 55 to 64 Years | 0 (0.0%) | 0 (0.0%) |
| 65 to 74 Years | 5 (6.6%) | 23 (27.7%) |
| 75 Years and over | 11 (9.7%) | 13 (12.8%) |
| Total | 16 (5.6%) | 36 (11.4%) |
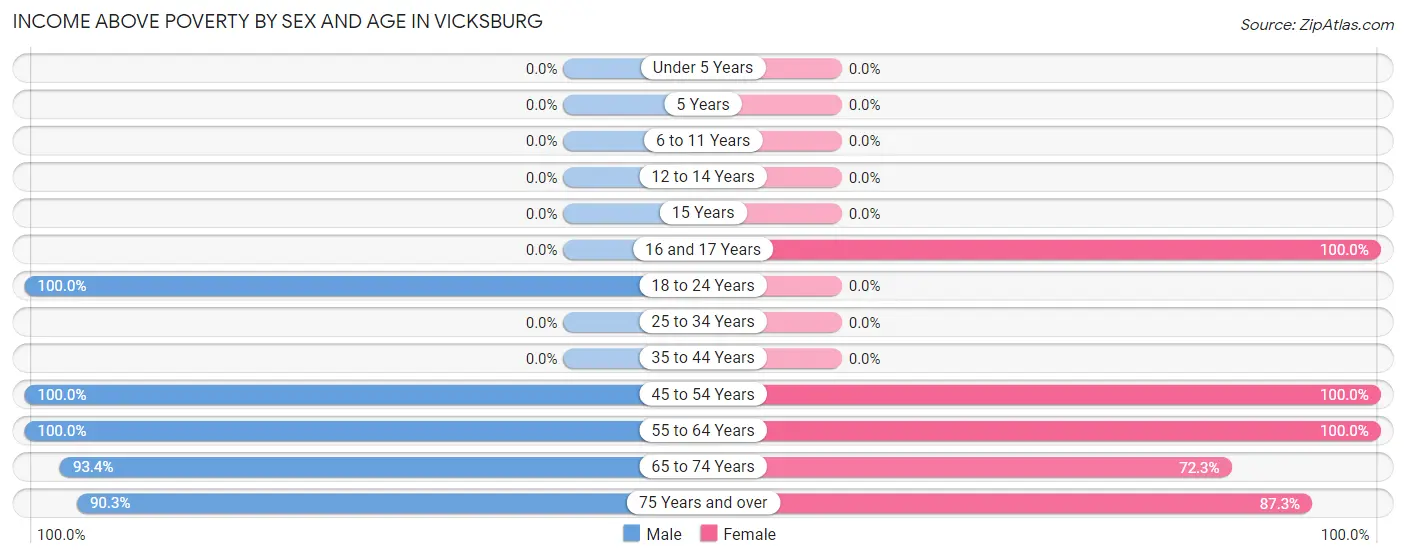
Income Above Poverty by Sex and Age in Vicksburg
According to the poverty statistics in Vicksburg, males aged 18 to 24 years and females aged 16 and 17 years are the age groups that are most secure financially, with 100.0% of males and 100.0% of females in these age groups living above the poverty line.
| Age Bracket | Male | Female |
| Under 5 Years | 0 (0.0%) | 0 (0.0%) |
| 5 Years | 0 (0.0%) | 0 (0.0%) |
| 6 to 11 Years | 0 (0.0%) | 0 (0.0%) |
| 12 to 14 Years | 0 (0.0%) | 0 (0.0%) |
| 15 Years | 0 (0.0%) | 0 (0.0%) |
| 16 and 17 Years | 0 (0.0%) | 30 (100.0%) |
| 18 to 24 Years | 46 (100.0%) | 0 (0.0%) |
| 25 to 34 Years | 0 (0.0%) | 0 (0.0%) |
| 35 to 44 Years | 0 (0.0%) | 0 (0.0%) |
| 45 to 54 Years | 44 (100.0%) | 39 (100.0%) |
| 55 to 64 Years | 8 (100.0%) | 61 (100.0%) |
| 65 to 74 Years | 71 (93.4%) | 60 (72.3%) |
| 75 Years and over | 102 (90.3%) | 89 (87.3%) |
| Total | 271 (94.4%) | 279 (88.6%) |
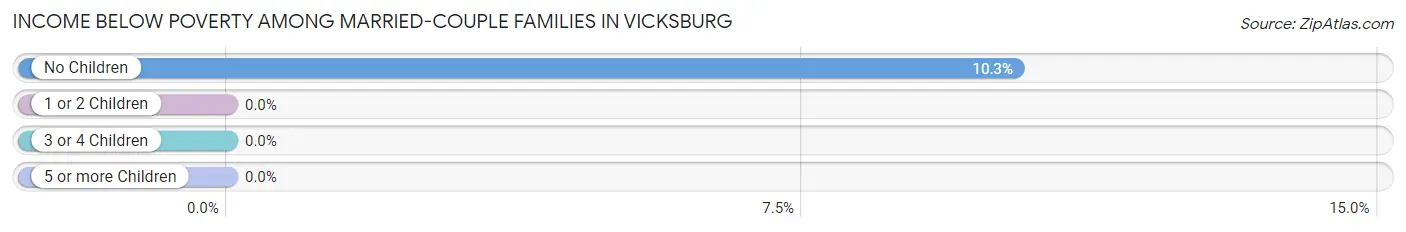
Income Below Poverty Among Married-Couple Families in Vicksburg
The poverty statistics for married-couple families in Vicksburg show that 10.3% or 23 of the total 224 families live below the poverty line. Families with no children have the highest poverty rate of 10.3%, comprising of 23 families. On the other hand, families with no children have the lowest poverty rate of 10.3%, which includes 23 families.
| Children | Above Poverty | Below Poverty |
| No Children | 201 (89.7%) | 23 (10.3%) |
| 1 or 2 Children | 0 (0.0%) | 0 (0.0%) |
| 3 or 4 Children | 0 (0.0%) | 0 (0.0%) |
| 5 or more Children | 0 (0.0%) | 0 (0.0%) |
| Total | 201 (89.7%) | 23 (10.3%) |
Income Below Poverty Among Single-Parent Households in Vicksburg
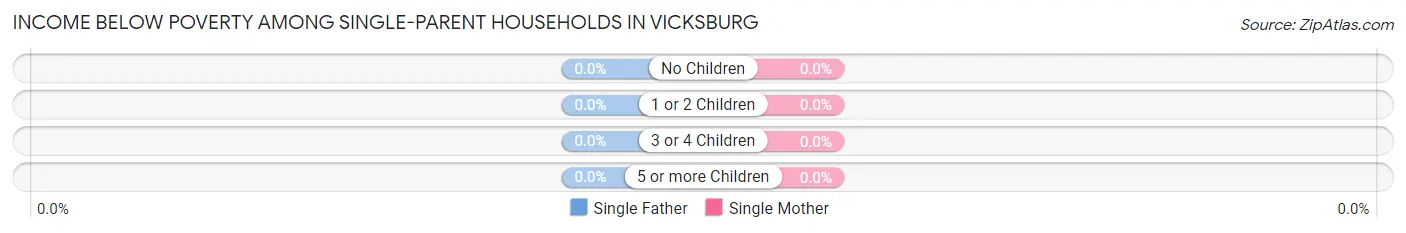
| Children | Single Father | Single Mother |
| No Children | 0 (0.0%) | 0 (0.0%) |
| 1 or 2 Children | 0 (0.0%) | 0 (0.0%) |
| 3 or 4 Children | 0 (0.0%) | 0 (0.0%) |
| 5 or more Children | 0 (0.0%) | 0 (0.0%) |
| Total | 0 (0.0%) | 0 (0.0%) |
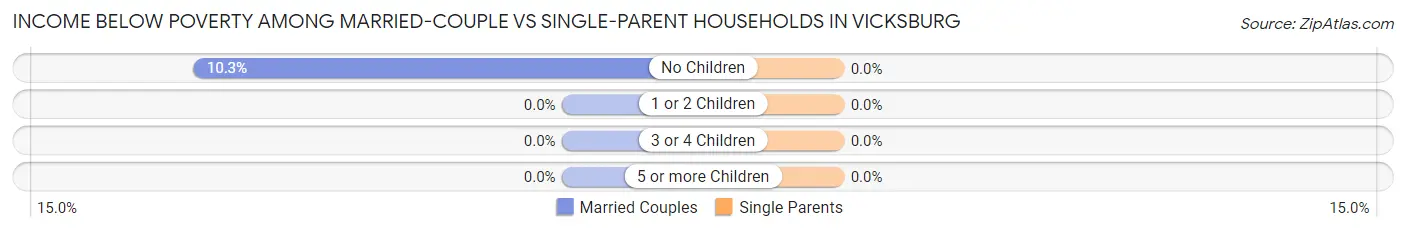
Income Below Poverty Among Married-Couple vs Single-Parent Households in Vicksburg
| Children | Married-Couple Families | Single-Parent Households |
| No Children | 23 (10.3%) | 0 (0.0%) |
| 1 or 2 Children | 0 (0.0%) | 0 (0.0%) |
| 3 or 4 Children | 0 (0.0%) | 0 (0.0%) |
| 5 or more Children | 0 (0.0%) | 0 (0.0%) |
| Total | 23 (10.3%) | 0 (0.0%) |
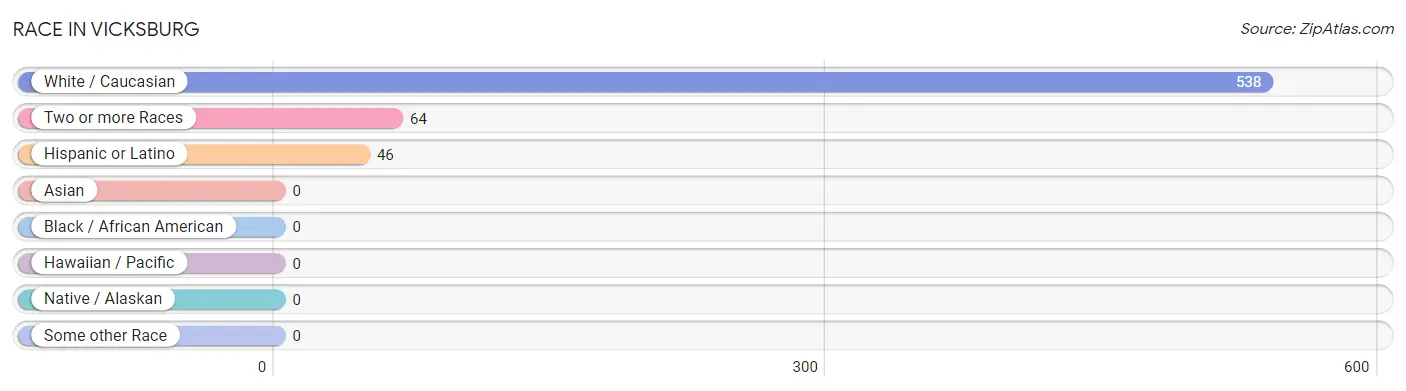
Race in Vicksburg
The most populous races in Vicksburg are White / Caucasian (538 | 89.4%), Two or more Races (64 | 10.6%), and Hispanic or Latino (46 | 7.6%).
| Race | # Population | % Population |
| Asian | 0 | 0.0% |
| Black / African American | 0 | 0.0% |
| Hawaiian / Pacific | 0 | 0.0% |
| Hispanic or Latino | 46 | 7.6% |
| Native / Alaskan | 0 | 0.0% |
| White / Caucasian | 538 | 89.4% |
| Two or more Races | 64 | 10.6% |
| Some other Race | 0 | 0.0% |
| Total | 602 | 100.0% |
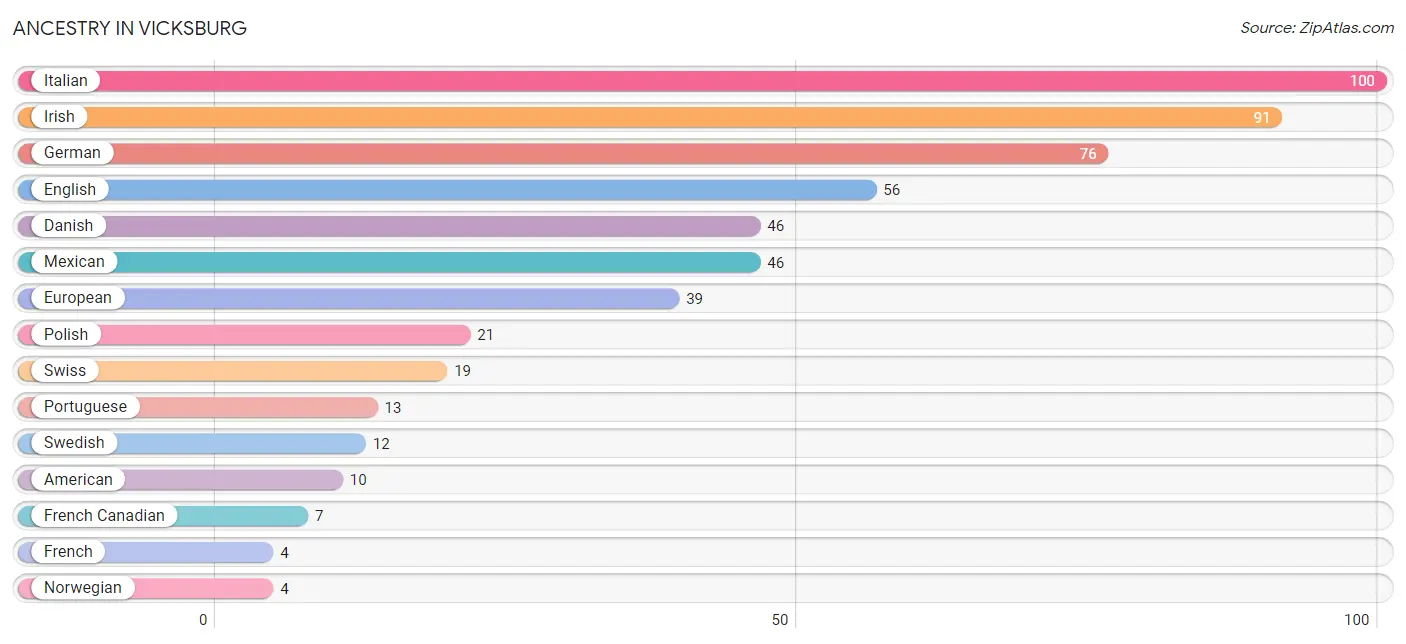
Ancestry in Vicksburg
The most populous ancestries reported in Vicksburg are Italian (100 | 16.6%), Irish (91 | 15.1%), German (76 | 12.6%), English (56 | 9.3%), and Danish (46 | 7.6%), together accounting for 61.3% of all Vicksburg residents.
| Ancestry | # Population | % Population |
| American | 10 | 1.7% |
| Danish | 46 | 7.6% |
| English | 56 | 9.3% |
| European | 39 | 6.5% |
| French | 4 | 0.7% |
| French Canadian | 7 | 1.2% |
| German | 76 | 12.6% |
| Irish | 91 | 15.1% |
| Italian | 100 | 16.6% |
| Mexican | 46 | 7.6% |
| Norwegian | 4 | 0.7% |
| Polish | 21 | 3.5% |
| Portuguese | 13 | 2.2% |
| Scandinavian | 4 | 0.7% |
| Swedish | 12 | 2.0% |
| Swiss | 19 | 3.2% | View All 16 Rows |
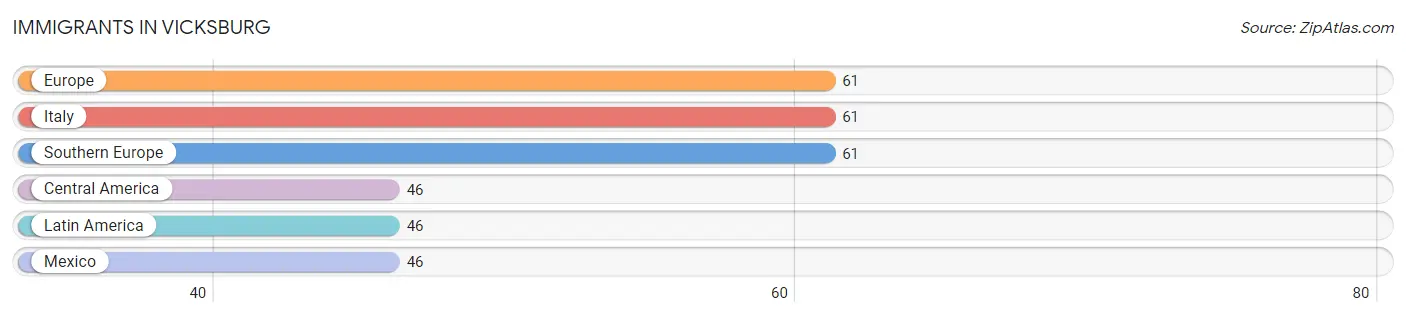
Immigrants in Vicksburg
The most numerous immigrant groups reported in Vicksburg came from Europe (61 | 10.1%), Italy (61 | 10.1%), Southern Europe (61 | 10.1%), Central America (46 | 7.6%), and Latin America (46 | 7.6%), together accounting for 45.7% of all Vicksburg residents.
| Immigration Origin | # Population | % Population |
| Central America | 46 | 7.6% |
| Europe | 61 | 10.1% |
| Italy | 61 | 10.1% |
| Latin America | 46 | 7.6% |
| Mexico | 46 | 7.6% |
| Southern Europe | 61 | 10.1% | View All 6 Rows |
Sex and Age in Vicksburg
Sex and Age in Vicksburg
The most populous age groups in Vicksburg are 75 to 79 Years (92 | 32.1%) for men and 75 to 79 Years (89 | 28.2%) for women.
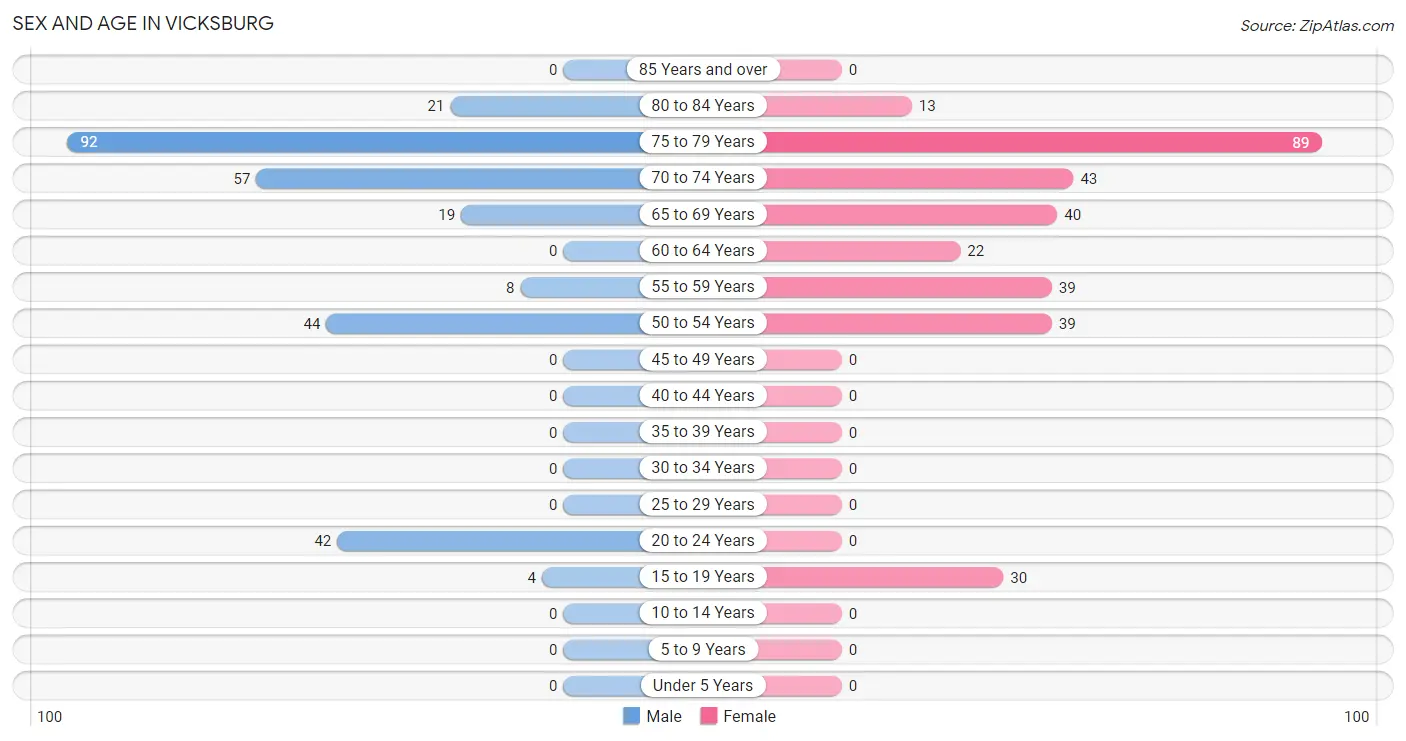
| Age Bracket | Male | Female |
| Under 5 Years | 0 (0.0%) | 0 (0.0%) |
| 5 to 9 Years | 0 (0.0%) | 0 (0.0%) |
| 10 to 14 Years | 0 (0.0%) | 0 (0.0%) |
| 15 to 19 Years | 4 (1.4%) | 30 (9.5%) |
| 20 to 24 Years | 42 (14.6%) | 0 (0.0%) |
| 25 to 29 Years | 0 (0.0%) | 0 (0.0%) |
| 30 to 34 Years | 0 (0.0%) | 0 (0.0%) |
| 35 to 39 Years | 0 (0.0%) | 0 (0.0%) |
| 40 to 44 Years | 0 (0.0%) | 0 (0.0%) |
| 45 to 49 Years | 0 (0.0%) | 0 (0.0%) |
| 50 to 54 Years | 44 (15.3%) | 39 (12.4%) |
| 55 to 59 Years | 8 (2.8%) | 39 (12.4%) |
| 60 to 64 Years | 0 (0.0%) | 22 (7.0%) |
| 65 to 69 Years | 19 (6.6%) | 40 (12.7%) |
| 70 to 74 Years | 57 (19.9%) | 43 (13.7%) |
| 75 to 79 Years | 92 (32.1%) | 89 (28.2%) |
| 80 to 84 Years | 21 (7.3%) | 13 (4.1%) |
| 85 Years and over | 0 (0.0%) | 0 (0.0%) |
| Total | 287 (100.0%) | 315 (100.0%) |
Families and Households in Vicksburg
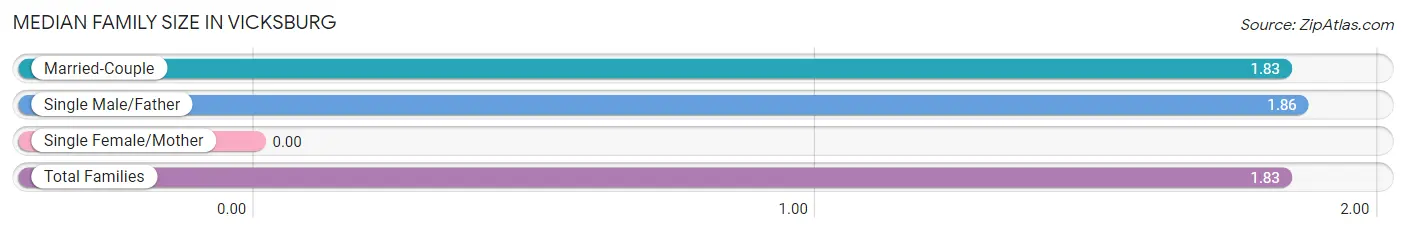
Median Family Size in Vicksburg
| Family Type | # Families | Family Size |
| Married-Couple | 224 (83.6%) | 1.83 |
| Single Male/Father | 44 (16.4%) | 1.86 |
| Single Female/Mother | 0 (0.0%) | - |
| Total Families | 268 (100.0%) | 1.83 |
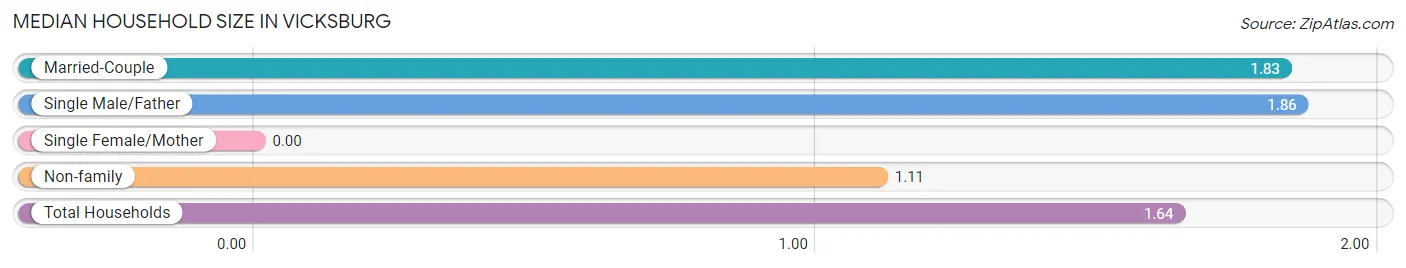
Median Household Size in Vicksburg
| Household Type | # Households | Household Size |
| Married-Couple | 224 (60.9%) | 1.83 |
| Single Male/Father | 44 (12.0%) | 1.86 |
| Single Female/Mother | 0 (0.0%) | - |
| Non-family | 100 (27.2%) | 1.11 |
| Total Households | 368 (100.0%) | 1.64 |
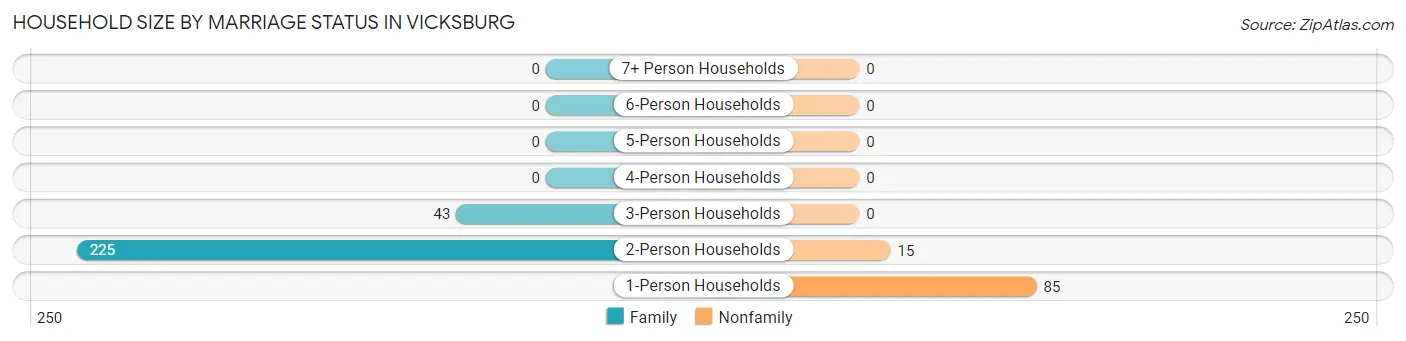
Household Size by Marriage Status in Vicksburg
Out of a total of 368 households in Vicksburg, 268 (72.8%) are family households, while 100 (27.2%) are nonfamily households. The most numerous type of family households are 2-person households, comprising 225, and the most common type of nonfamily households are 1-person households, comprising 85.
| Household Size | Family Households | Nonfamily Households |
| 1-Person Households | - | 85 (23.1%) |
| 2-Person Households | 225 (61.1%) | 15 (4.1%) |
| 3-Person Households | 43 (11.7%) | 0 (0.0%) |
| 4-Person Households | 0 (0.0%) | 0 (0.0%) |
| 5-Person Households | 0 (0.0%) | 0 (0.0%) |
| 6-Person Households | 0 (0.0%) | 0 (0.0%) |
| 7+ Person Households | 0 (0.0%) | 0 (0.0%) |
| Total | 268 (72.8%) | 100 (27.2%) |
Female Fertility in Vicksburg
Fertility by Age in Vicksburg
| Age Bracket | Women with Births | Births / 1,000 Women |
| 15 to 19 years | 0 (0.0%) | 0.0 |
| 20 to 34 years | 0 (0.0%) | 0.0 |
| 35 to 50 years | 0 (0.0%) | 0.0 |
| Total | 0 (0.0%) | 0.0 |
Fertility by Age by Marriage Status in Vicksburg
| Age Bracket | Married | Unmarried |
| 15 to 19 years | 0 (0.0%) | 0 (0.0%) |
| 20 to 34 years | 0 (0.0%) | 0 (0.0%) |
| 35 to 50 years | 0 (0.0%) | 0 (0.0%) |
| Total | 0 (0.0%) | 0 (0.0%) |
Fertility by Education in Vicksburg
| Educational Attainment | Women with Births | Births / 1,000 Women |
| Less than High School | 0 (0.0%) | 0.0 |
| High School Diploma | 0 (0.0%) | 0.0 |
| College or Associate's Degree | 0 (0.0%) | 0.0 |
| Bachelor's Degree | 0 (0.0%) | 0.0 |
| Graduate Degree | 0 (0.0%) | 0.0 |
| Total | 0 (0.0%) | 0.0 |
Fertility by Education by Marriage Status in Vicksburg
| Educational Attainment | Married | Unmarried |
| Less than High School | 0 (0.0%) | 0 (0.0%) |
| High School Diploma | 0 (0.0%) | 0 (0.0%) |
| College or Associate's Degree | 0 (0.0%) | 0 (0.0%) |
| Bachelor's Degree | 0 (0.0%) | 0 (0.0%) |
| Graduate Degree | 0 (0.0%) | 0 (0.0%) |
| Total | 0 (0.0%) | 0 (0.0%) |
Employment Characteristics in Vicksburg
Employment by Class of Employer in Vicksburg
Among the 219 employed individuals in Vicksburg, self-employed (incorporated) (115 | 52.5%), private company employees (102 | 46.6%), and self-employed (not incorporated) (2 | 0.9%) make up the most common classes of employment.
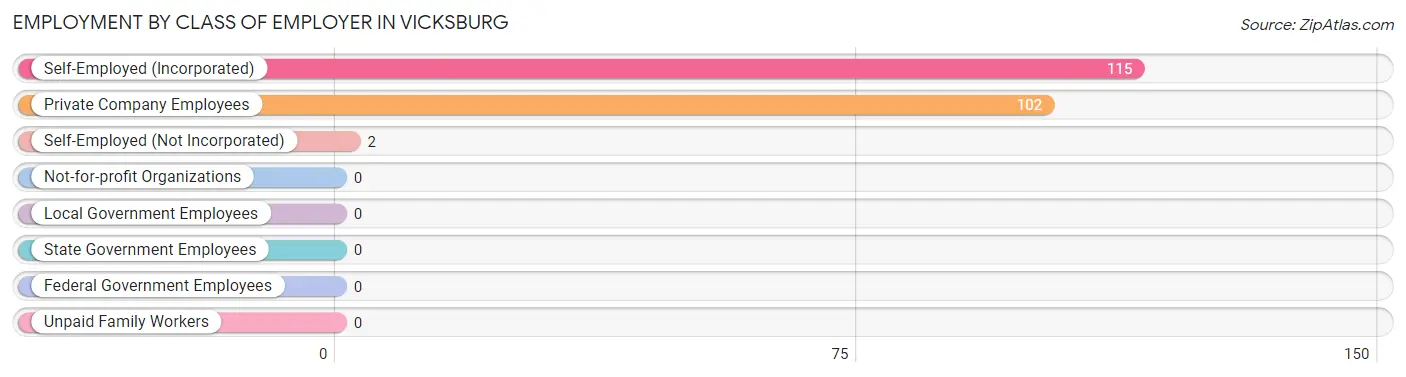
| Employer Class | # Employees | % Employees |
| Private Company Employees | 102 | 46.6% |
| Self-Employed (Incorporated) | 115 | 52.5% |
| Self-Employed (Not Incorporated) | 2 | 0.9% |
| Not-for-profit Organizations | 0 | 0.0% |
| Local Government Employees | 0 | 0.0% |
| State Government Employees | 0 | 0.0% |
| Federal Government Employees | 0 | 0.0% |
| Unpaid Family Workers | 0 | 0.0% |
| Total | 219 | 100.0% |
Employment Status by Age in Vicksburg
According to the labor force statistics for Vicksburg, out of the total population over 16 years of age (602), 37.7% or 227 individuals are in the labor force, with 3.5% or 8 of them unemployed. The age group with the highest labor force participation rate is 16 to 19 years, with 100.0% or 34 individuals in the labor force. Within the labor force, the 65 to 74 years age range has the highest percentage of unemployed individuals, with 66.7% or 8 of them being unemployed.
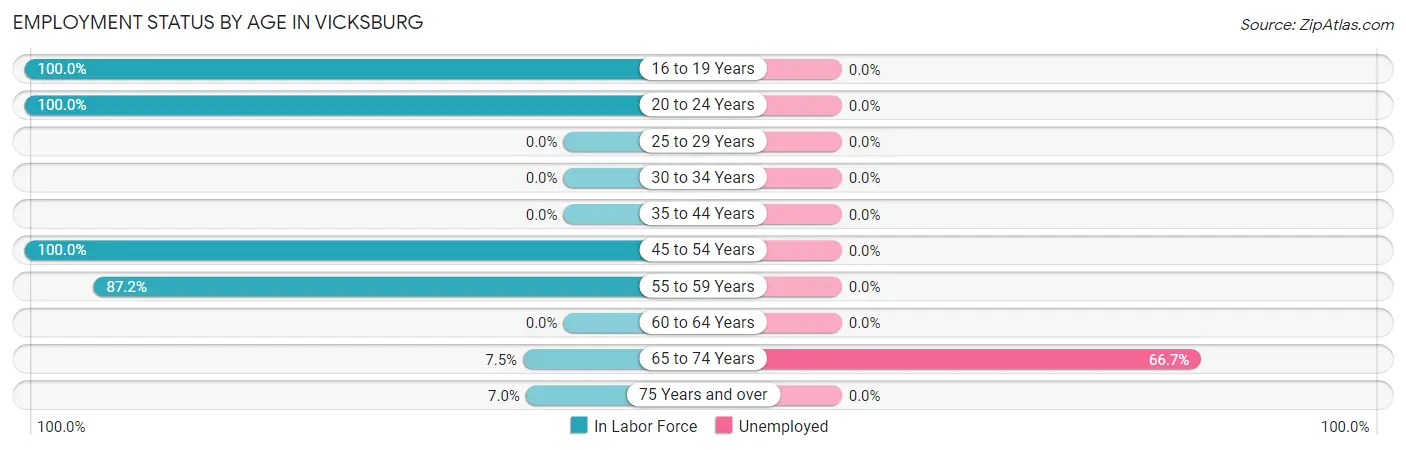
| Age Bracket | In Labor Force | Unemployed |
| 16 to 19 Years | 34 (100.0%) | 0 (0.0%) |
| 20 to 24 Years | 42 (100.0%) | 0 (0.0%) |
| 25 to 29 Years | 0 (0.0%) | 0 (0.0%) |
| 30 to 34 Years | 0 (0.0%) | 0 (0.0%) |
| 35 to 44 Years | 0 (0.0%) | 0 (0.0%) |
| 45 to 54 Years | 83 (100.0%) | 0 (0.0%) |
| 55 to 59 Years | 41 (87.2%) | 0 (0.0%) |
| 60 to 64 Years | 0 (0.0%) | 0 (0.0%) |
| 65 to 74 Years | 12 (7.5%) | 8 (66.7%) |
| 75 Years and over | 15 (7.0%) | 0 (0.0%) |
| Total | 227 (37.7%) | 8 (3.5%) |
Employment Status by Educational Attainment in Vicksburg
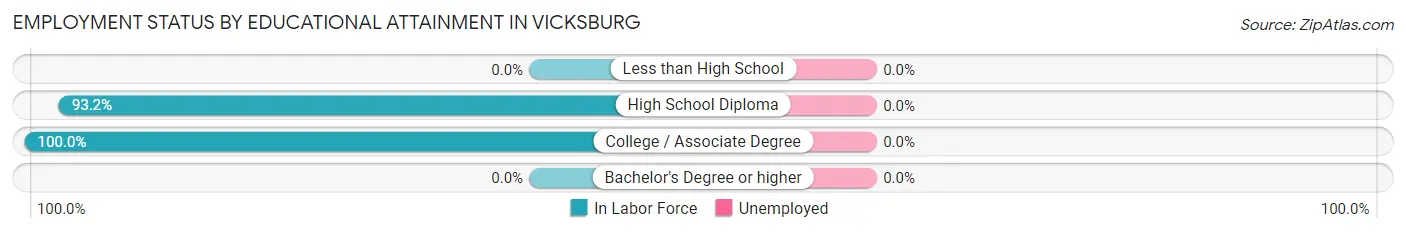
| Educational Attainment | In Labor Force | Unemployed |
| Less than High School | 0 (0.0%) | 0 (0.0%) |
| High School Diploma | 82 (93.2%) | 0 (0.0%) |
| College / Associate Degree | 42 (100.0%) | 0 (0.0%) |
| Bachelor's Degree or higher | 0 (0.0%) | 0 (0.0%) |
| Total | 124 (81.6%) | 0 (0.0%) |
Employment Occupations by Sex in Vicksburg
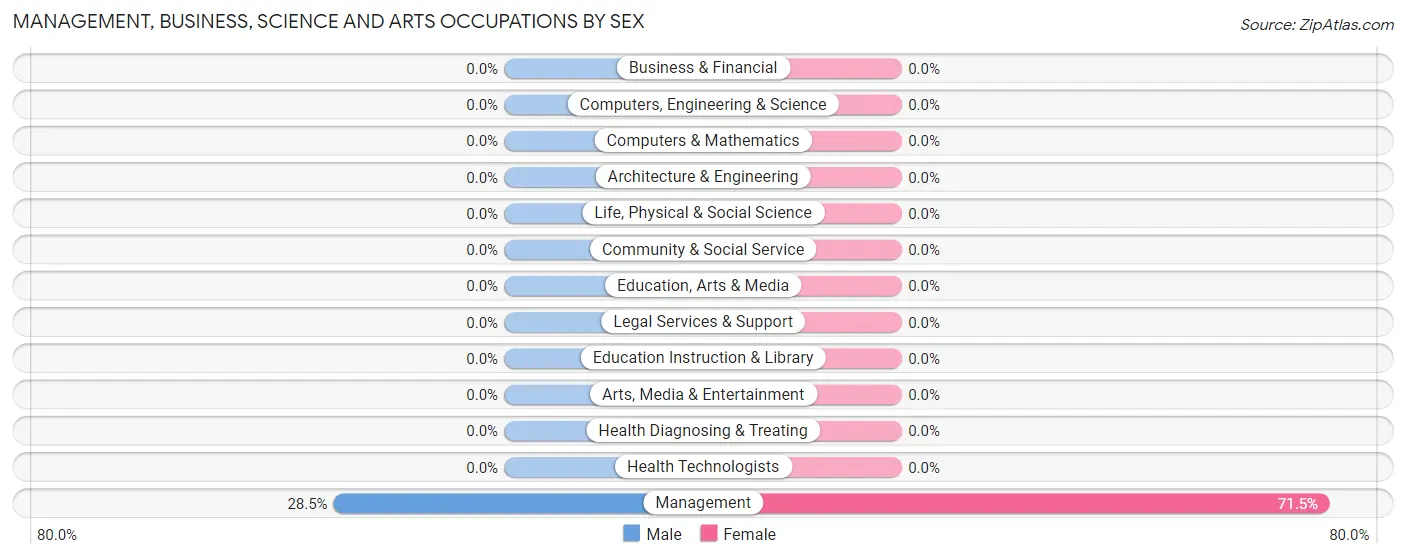
Management, Business, Science and Arts Occupations
The most common Management, Business, Science and Arts occupations in Vicksburg are , and Management (130 | 59.4%).
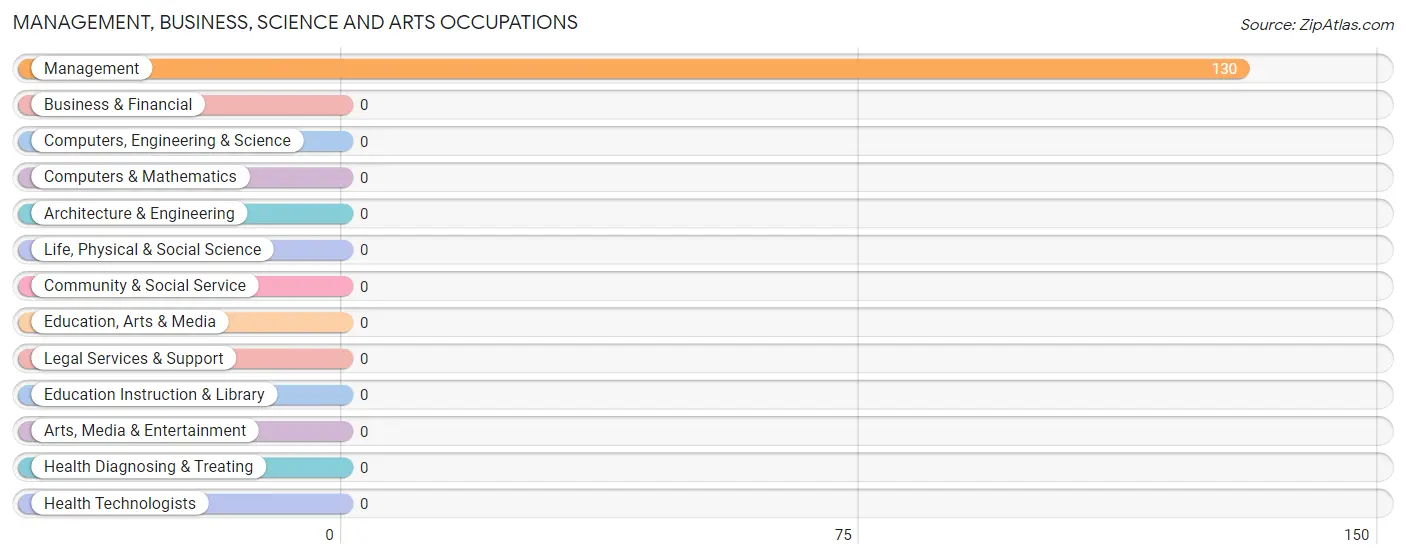
Management, Business, Science and Arts Occupations by Sex
| Occupation | Male | Female |
| Management | 37 (28.5%) | 93 (71.5%) |
| Business & Financial | 0 (0.0%) | 0 (0.0%) |
| Computers, Engineering & Science | 0 (0.0%) | 0 (0.0%) |
| Computers & Mathematics | 0 (0.0%) | 0 (0.0%) |
| Architecture & Engineering | 0 (0.0%) | 0 (0.0%) |
| Life, Physical & Social Science | 0 (0.0%) | 0 (0.0%) |
| Community & Social Service | 0 (0.0%) | 0 (0.0%) |
| Education, Arts & Media | 0 (0.0%) | 0 (0.0%) |
| Legal Services & Support | 0 (0.0%) | 0 (0.0%) |
| Education Instruction & Library | 0 (0.0%) | 0 (0.0%) |
| Arts, Media & Entertainment | 0 (0.0%) | 0 (0.0%) |
| Health Diagnosing & Treating | 0 (0.0%) | 0 (0.0%) |
| Health Technologists | 0 (0.0%) | 0 (0.0%) |
| Total (Category) | 37 (28.5%) | 93 (71.5%) |
| Total (Overall) | 92 (42.0%) | 127 (58.0%) |
Services Occupations
The most common Services occupations in Vicksburg are , and Food Preparation & Serving (30 | 13.7%).
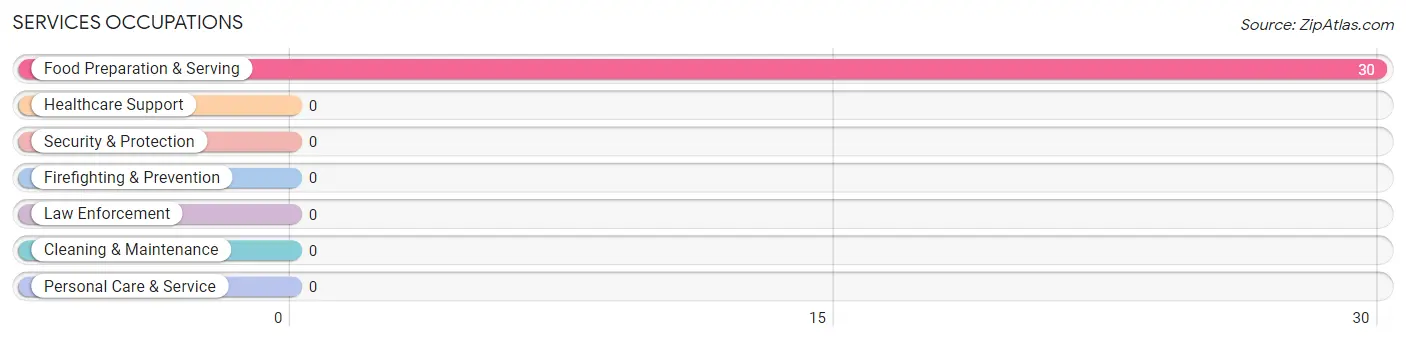
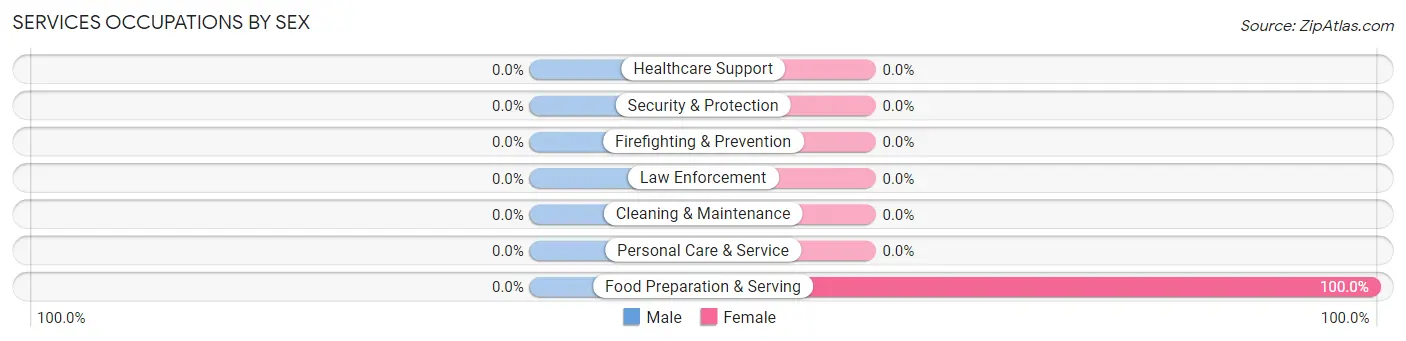
Services Occupations by Sex
| Occupation | Male | Female |
| Healthcare Support | 0 (0.0%) | 0 (0.0%) |
| Security & Protection | 0 (0.0%) | 0 (0.0%) |
| Firefighting & Prevention | 0 (0.0%) | 0 (0.0%) |
| Law Enforcement | 0 (0.0%) | 0 (0.0%) |
| Food Preparation & Serving | 0 (0.0%) | 30 (100.0%) |
| Cleaning & Maintenance | 0 (0.0%) | 0 (0.0%) |
| Personal Care & Service | 0 (0.0%) | 0 (0.0%) |
| Total (Category) | 0 (0.0%) | 30 (100.0%) |
| Total (Overall) | 92 (42.0%) | 127 (58.0%) |
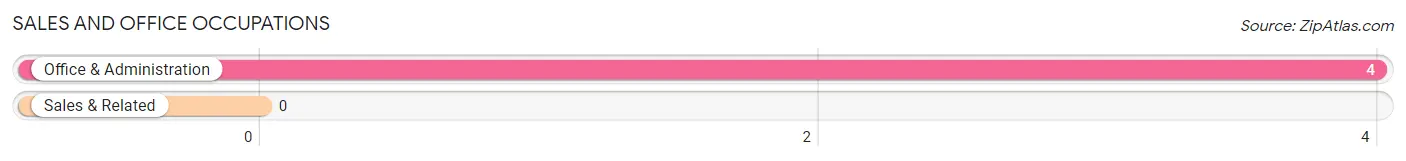
Sales and Office Occupations
The most common Sales and Office occupations in Vicksburg are , and Office & Administration (4 | 1.8%).
Sales and Office Occupations by Sex
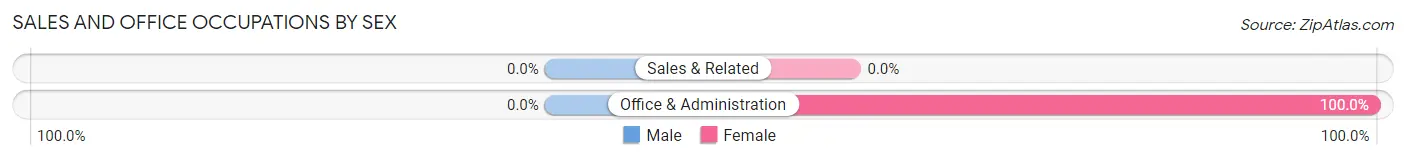
| Occupation | Male | Female |
| Sales & Related | 0 (0.0%) | 0 (0.0%) |
| Office & Administration | 0 (0.0%) | 4 (100.0%) |
| Total (Category) | 0 (0.0%) | 4 (100.0%) |
| Total (Overall) | 92 (42.0%) | 127 (58.0%) |
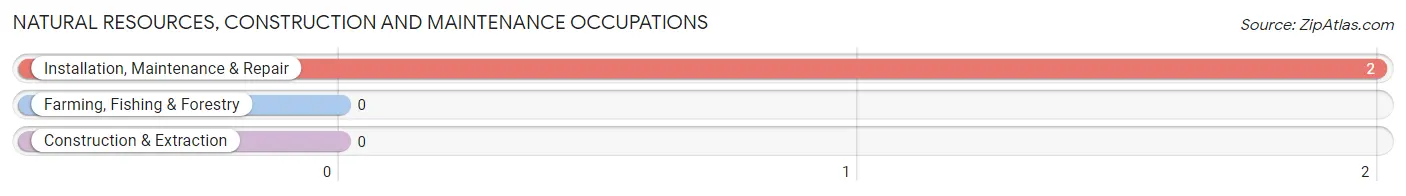
Natural Resources, Construction and Maintenance Occupations
The most common Natural Resources, Construction and Maintenance occupations in Vicksburg are , and Installation, Maintenance & Repair (2 | 0.9%).
Natural Resources, Construction and Maintenance Occupations by Sex
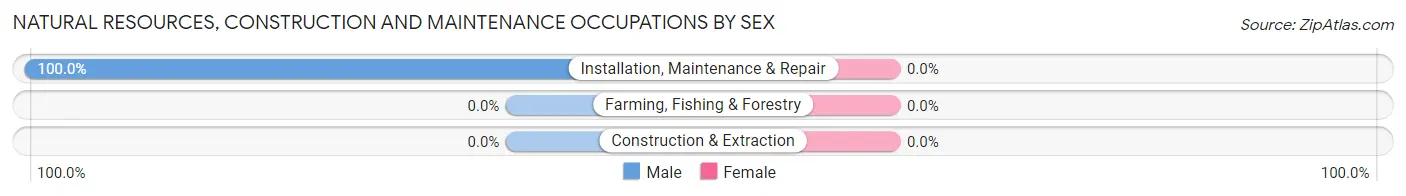
| Occupation | Male | Female |
| Farming, Fishing & Forestry | 0 (0.0%) | 0 (0.0%) |
| Construction & Extraction | 0 (0.0%) | 0 (0.0%) |
| Installation, Maintenance & Repair | 2 (100.0%) | 0 (0.0%) |
| Total (Category) | 2 (100.0%) | 0 (0.0%) |
| Total (Overall) | 92 (42.0%) | 127 (58.0%) |
Production, Transportation and Moving Occupations
The most common Production, Transportation and Moving occupations in Vicksburg are Production (47 | 21.5%), and Transportation (6 | 2.7%).
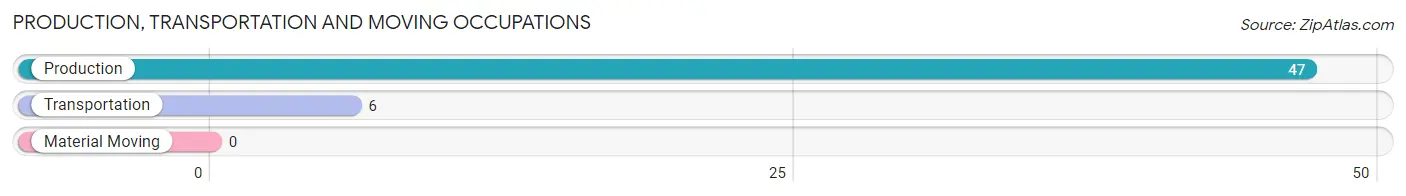
Production, Transportation and Moving Occupations by Sex
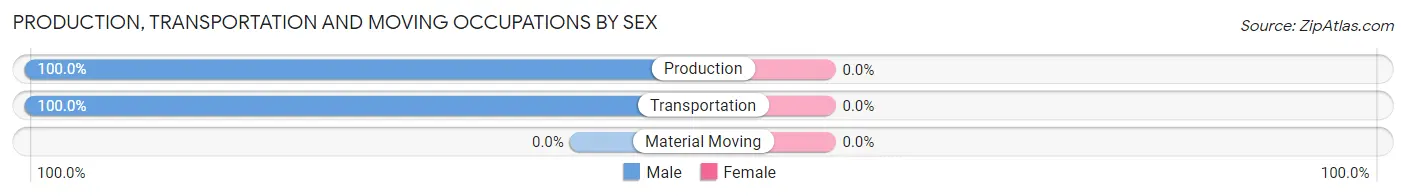
| Occupation | Male | Female |
| Production | 47 (100.0%) | 0 (0.0%) |
| Transportation | 6 (100.0%) | 0 (0.0%) |
| Material Moving | 0 (0.0%) | 0 (0.0%) |
| Total (Category) | 53 (100.0%) | 0 (0.0%) |
| Total (Overall) | 92 (42.0%) | 127 (58.0%) |
Employment Industries by Sex in Vicksburg
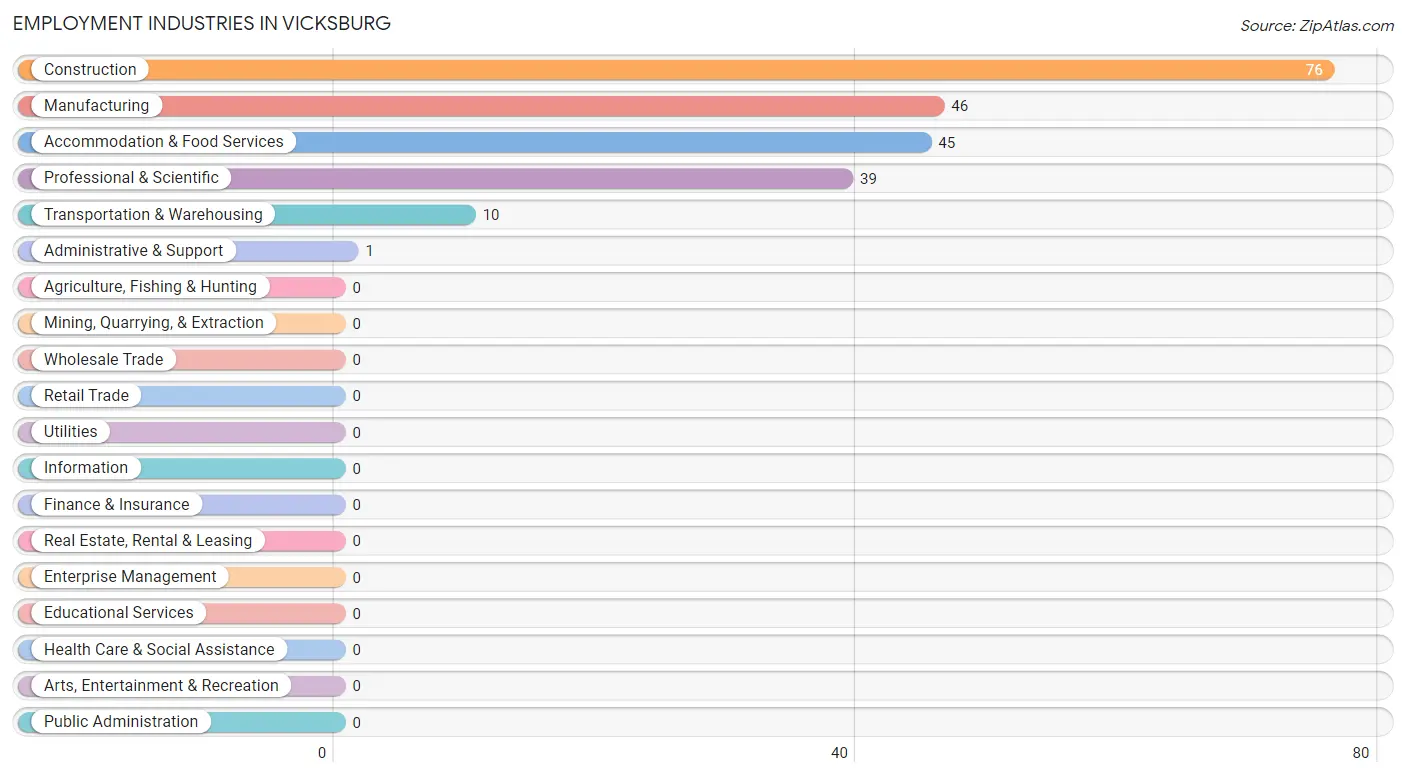
Employment Industries in Vicksburg
The major employment industries in Vicksburg include Construction (76 | 34.7%), Manufacturing (46 | 21.0%), Accommodation & Food Services (45 | 20.5%), Professional & Scientific (39 | 17.8%), and Transportation & Warehousing (10 | 4.6%).
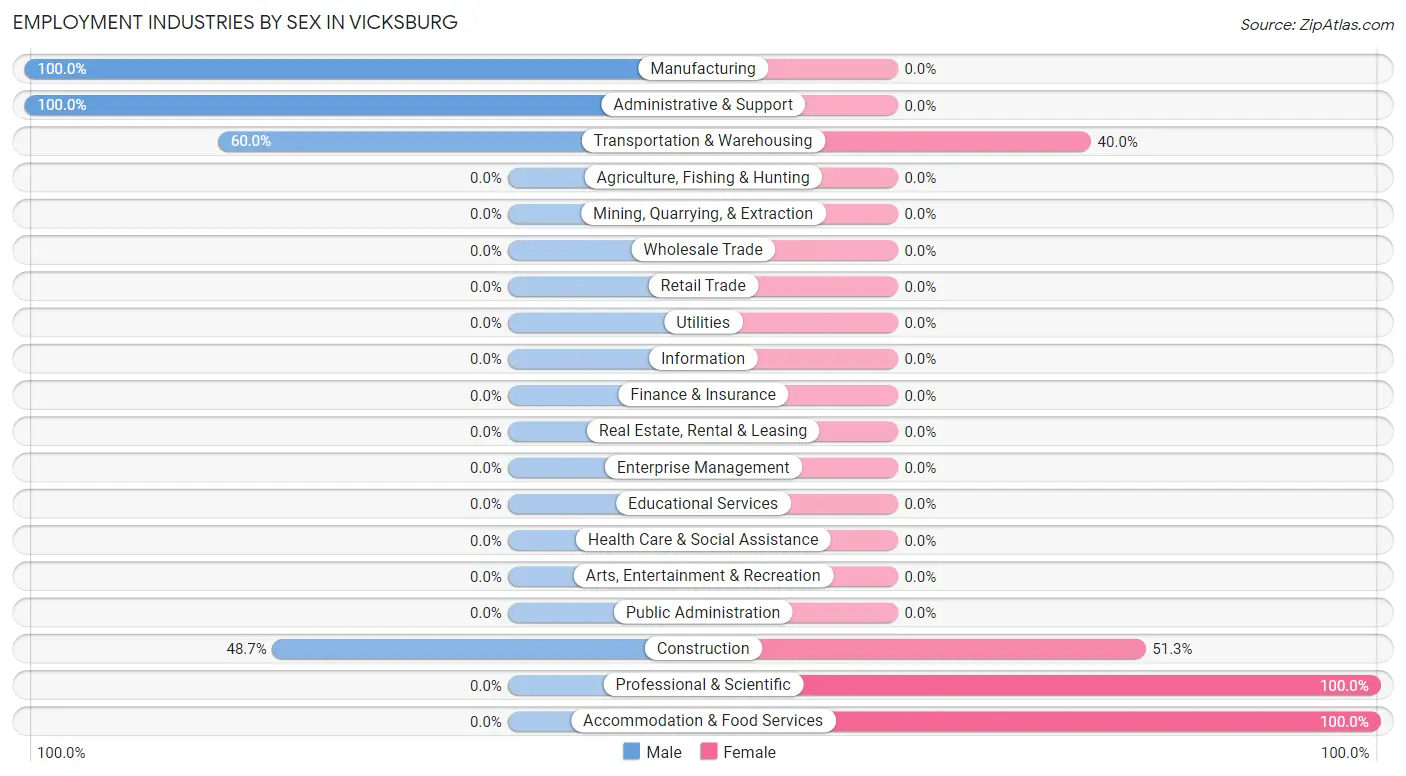
Employment Industries by Sex in Vicksburg
The Vicksburg industries that see more men than women are Manufacturing (100.0%), Administrative & Support (100.0%), and Transportation & Warehousing (60.0%), whereas the industries that tend to have a higher number of women are Professional & Scientific (100.0%), Accommodation & Food Services (100.0%), and Construction (51.3%).
| Industry | Male | Female |
| Agriculture, Fishing & Hunting | 0 (0.0%) | 0 (0.0%) |
| Mining, Quarrying, & Extraction | 0 (0.0%) | 0 (0.0%) |
| Construction | 37 (48.7%) | 39 (51.3%) |
| Manufacturing | 46 (100.0%) | 0 (0.0%) |
| Wholesale Trade | 0 (0.0%) | 0 (0.0%) |
| Retail Trade | 0 (0.0%) | 0 (0.0%) |
| Transportation & Warehousing | 6 (60.0%) | 4 (40.0%) |
| Utilities | 0 (0.0%) | 0 (0.0%) |
| Information | 0 (0.0%) | 0 (0.0%) |
| Finance & Insurance | 0 (0.0%) | 0 (0.0%) |
| Real Estate, Rental & Leasing | 0 (0.0%) | 0 (0.0%) |
| Professional & Scientific | 0 (0.0%) | 39 (100.0%) |
| Enterprise Management | 0 (0.0%) | 0 (0.0%) |
| Administrative & Support | 1 (100.0%) | 0 (0.0%) |
| Educational Services | 0 (0.0%) | 0 (0.0%) |
| Health Care & Social Assistance | 0 (0.0%) | 0 (0.0%) |
| Arts, Entertainment & Recreation | 0 (0.0%) | 0 (0.0%) |
| Accommodation & Food Services | 0 (0.0%) | 45 (100.0%) |
| Public Administration | 0 (0.0%) | 0 (0.0%) |
| Total | 92 (42.0%) | 127 (58.0%) |
Education in Vicksburg
School Enrollment in Vicksburg
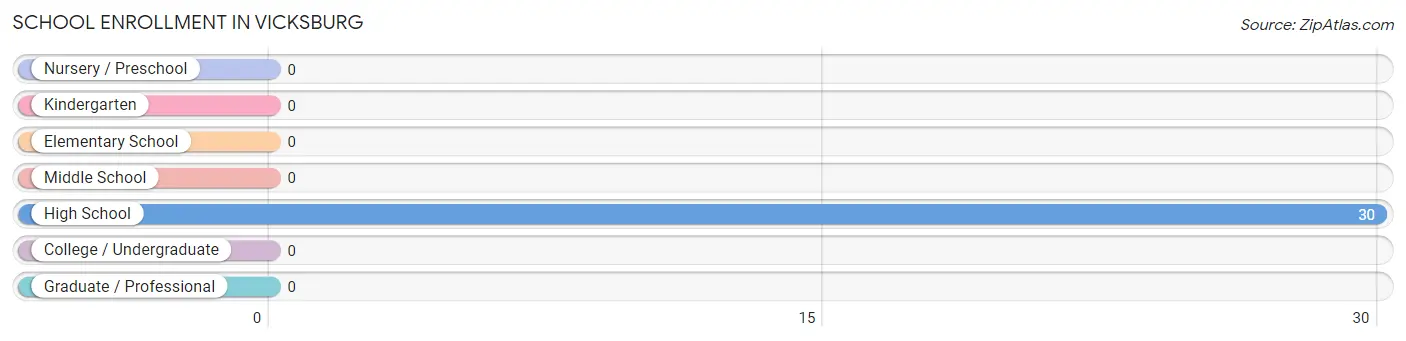
| School Level | # Students | % Students |
| Nursery / Preschool | 0 | 0.0% |
| Kindergarten | 0 | 0.0% |
| Elementary School | 0 | 0.0% |
| Middle School | 0 | 0.0% |
| High School | 30 | 100.0% |
| College / Undergraduate | 0 | 0.0% |
| Graduate / Professional | 0 | 0.0% |
| Total | 30 | 100.0% |
School Enrollment by Age by Funding Source in Vicksburg
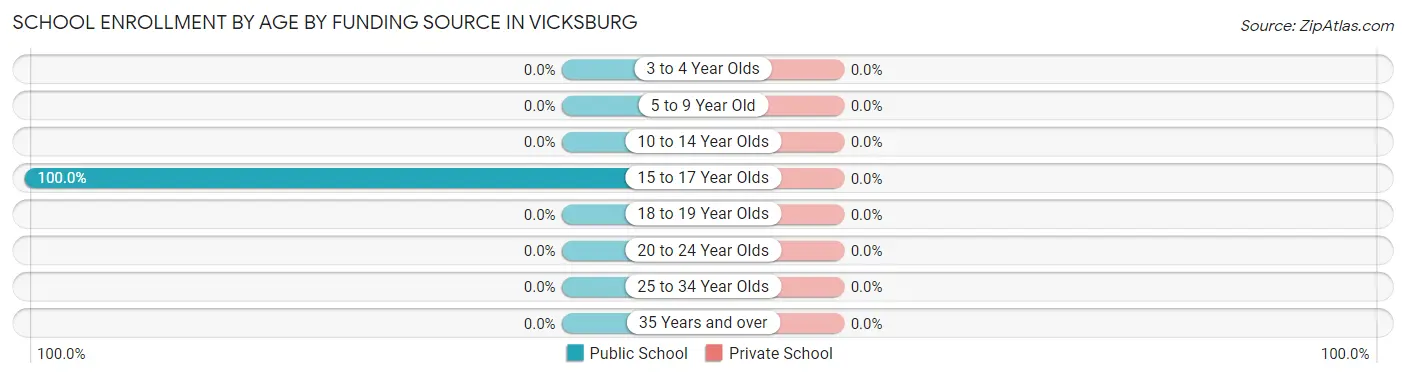
| Age Bracket | Public School | Private School |
| 3 to 4 Year Olds | 0 (0.0%) | 0 (0.0%) |
| 5 to 9 Year Old | 0 (0.0%) | 0 (0.0%) |
| 10 to 14 Year Olds | 0 (0.0%) | 0 (0.0%) |
| 15 to 17 Year Olds | 30 (100.0%) | 0 (0.0%) |
| 18 to 19 Year Olds | 0 (0.0%) | 0 (0.0%) |
| 20 to 24 Year Olds | 0 (0.0%) | 0 (0.0%) |
| 25 to 34 Year Olds | 0 (0.0%) | 0 (0.0%) |
| 35 Years and over | 0 (0.0%) | 0 (0.0%) |
| Total | 30 (100.0%) | 0 (0.0%) |
Educational Attainment by Field of Study in Vicksburg
Education (53 | 93.0%), and science & technology (4 | 7.0%) are the most common fields of study among 57 individuals in Vicksburg who have obtained a bachelor's degree or higher.
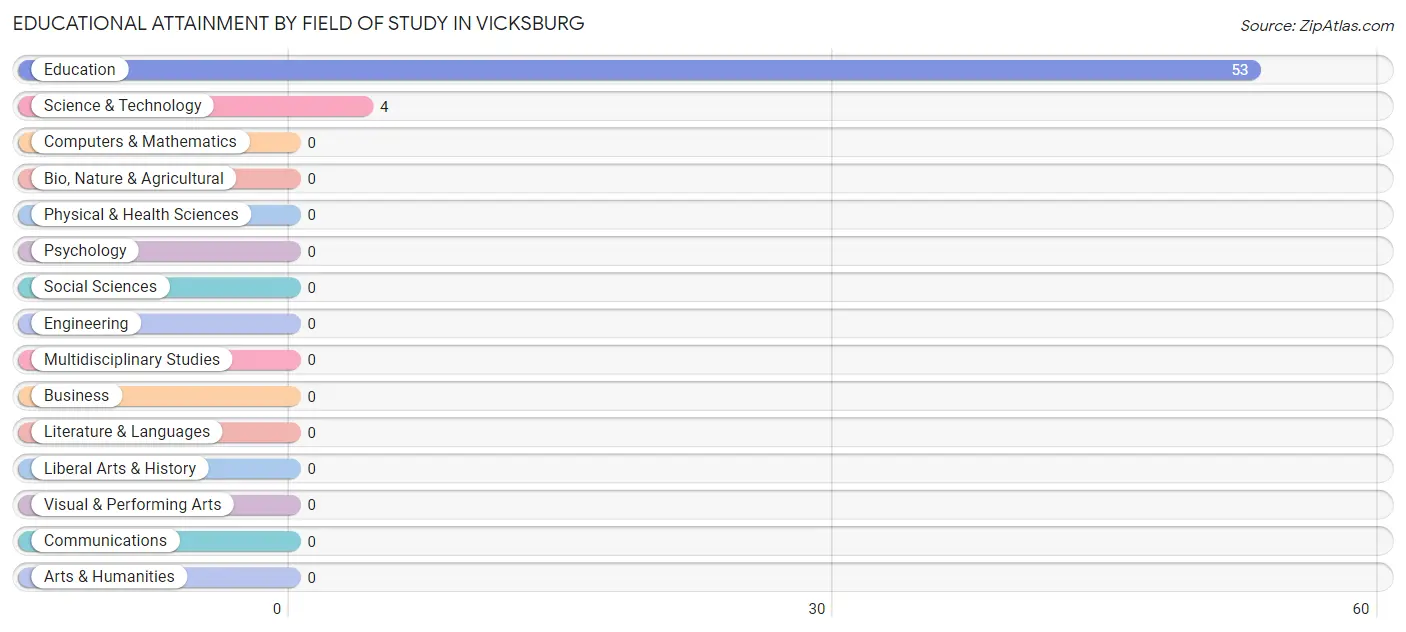
| Field of Study | # Graduates | % Graduates |
| Computers & Mathematics | 0 | 0.0% |
| Bio, Nature & Agricultural | 0 | 0.0% |
| Physical & Health Sciences | 0 | 0.0% |
| Psychology | 0 | 0.0% |
| Social Sciences | 0 | 0.0% |
| Engineering | 0 | 0.0% |
| Multidisciplinary Studies | 0 | 0.0% |
| Science & Technology | 4 | 7.0% |
| Business | 0 | 0.0% |
| Education | 53 | 93.0% |
| Literature & Languages | 0 | 0.0% |
| Liberal Arts & History | 0 | 0.0% |
| Visual & Performing Arts | 0 | 0.0% |
| Communications | 0 | 0.0% |
| Arts & Humanities | 0 | 0.0% |
| Total | 57 | 100.0% |
Transportation & Commute in Vicksburg
Vehicle Availability by Sex in Vicksburg
The most prevalent vehicle ownership categories in Vicksburg are males with 2 vehicles (85, accounting for 92.4%) and females with 2 vehicles (39, making up 66.9%).
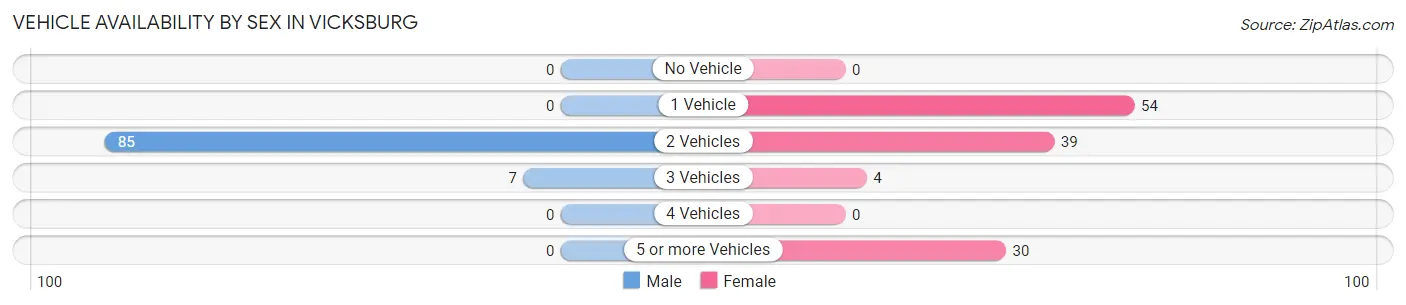
| Vehicles Available | Male | Female |
| No Vehicle | 0 (0.0%) | 0 (0.0%) |
| 1 Vehicle | 0 (0.0%) | 54 (42.5%) |
| 2 Vehicles | 85 (92.4%) | 39 (30.7%) |
| 3 Vehicles | 7 (7.6%) | 4 (3.2%) |
| 4 Vehicles | 0 (0.0%) | 0 (0.0%) |
| 5 or more Vehicles | 0 (0.0%) | 30 (23.6%) |
| Total | 92 (100.0%) | 127 (100.0%) |
Commute Time in Vicksburg
The most frequently occuring commute durations in Vicksburg are 20 to 24 minutes (80 commuters, 55.9%), 5 to 9 minutes (39 commuters, 27.3%), and less than 5 minutes (15 commuters, 10.5%).
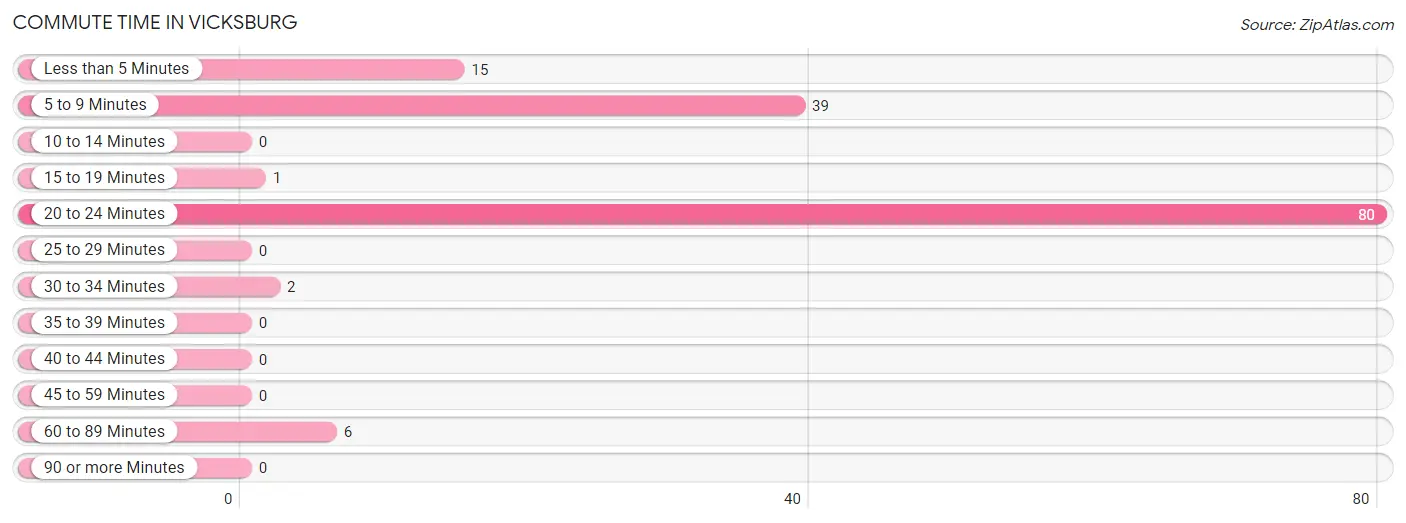
| Commute Time | # Commuters | % Commuters |
| Less than 5 Minutes | 15 | 10.5% |
| 5 to 9 Minutes | 39 | 27.3% |
| 10 to 14 Minutes | 0 | 0.0% |
| 15 to 19 Minutes | 1 | 0.7% |
| 20 to 24 Minutes | 80 | 55.9% |
| 25 to 29 Minutes | 0 | 0.0% |
| 30 to 34 Minutes | 2 | 1.4% |
| 35 to 39 Minutes | 0 | 0.0% |
| 40 to 44 Minutes | 0 | 0.0% |
| 45 to 59 Minutes | 0 | 0.0% |
| 60 to 89 Minutes | 6 | 4.2% |
| 90 or more Minutes | 0 | 0.0% |
Commute Time by Sex in Vicksburg
The most common commute times in Vicksburg are 20 to 24 minutes (46 commuters, 83.6%) for males and 5 to 9 minutes (39 commuters, 44.3%) for females.
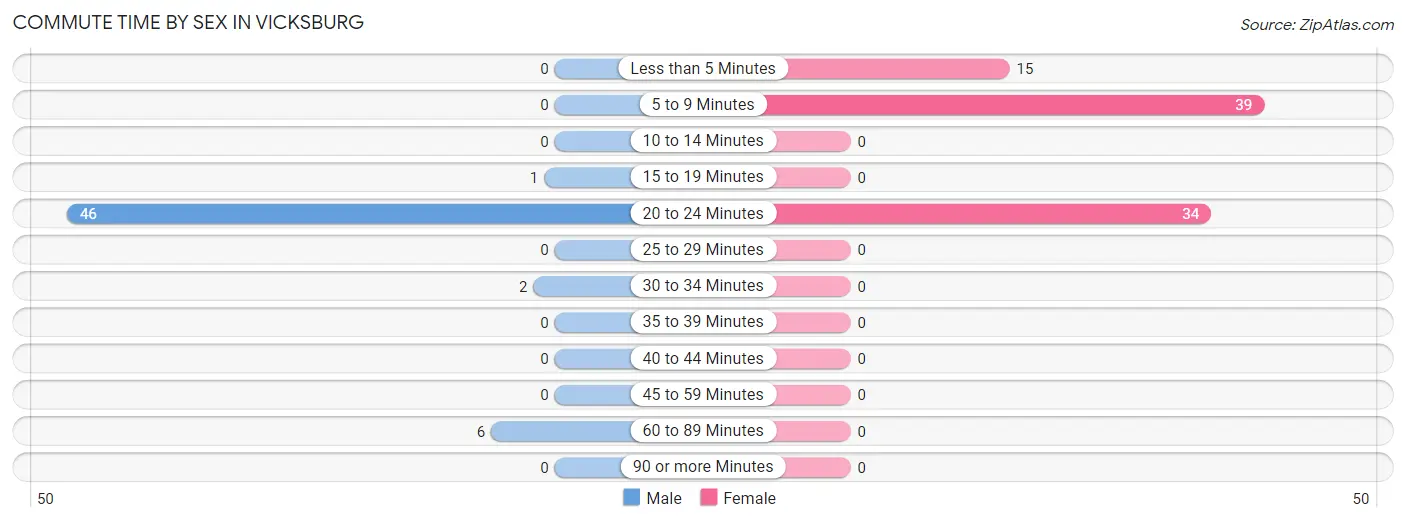
| Commute Time | Male | Female |
| Less than 5 Minutes | 0 (0.0%) | 15 (17.1%) |
| 5 to 9 Minutes | 0 (0.0%) | 39 (44.3%) |
| 10 to 14 Minutes | 0 (0.0%) | 0 (0.0%) |
| 15 to 19 Minutes | 1 (1.8%) | 0 (0.0%) |
| 20 to 24 Minutes | 46 (83.6%) | 34 (38.6%) |
| 25 to 29 Minutes | 0 (0.0%) | 0 (0.0%) |
| 30 to 34 Minutes | 2 (3.6%) | 0 (0.0%) |
| 35 to 39 Minutes | 0 (0.0%) | 0 (0.0%) |
| 40 to 44 Minutes | 0 (0.0%) | 0 (0.0%) |
| 45 to 59 Minutes | 0 (0.0%) | 0 (0.0%) |
| 60 to 89 Minutes | 6 (10.9%) | 0 (0.0%) |
| 90 or more Minutes | 0 (0.0%) | 0 (0.0%) |
Time of Departure to Work by Sex in Vicksburg
The most frequent times of departure to work in Vicksburg are 12:00 AM to 4:59 AM (49, 89.1%) for males and 6:30 AM to 6:59 AM (43, 48.9%) for females.
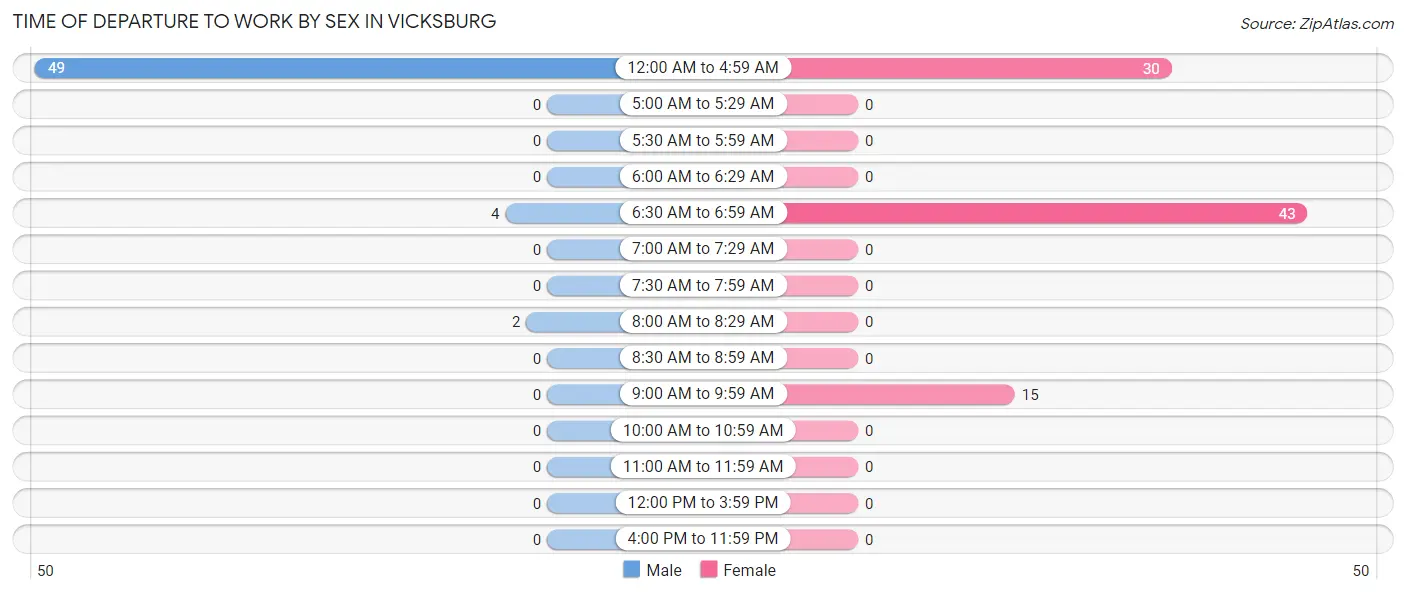
| Time of Departure | Male | Female |
| 12:00 AM to 4:59 AM | 49 (89.1%) | 30 (34.1%) |
| 5:00 AM to 5:29 AM | 0 (0.0%) | 0 (0.0%) |
| 5:30 AM to 5:59 AM | 0 (0.0%) | 0 (0.0%) |
| 6:00 AM to 6:29 AM | 0 (0.0%) | 0 (0.0%) |
| 6:30 AM to 6:59 AM | 4 (7.3%) | 43 (48.9%) |
| 7:00 AM to 7:29 AM | 0 (0.0%) | 0 (0.0%) |
| 7:30 AM to 7:59 AM | 0 (0.0%) | 0 (0.0%) |
| 8:00 AM to 8:29 AM | 2 (3.6%) | 0 (0.0%) |
| 8:30 AM to 8:59 AM | 0 (0.0%) | 0 (0.0%) |
| 9:00 AM to 9:59 AM | 0 (0.0%) | 15 (17.1%) |
| 10:00 AM to 10:59 AM | 0 (0.0%) | 0 (0.0%) |
| 11:00 AM to 11:59 AM | 0 (0.0%) | 0 (0.0%) |
| 12:00 PM to 3:59 PM | 0 (0.0%) | 0 (0.0%) |
| 4:00 PM to 11:59 PM | 0 (0.0%) | 0 (0.0%) |
| Total | 55 (100.0%) | 88 (100.0%) |
Housing Occupancy in Vicksburg
Occupancy by Ownership in Vicksburg
Of the total 368 dwellings in Vicksburg, owner-occupied units account for 286 (77.7%), while renter-occupied units make up 82 (22.3%).
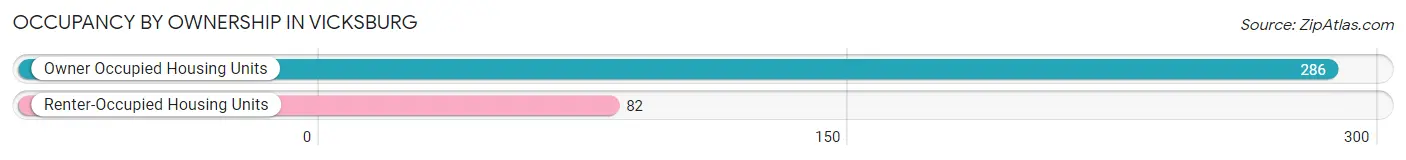
| Occupancy | # Housing Units | % Housing Units |
| Owner Occupied Housing Units | 286 | 77.7% |
| Renter-Occupied Housing Units | 82 | 22.3% |
| Total Occupied Housing Units | 368 | 100.0% |
Occupancy by Household Size in Vicksburg
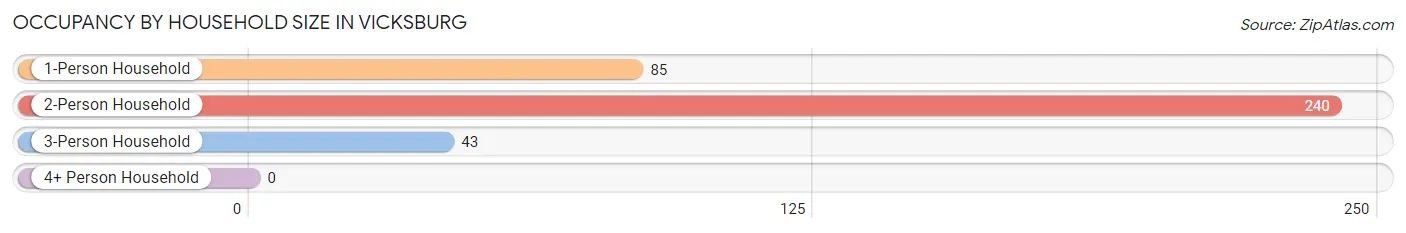
| Household Size | # Housing Units | % Housing Units |
| 1-Person Household | 85 | 23.1% |
| 2-Person Household | 240 | 65.2% |
| 3-Person Household | 43 | 11.7% |
| 4+ Person Household | 0 | 0.0% |
| Total Housing Units | 368 | 100.0% |
Occupancy by Ownership by Household Size in Vicksburg
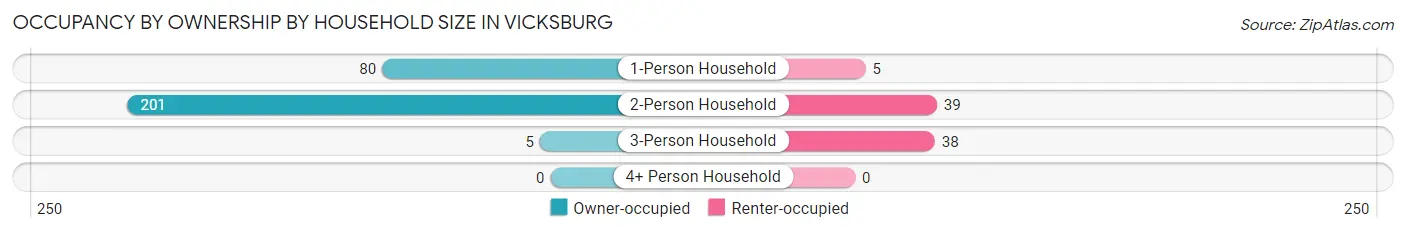
| Household Size | Owner-occupied | Renter-occupied |
| 1-Person Household | 80 (94.1%) | 5 (5.9%) |
| 2-Person Household | 201 (83.8%) | 39 (16.3%) |
| 3-Person Household | 5 (11.6%) | 38 (88.4%) |
| 4+ Person Household | 0 (0.0%) | 0 (0.0%) |
| Total Housing Units | 286 (77.7%) | 82 (22.3%) |
Occupancy by Educational Attainment in Vicksburg
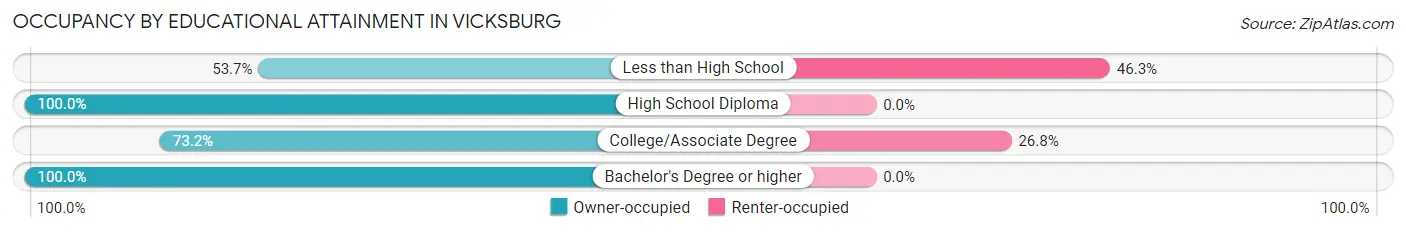
| Household Size | Owner-occupied | Renter-occupied |
| Less than High School | 44 (53.7%) | 38 (46.3%) |
| High School Diploma | 100 (100.0%) | 0 (0.0%) |
| College/Associate Degree | 120 (73.2%) | 44 (26.8%) |
| Bachelor's Degree or higher | 22 (100.0%) | 0 (0.0%) |
Occupancy by Age of Householder in Vicksburg
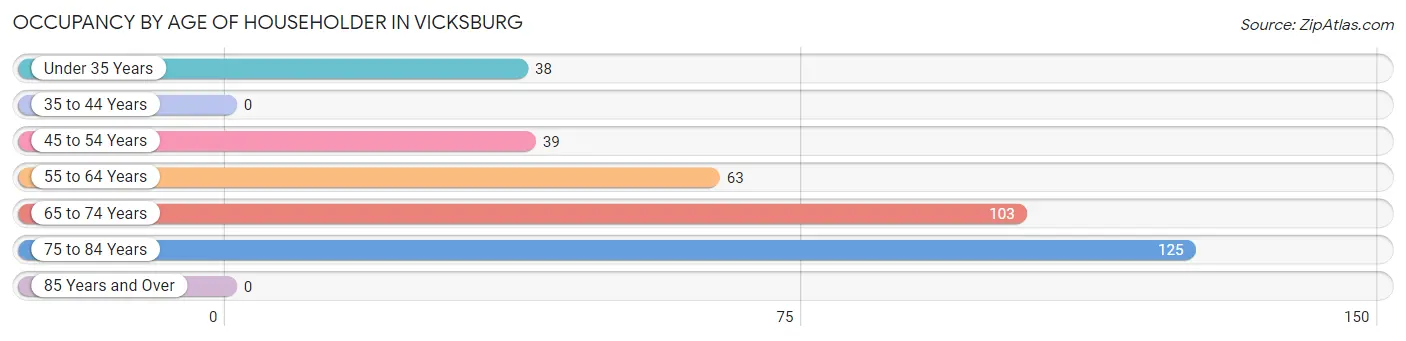
| Age Bracket | # Households | % Households |
| Under 35 Years | 38 | 10.3% |
| 35 to 44 Years | 0 | 0.0% |
| 45 to 54 Years | 39 | 10.6% |
| 55 to 64 Years | 63 | 17.1% |
| 65 to 74 Years | 103 | 28.0% |
| 75 to 84 Years | 125 | 34.0% |
| 85 Years and Over | 0 | 0.0% |
| Total | 368 | 100.0% |
Housing Finances in Vicksburg
Median Income by Occupancy in Vicksburg
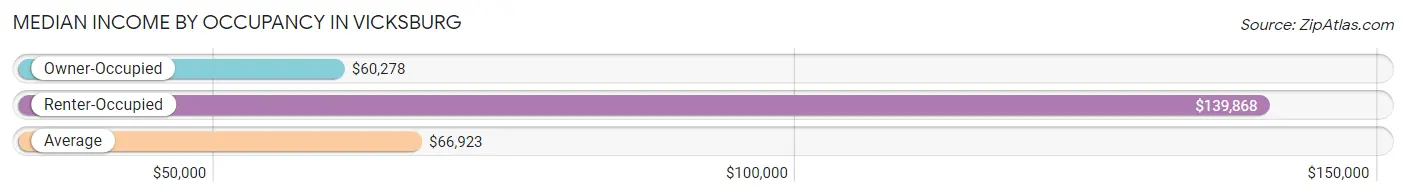
| Occupancy Type | # Households | Median Income |
| Owner-Occupied | 286 (77.7%) | $60,278 |
| Renter-Occupied | 82 (22.3%) | $139,868 |
| Average | 368 (100.0%) | $66,923 |
Occupancy by Householder Income Bracket in Vicksburg
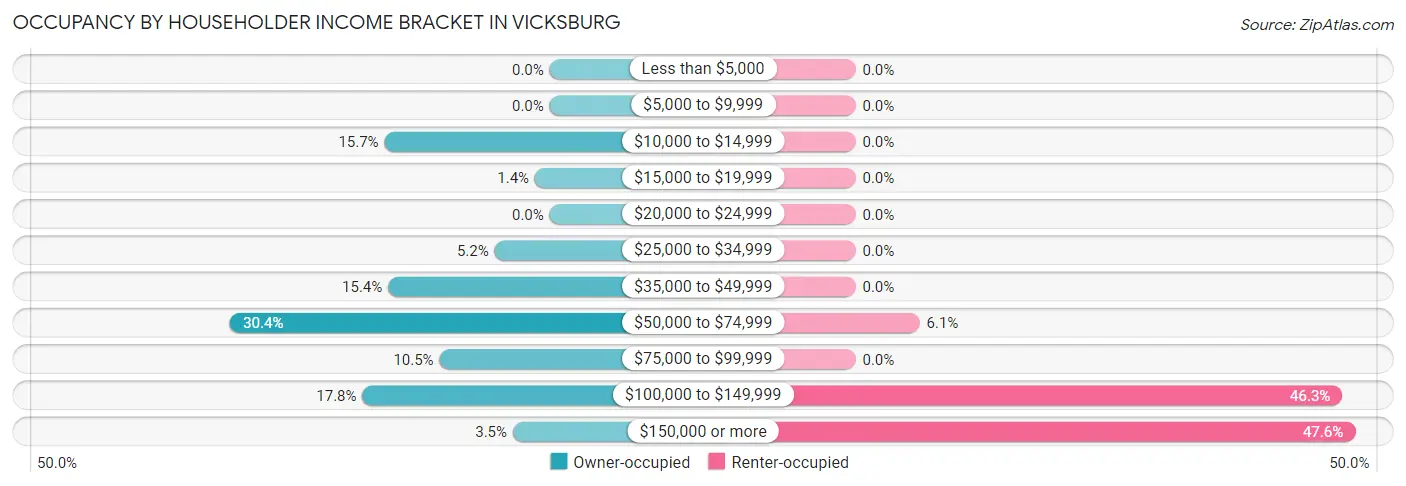
| Income Bracket | Owner-occupied | Renter-occupied |
| Less than $5,000 | 0 (0.0%) | 0 (0.0%) |
| $5,000 to $9,999 | 0 (0.0%) | 0 (0.0%) |
| $10,000 to $14,999 | 45 (15.7%) | 0 (0.0%) |
| $15,000 to $19,999 | 4 (1.4%) | 0 (0.0%) |
| $20,000 to $24,999 | 0 (0.0%) | 0 (0.0%) |
| $25,000 to $34,999 | 15 (5.2%) | 0 (0.0%) |
| $35,000 to $49,999 | 44 (15.4%) | 0 (0.0%) |
| $50,000 to $74,999 | 87 (30.4%) | 5 (6.1%) |
| $75,000 to $99,999 | 30 (10.5%) | 0 (0.0%) |
| $100,000 to $149,999 | 51 (17.8%) | 38 (46.3%) |
| $150,000 or more | 10 (3.5%) | 39 (47.6%) |
| Total | 286 (100.0%) | 82 (100.0%) |
Monthly Housing Cost Tiers in Vicksburg
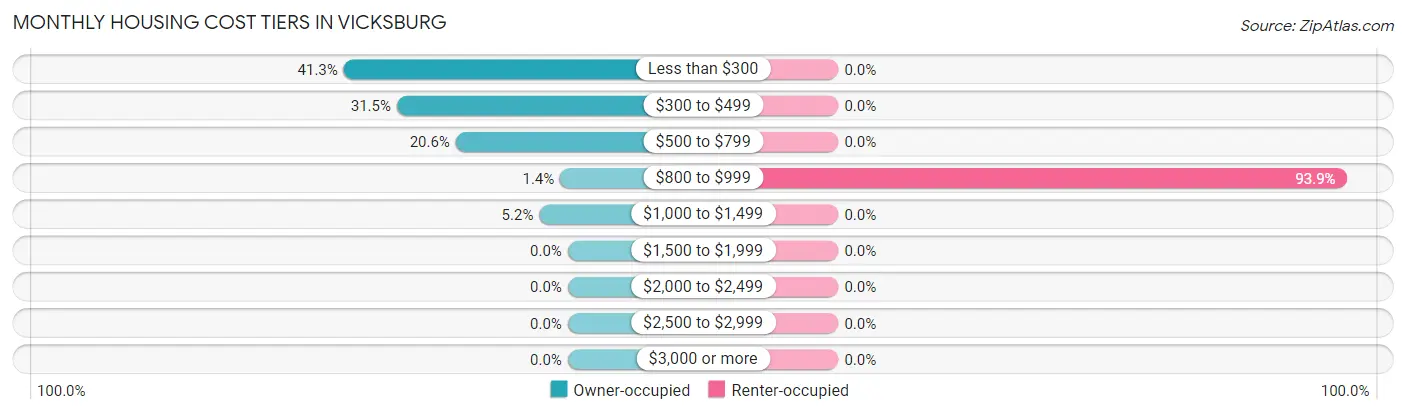
| Monthly Cost | Owner-occupied | Renter-occupied |
| Less than $300 | 118 (41.3%) | 0 (0.0%) |
| $300 to $499 | 90 (31.5%) | 0 (0.0%) |
| $500 to $799 | 59 (20.6%) | 0 (0.0%) |
| $800 to $999 | 4 (1.4%) | 77 (93.9%) |
| $1,000 to $1,499 | 15 (5.2%) | 0 (0.0%) |
| $1,500 to $1,999 | 0 (0.0%) | 0 (0.0%) |
| $2,000 to $2,499 | 0 (0.0%) | 0 (0.0%) |
| $2,500 to $2,999 | 0 (0.0%) | 0 (0.0%) |
| $3,000 or more | 0 (0.0%) | 0 (0.0%) |
| Total | 286 (100.0%) | 82 (100.0%) |
Physical Housing Characteristics in Vicksburg
Housing Structures in Vicksburg
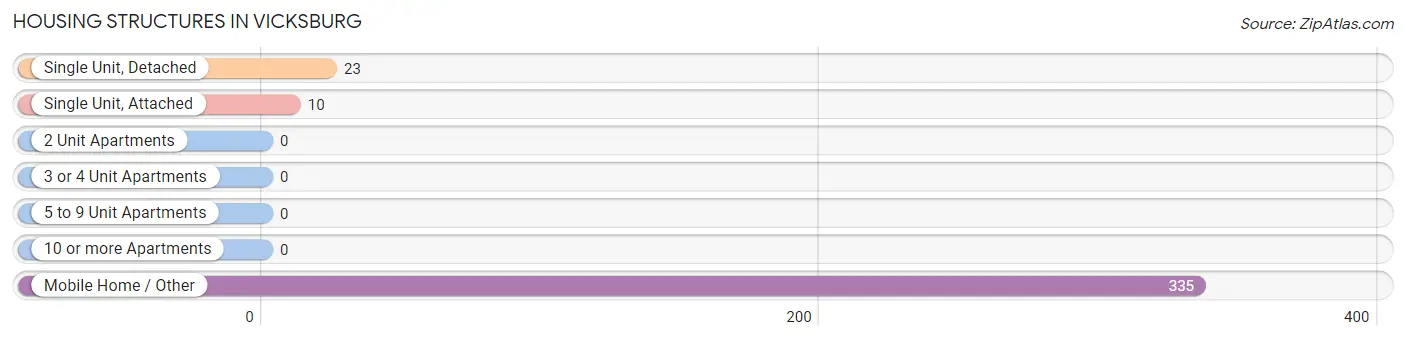
| Structure Type | # Housing Units | % Housing Units |
| Single Unit, Detached | 23 | 6.2% |
| Single Unit, Attached | 10 | 2.7% |
| 2 Unit Apartments | 0 | 0.0% |
| 3 or 4 Unit Apartments | 0 | 0.0% |
| 5 to 9 Unit Apartments | 0 | 0.0% |
| 10 or more Apartments | 0 | 0.0% |
| Mobile Home / Other | 335 | 91.0% |
| Total | 368 | 100.0% |
Housing Structures by Occupancy in Vicksburg
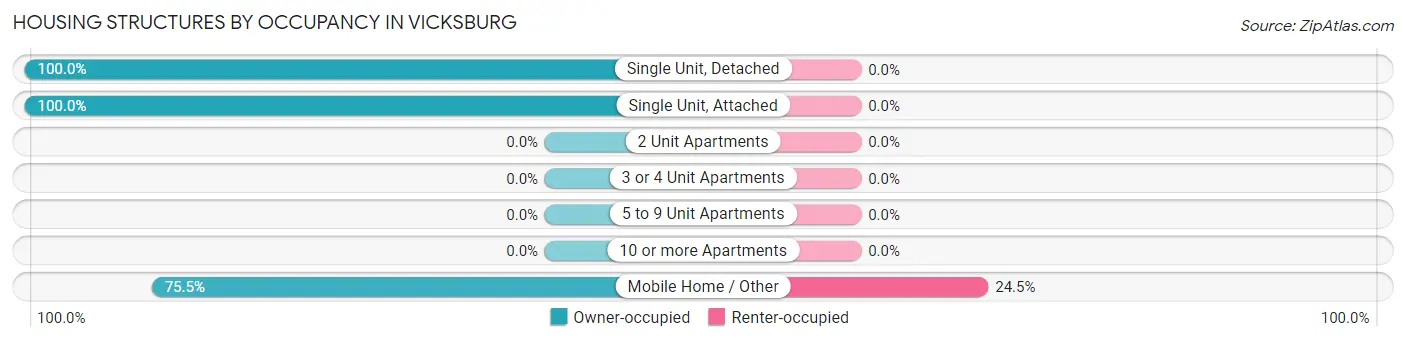
| Structure Type | Owner-occupied | Renter-occupied |
| Single Unit, Detached | 23 (100.0%) | 0 (0.0%) |
| Single Unit, Attached | 10 (100.0%) | 0 (0.0%) |
| 2 Unit Apartments | 0 (0.0%) | 0 (0.0%) |
| 3 or 4 Unit Apartments | 0 (0.0%) | 0 (0.0%) |
| 5 to 9 Unit Apartments | 0 (0.0%) | 0 (0.0%) |
| 10 or more Apartments | 0 (0.0%) | 0 (0.0%) |
| Mobile Home / Other | 253 (75.5%) | 82 (24.5%) |
| Total | 286 (77.7%) | 82 (22.3%) |
Housing Structures by Number of Rooms in Vicksburg
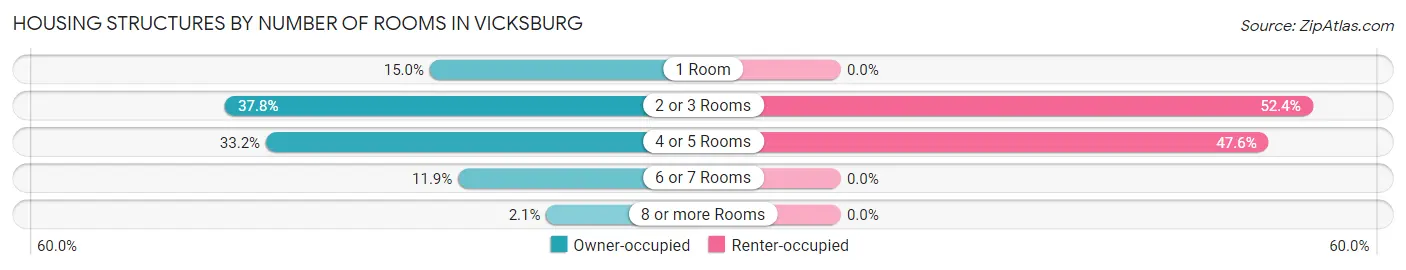
| Number of Rooms | Owner-occupied | Renter-occupied |
| 1 Room | 43 (15.0%) | 0 (0.0%) |
| 2 or 3 Rooms | 108 (37.8%) | 43 (52.4%) |
| 4 or 5 Rooms | 95 (33.2%) | 39 (47.6%) |
| 6 or 7 Rooms | 34 (11.9%) | 0 (0.0%) |
| 8 or more Rooms | 6 (2.1%) | 0 (0.0%) |
| Total | 286 (100.0%) | 82 (100.0%) |
Housing Structure by Heating Type in Vicksburg
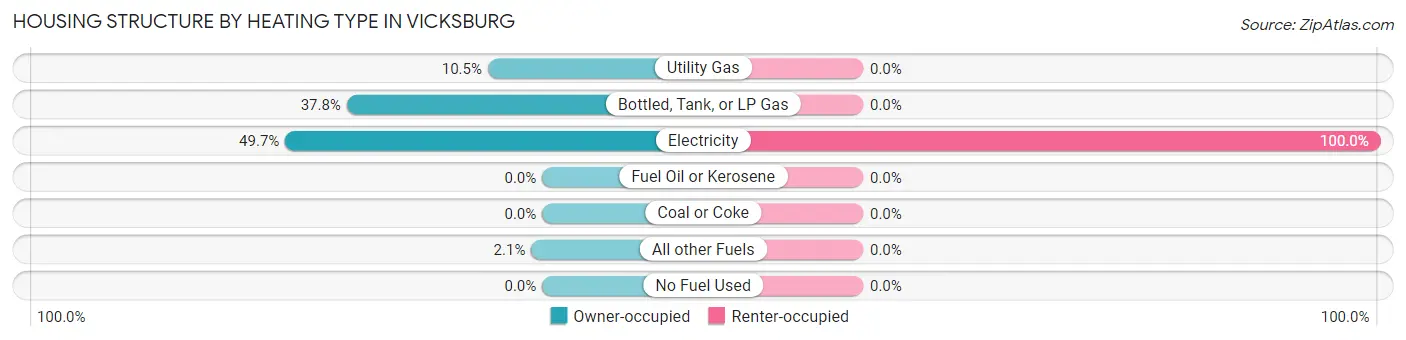
| Heating Type | Owner-occupied | Renter-occupied |
| Utility Gas | 30 (10.5%) | 0 (0.0%) |
| Bottled, Tank, or LP Gas | 108 (37.8%) | 0 (0.0%) |
| Electricity | 142 (49.6%) | 82 (100.0%) |
| Fuel Oil or Kerosene | 0 (0.0%) | 0 (0.0%) |
| Coal or Coke | 0 (0.0%) | 0 (0.0%) |
| All other Fuels | 6 (2.1%) | 0 (0.0%) |
| No Fuel Used | 0 (0.0%) | 0 (0.0%) |
| Total | 286 (100.0%) | 82 (100.0%) |
Household Vehicle Usage in Vicksburg
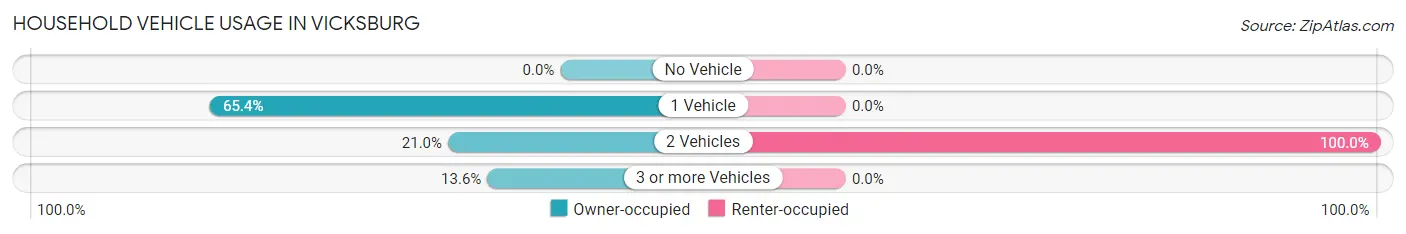
| Vehicles per Household | Owner-occupied | Renter-occupied |
| No Vehicle | 0 (0.0%) | 0 (0.0%) |
| 1 Vehicle | 187 (65.4%) | 0 (0.0%) |
| 2 Vehicles | 60 (21.0%) | 82 (100.0%) |
| 3 or more Vehicles | 39 (13.6%) | 0 (0.0%) |
| Total | 286 (100.0%) | 82 (100.0%) |
Real Estate & Mortgages in Vicksburg
Real Estate and Mortgage Overview in Vicksburg
| Characteristic | Without Mortgage | With Mortgage |
| Housing Units | 224 | 62 |
| Median Property Value | $36,400 | $125,800 |
| Median Household Income | $54,405 | $0 |
| Monthly Housing Costs | $289 | $0 |
| Real Estate Taxes | $426 | $14 |
Property Value by Mortgage Status in Vicksburg
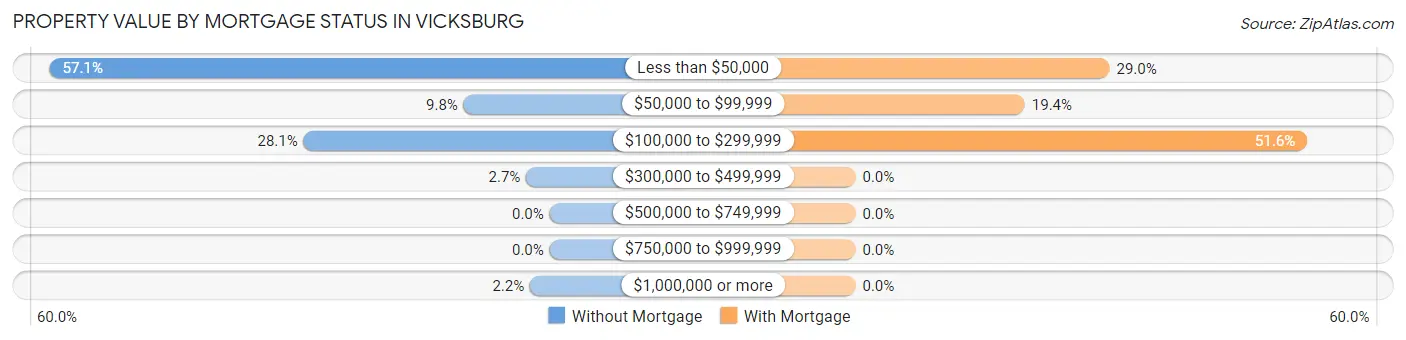
| Property Value | Without Mortgage | With Mortgage |
| Less than $50,000 | 128 (57.1%) | 18 (29.0%) |
| $50,000 to $99,999 | 22 (9.8%) | 12 (19.4%) |
| $100,000 to $299,999 | 63 (28.1%) | 32 (51.6%) |
| $300,000 to $499,999 | 6 (2.7%) | 0 (0.0%) |
| $500,000 to $749,999 | 0 (0.0%) | 0 (0.0%) |
| $750,000 to $999,999 | 0 (0.0%) | 0 (0.0%) |
| $1,000,000 or more | 5 (2.2%) | 0 (0.0%) |
| Total | 224 (100.0%) | 62 (100.0%) |
Household Income by Mortgage Status in Vicksburg
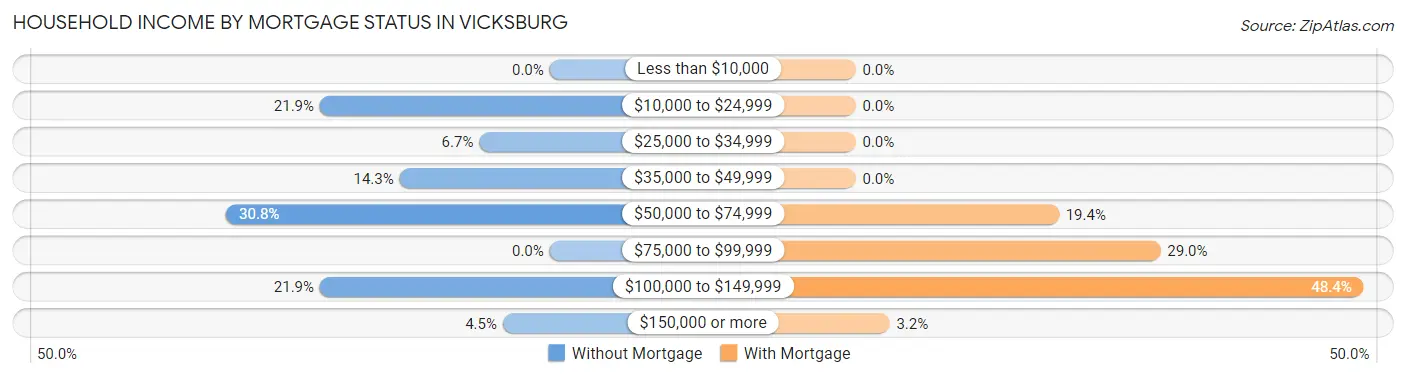
| Household Income | Without Mortgage | With Mortgage |
| Less than $10,000 | 0 (0.0%) | 0 (0.0%) |
| $10,000 to $24,999 | 49 (21.9%) | 0 (0.0%) |
| $25,000 to $34,999 | 15 (6.7%) | 0 (0.0%) |
| $35,000 to $49,999 | 32 (14.3%) | 0 (0.0%) |
| $50,000 to $74,999 | 69 (30.8%) | 12 (19.4%) |
| $75,000 to $99,999 | 0 (0.0%) | 18 (29.0%) |
| $100,000 to $149,999 | 49 (21.9%) | 30 (48.4%) |
| $150,000 or more | 10 (4.5%) | 2 (3.2%) |
| Total | 224 (100.0%) | 62 (100.0%) |
Property Value to Household Income Ratio in Vicksburg
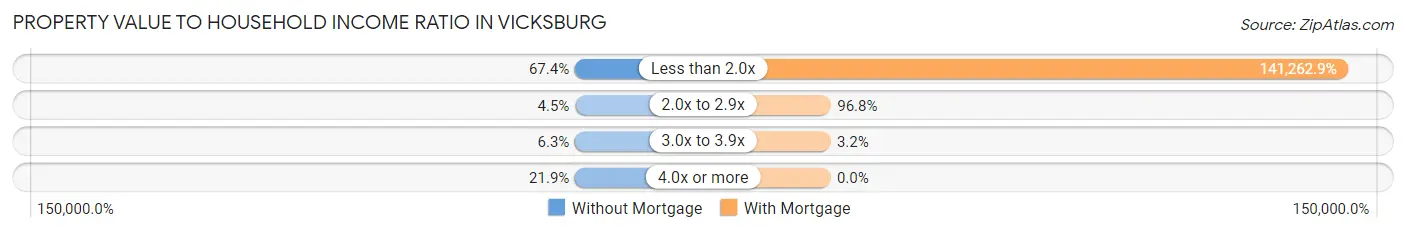
| Value-to-Income Ratio | Without Mortgage | With Mortgage |
| Less than 2.0x | 151 (67.4%) | 87,583 (141,262.9%) |
| 2.0x to 2.9x | 10 (4.5%) | 60 (96.8%) |
| 3.0x to 3.9x | 14 (6.2%) | 2 (3.2%) |
| 4.0x or more | 49 (21.9%) | 0 (0.0%) |
| Total | 224 (100.0%) | 62 (100.0%) |
Real Estate Taxes by Mortgage Status in Vicksburg
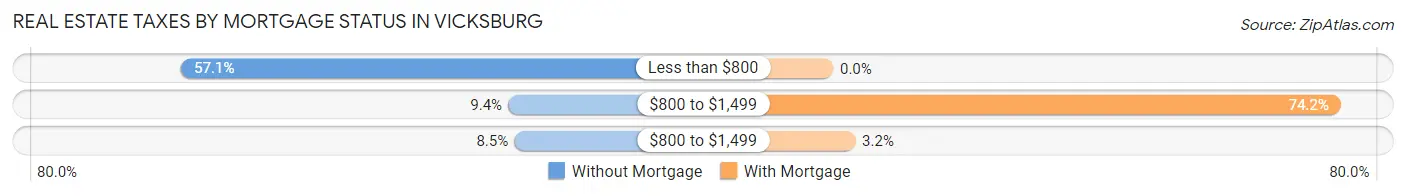
| Property Taxes | Without Mortgage | With Mortgage |
| Less than $800 | 128 (57.1%) | 0 (0.0%) |
| $800 to $1,499 | 21 (9.4%) | 46 (74.2%) |
| $800 to $1,499 | 19 (8.5%) | 2 (3.2%) |
| Total | 224 (100.0%) | 62 (100.0%) |
Health & Disability in Vicksburg
Health Insurance Coverage by Age in Vicksburg
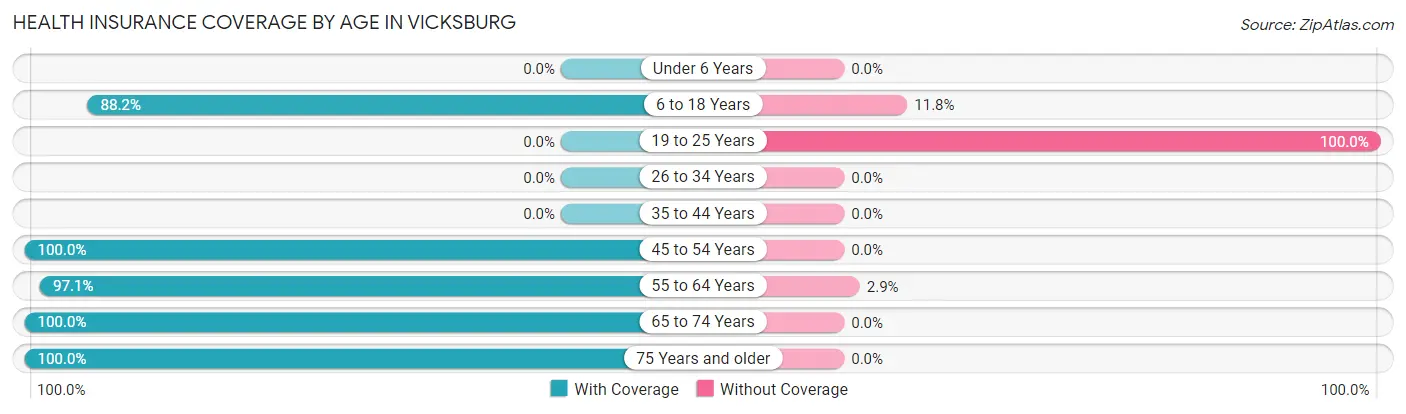
| Age Bracket | With Coverage | Without Coverage |
| Under 6 Years | 0 (0.0%) | 0 (0.0%) |
| 6 to 18 Years | 30 (88.2%) | 4 (11.8%) |
| 19 to 25 Years | 0 (0.0%) | 42 (100.0%) |
| 26 to 34 Years | 0 (0.0%) | 0 (0.0%) |
| 35 to 44 Years | 0 (0.0%) | 0 (0.0%) |
| 45 to 54 Years | 83 (100.0%) | 0 (0.0%) |
| 55 to 64 Years | 67 (97.1%) | 2 (2.9%) |
| 65 to 74 Years | 159 (100.0%) | 0 (0.0%) |
| 75 Years and older | 215 (100.0%) | 0 (0.0%) |
| Total | 554 (92.0%) | 48 (8.0%) |
Health Insurance Coverage by Citizenship Status in Vicksburg
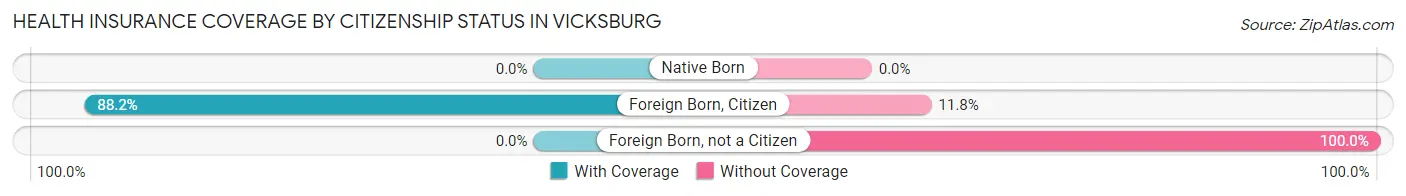
| Citizenship Status | With Coverage | Without Coverage |
| Native Born | 0 (0.0%) | 0 (0.0%) |
| Foreign Born, Citizen | 30 (88.2%) | 4 (11.8%) |
| Foreign Born, not a Citizen | 0 (0.0%) | 42 (100.0%) |
Health Insurance Coverage by Household Income in Vicksburg
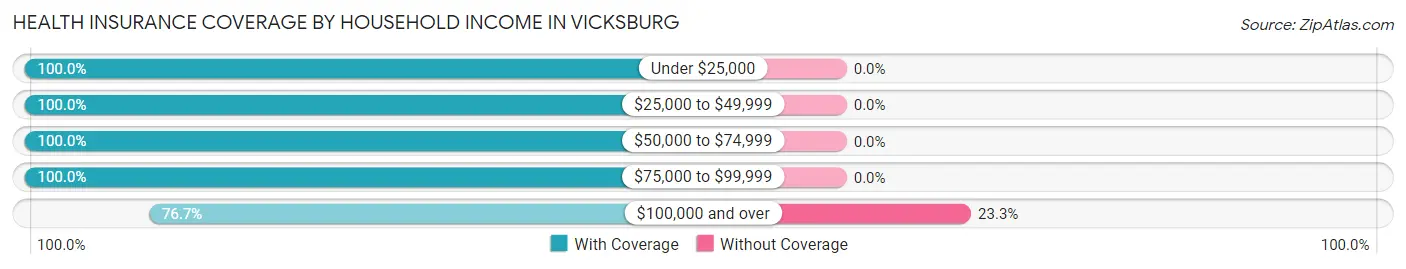
| Household Income | With Coverage | Without Coverage |
| Under $25,000 | 60 (100.0%) | 0 (0.0%) |
| $25,000 to $49,999 | 102 (100.0%) | 0 (0.0%) |
| $50,000 to $74,999 | 173 (100.0%) | 0 (0.0%) |
| $75,000 to $99,999 | 61 (100.0%) | 0 (0.0%) |
| $100,000 and over | 158 (76.7%) | 48 (23.3%) |
Public vs Private Health Insurance Coverage by Age in Vicksburg
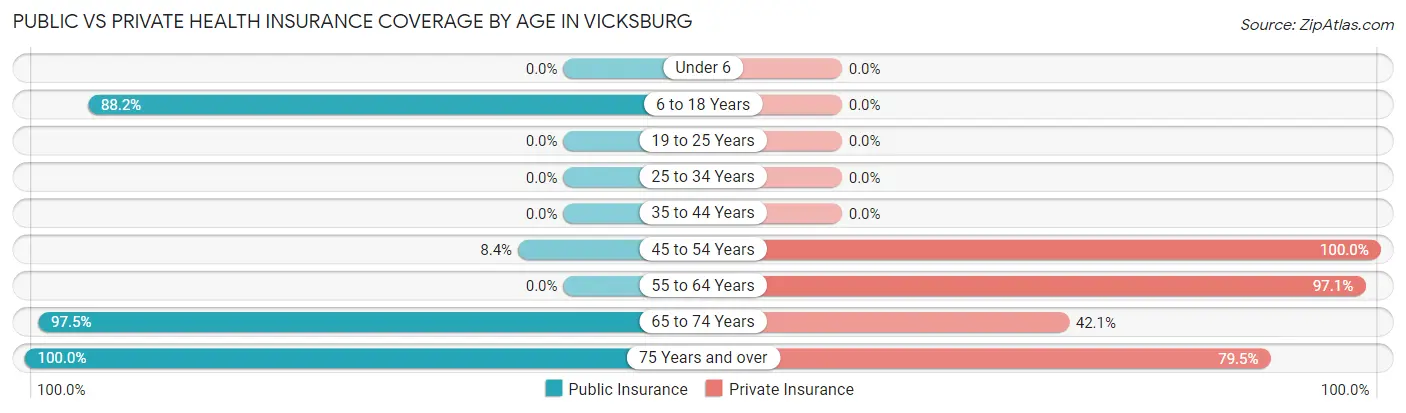
| Age Bracket | Public Insurance | Private Insurance |
| Under 6 | 0 (0.0%) | 0 (0.0%) |
| 6 to 18 Years | 30 (88.2%) | 0 (0.0%) |
| 19 to 25 Years | 0 (0.0%) | 0 (0.0%) |
| 25 to 34 Years | 0 (0.0%) | 0 (0.0%) |
| 35 to 44 Years | 0 (0.0%) | 0 (0.0%) |
| 45 to 54 Years | 7 (8.4%) | 83 (100.0%) |
| 55 to 64 Years | 0 (0.0%) | 67 (97.1%) |
| 65 to 74 Years | 155 (97.5%) | 67 (42.1%) |
| 75 Years and over | 215 (100.0%) | 171 (79.5%) |
| Total | 407 (67.6%) | 388 (64.4%) |
Disability Status by Sex by Age in Vicksburg
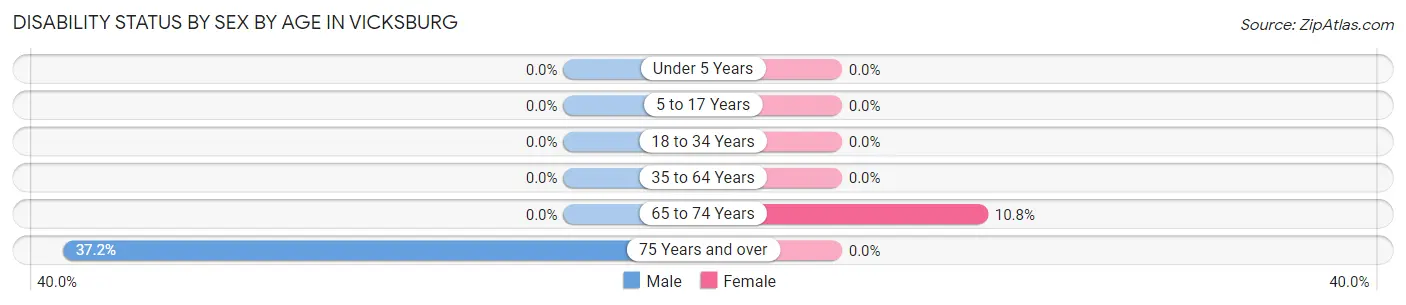
| Age Bracket | Male | Female |
| Under 5 Years | 0 (0.0%) | 0 (0.0%) |
| 5 to 17 Years | 0 (0.0%) | 0 (0.0%) |
| 18 to 34 Years | 0 (0.0%) | 0 (0.0%) |
| 35 to 64 Years | 0 (0.0%) | 0 (0.0%) |
| 65 to 74 Years | 0 (0.0%) | 9 (10.8%) |
| 75 Years and over | 42 (37.2%) | 0 (0.0%) |
Disability Class by Sex by Age in Vicksburg
Disability Class: Hearing Difficulty
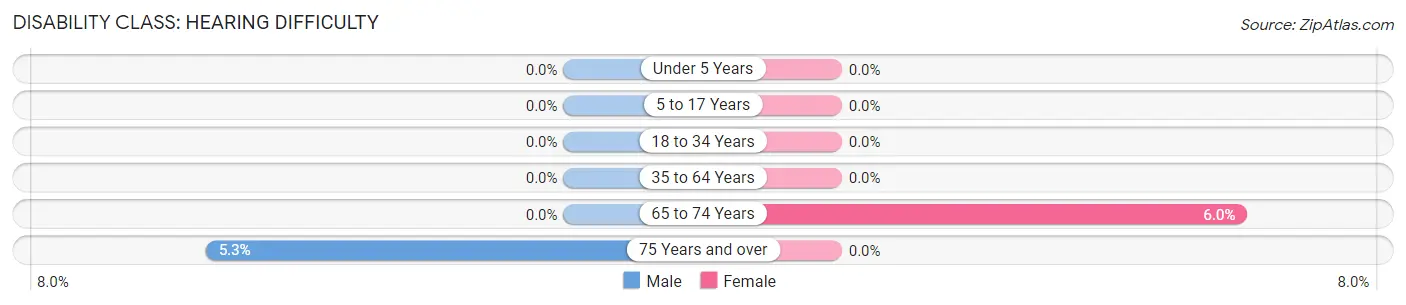
| Age Bracket | Male | Female |
| Under 5 Years | 0 (0.0%) | 0 (0.0%) |
| 5 to 17 Years | 0 (0.0%) | 0 (0.0%) |
| 18 to 34 Years | 0 (0.0%) | 0 (0.0%) |
| 35 to 64 Years | 0 (0.0%) | 0 (0.0%) |
| 65 to 74 Years | 0 (0.0%) | 5 (6.0%) |
| 75 Years and over | 6 (5.3%) | 0 (0.0%) |
Disability Class: Vision Difficulty
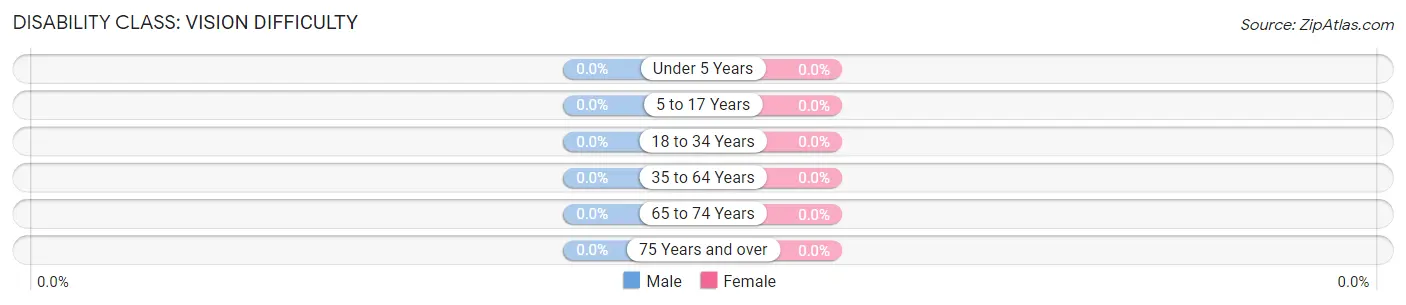
| Age Bracket | Male | Female |
| Under 5 Years | 0 (0.0%) | 0 (0.0%) |
| 5 to 17 Years | 0 (0.0%) | 0 (0.0%) |
| 18 to 34 Years | 0 (0.0%) | 0 (0.0%) |
| 35 to 64 Years | 0 (0.0%) | 0 (0.0%) |
| 65 to 74 Years | 0 (0.0%) | 0 (0.0%) |
| 75 Years and over | 0 (0.0%) | 0 (0.0%) |
Disability Class: Cognitive Difficulty
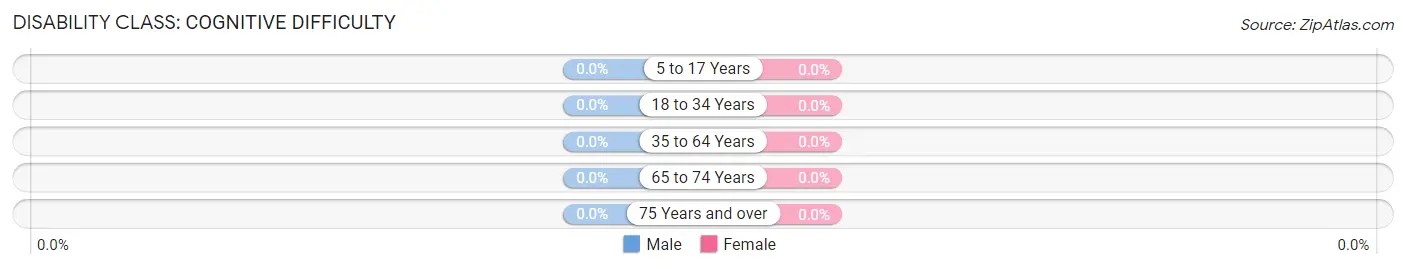
| Age Bracket | Male | Female |
| 5 to 17 Years | 0 (0.0%) | 0 (0.0%) |
| 18 to 34 Years | 0 (0.0%) | 0 (0.0%) |
| 35 to 64 Years | 0 (0.0%) | 0 (0.0%) |
| 65 to 74 Years | 0 (0.0%) | 0 (0.0%) |
| 75 Years and over | 0 (0.0%) | 0 (0.0%) |
Disability Class: Ambulatory Difficulty
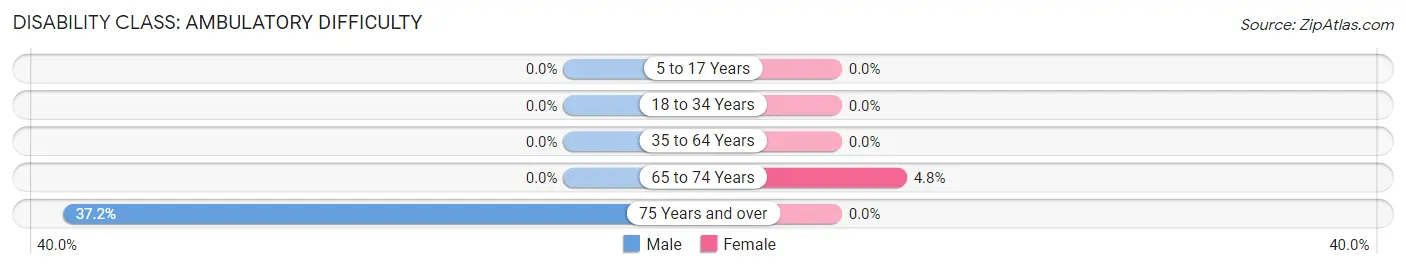
| Age Bracket | Male | Female |
| 5 to 17 Years | 0 (0.0%) | 0 (0.0%) |
| 18 to 34 Years | 0 (0.0%) | 0 (0.0%) |
| 35 to 64 Years | 0 (0.0%) | 0 (0.0%) |
| 65 to 74 Years | 0 (0.0%) | 4 (4.8%) |
| 75 Years and over | 42 (37.2%) | 0 (0.0%) |
Disability Class: Self-Care Difficulty
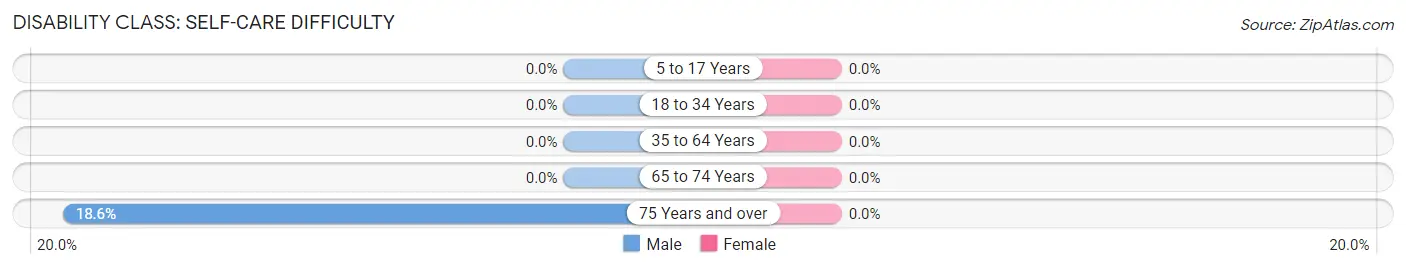
| Age Bracket | Male | Female |
| 5 to 17 Years | 0 (0.0%) | 0 (0.0%) |
| 18 to 34 Years | 0 (0.0%) | 0 (0.0%) |
| 35 to 64 Years | 0 (0.0%) | 0 (0.0%) |
| 65 to 74 Years | 0 (0.0%) | 0 (0.0%) |
| 75 Years and over | 21 (18.6%) | 0 (0.0%) |
Technology Access in Vicksburg
Computing Device Access in Vicksburg
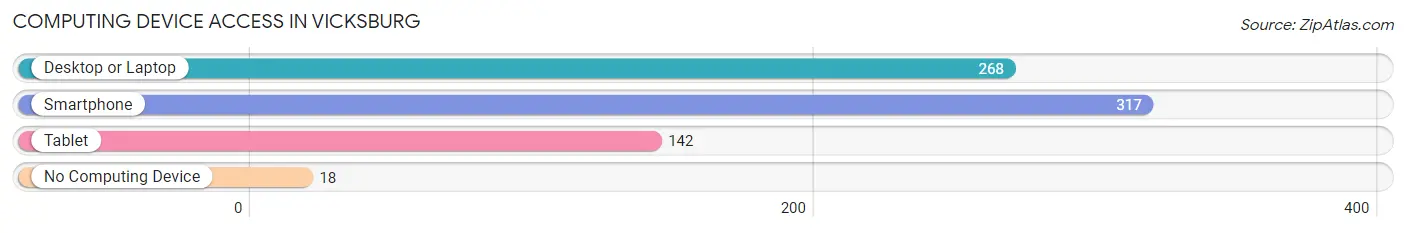
| Device Type | # Households | % Households |
| Desktop or Laptop | 268 | 72.8% |
| Smartphone | 317 | 86.1% |
| Tablet | 142 | 38.6% |
| No Computing Device | 18 | 4.9% |
| Total | 368 | 100.0% |
Internet Access in Vicksburg
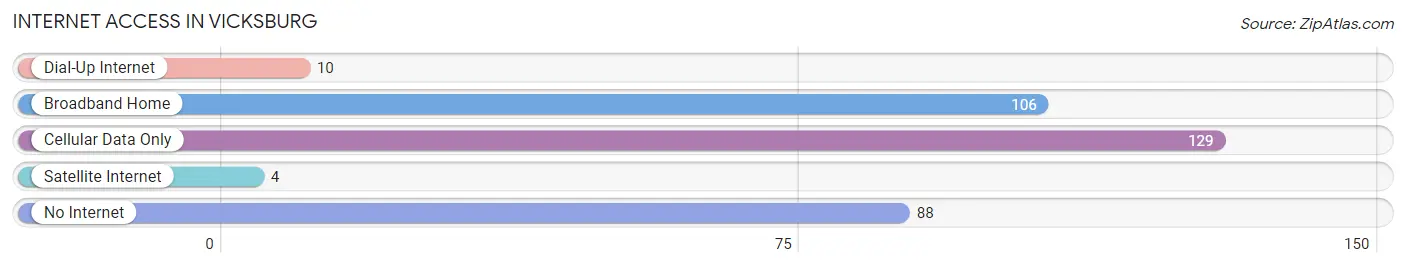
| Internet Type | # Households | % Households |
| Dial-Up Internet | 10 | 2.7% |
| Broadband Home | 106 | 28.8% |
| Cellular Data Only | 129 | 35.0% |
| Satellite Internet | 4 | 1.1% |
| No Internet | 88 | 23.9% |
| Total | 368 | 100.0% |
Vicksburg Summary
Vicksburg is a small town located in Yavapai County, Arizona. It is situated in the Verde Valley, which is a region of the state known for its scenic beauty and outdoor recreation opportunities. The town is located about 30 miles south of Flagstaff and about 90 miles north of Phoenix. The population of Vicksburg was estimated to be 1,072 in 2020.
History
Vicksburg was founded in 1883 by a group of settlers from the Midwest. The town was named after the Civil War battle of Vicksburg, Mississippi. The settlers were attracted to the area by the abundance of water and the fertile soil. The town quickly grew and by the early 1900s, it had become a thriving agricultural community.
The town was also home to a number of businesses, including a general store, a hotel, a blacksmith shop, and a saloon. In the early 1900s, the town was also home to a number of churches, including the Methodist Episcopal Church, the Presbyterian Church, and the Catholic Church.
In the 1920s, the town began to decline as the railroad bypassed it and the agricultural industry shifted to other areas. The population of Vicksburg began to decline and by the 1950s, the town had become a virtual ghost town.
Geography
Vicksburg is located in the Verde Valley, which is a region of Arizona known for its scenic beauty and outdoor recreation opportunities. The town is situated at an elevation of 4,400 feet and is surrounded by the Coconino National Forest. The town is located about 30 miles south of Flagstaff and about 90 miles north of Phoenix.
The climate in Vicksburg is semi-arid, with hot summers and mild winters. The average annual temperature is around 65 degrees Fahrenheit. The average annual precipitation is around 12 inches.
Economy
The economy of Vicksburg is largely based on tourism and agriculture. The town is home to a number of tourist attractions, including the Verde Valley Railroad, the Montezuma Castle National Monument, and the Tuzigoot National Monument. The town is also home to a number of wineries and vineyards, as well as a number of restaurants and shops.
Agriculture is also an important part of the economy of Vicksburg. The town is home to a number of farms, which produce a variety of crops, including alfalfa, hay, and cotton.
Demographics
The population of Vicksburg was estimated to be 1,072 in 2020. The town is predominantly white, with about 90% of the population identifying as white. The remaining 10% of the population is made up of African Americans, Native Americans, and Hispanics. The median household income in Vicksburg is around $45,000. The median home value is around $200,000.
Common Questions
What is Per Capita Income in Vicksburg?
Per Capita income in Vicksburg is $55,521.
What is the Median Family Income in Vicksburg?
Median Family Income in Vicksburg is $89,750.
What is the Median Household income in Vicksburg?
Median Household Income in Vicksburg is $66,923.
What is Inequality or Gini Index in Vicksburg?
Inequality or Gini Index in Vicksburg is 0.44.
What is the Total Population of Vicksburg?
Total Population of Vicksburg is 602.
What is the Total Male Population of Vicksburg?
Total Male Population of Vicksburg is 287.
What is the Total Female Population of Vicksburg?
Total Female Population of Vicksburg is 315.
What is the Ratio of Males per 100 Females in Vicksburg?
There are 91.11 Males per 100 Females in Vicksburg.
What is the Ratio of Females per 100 Males in Vicksburg?
There are 109.76 Females per 100 Males in Vicksburg.
What is the Median Population Age in Vicksburg?
Median Population Age in Vicksburg is 70.4 Years.
What is the Average Family Size in Vicksburg
Average Family Size in Vicksburg is 1.8 People.
What is the Average Household Size in Vicksburg
Average Household Size in Vicksburg is 1.6 People.
How Large is the Labor Force in Vicksburg?
There are 227 People in the Labor Forcein in Vicksburg.
What is the Percentage of People in the Labor Force in Vicksburg?
37.7% of People are in the Labor Force in Vicksburg.
What is the Unemployment Rate in Vicksburg?
Unemployment Rate in Vicksburg is 3.5%.