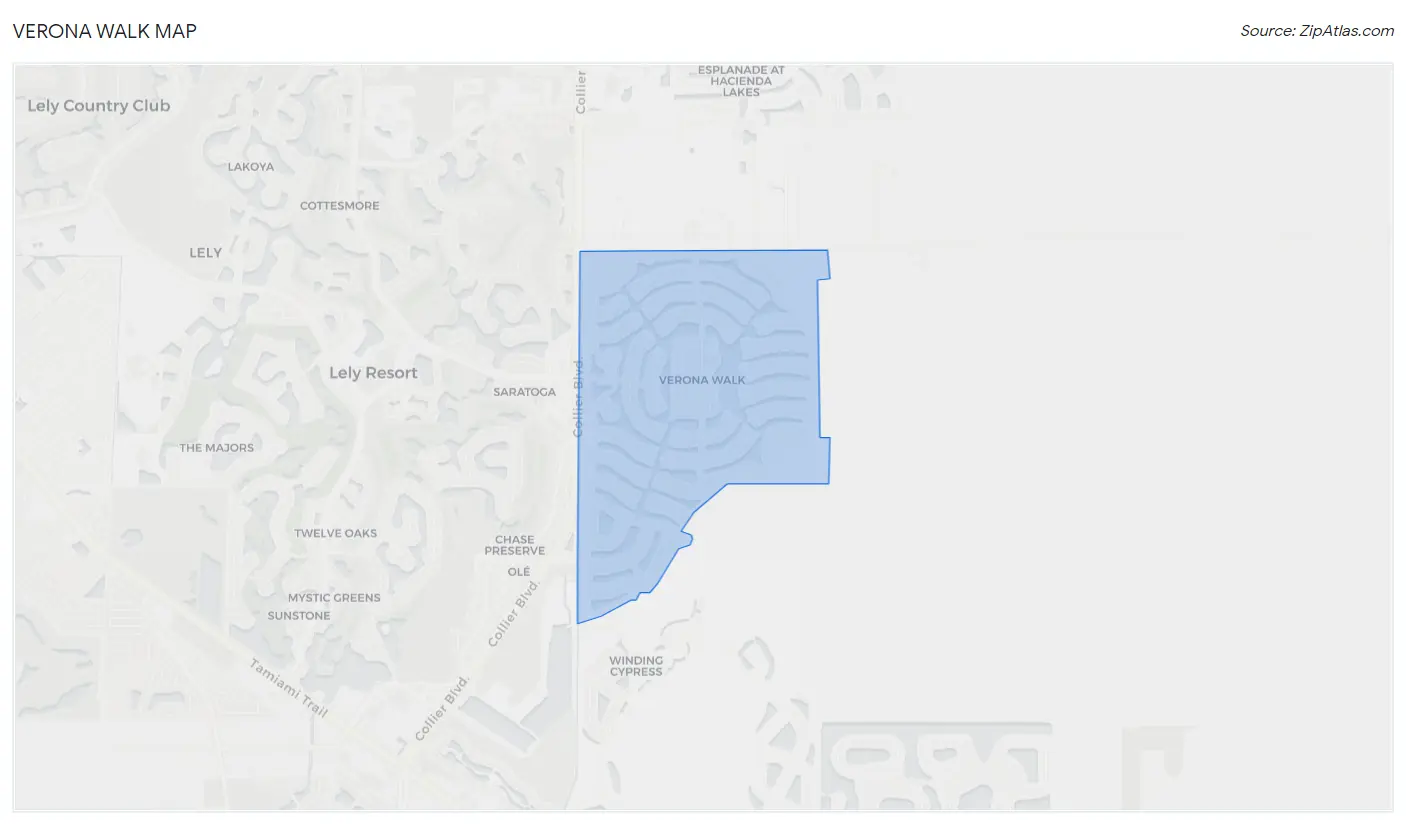
Verona Walk, FL Map & Demographics
Verona Walk Map
Verona Walk Overview
$61,315
PER CAPITA INCOME
$81,086
AVG FAMILY INCOME
$73,911
AVG HOUSEHOLD INCOME
0.53
INEQUALITY / GINI INDEX
2,998
TOTAL POPULATION
1,640
MALE POPULATION
1,358
FEMALE POPULATION
120.77
MALES / 100 FEMALES
82.80
FEMALES / 100 MALES
69.3
MEDIAN AGE
2.3
AVG FAMILY SIZE
2.0
AVG HOUSEHOLD SIZE
958
LABOR FORCE [ PEOPLE ]
34.3%
PERCENT IN LABOR FORCE
7.6%
UNEMPLOYMENT RATE
Income in Verona Walk
Income Overview in Verona Walk
Per Capita Income in Verona Walk is $61,315, while median incomes of families and households are $81,086 and $73,911 respectively.
| Characteristic | Number | Measure |
| Per Capita Income | 2,998 | $61,315 |
| Median Family Income | 1,127 | $81,086 |
| Mean Family Income | 1,127 | $133,560 |
| Median Household Income | 1,491 | $73,911 |
| Mean Household Income | 1,491 | $119,737 |
| Income Deficit | 1,127 | $0 |
| Wage / Income Gap (%) | 2,998 | 0.00% |
| Wage / Income Gap ($) | 2,998 | 100.00¢ per $1 |
| Gini / Inequality Index | 2,998 | 0.53 |
Earnings by Sex in Verona Walk
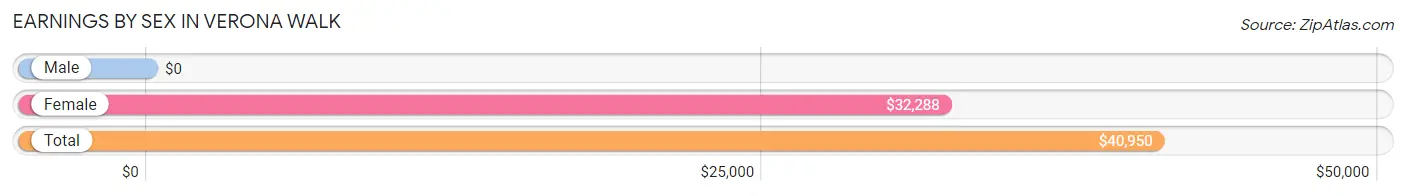
| Sex | Number | Average Earnings |
| Male | 522 (51.1%) | $0 |
| Female | 499 (48.9%) | $32,288 |
| Total | 1,021 (100.0%) | $40,950 |
Earnings by Sex by Income Bracket in Verona Walk
The most common earnings brackets in Verona Walk are $100,000+ for men (248 | 47.5%) and $30,000 to $34,999 for women (112 | 22.4%).
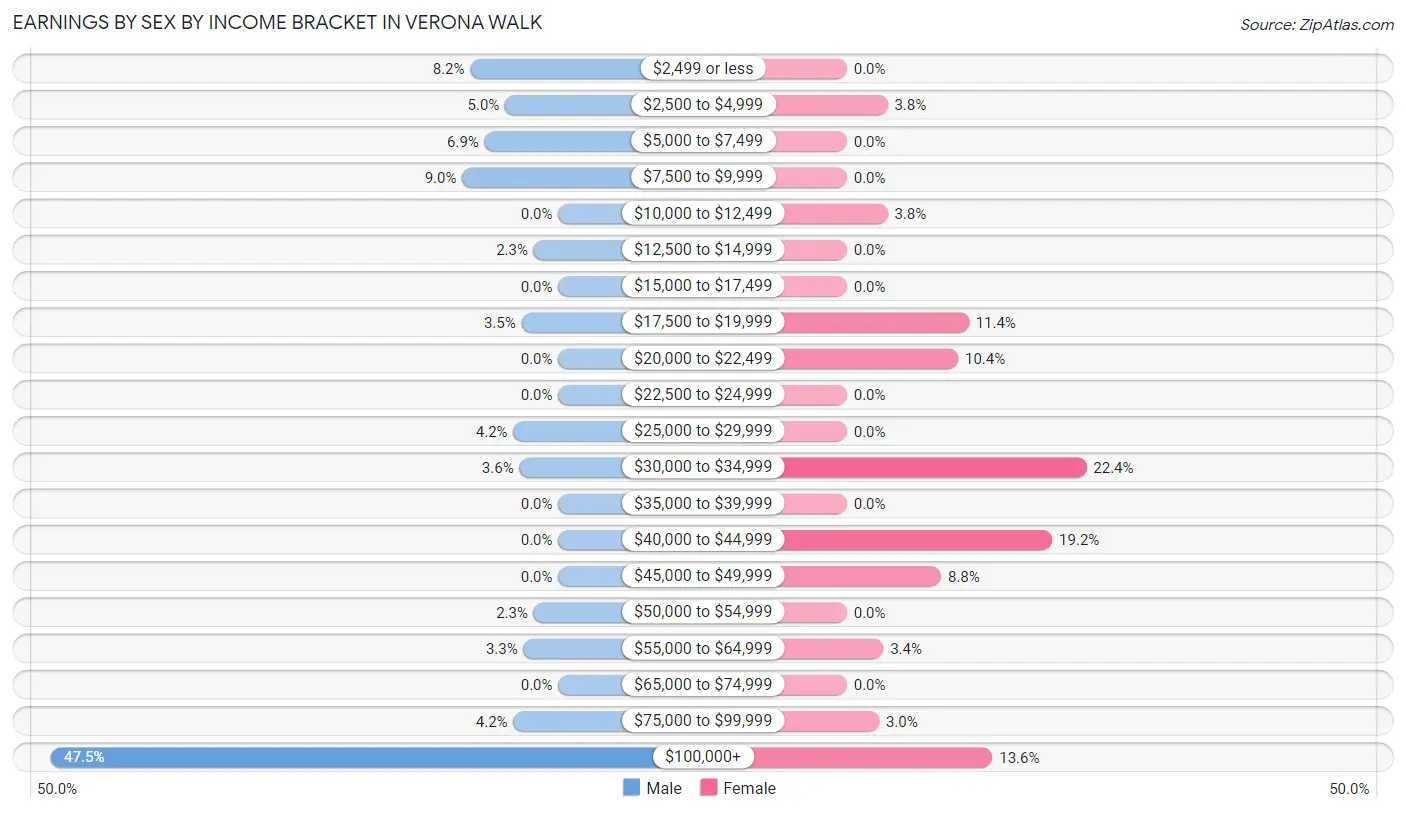
| Income | Male | Female |
| $2,499 or less | 43 (8.2%) | 0 (0.0%) |
| $2,500 to $4,999 | 26 (5.0%) | 19 (3.8%) |
| $5,000 to $7,499 | 36 (6.9%) | 0 (0.0%) |
| $7,500 to $9,999 | 47 (9.0%) | 0 (0.0%) |
| $10,000 to $12,499 | 0 (0.0%) | 19 (3.8%) |
| $12,500 to $14,999 | 12 (2.3%) | 0 (0.0%) |
| $15,000 to $17,499 | 0 (0.0%) | 0 (0.0%) |
| $17,500 to $19,999 | 18 (3.5%) | 57 (11.4%) |
| $20,000 to $22,499 | 0 (0.0%) | 52 (10.4%) |
| $22,500 to $24,999 | 0 (0.0%) | 0 (0.0%) |
| $25,000 to $29,999 | 22 (4.2%) | 0 (0.0%) |
| $30,000 to $34,999 | 19 (3.6%) | 112 (22.4%) |
| $35,000 to $39,999 | 0 (0.0%) | 0 (0.0%) |
| $40,000 to $44,999 | 0 (0.0%) | 96 (19.2%) |
| $45,000 to $49,999 | 0 (0.0%) | 44 (8.8%) |
| $50,000 to $54,999 | 12 (2.3%) | 0 (0.0%) |
| $55,000 to $64,999 | 17 (3.3%) | 17 (3.4%) |
| $65,000 to $74,999 | 0 (0.0%) | 0 (0.0%) |
| $75,000 to $99,999 | 22 (4.2%) | 15 (3.0%) |
| $100,000+ | 248 (47.5%) | 68 (13.6%) |
| Total | 522 (100.0%) | 499 (100.0%) |
Earnings by Sex by Educational Attainment in Verona Walk
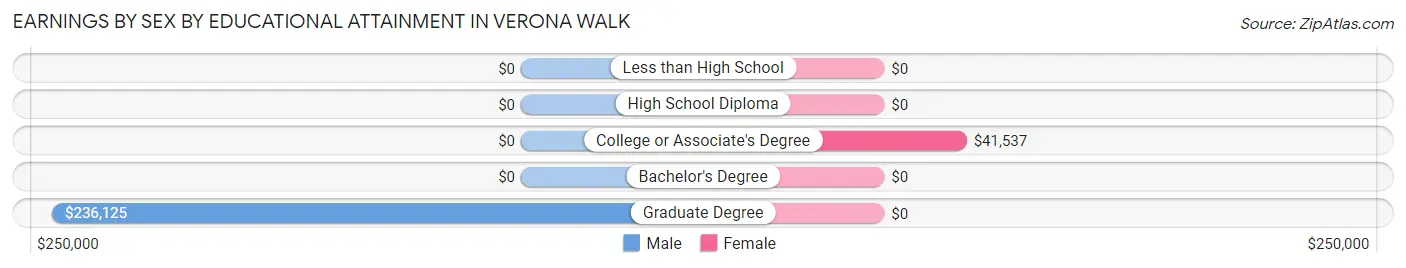
| Educational Attainment | Male Income | Female Income |
| Less than High School | - | - |
| High School Diploma | - | - |
| College or Associate's Degree | - | - |
| Bachelor's Degree | - | - |
| Graduate Degree | $236,125 | $0 |
| Total | - | - |
Family Income in Verona Walk
Family Income Brackets in Verona Walk
According to the Verona Walk family income data, there are 211 families falling into the $200,000+ income range, which is the most common income bracket and makes up 18.7% of all families. Conversely, the less than $10,000 income bracket is the least frequent group with only 12 families (1.1%) belonging to this category.
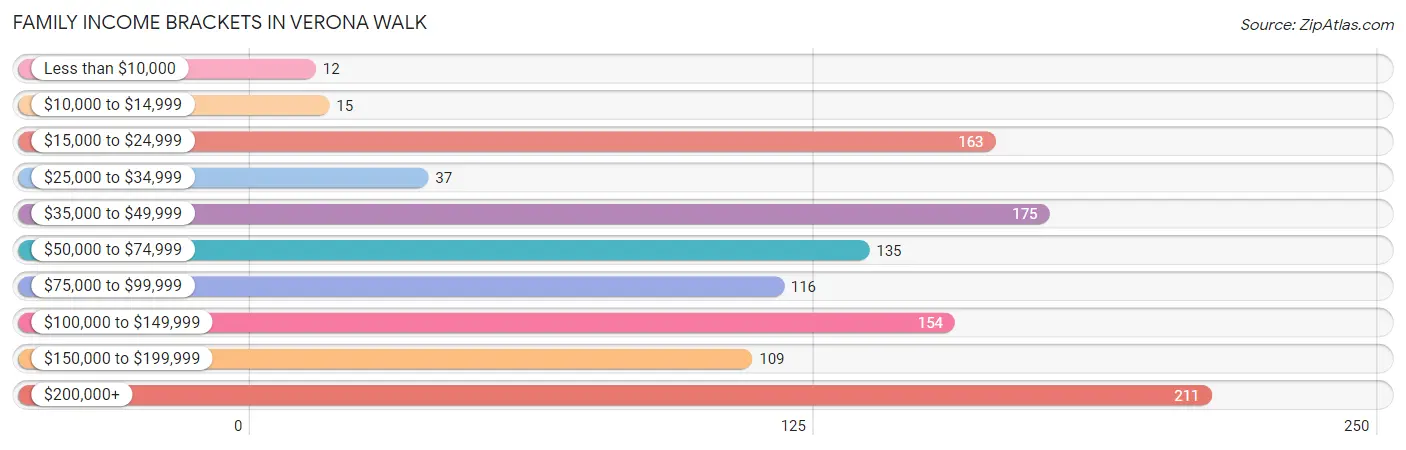
| Income Bracket | # Families | % Families |
| Less than $10,000 | 12 | 1.1% |
| $10,000 to $14,999 | 15 | 1.3% |
| $15,000 to $24,999 | 163 | 14.5% |
| $25,000 to $34,999 | 37 | 3.3% |
| $35,000 to $49,999 | 175 | 15.5% |
| $50,000 to $74,999 | 135 | 12.0% |
| $75,000 to $99,999 | 116 | 10.3% |
| $100,000 to $149,999 | 154 | 13.7% |
| $150,000 to $199,999 | 109 | 9.7% |
| $200,000+ | 211 | 18.7% |
Family Income by Famaliy Size in Verona Walk
3-person families (76 | 6.7%) account for the highest median family income in Verona Walk with $198,947 per family, while 3-person families (76 | 6.7%) have the highest median income of $66,316 per family member.
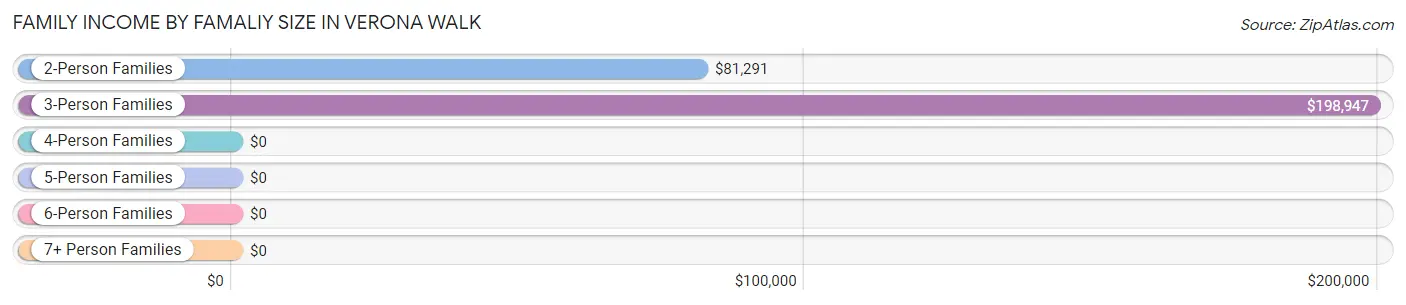
| Income Bracket | # Families | Median Income |
| 2-Person Families | 977 (86.7%) | $81,291 |
| 3-Person Families | 76 (6.7%) | $198,947 |
| 4-Person Families | 57 (5.1%) | $0 |
| 5-Person Families | 17 (1.5%) | $0 |
| 6-Person Families | 0 (0.0%) | $0 |
| 7+ Person Families | 0 (0.0%) | $0 |
| Total | 1,127 (100.0%) | $81,086 |
Family Income by Number of Earners in Verona Walk
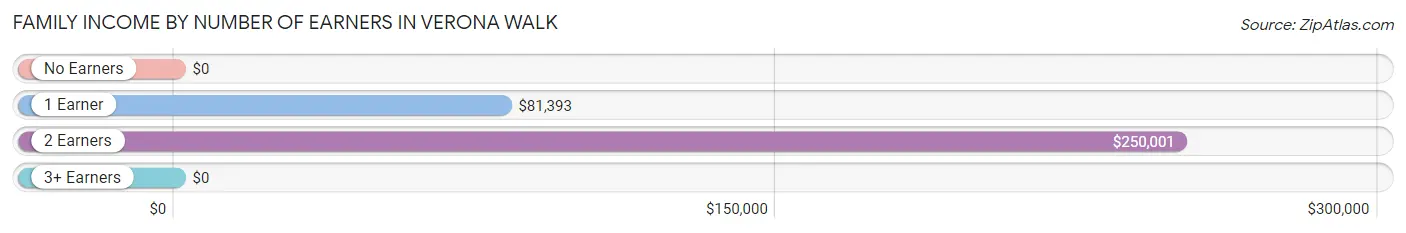
| Number of Earners | # Families | Median Income |
| No Earners | 506 (44.9%) | $0 |
| 1 Earner | 398 (35.3%) | $81,393 |
| 2 Earners | 204 (18.1%) | $250,001 |
| 3+ Earners | 19 (1.7%) | $0 |
| Total | 1,127 (100.0%) | $81,086 |
Household Income in Verona Walk
Household Income Brackets in Verona Walk
With 250 households falling in the category, the $200,000+ income range is the most frequent in Verona Walk, accounting for 16.8% of all households. In contrast, only 15 households (1.0%) fall into the $10,000 to $14,999 income bracket, making it the least populous group.
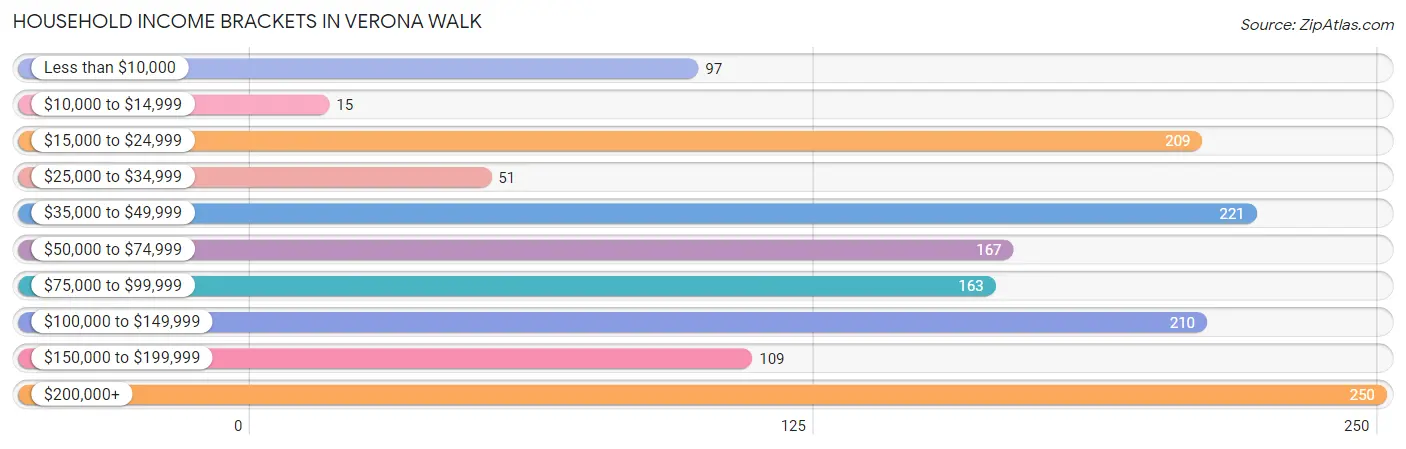
| Income Bracket | # Households | % Households |
| Less than $10,000 | 97 | 6.5% |
| $10,000 to $14,999 | 15 | 1.0% |
| $15,000 to $24,999 | 209 | 14.0% |
| $25,000 to $34,999 | 51 | 3.4% |
| $35,000 to $49,999 | 221 | 14.8% |
| $50,000 to $74,999 | 167 | 11.2% |
| $75,000 to $99,999 | 163 | 10.9% |
| $100,000 to $149,999 | 210 | 14.1% |
| $150,000 to $199,999 | 109 | 7.3% |
| $200,000+ | 250 | 16.8% |
Household Income by Householder Age in Verona Walk
The median household income in Verona Walk is $73,911, with the highest median household income of $52,120 found in the 65+ years age bracket for the primary householder. A total of 1,024 households (68.7%) fall into this category.
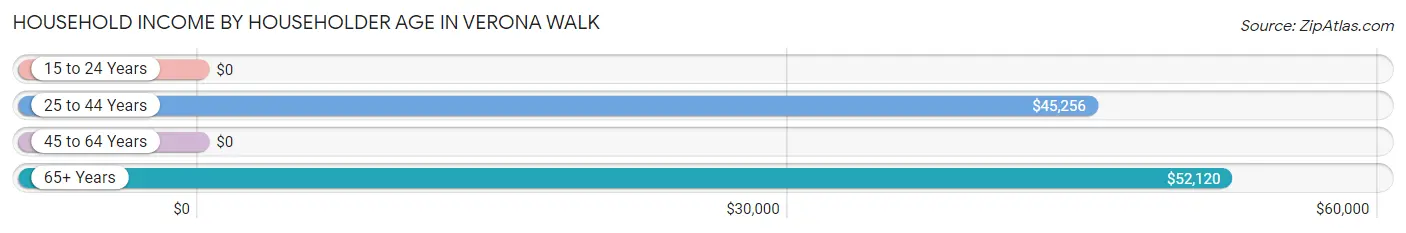
| Income Bracket | # Households | Median Income |
| 15 to 24 Years | 0 (0.0%) | $0 |
| 25 to 44 Years | 165 (11.1%) | $45,256 |
| 45 to 64 Years | 302 (20.3%) | $0 |
| 65+ Years | 1,024 (68.7%) | $52,120 |
| Total | 1,491 (100.0%) | $73,911 |
Poverty in Verona Walk
Income Below Poverty by Sex and Age in Verona Walk
With 4.5% poverty level for males and 8.3% for females among the residents of Verona Walk, 35 to 44 year old males and 45 to 54 year old females are the most vulnerable to poverty, with 47 males (35.3%) and 47 females (42.3%) in their respective age groups living below the poverty level.
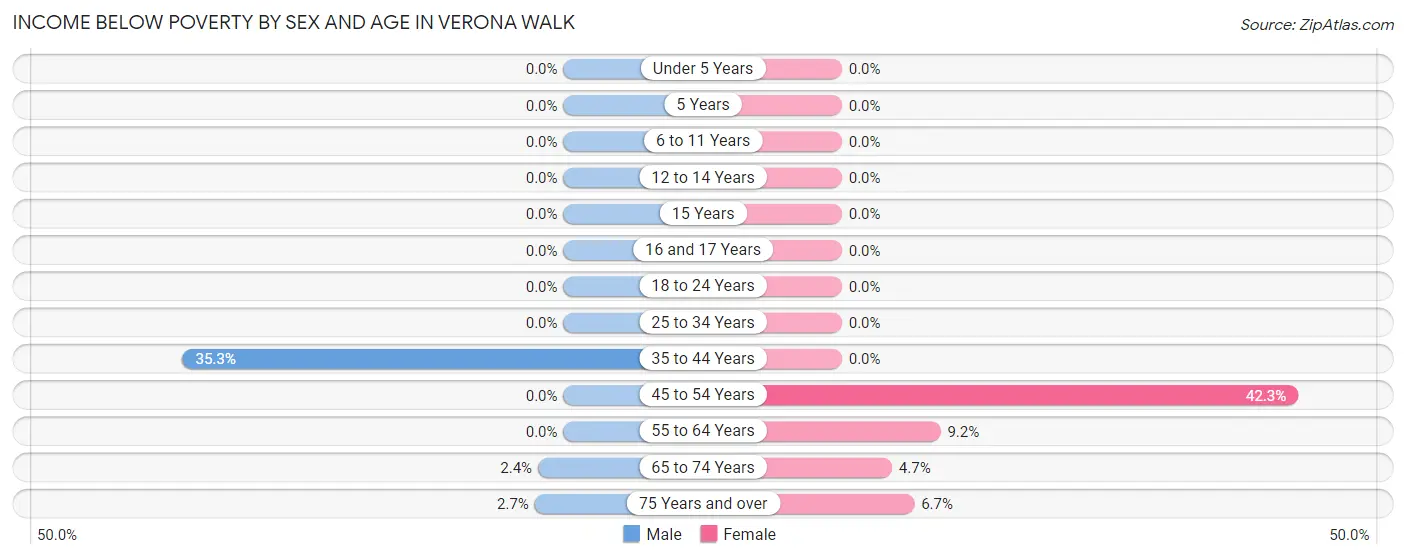
| Age Bracket | Male | Female |
| Under 5 Years | 0 (0.0%) | 0 (0.0%) |
| 5 Years | 0 (0.0%) | 0 (0.0%) |
| 6 to 11 Years | 0 (0.0%) | 0 (0.0%) |
| 12 to 14 Years | 0 (0.0%) | 0 (0.0%) |
| 15 Years | 0 (0.0%) | 0 (0.0%) |
| 16 and 17 Years | 0 (0.0%) | 0 (0.0%) |
| 18 to 24 Years | 0 (0.0%) | 0 (0.0%) |
| 25 to 34 Years | 0 (0.0%) | 0 (0.0%) |
| 35 to 44 Years | 47 (35.3%) | 0 (0.0%) |
| 45 to 54 Years | 0 (0.0%) | 47 (42.3%) |
| 55 to 64 Years | 0 (0.0%) | 25 (9.2%) |
| 65 to 74 Years | 12 (2.4%) | 25 (4.6%) |
| 75 Years and over | 15 (2.7%) | 16 (6.7%) |
| Total | 74 (4.5%) | 113 (8.3%) |
Income Above Poverty by Sex and Age in Verona Walk
According to the poverty statistics in Verona Walk, males aged under 5 years and females aged under 5 years are the age groups that are most secure financially, with 100.0% of males and 100.0% of females in these age groups living above the poverty line.
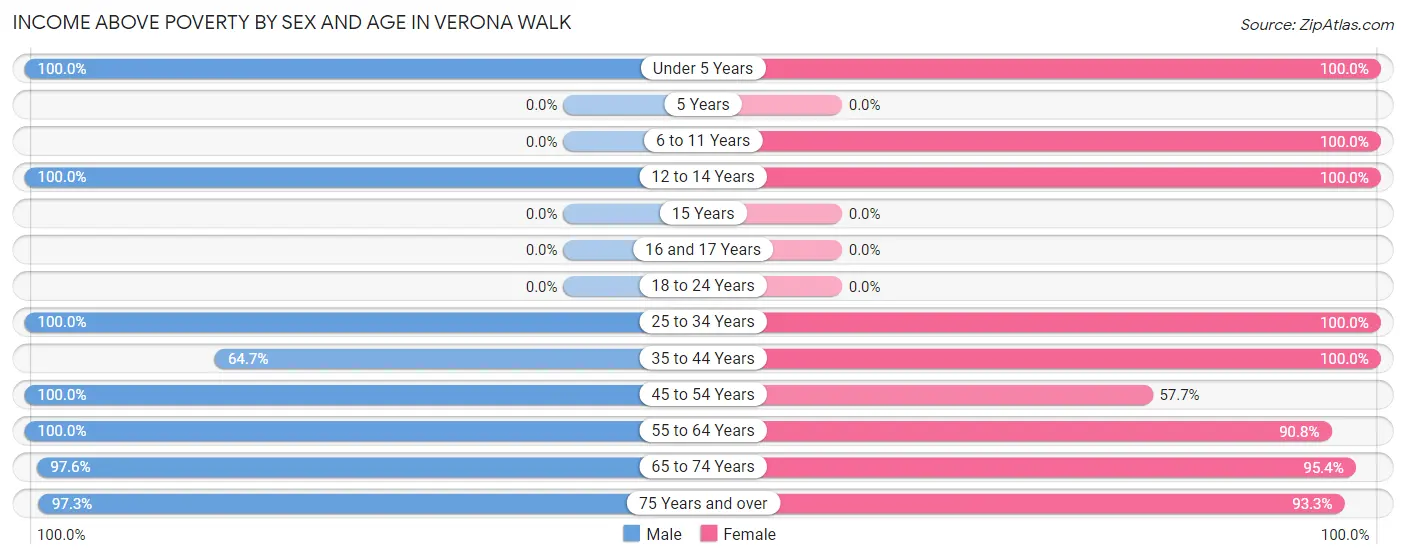
| Age Bracket | Male | Female |
| Under 5 Years | 70 (100.0%) | 10 (100.0%) |
| 5 Years | 0 (0.0%) | 0 (0.0%) |
| 6 to 11 Years | 0 (0.0%) | 16 (100.0%) |
| 12 to 14 Years | 92 (100.0%) | 16 (100.0%) |
| 15 Years | 0 (0.0%) | 0 (0.0%) |
| 16 and 17 Years | 0 (0.0%) | 0 (0.0%) |
| 18 to 24 Years | 0 (0.0%) | 0 (0.0%) |
| 25 to 34 Years | 26 (100.0%) | 25 (100.0%) |
| 35 to 44 Years | 86 (64.7%) | 131 (100.0%) |
| 45 to 54 Years | 117 (100.0%) | 64 (57.7%) |
| 55 to 64 Years | 131 (100.0%) | 248 (90.8%) |
| 65 to 74 Years | 496 (97.6%) | 513 (95.4%) |
| 75 Years and over | 548 (97.3%) | 222 (93.3%) |
| Total | 1,566 (95.5%) | 1,245 (91.7%) |
Income Below Poverty Among Married-Couple Families in Verona Walk
The poverty statistics for married-couple families in Verona Walk show that 2.4% or 27 of the total 1,115 families live below the poverty line. Families with no children have the highest poverty rate of 2.7%, comprising of 27 families. On the other hand, families with 1 or 2 children have the lowest poverty rate of 0.0%, which includes 0 families.
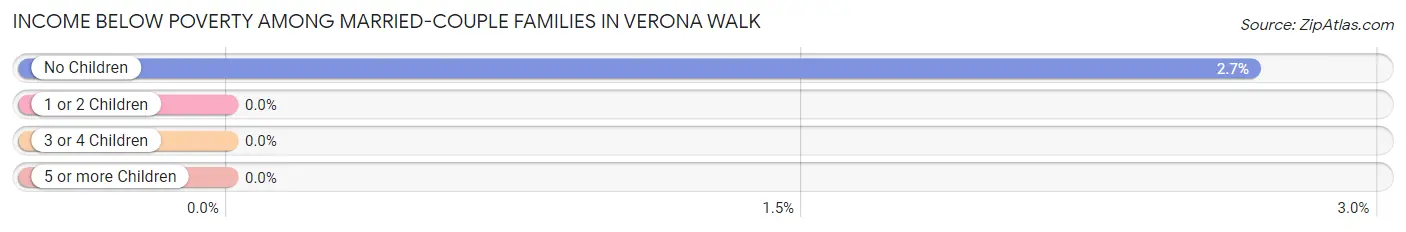
| Children | Above Poverty | Below Poverty |
| No Children | 984 (97.3%) | 27 (2.7%) |
| 1 or 2 Children | 87 (100.0%) | 0 (0.0%) |
| 3 or 4 Children | 17 (100.0%) | 0 (0.0%) |
| 5 or more Children | 0 (0.0%) | 0 (0.0%) |
| Total | 1,088 (97.6%) | 27 (2.4%) |
Income Below Poverty Among Single-Parent Households in Verona Walk
| Children | Single Father | Single Mother |
| No Children | 0 (0.0%) | 0 (0.0%) |
| 1 or 2 Children | 0 (0.0%) | 0 (0.0%) |
| 3 or 4 Children | 0 (0.0%) | 0 (0.0%) |
| 5 or more Children | 0 (0.0%) | 0 (0.0%) |
| Total | 0 (0.0%) | 0 (0.0%) |
Income Below Poverty Among Married-Couple vs Single-Parent Households in Verona Walk
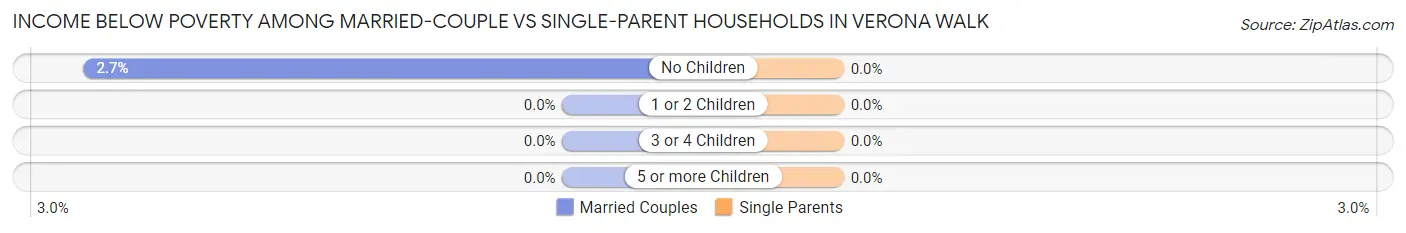
| Children | Married-Couple Families | Single-Parent Households |
| No Children | 27 (2.7%) | 0 (0.0%) |
| 1 or 2 Children | 0 (0.0%) | 0 (0.0%) |
| 3 or 4 Children | 0 (0.0%) | 0 (0.0%) |
| 5 or more Children | 0 (0.0%) | 0 (0.0%) |
| Total | 27 (2.4%) | 0 (0.0%) |
Race in Verona Walk
The most populous races in Verona Walk are White / Caucasian (2,798 | 93.3%), Hispanic or Latino (285 | 9.5%), and Two or more Races (129 | 4.3%).
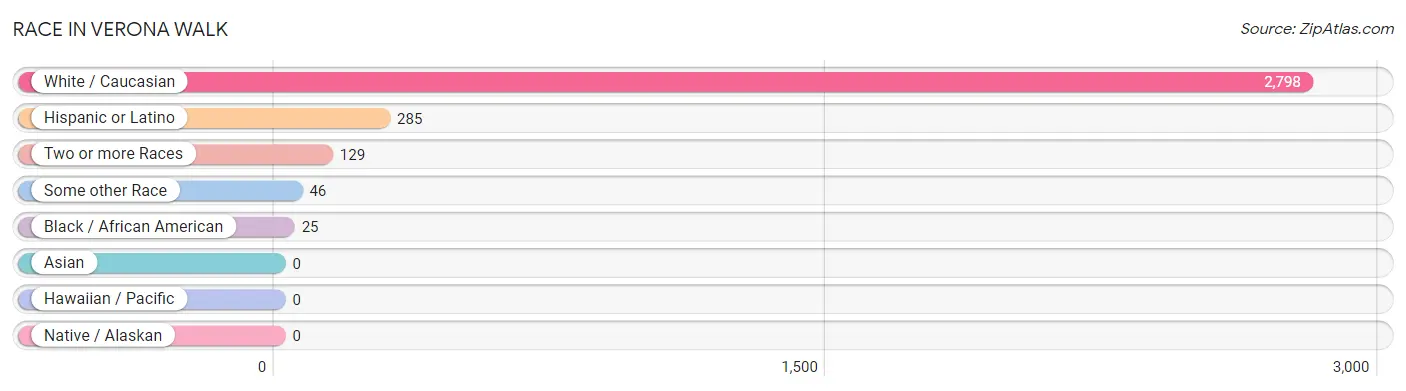
| Race | # Population | % Population |
| Asian | 0 | 0.0% |
| Black / African American | 25 | 0.8% |
| Hawaiian / Pacific | 0 | 0.0% |
| Hispanic or Latino | 285 | 9.5% |
| Native / Alaskan | 0 | 0.0% |
| White / Caucasian | 2,798 | 93.3% |
| Two or more Races | 129 | 4.3% |
| Some other Race | 46 | 1.5% |
| Total | 2,998 | 100.0% |
Ancestry in Verona Walk
The most populous ancestries reported in Verona Walk are Irish (704 | 23.5%), Italian (618 | 20.6%), German (319 | 10.6%), English (192 | 6.4%), and Polish (190 | 6.3%), together accounting for 67.5% of all Verona Walk residents.
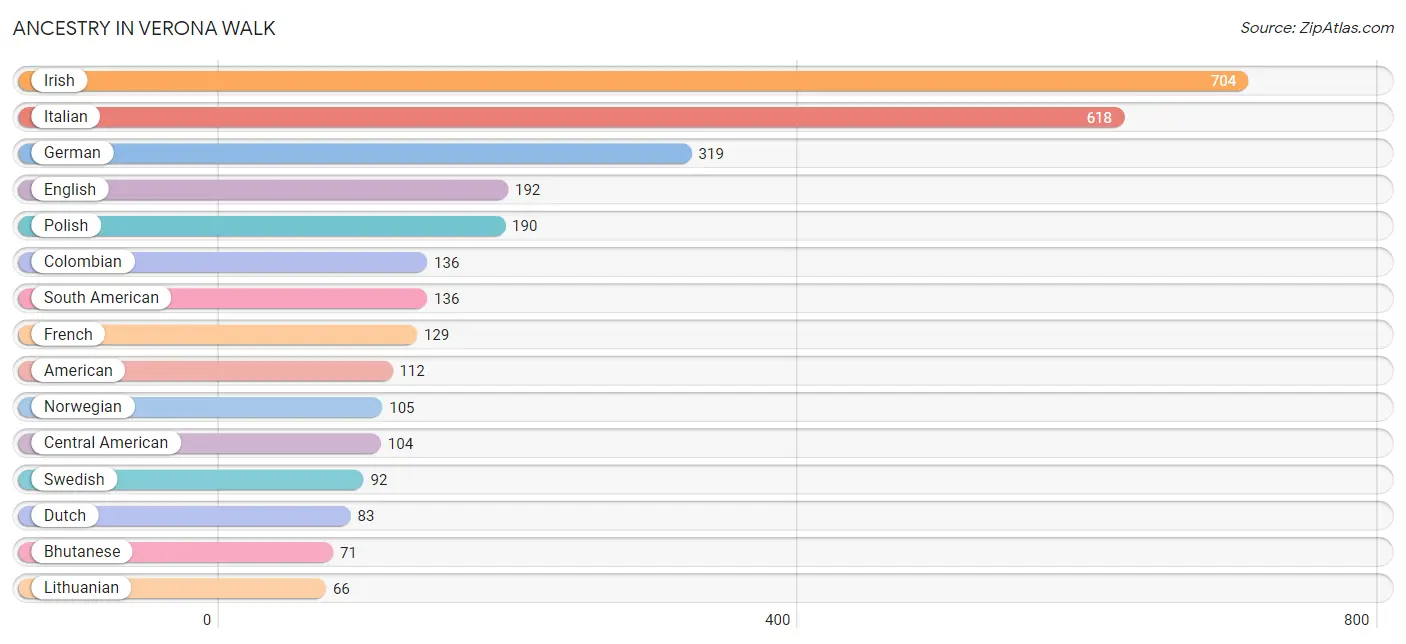
| Ancestry | # Population | % Population |
| American | 112 | 3.7% |
| Bhutanese | 71 | 2.4% |
| Canadian | 43 | 1.4% |
| Central American | 104 | 3.5% |
| Colombian | 136 | 4.5% |
| Dutch | 83 | 2.8% |
| English | 192 | 6.4% |
| French | 129 | 4.3% |
| French Canadian | 14 | 0.5% |
| German | 319 | 10.6% |
| Honduran | 58 | 1.9% |
| Irish | 704 | 23.5% |
| Italian | 618 | 20.6% |
| Lithuanian | 66 | 2.2% |
| Norwegian | 105 | 3.5% |
| Pennsylvania German | 12 | 0.4% |
| Polish | 190 | 6.3% |
| Puerto Rican | 18 | 0.6% |
| Russian | 14 | 0.5% |
| Salvadoran | 46 | 1.5% |
| Scotch-Irish | 18 | 0.6% |
| Scottish | 32 | 1.1% |
| South American | 136 | 4.5% |
| Spaniard | 16 | 0.5% |
| Swedish | 92 | 3.1% |
| Swiss | 11 | 0.4% |
| Ukrainian | 22 | 0.7% | View All 27 Rows |
Immigrants in Verona Walk
The most numerous immigrant groups reported in Verona Walk came from Europe (563 | 18.8%), Italy (395 | 13.2%), Southern Europe (395 | 13.2%), Northern Europe (116 | 3.9%), and Central America (104 | 3.5%), together accounting for 52.5% of all Verona Walk residents.
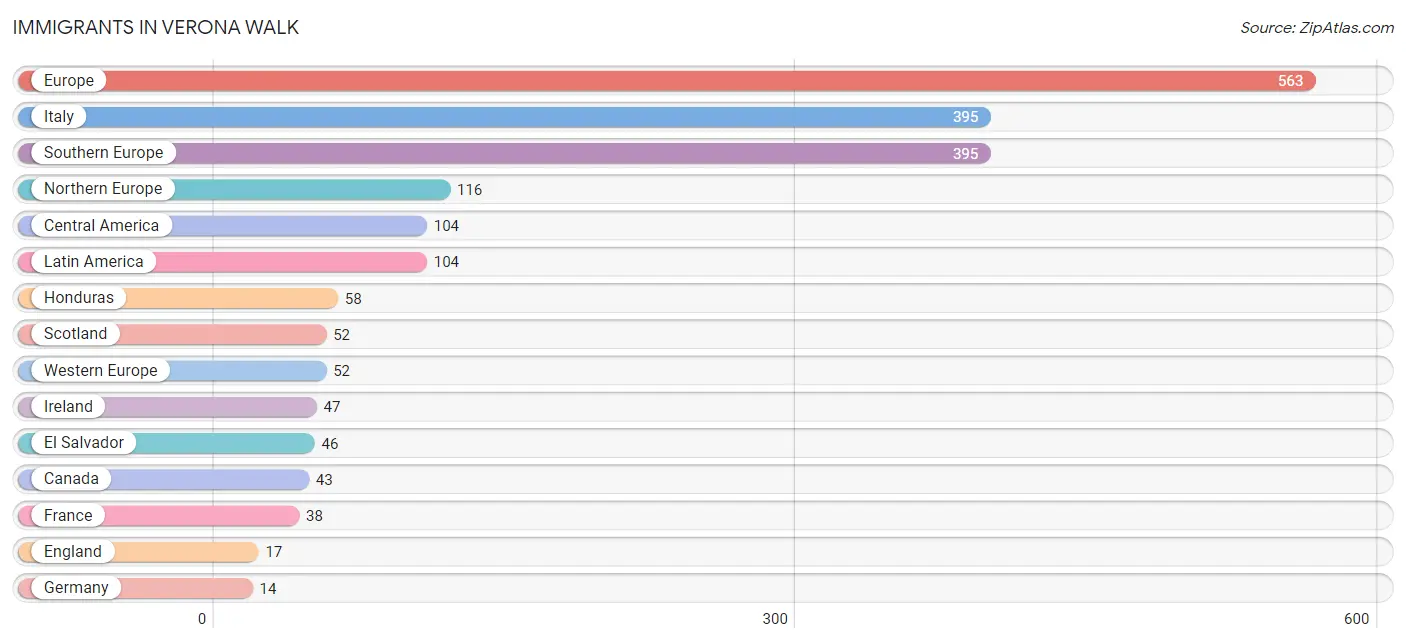
| Immigration Origin | # Population | % Population |
| Canada | 43 | 1.4% |
| Central America | 104 | 3.5% |
| El Salvador | 46 | 1.5% |
| England | 17 | 0.6% |
| Europe | 563 | 18.8% |
| France | 38 | 1.3% |
| Germany | 14 | 0.5% |
| Honduras | 58 | 1.9% |
| Ireland | 47 | 1.6% |
| Italy | 395 | 13.2% |
| Latin America | 104 | 3.5% |
| Northern Europe | 116 | 3.9% |
| Scotland | 52 | 1.7% |
| Southern Europe | 395 | 13.2% |
| Western Europe | 52 | 1.7% | View All 15 Rows |
Sex and Age in Verona Walk
Sex and Age in Verona Walk
The most populous age groups in Verona Walk are 75 to 79 Years (313 | 19.1%) for men and 70 to 74 Years (283 | 20.8%) for women.
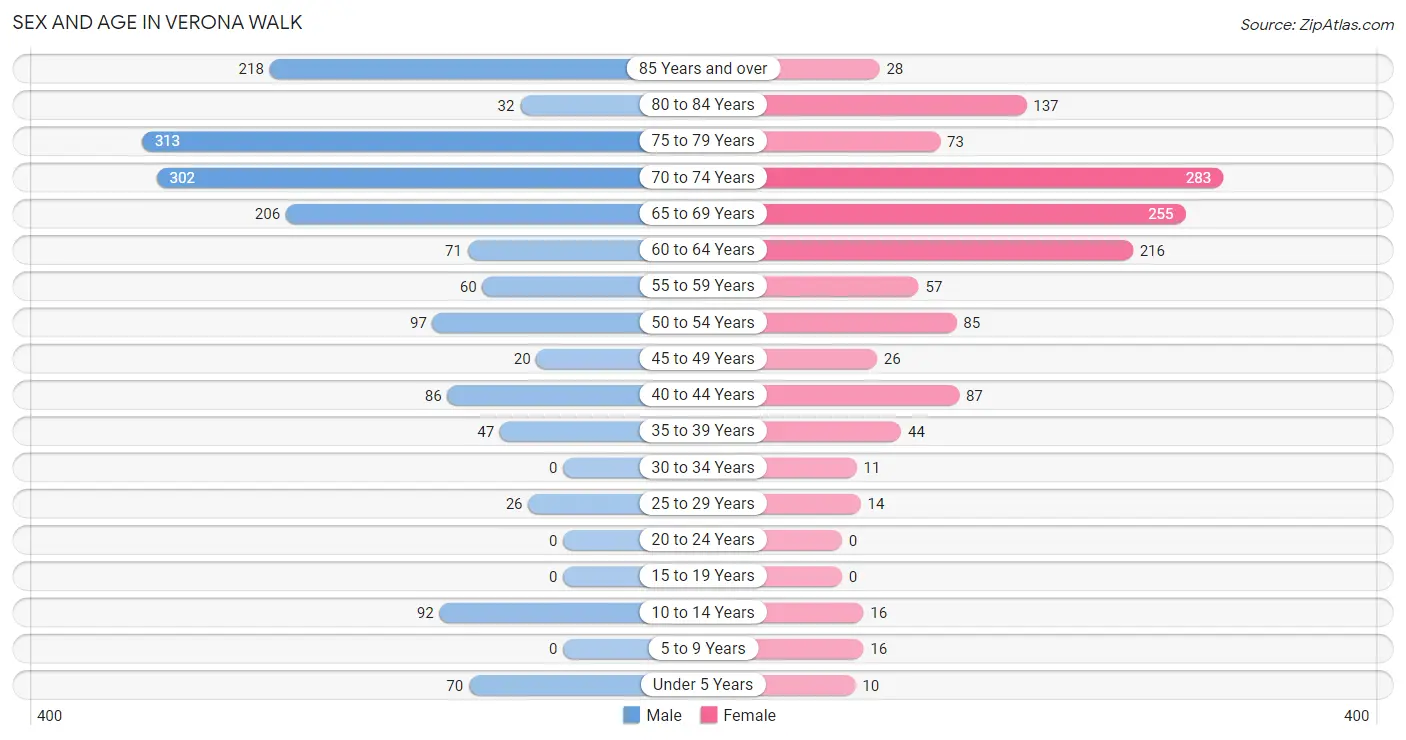
| Age Bracket | Male | Female |
| Under 5 Years | 70 (4.3%) | 10 (0.7%) |
| 5 to 9 Years | 0 (0.0%) | 16 (1.2%) |
| 10 to 14 Years | 92 (5.6%) | 16 (1.2%) |
| 15 to 19 Years | 0 (0.0%) | 0 (0.0%) |
| 20 to 24 Years | 0 (0.0%) | 0 (0.0%) |
| 25 to 29 Years | 26 (1.6%) | 14 (1.0%) |
| 30 to 34 Years | 0 (0.0%) | 11 (0.8%) |
| 35 to 39 Years | 47 (2.9%) | 44 (3.2%) |
| 40 to 44 Years | 86 (5.2%) | 87 (6.4%) |
| 45 to 49 Years | 20 (1.2%) | 26 (1.9%) |
| 50 to 54 Years | 97 (5.9%) | 85 (6.3%) |
| 55 to 59 Years | 60 (3.7%) | 57 (4.2%) |
| 60 to 64 Years | 71 (4.3%) | 216 (15.9%) |
| 65 to 69 Years | 206 (12.6%) | 255 (18.8%) |
| 70 to 74 Years | 302 (18.4%) | 283 (20.8%) |
| 75 to 79 Years | 313 (19.1%) | 73 (5.4%) |
| 80 to 84 Years | 32 (1.9%) | 137 (10.1%) |
| 85 Years and over | 218 (13.3%) | 28 (2.1%) |
| Total | 1,640 (100.0%) | 1,358 (100.0%) |
Families and Households in Verona Walk
Median Family Size in Verona Walk
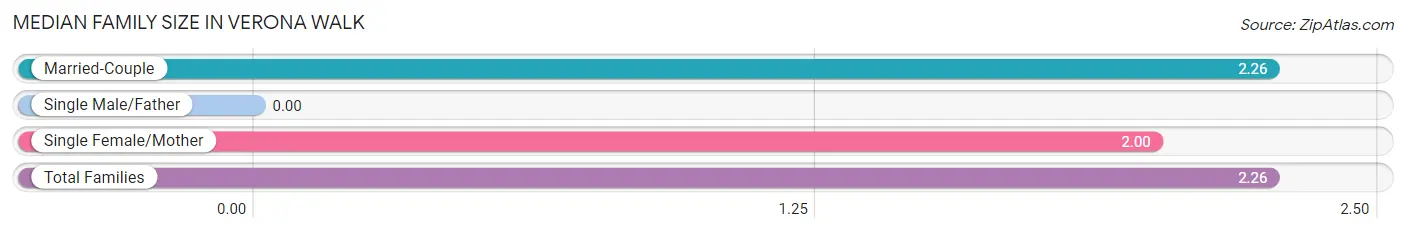
| Family Type | # Families | Family Size |
| Married-Couple | 1,115 (98.9%) | 2.26 |
| Single Male/Father | 0 (0.0%) | - |
| Single Female/Mother | 12 (1.1%) | 2.00 |
| Total Families | 1,127 (100.0%) | 2.26 |
Median Household Size in Verona Walk
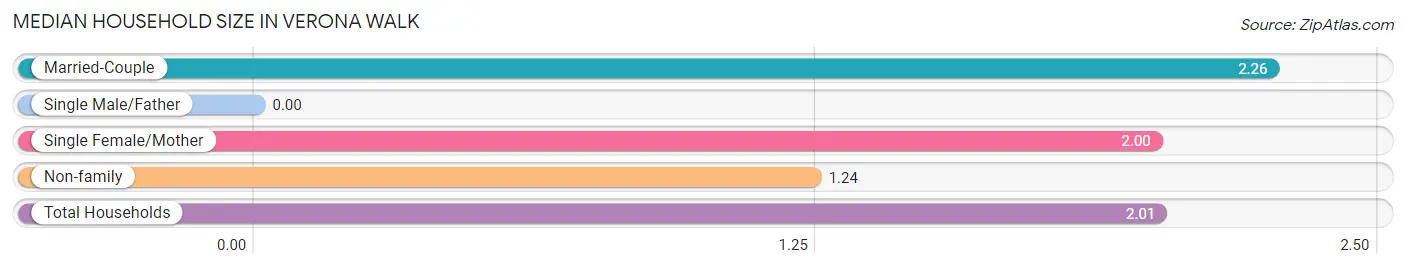
| Household Type | # Households | Household Size |
| Married-Couple | 1,115 (74.8%) | 2.26 |
| Single Male/Father | 0 (0.0%) | - |
| Single Female/Mother | 12 (0.8%) | 2.00 |
| Non-family | 364 (24.4%) | 1.24 |
| Total Households | 1,491 (100.0%) | 2.01 |
Household Size by Marriage Status in Verona Walk
Out of a total of 1,491 households in Verona Walk, 1,127 (75.6%) are family households, while 364 (24.4%) are nonfamily households. The most numerous type of family households are 2-person households, comprising 977, and the most common type of nonfamily households are 1-person households, comprising 302.
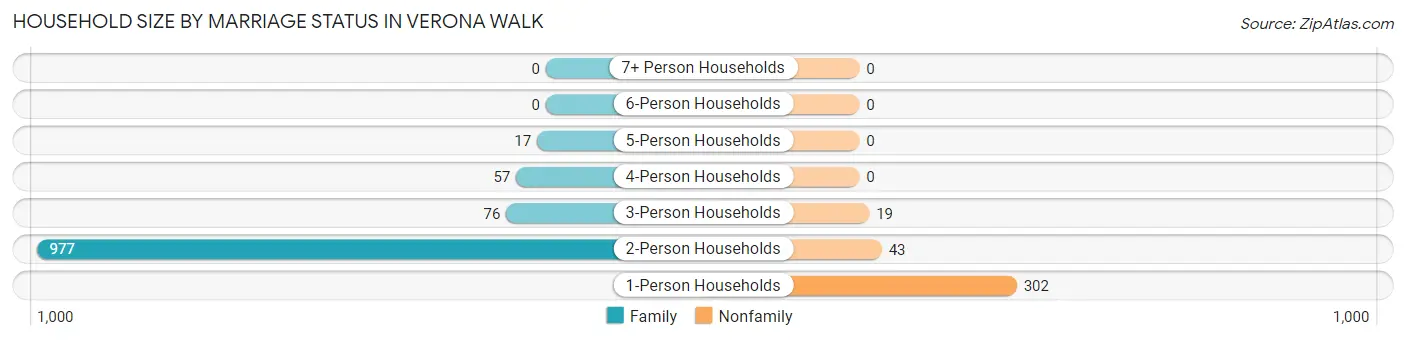
| Household Size | Family Households | Nonfamily Households |
| 1-Person Households | - | 302 (20.3%) |
| 2-Person Households | 977 (65.5%) | 43 (2.9%) |
| 3-Person Households | 76 (5.1%) | 19 (1.3%) |
| 4-Person Households | 57 (3.8%) | 0 (0.0%) |
| 5-Person Households | 17 (1.1%) | 0 (0.0%) |
| 6-Person Households | 0 (0.0%) | 0 (0.0%) |
| 7+ Person Households | 0 (0.0%) | 0 (0.0%) |
| Total | 1,127 (75.6%) | 364 (24.4%) |
Female Fertility in Verona Walk
Fertility by Age in Verona Walk
| Age Bracket | Women with Births | Births / 1,000 Women |
| 15 to 19 years | 0 (0.0%) | 0.0 |
| 20 to 34 years | 0 (0.0%) | 0.0 |
| 35 to 50 years | 0 (0.0%) | 0.0 |
| Total | 0 (0.0%) | 0.0 |
Fertility by Age by Marriage Status in Verona Walk
| Age Bracket | Married | Unmarried |
| 15 to 19 years | 0 (0.0%) | 0 (0.0%) |
| 20 to 34 years | 0 (0.0%) | 0 (0.0%) |
| 35 to 50 years | 0 (0.0%) | 0 (0.0%) |
| Total | 0 (0.0%) | 0 (0.0%) |
Fertility by Education in Verona Walk
| Educational Attainment | Women with Births | Births / 1,000 Women |
| Less than High School | 0 (0.0%) | 0.0 |
| High School Diploma | 0 (0.0%) | 0.0 |
| College or Associate's Degree | 0 (0.0%) | 0.0 |
| Bachelor's Degree | 0 (0.0%) | 0.0 |
| Graduate Degree | 0 (0.0%) | 0.0 |
| Total | 0 (0.0%) | 0.0 |
Fertility by Education by Marriage Status in Verona Walk
| Educational Attainment | Married | Unmarried |
| Less than High School | 0 (0.0%) | 0 (0.0%) |
| High School Diploma | 0 (0.0%) | 0 (0.0%) |
| College or Associate's Degree | 0 (0.0%) | 0 (0.0%) |
| Bachelor's Degree | 0 (0.0%) | 0 (0.0%) |
| Graduate Degree | 0 (0.0%) | 0 (0.0%) |
| Total | 0 (0.0%) | 0 (0.0%) |
Employment Characteristics in Verona Walk
Employment by Class of Employer in Verona Walk
Among the 886 employed individuals in Verona Walk, private company employees (551 | 62.2%), self-employed (incorporated) (160 | 18.1%), and self-employed (not incorporated) (138 | 15.6%) make up the most common classes of employment.
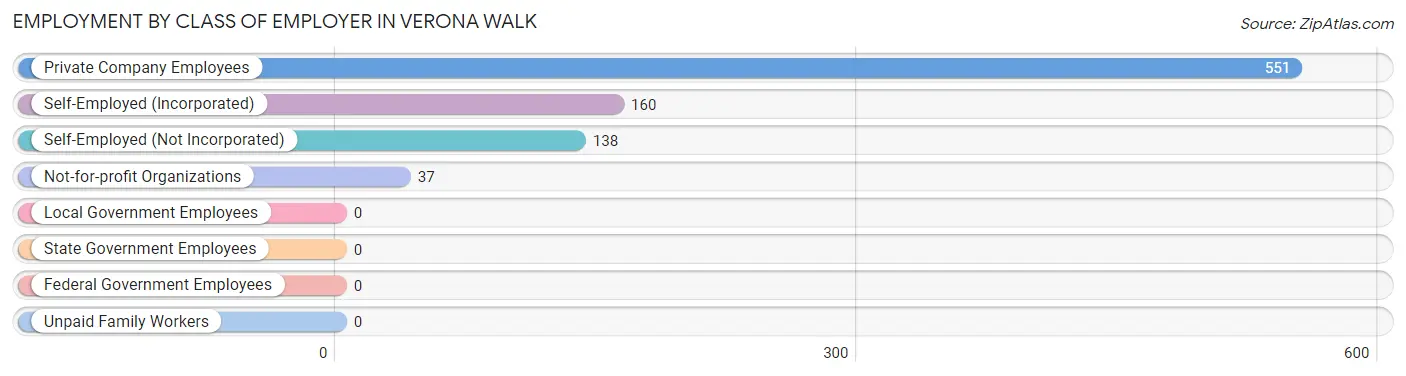
| Employer Class | # Employees | % Employees |
| Private Company Employees | 551 | 62.2% |
| Self-Employed (Incorporated) | 160 | 18.1% |
| Self-Employed (Not Incorporated) | 138 | 15.6% |
| Not-for-profit Organizations | 37 | 4.2% |
| Local Government Employees | 0 | 0.0% |
| State Government Employees | 0 | 0.0% |
| Federal Government Employees | 0 | 0.0% |
| Unpaid Family Workers | 0 | 0.0% |
| Total | 886 | 100.0% |
Employment Status by Age in Verona Walk
According to the labor force statistics for Verona Walk, out of the total population over 16 years of age (2,794), 34.3% or 958 individuals are in the labor force, with 7.6% or 73 of them unemployed. The age group with the highest labor force participation rate is 25 to 29 years, with 100.0% or 40 individuals in the labor force. Within the labor force, the 45 to 54 years age range has the highest percentage of unemployed individuals, with 22.6% or 47 of them being unemployed.
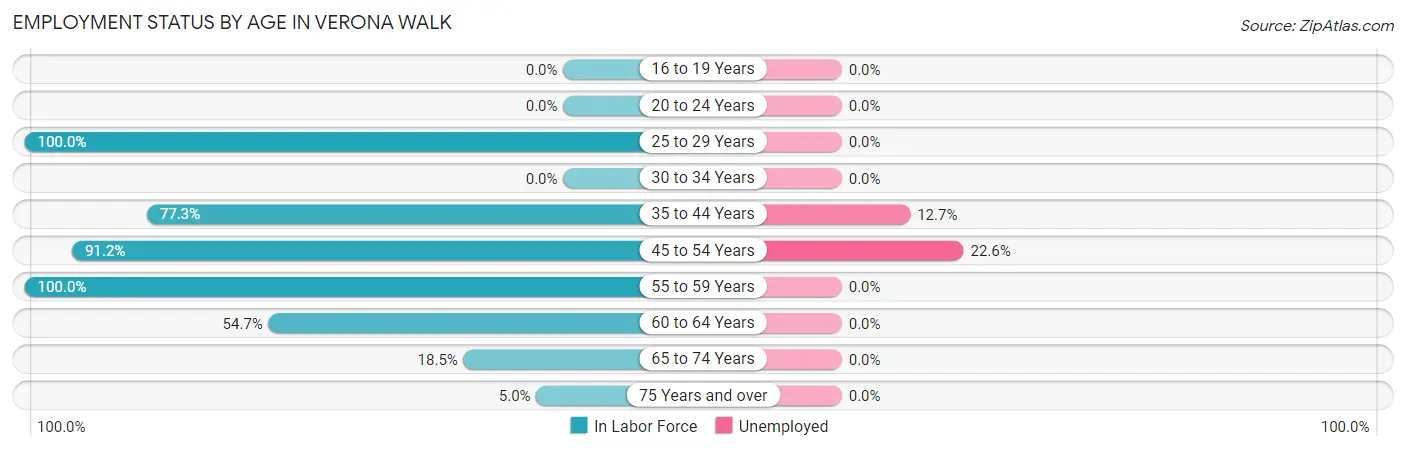
| Age Bracket | In Labor Force | Unemployed |
| 16 to 19 Years | 0 (0.0%) | 0 (0.0%) |
| 20 to 24 Years | 0 (0.0%) | 0 (0.0%) |
| 25 to 29 Years | 40 (100.0%) | 0 (0.0%) |
| 30 to 34 Years | 0 (0.0%) | 0 (0.0%) |
| 35 to 44 Years | 204 (77.3%) | 26 (12.7%) |
| 45 to 54 Years | 208 (91.2%) | 47 (22.6%) |
| 55 to 59 Years | 117 (100.0%) | 0 (0.0%) |
| 60 to 64 Years | 157 (54.7%) | 0 (0.0%) |
| 65 to 74 Years | 194 (18.5%) | 0 (0.0%) |
| 75 Years and over | 40 (5.0%) | 0 (0.0%) |
| Total | 958 (34.3%) | 73 (7.6%) |
Employment Status by Educational Attainment in Verona Walk
According to labor force statistics for Verona Walk, 76.7% of individuals (726) out of the total population between 25 and 64 years of age (947) are in the labor force, with 10.1% or 73 of them being unemployed. The group with the highest labor force participation rate are those with the educational attainment of college / associate degree, with 82.0% or 223 individuals in the labor force. Within the labor force, individuals with high school diploma education have the highest percentage of unemployment, with 26.3% or 47 of them being unemployed.
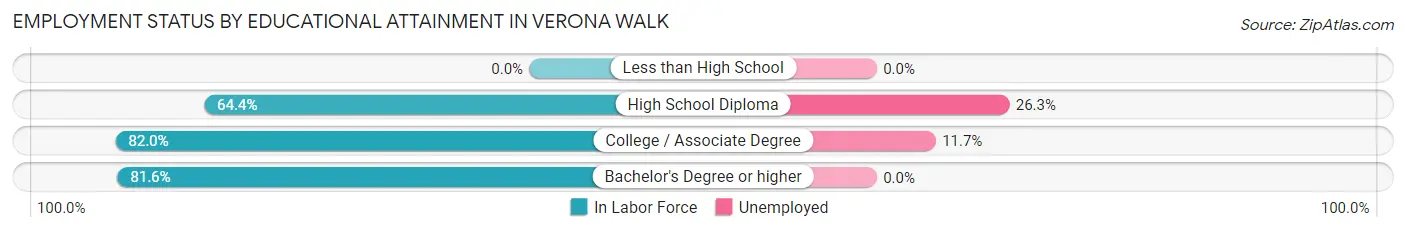
| Educational Attainment | In Labor Force | Unemployed |
| Less than High School | 0 (0.0%) | 0 (0.0%) |
| High School Diploma | 179 (64.4%) | 73 (26.3%) |
| College / Associate Degree | 223 (82.0%) | 32 (11.7%) |
| Bachelor's Degree or higher | 324 (81.6%) | 0 (0.0%) |
| Total | 726 (76.7%) | 96 (10.1%) |
Employment Occupations by Sex in Verona Walk
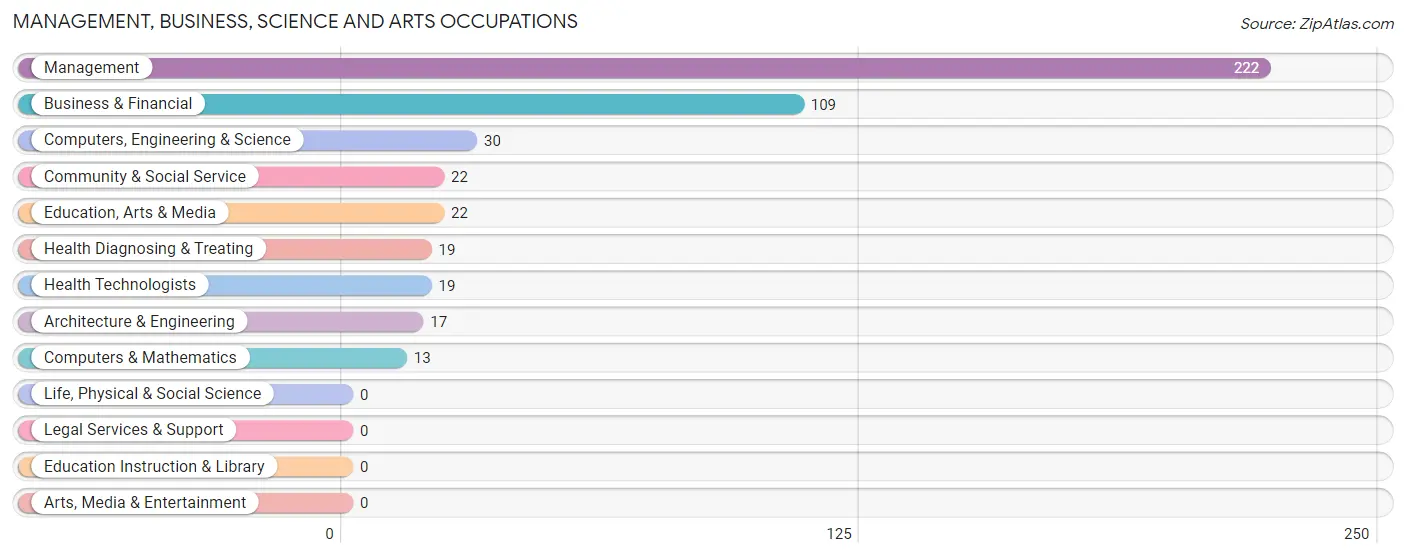
Management, Business, Science and Arts Occupations
The most common Management, Business, Science and Arts occupations in Verona Walk are Management (222 | 25.1%), Business & Financial (109 | 12.3%), Computers, Engineering & Science (30 | 3.4%), Community & Social Service (22 | 2.5%), and Education, Arts & Media (22 | 2.5%).
Management, Business, Science and Arts Occupations by Sex
Within the Management, Business, Science and Arts occupations in Verona Walk, the most male-oriented occupations are Computers, Engineering & Science (100.0%), Computers & Mathematics (100.0%), and Architecture & Engineering (100.0%), while the most female-oriented occupations are Health Diagnosing & Treating (100.0%), Health Technologists (100.0%), and Business & Financial (85.3%).
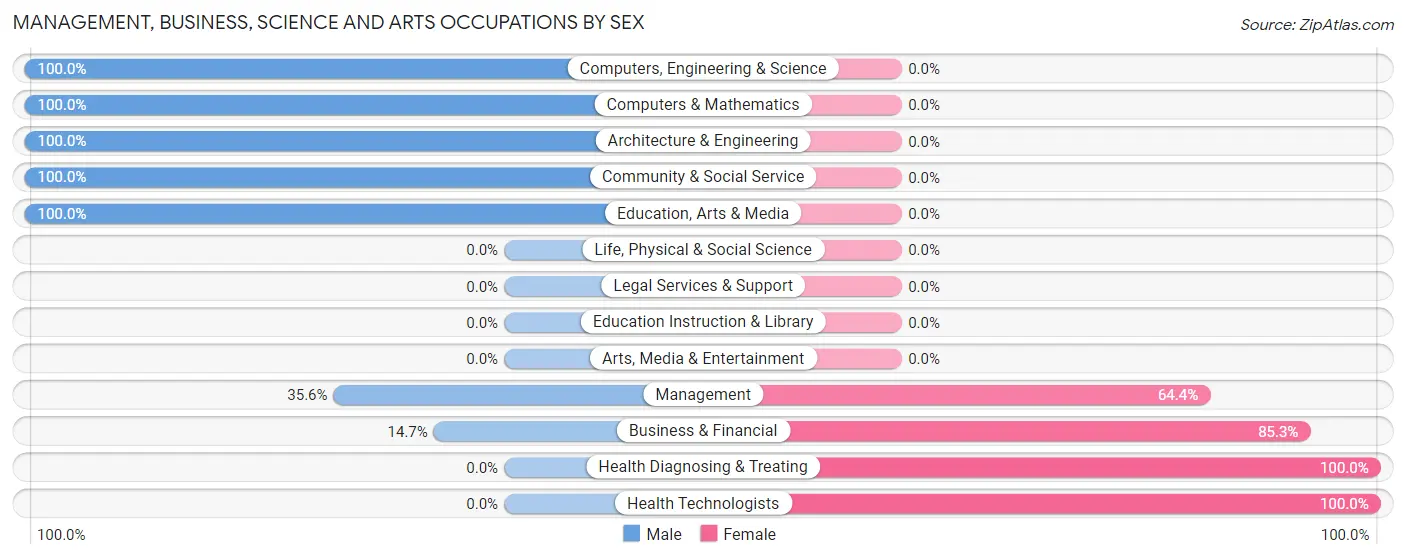
| Occupation | Male | Female |
| Management | 79 (35.6%) | 143 (64.4%) |
| Business & Financial | 16 (14.7%) | 93 (85.3%) |
| Computers, Engineering & Science | 30 (100.0%) | 0 (0.0%) |
| Computers & Mathematics | 13 (100.0%) | 0 (0.0%) |
| Architecture & Engineering | 17 (100.0%) | 0 (0.0%) |
| Life, Physical & Social Science | 0 (0.0%) | 0 (0.0%) |
| Community & Social Service | 22 (100.0%) | 0 (0.0%) |
| Education, Arts & Media | 22 (100.0%) | 0 (0.0%) |
| Legal Services & Support | 0 (0.0%) | 0 (0.0%) |
| Education Instruction & Library | 0 (0.0%) | 0 (0.0%) |
| Arts, Media & Entertainment | 0 (0.0%) | 0 (0.0%) |
| Health Diagnosing & Treating | 0 (0.0%) | 19 (100.0%) |
| Health Technologists | 0 (0.0%) | 19 (100.0%) |
| Total (Category) | 147 (36.6%) | 255 (63.4%) |
| Total (Overall) | 413 (46.6%) | 473 (53.4%) |
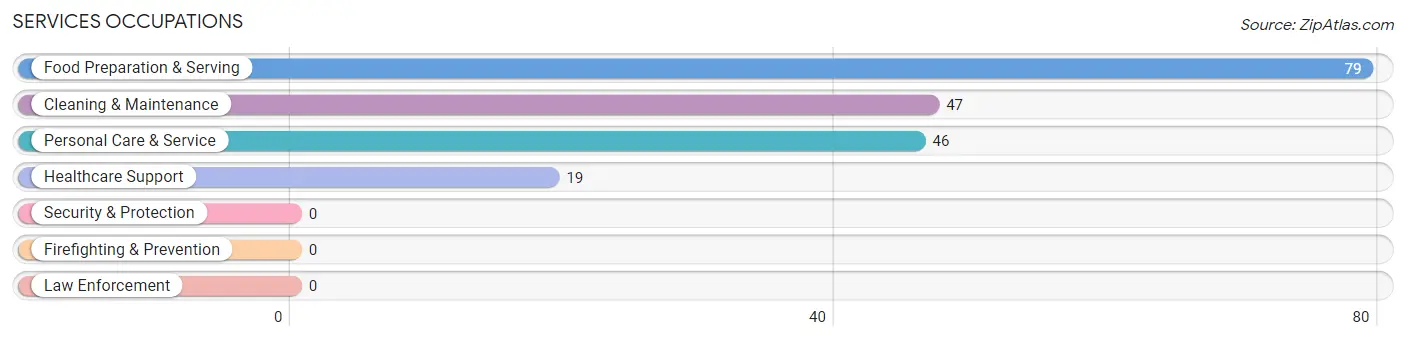
Services Occupations
The most common Services occupations in Verona Walk are Food Preparation & Serving (79 | 8.9%), Cleaning & Maintenance (47 | 5.3%), Personal Care & Service (46 | 5.2%), and Healthcare Support (19 | 2.1%).
Services Occupations by Sex
Within the Services occupations in Verona Walk, the most male-oriented occupations are Cleaning & Maintenance (100.0%), and Personal Care & Service (100.0%), while the most female-oriented occupations are Healthcare Support (100.0%), and Food Preparation & Serving (100.0%).
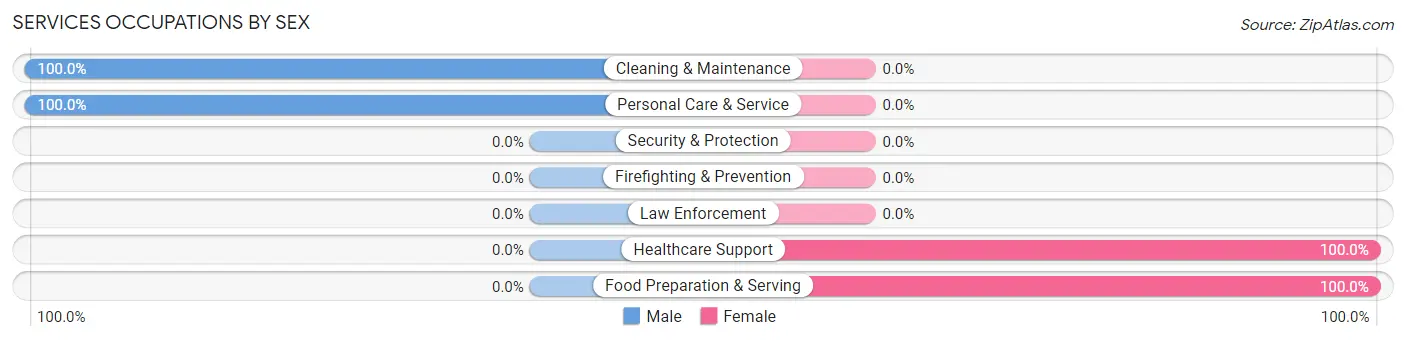
| Occupation | Male | Female |
| Healthcare Support | 0 (0.0%) | 19 (100.0%) |
| Security & Protection | 0 (0.0%) | 0 (0.0%) |
| Firefighting & Prevention | 0 (0.0%) | 0 (0.0%) |
| Law Enforcement | 0 (0.0%) | 0 (0.0%) |
| Food Preparation & Serving | 0 (0.0%) | 79 (100.0%) |
| Cleaning & Maintenance | 47 (100.0%) | 0 (0.0%) |
| Personal Care & Service | 46 (100.0%) | 0 (0.0%) |
| Total (Category) | 93 (48.7%) | 98 (51.3%) |
| Total (Overall) | 413 (46.6%) | 473 (53.4%) |
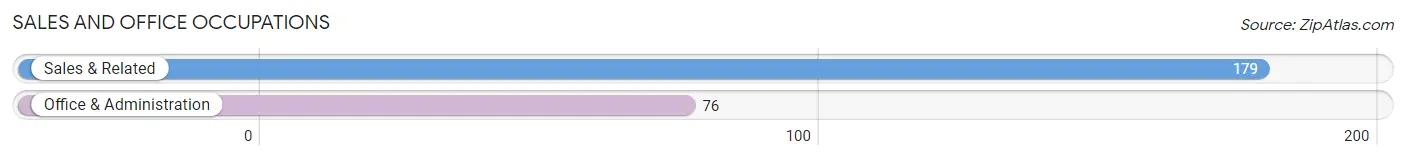
Sales and Office Occupations
The most common Sales and Office occupations in Verona Walk are Sales & Related (179 | 20.2%), and Office & Administration (76 | 8.6%).
Sales and Office Occupations by Sex
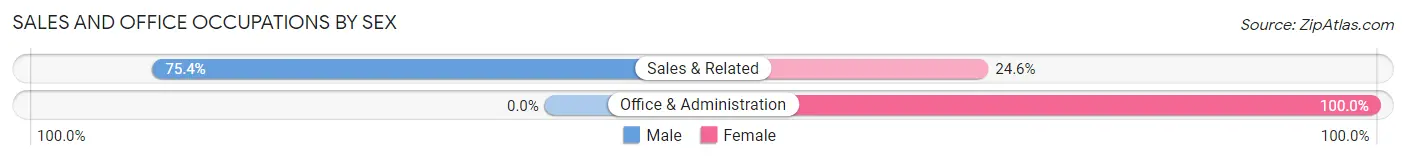
| Occupation | Male | Female |
| Sales & Related | 135 (75.4%) | 44 (24.6%) |
| Office & Administration | 0 (0.0%) | 76 (100.0%) |
| Total (Category) | 135 (52.9%) | 120 (47.1%) |
| Total (Overall) | 413 (46.6%) | 473 (53.4%) |
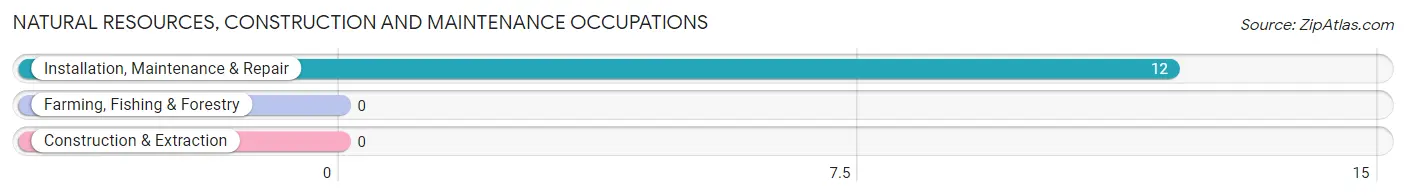
Natural Resources, Construction and Maintenance Occupations
The most common Natural Resources, Construction and Maintenance occupations in Verona Walk are , and Installation, Maintenance & Repair (12 | 1.3%).
Natural Resources, Construction and Maintenance Occupations by Sex
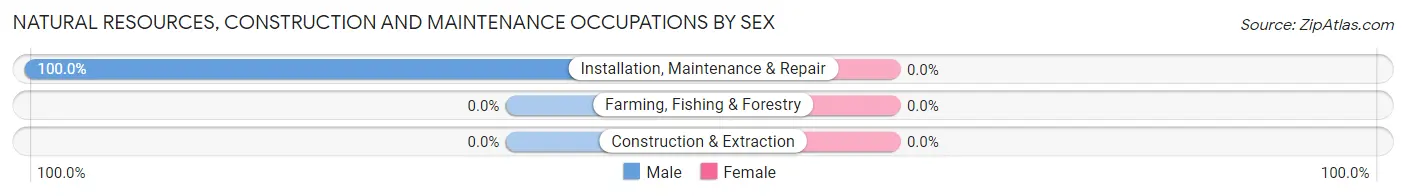
| Occupation | Male | Female |
| Farming, Fishing & Forestry | 0 (0.0%) | 0 (0.0%) |
| Construction & Extraction | 0 (0.0%) | 0 (0.0%) |
| Installation, Maintenance & Repair | 12 (100.0%) | 0 (0.0%) |
| Total (Category) | 12 (100.0%) | 0 (0.0%) |
| Total (Overall) | 413 (46.6%) | 473 (53.4%) |
Production, Transportation and Moving Occupations
The most common Production, Transportation and Moving occupations in Verona Walk are , and Material Moving (26 | 2.9%).
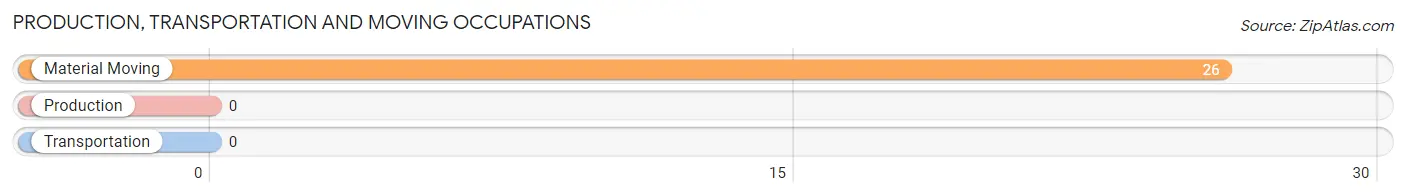
Production, Transportation and Moving Occupations by Sex
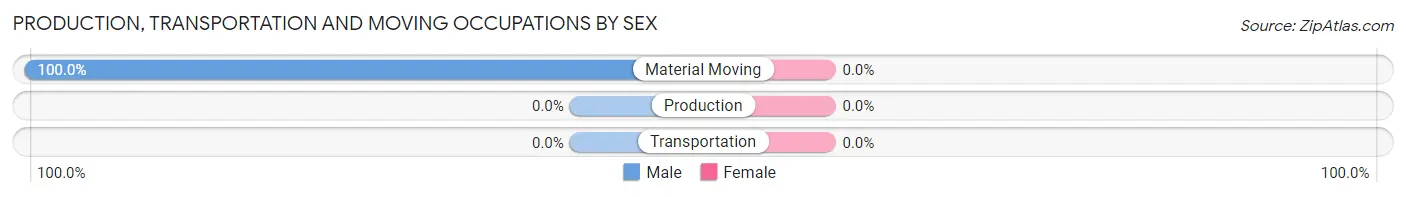
| Occupation | Male | Female |
| Production | 0 (0.0%) | 0 (0.0%) |
| Transportation | 0 (0.0%) | 0 (0.0%) |
| Material Moving | 26 (100.0%) | 0 (0.0%) |
| Total (Category) | 26 (100.0%) | 0 (0.0%) |
| Total (Overall) | 413 (46.6%) | 473 (53.4%) |
Employment Industries by Sex in Verona Walk
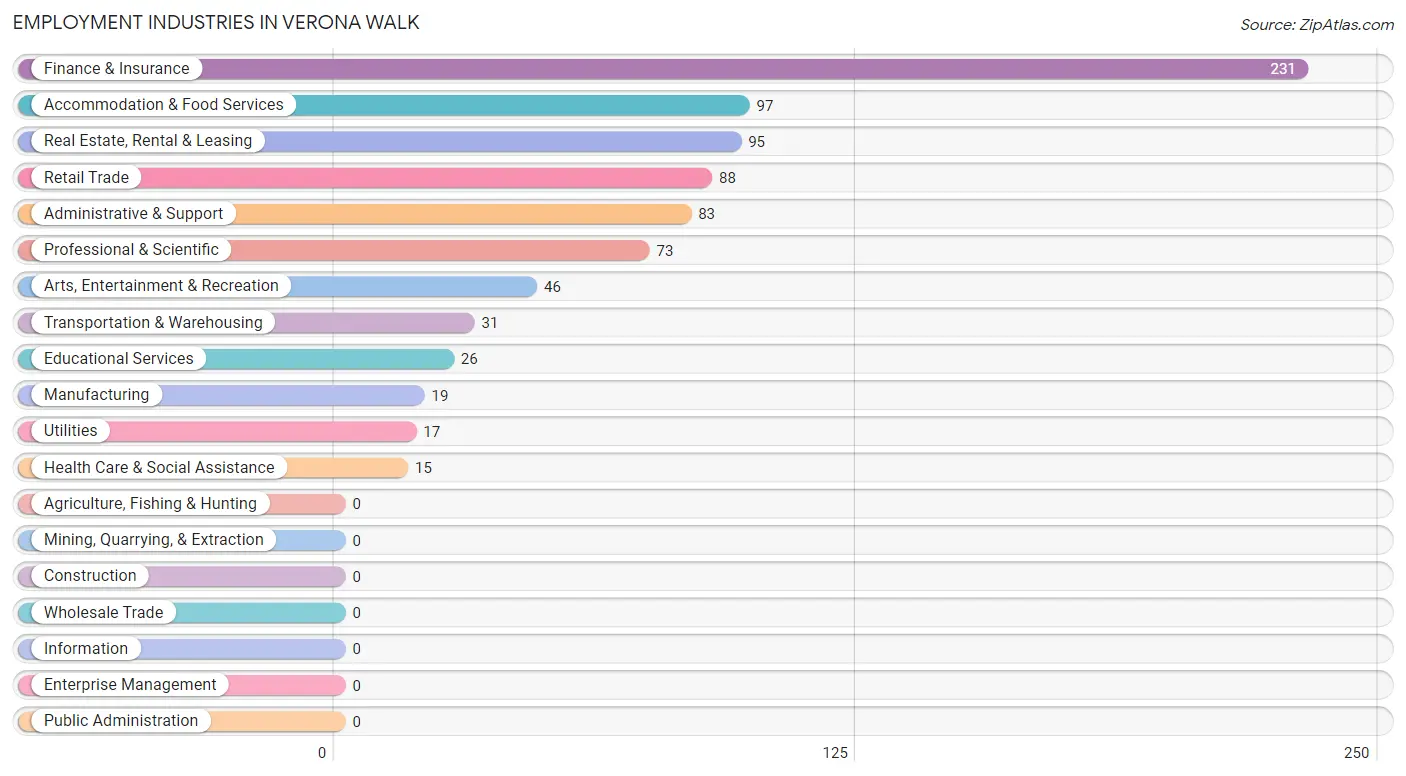
Employment Industries in Verona Walk
The major employment industries in Verona Walk include Finance & Insurance (231 | 26.1%), Accommodation & Food Services (97 | 11.0%), Real Estate, Rental & Leasing (95 | 10.7%), Retail Trade (88 | 9.9%), and Administrative & Support (83 | 9.4%).
Employment Industries by Sex in Verona Walk
The Verona Walk industries that see more men than women are Transportation & Warehousing (100.0%), Utilities (100.0%), and Arts, Entertainment & Recreation (100.0%), whereas the industries that tend to have a higher number of women are Manufacturing (100.0%), Educational Services (100.0%), and Health Care & Social Assistance (100.0%).
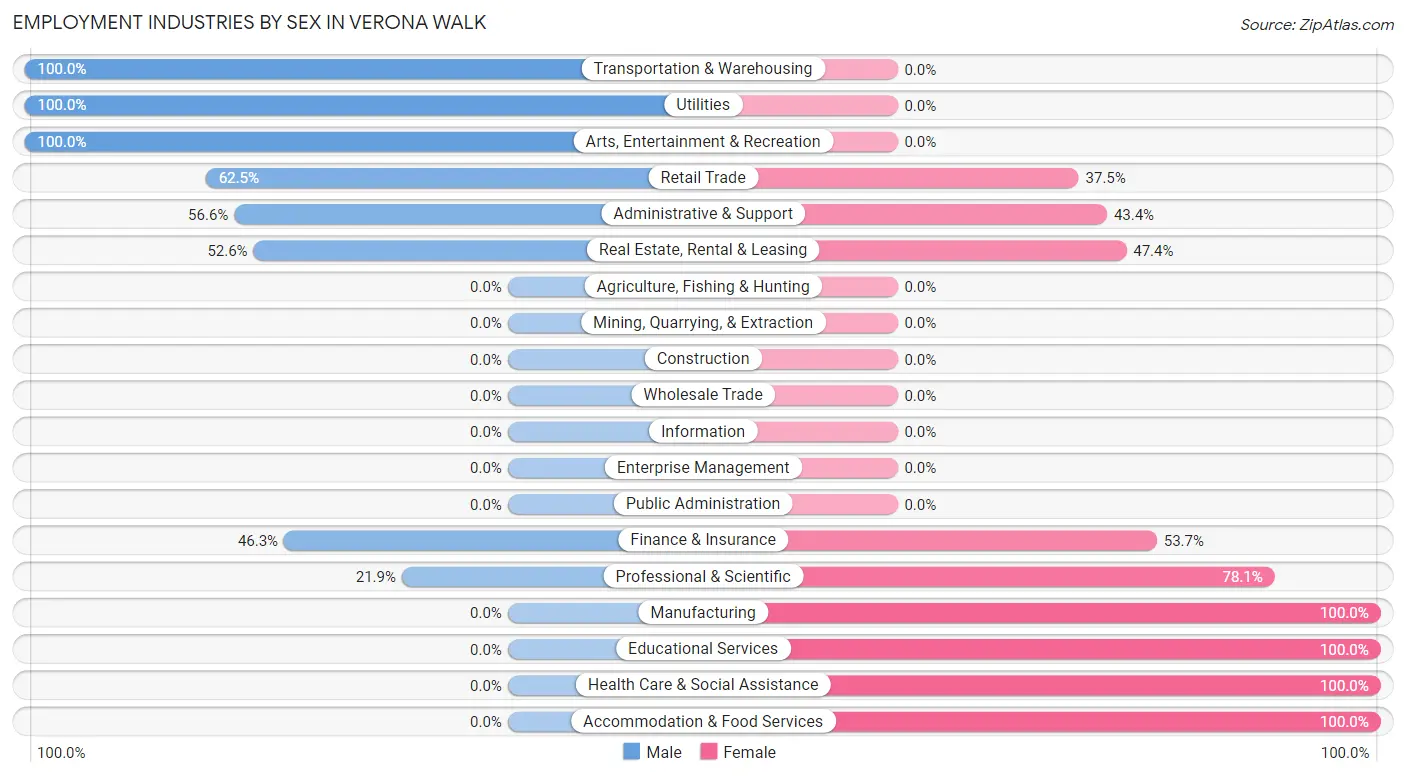
| Industry | Male | Female |
| Agriculture, Fishing & Hunting | 0 (0.0%) | 0 (0.0%) |
| Mining, Quarrying, & Extraction | 0 (0.0%) | 0 (0.0%) |
| Construction | 0 (0.0%) | 0 (0.0%) |
| Manufacturing | 0 (0.0%) | 19 (100.0%) |
| Wholesale Trade | 0 (0.0%) | 0 (0.0%) |
| Retail Trade | 55 (62.5%) | 33 (37.5%) |
| Transportation & Warehousing | 31 (100.0%) | 0 (0.0%) |
| Utilities | 17 (100.0%) | 0 (0.0%) |
| Information | 0 (0.0%) | 0 (0.0%) |
| Finance & Insurance | 107 (46.3%) | 124 (53.7%) |
| Real Estate, Rental & Leasing | 50 (52.6%) | 45 (47.4%) |
| Professional & Scientific | 16 (21.9%) | 57 (78.1%) |
| Enterprise Management | 0 (0.0%) | 0 (0.0%) |
| Administrative & Support | 47 (56.6%) | 36 (43.4%) |
| Educational Services | 0 (0.0%) | 26 (100.0%) |
| Health Care & Social Assistance | 0 (0.0%) | 15 (100.0%) |
| Arts, Entertainment & Recreation | 46 (100.0%) | 0 (0.0%) |
| Accommodation & Food Services | 0 (0.0%) | 97 (100.0%) |
| Public Administration | 0 (0.0%) | 0 (0.0%) |
| Total | 413 (46.6%) | 473 (53.4%) |
Education in Verona Walk
School Enrollment in Verona Walk
The most common levels of schooling among the 139 students in Verona Walk are high school (62 | 44.6%), middle school (46 | 33.1%), and elementary school (16 | 11.5%).
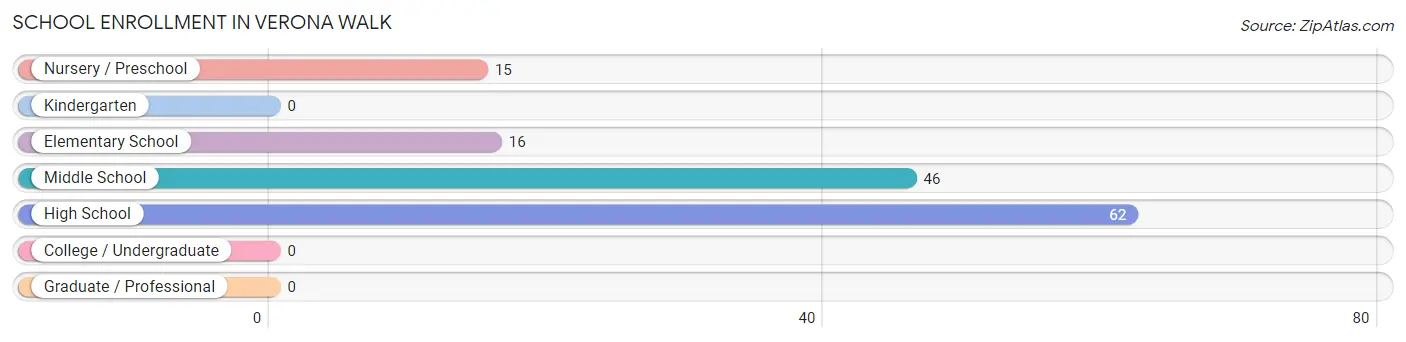
| School Level | # Students | % Students |
| Nursery / Preschool | 15 | 10.8% |
| Kindergarten | 0 | 0.0% |
| Elementary School | 16 | 11.5% |
| Middle School | 46 | 33.1% |
| High School | 62 | 44.6% |
| College / Undergraduate | 0 | 0.0% |
| Graduate / Professional | 0 | 0.0% |
| Total | 139 | 100.0% |
School Enrollment by Age by Funding Source in Verona Walk
Out of a total of 139 students who are enrolled in schools in Verona Walk, 31 (22.3%) attend a private institution, while the remaining 108 (77.7%) are enrolled in public schools. The age group of 3 to 4 year olds has the highest likelihood of being enrolled in private schools, with 15 (100.0% in the age bracket) enrolled. Conversely, the age group of 5 to 9 year old has the lowest likelihood of being enrolled in a private school, with 16 (100.0% in the age bracket) attending a public institution.
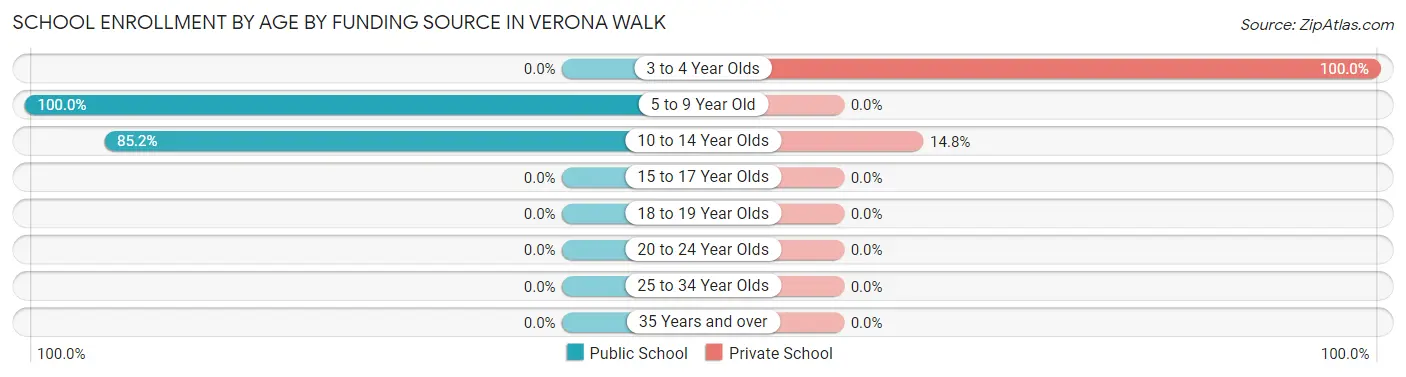
| Age Bracket | Public School | Private School |
| 3 to 4 Year Olds | 0 (0.0%) | 15 (100.0%) |
| 5 to 9 Year Old | 16 (100.0%) | 0 (0.0%) |
| 10 to 14 Year Olds | 92 (85.2%) | 16 (14.8%) |
| 15 to 17 Year Olds | 0 (0.0%) | 0 (0.0%) |
| 18 to 19 Year Olds | 0 (0.0%) | 0 (0.0%) |
| 20 to 24 Year Olds | 0 (0.0%) | 0 (0.0%) |
| 25 to 34 Year Olds | 0 (0.0%) | 0 (0.0%) |
| 35 Years and over | 0 (0.0%) | 0 (0.0%) |
| Total | 108 (77.7%) | 31 (22.3%) |
Educational Attainment by Field of Study in Verona Walk
Business (378 | 29.3%), education (220 | 17.1%), social sciences (143 | 11.1%), bio, nature & agricultural (115 | 8.9%), and science & technology (97 | 7.5%) are the most common fields of study among 1,288 individuals in Verona Walk who have obtained a bachelor's degree or higher.
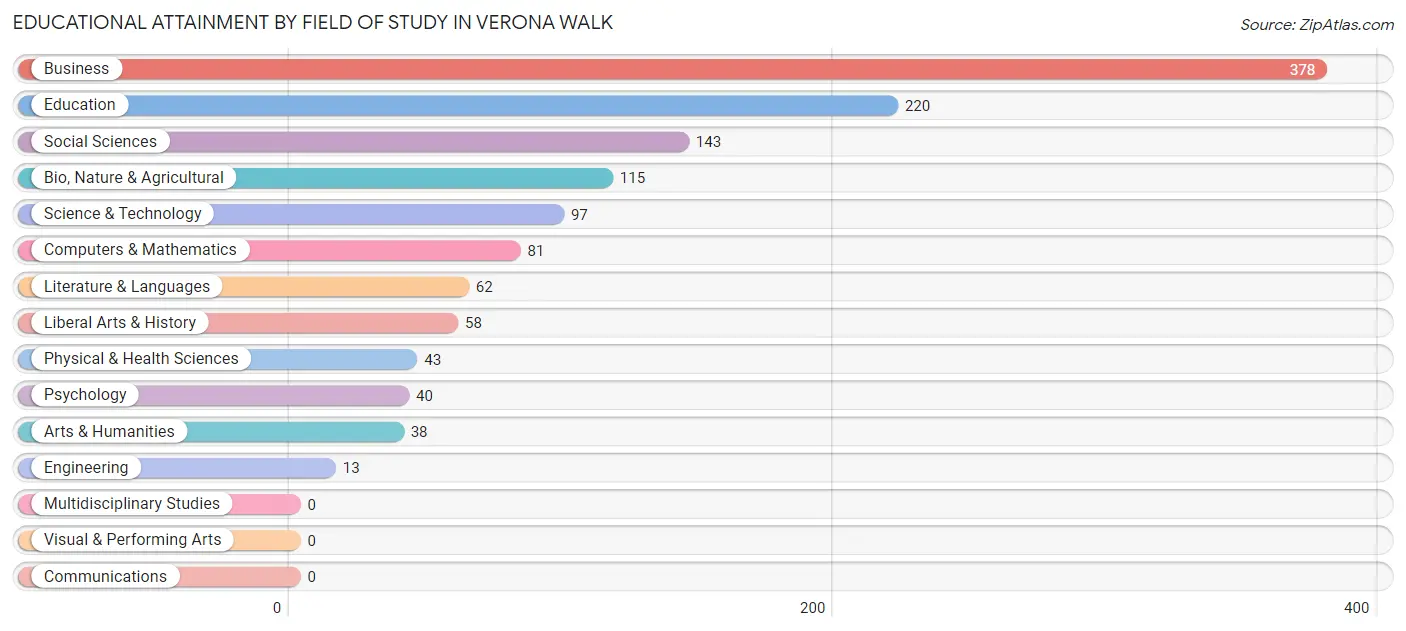
| Field of Study | # Graduates | % Graduates |
| Computers & Mathematics | 81 | 6.3% |
| Bio, Nature & Agricultural | 115 | 8.9% |
| Physical & Health Sciences | 43 | 3.3% |
| Psychology | 40 | 3.1% |
| Social Sciences | 143 | 11.1% |
| Engineering | 13 | 1.0% |
| Multidisciplinary Studies | 0 | 0.0% |
| Science & Technology | 97 | 7.5% |
| Business | 378 | 29.3% |
| Education | 220 | 17.1% |
| Literature & Languages | 62 | 4.8% |
| Liberal Arts & History | 58 | 4.5% |
| Visual & Performing Arts | 0 | 0.0% |
| Communications | 0 | 0.0% |
| Arts & Humanities | 38 | 2.9% |
| Total | 1,288 | 100.0% |
Transportation & Commute in Verona Walk
Vehicle Availability by Sex in Verona Walk
The most prevalent vehicle ownership categories in Verona Walk are males with 2 vehicles (305, accounting for 73.9%) and females with 2 vehicles (403, making up 64.5%).
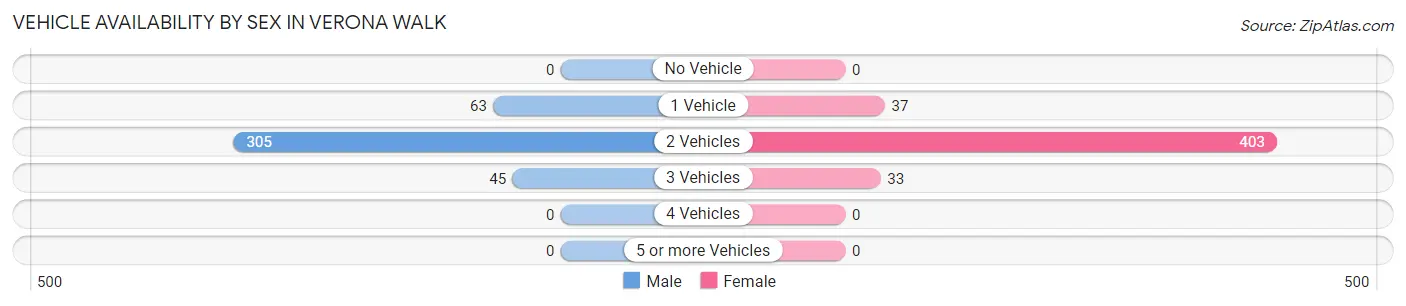
| Vehicles Available | Male | Female |
| No Vehicle | 0 (0.0%) | 0 (0.0%) |
| 1 Vehicle | 63 (15.2%) | 37 (7.8%) |
| 2 Vehicles | 305 (73.9%) | 403 (85.2%) |
| 3 Vehicles | 45 (10.9%) | 33 (7.0%) |
| 4 Vehicles | 0 (0.0%) | 0 (0.0%) |
| 5 or more Vehicles | 0 (0.0%) | 0 (0.0%) |
| Total | 413 (100.0%) | 473 (100.0%) |
Commute Time in Verona Walk
The most frequently occuring commute durations in Verona Walk are 20 to 24 minutes (216 commuters, 32.1%), 30 to 34 minutes (155 commuters, 23.0%), and 25 to 29 minutes (148 commuters, 22.0%).
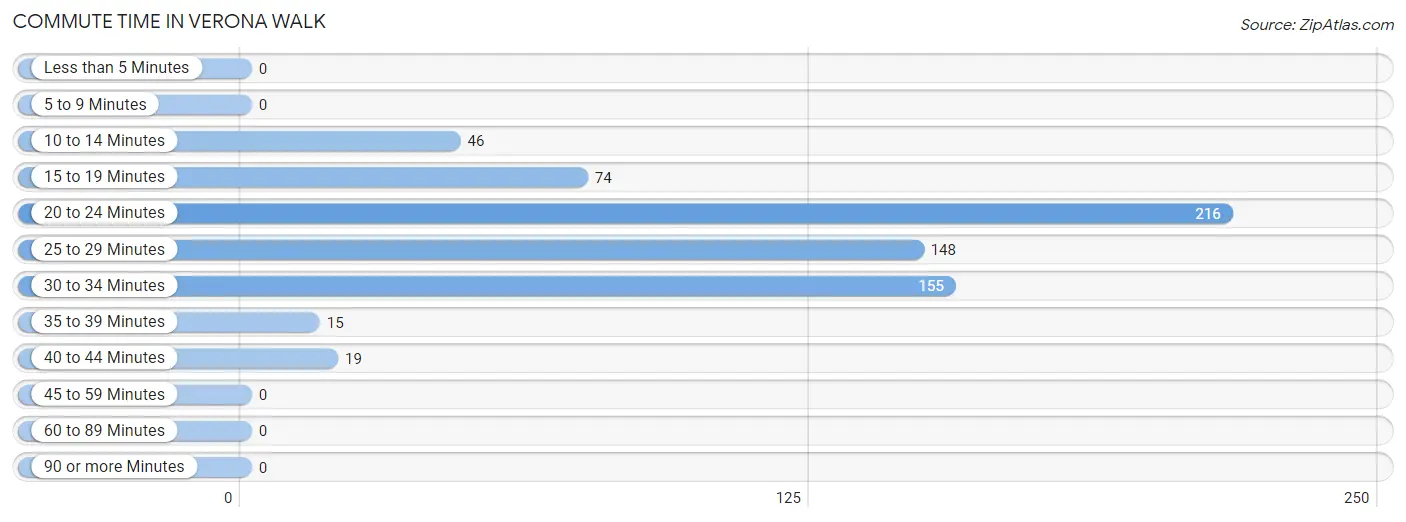
| Commute Time | # Commuters | % Commuters |
| Less than 5 Minutes | 0 | 0.0% |
| 5 to 9 Minutes | 0 | 0.0% |
| 10 to 14 Minutes | 46 | 6.8% |
| 15 to 19 Minutes | 74 | 11.0% |
| 20 to 24 Minutes | 216 | 32.1% |
| 25 to 29 Minutes | 148 | 22.0% |
| 30 to 34 Minutes | 155 | 23.0% |
| 35 to 39 Minutes | 15 | 2.2% |
| 40 to 44 Minutes | 19 | 2.8% |
| 45 to 59 Minutes | 0 | 0.0% |
| 60 to 89 Minutes | 0 | 0.0% |
| 90 or more Minutes | 0 | 0.0% |
Commute Time by Sex in Verona Walk
The most common commute times in Verona Walk are 30 to 34 minutes (129 commuters, 47.1%) for males and 20 to 24 minutes (177 commuters, 44.4%) for females.
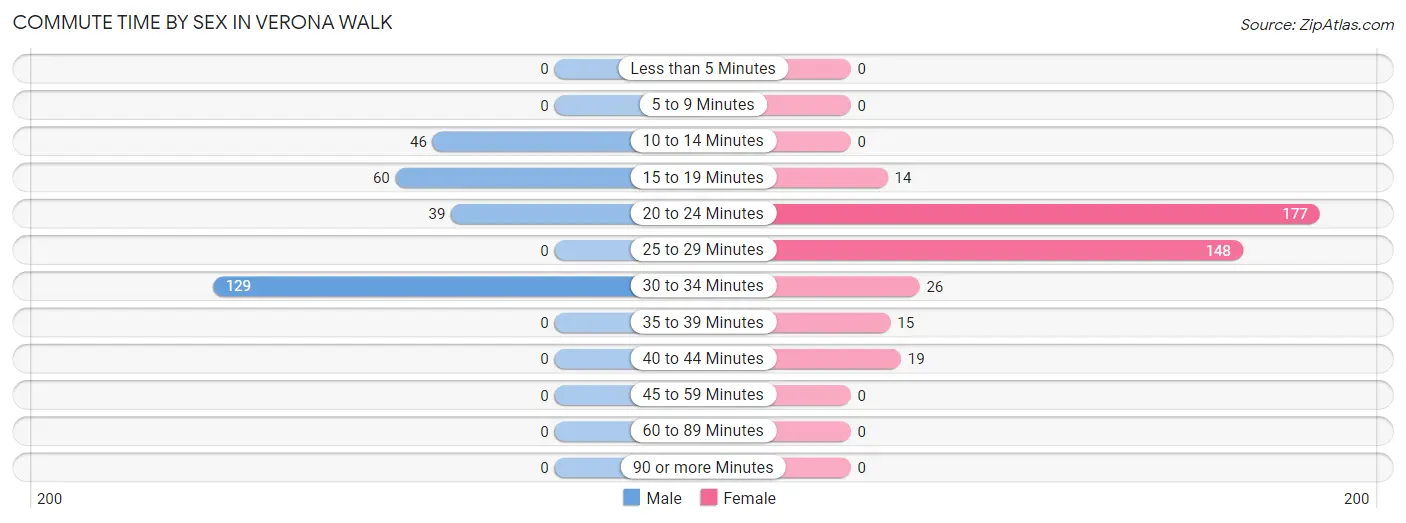
| Commute Time | Male | Female |
| Less than 5 Minutes | 0 (0.0%) | 0 (0.0%) |
| 5 to 9 Minutes | 0 (0.0%) | 0 (0.0%) |
| 10 to 14 Minutes | 46 (16.8%) | 0 (0.0%) |
| 15 to 19 Minutes | 60 (21.9%) | 14 (3.5%) |
| 20 to 24 Minutes | 39 (14.2%) | 177 (44.4%) |
| 25 to 29 Minutes | 0 (0.0%) | 148 (37.1%) |
| 30 to 34 Minutes | 129 (47.1%) | 26 (6.5%) |
| 35 to 39 Minutes | 0 (0.0%) | 15 (3.8%) |
| 40 to 44 Minutes | 0 (0.0%) | 19 (4.8%) |
| 45 to 59 Minutes | 0 (0.0%) | 0 (0.0%) |
| 60 to 89 Minutes | 0 (0.0%) | 0 (0.0%) |
| 90 or more Minutes | 0 (0.0%) | 0 (0.0%) |
Time of Departure to Work by Sex in Verona Walk
The most frequent times of departure to work in Verona Walk are 6:30 AM to 6:59 AM (60, 21.9%) for males and 8:00 AM to 8:29 AM (135, 33.8%) for females.
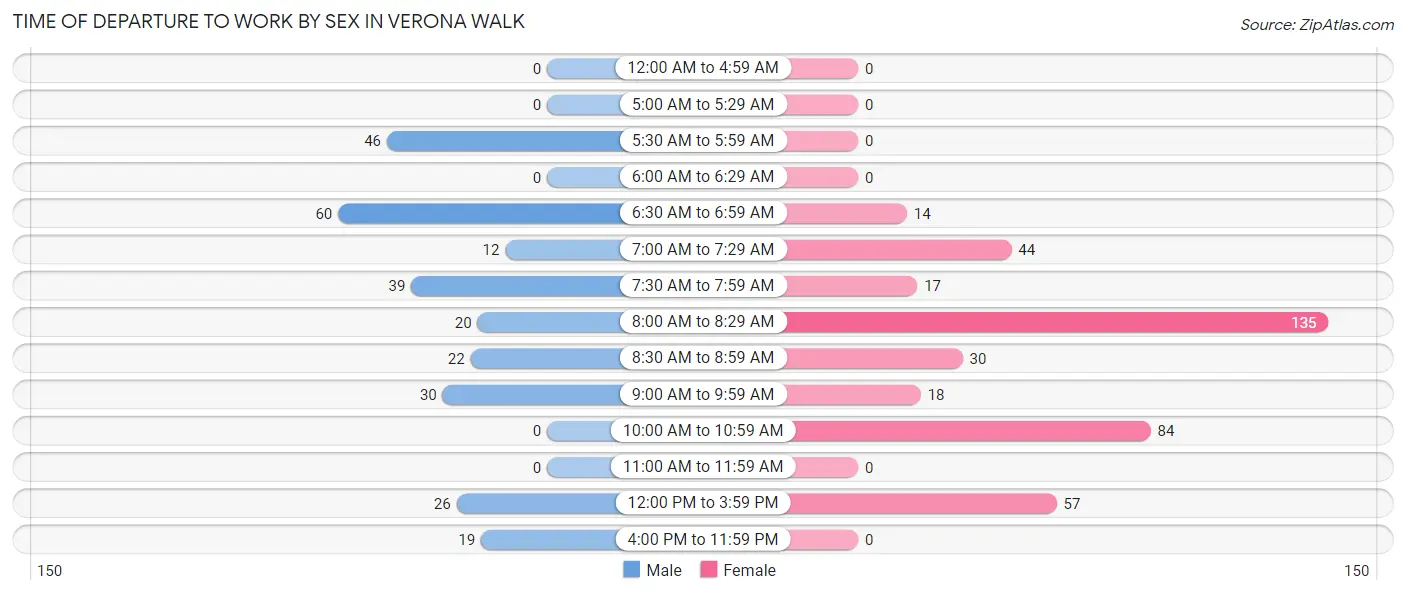
| Time of Departure | Male | Female |
| 12:00 AM to 4:59 AM | 0 (0.0%) | 0 (0.0%) |
| 5:00 AM to 5:29 AM | 0 (0.0%) | 0 (0.0%) |
| 5:30 AM to 5:59 AM | 46 (16.8%) | 0 (0.0%) |
| 6:00 AM to 6:29 AM | 0 (0.0%) | 0 (0.0%) |
| 6:30 AM to 6:59 AM | 60 (21.9%) | 14 (3.5%) |
| 7:00 AM to 7:29 AM | 12 (4.4%) | 44 (11.0%) |
| 7:30 AM to 7:59 AM | 39 (14.2%) | 17 (4.3%) |
| 8:00 AM to 8:29 AM | 20 (7.3%) | 135 (33.8%) |
| 8:30 AM to 8:59 AM | 22 (8.0%) | 30 (7.5%) |
| 9:00 AM to 9:59 AM | 30 (11.0%) | 18 (4.5%) |
| 10:00 AM to 10:59 AM | 0 (0.0%) | 84 (21.0%) |
| 11:00 AM to 11:59 AM | 0 (0.0%) | 0 (0.0%) |
| 12:00 PM to 3:59 PM | 26 (9.5%) | 57 (14.3%) |
| 4:00 PM to 11:59 PM | 19 (6.9%) | 0 (0.0%) |
| Total | 274 (100.0%) | 399 (100.0%) |
Housing Occupancy in Verona Walk
Occupancy by Ownership in Verona Walk
Of the total 1,491 dwellings in Verona Walk, owner-occupied units account for 1,327 (89.0%), while renter-occupied units make up 164 (11.0%).
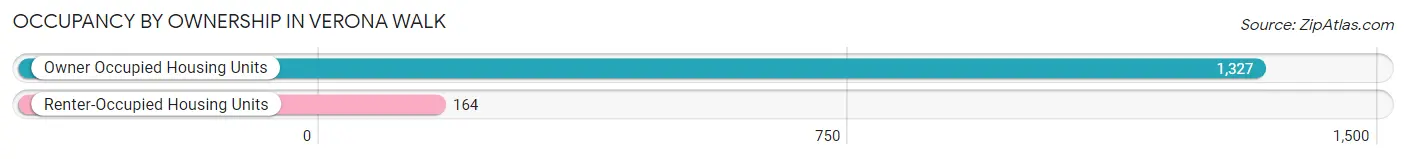
| Occupancy | # Housing Units | % Housing Units |
| Owner Occupied Housing Units | 1,327 | 89.0% |
| Renter-Occupied Housing Units | 164 | 11.0% |
| Total Occupied Housing Units | 1,491 | 100.0% |
Occupancy by Household Size in Verona Walk
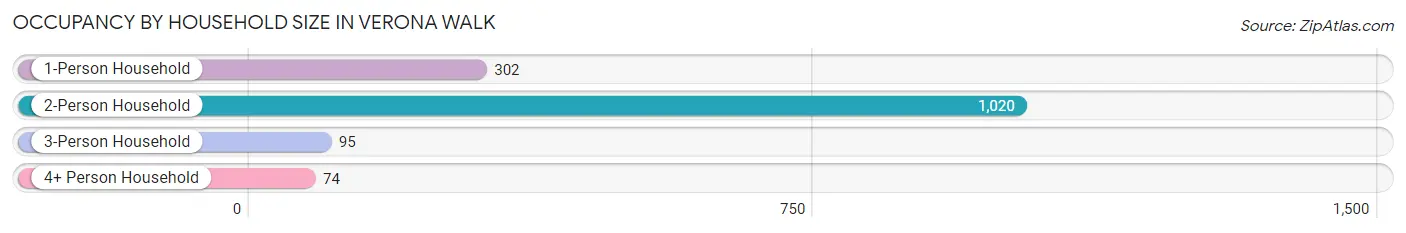
| Household Size | # Housing Units | % Housing Units |
| 1-Person Household | 302 | 20.3% |
| 2-Person Household | 1,020 | 68.4% |
| 3-Person Household | 95 | 6.4% |
| 4+ Person Household | 74 | 5.0% |
| Total Housing Units | 1,491 | 100.0% |
Occupancy by Ownership by Household Size in Verona Walk
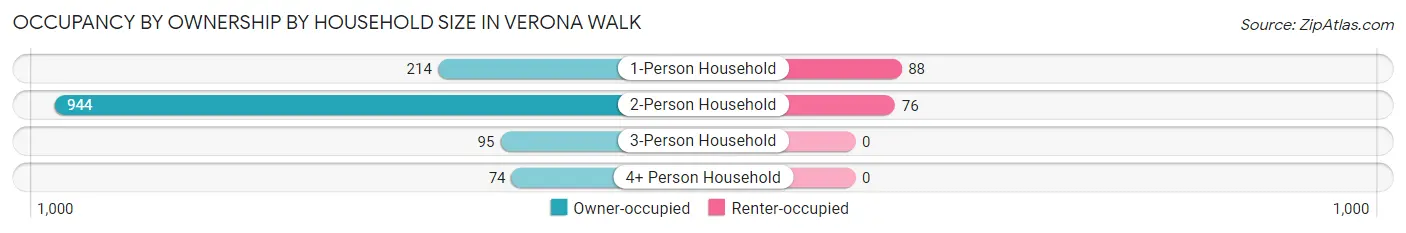
| Household Size | Owner-occupied | Renter-occupied |
| 1-Person Household | 214 (70.9%) | 88 (29.1%) |
| 2-Person Household | 944 (92.5%) | 76 (7.4%) |
| 3-Person Household | 95 (100.0%) | 0 (0.0%) |
| 4+ Person Household | 74 (100.0%) | 0 (0.0%) |
| Total Housing Units | 1,327 (89.0%) | 164 (11.0%) |
Occupancy by Educational Attainment in Verona Walk
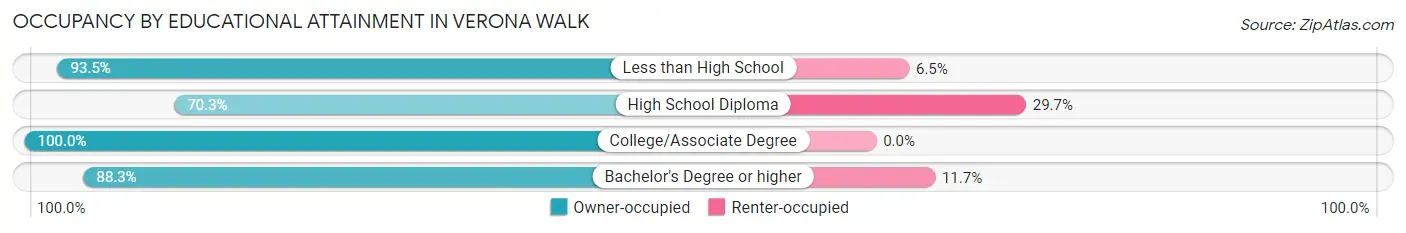
| Household Size | Owner-occupied | Renter-occupied |
| Less than High School | 215 (93.5%) | 15 (6.5%) |
| High School Diploma | 147 (70.3%) | 62 (29.7%) |
| College/Associate Degree | 306 (100.0%) | 0 (0.0%) |
| Bachelor's Degree or higher | 659 (88.3%) | 87 (11.7%) |
Occupancy by Age of Householder in Verona Walk
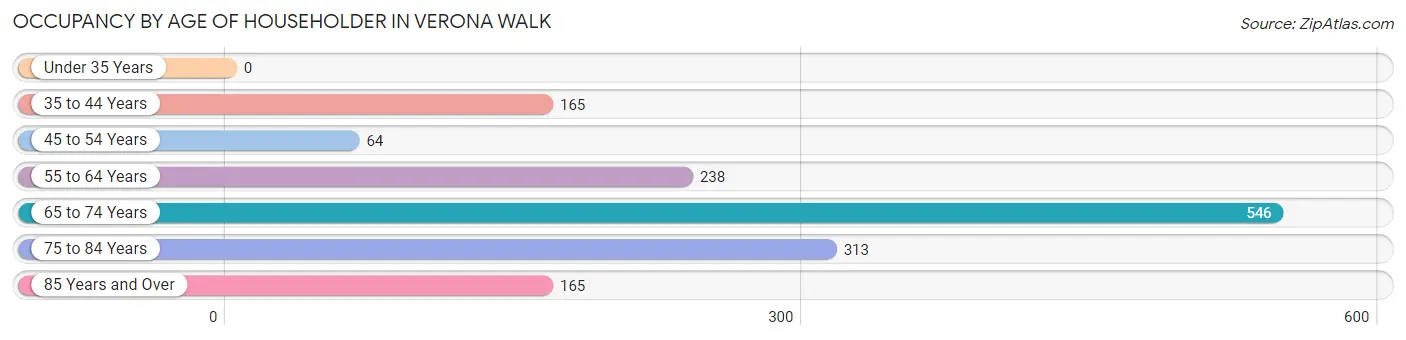
| Age Bracket | # Households | % Households |
| Under 35 Years | 0 | 0.0% |
| 35 to 44 Years | 165 | 11.1% |
| 45 to 54 Years | 64 | 4.3% |
| 55 to 64 Years | 238 | 16.0% |
| 65 to 74 Years | 546 | 36.6% |
| 75 to 84 Years | 313 | 21.0% |
| 85 Years and Over | 165 | 11.1% |
| Total | 1,491 | 100.0% |
Housing Finances in Verona Walk
Median Income by Occupancy in Verona Walk
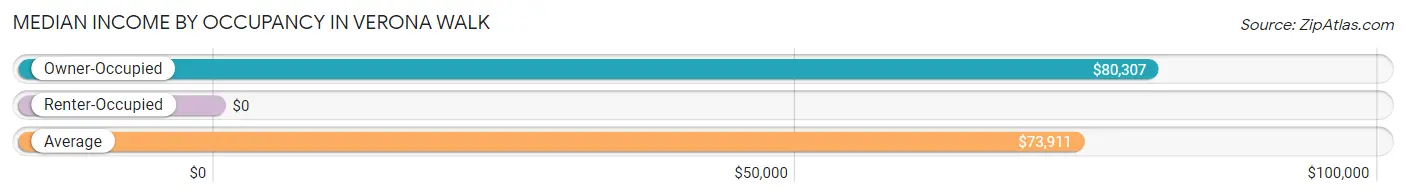
| Occupancy Type | # Households | Median Income |
| Owner-Occupied | 1,327 (89.0%) | $80,307 |
| Renter-Occupied | 164 (11.0%) | $0 |
| Average | 1,491 (100.0%) | $73,911 |
Occupancy by Householder Income Bracket in Verona Walk
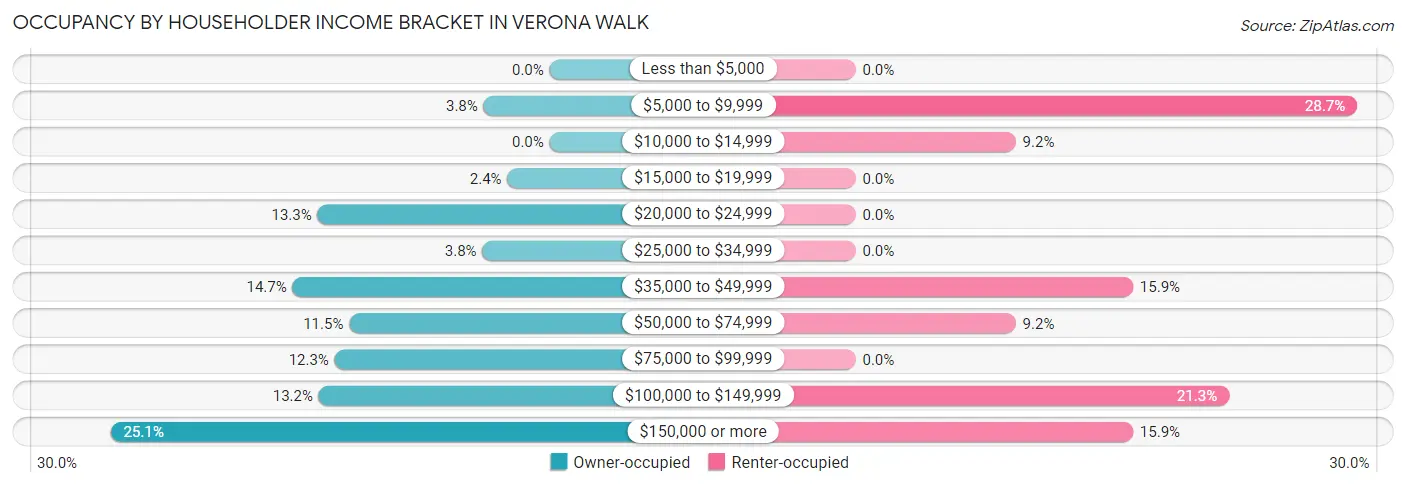
| Income Bracket | Owner-occupied | Renter-occupied |
| Less than $5,000 | 0 (0.0%) | 0 (0.0%) |
| $5,000 to $9,999 | 50 (3.8%) | 47 (28.7%) |
| $10,000 to $14,999 | 0 (0.0%) | 15 (9.1%) |
| $15,000 to $19,999 | 32 (2.4%) | 0 (0.0%) |
| $20,000 to $24,999 | 176 (13.3%) | 0 (0.0%) |
| $25,000 to $34,999 | 51 (3.8%) | 0 (0.0%) |
| $35,000 to $49,999 | 195 (14.7%) | 26 (15.9%) |
| $50,000 to $74,999 | 152 (11.5%) | 15 (9.1%) |
| $75,000 to $99,999 | 163 (12.3%) | 0 (0.0%) |
| $100,000 to $149,999 | 175 (13.2%) | 35 (21.3%) |
| $150,000 or more | 333 (25.1%) | 26 (15.9%) |
| Total | 1,327 (100.0%) | 164 (100.0%) |
Monthly Housing Cost Tiers in Verona Walk
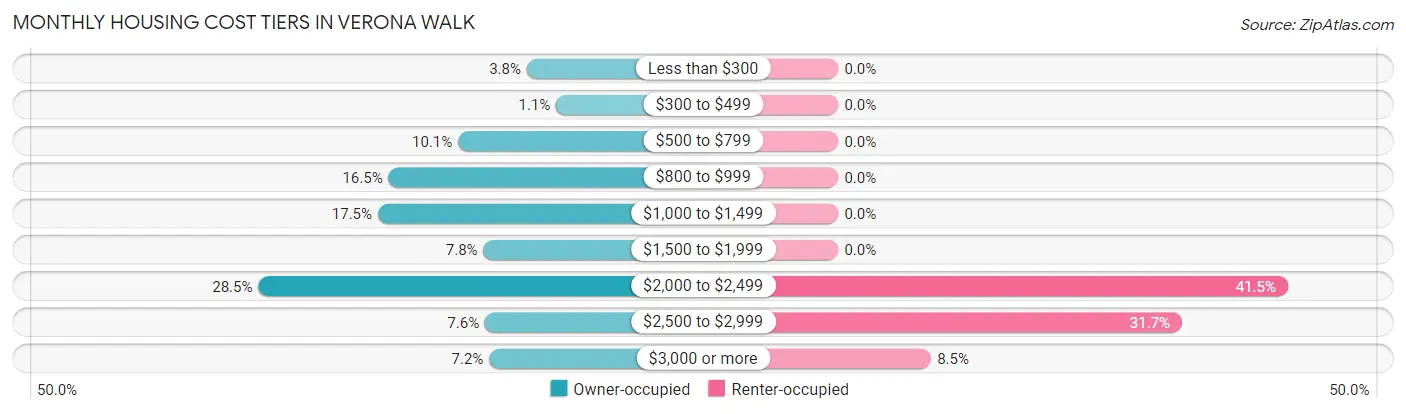
| Monthly Cost | Owner-occupied | Renter-occupied |
| Less than $300 | 50 (3.8%) | 0 (0.0%) |
| $300 to $499 | 14 (1.1%) | 0 (0.0%) |
| $500 to $799 | 134 (10.1%) | 0 (0.0%) |
| $800 to $999 | 219 (16.5%) | 0 (0.0%) |
| $1,000 to $1,499 | 232 (17.5%) | 0 (0.0%) |
| $1,500 to $1,999 | 103 (7.8%) | 0 (0.0%) |
| $2,000 to $2,499 | 378 (28.5%) | 68 (41.5%) |
| $2,500 to $2,999 | 101 (7.6%) | 52 (31.7%) |
| $3,000 or more | 96 (7.2%) | 14 (8.5%) |
| Total | 1,327 (100.0%) | 164 (100.0%) |
Physical Housing Characteristics in Verona Walk
Housing Structures in Verona Walk
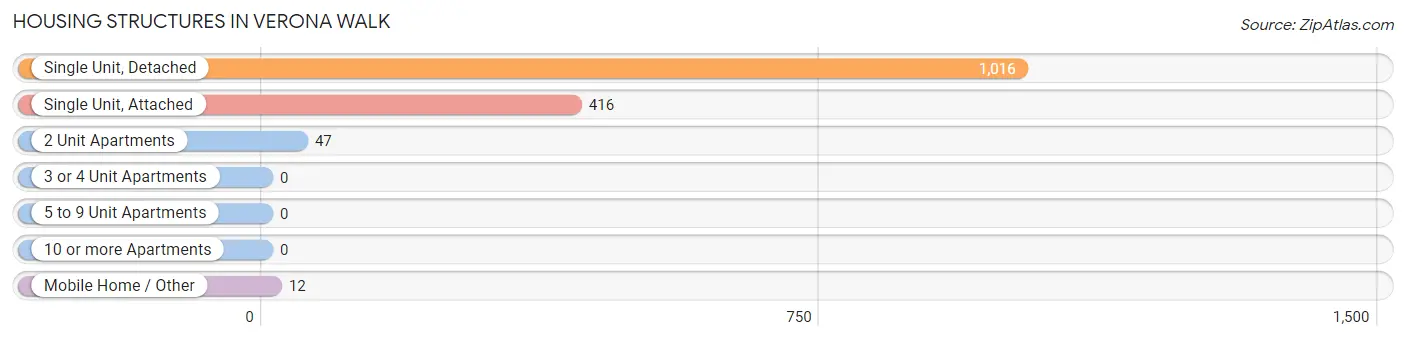
| Structure Type | # Housing Units | % Housing Units |
| Single Unit, Detached | 1,016 | 68.1% |
| Single Unit, Attached | 416 | 27.9% |
| 2 Unit Apartments | 47 | 3.2% |
| 3 or 4 Unit Apartments | 0 | 0.0% |
| 5 to 9 Unit Apartments | 0 | 0.0% |
| 10 or more Apartments | 0 | 0.0% |
| Mobile Home / Other | 12 | 0.8% |
| Total | 1,491 | 100.0% |
Housing Structures by Occupancy in Verona Walk
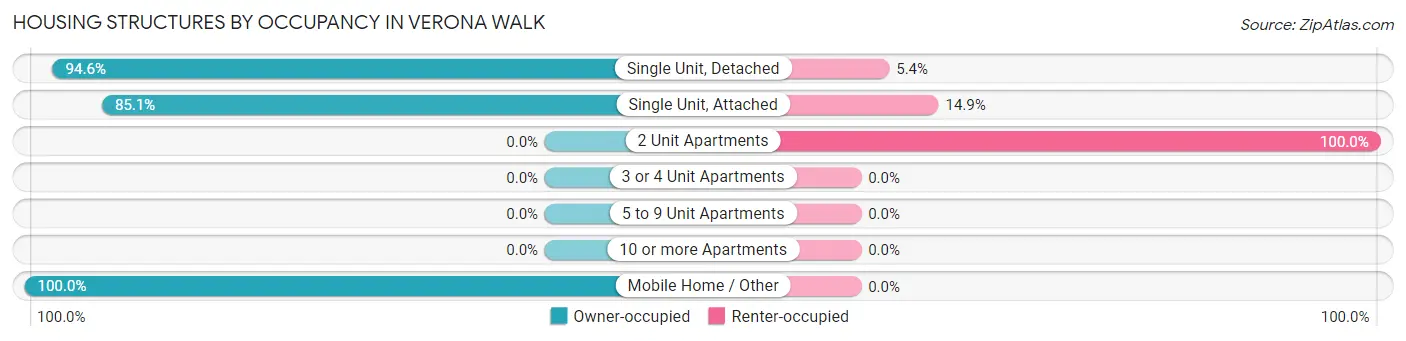
| Structure Type | Owner-occupied | Renter-occupied |
| Single Unit, Detached | 961 (94.6%) | 55 (5.4%) |
| Single Unit, Attached | 354 (85.1%) | 62 (14.9%) |
| 2 Unit Apartments | 0 (0.0%) | 47 (100.0%) |
| 3 or 4 Unit Apartments | 0 (0.0%) | 0 (0.0%) |
| 5 to 9 Unit Apartments | 0 (0.0%) | 0 (0.0%) |
| 10 or more Apartments | 0 (0.0%) | 0 (0.0%) |
| Mobile Home / Other | 12 (100.0%) | 0 (0.0%) |
| Total | 1,327 (89.0%) | 164 (11.0%) |
Housing Structures by Number of Rooms in Verona Walk
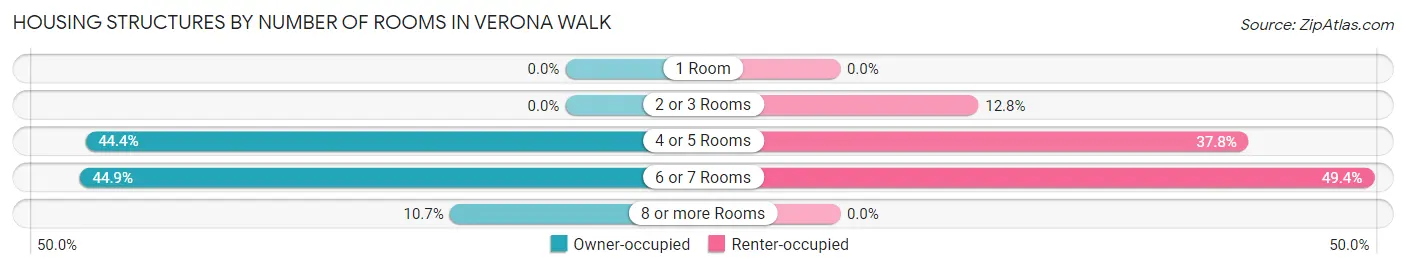
| Number of Rooms | Owner-occupied | Renter-occupied |
| 1 Room | 0 (0.0%) | 0 (0.0%) |
| 2 or 3 Rooms | 0 (0.0%) | 21 (12.8%) |
| 4 or 5 Rooms | 589 (44.4%) | 62 (37.8%) |
| 6 or 7 Rooms | 596 (44.9%) | 81 (49.4%) |
| 8 or more Rooms | 142 (10.7%) | 0 (0.0%) |
| Total | 1,327 (100.0%) | 164 (100.0%) |
Housing Structure by Heating Type in Verona Walk
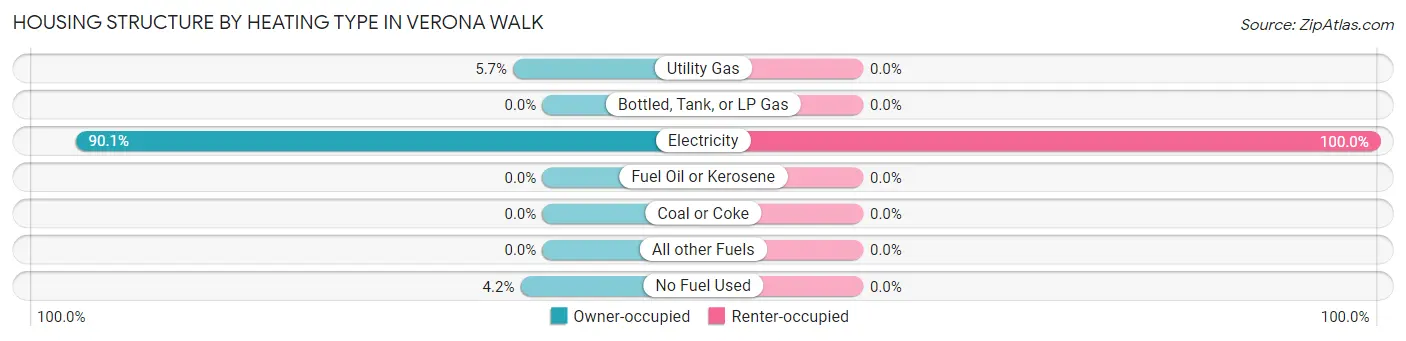
| Heating Type | Owner-occupied | Renter-occupied |
| Utility Gas | 75 (5.7%) | 0 (0.0%) |
| Bottled, Tank, or LP Gas | 0 (0.0%) | 0 (0.0%) |
| Electricity | 1,196 (90.1%) | 164 (100.0%) |
| Fuel Oil or Kerosene | 0 (0.0%) | 0 (0.0%) |
| Coal or Coke | 0 (0.0%) | 0 (0.0%) |
| All other Fuels | 0 (0.0%) | 0 (0.0%) |
| No Fuel Used | 56 (4.2%) | 0 (0.0%) |
| Total | 1,327 (100.0%) | 164 (100.0%) |
Household Vehicle Usage in Verona Walk
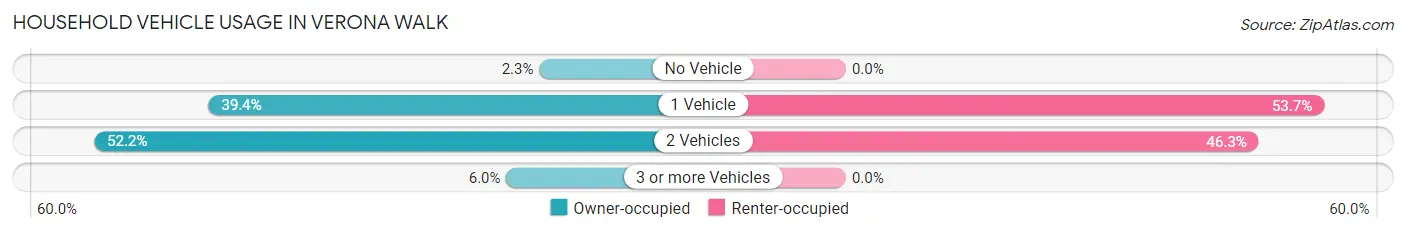
| Vehicles per Household | Owner-occupied | Renter-occupied |
| No Vehicle | 31 (2.3%) | 0 (0.0%) |
| 1 Vehicle | 523 (39.4%) | 88 (53.7%) |
| 2 Vehicles | 693 (52.2%) | 76 (46.3%) |
| 3 or more Vehicles | 80 (6.0%) | 0 (0.0%) |
| Total | 1,327 (100.0%) | 164 (100.0%) |
Real Estate & Mortgages in Verona Walk
Real Estate and Mortgage Overview in Verona Walk
| Characteristic | Without Mortgage | With Mortgage |
| Housing Units | 600 | 727 |
| Median Property Value | $483,000 | $397,000 |
| Median Household Income | $91,563 | $182 |
| Monthly Housing Costs | $864 | $96 |
| Real Estate Taxes | $4,618 | $0 |
Property Value by Mortgage Status in Verona Walk
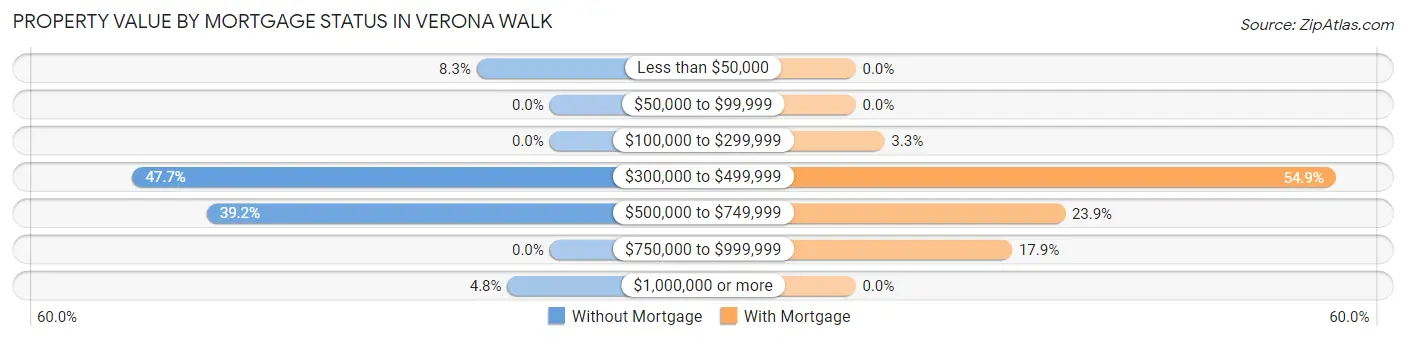
| Property Value | Without Mortgage | With Mortgage |
| Less than $50,000 | 50 (8.3%) | 0 (0.0%) |
| $50,000 to $99,999 | 0 (0.0%) | 0 (0.0%) |
| $100,000 to $299,999 | 0 (0.0%) | 24 (3.3%) |
| $300,000 to $499,999 | 286 (47.7%) | 399 (54.9%) |
| $500,000 to $749,999 | 235 (39.2%) | 174 (23.9%) |
| $750,000 to $999,999 | 0 (0.0%) | 130 (17.9%) |
| $1,000,000 or more | 29 (4.8%) | 0 (0.0%) |
| Total | 600 (100.0%) | 727 (100.0%) |
Household Income by Mortgage Status in Verona Walk
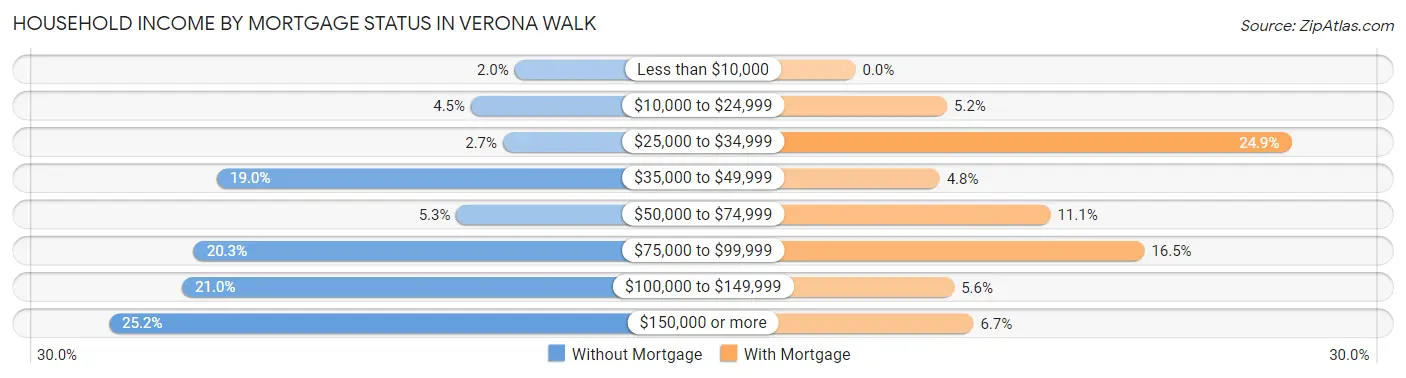
| Household Income | Without Mortgage | With Mortgage |
| Less than $10,000 | 12 (2.0%) | 0 (0.0%) |
| $10,000 to $24,999 | 27 (4.5%) | 38 (5.2%) |
| $25,000 to $34,999 | 16 (2.7%) | 181 (24.9%) |
| $35,000 to $49,999 | 114 (19.0%) | 35 (4.8%) |
| $50,000 to $74,999 | 32 (5.3%) | 81 (11.1%) |
| $75,000 to $99,999 | 122 (20.3%) | 120 (16.5%) |
| $100,000 to $149,999 | 126 (21.0%) | 41 (5.6%) |
| $150,000 or more | 151 (25.2%) | 49 (6.7%) |
| Total | 600 (100.0%) | 727 (100.0%) |
Property Value to Household Income Ratio in Verona Walk
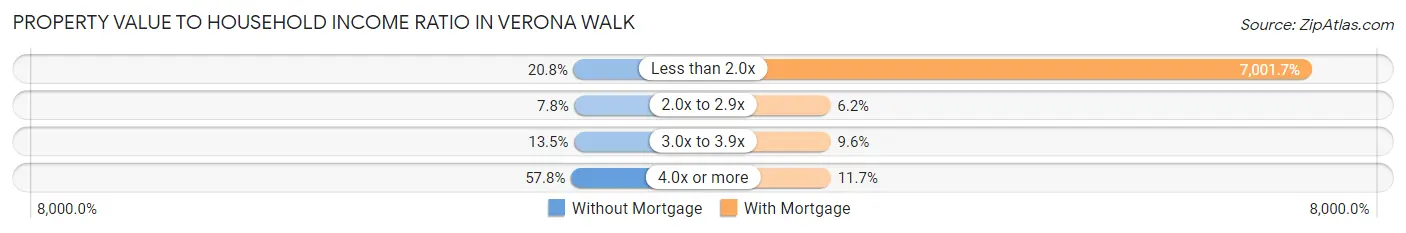
| Value-to-Income Ratio | Without Mortgage | With Mortgage |
| Less than 2.0x | 125 (20.8%) | 50,902 (7,001.6%) |
| 2.0x to 2.9x | 47 (7.8%) | 45 (6.2%) |
| 3.0x to 3.9x | 81 (13.5%) | 70 (9.6%) |
| 4.0x or more | 347 (57.8%) | 85 (11.7%) |
| Total | 600 (100.0%) | 727 (100.0%) |
Real Estate Taxes by Mortgage Status in Verona Walk
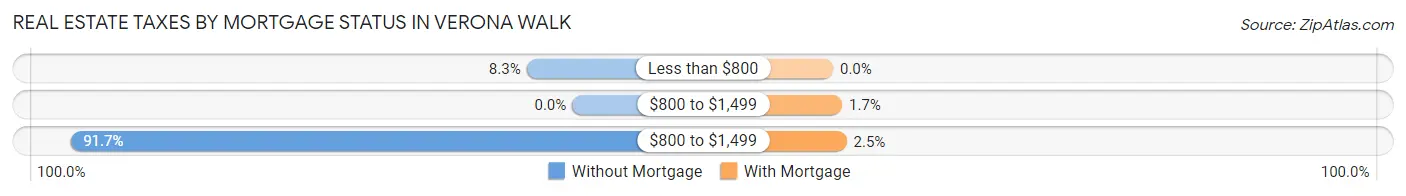
| Property Taxes | Without Mortgage | With Mortgage |
| Less than $800 | 50 (8.3%) | 0 (0.0%) |
| $800 to $1,499 | 0 (0.0%) | 12 (1.7%) |
| $800 to $1,499 | 550 (91.7%) | 18 (2.5%) |
| Total | 600 (100.0%) | 727 (100.0%) |
Health & Disability in Verona Walk
Health Insurance Coverage by Age in Verona Walk
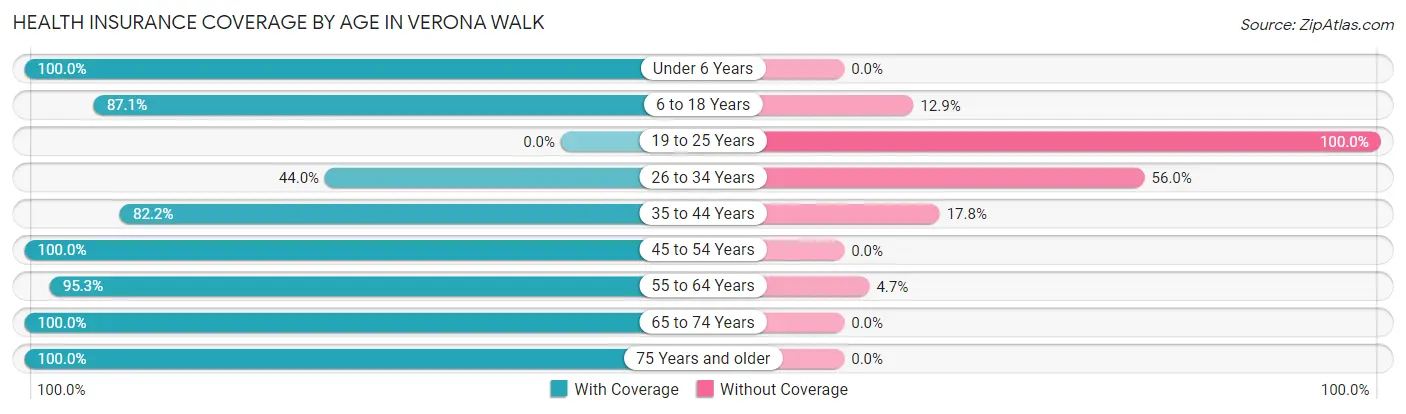
| Age Bracket | With Coverage | Without Coverage |
| Under 6 Years | 80 (100.0%) | 0 (0.0%) |
| 6 to 18 Years | 108 (87.1%) | 16 (12.9%) |
| 19 to 25 Years | 0 (0.0%) | 26 (100.0%) |
| 26 to 34 Years | 11 (44.0%) | 14 (56.0%) |
| 35 to 44 Years | 217 (82.2%) | 47 (17.8%) |
| 45 to 54 Years | 228 (100.0%) | 0 (0.0%) |
| 55 to 64 Years | 385 (95.3%) | 19 (4.7%) |
| 65 to 74 Years | 1,046 (100.0%) | 0 (0.0%) |
| 75 Years and older | 801 (100.0%) | 0 (0.0%) |
| Total | 2,876 (95.9%) | 122 (4.1%) |
Health Insurance Coverage by Citizenship Status in Verona Walk
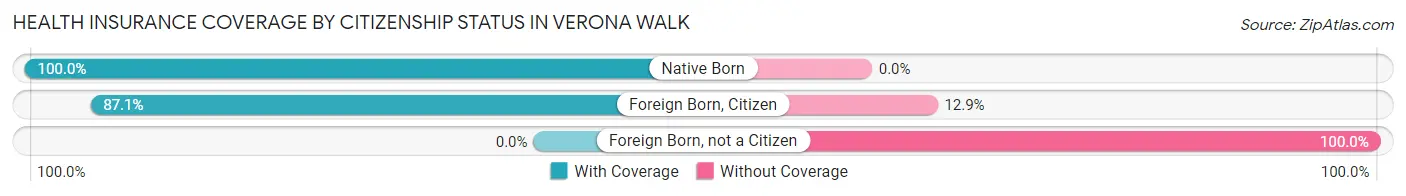
| Citizenship Status | With Coverage | Without Coverage |
| Native Born | 80 (100.0%) | 0 (0.0%) |
| Foreign Born, Citizen | 108 (87.1%) | 16 (12.9%) |
| Foreign Born, not a Citizen | 0 (0.0%) | 26 (100.0%) |
Health Insurance Coverage by Household Income in Verona Walk
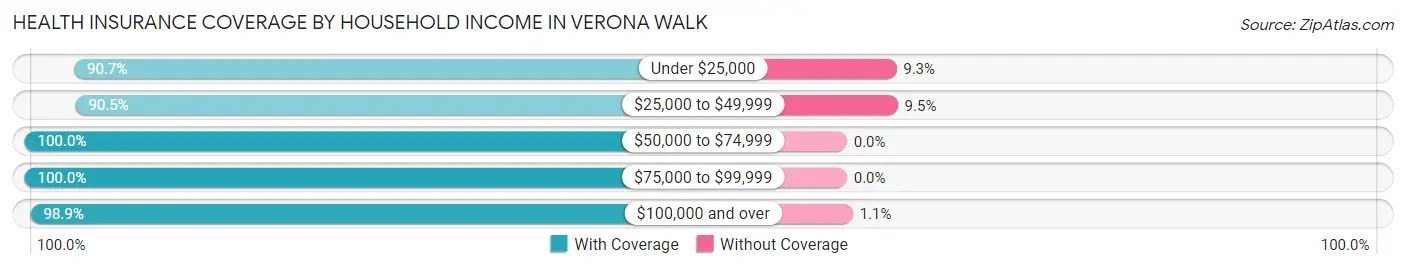
| Household Income | With Coverage | Without Coverage |
| Under $25,000 | 460 (90.7%) | 47 (9.3%) |
| $25,000 to $49,999 | 579 (90.5%) | 61 (9.5%) |
| $50,000 to $74,999 | 288 (100.0%) | 0 (0.0%) |
| $75,000 to $99,999 | 299 (100.0%) | 0 (0.0%) |
| $100,000 and over | 1,250 (98.9%) | 14 (1.1%) |
Public vs Private Health Insurance Coverage by Age in Verona Walk
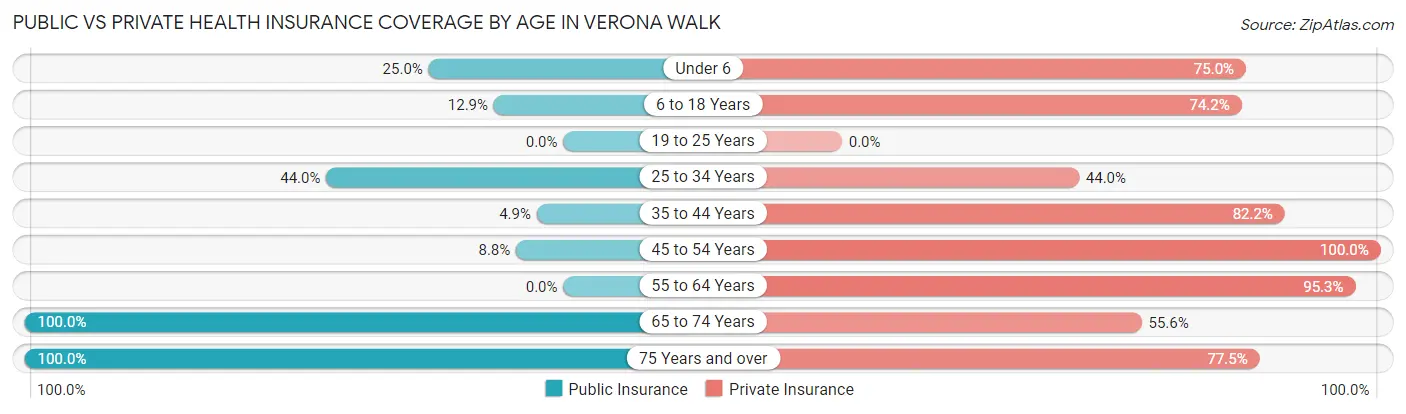
| Age Bracket | Public Insurance | Private Insurance |
| Under 6 | 20 (25.0%) | 60 (75.0%) |
| 6 to 18 Years | 16 (12.9%) | 92 (74.2%) |
| 19 to 25 Years | 0 (0.0%) | 0 (0.0%) |
| 25 to 34 Years | 11 (44.0%) | 11 (44.0%) |
| 35 to 44 Years | 13 (4.9%) | 217 (82.2%) |
| 45 to 54 Years | 20 (8.8%) | 228 (100.0%) |
| 55 to 64 Years | 0 (0.0%) | 385 (95.3%) |
| 65 to 74 Years | 1,046 (100.0%) | 582 (55.6%) |
| 75 Years and over | 801 (100.0%) | 621 (77.5%) |
| Total | 1,927 (64.3%) | 2,196 (73.3%) |
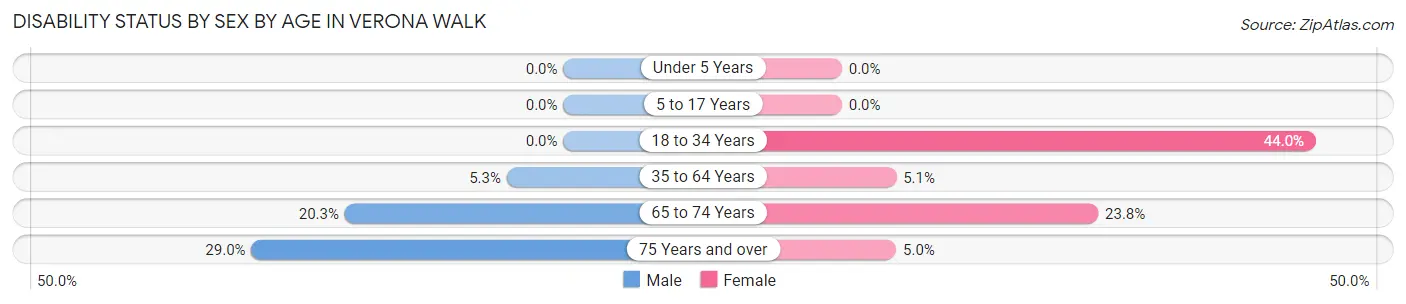
Disability Status by Sex by Age in Verona Walk
| Age Bracket | Male | Female |
| Under 5 Years | 0 (0.0%) | 0 (0.0%) |
| 5 to 17 Years | 0 (0.0%) | 0 (0.0%) |
| 18 to 34 Years | 0 (0.0%) | 11 (44.0%) |
| 35 to 64 Years | 20 (5.2%) | 26 (5.1%) |
| 65 to 74 Years | 103 (20.3%) | 128 (23.8%) |
| 75 Years and over | 163 (28.9%) | 12 (5.0%) |
Disability Class by Sex by Age in Verona Walk
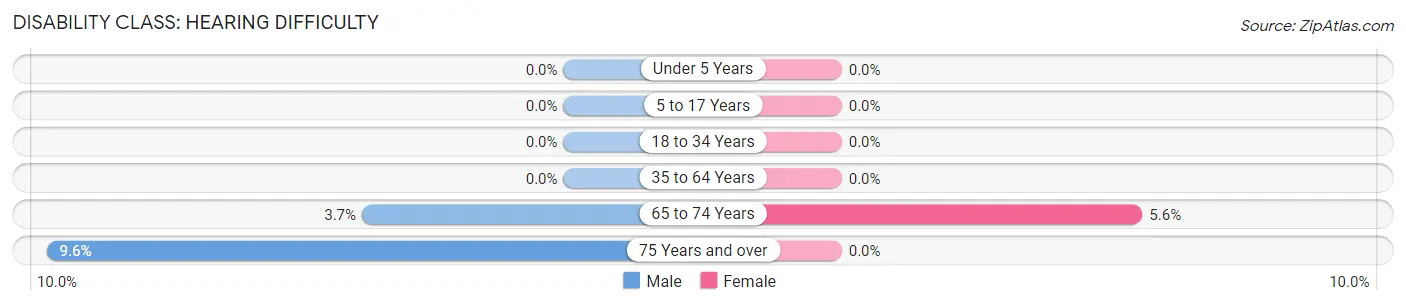
Disability Class: Hearing Difficulty
| Age Bracket | Male | Female |
| Under 5 Years | 0 (0.0%) | 0 (0.0%) |
| 5 to 17 Years | 0 (0.0%) | 0 (0.0%) |
| 18 to 34 Years | 0 (0.0%) | 0 (0.0%) |
| 35 to 64 Years | 0 (0.0%) | 0 (0.0%) |
| 65 to 74 Years | 19 (3.7%) | 30 (5.6%) |
| 75 Years and over | 54 (9.6%) | 0 (0.0%) |
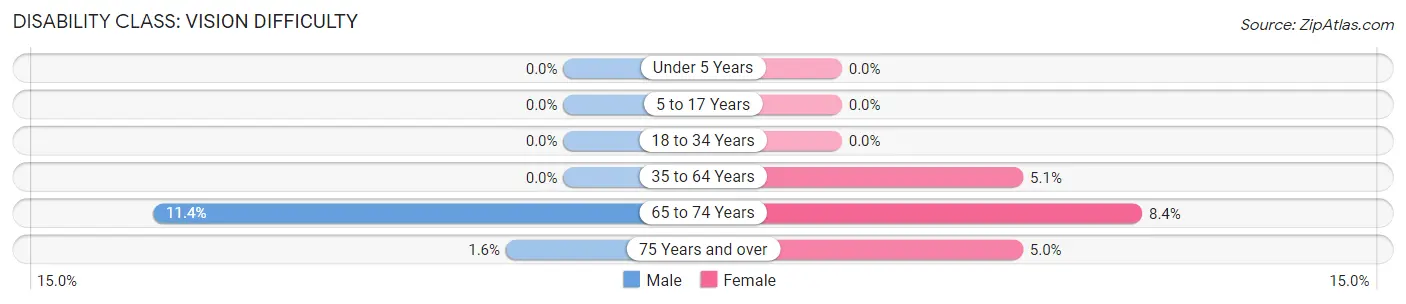
Disability Class: Vision Difficulty
| Age Bracket | Male | Female |
| Under 5 Years | 0 (0.0%) | 0 (0.0%) |
| 5 to 17 Years | 0 (0.0%) | 0 (0.0%) |
| 18 to 34 Years | 0 (0.0%) | 0 (0.0%) |
| 35 to 64 Years | 0 (0.0%) | 26 (5.1%) |
| 65 to 74 Years | 58 (11.4%) | 45 (8.4%) |
| 75 Years and over | 9 (1.6%) | 12 (5.0%) |
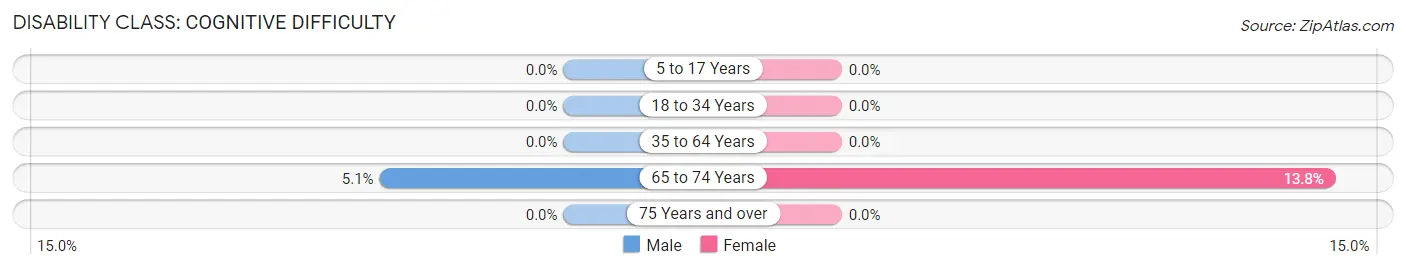
Disability Class: Cognitive Difficulty
| Age Bracket | Male | Female |
| 5 to 17 Years | 0 (0.0%) | 0 (0.0%) |
| 18 to 34 Years | 0 (0.0%) | 0 (0.0%) |
| 35 to 64 Years | 0 (0.0%) | 0 (0.0%) |
| 65 to 74 Years | 26 (5.1%) | 74 (13.8%) |
| 75 Years and over | 0 (0.0%) | 0 (0.0%) |
Disability Class: Ambulatory Difficulty
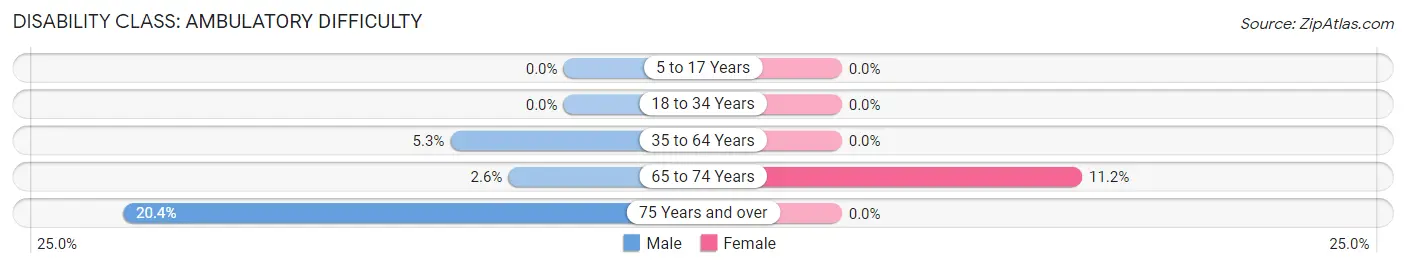
| Age Bracket | Male | Female |
| 5 to 17 Years | 0 (0.0%) | 0 (0.0%) |
| 18 to 34 Years | 0 (0.0%) | 0 (0.0%) |
| 35 to 64 Years | 20 (5.2%) | 0 (0.0%) |
| 65 to 74 Years | 13 (2.6%) | 60 (11.2%) |
| 75 Years and over | 115 (20.4%) | 0 (0.0%) |
Disability Class: Self-Care Difficulty
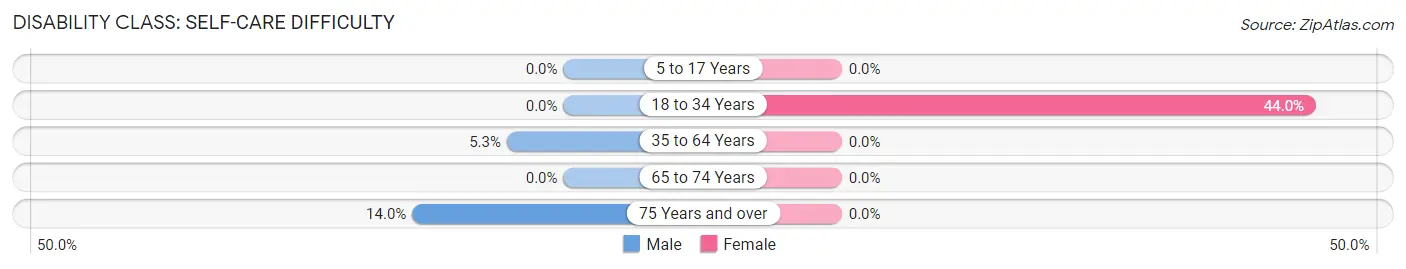
| Age Bracket | Male | Female |
| 5 to 17 Years | 0 (0.0%) | 0 (0.0%) |
| 18 to 34 Years | 0 (0.0%) | 11 (44.0%) |
| 35 to 64 Years | 20 (5.2%) | 0 (0.0%) |
| 65 to 74 Years | 0 (0.0%) | 0 (0.0%) |
| 75 Years and over | 79 (14.0%) | 0 (0.0%) |
Technology Access in Verona Walk
Computing Device Access in Verona Walk
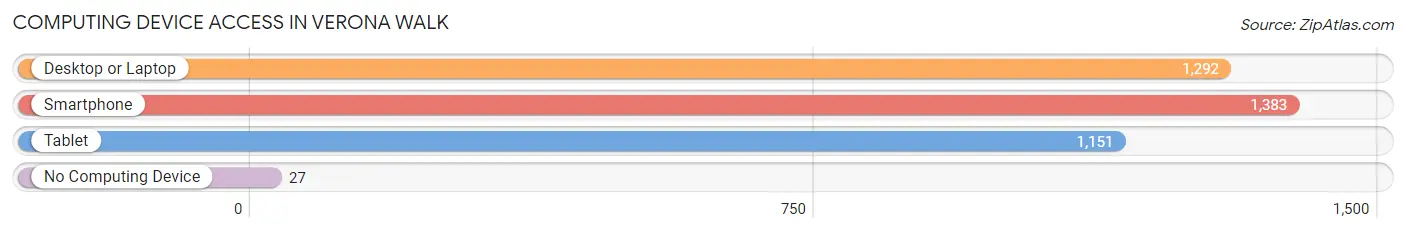
| Device Type | # Households | % Households |
| Desktop or Laptop | 1,292 | 86.7% |
| Smartphone | 1,383 | 92.8% |
| Tablet | 1,151 | 77.2% |
| No Computing Device | 27 | 1.8% |
| Total | 1,491 | 100.0% |
Internet Access in Verona Walk
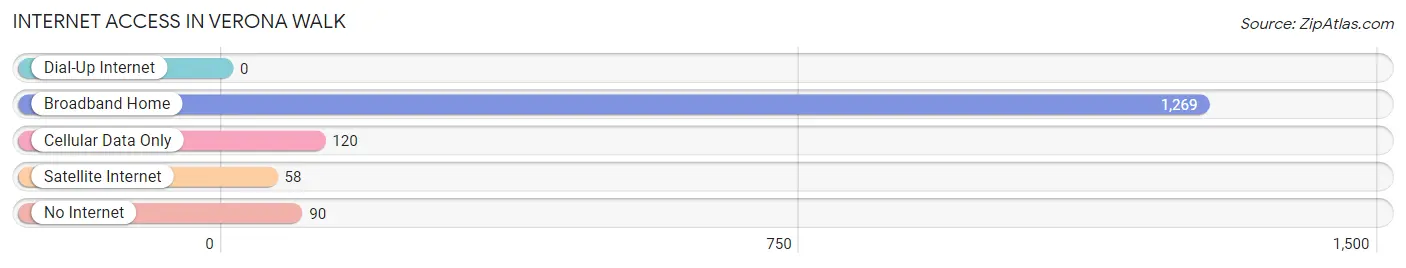
| Internet Type | # Households | % Households |
| Dial-Up Internet | 0 | 0.0% |
| Broadband Home | 1,269 | 85.1% |
| Cellular Data Only | 120 | 8.1% |
| Satellite Internet | 58 | 3.9% |
| No Internet | 90 | 6.0% |
| Total | 1,491 | 100.0% |
Verona Walk Summary
Verona Walk is a residential community located in Naples, Florida. It is situated on the west side of the city, just off of US 41 and is bordered by the Imperial River to the east. The community was developed in the late 1990s and is now home to over 2,000 residents.
History
Verona Walk was developed in the late 1990s by the WCI Communities, Inc. The community was designed to be a self-contained, master-planned community with a variety of amenities and features. The community was designed to be a safe and secure place to live, with 24-hour security and gated access. The community was also designed to be a pedestrian-friendly community, with sidewalks and trails throughout the community.
Geography
Verona Walk is located in the city of Naples, Florida. It is situated on the west side of the city, just off of US 41 and is bordered by the Imperial River to the east. The community is located in Collier County and is approximately 20 miles from the Gulf of Mexico. The community is located in a flat, low-lying area and is surrounded by a variety of natural features, including wetlands, cypress swamps, and pine flatwoods.
Economy
Verona Walk is a residential community and does not have a commercial or industrial base. The majority of the residents are employed in the nearby city of Naples, which is home to a variety of businesses and industries. The community is also home to a variety of small businesses, including restaurants, retail stores, and professional services.
Demographics
As of the 2010 census, the population of Verona Walk was 2,072. The population is primarily white (90.2%), with a small percentage of African Americans (3.2%), Hispanics (2.7%), and Asians (1.7%). The median household income is $77,945, and the median age is 54. The majority of the population is married (63.2%), and the majority of the population is homeowners (90.2%).
Verona Walk is a vibrant and diverse community that is home to a variety of people from all walks of life. The community is a safe and secure place to live, with a variety of amenities and features that make it an attractive place to live. The community is also conveniently located near the city of Naples, which provides residents with access to a variety of businesses and services.
Common Questions
What is Per Capita Income in Verona Walk?
Per Capita income in Verona Walk is $61,315.
What is the Median Family Income in Verona Walk?
Median Family Income in Verona Walk is $81,086.
What is the Median Household income in Verona Walk?
Median Household Income in Verona Walk is $73,911.
What is Inequality or Gini Index in Verona Walk?
Inequality or Gini Index in Verona Walk is 0.53.
What is the Total Population of Verona Walk?
Total Population of Verona Walk is 2,998.
What is the Total Male Population of Verona Walk?
Total Male Population of Verona Walk is 1,640.
What is the Total Female Population of Verona Walk?
Total Female Population of Verona Walk is 1,358.
What is the Ratio of Males per 100 Females in Verona Walk?
There are 120.77 Males per 100 Females in Verona Walk.
What is the Ratio of Females per 100 Males in Verona Walk?
There are 82.80 Females per 100 Males in Verona Walk.
What is the Median Population Age in Verona Walk?
Median Population Age in Verona Walk is 69.3 Years.
What is the Average Family Size in Verona Walk
Average Family Size in Verona Walk is 2.3 People.
What is the Average Household Size in Verona Walk
Average Household Size in Verona Walk is 2.0 People.
How Large is the Labor Force in Verona Walk?
There are 958 People in the Labor Forcein in Verona Walk.
What is the Percentage of People in the Labor Force in Verona Walk?
34.3% of People are in the Labor Force in Verona Walk.
What is the Unemployment Rate in Verona Walk?
Unemployment Rate in Verona Walk is 7.6%.