Autauga County, AL Map & Demographics
Autauga County Map
Autauga County Overview
$35,332
PER CAPITA INCOME
$83,790
AVG FAMILY INCOME
$68,315
AVG HOUSEHOLD INCOME
39.0%
WAGE / INCOME GAP [ % ]
61.0¢/ $1
WAGE / INCOME GAP [ $ ]
$11,230
FAMILY INCOME DEFICIT
0.45
INEQUALITY / GINI INDEX
58,761
TOTAL POPULATION
28,663
MALE POPULATION
30,098
FEMALE POPULATION
95.23
MALES / 100 FEMALES
105.01
FEMALES / 100 MALES
39.0
MEDIAN AGE
3.2
AVG FAMILY SIZE
2.6
AVG HOUSEHOLD SIZE
28,099
LABOR FORCE [ PEOPLE ]
59.6%
PERCENT IN LABOR FORCE
2.8%
UNEMPLOYMENT RATE
Autauga County Area Codes
Income in Autauga County
Income Overview in Autauga County
Per Capita Income in Autauga County is $35,332, while median incomes of families and households are $83,790 and $68,315 respectively.
| Characteristic | Number | Measure |
| Per Capita Income | 58,761 | $35,332 |
| Median Family Income | 15,363 | $83,790 |
| Mean Family Income | 15,363 | $107,038 |
| Median Household Income | 22,308 | $68,315 |
| Mean Household Income | 22,308 | $90,372 |
| Income Deficit | 15,363 | $11,230 |
| Wage / Income Gap (%) | 58,761 | 38.96% |
| Wage / Income Gap ($) | 58,761 | 61.04¢ per $1 |
| Gini / Inequality Index | 58,761 | 0.45 |
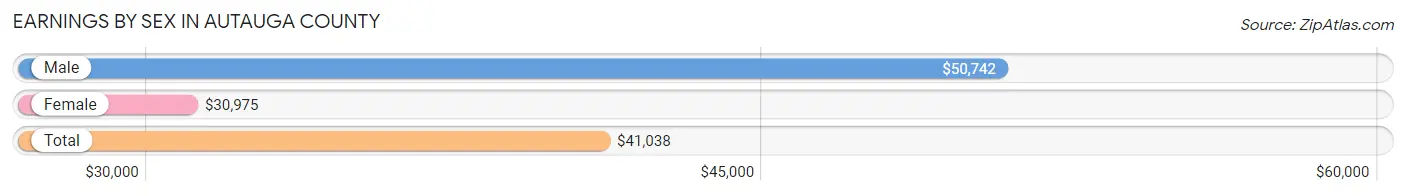
Earnings by Sex in Autauga County
Average Earnings in Autauga County are $41,038, $50,742 for men and $30,975 for women, a difference of 39.0%.
| Sex | Number | Average Earnings |
| Male | 15,470 (53.5%) | $50,742 |
| Female | 13,459 (46.5%) | $30,975 |
| Total | 28,929 (100.0%) | $41,038 |
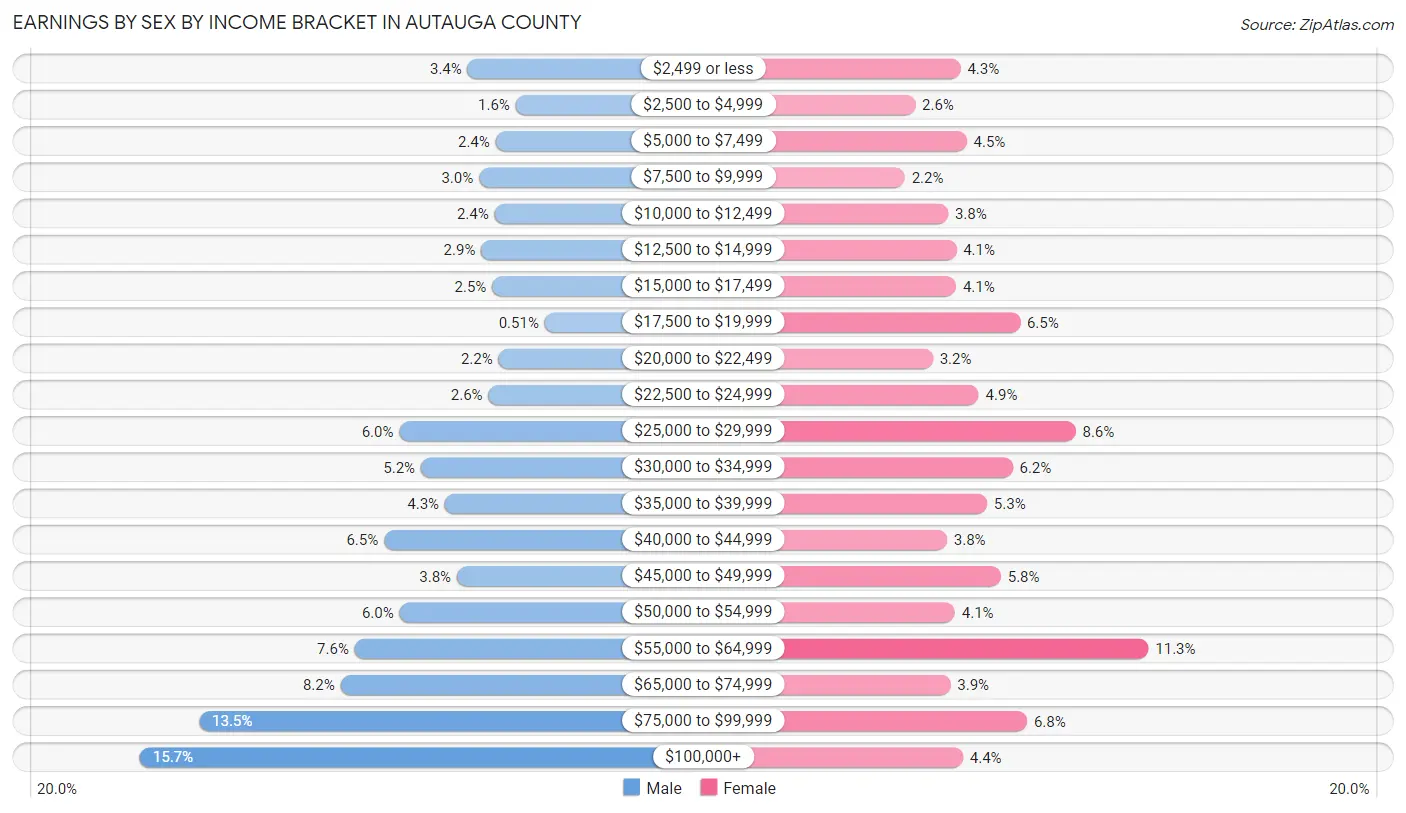
Earnings by Sex by Income Bracket in Autauga County
The most common earnings brackets in Autauga County are $100,000+ for men (2,425 | 15.7%) and $55,000 to $64,999 for women (1,521 | 11.3%).
| Income | Male | Female |
| $2,499 or less | 526 (3.4%) | 574 (4.3%) |
| $2,500 to $4,999 | 247 (1.6%) | 345 (2.6%) |
| $5,000 to $7,499 | 363 (2.4%) | 604 (4.5%) |
| $7,500 to $9,999 | 459 (3.0%) | 292 (2.2%) |
| $10,000 to $12,499 | 370 (2.4%) | 510 (3.8%) |
| $12,500 to $14,999 | 447 (2.9%) | 552 (4.1%) |
| $15,000 to $17,499 | 384 (2.5%) | 551 (4.1%) |
| $17,500 to $19,999 | 79 (0.5%) | 873 (6.5%) |
| $20,000 to $22,499 | 346 (2.2%) | 433 (3.2%) |
| $22,500 to $24,999 | 405 (2.6%) | 665 (4.9%) |
| $25,000 to $29,999 | 922 (6.0%) | 1,153 (8.6%) |
| $30,000 to $34,999 | 797 (5.1%) | 836 (6.2%) |
| $35,000 to $39,999 | 657 (4.3%) | 707 (5.2%) |
| $40,000 to $44,999 | 1,010 (6.5%) | 505 (3.7%) |
| $45,000 to $49,999 | 588 (3.8%) | 776 (5.8%) |
| $50,000 to $54,999 | 920 (5.9%) | 545 (4.1%) |
| $55,000 to $64,999 | 1,180 (7.6%) | 1,521 (11.3%) |
| $65,000 to $74,999 | 1,262 (8.2%) | 522 (3.9%) |
| $75,000 to $99,999 | 2,083 (13.5%) | 909 (6.8%) |
| $100,000+ | 2,425 (15.7%) | 586 (4.3%) |
| Total | 15,470 (100.0%) | 13,459 (100.0%) |
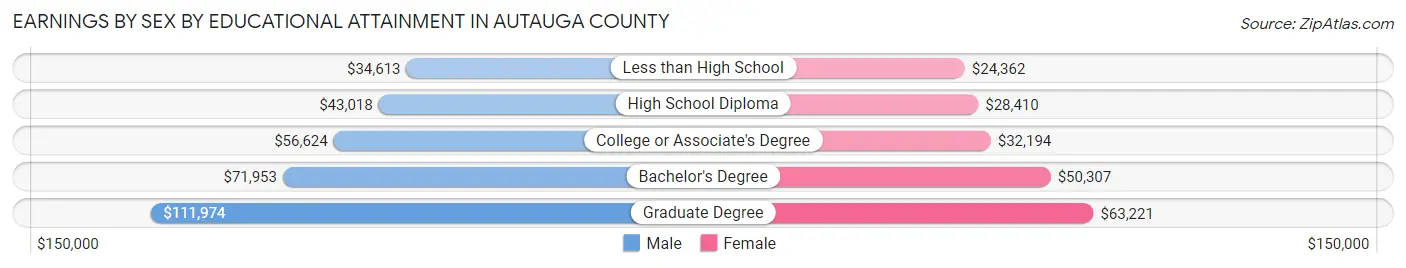
Earnings by Sex by Educational Attainment in Autauga County
Average earnings in Autauga County are $57,009 for men and $36,336 for women, a difference of 36.3%. Men with an educational attainment of graduate degree enjoy the highest average annual earnings of $111,974, while those with less than high school education earn the least with $34,613. Women with an educational attainment of graduate degree earn the most with the average annual earnings of $63,221, while those with less than high school education have the smallest earnings of $24,362.
| Educational Attainment | Male Income | Female Income |
| Less than High School | $34,613 | $24,362 |
| High School Diploma | $43,018 | $28,410 |
| College or Associate's Degree | $56,624 | $32,194 |
| Bachelor's Degree | $71,953 | $50,307 |
| Graduate Degree | $111,974 | $63,221 |
| Total | $57,009 | $36,336 |
Family Income in Autauga County
Family Income Brackets in Autauga County
According to the Autauga County family income data, there are 3,165 families falling into the $100,000 to $149,999 income range, which is the most common income bracket and makes up 20.6% of all families. Conversely, the $10,000 to $14,999 income bracket is the least frequent group with only 154 families (1.0%) belonging to this category.
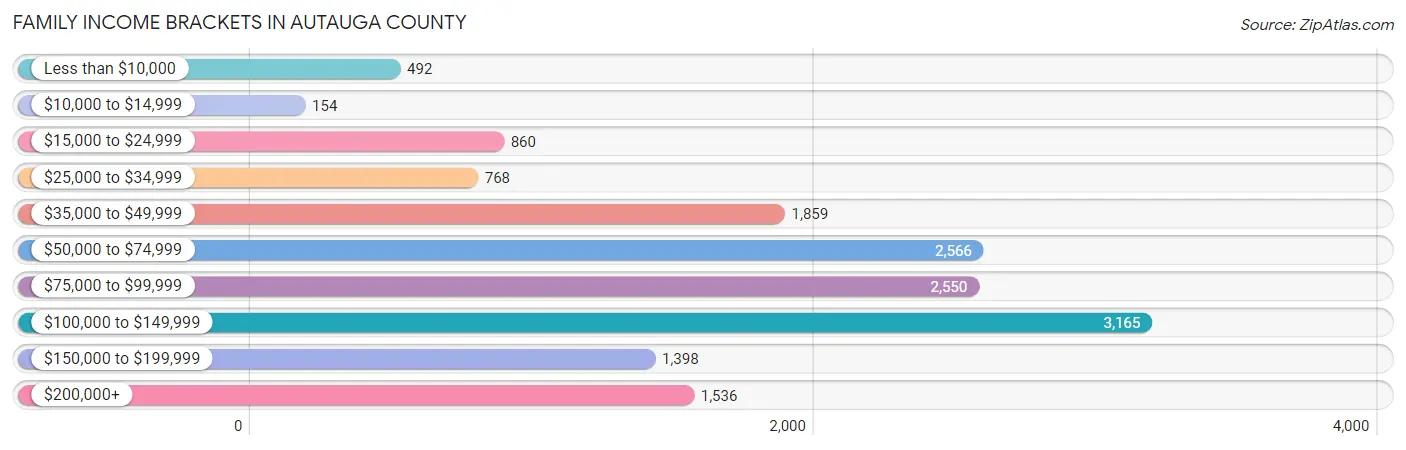
| Income Bracket | # Families | % Families |
| Less than $10,000 | 492 | 3.2% |
| $10,000 to $14,999 | 154 | 1.0% |
| $15,000 to $24,999 | 860 | 5.6% |
| $25,000 to $34,999 | 768 | 5.0% |
| $35,000 to $49,999 | 1,859 | 12.1% |
| $50,000 to $74,999 | 2,566 | 16.7% |
| $75,000 to $99,999 | 2,550 | 16.6% |
| $100,000 to $149,999 | 3,165 | 20.6% |
| $150,000 to $199,999 | 1,398 | 9.1% |
| $200,000+ | 1,536 | 10.0% |
Family Income by Famaliy Size in Autauga County
4-person families (2,801 | 18.2%) account for the highest median family income in Autauga County with $113,867 per family, while 2-person families (7,081 | 46.1%) have the highest median income of $32,744 per family member.
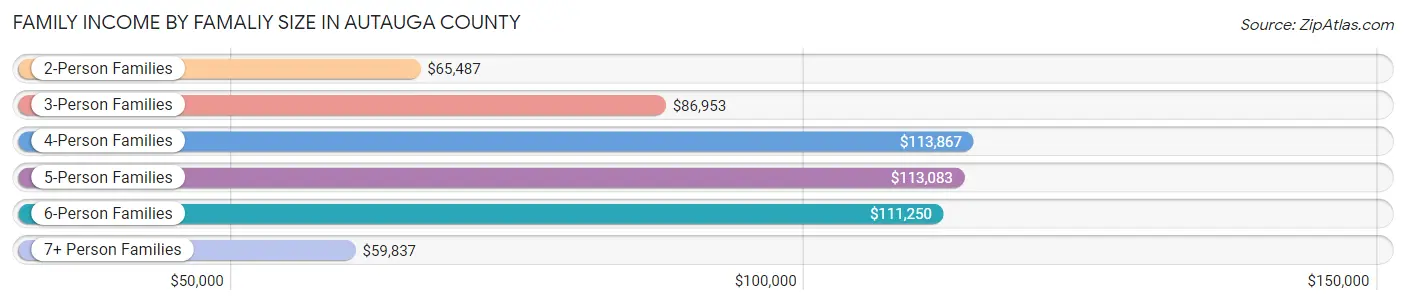
| Income Bracket | # Families | Median Income |
| 2-Person Families | 7,081 (46.1%) | $65,487 |
| 3-Person Families | 3,540 (23.0%) | $86,953 |
| 4-Person Families | 2,801 (18.2%) | $113,867 |
| 5-Person Families | 1,373 (8.9%) | $113,083 |
| 6-Person Families | 375 (2.4%) | $111,250 |
| 7+ Person Families | 193 (1.3%) | $59,837 |
| Total | 15,363 (100.0%) | $83,790 |
Family Income by Number of Earners in Autauga County
The median family income in Autauga County is $83,790, with families comprising 3+ earners (1,444) having the highest median family income of $135,781, while families with no earners (2,747) have the lowest median family income of $50,221, accounting for 9.4% and 17.9% of families, respectively.
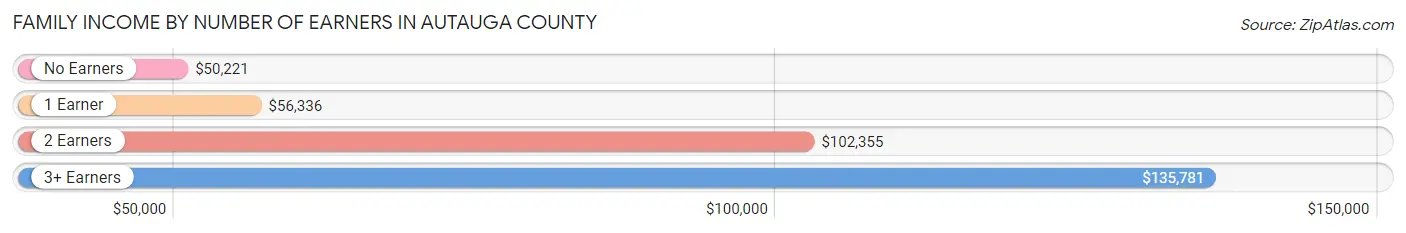
| Number of Earners | # Families | Median Income |
| No Earners | 2,747 (17.9%) | $50,221 |
| 1 Earner | 4,658 (30.3%) | $56,336 |
| 2 Earners | 6,514 (42.4%) | $102,355 |
| 3+ Earners | 1,444 (9.4%) | $135,781 |
| Total | 15,363 (100.0%) | $83,790 |
Household Income in Autauga County
Household Income Brackets in Autauga County
With 3,971 households falling in the category, the $100,000 to $149,999 income range is the most frequent in Autauga County, accounting for 17.8% of all households. In contrast, only 647 households (2.9%) fall into the $10,000 to $14,999 income bracket, making it the least populous group.
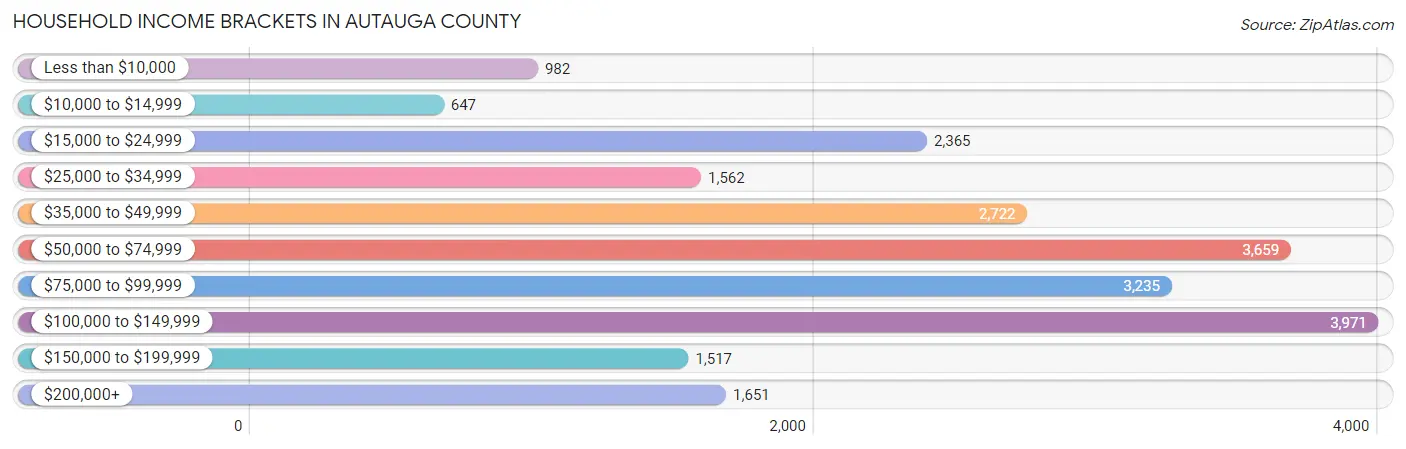
| Income Bracket | # Households | % Households |
| Less than $10,000 | 982 | 4.4% |
| $10,000 to $14,999 | 647 | 2.9% |
| $15,000 to $24,999 | 2,365 | 10.6% |
| $25,000 to $34,999 | 1,562 | 7.0% |
| $35,000 to $49,999 | 2,722 | 12.2% |
| $50,000 to $74,999 | 3,659 | 16.4% |
| $75,000 to $99,999 | 3,235 | 14.5% |
| $100,000 to $149,999 | 3,971 | 17.8% |
| $150,000 to $199,999 | 1,517 | 6.8% |
| $200,000+ | 1,651 | 7.4% |
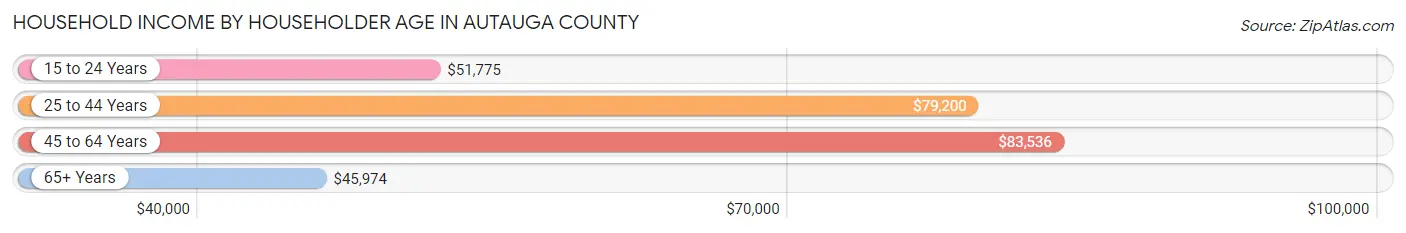
Household Income by Householder Age in Autauga County
The median household income in Autauga County is $68,315, with the highest median household income of $83,536 found in the 45 to 64 years age bracket for the primary householder. A total of 8,430 households (37.8%) fall into this category. Meanwhile, the 65+ years age bracket for the primary householder has the lowest median household income of $45,974, with 6,059 households (27.2%) in this group.
| Income Bracket | # Households | Median Income |
| 15 to 24 Years | 512 (2.3%) | $51,775 |
| 25 to 44 Years | 7,307 (32.8%) | $79,200 |
| 45 to 64 Years | 8,430 (37.8%) | $83,536 |
| 65+ Years | 6,059 (27.2%) | $45,974 |
| Total | 22,308 (100.0%) | $68,315 |
Poverty in Autauga County
Income Below Poverty by Sex and Age in Autauga County
With 10.3% poverty level for males and 12.4% for females among the residents of Autauga County, 16 and 17 year old males and 5 year old females are the most vulnerable to poverty, with 171 males (17.0%) and 58 females (23.7%) in their respective age groups living below the poverty level.
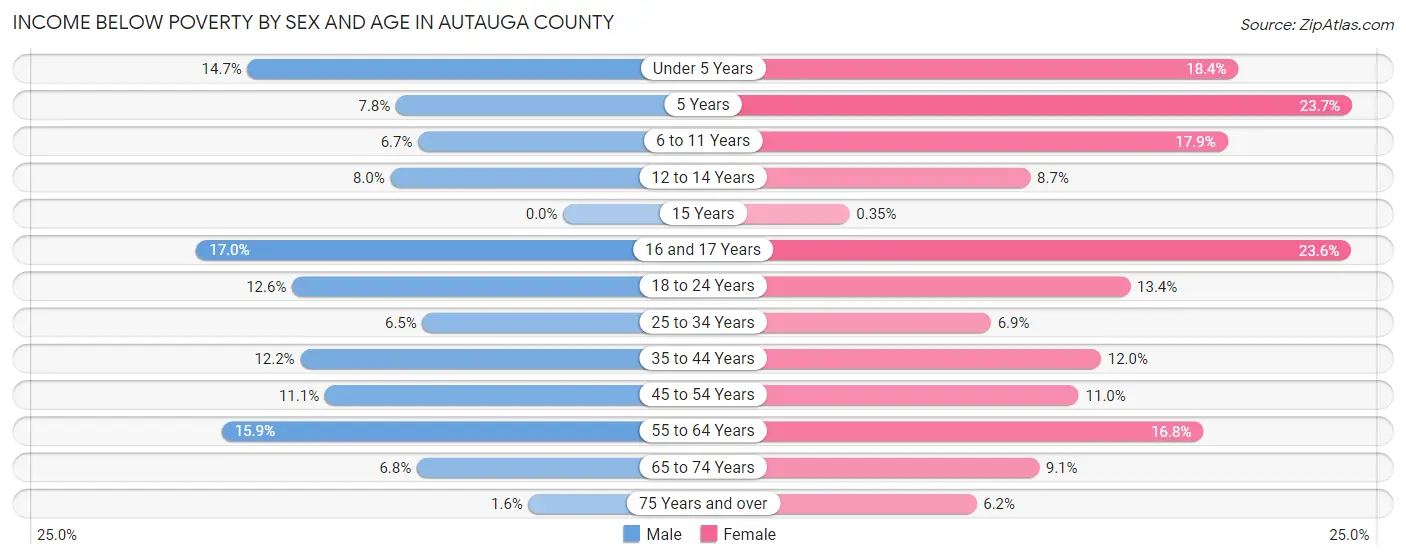
| Age Bracket | Male | Female |
| Under 5 Years | 252 (14.6%) | 293 (18.4%) |
| 5 Years | 25 (7.8%) | 58 (23.7%) |
| 6 to 11 Years | 169 (6.7%) | 427 (17.9%) |
| 12 to 14 Years | 83 (8.0%) | 101 (8.7%) |
| 15 Years | 0 (0.0%) | 1 (0.4%) |
| 16 and 17 Years | 171 (17.0%) | 271 (23.6%) |
| 18 to 24 Years | 306 (12.6%) | 317 (13.4%) |
| 25 to 34 Years | 239 (6.5%) | 254 (6.9%) |
| 35 to 44 Years | 446 (12.2%) | 507 (12.0%) |
| 45 to 54 Years | 431 (11.1%) | 430 (11.0%) |
| 55 to 64 Years | 602 (15.9%) | 656 (16.8%) |
| 65 to 74 Years | 165 (6.8%) | 260 (9.1%) |
| 75 Years and over | 25 (1.6%) | 141 (6.2%) |
| Total | 2,914 (10.3%) | 3,716 (12.4%) |
Income Above Poverty by Sex and Age in Autauga County
According to the poverty statistics in Autauga County, males aged 15 years and females aged 15 years are the age groups that are most secure financially, with 100.0% of males and 99.7% of females in these age groups living above the poverty line.
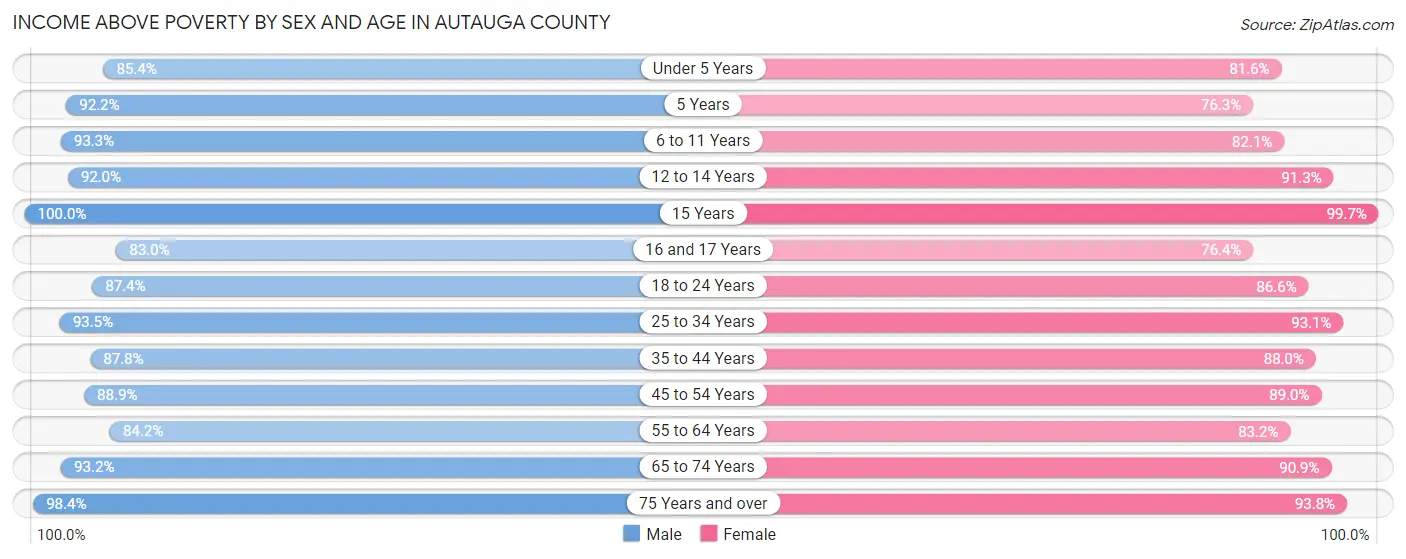
| Age Bracket | Male | Female |
| Under 5 Years | 1,468 (85.4%) | 1,299 (81.6%) |
| 5 Years | 297 (92.2%) | 187 (76.3%) |
| 6 to 11 Years | 2,341 (93.3%) | 1,958 (82.1%) |
| 12 to 14 Years | 952 (92.0%) | 1,055 (91.3%) |
| 15 Years | 268 (100.0%) | 285 (99.7%) |
| 16 and 17 Years | 833 (83.0%) | 876 (76.4%) |
| 18 to 24 Years | 2,127 (87.4%) | 2,052 (86.6%) |
| 25 to 34 Years | 3,421 (93.5%) | 3,420 (93.1%) |
| 35 to 44 Years | 3,209 (87.8%) | 3,712 (88.0%) |
| 45 to 54 Years | 3,466 (88.9%) | 3,484 (89.0%) |
| 55 to 64 Years | 3,196 (84.2%) | 3,255 (83.2%) |
| 65 to 74 Years | 2,266 (93.2%) | 2,586 (90.9%) |
| 75 Years and over | 1,529 (98.4%) | 2,119 (93.8%) |
| Total | 25,373 (89.7%) | 26,288 (87.6%) |
Income Below Poverty Among Married-Couple Families in Autauga County
The poverty statistics for married-couple families in Autauga County show that 5.9% or 707 of the total 11,889 families live below the poverty line. Families with 5 or more children have the highest poverty rate of 19.5%, comprising of 22 families. On the other hand, families with 1 or 2 children have the lowest poverty rate of 3.8%, which includes 152 families.
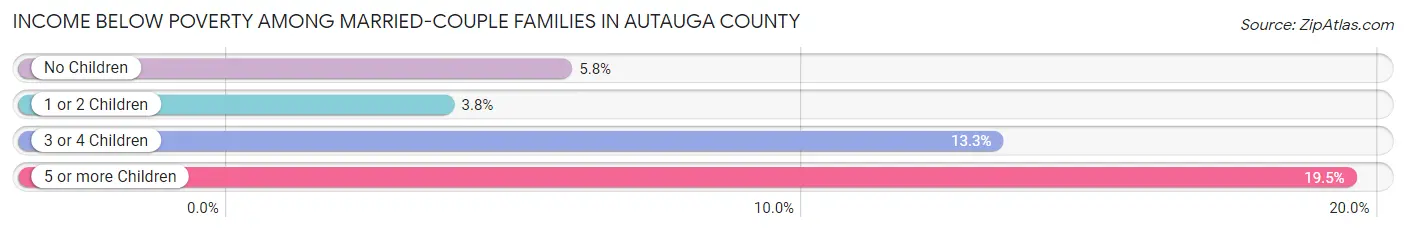
| Children | Above Poverty | Below Poverty |
| No Children | 6,251 (94.2%) | 386 (5.8%) |
| 1 or 2 Children | 3,883 (96.2%) | 152 (3.8%) |
| 3 or 4 Children | 957 (86.7%) | 147 (13.3%) |
| 5 or more Children | 91 (80.5%) | 22 (19.5%) |
| Total | 11,182 (94.1%) | 707 (5.9%) |
Income Below Poverty Among Single-Parent Households in Autauga County
According to the poverty data in Autauga County, 8.3% or 62 single-father households and 18.7% or 509 single-mother households are living below the poverty line. Among single-father households, those with 1 or 2 children have the highest poverty rate, with 50 households (13.1%) experiencing poverty. Likewise, among single-mother households, those with 3 or 4 children have the highest poverty rate, with 115 households (85.2%) falling below the poverty line.
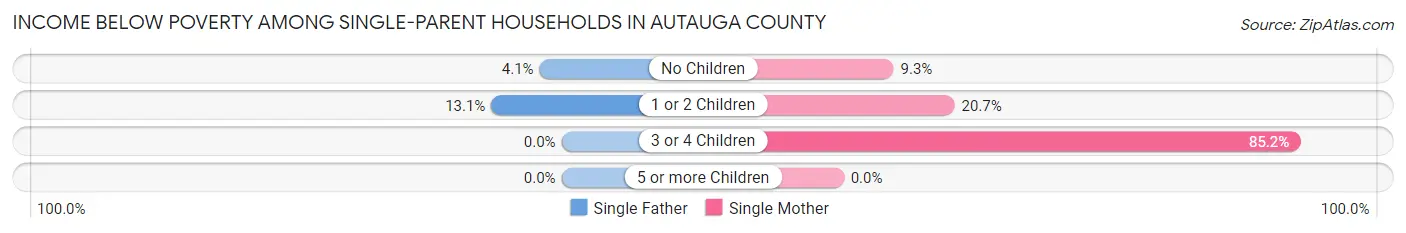
| Children | Single Father | Single Mother |
| No Children | 12 (4.1%) | 116 (9.3%) |
| 1 or 2 Children | 50 (13.1%) | 278 (20.6%) |
| 3 or 4 Children | 0 (0.0%) | 115 (85.2%) |
| 5 or more Children | 0 (0.0%) | 0 (0.0%) |
| Total | 62 (8.3%) | 509 (18.7%) |
Income Below Poverty Among Married-Couple vs Single-Parent Households in Autauga County
The poverty data for Autauga County shows that 707 of the married-couple family households (5.9%) and 571 of the single-parent households (16.4%) are living below the poverty level. Within the married-couple family households, those with 5 or more children have the highest poverty rate, with 22 households (19.5%) falling below the poverty line. Among the single-parent households, those with 3 or 4 children have the highest poverty rate, with 115 household (55.6%) living below poverty.
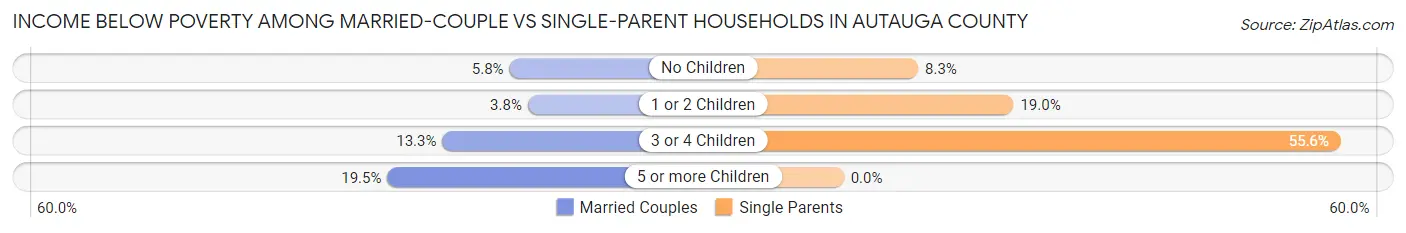
| Children | Married-Couple Families | Single-Parent Households |
| No Children | 386 (5.8%) | 128 (8.3%) |
| 1 or 2 Children | 152 (3.8%) | 328 (19.0%) |
| 3 or 4 Children | 147 (13.3%) | 115 (55.6%) |
| 5 or more Children | 22 (19.5%) | 0 (0.0%) |
| Total | 707 (5.9%) | 571 (16.4%) |
Race in Autauga County
The most populous races in Autauga County are White / Caucasian (43,747 | 74.5%), Black / African American (11,496 | 19.6%), and Two or more Races (2,480 | 4.2%).
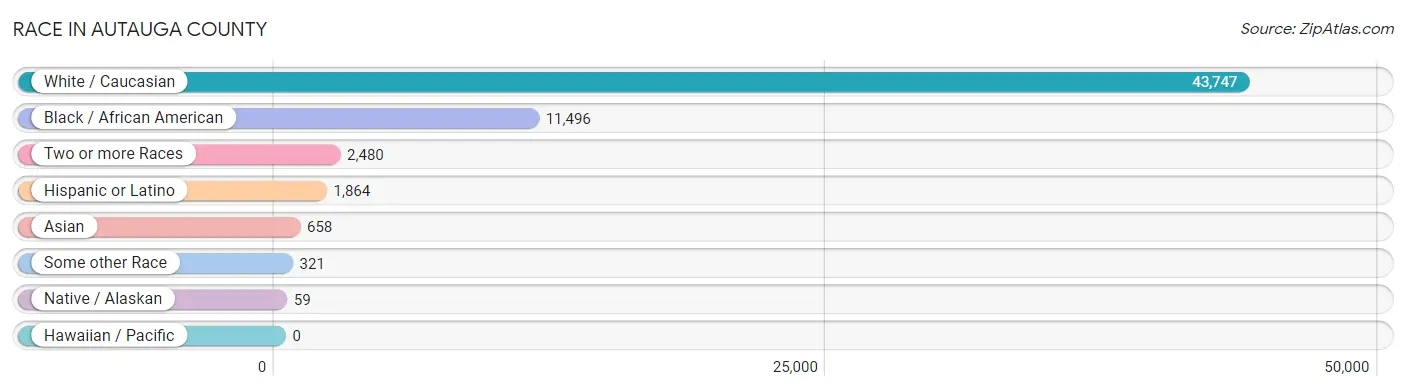
| Race | # Population | % Population |
| Asian | 658 | 1.1% |
| Black / African American | 11,496 | 19.6% |
| Hawaiian / Pacific | 0 | 0.0% |
| Hispanic or Latino | 1,864 | 3.2% |
| Native / Alaskan | 59 | 0.1% |
| White / Caucasian | 43,747 | 74.5% |
| Two or more Races | 2,480 | 4.2% |
| Some other Race | 321 | 0.5% |
| Total | 58,761 | 100.0% |
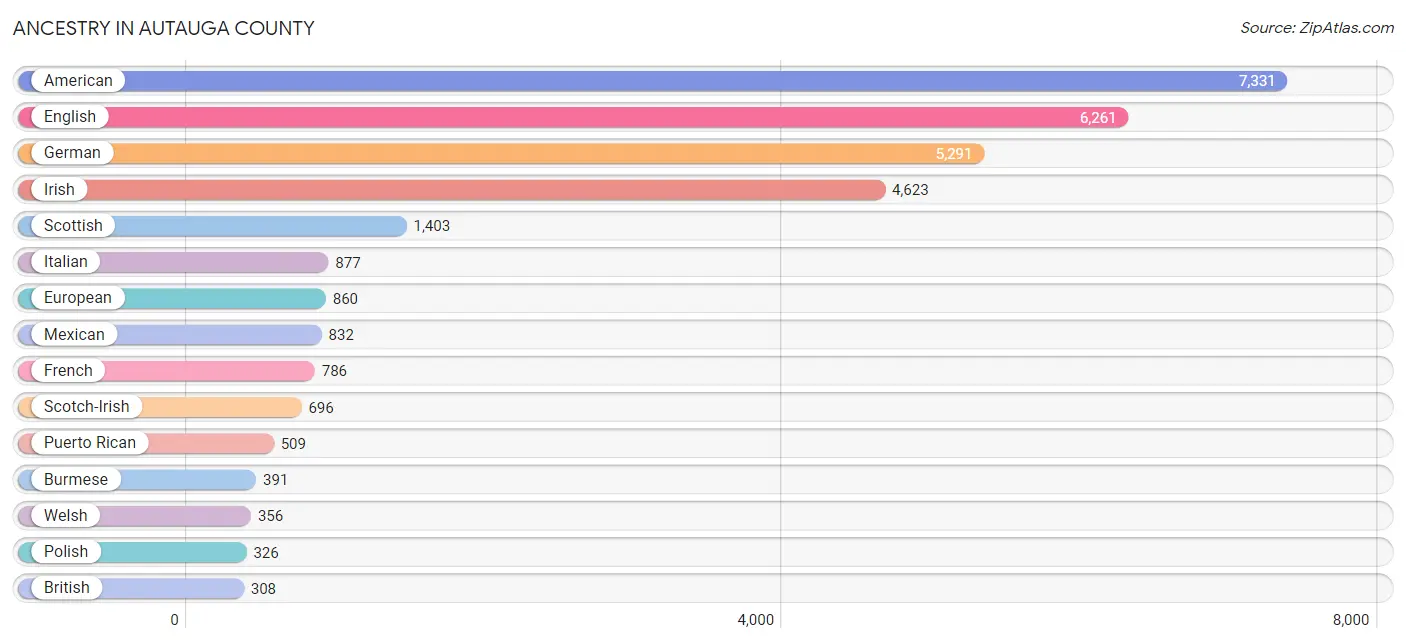
Ancestry in Autauga County
The most populous ancestries reported in Autauga County are American (7,331 | 12.5%), English (6,261 | 10.7%), German (5,291 | 9.0%), Irish (4,623 | 7.9%), and Scottish (1,403 | 2.4%), together accounting for 42.4% of all Autauga County residents.
| Ancestry | # Population | % Population |
| African | 58 | 0.1% |
| American | 7,331 | 12.5% |
| Armenian | 15 | 0.0% |
| Australian | 21 | 0.0% |
| Austrian | 7 | 0.0% |
| Bhutanese | 259 | 0.4% |
| Blackfeet | 31 | 0.1% |
| British | 308 | 0.5% |
| Burmese | 391 | 0.7% |
| Cajun | 11 | 0.0% |
| Central American | 191 | 0.3% |
| Cherokee | 282 | 0.5% |
| Chickasaw | 45 | 0.1% |
| Creek | 14 | 0.0% |
| Croatian | 166 | 0.3% |
| Cuban | 168 | 0.3% |
| Czech | 110 | 0.2% |
| Czechoslovakian | 8 | 0.0% |
| Danish | 281 | 0.5% |
| Dominican | 19 | 0.0% |
| Dutch | 265 | 0.4% |
| Eastern European | 63 | 0.1% |
| English | 6,261 | 10.7% |
| European | 860 | 1.5% |
| French | 786 | 1.3% |
| French Canadian | 70 | 0.1% |
| German | 5,291 | 9.0% |
| Greek | 66 | 0.1% |
| Honduran | 138 | 0.2% |
| Hungarian | 75 | 0.1% |
| Icelander | 11 | 0.0% |
| Indian (Asian) | 143 | 0.2% |
| Iranian | 27 | 0.1% |
| Irish | 4,623 | 7.9% |
| Italian | 877 | 1.5% |
| Jamaican | 7 | 0.0% |
| Korean | 240 | 0.4% |
| Lithuanian | 89 | 0.2% |
| Maltese | 1 | 0.0% |
| Mexican | 832 | 1.4% |
| Northern European | 16 | 0.0% |
| Norwegian | 175 | 0.3% |
| Pakistani | 11 | 0.0% |
| Panamanian | 53 | 0.1% |
| Polish | 326 | 0.5% |
| Portuguese | 64 | 0.1% |
| Puerto Rican | 509 | 0.9% |
| Romanian | 28 | 0.1% |
| Russian | 115 | 0.2% |
| Scandinavian | 301 | 0.5% |
| Scotch-Irish | 696 | 1.2% |
| Scottish | 1,403 | 2.4% |
| Sioux | 21 | 0.0% |
| Slavic | 9 | 0.0% |
| Slovak | 24 | 0.0% |
| Spaniard | 73 | 0.1% |
| Spanish | 63 | 0.1% |
| Subsaharan African | 58 | 0.1% |
| Swedish | 245 | 0.4% |
| Swiss | 20 | 0.0% |
| Thai | 87 | 0.2% |
| Ukrainian | 25 | 0.0% |
| Welsh | 356 | 0.6% |
| West Indian | 19 | 0.0% | View All 64 Rows |
Immigrants in Autauga County
The most numerous immigrant groups reported in Autauga County came from Asia (473 | 0.8%), Europe (466 | 0.8%), Latin America (428 | 0.7%), Central America (399 | 0.7%), and Eastern Europe (324 | 0.5%), together accounting for 3.6% of all Autauga County residents.
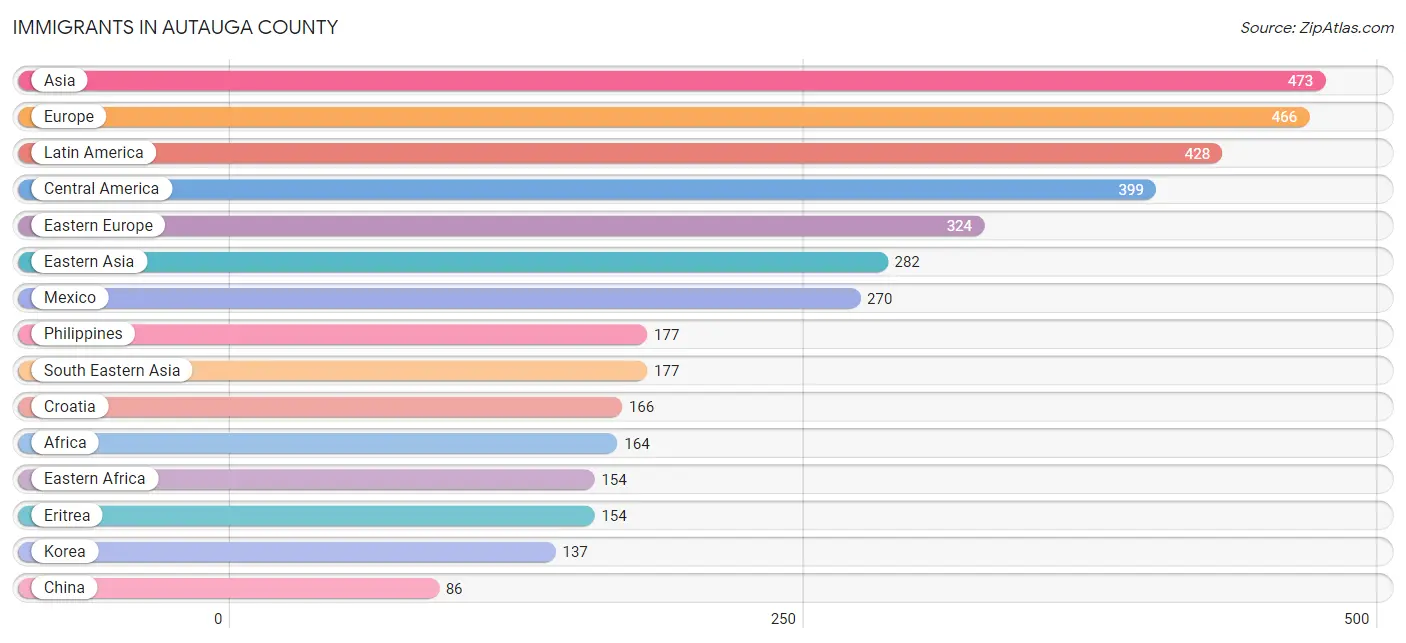
| Immigration Origin | # Population | % Population |
| Africa | 164 | 0.3% |
| Asia | 473 | 0.8% |
| Australia | 21 | 0.0% |
| Brazil | 8 | 0.0% |
| Caribbean | 21 | 0.0% |
| Central America | 399 | 0.7% |
| China | 86 | 0.2% |
| Croatia | 166 | 0.3% |
| Dominican Republic | 14 | 0.0% |
| Eastern Africa | 154 | 0.3% |
| Eastern Asia | 282 | 0.5% |
| Eastern Europe | 324 | 0.5% |
| England | 19 | 0.0% |
| Eritrea | 154 | 0.3% |
| Europe | 466 | 0.8% |
| France | 15 | 0.0% |
| Germany | 41 | 0.1% |
| Honduras | 76 | 0.1% |
| India | 14 | 0.0% |
| Jamaica | 7 | 0.0% |
| Japan | 59 | 0.1% |
| Korea | 137 | 0.2% |
| Latin America | 428 | 0.7% |
| Lithuania | 44 | 0.1% |
| Mexico | 270 | 0.5% |
| Netherlands | 11 | 0.0% |
| Northern Europe | 52 | 0.1% |
| Oceania | 21 | 0.0% |
| Panama | 53 | 0.1% |
| Philippines | 177 | 0.3% |
| Russia | 24 | 0.0% |
| South Africa | 10 | 0.0% |
| South America | 8 | 0.0% |
| South Central Asia | 14 | 0.0% |
| South Eastern Asia | 177 | 0.3% |
| Southern Europe | 23 | 0.0% |
| Spain | 23 | 0.0% |
| Ukraine | 66 | 0.1% |
| Western Europe | 67 | 0.1% | View All 39 Rows |
Sex and Age in Autauga County
Sex and Age in Autauga County
The most populous age groups in Autauga County are 35 to 39 Years (2,211 | 7.7%) for men and 40 to 44 Years (2,406 | 8.0%) for women.
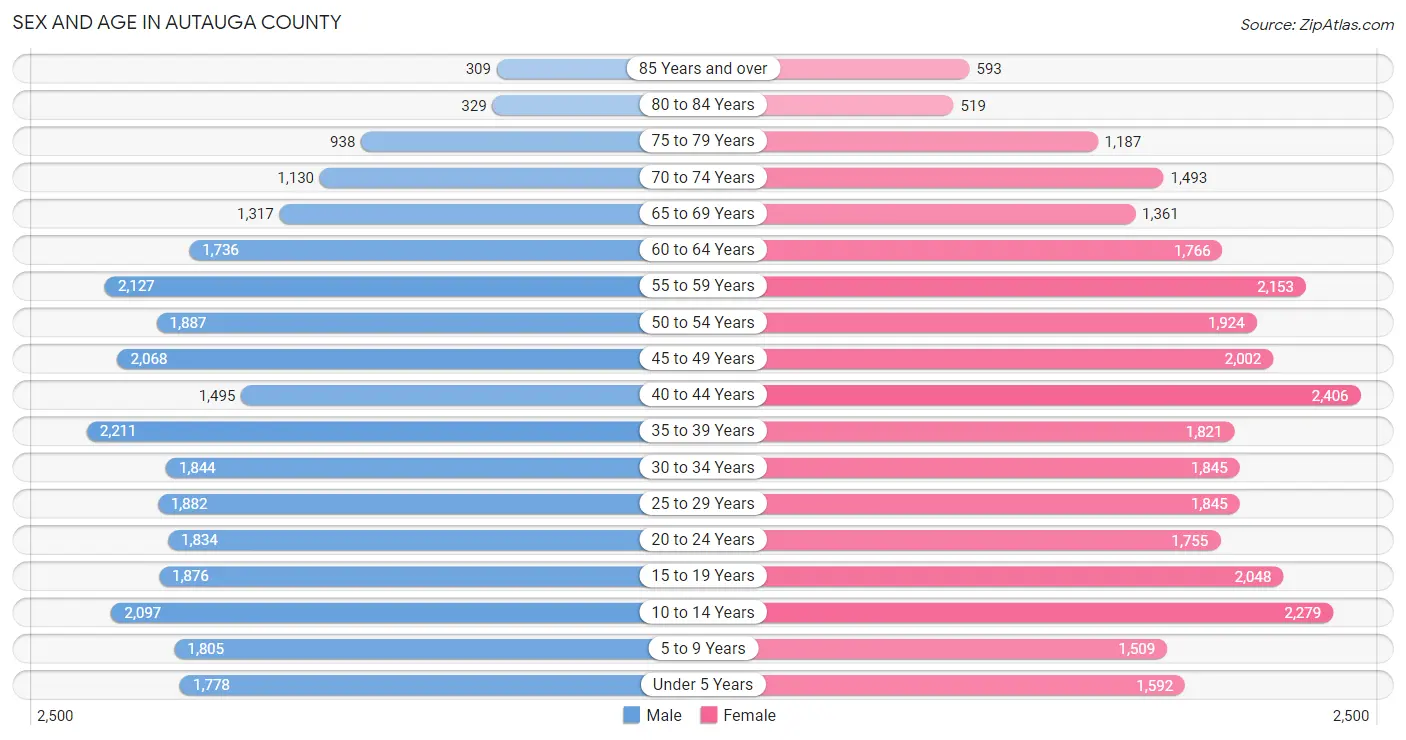
| Age Bracket | Male | Female |
| Under 5 Years | 1,778 (6.2%) | 1,592 (5.3%) |
| 5 to 9 Years | 1,805 (6.3%) | 1,509 (5.0%) |
| 10 to 14 Years | 2,097 (7.3%) | 2,279 (7.6%) |
| 15 to 19 Years | 1,876 (6.6%) | 2,048 (6.8%) |
| 20 to 24 Years | 1,834 (6.4%) | 1,755 (5.8%) |
| 25 to 29 Years | 1,882 (6.6%) | 1,845 (6.1%) |
| 30 to 34 Years | 1,844 (6.4%) | 1,845 (6.1%) |
| 35 to 39 Years | 2,211 (7.7%) | 1,821 (6.0%) |
| 40 to 44 Years | 1,495 (5.2%) | 2,406 (8.0%) |
| 45 to 49 Years | 2,068 (7.2%) | 2,002 (6.7%) |
| 50 to 54 Years | 1,887 (6.6%) | 1,924 (6.4%) |
| 55 to 59 Years | 2,127 (7.4%) | 2,153 (7.1%) |
| 60 to 64 Years | 1,736 (6.1%) | 1,766 (5.9%) |
| 65 to 69 Years | 1,317 (4.6%) | 1,361 (4.5%) |
| 70 to 74 Years | 1,130 (3.9%) | 1,493 (5.0%) |
| 75 to 79 Years | 938 (3.3%) | 1,187 (3.9%) |
| 80 to 84 Years | 329 (1.1%) | 519 (1.7%) |
| 85 Years and over | 309 (1.1%) | 593 (2.0%) |
| Total | 28,663 (100.0%) | 30,098 (100.0%) |
Families and Households in Autauga County
Median Family Size in Autauga County
The median family size in Autauga County is 3.19 persons per family, with single female/mother families (2,728 | 17.8%) accounting for the largest median family size of 3.24 persons per family. On the other hand, single male/father families (746 | 4.9%) represent the smallest median family size with 3.11 persons per family.
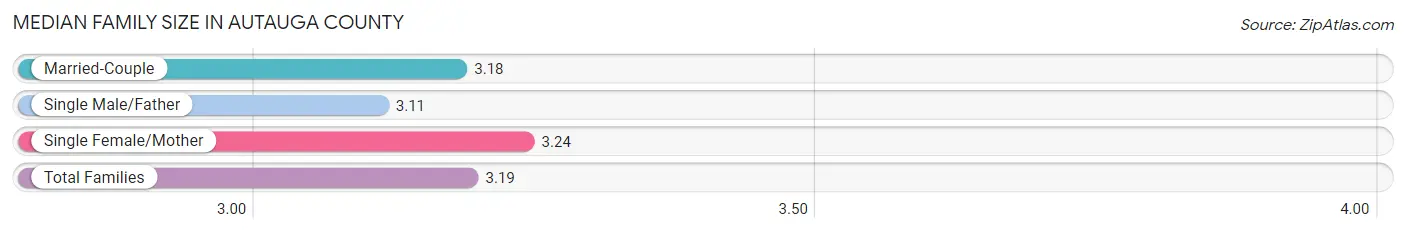
| Family Type | # Families | Family Size |
| Married-Couple | 11,889 (77.4%) | 3.18 |
| Single Male/Father | 746 (4.9%) | 3.11 |
| Single Female/Mother | 2,728 (17.8%) | 3.24 |
| Total Families | 15,363 (100.0%) | 3.19 |
Median Household Size in Autauga County
The median household size in Autauga County is 2.61 persons per household, with single female/mother households (2,728 | 12.2%) accounting for the largest median household size of 3.48 persons per household. non-family households (6,945 | 31.1%) represent the smallest median household size with 1.19 persons per household.
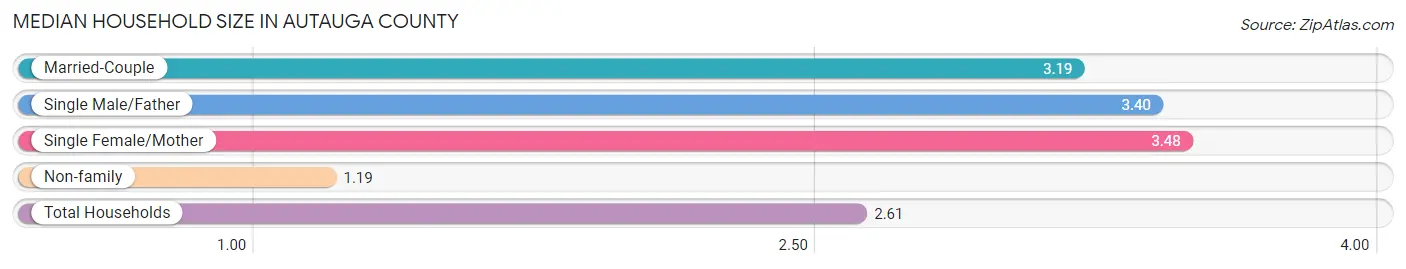
| Household Type | # Households | Household Size |
| Married-Couple | 11,889 (53.3%) | 3.19 |
| Single Male/Father | 746 (3.3%) | 3.40 |
| Single Female/Mother | 2,728 (12.2%) | 3.48 |
| Non-family | 6,945 (31.1%) | 1.19 |
| Total Households | 22,308 (100.0%) | 2.61 |
Household Size by Marriage Status in Autauga County
Out of a total of 22,308 households in Autauga County, 15,363 (68.9%) are family households, while 6,945 (31.1%) are nonfamily households. The most numerous type of family households are 2-person households, comprising 6,772, and the most common type of nonfamily households are 1-person households, comprising 6,069.
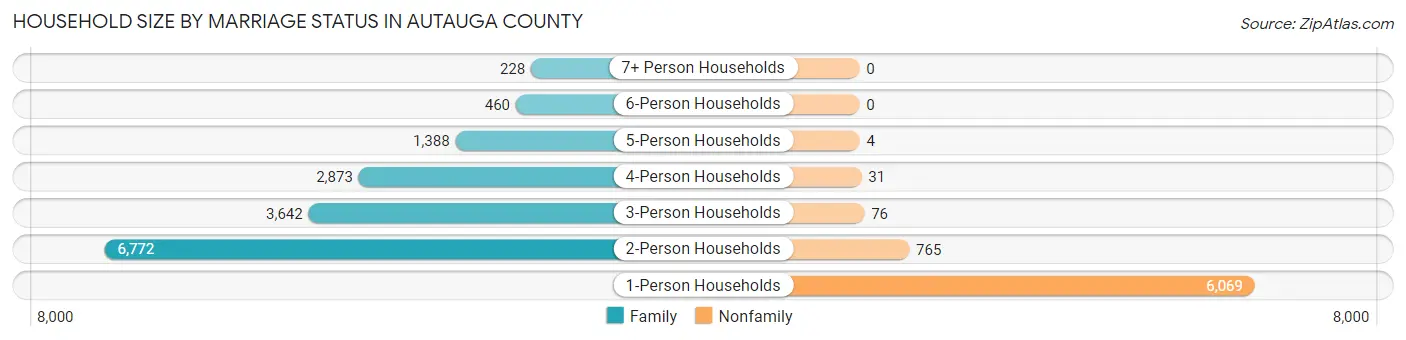
| Household Size | Family Households | Nonfamily Households |
| 1-Person Households | - | 6,069 (27.2%) |
| 2-Person Households | 6,772 (30.4%) | 765 (3.4%) |
| 3-Person Households | 3,642 (16.3%) | 76 (0.3%) |
| 4-Person Households | 2,873 (12.9%) | 31 (0.1%) |
| 5-Person Households | 1,388 (6.2%) | 4 (0.0%) |
| 6-Person Households | 460 (2.1%) | 0 (0.0%) |
| 7+ Person Households | 228 (1.0%) | 0 (0.0%) |
| Total | 15,363 (68.9%) | 6,945 (31.1%) |
Female Fertility in Autauga County
Fertility by Age in Autauga County
Average fertility rate in Autauga County is 55.0 births per 1,000 women. Women in the age bracket of 20 to 34 years have the highest fertility rate with 101.0 births per 1,000 women. Women in the age bracket of 20 to 34 years acount for 70.1% of all women with births.
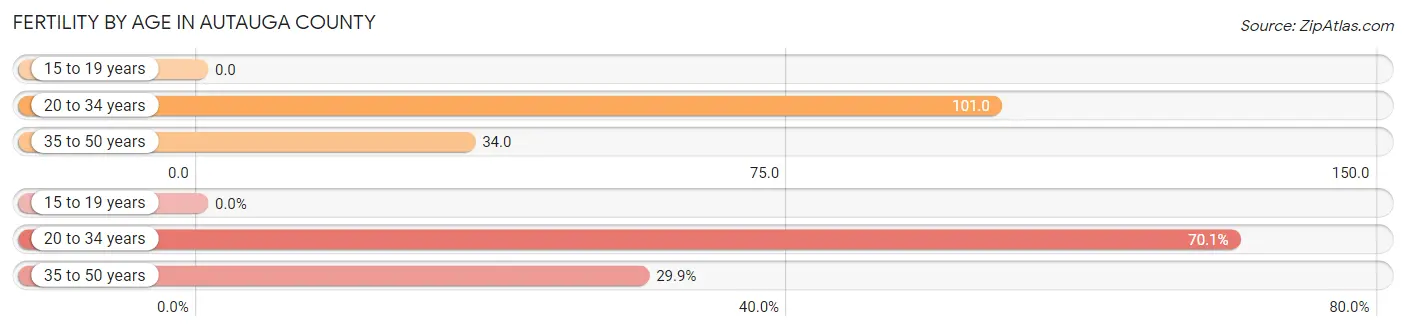
| Age Bracket | Women with Births | Births / 1,000 Women |
| 15 to 19 years | 0 (0.0%) | 0.0 |
| 20 to 34 years | 550 (70.1%) | 101.0 |
| 35 to 50 years | 235 (29.9%) | 34.0 |
| Total | 785 (100.0%) | 55.0 |
Fertility by Age by Marriage Status in Autauga County
79.4% of women with births (785) in Autauga County are married. The highest percentage of unmarried women with births falls into 35 to 50 years age bracket with 24.3% of them unmarried at the time of birth, while the lowest percentage of unmarried women with births belong to 20 to 34 years age bracket with 19.1% of them unmarried.
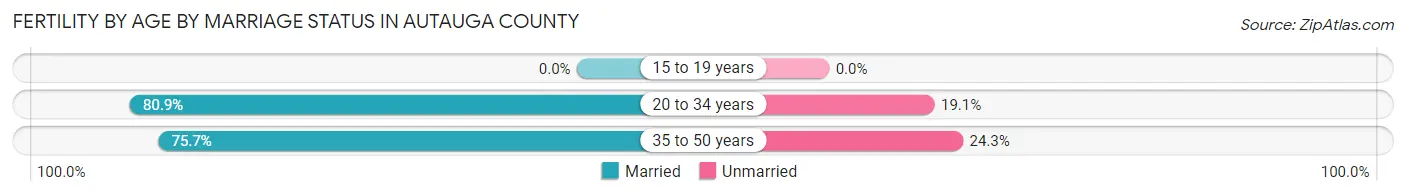
| Age Bracket | Married | Unmarried |
| 15 to 19 years | 0 (0.0%) | 0 (0.0%) |
| 20 to 34 years | 445 (80.9%) | 105 (19.1%) |
| 35 to 50 years | 178 (75.7%) | 57 (24.3%) |
| Total | 623 (79.4%) | 162 (20.6%) |
Fertility by Education in Autauga County
Average fertility rate in Autauga County is 55.0 births per 1,000 women. Women with the education attainment of graduate degree have the highest fertility rate of 112.0 births per 1,000 women, while women with the education attainment of less than high school have the lowest fertility at 18.0 births per 1,000 women. Women with the education attainment of college or associate's degree represent 39.8% of all women with births.
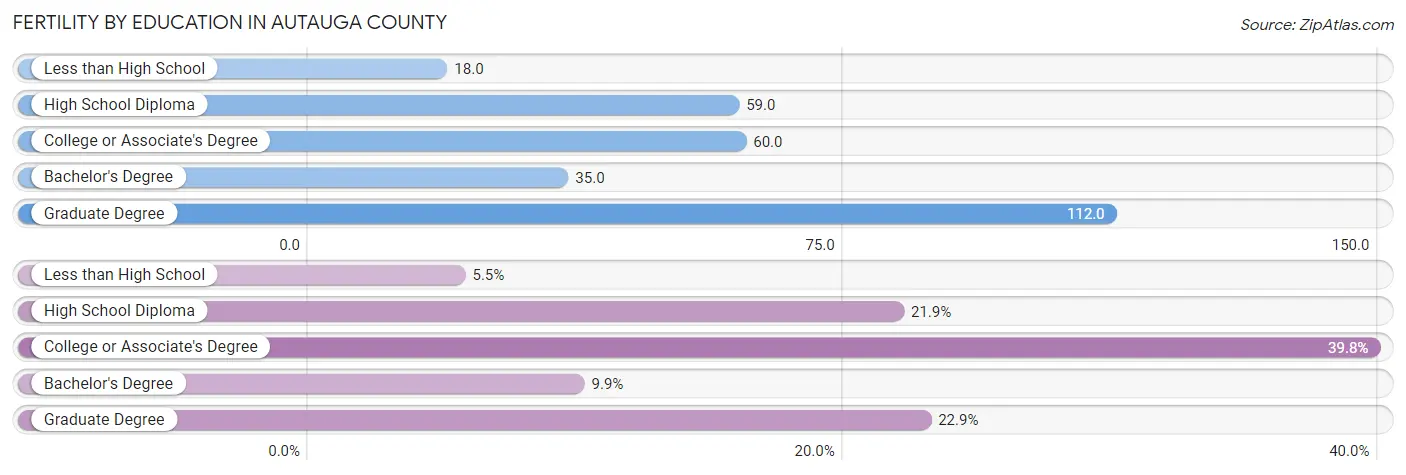
| Educational Attainment | Women with Births | Births / 1,000 Women |
| Less than High School | 43 (5.5%) | 18.0 |
| High School Diploma | 172 (21.9%) | 59.0 |
| College or Associate's Degree | 312 (39.8%) | 60.0 |
| Bachelor's Degree | 78 (9.9%) | 35.0 |
| Graduate Degree | 180 (22.9%) | 112.0 |
| Total | 785 (100.0%) | 55.0 |
Fertility by Education by Marriage Status in Autauga County
20.6% of women with births in Autauga County are unmarried. Women with the educational attainment of bachelor's degree are most likely to be married with 100.0% of them married at childbirth, while women with the educational attainment of less than high school are least likely to be married with 62.8% of them unmarried at childbirth.
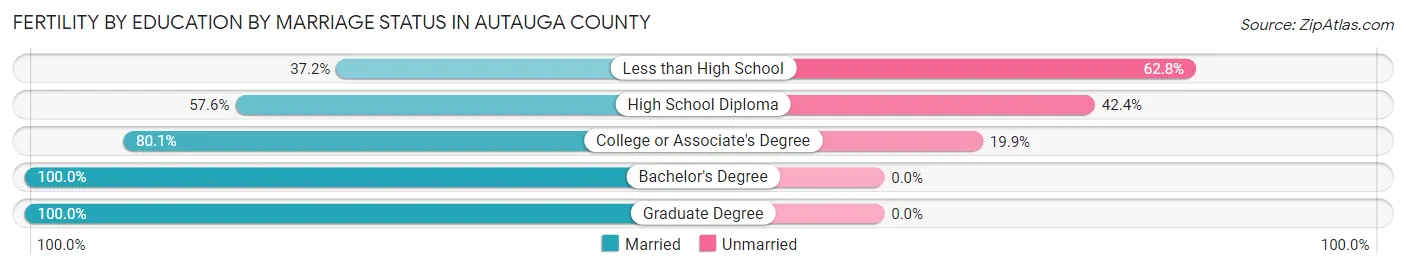
| Educational Attainment | Married | Unmarried |
| Less than High School | 16 (37.2%) | 27 (62.8%) |
| High School Diploma | 99 (57.6%) | 73 (42.4%) |
| College or Associate's Degree | 250 (80.1%) | 62 (19.9%) |
| Bachelor's Degree | 78 (100.0%) | 0 (0.0%) |
| Graduate Degree | 180 (100.0%) | 0 (0.0%) |
| Total | 623 (79.4%) | 162 (20.6%) |
Employment Characteristics in Autauga County
Employment by Class of Employer in Autauga County
Among the 27,031 employed individuals in Autauga County, private company employees (17,047 | 63.1%), state government employees (2,350 | 8.7%), and federal government employees (2,260 | 8.4%) make up the most common classes of employment.
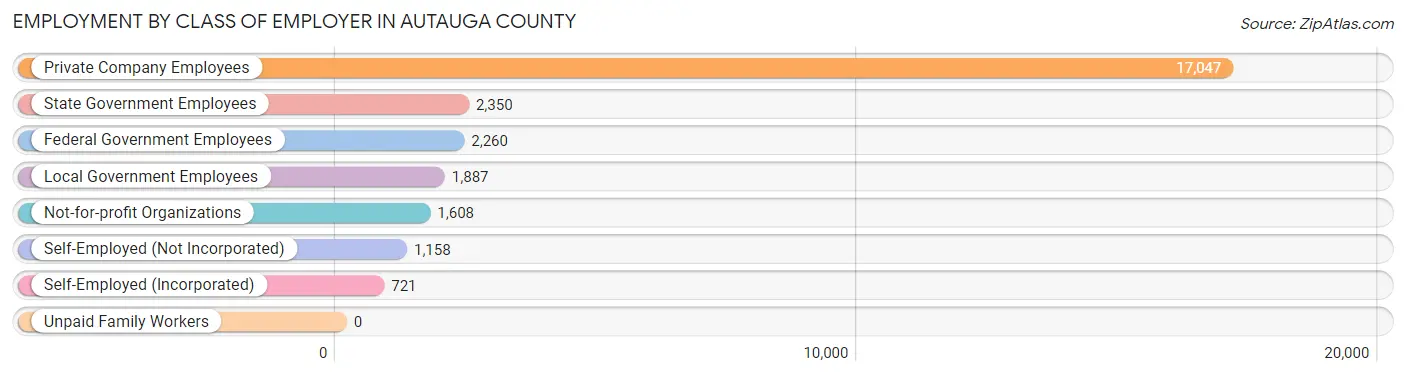
| Employer Class | # Employees | % Employees |
| Private Company Employees | 17,047 | 63.1% |
| Self-Employed (Incorporated) | 721 | 2.7% |
| Self-Employed (Not Incorporated) | 1,158 | 4.3% |
| Not-for-profit Organizations | 1,608 | 5.9% |
| Local Government Employees | 1,887 | 7.0% |
| State Government Employees | 2,350 | 8.7% |
| Federal Government Employees | 2,260 | 8.4% |
| Unpaid Family Workers | 0 | 0.0% |
| Total | 27,031 | 100.0% |
Employment Status by Age in Autauga County
According to the labor force statistics for Autauga County, out of the total population over 16 years of age (47,146), 59.6% or 28,099 individuals are in the labor force, with 2.8% or 787 of them unemployed. The age group with the highest labor force participation rate is 20 to 24 years, with 87.6% or 3,144 individuals in the labor force. Within the labor force, the 16 to 19 years age range has the highest percentage of unemployed individuals, with 9.1% or 113 of them being unemployed.
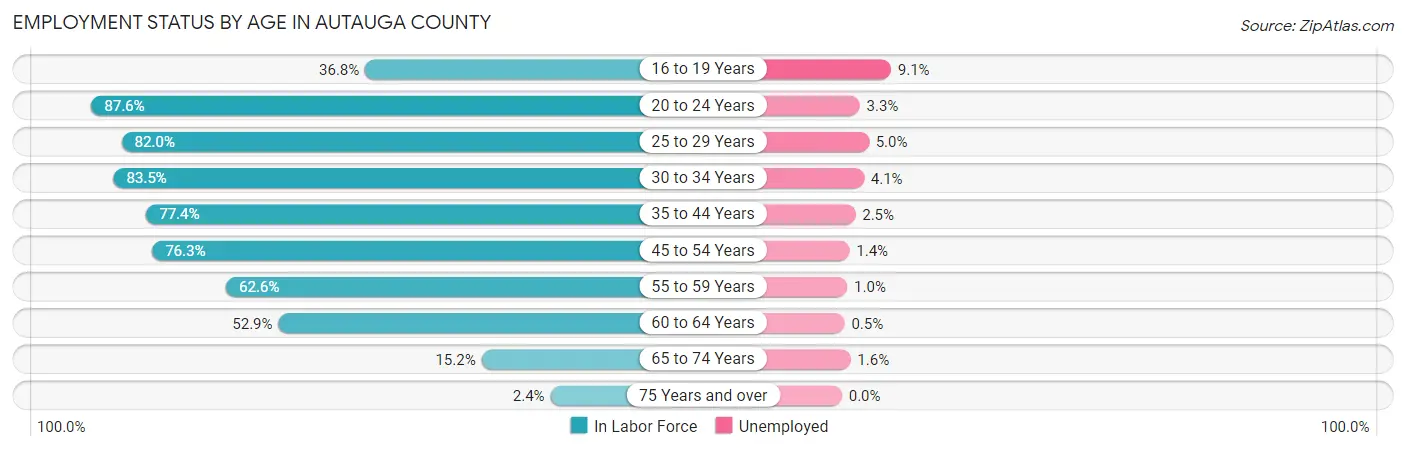
| Age Bracket | In Labor Force | Unemployed |
| 16 to 19 Years | 1,240 (36.8%) | 113 (9.1%) |
| 20 to 24 Years | 3,144 (87.6%) | 104 (3.3%) |
| 25 to 29 Years | 3,056 (82.0%) | 153 (5.0%) |
| 30 to 34 Years | 3,080 (83.5%) | 126 (4.1%) |
| 35 to 44 Years | 6,140 (77.4%) | 154 (2.5%) |
| 45 to 54 Years | 6,013 (76.3%) | 84 (1.4%) |
| 55 to 59 Years | 2,679 (62.6%) | 27 (1.0%) |
| 60 to 64 Years | 1,853 (52.9%) | 9 (0.5%) |
| 65 to 74 Years | 806 (15.2%) | 13 (1.6%) |
| 75 Years and over | 93 (2.4%) | 0 (0.0%) |
| Total | 28,099 (59.6%) | 787 (2.8%) |
Employment Status by Educational Attainment in Autauga County
According to labor force statistics for Autauga County, 73.6% of individuals (22,825) out of the total population between 25 and 64 years of age (31,012) are in the labor force, with 2.4% or 548 of them being unemployed. The group with the highest labor force participation rate are those with the educational attainment of bachelor's degree or higher, with 84.0% or 7,951 individuals in the labor force. Within the labor force, individuals with less than high school education have the highest percentage of unemployment, with 11.0% or 138 of them being unemployed.
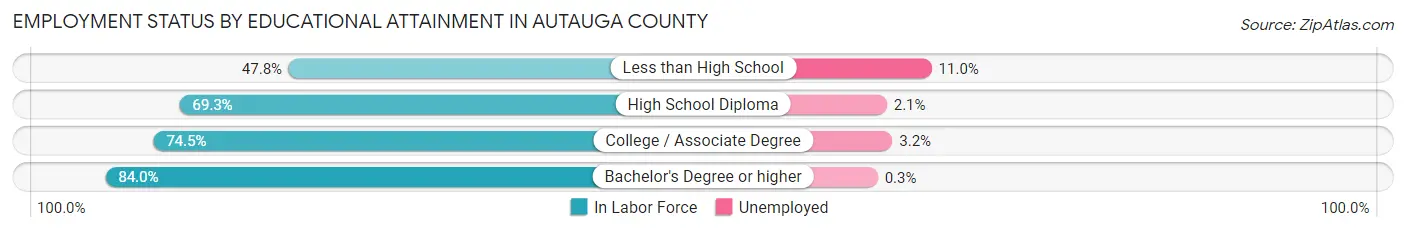
| Educational Attainment | In Labor Force | Unemployed |
| Less than High School | 1,257 (47.8%) | 289 (11.0%) |
| High School Diploma | 6,271 (69.3%) | 190 (2.1%) |
| College / Associate Degree | 7,352 (74.5%) | 316 (3.2%) |
| Bachelor's Degree or higher | 7,951 (84.0%) | 28 (0.3%) |
| Total | 22,825 (73.6%) | 744 (2.4%) |
Employment Occupations by Sex in Autauga County
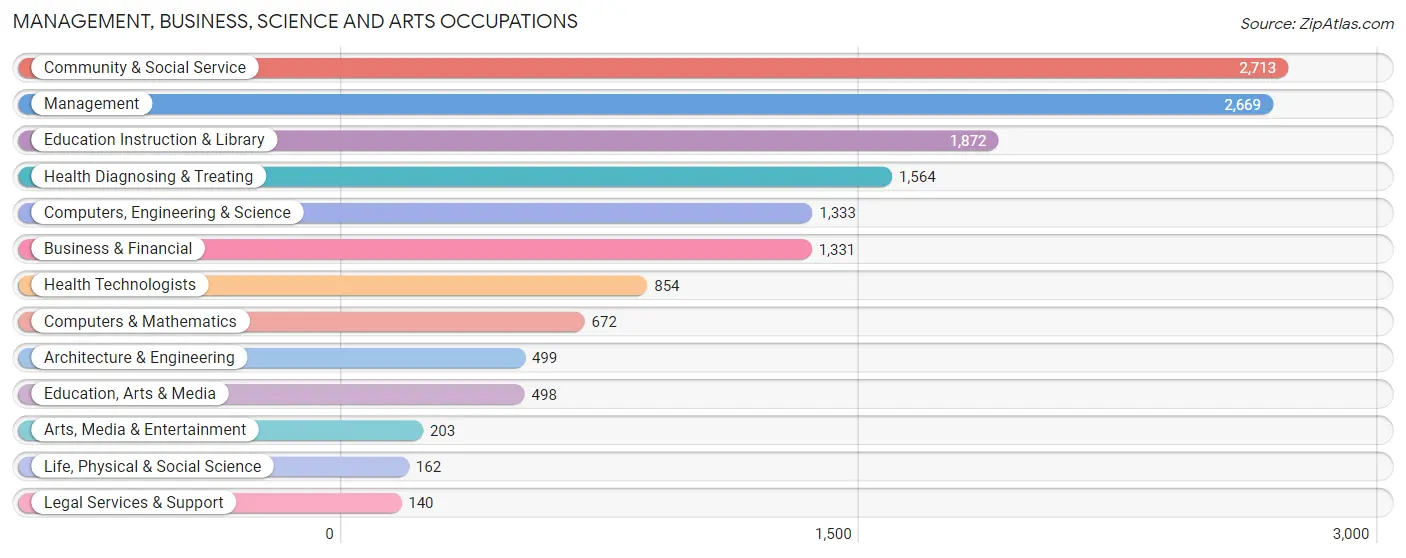
Management, Business, Science and Arts Occupations
The most common Management, Business, Science and Arts occupations in Autauga County are Community & Social Service (2,713 | 10.3%), Management (2,669 | 10.1%), Education Instruction & Library (1,872 | 7.1%), Health Diagnosing & Treating (1,564 | 5.9%), and Computers, Engineering & Science (1,333 | 5.1%).
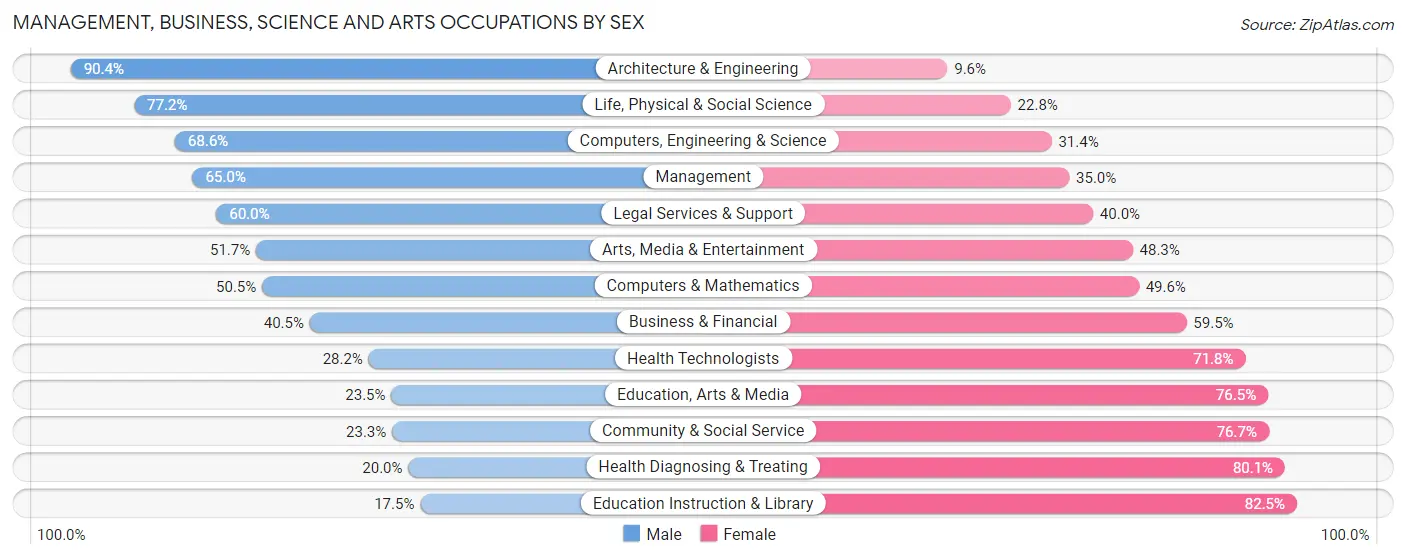
Management, Business, Science and Arts Occupations by Sex
Within the Management, Business, Science and Arts occupations in Autauga County, the most male-oriented occupations are Architecture & Engineering (90.4%), Life, Physical & Social Science (77.2%), and Computers, Engineering & Science (68.6%), while the most female-oriented occupations are Education Instruction & Library (82.5%), Health Diagnosing & Treating (80.0%), and Community & Social Service (76.7%).
| Occupation | Male | Female |
| Management | 1,734 (65.0%) | 935 (35.0%) |
| Business & Financial | 539 (40.5%) | 792 (59.5%) |
| Computers, Engineering & Science | 915 (68.6%) | 418 (31.4%) |
| Computers & Mathematics | 339 (50.4%) | 333 (49.5%) |
| Architecture & Engineering | 451 (90.4%) | 48 (9.6%) |
| Life, Physical & Social Science | 125 (77.2%) | 37 (22.8%) |
| Community & Social Service | 633 (23.3%) | 2,080 (76.7%) |
| Education, Arts & Media | 117 (23.5%) | 381 (76.5%) |
| Legal Services & Support | 84 (60.0%) | 56 (40.0%) |
| Education Instruction & Library | 327 (17.5%) | 1,545 (82.5%) |
| Arts, Media & Entertainment | 105 (51.7%) | 98 (48.3%) |
| Health Diagnosing & Treating | 312 (20.0%) | 1,252 (80.0%) |
| Health Technologists | 241 (28.2%) | 613 (71.8%) |
| Total (Category) | 4,133 (43.0%) | 5,477 (57.0%) |
| Total (Overall) | 14,009 (53.0%) | 12,402 (47.0%) |
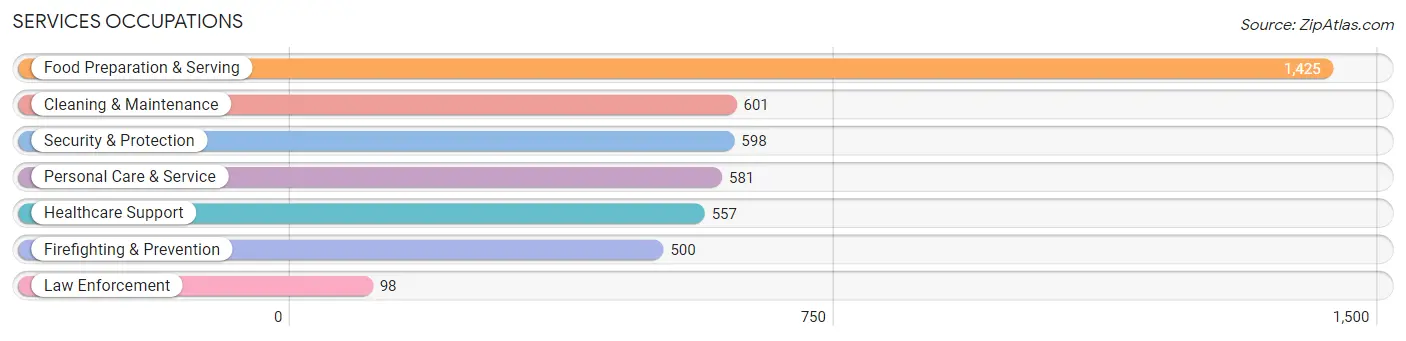
Services Occupations
The most common Services occupations in Autauga County are Food Preparation & Serving (1,425 | 5.4%), Cleaning & Maintenance (601 | 2.3%), Security & Protection (598 | 2.3%), Personal Care & Service (581 | 2.2%), and Healthcare Support (557 | 2.1%).
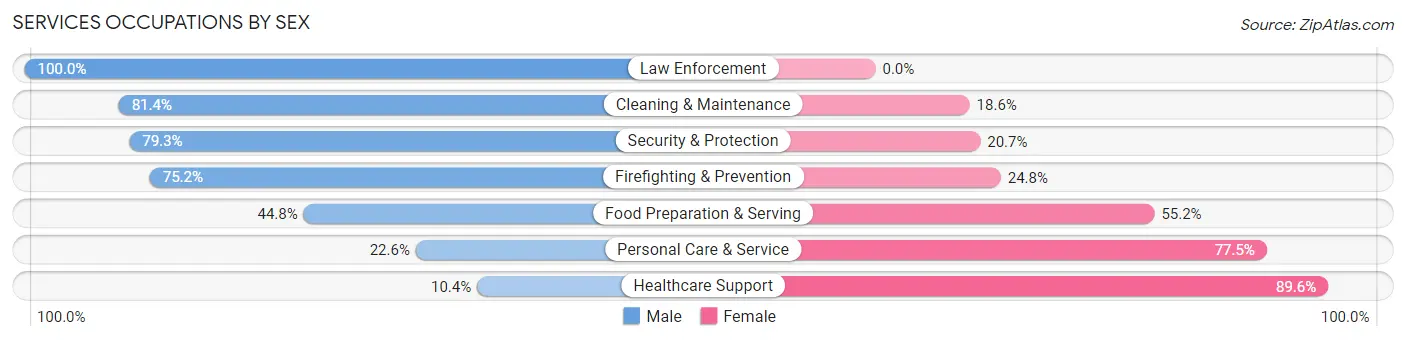
Services Occupations by Sex
Within the Services occupations in Autauga County, the most male-oriented occupations are Law Enforcement (100.0%), Cleaning & Maintenance (81.4%), and Security & Protection (79.3%), while the most female-oriented occupations are Healthcare Support (89.6%), Personal Care & Service (77.4%), and Food Preparation & Serving (55.2%).
| Occupation | Male | Female |
| Healthcare Support | 58 (10.4%) | 499 (89.6%) |
| Security & Protection | 474 (79.3%) | 124 (20.7%) |
| Firefighting & Prevention | 376 (75.2%) | 124 (24.8%) |
| Law Enforcement | 98 (100.0%) | 0 (0.0%) |
| Food Preparation & Serving | 638 (44.8%) | 787 (55.2%) |
| Cleaning & Maintenance | 489 (81.4%) | 112 (18.6%) |
| Personal Care & Service | 131 (22.6%) | 450 (77.4%) |
| Total (Category) | 1,790 (47.6%) | 1,972 (52.4%) |
| Total (Overall) | 14,009 (53.0%) | 12,402 (47.0%) |
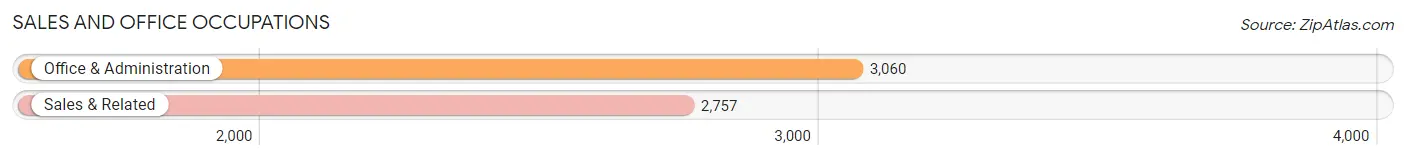
Sales and Office Occupations
The most common Sales and Office occupations in Autauga County are Office & Administration (3,060 | 11.6%), and Sales & Related (2,757 | 10.4%).
Sales and Office Occupations by Sex
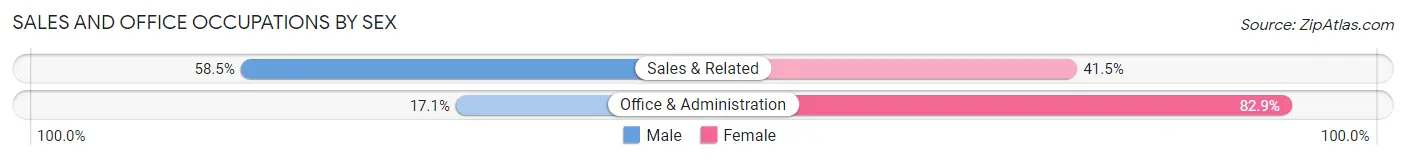
| Occupation | Male | Female |
| Sales & Related | 1,612 (58.5%) | 1,145 (41.5%) |
| Office & Administration | 523 (17.1%) | 2,537 (82.9%) |
| Total (Category) | 2,135 (36.7%) | 3,682 (63.3%) |
| Total (Overall) | 14,009 (53.0%) | 12,402 (47.0%) |
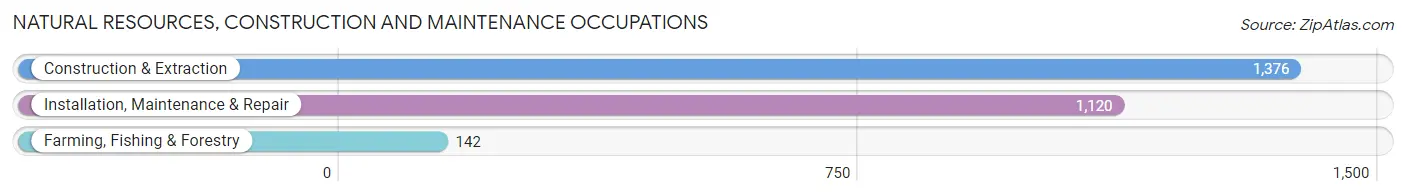
Natural Resources, Construction and Maintenance Occupations
The most common Natural Resources, Construction and Maintenance occupations in Autauga County are Construction & Extraction (1,376 | 5.2%), Installation, Maintenance & Repair (1,120 | 4.2%), and Farming, Fishing & Forestry (142 | 0.5%).
Natural Resources, Construction and Maintenance Occupations by Sex
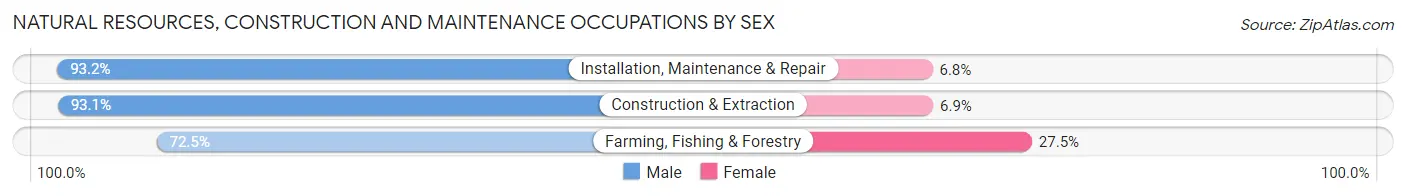
| Occupation | Male | Female |
| Farming, Fishing & Forestry | 103 (72.5%) | 39 (27.5%) |
| Construction & Extraction | 1,281 (93.1%) | 95 (6.9%) |
| Installation, Maintenance & Repair | 1,044 (93.2%) | 76 (6.8%) |
| Total (Category) | 2,428 (92.0%) | 210 (8.0%) |
| Total (Overall) | 14,009 (53.0%) | 12,402 (47.0%) |
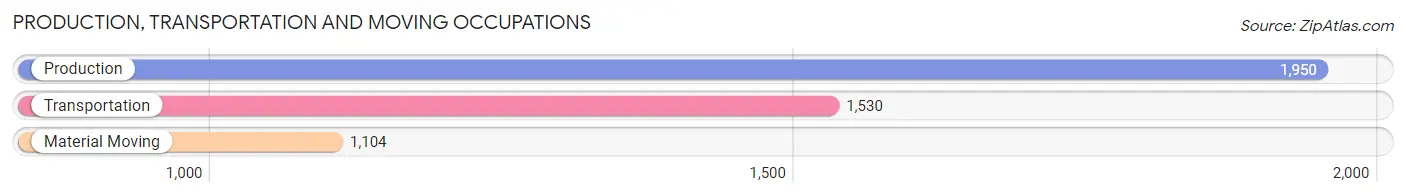
Production, Transportation and Moving Occupations
The most common Production, Transportation and Moving occupations in Autauga County are Production (1,950 | 7.4%), Transportation (1,530 | 5.8%), and Material Moving (1,104 | 4.2%).
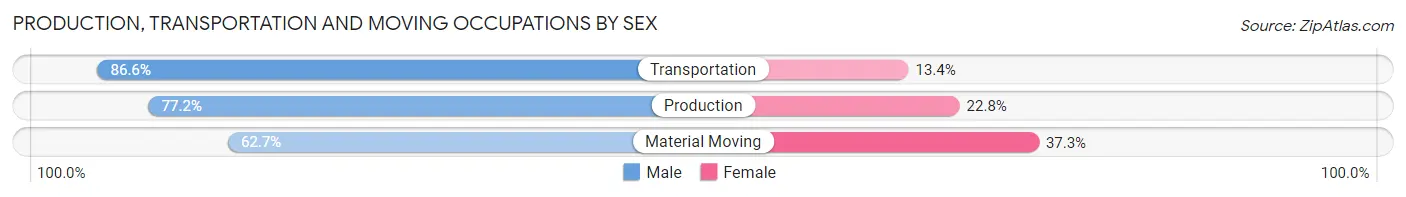
Production, Transportation and Moving Occupations by Sex
| Occupation | Male | Female |
| Production | 1,506 (77.2%) | 444 (22.8%) |
| Transportation | 1,325 (86.6%) | 205 (13.4%) |
| Material Moving | 692 (62.7%) | 412 (37.3%) |
| Total (Category) | 3,523 (76.8%) | 1,061 (23.2%) |
| Total (Overall) | 14,009 (53.0%) | 12,402 (47.0%) |
Employment Industries by Sex in Autauga County
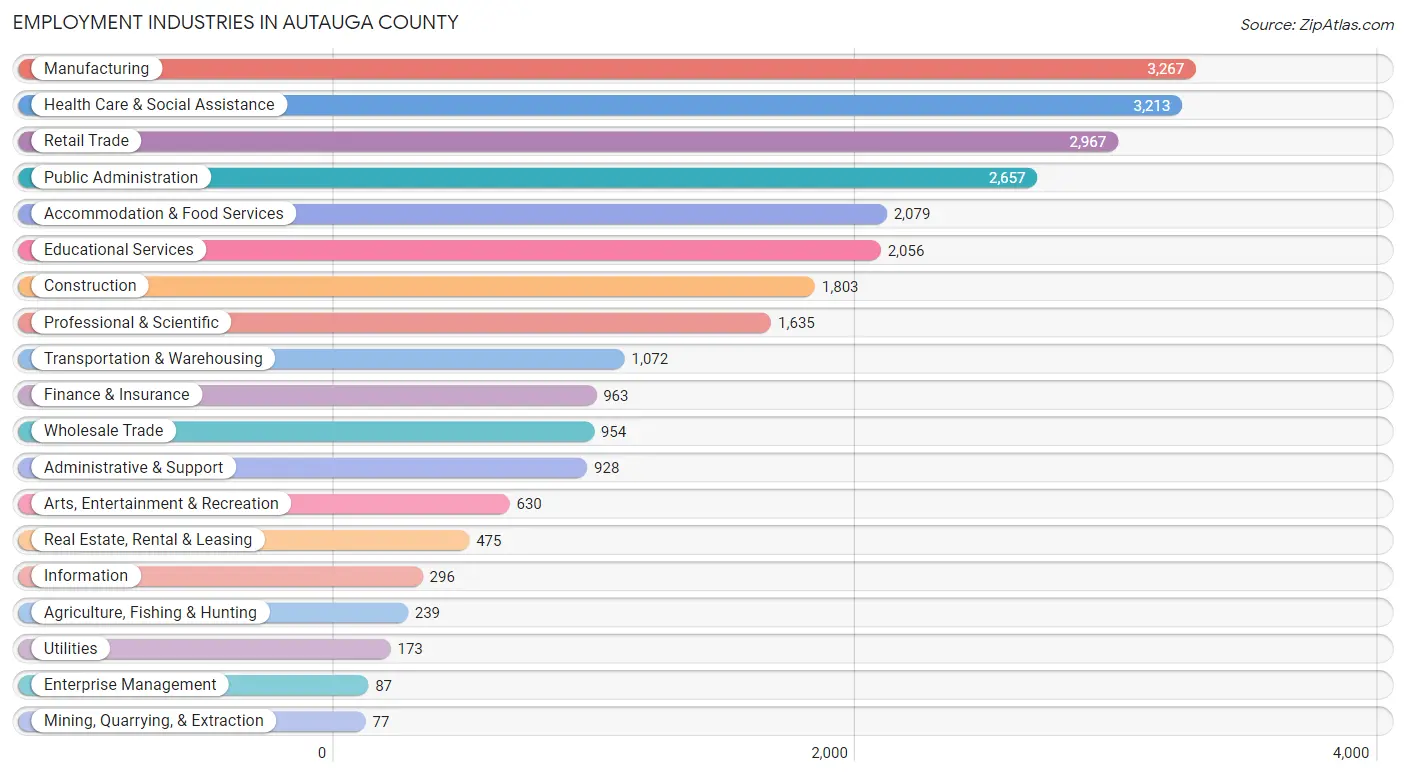
Employment Industries in Autauga County
The major employment industries in Autauga County include Manufacturing (3,267 | 12.4%), Health Care & Social Assistance (3,213 | 12.2%), Retail Trade (2,967 | 11.2%), Public Administration (2,657 | 10.1%), and Accommodation & Food Services (2,079 | 7.9%).
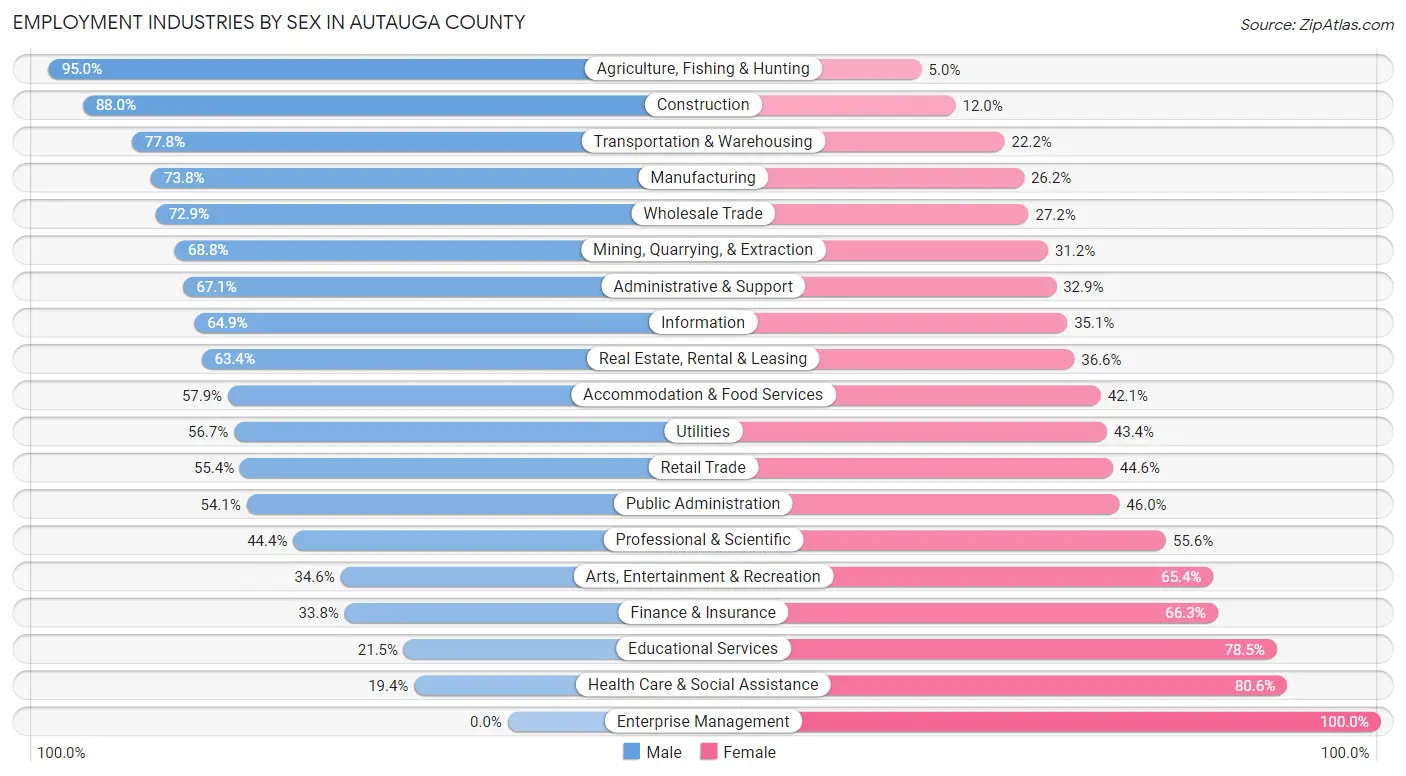
Employment Industries by Sex in Autauga County
The Autauga County industries that see more men than women are Agriculture, Fishing & Hunting (95.0%), Construction (88.0%), and Transportation & Warehousing (77.8%), whereas the industries that tend to have a higher number of women are Enterprise Management (100.0%), Health Care & Social Assistance (80.6%), and Educational Services (78.5%).
| Industry | Male | Female |
| Agriculture, Fishing & Hunting | 227 (95.0%) | 12 (5.0%) |
| Mining, Quarrying, & Extraction | 53 (68.8%) | 24 (31.2%) |
| Construction | 1,586 (88.0%) | 217 (12.0%) |
| Manufacturing | 2,411 (73.8%) | 856 (26.2%) |
| Wholesale Trade | 695 (72.9%) | 259 (27.2%) |
| Retail Trade | 1,644 (55.4%) | 1,323 (44.6%) |
| Transportation & Warehousing | 834 (77.8%) | 238 (22.2%) |
| Utilities | 98 (56.7%) | 75 (43.3%) |
| Information | 192 (64.9%) | 104 (35.1%) |
| Finance & Insurance | 325 (33.8%) | 638 (66.2%) |
| Real Estate, Rental & Leasing | 301 (63.4%) | 174 (36.6%) |
| Professional & Scientific | 726 (44.4%) | 909 (55.6%) |
| Enterprise Management | 0 (0.0%) | 87 (100.0%) |
| Administrative & Support | 623 (67.1%) | 305 (32.9%) |
| Educational Services | 442 (21.5%) | 1,614 (78.5%) |
| Health Care & Social Assistance | 622 (19.4%) | 2,591 (80.6%) |
| Arts, Entertainment & Recreation | 218 (34.6%) | 412 (65.4%) |
| Accommodation & Food Services | 1,204 (57.9%) | 875 (42.1%) |
| Public Administration | 1,436 (54.0%) | 1,221 (46.0%) |
| Total | 14,009 (53.0%) | 12,402 (47.0%) |
Education in Autauga County
School Enrollment in Autauga County
The most common levels of schooling among the 13,743 students in Autauga County are middle school (3,507 | 25.5%), high school (3,480 | 25.3%), and elementary school (2,679 | 19.5%).
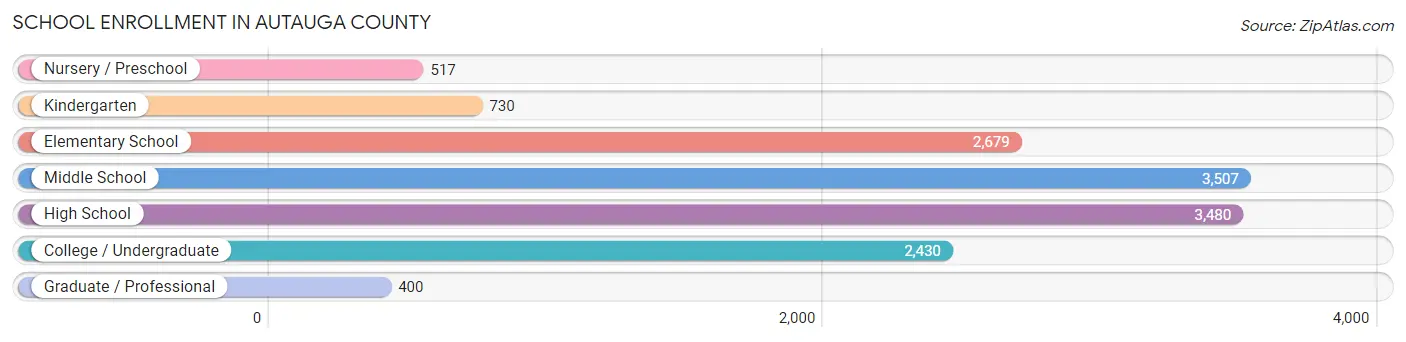
| School Level | # Students | % Students |
| Nursery / Preschool | 517 | 3.8% |
| Kindergarten | 730 | 5.3% |
| Elementary School | 2,679 | 19.5% |
| Middle School | 3,507 | 25.5% |
| High School | 3,480 | 25.3% |
| College / Undergraduate | 2,430 | 17.7% |
| Graduate / Professional | 400 | 2.9% |
| Total | 13,743 | 100.0% |
School Enrollment by Age by Funding Source in Autauga County
Out of a total of 13,743 students who are enrolled in schools in Autauga County, 2,721 (19.8%) attend a private institution, while the remaining 11,022 (80.2%) are enrolled in public schools. The age group of 3 to 4 year olds has the highest likelihood of being enrolled in private schools, with 150 (47.2% in the age bracket) enrolled. Conversely, the age group of 10 to 14 year olds has the lowest likelihood of being enrolled in a private school, with 3,557 (83.7% in the age bracket) attending a public institution.
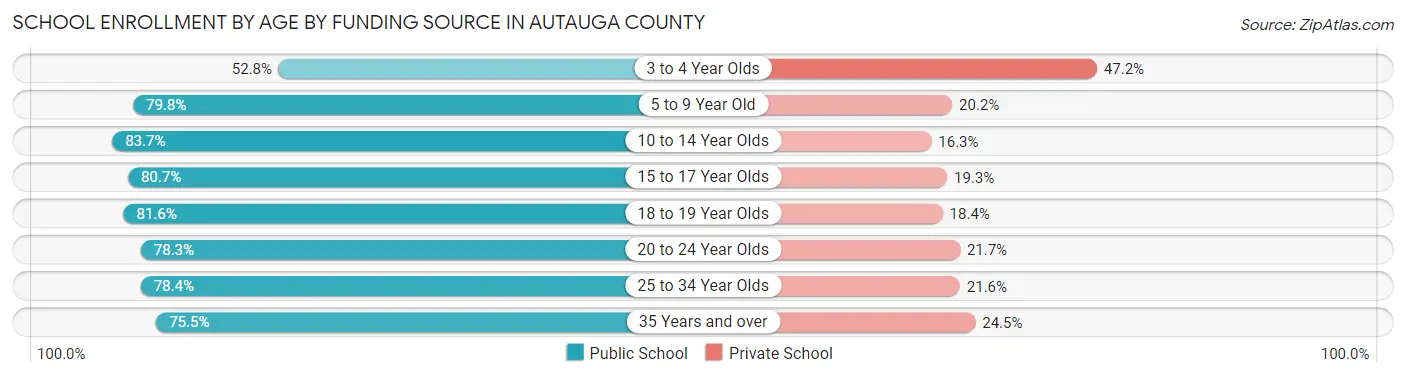
| Age Bracket | Public School | Private School |
| 3 to 4 Year Olds | 168 (52.8%) | 150 (47.2%) |
| 5 to 9 Year Old | 2,487 (79.8%) | 630 (20.2%) |
| 10 to 14 Year Olds | 3,557 (83.7%) | 694 (16.3%) |
| 15 to 17 Year Olds | 2,058 (80.7%) | 491 (19.3%) |
| 18 to 19 Year Olds | 796 (81.6%) | 180 (18.4%) |
| 20 to 24 Year Olds | 861 (78.3%) | 238 (21.7%) |
| 25 to 34 Year Olds | 391 (78.4%) | 108 (21.6%) |
| 35 Years and over | 705 (75.5%) | 229 (24.5%) |
| Total | 11,022 (80.2%) | 2,721 (19.8%) |
Educational Attainment by Field of Study in Autauga County
Business (2,883 | 22.9%), education (2,044 | 16.3%), arts & humanities (1,192 | 9.5%), science & technology (1,008 | 8.0%), and engineering (860 | 6.8%) are the most common fields of study among 12,571 individuals in Autauga County who have obtained a bachelor's degree or higher.
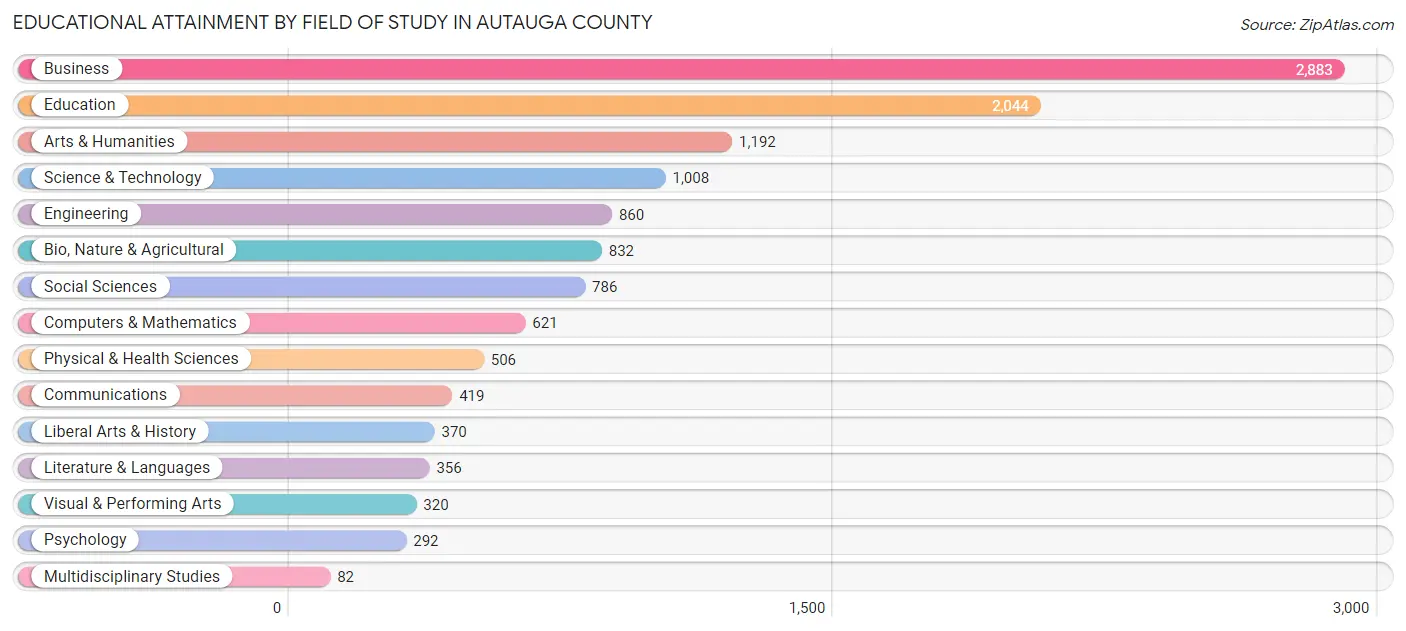
| Field of Study | # Graduates | % Graduates |
| Computers & Mathematics | 621 | 4.9% |
| Bio, Nature & Agricultural | 832 | 6.6% |
| Physical & Health Sciences | 506 | 4.0% |
| Psychology | 292 | 2.3% |
| Social Sciences | 786 | 6.2% |
| Engineering | 860 | 6.8% |
| Multidisciplinary Studies | 82 | 0.6% |
| Science & Technology | 1,008 | 8.0% |
| Business | 2,883 | 22.9% |
| Education | 2,044 | 16.3% |
| Literature & Languages | 356 | 2.8% |
| Liberal Arts & History | 370 | 2.9% |
| Visual & Performing Arts | 320 | 2.5% |
| Communications | 419 | 3.3% |
| Arts & Humanities | 1,192 | 9.5% |
| Total | 12,571 | 100.0% |
Transportation & Commute in Autauga County
Vehicle Availability by Sex in Autauga County
The most prevalent vehicle ownership categories in Autauga County are males with 2 vehicles (5,289, accounting for 36.1%) and females with 2 vehicles (4,141, making up 42.9%).
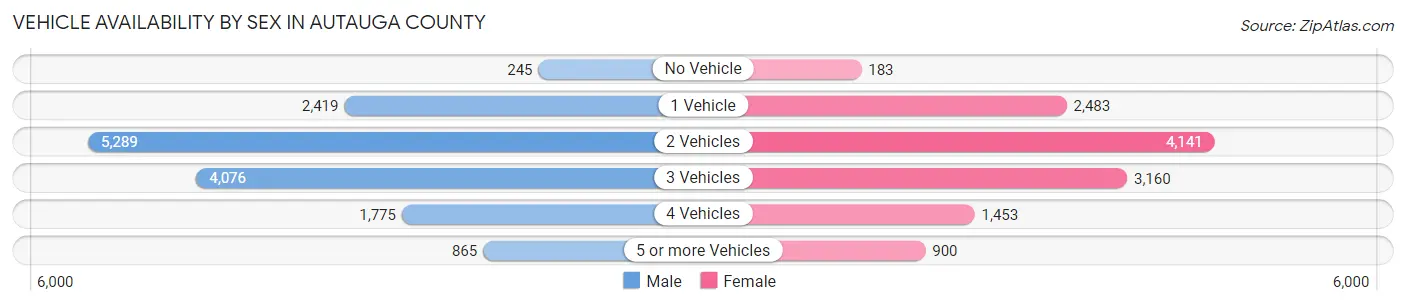
| Vehicles Available | Male | Female |
| No Vehicle | 245 (1.7%) | 183 (1.5%) |
| 1 Vehicle | 2,419 (16.5%) | 2,483 (20.2%) |
| 2 Vehicles | 5,289 (36.1%) | 4,141 (33.6%) |
| 3 Vehicles | 4,076 (27.8%) | 3,160 (25.7%) |
| 4 Vehicles | 1,775 (12.1%) | 1,453 (11.8%) |
| 5 or more Vehicles | 865 (5.9%) | 900 (7.3%) |
| Total | 14,669 (100.0%) | 12,320 (100.0%) |
Commute Time in Autauga County
The most frequently occuring commute durations in Autauga County are 30 to 34 minutes (5,145 commuters, 20.1%), 20 to 24 minutes (4,277 commuters, 16.7%), and 10 to 14 minutes (3,277 commuters, 12.8%).
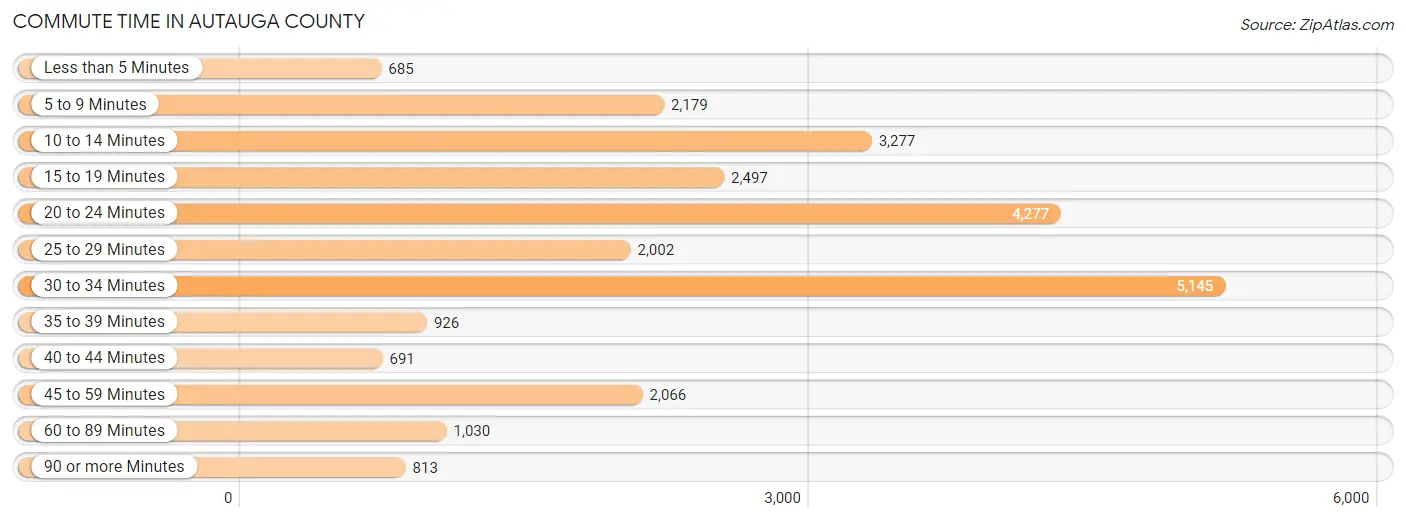
| Commute Time | # Commuters | % Commuters |
| Less than 5 Minutes | 685 | 2.7% |
| 5 to 9 Minutes | 2,179 | 8.5% |
| 10 to 14 Minutes | 3,277 | 12.8% |
| 15 to 19 Minutes | 2,497 | 9.8% |
| 20 to 24 Minutes | 4,277 | 16.7% |
| 25 to 29 Minutes | 2,002 | 7.8% |
| 30 to 34 Minutes | 5,145 | 20.1% |
| 35 to 39 Minutes | 926 | 3.6% |
| 40 to 44 Minutes | 691 | 2.7% |
| 45 to 59 Minutes | 2,066 | 8.1% |
| 60 to 89 Minutes | 1,030 | 4.0% |
| 90 or more Minutes | 813 | 3.2% |
Commute Time by Sex in Autauga County
The most common commute times in Autauga County are 30 to 34 minutes (3,062 commuters, 21.7%) for males and 30 to 34 minutes (2,083 commuters, 18.2%) for females.
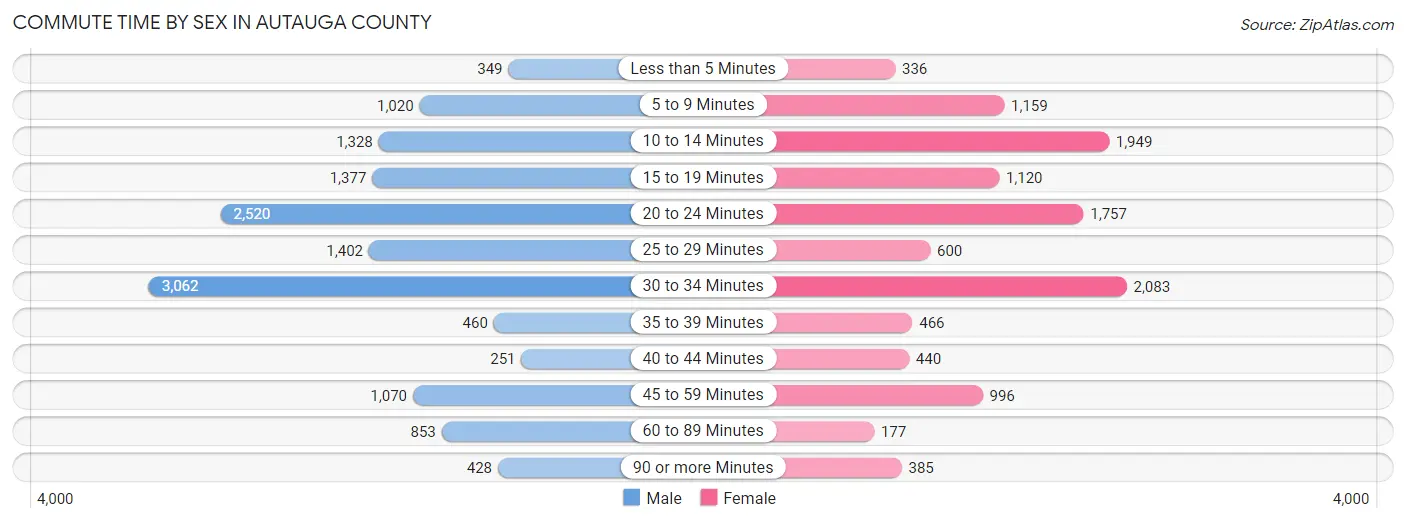
| Commute Time | Male | Female |
| Less than 5 Minutes | 349 (2.5%) | 336 (2.9%) |
| 5 to 9 Minutes | 1,020 (7.2%) | 1,159 (10.1%) |
| 10 to 14 Minutes | 1,328 (9.4%) | 1,949 (17.0%) |
| 15 to 19 Minutes | 1,377 (9.8%) | 1,120 (9.8%) |
| 20 to 24 Minutes | 2,520 (17.8%) | 1,757 (15.3%) |
| 25 to 29 Minutes | 1,402 (9.9%) | 600 (5.2%) |
| 30 to 34 Minutes | 3,062 (21.7%) | 2,083 (18.2%) |
| 35 to 39 Minutes | 460 (3.3%) | 466 (4.1%) |
| 40 to 44 Minutes | 251 (1.8%) | 440 (3.8%) |
| 45 to 59 Minutes | 1,070 (7.6%) | 996 (8.7%) |
| 60 to 89 Minutes | 853 (6.0%) | 177 (1.5%) |
| 90 or more Minutes | 428 (3.0%) | 385 (3.4%) |
Time of Departure to Work by Sex in Autauga County
The most frequent times of departure to work in Autauga County are 7:00 AM to 7:29 AM (2,186, 15.5%) for males and 7:00 AM to 7:29 AM (2,370, 20.7%) for females.
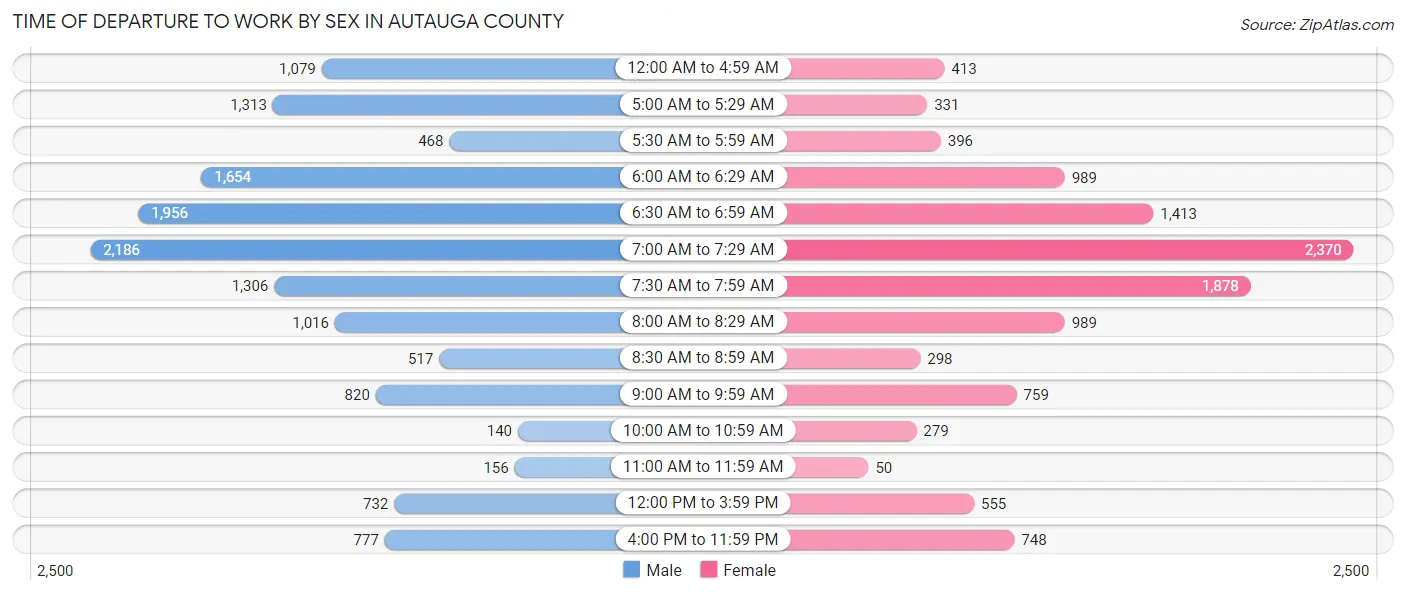
| Time of Departure | Male | Female |
| 12:00 AM to 4:59 AM | 1,079 (7.6%) | 413 (3.6%) |
| 5:00 AM to 5:29 AM | 1,313 (9.3%) | 331 (2.9%) |
| 5:30 AM to 5:59 AM | 468 (3.3%) | 396 (3.5%) |
| 6:00 AM to 6:29 AM | 1,654 (11.7%) | 989 (8.6%) |
| 6:30 AM to 6:59 AM | 1,956 (13.9%) | 1,413 (12.3%) |
| 7:00 AM to 7:29 AM | 2,186 (15.5%) | 2,370 (20.7%) |
| 7:30 AM to 7:59 AM | 1,306 (9.2%) | 1,878 (16.4%) |
| 8:00 AM to 8:29 AM | 1,016 (7.2%) | 989 (8.6%) |
| 8:30 AM to 8:59 AM | 517 (3.7%) | 298 (2.6%) |
| 9:00 AM to 9:59 AM | 820 (5.8%) | 759 (6.6%) |
| 10:00 AM to 10:59 AM | 140 (1.0%) | 279 (2.4%) |
| 11:00 AM to 11:59 AM | 156 (1.1%) | 50 (0.4%) |
| 12:00 PM to 3:59 PM | 732 (5.2%) | 555 (4.8%) |
| 4:00 PM to 11:59 PM | 777 (5.5%) | 748 (6.5%) |
| Total | 14,120 (100.0%) | 11,468 (100.0%) |
Housing Occupancy in Autauga County
Occupancy by Ownership in Autauga County
Of the total 22,308 dwellings in Autauga County, owner-occupied units account for 16,832 (75.4%), while renter-occupied units make up 5,476 (24.5%).
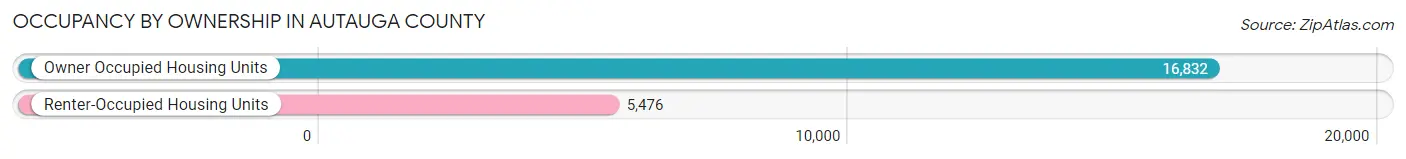
| Occupancy | # Housing Units | % Housing Units |
| Owner Occupied Housing Units | 16,832 | 75.4% |
| Renter-Occupied Housing Units | 5,476 | 24.5% |
| Total Occupied Housing Units | 22,308 | 100.0% |
Occupancy by Household Size in Autauga County
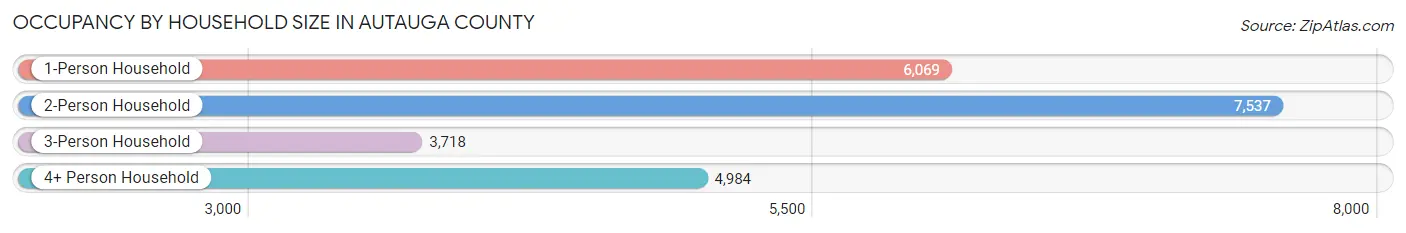
| Household Size | # Housing Units | % Housing Units |
| 1-Person Household | 6,069 | 27.2% |
| 2-Person Household | 7,537 | 33.8% |
| 3-Person Household | 3,718 | 16.7% |
| 4+ Person Household | 4,984 | 22.3% |
| Total Housing Units | 22,308 | 100.0% |
Occupancy by Ownership by Household Size in Autauga County
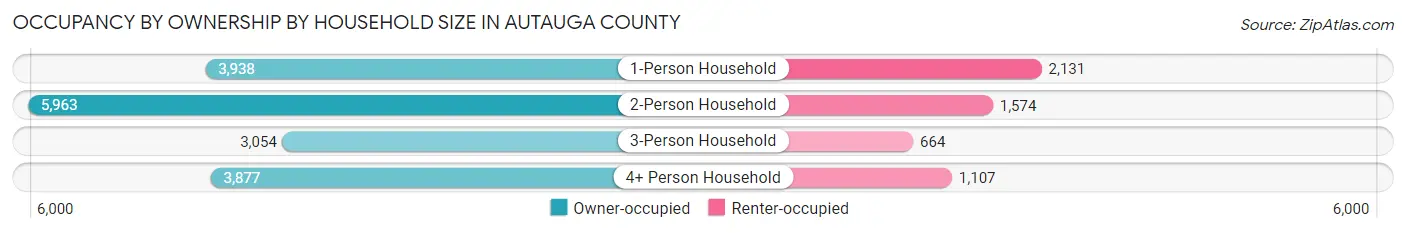
| Household Size | Owner-occupied | Renter-occupied |
| 1-Person Household | 3,938 (64.9%) | 2,131 (35.1%) |
| 2-Person Household | 5,963 (79.1%) | 1,574 (20.9%) |
| 3-Person Household | 3,054 (82.1%) | 664 (17.9%) |
| 4+ Person Household | 3,877 (77.8%) | 1,107 (22.2%) |
| Total Housing Units | 16,832 (75.4%) | 5,476 (24.5%) |
Occupancy by Educational Attainment in Autauga County
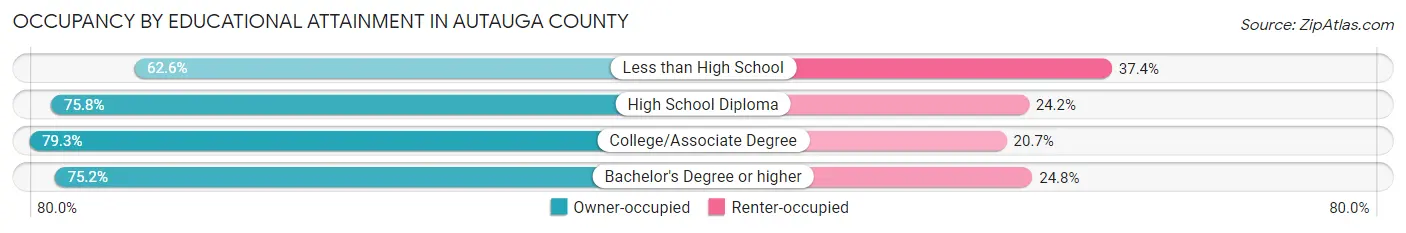
| Household Size | Owner-occupied | Renter-occupied |
| Less than High School | 1,233 (62.6%) | 736 (37.4%) |
| High School Diploma | 4,775 (75.8%) | 1,525 (24.2%) |
| College/Associate Degree | 5,095 (79.3%) | 1,330 (20.7%) |
| Bachelor's Degree or higher | 5,729 (75.2%) | 1,885 (24.8%) |
Occupancy by Age of Householder in Autauga County
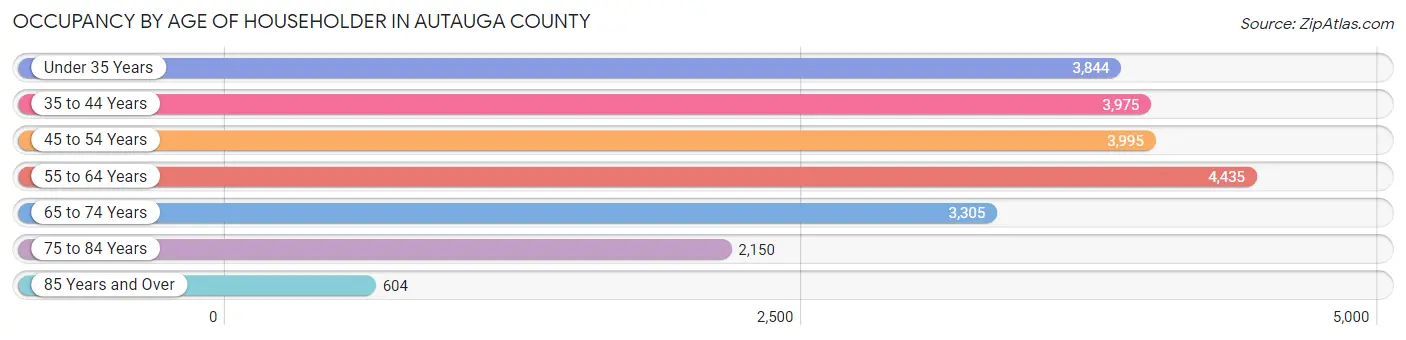
| Age Bracket | # Households | % Households |
| Under 35 Years | 3,844 | 17.2% |
| 35 to 44 Years | 3,975 | 17.8% |
| 45 to 54 Years | 3,995 | 17.9% |
| 55 to 64 Years | 4,435 | 19.9% |
| 65 to 74 Years | 3,305 | 14.8% |
| 75 to 84 Years | 2,150 | 9.6% |
| 85 Years and Over | 604 | 2.7% |
| Total | 22,308 | 100.0% |
Housing Finances in Autauga County
Median Income by Occupancy in Autauga County
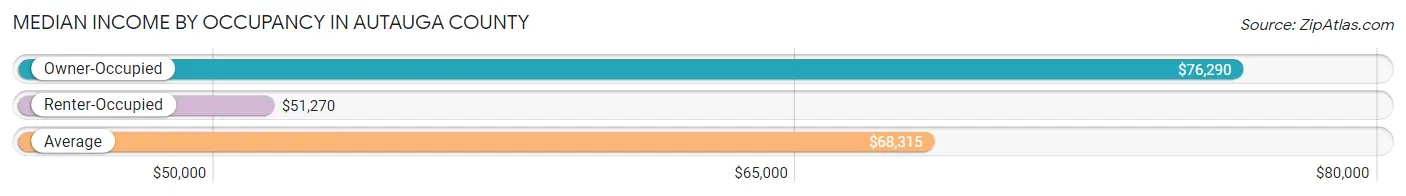
| Occupancy Type | # Households | Median Income |
| Owner-Occupied | 16,832 (75.4%) | $76,290 |
| Renter-Occupied | 5,476 (24.5%) | $51,270 |
| Average | 22,308 (100.0%) | $68,315 |
Occupancy by Householder Income Bracket in Autauga County
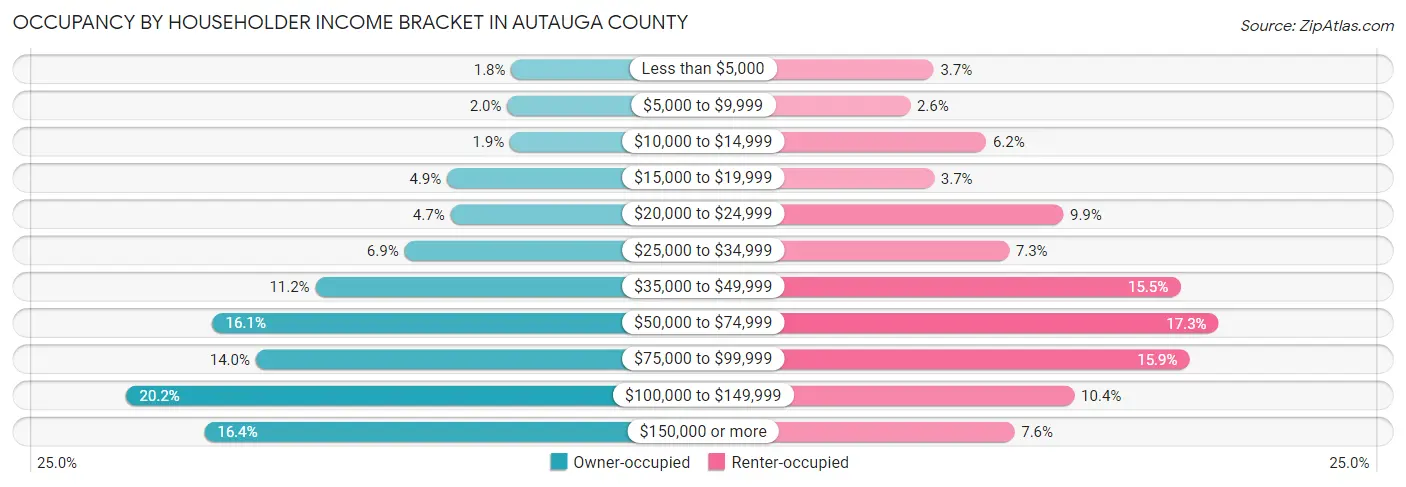
| Income Bracket | Owner-occupied | Renter-occupied |
| Less than $5,000 | 307 (1.8%) | 203 (3.7%) |
| $5,000 to $9,999 | 338 (2.0%) | 142 (2.6%) |
| $10,000 to $14,999 | 316 (1.9%) | 340 (6.2%) |
| $15,000 to $19,999 | 822 (4.9%) | 204 (3.7%) |
| $20,000 to $24,999 | 794 (4.7%) | 541 (9.9%) |
| $25,000 to $34,999 | 1,163 (6.9%) | 400 (7.3%) |
| $35,000 to $49,999 | 1,877 (11.2%) | 846 (15.4%) |
| $50,000 to $74,999 | 2,702 (16.1%) | 946 (17.3%) |
| $75,000 to $99,999 | 2,355 (14.0%) | 870 (15.9%) |
| $100,000 to $149,999 | 3,391 (20.2%) | 570 (10.4%) |
| $150,000 or more | 2,767 (16.4%) | 414 (7.6%) |
| Total | 16,832 (100.0%) | 5,476 (100.0%) |
Monthly Housing Cost Tiers in Autauga County
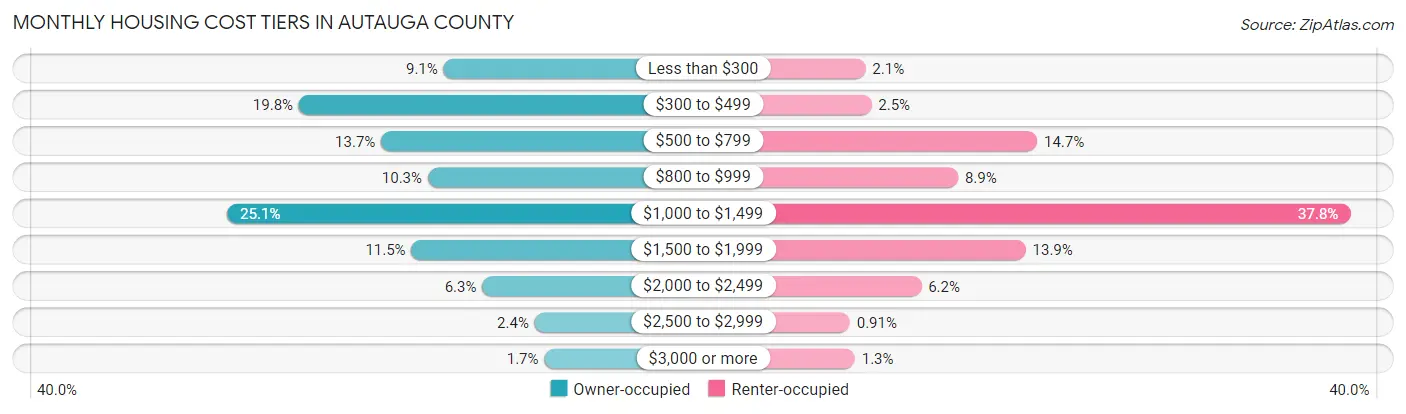
| Monthly Cost | Owner-occupied | Renter-occupied |
| Less than $300 | 1,539 (9.1%) | 113 (2.1%) |
| $300 to $499 | 3,333 (19.8%) | 137 (2.5%) |
| $500 to $799 | 2,312 (13.7%) | 805 (14.7%) |
| $800 to $999 | 1,733 (10.3%) | 486 (8.9%) |
| $1,000 to $1,499 | 4,222 (25.1%) | 2,068 (37.8%) |
| $1,500 to $1,999 | 1,937 (11.5%) | 759 (13.9%) |
| $2,000 to $2,499 | 1,058 (6.3%) | 338 (6.2%) |
| $2,500 to $2,999 | 409 (2.4%) | 50 (0.9%) |
| $3,000 or more | 289 (1.7%) | 70 (1.3%) |
| Total | 16,832 (100.0%) | 5,476 (100.0%) |
Physical Housing Characteristics in Autauga County
Housing Structures in Autauga County
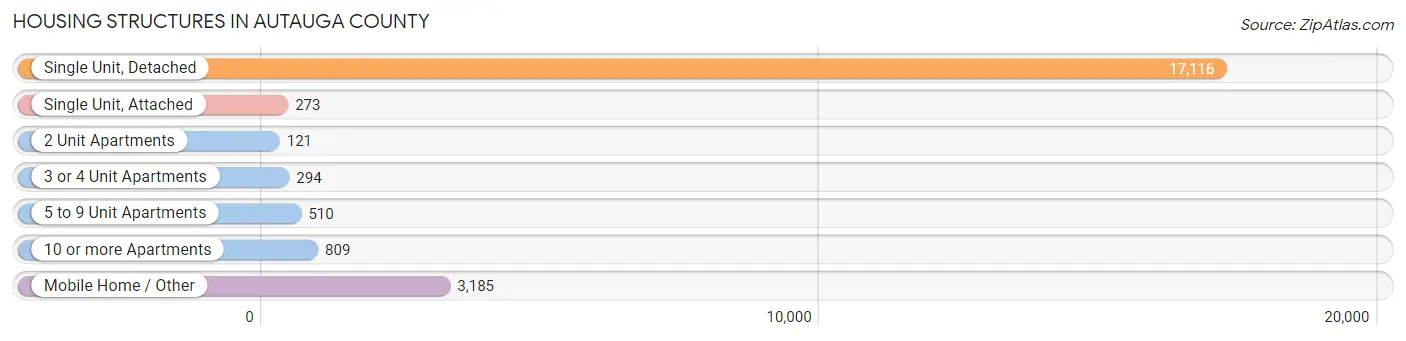
| Structure Type | # Housing Units | % Housing Units |
| Single Unit, Detached | 17,116 | 76.7% |
| Single Unit, Attached | 273 | 1.2% |
| 2 Unit Apartments | 121 | 0.5% |
| 3 or 4 Unit Apartments | 294 | 1.3% |
| 5 to 9 Unit Apartments | 510 | 2.3% |
| 10 or more Apartments | 809 | 3.6% |
| Mobile Home / Other | 3,185 | 14.3% |
| Total | 22,308 | 100.0% |
Housing Structures by Occupancy in Autauga County
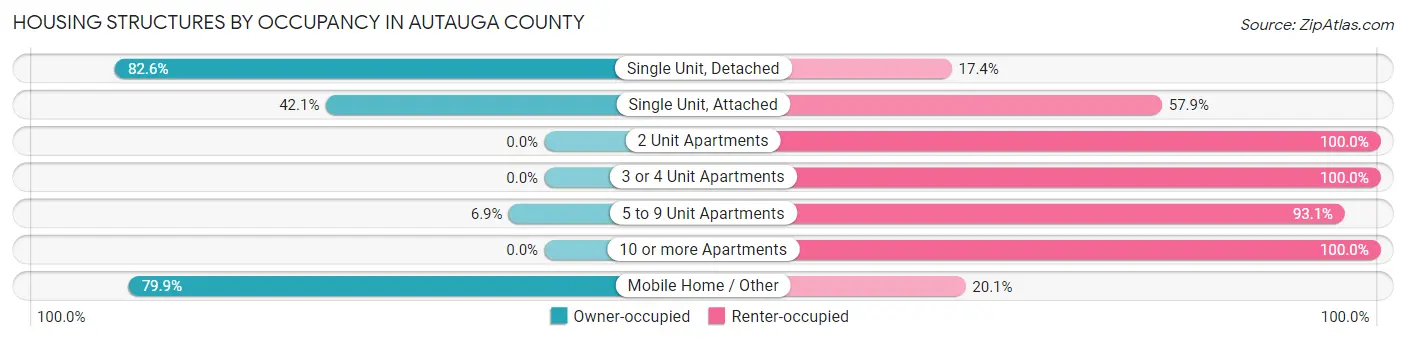
| Structure Type | Owner-occupied | Renter-occupied |
| Single Unit, Detached | 14,136 (82.6%) | 2,980 (17.4%) |
| Single Unit, Attached | 115 (42.1%) | 158 (57.9%) |
| 2 Unit Apartments | 0 (0.0%) | 121 (100.0%) |
| 3 or 4 Unit Apartments | 0 (0.0%) | 294 (100.0%) |
| 5 to 9 Unit Apartments | 35 (6.9%) | 475 (93.1%) |
| 10 or more Apartments | 0 (0.0%) | 809 (100.0%) |
| Mobile Home / Other | 2,546 (79.9%) | 639 (20.1%) |
| Total | 16,832 (75.4%) | 5,476 (24.5%) |
Housing Structures by Number of Rooms in Autauga County
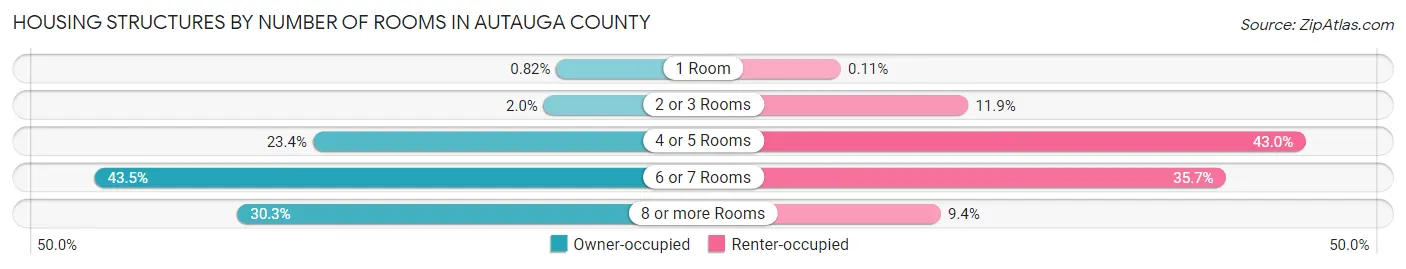
| Number of Rooms | Owner-occupied | Renter-occupied |
| 1 Room | 138 (0.8%) | 6 (0.1%) |
| 2 or 3 Rooms | 335 (2.0%) | 651 (11.9%) |
| 4 or 5 Rooms | 3,931 (23.4%) | 2,355 (43.0%) |
| 6 or 7 Rooms | 7,325 (43.5%) | 1,952 (35.6%) |
| 8 or more Rooms | 5,103 (30.3%) | 512 (9.3%) |
| Total | 16,832 (100.0%) | 5,476 (100.0%) |
Housing Structure by Heating Type in Autauga County
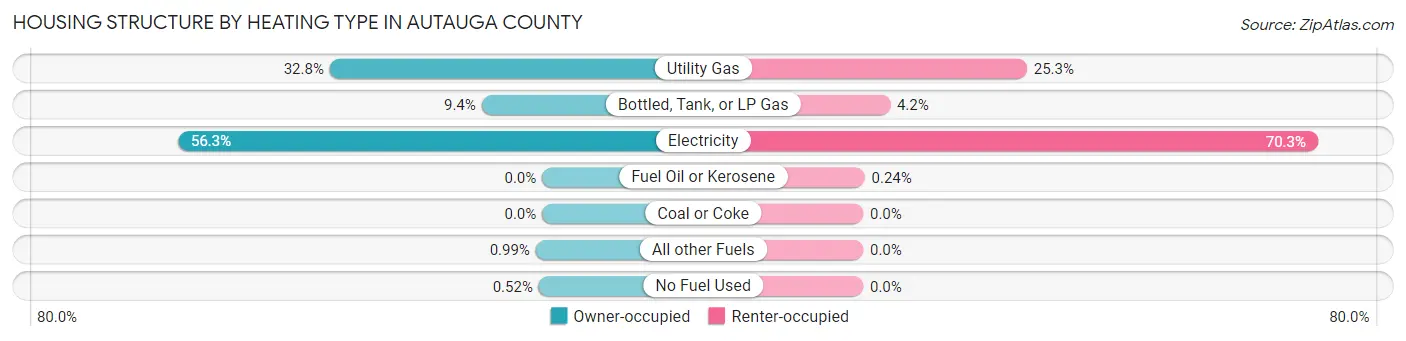
| Heating Type | Owner-occupied | Renter-occupied |
| Utility Gas | 5,526 (32.8%) | 1,386 (25.3%) |
| Bottled, Tank, or LP Gas | 1,574 (9.3%) | 228 (4.2%) |
| Electricity | 9,478 (56.3%) | 3,849 (70.3%) |
| Fuel Oil or Kerosene | 0 (0.0%) | 13 (0.2%) |
| Coal or Coke | 0 (0.0%) | 0 (0.0%) |
| All other Fuels | 166 (1.0%) | 0 (0.0%) |
| No Fuel Used | 88 (0.5%) | 0 (0.0%) |
| Total | 16,832 (100.0%) | 5,476 (100.0%) |
Household Vehicle Usage in Autauga County
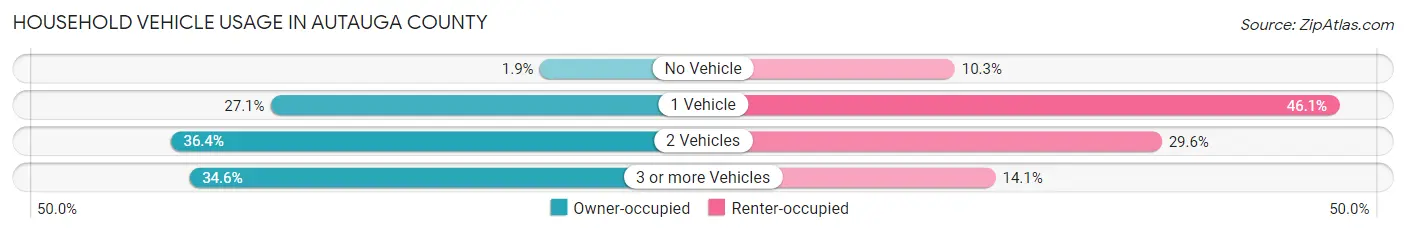
| Vehicles per Household | Owner-occupied | Renter-occupied |
| No Vehicle | 326 (1.9%) | 562 (10.3%) |
| 1 Vehicle | 4,555 (27.1%) | 2,525 (46.1%) |
| 2 Vehicles | 6,122 (36.4%) | 1,619 (29.6%) |
| 3 or more Vehicles | 5,829 (34.6%) | 770 (14.1%) |
| Total | 16,832 (100.0%) | 5,476 (100.0%) |
Real Estate & Mortgages in Autauga County
Real Estate and Mortgage Overview in Autauga County
| Characteristic | Without Mortgage | With Mortgage |
| Housing Units | 7,156 | 9,676 |
| Median Property Value | $173,700 | $200,600 |
| Median Household Income | $50,862 | $2,030 |
| Monthly Housing Costs | $417 | $262 |
| Real Estate Taxes | $422 | $1,050 |
Property Value by Mortgage Status in Autauga County
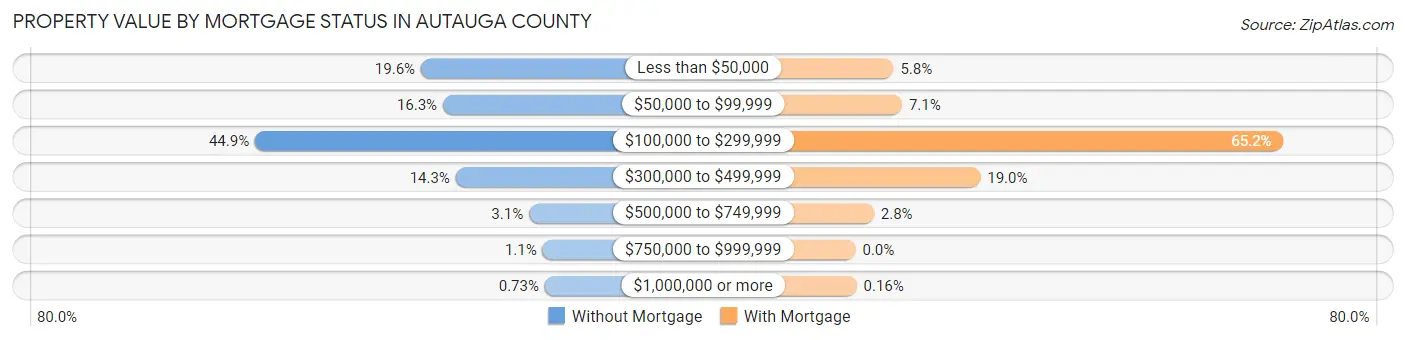
| Property Value | Without Mortgage | With Mortgage |
| Less than $50,000 | 1,403 (19.6%) | 559 (5.8%) |
| $50,000 to $99,999 | 1,163 (16.3%) | 684 (7.1%) |
| $100,000 to $299,999 | 3,212 (44.9%) | 6,309 (65.2%) |
| $300,000 to $499,999 | 1,024 (14.3%) | 1,839 (19.0%) |
| $500,000 to $749,999 | 225 (3.1%) | 270 (2.8%) |
| $750,000 to $999,999 | 77 (1.1%) | 0 (0.0%) |
| $1,000,000 or more | 52 (0.7%) | 15 (0.2%) |
| Total | 7,156 (100.0%) | 9,676 (100.0%) |
Household Income by Mortgage Status in Autauga County
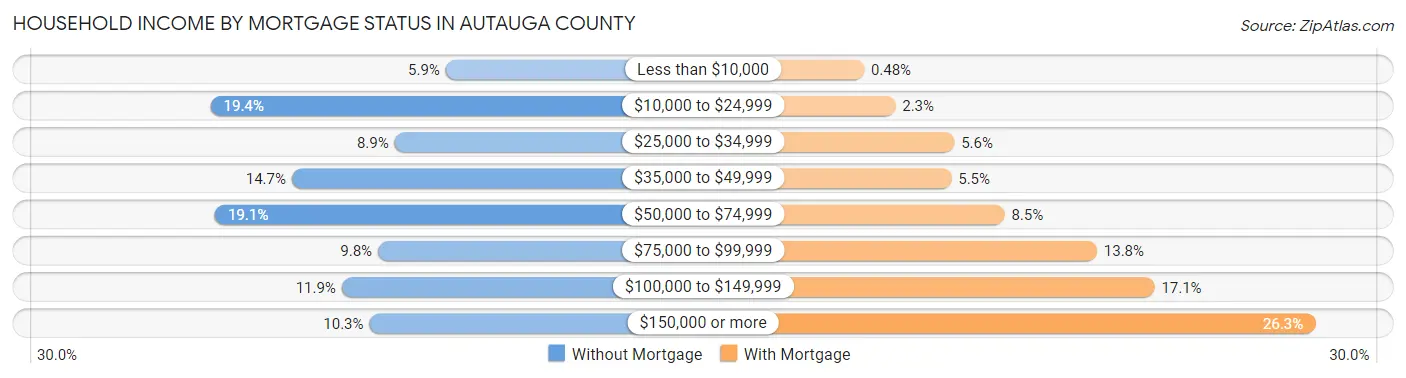
| Household Income | Without Mortgage | With Mortgage |
| Less than $10,000 | 425 (5.9%) | 46 (0.5%) |
| $10,000 to $24,999 | 1,386 (19.4%) | 220 (2.3%) |
| $25,000 to $34,999 | 634 (8.9%) | 546 (5.6%) |
| $35,000 to $49,999 | 1,054 (14.7%) | 529 (5.5%) |
| $50,000 to $74,999 | 1,368 (19.1%) | 823 (8.5%) |
| $75,000 to $99,999 | 702 (9.8%) | 1,334 (13.8%) |
| $100,000 to $149,999 | 850 (11.9%) | 1,653 (17.1%) |
| $150,000 or more | 737 (10.3%) | 2,541 (26.3%) |
| Total | 7,156 (100.0%) | 9,676 (100.0%) |
Property Value to Household Income Ratio in Autauga County
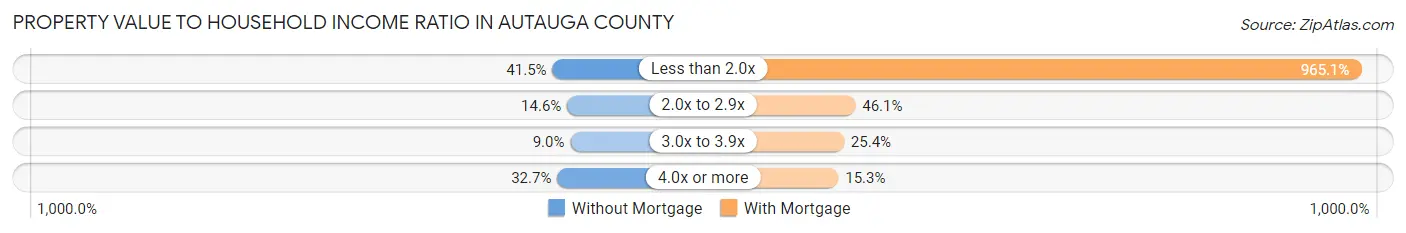
| Value-to-Income Ratio | Without Mortgage | With Mortgage |
| Less than 2.0x | 2,966 (41.4%) | 93,381 (965.1%) |
| 2.0x to 2.9x | 1,047 (14.6%) | 4,456 (46.1%) |
| 3.0x to 3.9x | 642 (9.0%) | 2,458 (25.4%) |
| 4.0x or more | 2,339 (32.7%) | 1,476 (15.2%) |
| Total | 7,156 (100.0%) | 9,676 (100.0%) |
Real Estate Taxes by Mortgage Status in Autauga County
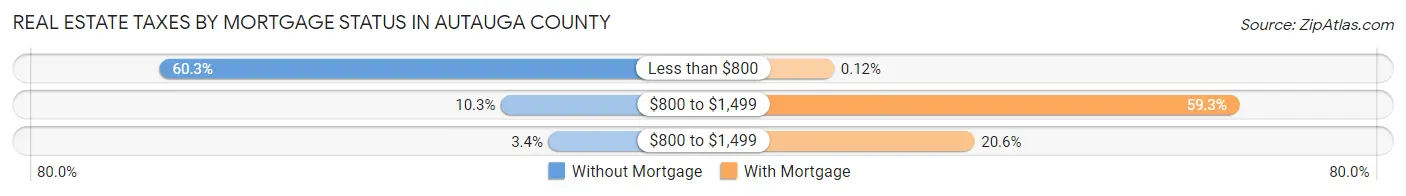
| Property Taxes | Without Mortgage | With Mortgage |
| Less than $800 | 4,313 (60.3%) | 12 (0.1%) |
| $800 to $1,499 | 740 (10.3%) | 5,736 (59.3%) |
| $800 to $1,499 | 244 (3.4%) | 1,997 (20.6%) |
| Total | 7,156 (100.0%) | 9,676 (100.0%) |
Health & Disability in Autauga County
Health Insurance Coverage by Age in Autauga County
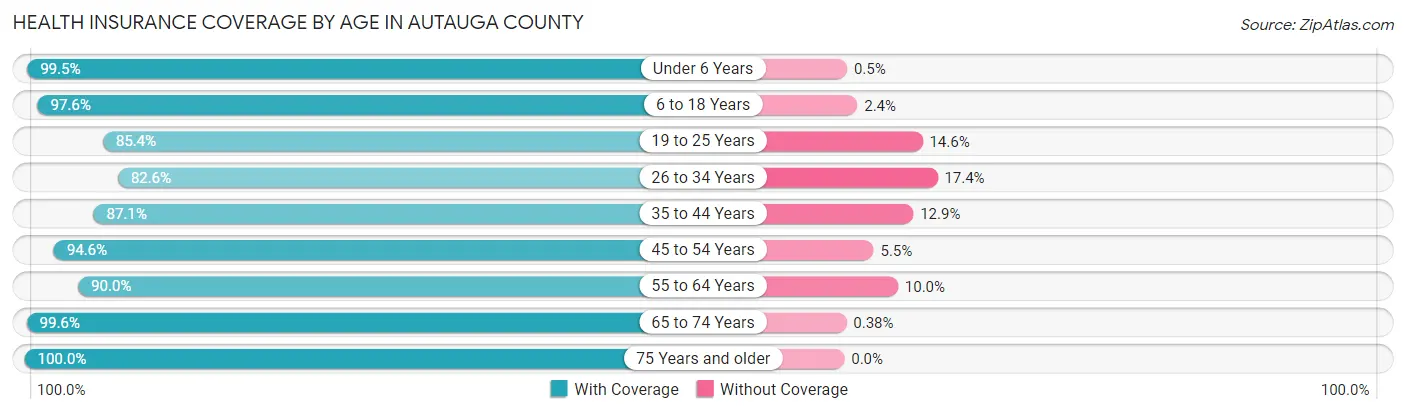
| Age Bracket | With Coverage | Without Coverage |
| Under 6 Years | 3,946 (99.5%) | 20 (0.5%) |
| 6 to 18 Years | 10,264 (97.6%) | 255 (2.4%) |
| 19 to 25 Years | 3,955 (85.4%) | 675 (14.6%) |
| 26 to 34 Years | 5,320 (82.6%) | 1,118 (17.4%) |
| 35 to 44 Years | 6,424 (87.1%) | 948 (12.9%) |
| 45 to 54 Years | 7,336 (94.6%) | 423 (5.4%) |
| 55 to 64 Years | 6,902 (90.0%) | 766 (10.0%) |
| 65 to 74 Years | 5,257 (99.6%) | 20 (0.4%) |
| 75 Years and older | 3,814 (100.0%) | 0 (0.0%) |
| Total | 53,218 (92.6%) | 4,225 (7.4%) |
Health Insurance Coverage by Citizenship Status in Autauga County
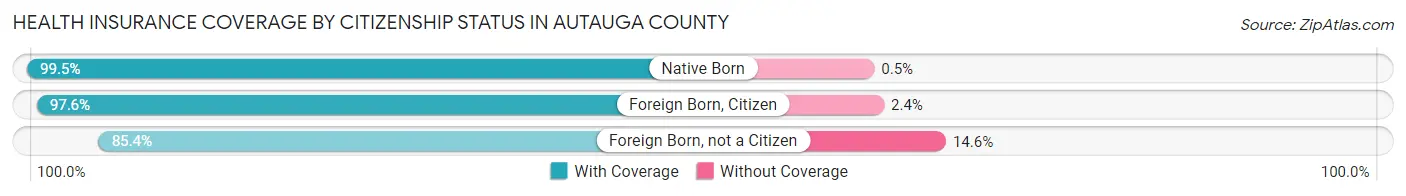
| Citizenship Status | With Coverage | Without Coverage |
| Native Born | 3,946 (99.5%) | 20 (0.5%) |
| Foreign Born, Citizen | 10,264 (97.6%) | 255 (2.4%) |
| Foreign Born, not a Citizen | 3,955 (85.4%) | 675 (14.6%) |
Health Insurance Coverage by Household Income in Autauga County
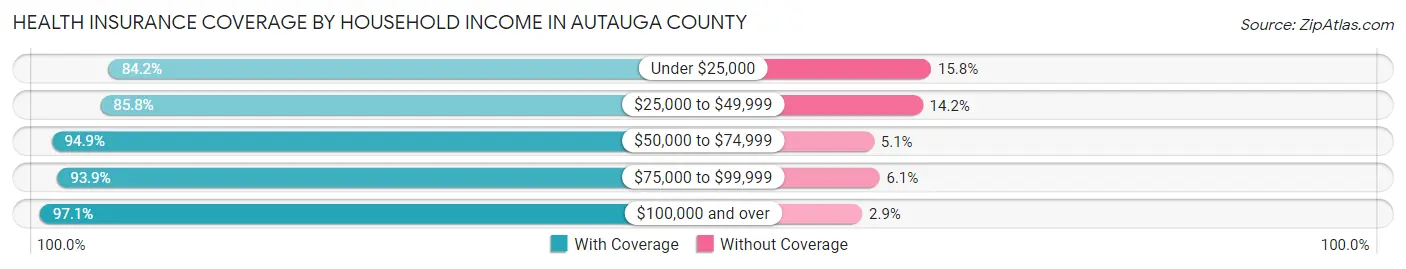
| Household Income | With Coverage | Without Coverage |
| Under $25,000 | 6,223 (84.2%) | 1,167 (15.8%) |
| $25,000 to $49,999 | 8,200 (85.8%) | 1,358 (14.2%) |
| $50,000 to $74,999 | 8,244 (94.9%) | 440 (5.1%) |
| $75,000 to $99,999 | 8,864 (93.9%) | 579 (6.1%) |
| $100,000 and over | 21,556 (97.1%) | 636 (2.9%) |
Public vs Private Health Insurance Coverage by Age in Autauga County
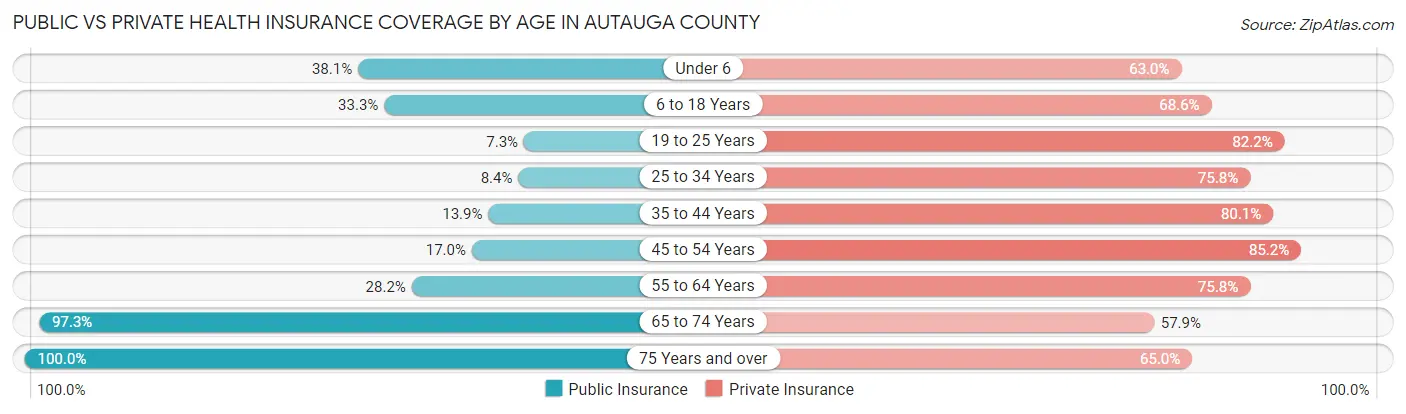
| Age Bracket | Public Insurance | Private Insurance |
| Under 6 | 1,512 (38.1%) | 2,499 (63.0%) |
| 6 to 18 Years | 3,499 (33.3%) | 7,216 (68.6%) |
| 19 to 25 Years | 339 (7.3%) | 3,804 (82.2%) |
| 25 to 34 Years | 539 (8.4%) | 4,878 (75.8%) |
| 35 to 44 Years | 1,027 (13.9%) | 5,901 (80.0%) |
| 45 to 54 Years | 1,319 (17.0%) | 6,614 (85.2%) |
| 55 to 64 Years | 2,159 (28.2%) | 5,811 (75.8%) |
| 65 to 74 Years | 5,136 (97.3%) | 3,056 (57.9%) |
| 75 Years and over | 3,814 (100.0%) | 2,480 (65.0%) |
| Total | 19,344 (33.7%) | 42,259 (73.6%) |
Disability Status by Sex by Age in Autauga County
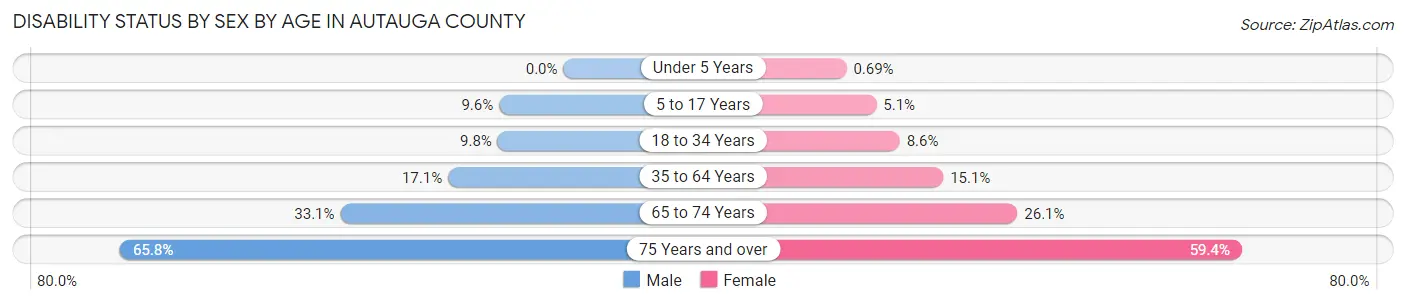
| Age Bracket | Male | Female |
| Under 5 Years | 0 (0.0%) | 11 (0.7%) |
| 5 to 17 Years | 494 (9.6%) | 268 (5.1%) |
| 18 to 34 Years | 561 (9.8%) | 519 (8.6%) |
| 35 to 64 Years | 1,876 (17.1%) | 1,784 (15.1%) |
| 65 to 74 Years | 805 (33.1%) | 742 (26.1%) |
| 75 Years and over | 1,023 (65.8%) | 1,342 (59.4%) |
Disability Class by Sex by Age in Autauga County
Disability Class: Hearing Difficulty
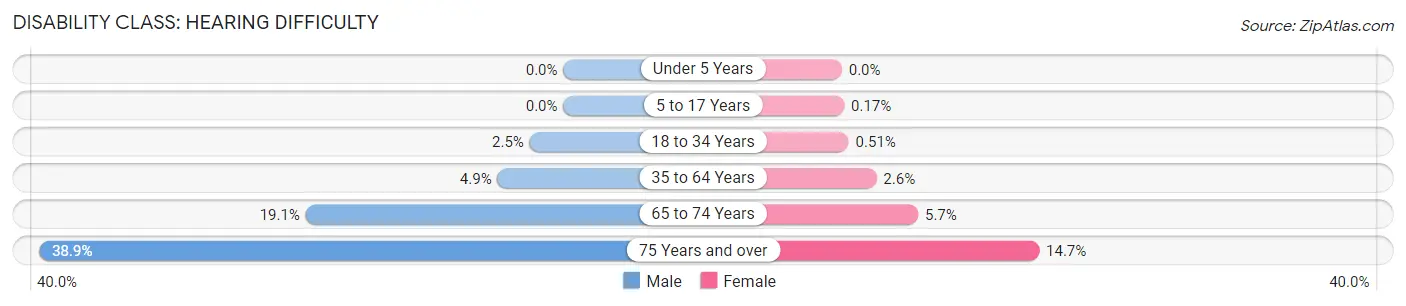
| Age Bracket | Male | Female |
| Under 5 Years | 0 (0.0%) | 0 (0.0%) |
| 5 to 17 Years | 0 (0.0%) | 9 (0.2%) |
| 18 to 34 Years | 144 (2.5%) | 31 (0.5%) |
| 35 to 64 Years | 535 (4.9%) | 304 (2.6%) |
| 65 to 74 Years | 465 (19.1%) | 161 (5.7%) |
| 75 Years and over | 605 (38.9%) | 331 (14.6%) |
Disability Class: Vision Difficulty
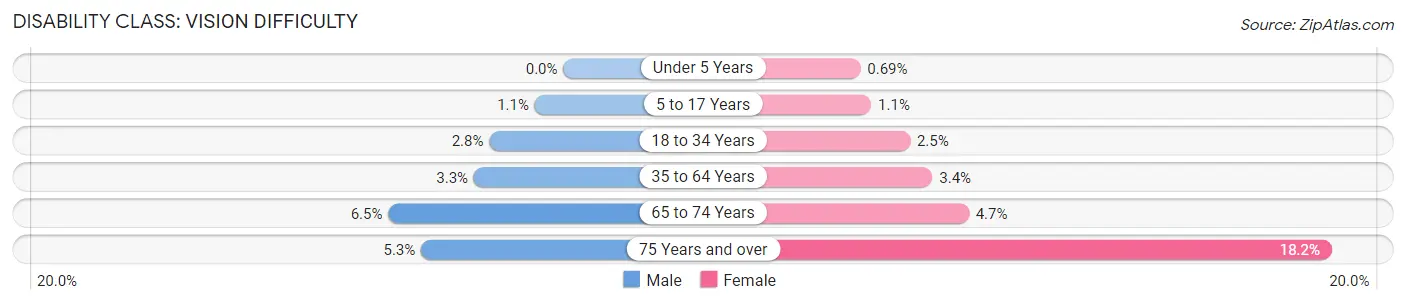
| Age Bracket | Male | Female |
| Under 5 Years | 0 (0.0%) | 11 (0.7%) |
| 5 to 17 Years | 55 (1.1%) | 57 (1.1%) |
| 18 to 34 Years | 158 (2.8%) | 153 (2.5%) |
| 35 to 64 Years | 364 (3.3%) | 398 (3.4%) |
| 65 to 74 Years | 158 (6.5%) | 134 (4.7%) |
| 75 Years and over | 82 (5.3%) | 411 (18.2%) |
Disability Class: Cognitive Difficulty
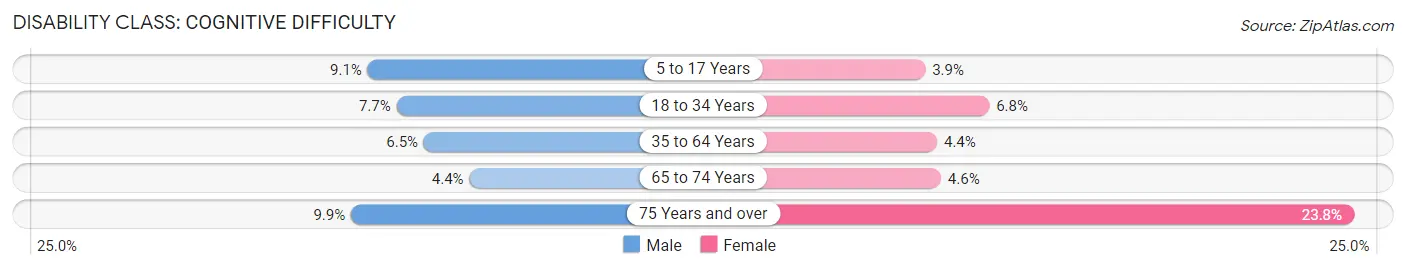
| Age Bracket | Male | Female |
| 5 to 17 Years | 470 (9.1%) | 202 (3.9%) |
| 18 to 34 Years | 445 (7.7%) | 413 (6.8%) |
| 35 to 64 Years | 708 (6.5%) | 524 (4.4%) |
| 65 to 74 Years | 106 (4.4%) | 131 (4.6%) |
| 75 Years and over | 153 (9.9%) | 537 (23.8%) |
Disability Class: Ambulatory Difficulty
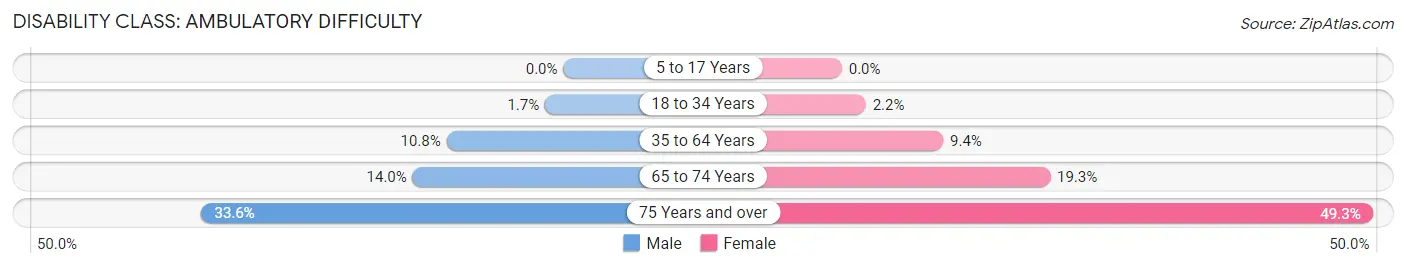
| Age Bracket | Male | Female |
| 5 to 17 Years | 0 (0.0%) | 0 (0.0%) |
| 18 to 34 Years | 98 (1.7%) | 134 (2.2%) |
| 35 to 64 Years | 1,187 (10.8%) | 1,114 (9.4%) |
| 65 to 74 Years | 340 (14.0%) | 550 (19.3%) |
| 75 Years and over | 522 (33.6%) | 1,113 (49.2%) |
Disability Class: Self-Care Difficulty
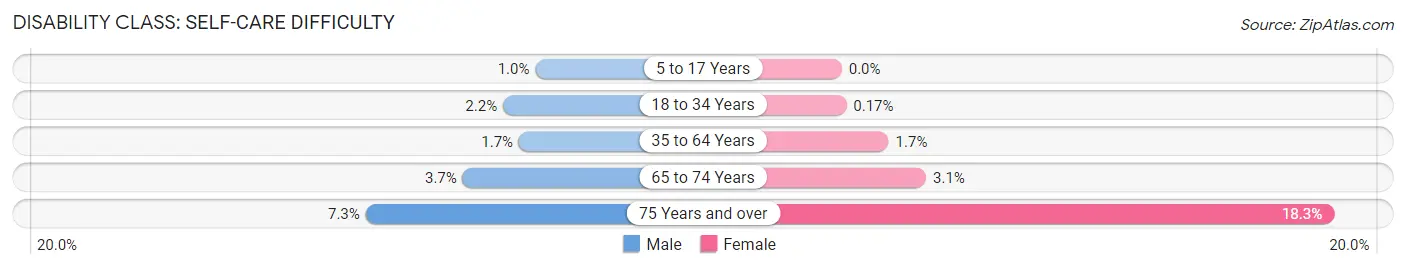
| Age Bracket | Male | Female |
| 5 to 17 Years | 54 (1.0%) | 0 (0.0%) |
| 18 to 34 Years | 129 (2.2%) | 10 (0.2%) |
| 35 to 64 Years | 181 (1.7%) | 206 (1.7%) |
| 65 to 74 Years | 91 (3.7%) | 89 (3.1%) |
| 75 Years and over | 114 (7.3%) | 413 (18.3%) |
Technology Access in Autauga County
Computing Device Access in Autauga County
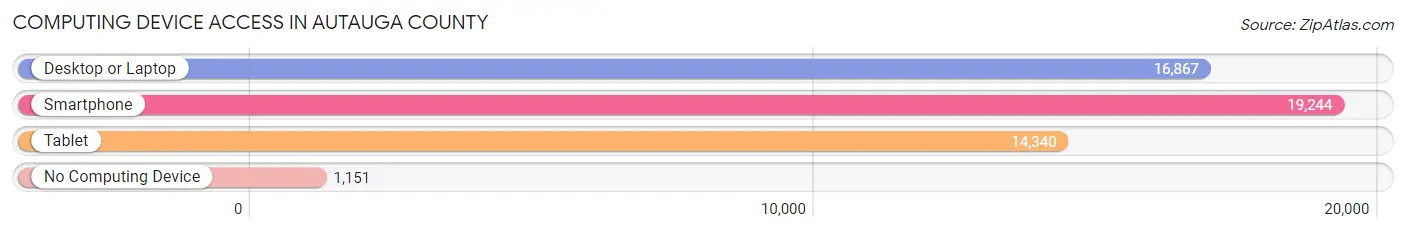
| Device Type | # Households | % Households |
| Desktop or Laptop | 16,867 | 75.6% |
| Smartphone | 19,244 | 86.3% |
| Tablet | 14,340 | 64.3% |
| No Computing Device | 1,151 | 5.2% |
| Total | 22,308 | 100.0% |
Internet Access in Autauga County
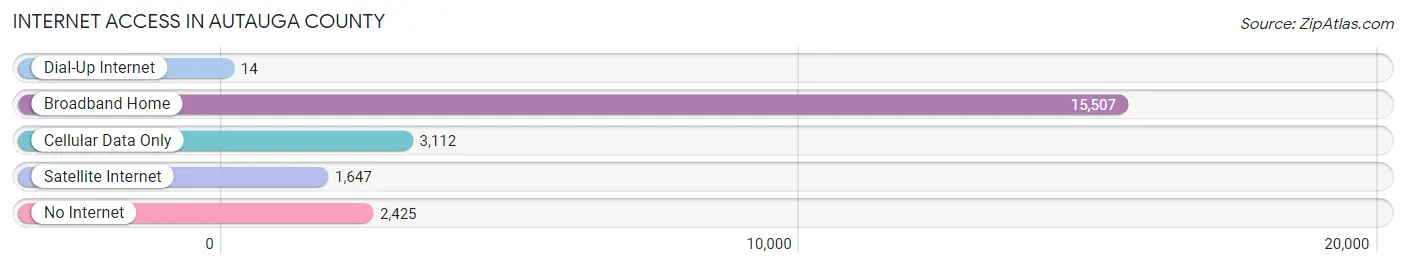
| Internet Type | # Households | % Households |
| Dial-Up Internet | 14 | 0.1% |
| Broadband Home | 15,507 | 69.5% |
| Cellular Data Only | 3,112 | 14.0% |
| Satellite Internet | 1,647 | 7.4% |
| No Internet | 2,425 | 10.9% |
| Total | 22,308 | 100.0% |
Autauga County Summary
Autauga County is located in the central part of the state of Alabama, in the United States. It is part of the Montgomery Metropolitan Statistical Area and is bordered by Elmore County to the north, Chilton County to the east, Dallas County to the south, and Lowndes County to the west. The county seat is Prattville, and the largest city is Prattville. As of the 2010 census, the population of Autauga County was 54,571.
History
Autauga County was established on November 21, 1818, by an act of the Alabama Territorial Legislature. It was named for the Autauga Creek, which runs through the county. The creek was named for the Autauga Indians, a Muscogee tribe who lived in the area before European settlement.
The first settlers in Autauga County were mostly Scots-Irish immigrants who arrived in the early 19th century. The county was largely agricultural, with cotton being the primary crop. During the Civil War, Autauga County was a major supplier of food and other supplies to the Confederate Army.
Geography
Autauga County is located in the central part of Alabama, in the Black Belt region. It is bordered by Elmore County to the north, Chilton County to the east, Dallas County to the south, and Lowndes County to the west. The county has a total area of 602 square miles, of which 599 square miles is land and 3 square miles is water.
The county is mostly flat, with some rolling hills in the northern part. The Autauga Creek runs through the county, and there are several small lakes and ponds. The county is part of the Alabama River watershed.
Economy
The economy of Autauga County is largely based on agriculture. Cotton is the primary crop, followed by soybeans, corn, and peanuts. The county also has a thriving timber industry, and there are several poultry farms in the area.
The county is home to several manufacturing companies, including Prattville Manufacturing, which produces automotive parts, and Autauga Plastics, which produces plastic products. The county also has a growing tourism industry, with several attractions, such as the Robert Trent Jones Golf Trail at Capitol Hill and the Autauga County Historical Museum.
Demographics
As of the 2010 census, there were 54,571 people, 20,845 households, and 14,845 families living in Autauga County. The population density was 91 people per square mile. The racial makeup of the county was 73.3% White, 24.2% Black or African American, 0.3% Native American, 0.7% Asian, 0.1% Pacific Islander, 0.6% from other races, and 0.8% from two or more races. 1.7% of the population were Hispanic or Latino of any race.
The median income for a household in Autauga County was $45,945, and the median income for a family was $54,945. The per capita income for the county was $22,945. About 11.3% of families and 14.2% of the population were below the poverty line, including 19.2% of those under age 18 and 11.2% of those age 65 or over.
Common Questions
What is Per Capita Income in Autauga County?
Per Capita income in Autauga County is $35,332.
What is the Median Family Income in Autauga County?
Median Family Income in Autauga County is $83,790.
What is the Median Household income in Autauga County?
Median Household Income in Autauga County is $68,315.
What is Income or Wage Gap in Autauga County?
Income or Wage Gap in Autauga County is 39.0%.
Women in Autauga County earn 61.0 cents for every dollar earned by a man.
What is Family Income Deficit in Autauga County?
Family Income Deficit in Autauga County is $11,230.
Families that are below poverty line in Autauga County earn $11,230 less on average than the poverty threshold level.
What is Inequality or Gini Index in Autauga County?
Inequality or Gini Index in Autauga County is 0.45.
What is the Total Population of Autauga County?
Total Population of Autauga County is 58,761.
What is the Total Male Population of Autauga County?
Total Male Population of Autauga County is 28,663.
What is the Total Female Population of Autauga County?
Total Female Population of Autauga County is 30,098.
What is the Ratio of Males per 100 Females in Autauga County?
There are 95.23 Males per 100 Females in Autauga County.
What is the Ratio of Females per 100 Males in Autauga County?
There are 105.01 Females per 100 Males in Autauga County.
What is the Median Population Age in Autauga County?
Median Population Age in Autauga County is 39.0 Years.
What is the Average Family Size in Autauga County
Average Family Size in Autauga County is 3.2 People.
What is the Average Household Size in Autauga County
Average Household Size in Autauga County is 2.6 People.
How Large is the Labor Force in Autauga County?
There are 28,099 People in the Labor Forcein in Autauga County.
What is the Percentage of People in the Labor Force in Autauga County?
59.6% of People are in the Labor Force in Autauga County.
What is the Unemployment Rate in Autauga County?
Unemployment Rate in Autauga County is 2.8%.