Jackson County, AL Map & Demographics
Jackson County Map
Jackson County Overview
$27,695
PER CAPITA INCOME
$59,400
AVG FAMILY INCOME
$46,748
AVG HOUSEHOLD INCOME
34.8%
WAGE / INCOME GAP [ % ]
65.2¢/ $1
WAGE / INCOME GAP [ $ ]
$8,952
FAMILY INCOME DEFICIT
0.46
INEQUALITY / GINI INDEX
52,618
TOTAL POPULATION
25,883
MALE POPULATION
26,735
FEMALE POPULATION
96.81
MALES / 100 FEMALES
103.29
FEMALES / 100 MALES
43.0
MEDIAN AGE
3.1
AVG FAMILY SIZE
2.5
AVG HOUSEHOLD SIZE
21,729
LABOR FORCE [ PEOPLE ]
50.5%
PERCENT IN LABOR FORCE
6.0%
UNEMPLOYMENT RATE
Jackson County Area Codes
Income in Jackson County
Income Overview in Jackson County
Per Capita Income in Jackson County is $27,695, while median incomes of families and households are $59,400 and $46,748 respectively.
| Characteristic | Number | Measure |
| Per Capita Income | 52,618 | $27,695 |
| Median Family Income | 13,916 | $59,400 |
| Mean Family Income | 13,916 | $77,535 |
| Median Household Income | 20,670 | $46,748 |
| Mean Household Income | 20,670 | $65,829 |
| Income Deficit | 13,916 | $8,952 |
| Wage / Income Gap (%) | 52,618 | 34.78% |
| Wage / Income Gap ($) | 52,618 | 65.22¢ per $1 |
| Gini / Inequality Index | 52,618 | 0.46 |
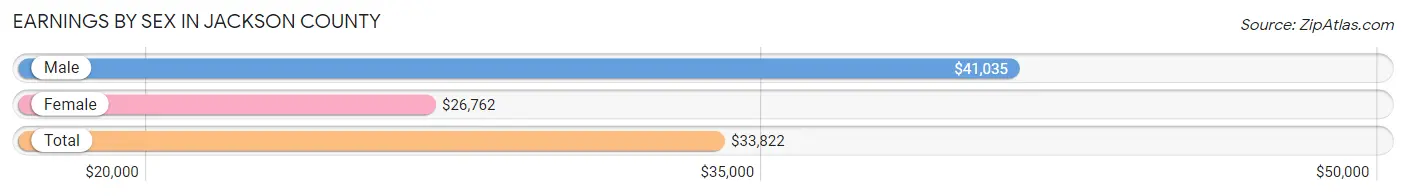
Earnings by Sex in Jackson County
Average Earnings in Jackson County are $33,822, $41,035 for men and $26,762 for women, a difference of 34.8%.
| Sex | Number | Average Earnings |
| Male | 12,483 (54.9%) | $41,035 |
| Female | 10,257 (45.1%) | $26,762 |
| Total | 22,740 (100.0%) | $33,822 |
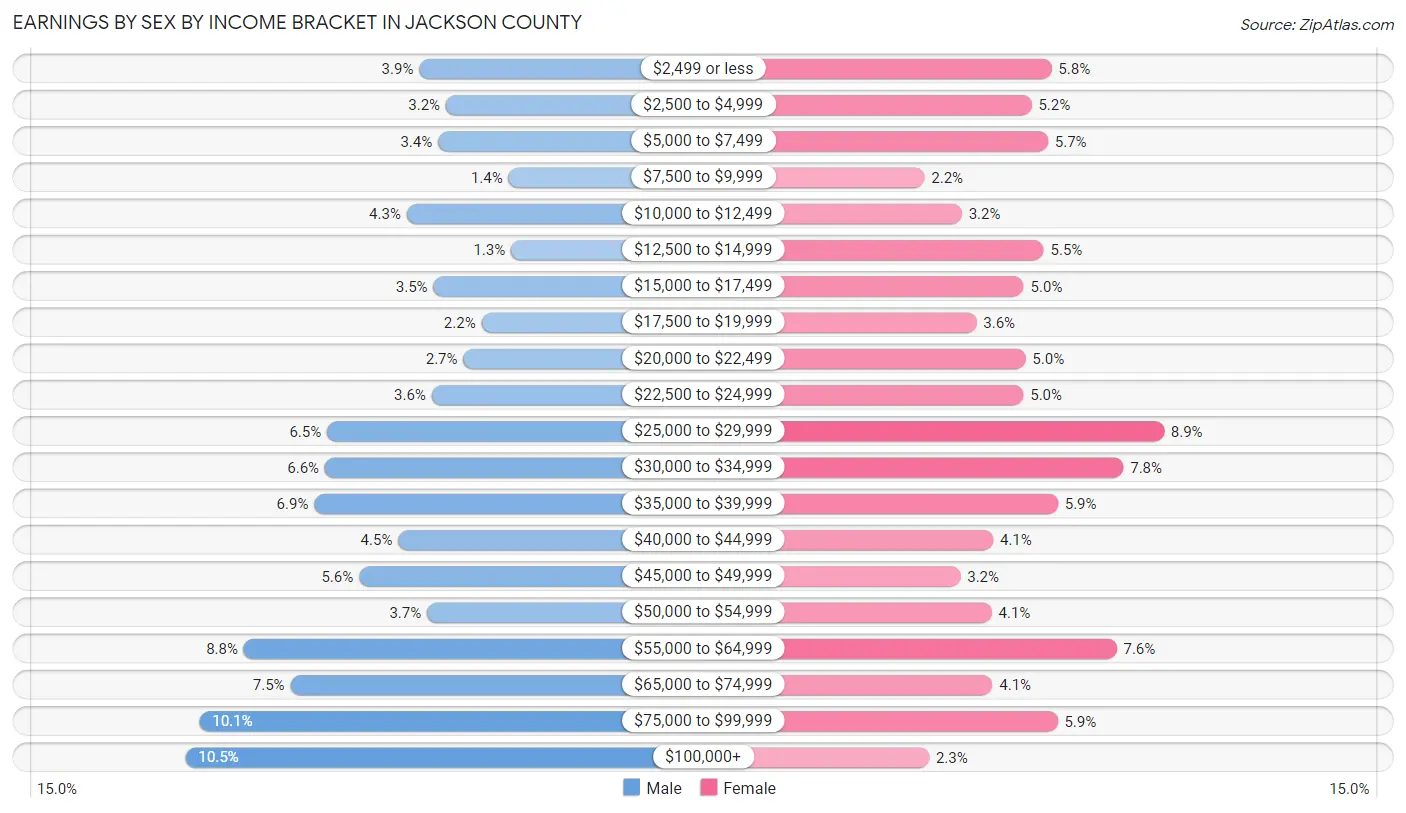
Earnings by Sex by Income Bracket in Jackson County
The most common earnings brackets in Jackson County are $100,000+ for men (1,308 | 10.5%) and $25,000 to $29,999 for women (914 | 8.9%).
| Income | Male | Female |
| $2,499 or less | 488 (3.9%) | 590 (5.8%) |
| $2,500 to $4,999 | 395 (3.2%) | 532 (5.2%) |
| $5,000 to $7,499 | 422 (3.4%) | 580 (5.7%) |
| $7,500 to $9,999 | 175 (1.4%) | 224 (2.2%) |
| $10,000 to $12,499 | 532 (4.3%) | 331 (3.2%) |
| $12,500 to $14,999 | 166 (1.3%) | 567 (5.5%) |
| $15,000 to $17,499 | 438 (3.5%) | 510 (5.0%) |
| $17,500 to $19,999 | 270 (2.2%) | 373 (3.6%) |
| $20,000 to $22,499 | 333 (2.7%) | 515 (5.0%) |
| $22,500 to $24,999 | 444 (3.6%) | 509 (5.0%) |
| $25,000 to $29,999 | 812 (6.5%) | 914 (8.9%) |
| $30,000 to $34,999 | 819 (6.6%) | 797 (7.8%) |
| $35,000 to $39,999 | 856 (6.9%) | 608 (5.9%) |
| $40,000 to $44,999 | 562 (4.5%) | 422 (4.1%) |
| $45,000 to $49,999 | 699 (5.6%) | 327 (3.2%) |
| $50,000 to $54,999 | 460 (3.7%) | 417 (4.1%) |
| $55,000 to $64,999 | 1,104 (8.8%) | 777 (7.6%) |
| $65,000 to $74,999 | 940 (7.5%) | 420 (4.1%) |
| $75,000 to $99,999 | 1,260 (10.1%) | 607 (5.9%) |
| $100,000+ | 1,308 (10.5%) | 237 (2.3%) |
| Total | 12,483 (100.0%) | 10,257 (100.0%) |
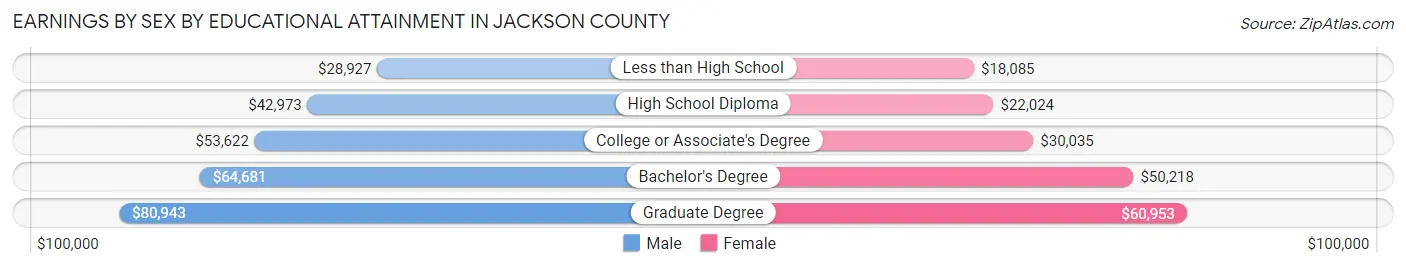
Earnings by Sex by Educational Attainment in Jackson County
Average earnings in Jackson County are $46,007 for men and $30,186 for women, a difference of 34.4%. Men with an educational attainment of graduate degree enjoy the highest average annual earnings of $80,943, while those with less than high school education earn the least with $28,927. Women with an educational attainment of graduate degree earn the most with the average annual earnings of $60,953, while those with less than high school education have the smallest earnings of $18,085.
| Educational Attainment | Male Income | Female Income |
| Less than High School | $28,927 | $18,085 |
| High School Diploma | $42,973 | $22,024 |
| College or Associate's Degree | $53,622 | $30,035 |
| Bachelor's Degree | $64,681 | $50,218 |
| Graduate Degree | $80,943 | $60,953 |
| Total | $46,007 | $30,186 |
Family Income in Jackson County
Family Income Brackets in Jackson County
According to the Jackson County family income data, there are 2,296 families falling into the $50,000 to $74,999 income range, which is the most common income bracket and makes up 16.5% of all families. Conversely, the less than $10,000 income bracket is the least frequent group with only 473 families (3.4%) belonging to this category.
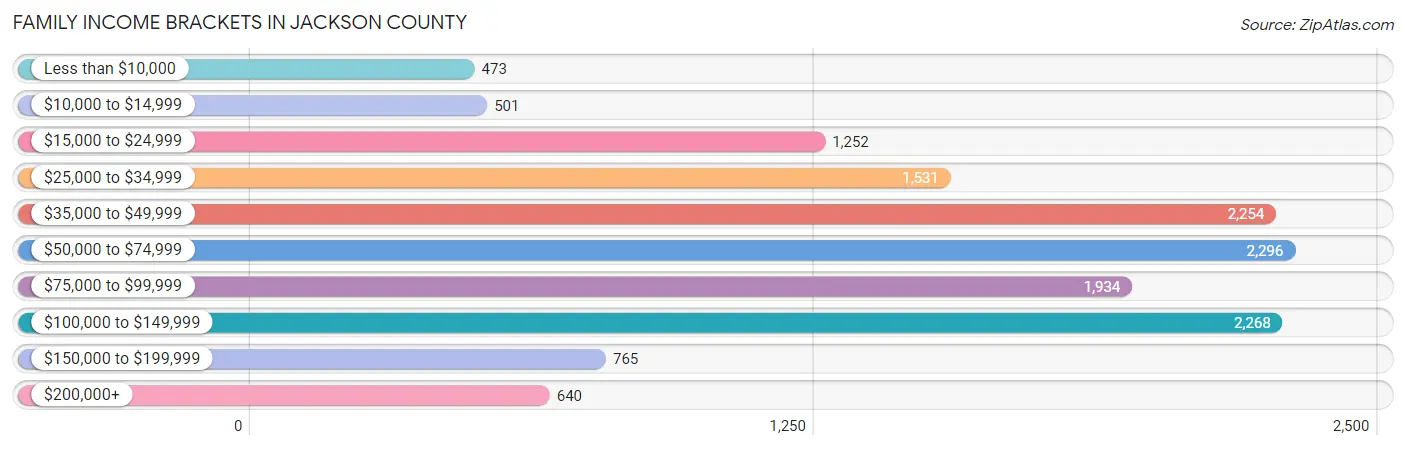
| Income Bracket | # Families | % Families |
| Less than $10,000 | 473 | 3.4% |
| $10,000 to $14,999 | 501 | 3.6% |
| $15,000 to $24,999 | 1,252 | 9.0% |
| $25,000 to $34,999 | 1,531 | 11.0% |
| $35,000 to $49,999 | 2,254 | 16.2% |
| $50,000 to $74,999 | 2,296 | 16.5% |
| $75,000 to $99,999 | 1,934 | 13.9% |
| $100,000 to $149,999 | 2,268 | 16.3% |
| $150,000 to $199,999 | 765 | 5.5% |
| $200,000+ | 640 | 4.6% |
Family Income by Famaliy Size in Jackson County
6-person families (227 | 1.6%) account for the highest median family income in Jackson County with $99,464 per family, while 2-person families (7,460 | 53.6%) have the highest median income of $26,364 per family member.
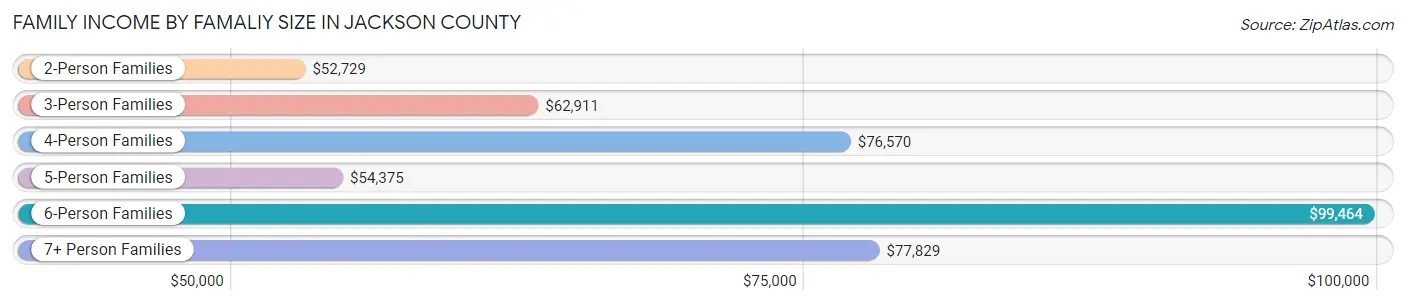
| Income Bracket | # Families | Median Income |
| 2-Person Families | 7,460 (53.6%) | $52,729 |
| 3-Person Families | 2,903 (20.9%) | $62,911 |
| 4-Person Families | 2,152 (15.5%) | $76,570 |
| 5-Person Families | 1,117 (8.0%) | $54,375 |
| 6-Person Families | 227 (1.6%) | $99,464 |
| 7+ Person Families | 57 (0.4%) | $77,829 |
| Total | 13,916 (100.0%) | $59,400 |
Family Income by Number of Earners in Jackson County
The median family income in Jackson County is $59,400, with families comprising 3+ earners (716) having the highest median family income of $110,833, while families with no earners (3,147) have the lowest median family income of $32,391, accounting for 5.1% and 22.6% of families, respectively.
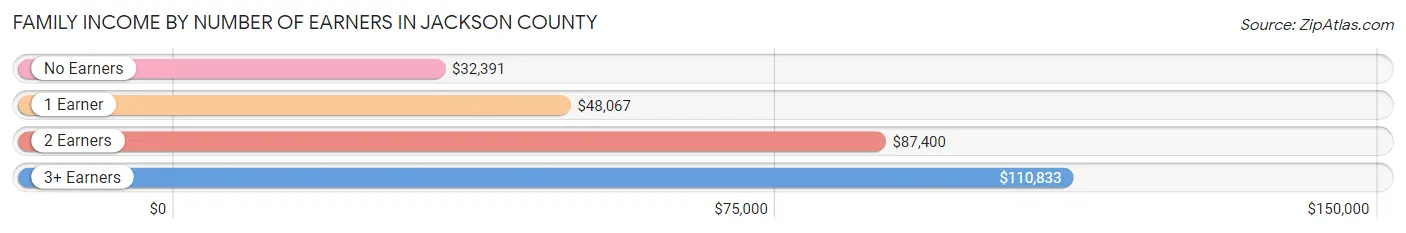
| Number of Earners | # Families | Median Income |
| No Earners | 3,147 (22.6%) | $32,391 |
| 1 Earner | 5,266 (37.8%) | $48,067 |
| 2 Earners | 4,787 (34.4%) | $87,400 |
| 3+ Earners | 716 (5.1%) | $110,833 |
| Total | 13,916 (100.0%) | $59,400 |
Household Income in Jackson County
Household Income Brackets in Jackson County
With 3,183 households falling in the category, the $50,000 to $74,999 income range is the most frequent in Jackson County, accounting for 15.4% of all households. In contrast, only 723 households (3.5%) fall into the $200,000+ income bracket, making it the least populous group.
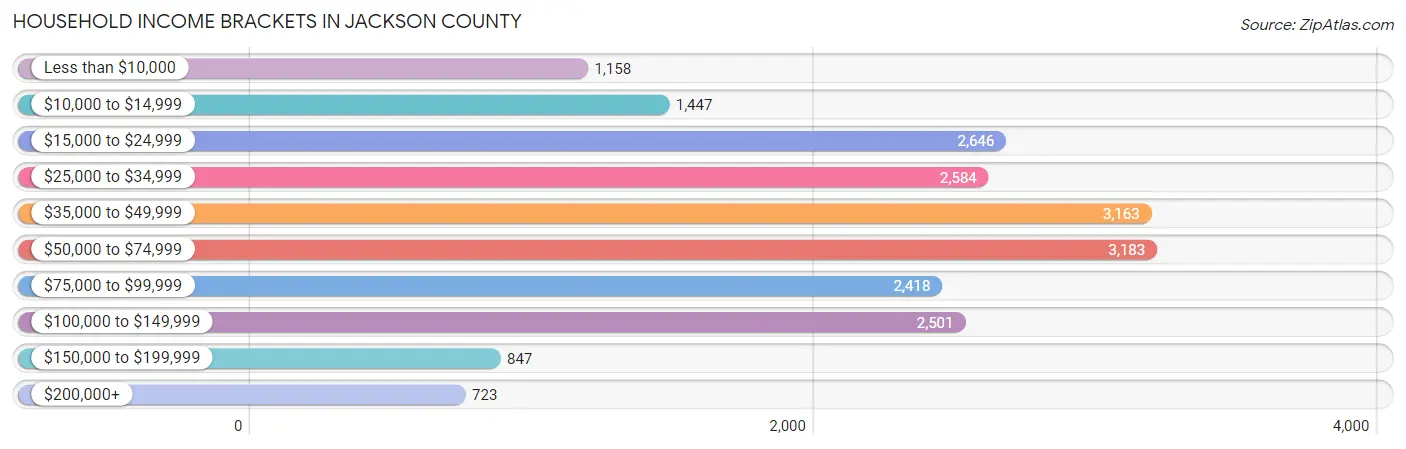
| Income Bracket | # Households | % Households |
| Less than $10,000 | 1,158 | 5.6% |
| $10,000 to $14,999 | 1,447 | 7.0% |
| $15,000 to $24,999 | 2,646 | 12.8% |
| $25,000 to $34,999 | 2,584 | 12.5% |
| $35,000 to $49,999 | 3,163 | 15.3% |
| $50,000 to $74,999 | 3,183 | 15.4% |
| $75,000 to $99,999 | 2,418 | 11.7% |
| $100,000 to $149,999 | 2,501 | 12.1% |
| $150,000 to $199,999 | 847 | 4.1% |
| $200,000+ | 723 | 3.5% |
Household Income by Householder Age in Jackson County
The median household income in Jackson County is $46,748, with the highest median household income of $57,699 found in the 45 to 64 years age bracket for the primary householder. A total of 7,974 households (38.6%) fall into this category. Meanwhile, the 15 to 24 years age bracket for the primary householder has the lowest median household income of $37,457, with 563 households (2.7%) in this group.
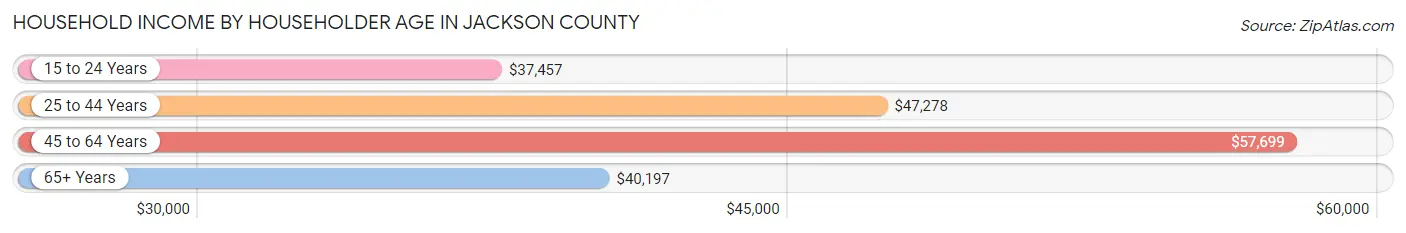
| Income Bracket | # Households | Median Income |
| 15 to 24 Years | 563 (2.7%) | $37,457 |
| 25 to 44 Years | 5,548 (26.8%) | $47,278 |
| 45 to 64 Years | 7,974 (38.6%) | $57,699 |
| 65+ Years | 6,585 (31.9%) | $40,197 |
| Total | 20,670 (100.0%) | $46,748 |
Poverty in Jackson County
Income Below Poverty by Sex and Age in Jackson County
With 16.7% poverty level for males and 20.4% for females among the residents of Jackson County, under 5 year old males and 12 to 14 year old females are the most vulnerable to poverty, with 555 males (42.7%) and 338 females (33.6%) in their respective age groups living below the poverty level.
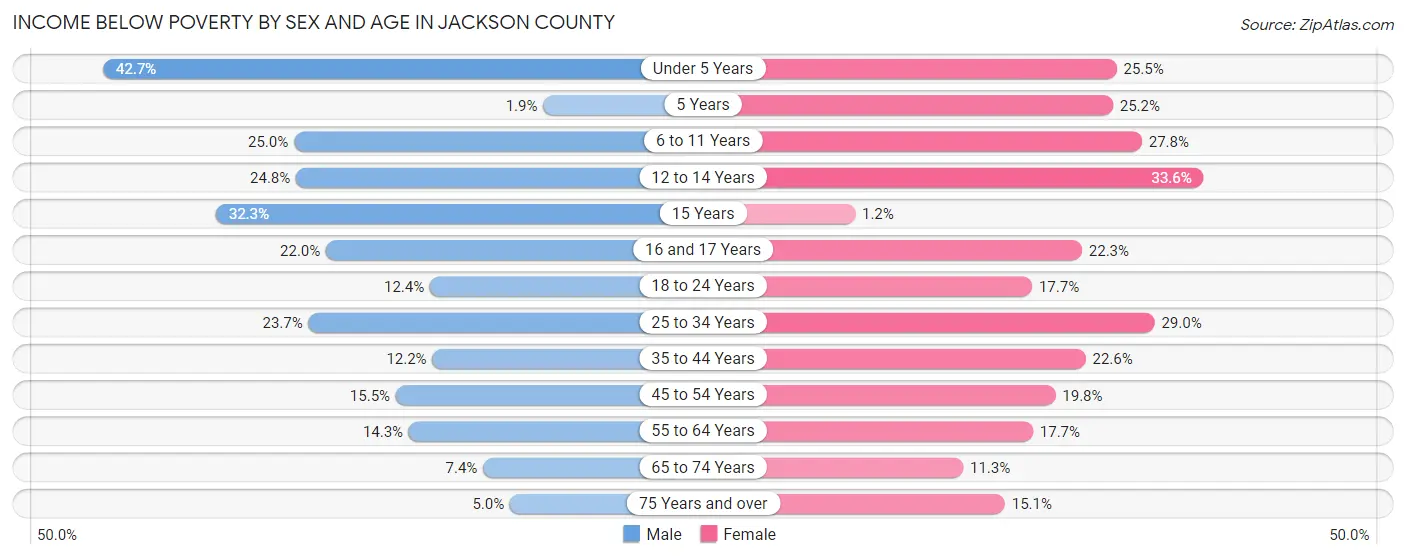
| Age Bracket | Male | Female |
| Under 5 Years | 555 (42.7%) | 321 (25.5%) |
| 5 Years | 4 (1.9%) | 82 (25.2%) |
| 6 to 11 Years | 421 (25.0%) | 486 (27.8%) |
| 12 to 14 Years | 315 (24.8%) | 338 (33.6%) |
| 15 Years | 119 (32.3%) | 4 (1.2%) |
| 16 and 17 Years | 142 (22.0%) | 137 (22.3%) |
| 18 to 24 Years | 244 (12.4%) | 345 (17.6%) |
| 25 to 34 Years | 703 (23.6%) | 856 (29.0%) |
| 35 to 44 Years | 380 (12.1%) | 744 (22.6%) |
| 45 to 54 Years | 547 (15.5%) | 677 (19.8%) |
| 55 to 64 Years | 540 (14.3%) | 665 (17.7%) |
| 65 to 74 Years | 224 (7.4%) | 379 (11.3%) |
| 75 Years and over | 85 (5.0%) | 367 (15.1%) |
| Total | 4,279 (16.7%) | 5,401 (20.4%) |
Income Above Poverty by Sex and Age in Jackson County
According to the poverty statistics in Jackson County, males aged 5 years and females aged 15 years are the age groups that are most secure financially, with 98.1% of males and 98.8% of females in these age groups living above the poverty line.
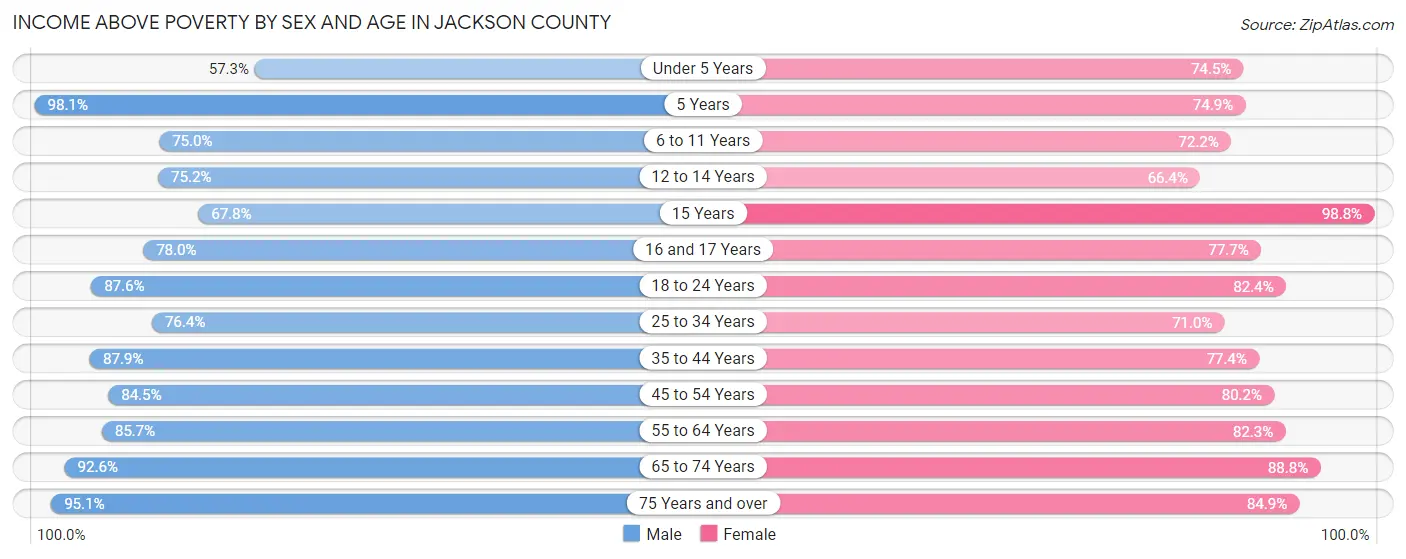
| Age Bracket | Male | Female |
| Under 5 Years | 744 (57.3%) | 938 (74.5%) |
| 5 Years | 211 (98.1%) | 244 (74.9%) |
| 6 to 11 Years | 1,264 (75.0%) | 1,260 (72.2%) |
| 12 to 14 Years | 955 (75.2%) | 669 (66.4%) |
| 15 Years | 250 (67.7%) | 322 (98.8%) |
| 16 and 17 Years | 503 (78.0%) | 478 (77.7%) |
| 18 to 24 Years | 1,729 (87.6%) | 1,610 (82.4%) |
| 25 to 34 Years | 2,270 (76.3%) | 2,094 (71.0%) |
| 35 to 44 Years | 2,747 (87.8%) | 2,545 (77.4%) |
| 45 to 54 Years | 2,972 (84.5%) | 2,738 (80.2%) |
| 55 to 64 Years | 3,229 (85.7%) | 3,086 (82.3%) |
| 65 to 74 Years | 2,788 (92.6%) | 2,991 (88.7%) |
| 75 Years and over | 1,633 (95.1%) | 2,058 (84.9%) |
| Total | 21,295 (83.3%) | 21,033 (79.6%) |
Income Below Poverty Among Married-Couple Families in Jackson County
The poverty statistics for married-couple families in Jackson County show that 7.9% or 818 of the total 10,347 families live below the poverty line. Families with 3 or 4 children have the highest poverty rate of 17.4%, comprising of 130 families. On the other hand, families with no children have the lowest poverty rate of 6.3%, which includes 416 families.
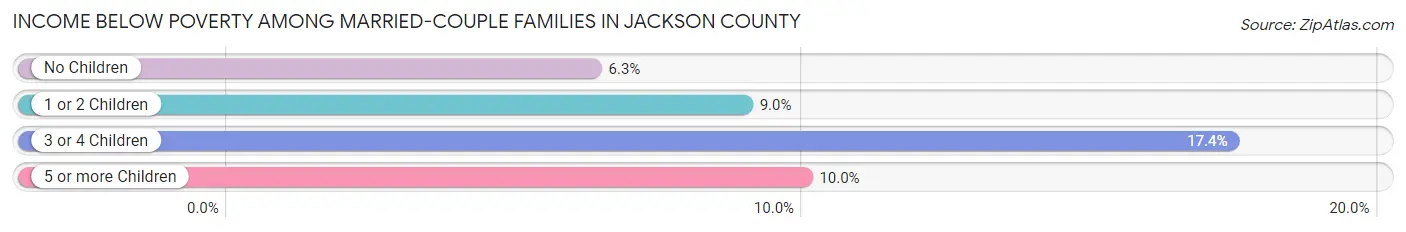
| Children | Above Poverty | Below Poverty |
| No Children | 6,151 (93.7%) | 416 (6.3%) |
| 1 or 2 Children | 2,744 (91.0%) | 270 (9.0%) |
| 3 or 4 Children | 616 (82.6%) | 130 (17.4%) |
| 5 or more Children | 18 (90.0%) | 2 (10.0%) |
| Total | 9,529 (92.1%) | 818 (7.9%) |
Income Below Poverty Among Single-Parent Households in Jackson County
According to the poverty data in Jackson County, 18.0% or 202 single-father households and 41.3% or 1,010 single-mother households are living below the poverty line. Among single-father households, those with 3 or 4 children have the highest poverty rate, with 66 households (84.6%) experiencing poverty. Likewise, among single-mother households, those with 3 or 4 children have the highest poverty rate, with 217 households (91.9%) falling below the poverty line.
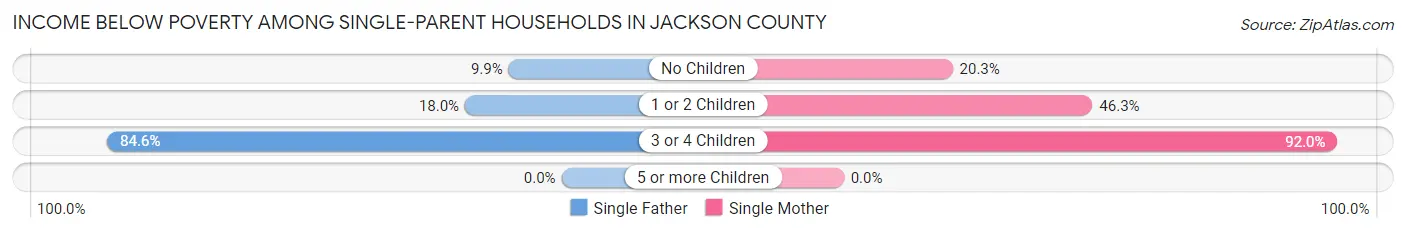
| Children | Single Father | Single Mother |
| No Children | 63 (9.9%) | 180 (20.3%) |
| 1 or 2 Children | 73 (18.0%) | 613 (46.3%) |
| 3 or 4 Children | 66 (84.6%) | 217 (91.9%) |
| 5 or more Children | 0 (0.0%) | 0 (0.0%) |
| Total | 202 (18.0%) | 1,010 (41.3%) |
Income Below Poverty Among Married-Couple vs Single-Parent Households in Jackson County
The poverty data for Jackson County shows that 818 of the married-couple family households (7.9%) and 1,212 of the single-parent households (34.0%) are living below the poverty level. Within the married-couple family households, those with 3 or 4 children have the highest poverty rate, with 130 households (17.4%) falling below the poverty line. Among the single-parent households, those with 3 or 4 children have the highest poverty rate, with 283 household (90.1%) living below poverty.
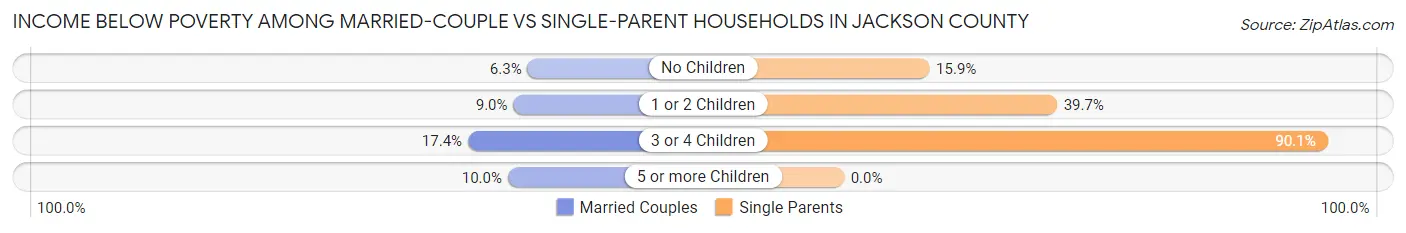
| Children | Married-Couple Families | Single-Parent Households |
| No Children | 416 (6.3%) | 243 (15.9%) |
| 1 or 2 Children | 270 (9.0%) | 686 (39.7%) |
| 3 or 4 Children | 130 (17.4%) | 283 (90.1%) |
| 5 or more Children | 2 (10.0%) | 0 (0.0%) |
| Total | 818 (7.9%) | 1,212 (34.0%) |
Race in Jackson County
The most populous races in Jackson County are White / Caucasian (47,208 | 89.7%), Two or more Races (2,104 | 4.0%), and Black / African American (1,731 | 3.3%).
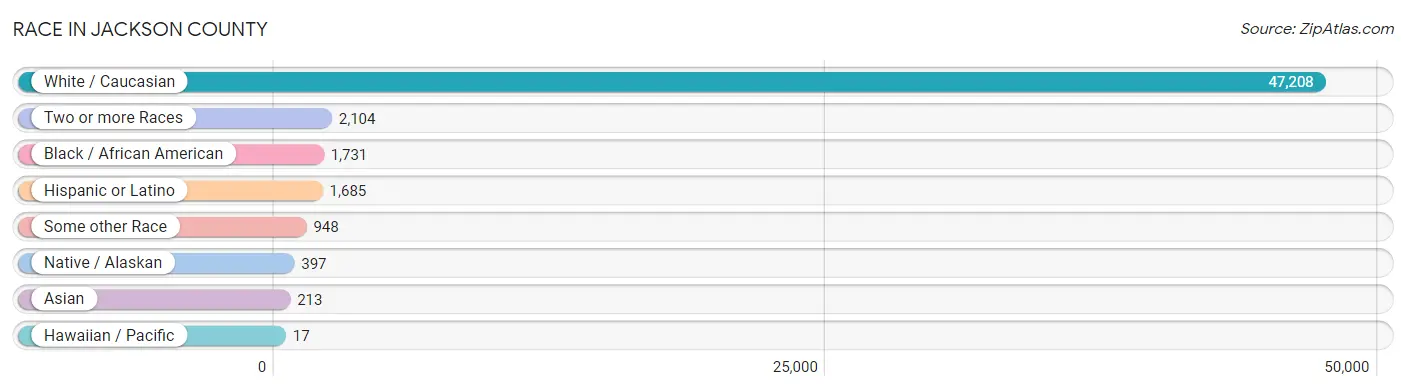
| Race | # Population | % Population |
| Asian | 213 | 0.4% |
| Black / African American | 1,731 | 3.3% |
| Hawaiian / Pacific | 17 | 0.0% |
| Hispanic or Latino | 1,685 | 3.2% |
| Native / Alaskan | 397 | 0.7% |
| White / Caucasian | 47,208 | 89.7% |
| Two or more Races | 2,104 | 4.0% |
| Some other Race | 948 | 1.8% |
| Total | 52,618 | 100.0% |
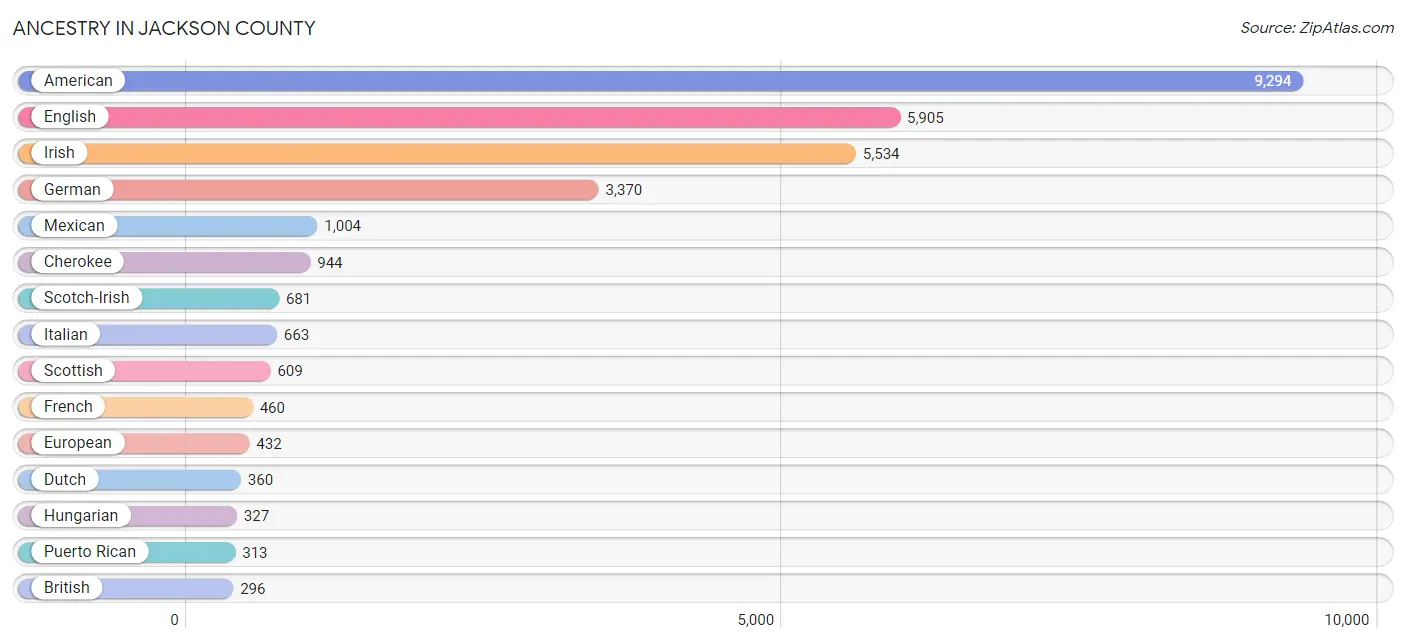
Ancestry in Jackson County
The most populous ancestries reported in Jackson County are American (9,294 | 17.7%), English (5,905 | 11.2%), Irish (5,534 | 10.5%), German (3,370 | 6.4%), and Mexican (1,004 | 1.9%), together accounting for 47.7% of all Jackson County residents.
| Ancestry | # Population | % Population |
| African | 233 | 0.4% |
| American | 9,294 | 17.7% |
| Apache | 3 | 0.0% |
| Arab | 82 | 0.2% |
| Austrian | 53 | 0.1% |
| Belgian | 12 | 0.0% |
| Bhutanese | 39 | 0.1% |
| Blackfeet | 10 | 0.0% |
| British | 296 | 0.6% |
| Burmese | 69 | 0.1% |
| Cajun | 22 | 0.0% |
| Canadian | 17 | 0.0% |
| Celtic | 6 | 0.0% |
| Central American | 264 | 0.5% |
| Cherokee | 944 | 1.8% |
| Chilean | 63 | 0.1% |
| Choctaw | 59 | 0.1% |
| Creek | 27 | 0.1% |
| Croatian | 2 | 0.0% |
| Crow | 6 | 0.0% |
| Czech | 23 | 0.0% |
| Czechoslovakian | 2 | 0.0% |
| Danish | 10 | 0.0% |
| Dutch | 360 | 0.7% |
| Dutch West Indian | 2 | 0.0% |
| Eastern European | 81 | 0.2% |
| English | 5,905 | 11.2% |
| European | 432 | 0.8% |
| Finnish | 22 | 0.0% |
| French | 460 | 0.9% |
| French Canadian | 66 | 0.1% |
| German | 3,370 | 6.4% |
| Greek | 15 | 0.0% |
| Guatemalan | 262 | 0.5% |
| Hopi | 1 | 0.0% |
| Hungarian | 327 | 0.6% |
| Indian (Asian) | 9 | 0.0% |
| Iranian | 2 | 0.0% |
| Irish | 5,534 | 10.5% |
| Iroquois | 3 | 0.0% |
| Italian | 663 | 1.3% |
| Jamaican | 65 | 0.1% |
| Korean | 91 | 0.2% |
| Lebanese | 80 | 0.2% |
| Mexican | 1,004 | 1.9% |
| Native Hawaiian | 15 | 0.0% |
| New Zealander | 11 | 0.0% |
| Nigerian | 20 | 0.0% |
| Northern European | 11 | 0.0% |
| Norwegian | 84 | 0.2% |
| Pakistani | 50 | 0.1% |
| Panamanian | 2 | 0.0% |
| Polish | 111 | 0.2% |
| Portuguese | 47 | 0.1% |
| Puerto Rican | 313 | 0.6% |
| Russian | 17 | 0.0% |
| Scandinavian | 117 | 0.2% |
| Scotch-Irish | 681 | 1.3% |
| Scottish | 609 | 1.2% |
| Sioux | 12 | 0.0% |
| Slavic | 8 | 0.0% |
| Slovak | 37 | 0.1% |
| South American | 63 | 0.1% |
| Spaniard | 7 | 0.0% |
| Spanish | 29 | 0.1% |
| Sri Lankan | 98 | 0.2% |
| Subsaharan African | 281 | 0.5% |
| Swedish | 79 | 0.2% |
| Vietnamese | 4 | 0.0% |
| Welsh | 128 | 0.2% | View All 70 Rows |
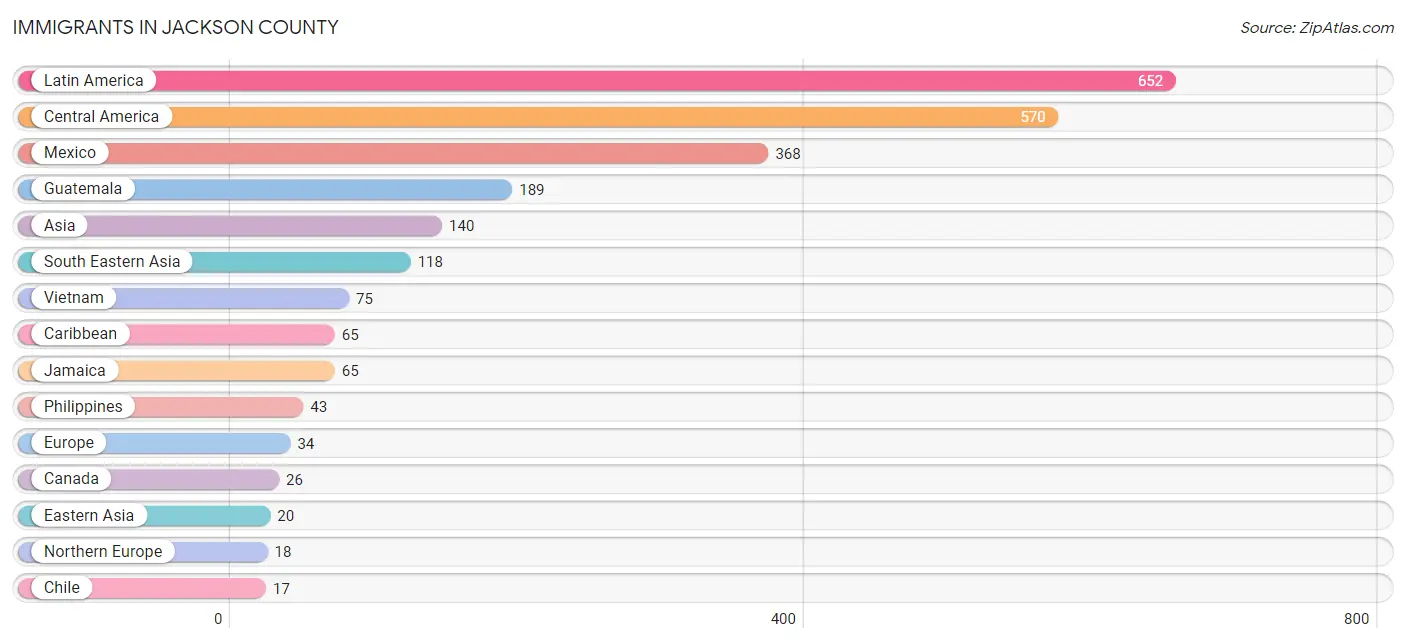
Immigrants in Jackson County
The most numerous immigrant groups reported in Jackson County came from Latin America (652 | 1.2%), Central America (570 | 1.1%), Mexico (368 | 0.7%), Guatemala (189 | 0.4%), and Asia (140 | 0.3%), together accounting for 3.6% of all Jackson County residents.
| Immigration Origin | # Population | % Population |
| Asia | 140 | 0.3% |
| Bangladesh | 2 | 0.0% |
| Canada | 26 | 0.1% |
| Caribbean | 65 | 0.1% |
| Central America | 570 | 1.1% |
| Chile | 17 | 0.0% |
| China | 7 | 0.0% |
| Eastern Asia | 20 | 0.0% |
| Eastern Europe | 3 | 0.0% |
| Europe | 34 | 0.1% |
| France | 4 | 0.0% |
| Germany | 9 | 0.0% |
| Guatemala | 189 | 0.4% |
| Jamaica | 65 | 0.1% |
| Japan | 13 | 0.0% |
| Latin America | 652 | 1.2% |
| Mexico | 368 | 0.7% |
| Northern Europe | 18 | 0.0% |
| Oceania | 11 | 0.0% |
| Panama | 13 | 0.0% |
| Philippines | 43 | 0.1% |
| Russia | 3 | 0.0% |
| South America | 17 | 0.0% |
| South Central Asia | 2 | 0.0% |
| South Eastern Asia | 118 | 0.2% |
| Vietnam | 75 | 0.1% |
| Western Europe | 13 | 0.0% | View All 27 Rows |
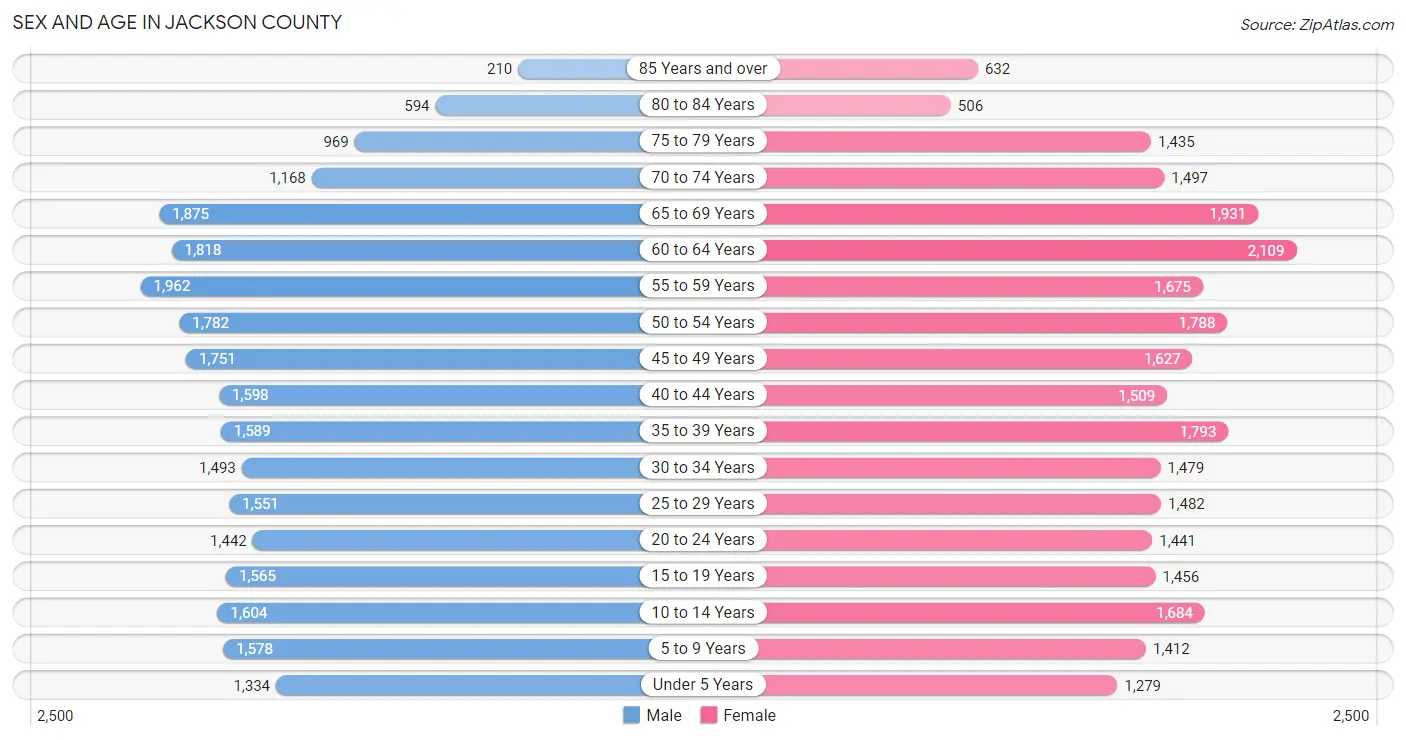
Sex and Age in Jackson County
Sex and Age in Jackson County
The most populous age groups in Jackson County are 55 to 59 Years (1,962 | 7.6%) for men and 60 to 64 Years (2,109 | 7.9%) for women.
| Age Bracket | Male | Female |
| Under 5 Years | 1,334 (5.1%) | 1,279 (4.8%) |
| 5 to 9 Years | 1,578 (6.1%) | 1,412 (5.3%) |
| 10 to 14 Years | 1,604 (6.2%) | 1,684 (6.3%) |
| 15 to 19 Years | 1,565 (6.0%) | 1,456 (5.4%) |
| 20 to 24 Years | 1,442 (5.6%) | 1,441 (5.4%) |
| 25 to 29 Years | 1,551 (6.0%) | 1,482 (5.5%) |
| 30 to 34 Years | 1,493 (5.8%) | 1,479 (5.5%) |
| 35 to 39 Years | 1,589 (6.1%) | 1,793 (6.7%) |
| 40 to 44 Years | 1,598 (6.2%) | 1,509 (5.6%) |
| 45 to 49 Years | 1,751 (6.8%) | 1,627 (6.1%) |
| 50 to 54 Years | 1,782 (6.9%) | 1,788 (6.7%) |
| 55 to 59 Years | 1,962 (7.6%) | 1,675 (6.3%) |
| 60 to 64 Years | 1,818 (7.0%) | 2,109 (7.9%) |
| 65 to 69 Years | 1,875 (7.2%) | 1,931 (7.2%) |
| 70 to 74 Years | 1,168 (4.5%) | 1,497 (5.6%) |
| 75 to 79 Years | 969 (3.7%) | 1,435 (5.4%) |
| 80 to 84 Years | 594 (2.3%) | 506 (1.9%) |
| 85 Years and over | 210 (0.8%) | 632 (2.4%) |
| Total | 25,883 (100.0%) | 26,735 (100.0%) |
Families and Households in Jackson County
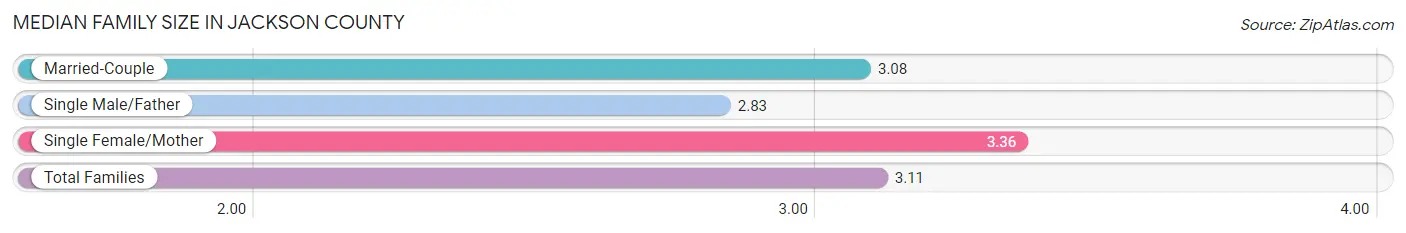
Median Family Size in Jackson County
The median family size in Jackson County is 3.11 persons per family, with single female/mother families (2,446 | 17.6%) accounting for the largest median family size of 3.36 persons per family. On the other hand, single male/father families (1,123 | 8.1%) represent the smallest median family size with 2.83 persons per family.
| Family Type | # Families | Family Size |
| Married-Couple | 10,347 (74.4%) | 3.08 |
| Single Male/Father | 1,123 (8.1%) | 2.83 |
| Single Female/Mother | 2,446 (17.6%) | 3.36 |
| Total Families | 13,916 (100.0%) | 3.11 |
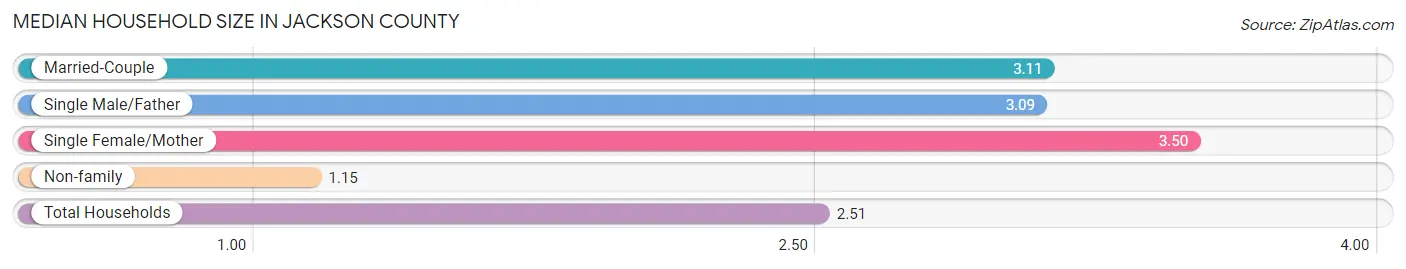
Median Household Size in Jackson County
The median household size in Jackson County is 2.51 persons per household, with single female/mother households (2,446 | 11.8%) accounting for the largest median household size of 3.5 persons per household. non-family households (6,754 | 32.7%) represent the smallest median household size with 1.15 persons per household.
| Household Type | # Households | Household Size |
| Married-Couple | 10,347 (50.1%) | 3.11 |
| Single Male/Father | 1,123 (5.4%) | 3.09 |
| Single Female/Mother | 2,446 (11.8%) | 3.50 |
| Non-family | 6,754 (32.7%) | 1.15 |
| Total Households | 20,670 (100.0%) | 2.51 |
Household Size by Marriage Status in Jackson County
Out of a total of 20,670 households in Jackson County, 13,916 (67.3%) are family households, while 6,754 (32.7%) are nonfamily households. The most numerous type of family households are 2-person households, comprising 7,148, and the most common type of nonfamily households are 1-person households, comprising 6,082.
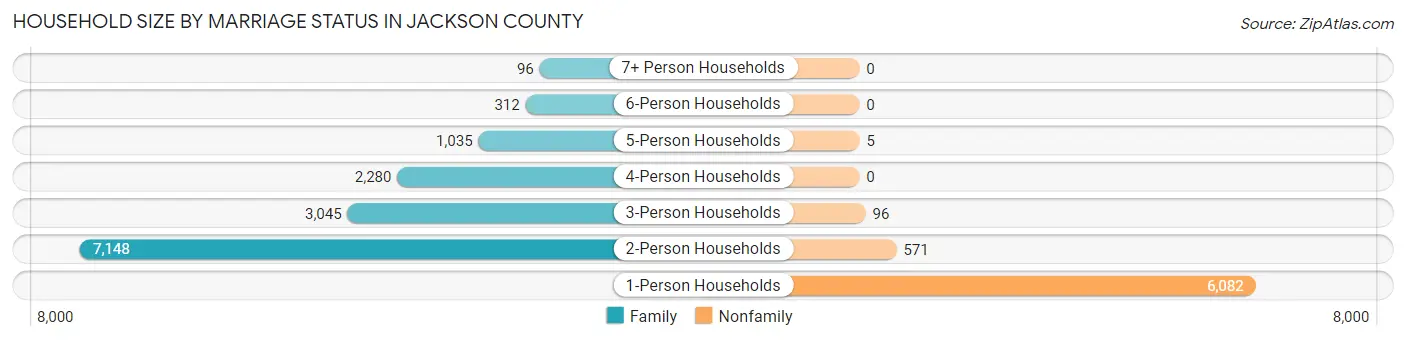
| Household Size | Family Households | Nonfamily Households |
| 1-Person Households | - | 6,082 (29.4%) |
| 2-Person Households | 7,148 (34.6%) | 571 (2.8%) |
| 3-Person Households | 3,045 (14.7%) | 96 (0.5%) |
| 4-Person Households | 2,280 (11.0%) | 0 (0.0%) |
| 5-Person Households | 1,035 (5.0%) | 5 (0.0%) |
| 6-Person Households | 312 (1.5%) | 0 (0.0%) |
| 7+ Person Households | 96 (0.5%) | 0 (0.0%) |
| Total | 13,916 (67.3%) | 6,754 (32.7%) |
Female Fertility in Jackson County
Fertility by Age in Jackson County
Average fertility rate in Jackson County is 62.0 births per 1,000 women. Women in the age bracket of 20 to 34 years have the highest fertility rate with 135.0 births per 1,000 women. Women in the age bracket of 20 to 34 years acount for 85.1% of all women with births.
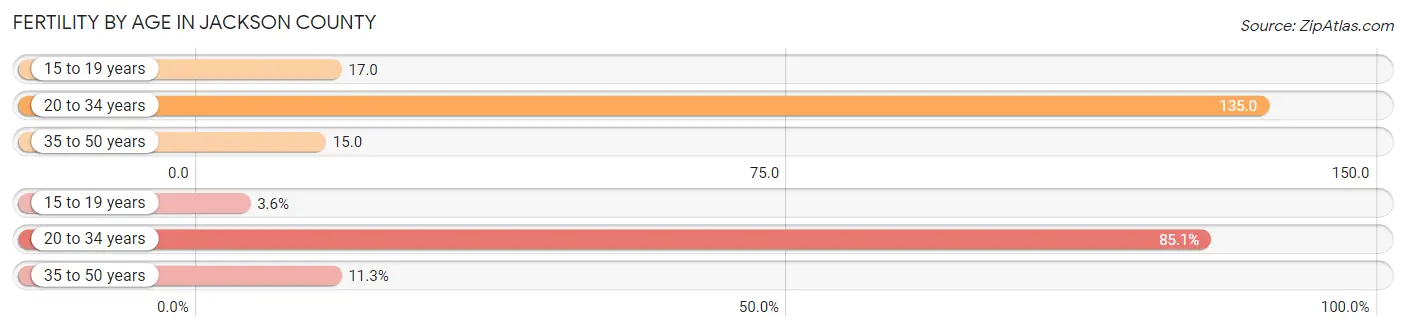
| Age Bracket | Women with Births | Births / 1,000 Women |
| 15 to 19 years | 25 (3.6%) | 17.0 |
| 20 to 34 years | 594 (85.1%) | 135.0 |
| 35 to 50 years | 79 (11.3%) | 15.0 |
| Total | 698 (100.0%) | 62.0 |
Fertility by Age by Marriage Status in Jackson County
63.9% of women with births (698) in Jackson County are married. The highest percentage of unmarried women with births falls into 15 to 19 years age bracket with 100.0% of them unmarried at the time of birth, while the lowest percentage of unmarried women with births belong to 20 to 34 years age bracket with 31.8% of them unmarried.
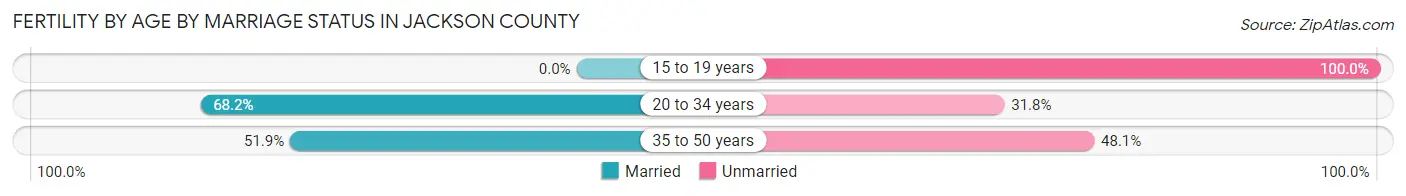
| Age Bracket | Married | Unmarried |
| 15 to 19 years | 0 (0.0%) | 25 (100.0%) |
| 20 to 34 years | 405 (68.2%) | 189 (31.8%) |
| 35 to 50 years | 41 (51.9%) | 38 (48.1%) |
| Total | 446 (63.9%) | 252 (36.1%) |
Fertility by Education in Jackson County
Average fertility rate in Jackson County is 62.0 births per 1,000 women. Women with the education attainment of bachelor's degree have the highest fertility rate of 80.0 births per 1,000 women, while women with the education attainment of graduate degree have the lowest fertility at 30.0 births per 1,000 women. Women with the education attainment of college or associate's degree represent 41.3% of all women with births.
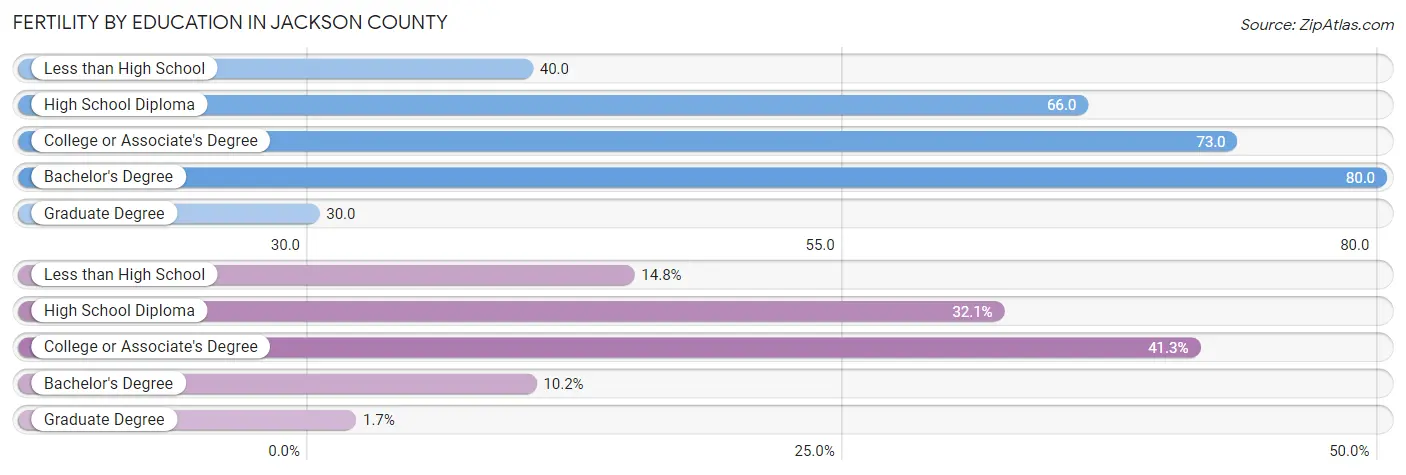
| Educational Attainment | Women with Births | Births / 1,000 Women |
| Less than High School | 103 (14.8%) | 40.0 |
| High School Diploma | 224 (32.1%) | 66.0 |
| College or Associate's Degree | 288 (41.3%) | 73.0 |
| Bachelor's Degree | 71 (10.2%) | 80.0 |
| Graduate Degree | 12 (1.7%) | 30.0 |
| Total | 698 (100.0%) | 62.0 |
Fertility by Education by Marriage Status in Jackson County
36.1% of women with births in Jackson County are unmarried. Women with the educational attainment of graduate degree are most likely to be married with 100.0% of them married at childbirth, while women with the educational attainment of less than high school are least likely to be married with 65.0% of them unmarried at childbirth.
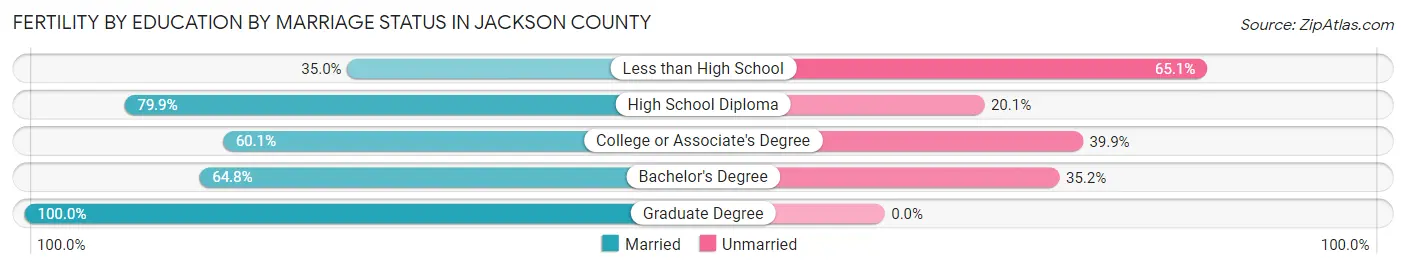
| Educational Attainment | Married | Unmarried |
| Less than High School | 36 (34.9%) | 67 (65.0%) |
| High School Diploma | 179 (79.9%) | 45 (20.1%) |
| College or Associate's Degree | 173 (60.1%) | 115 (39.9%) |
| Bachelor's Degree | 46 (64.8%) | 25 (35.2%) |
| Graduate Degree | 12 (100.0%) | 0 (0.0%) |
| Total | 446 (63.9%) | 252 (36.1%) |
Employment Characteristics in Jackson County
Employment by Class of Employer in Jackson County
Among the 20,023 employed individuals in Jackson County, private company employees (14,264 | 71.2%), local government employees (2,009 | 10.0%), and self-employed (not incorporated) (1,110 | 5.5%) make up the most common classes of employment.
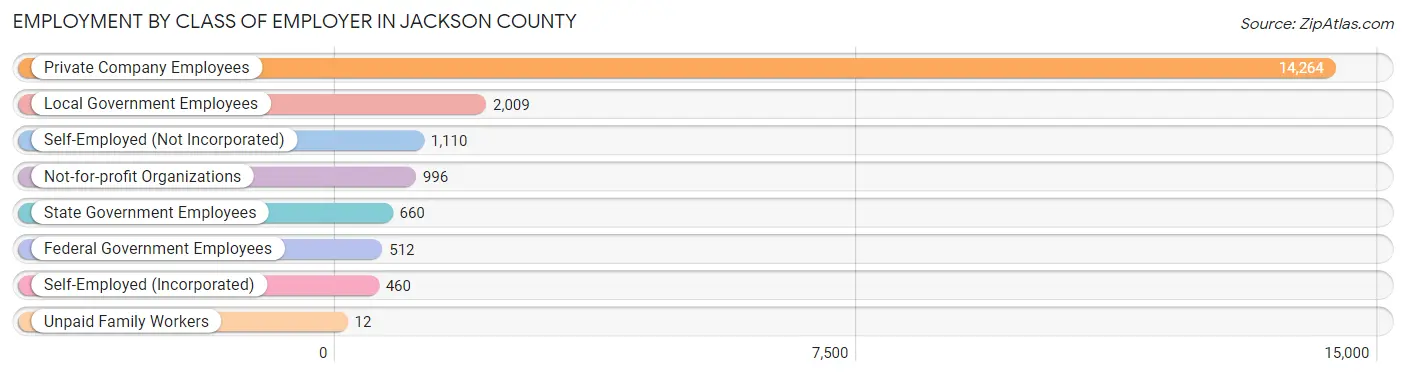
| Employer Class | # Employees | % Employees |
| Private Company Employees | 14,264 | 71.2% |
| Self-Employed (Incorporated) | 460 | 2.3% |
| Self-Employed (Not Incorporated) | 1,110 | 5.5% |
| Not-for-profit Organizations | 996 | 5.0% |
| Local Government Employees | 2,009 | 10.0% |
| State Government Employees | 660 | 3.3% |
| Federal Government Employees | 512 | 2.6% |
| Unpaid Family Workers | 12 | 0.1% |
| Total | 20,023 | 100.0% |
Employment Status by Age in Jackson County
According to the labor force statistics for Jackson County, out of the total population over 16 years of age (43,027), 50.5% or 21,729 individuals are in the labor force, with 6.0% or 1,304 of them unemployed. The age group with the highest labor force participation rate is 35 to 44 years, with 74.8% or 4,854 individuals in the labor force. Within the labor force, the 20 to 24 years age range has the highest percentage of unemployed individuals, with 14.1% or 233 of them being unemployed.
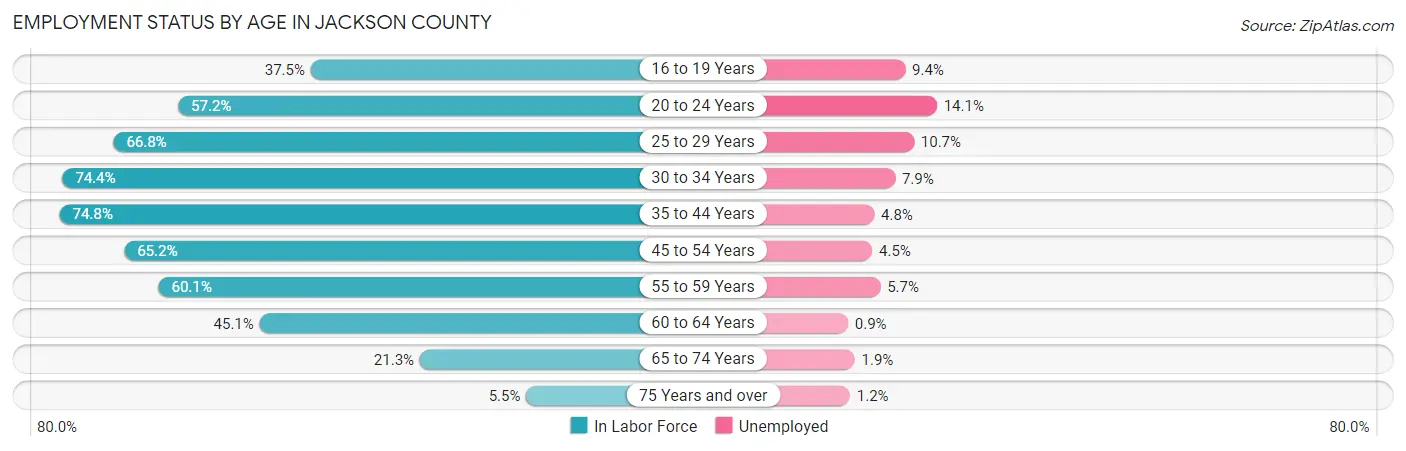
| Age Bracket | In Labor Force | Unemployed |
| 16 to 19 Years | 870 (37.5%) | 82 (9.4%) |
| 20 to 24 Years | 1,649 (57.2%) | 233 (14.1%) |
| 25 to 29 Years | 2,026 (66.8%) | 217 (10.7%) |
| 30 to 34 Years | 2,211 (74.4%) | 175 (7.9%) |
| 35 to 44 Years | 4,854 (74.8%) | 233 (4.8%) |
| 45 to 54 Years | 4,530 (65.2%) | 204 (4.5%) |
| 55 to 59 Years | 2,186 (60.1%) | 125 (5.7%) |
| 60 to 64 Years | 1,771 (45.1%) | 16 (0.9%) |
| 65 to 74 Years | 1,378 (21.3%) | 26 (1.9%) |
| 75 Years and over | 239 (5.5%) | 3 (1.2%) |
| Total | 21,729 (50.5%) | 1,304 (6.0%) |
Employment Status by Educational Attainment in Jackson County
According to labor force statistics for Jackson County, 65.1% of individuals (17,581) out of the total population between 25 and 64 years of age (27,006) are in the labor force, with 5.5% or 967 of them being unemployed. The group with the highest labor force participation rate are those with the educational attainment of bachelor's degree or higher, with 79.2% or 3,646 individuals in the labor force. Within the labor force, individuals with less than high school education have the highest percentage of unemployment, with 10.7% or 225 of them being unemployed.
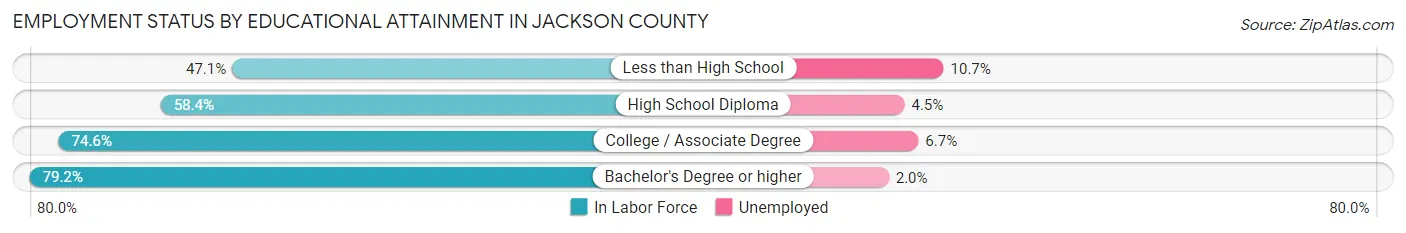
| Educational Attainment | In Labor Force | Unemployed |
| Less than High School | 2,105 (47.1%) | 478 (10.7%) |
| High School Diploma | 5,585 (58.4%) | 430 (4.5%) |
| College / Associate Degree | 6,243 (74.6%) | 561 (6.7%) |
| Bachelor's Degree or higher | 3,646 (79.2%) | 92 (2.0%) |
| Total | 17,581 (65.1%) | 1,485 (5.5%) |
Employment Occupations by Sex in Jackson County
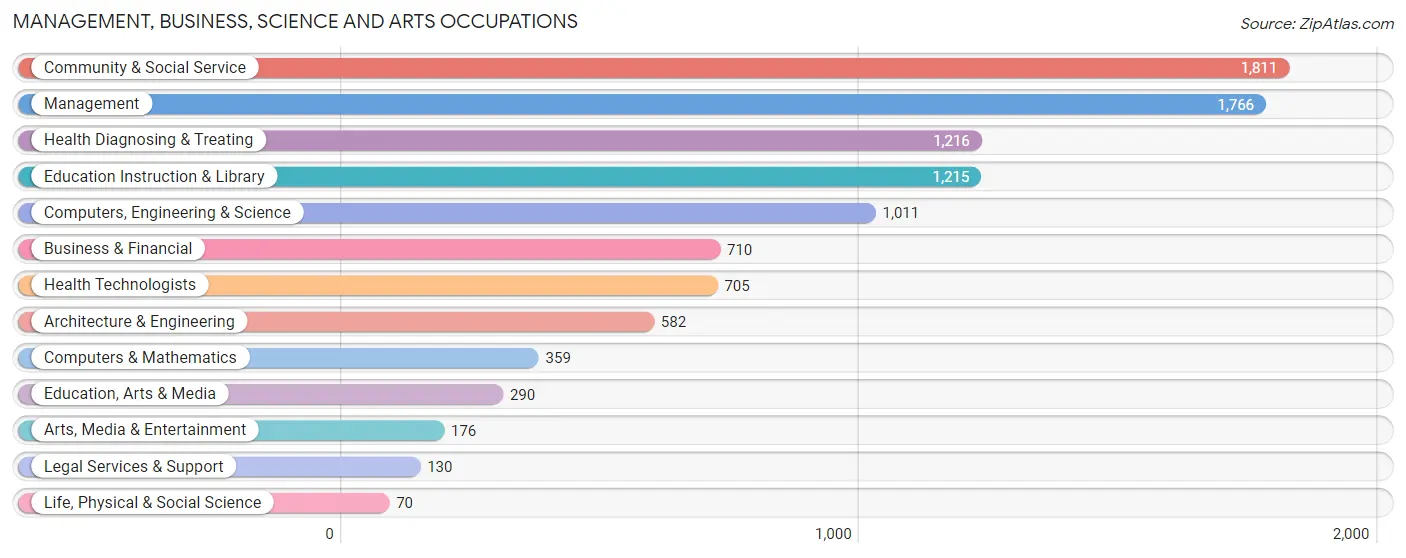
Management, Business, Science and Arts Occupations
The most common Management, Business, Science and Arts occupations in Jackson County are Community & Social Service (1,811 | 8.9%), Management (1,766 | 8.6%), Health Diagnosing & Treating (1,216 | 6.0%), Education Instruction & Library (1,215 | 5.9%), and Computers, Engineering & Science (1,011 | 5.0%).
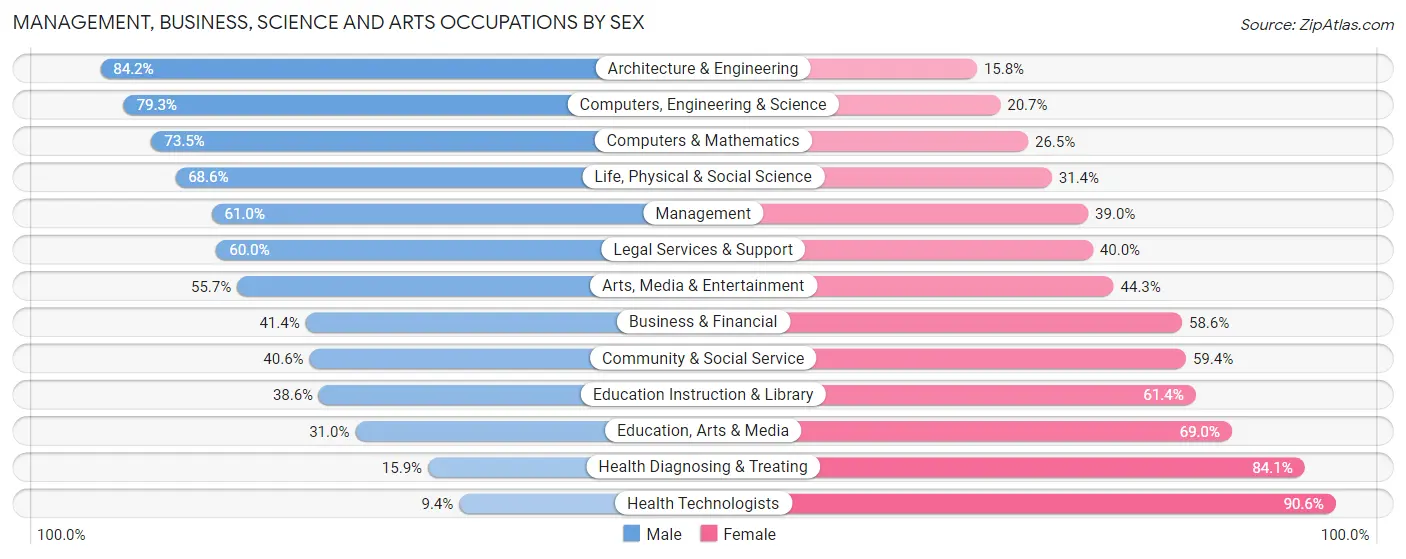
Management, Business, Science and Arts Occupations by Sex
Within the Management, Business, Science and Arts occupations in Jackson County, the most male-oriented occupations are Architecture & Engineering (84.2%), Computers, Engineering & Science (79.3%), and Computers & Mathematics (73.5%), while the most female-oriented occupations are Health Technologists (90.6%), Health Diagnosing & Treating (84.1%), and Education, Arts & Media (69.0%).
| Occupation | Male | Female |
| Management | 1,077 (61.0%) | 689 (39.0%) |
| Business & Financial | 294 (41.4%) | 416 (58.6%) |
| Computers, Engineering & Science | 802 (79.3%) | 209 (20.7%) |
| Computers & Mathematics | 264 (73.5%) | 95 (26.5%) |
| Architecture & Engineering | 490 (84.2%) | 92 (15.8%) |
| Life, Physical & Social Science | 48 (68.6%) | 22 (31.4%) |
| Community & Social Service | 735 (40.6%) | 1,076 (59.4%) |
| Education, Arts & Media | 90 (31.0%) | 200 (69.0%) |
| Legal Services & Support | 78 (60.0%) | 52 (40.0%) |
| Education Instruction & Library | 469 (38.6%) | 746 (61.4%) |
| Arts, Media & Entertainment | 98 (55.7%) | 78 (44.3%) |
| Health Diagnosing & Treating | 193 (15.9%) | 1,023 (84.1%) |
| Health Technologists | 66 (9.4%) | 639 (90.6%) |
| Total (Category) | 3,101 (47.6%) | 3,413 (52.4%) |
| Total (Overall) | 11,393 (55.8%) | 9,012 (44.2%) |
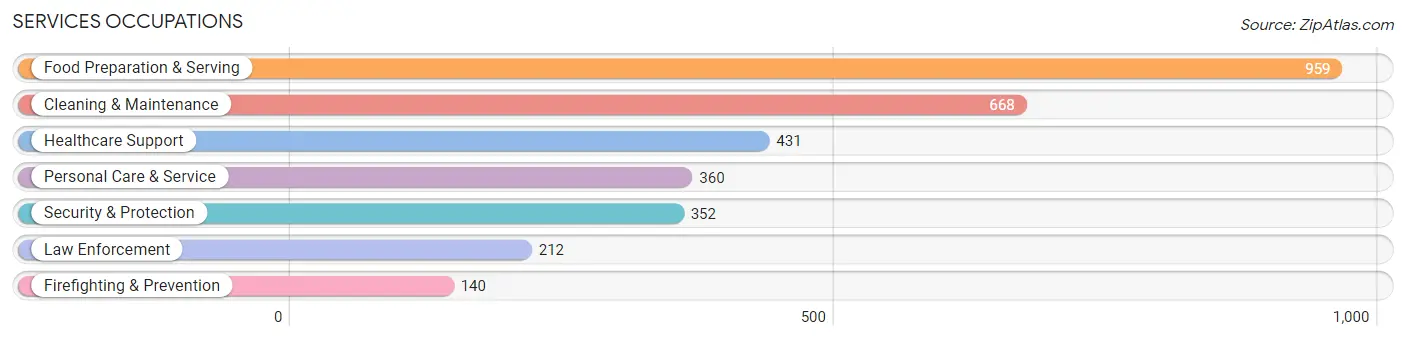
Services Occupations
The most common Services occupations in Jackson County are Food Preparation & Serving (959 | 4.7%), Cleaning & Maintenance (668 | 3.3%), Healthcare Support (431 | 2.1%), Personal Care & Service (360 | 1.8%), and Security & Protection (352 | 1.7%).
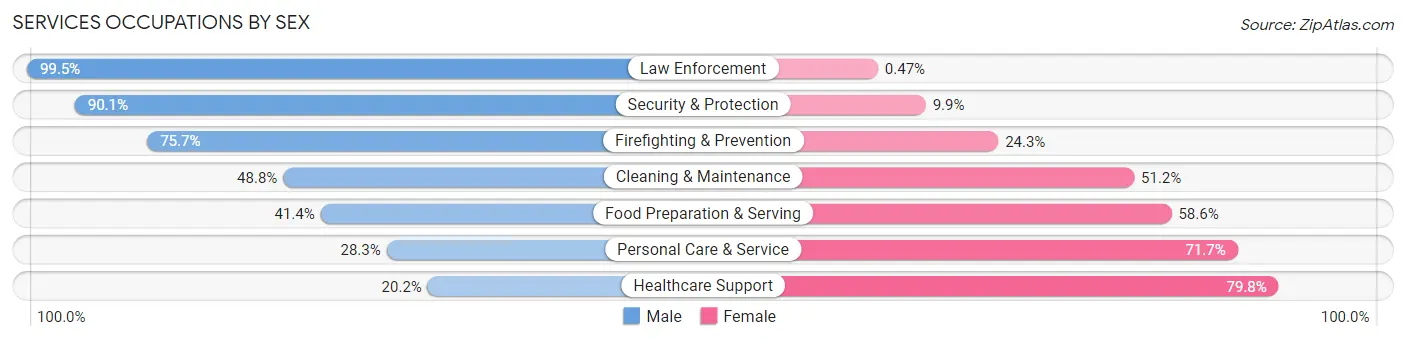
Services Occupations by Sex
Within the Services occupations in Jackson County, the most male-oriented occupations are Law Enforcement (99.5%), Security & Protection (90.1%), and Firefighting & Prevention (75.7%), while the most female-oriented occupations are Healthcare Support (79.8%), Personal Care & Service (71.7%), and Food Preparation & Serving (58.6%).
| Occupation | Male | Female |
| Healthcare Support | 87 (20.2%) | 344 (79.8%) |
| Security & Protection | 317 (90.1%) | 35 (9.9%) |
| Firefighting & Prevention | 106 (75.7%) | 34 (24.3%) |
| Law Enforcement | 211 (99.5%) | 1 (0.5%) |
| Food Preparation & Serving | 397 (41.4%) | 562 (58.6%) |
| Cleaning & Maintenance | 326 (48.8%) | 342 (51.2%) |
| Personal Care & Service | 102 (28.3%) | 258 (71.7%) |
| Total (Category) | 1,229 (44.4%) | 1,541 (55.6%) |
| Total (Overall) | 11,393 (55.8%) | 9,012 (44.2%) |
Sales and Office Occupations
The most common Sales and Office occupations in Jackson County are Office & Administration (1,746 | 8.6%), and Sales & Related (1,740 | 8.5%).
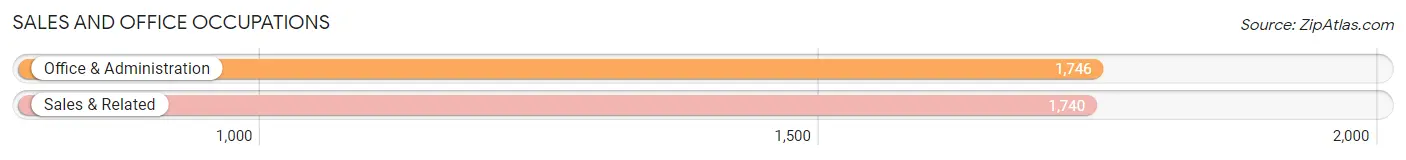
Sales and Office Occupations by Sex

| Occupation | Male | Female |
| Sales & Related | 712 (40.9%) | 1,028 (59.1%) |
| Office & Administration | 338 (19.4%) | 1,408 (80.6%) |
| Total (Category) | 1,050 (30.1%) | 2,436 (69.9%) |
| Total (Overall) | 11,393 (55.8%) | 9,012 (44.2%) |
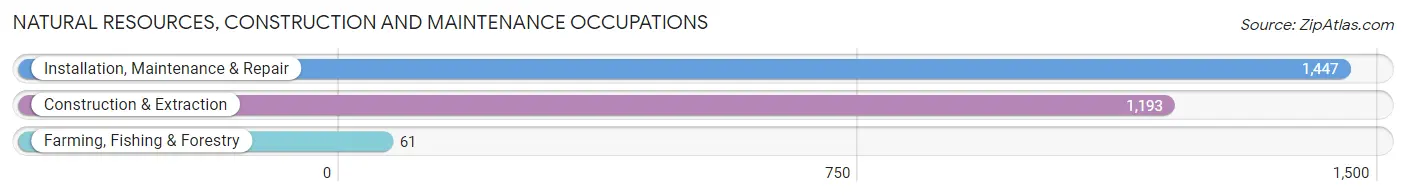
Natural Resources, Construction and Maintenance Occupations
The most common Natural Resources, Construction and Maintenance occupations in Jackson County are Installation, Maintenance & Repair (1,447 | 7.1%), Construction & Extraction (1,193 | 5.9%), and Farming, Fishing & Forestry (61 | 0.3%).
Natural Resources, Construction and Maintenance Occupations by Sex
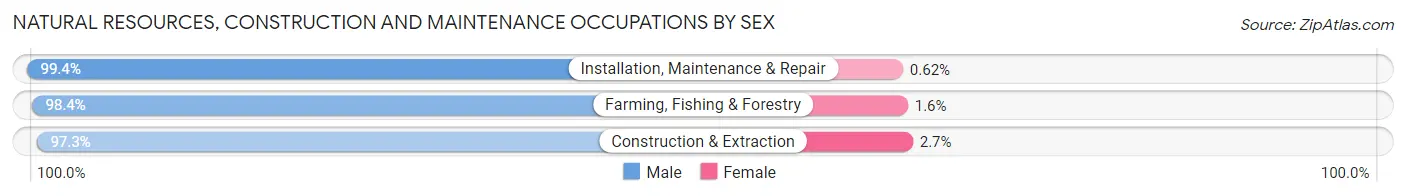
| Occupation | Male | Female |
| Farming, Fishing & Forestry | 60 (98.4%) | 1 (1.6%) |
| Construction & Extraction | 1,161 (97.3%) | 32 (2.7%) |
| Installation, Maintenance & Repair | 1,438 (99.4%) | 9 (0.6%) |
| Total (Category) | 2,659 (98.5%) | 42 (1.5%) |
| Total (Overall) | 11,393 (55.8%) | 9,012 (44.2%) |
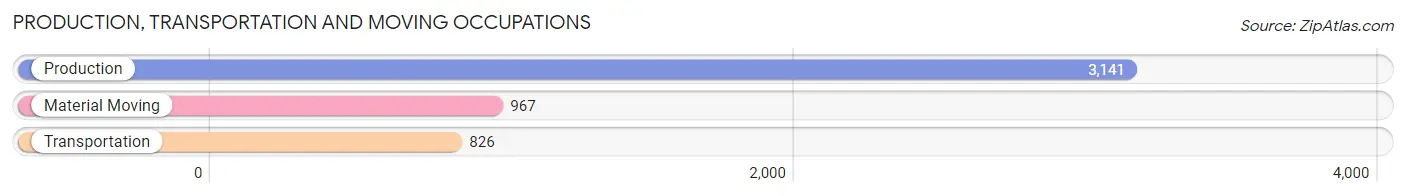
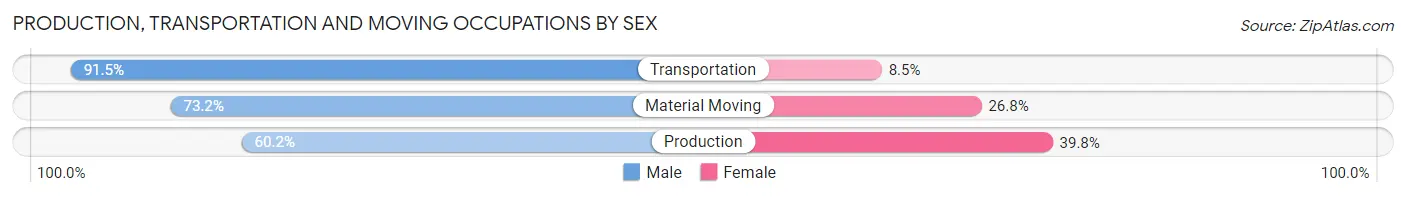
Production, Transportation and Moving Occupations
The most common Production, Transportation and Moving occupations in Jackson County are Production (3,141 | 15.4%), Material Moving (967 | 4.7%), and Transportation (826 | 4.1%).
Production, Transportation and Moving Occupations by Sex
| Occupation | Male | Female |
| Production | 1,890 (60.2%) | 1,251 (39.8%) |
| Transportation | 756 (91.5%) | 70 (8.5%) |
| Material Moving | 708 (73.2%) | 259 (26.8%) |
| Total (Category) | 3,354 (68.0%) | 1,580 (32.0%) |
| Total (Overall) | 11,393 (55.8%) | 9,012 (44.2%) |
Employment Industries by Sex in Jackson County
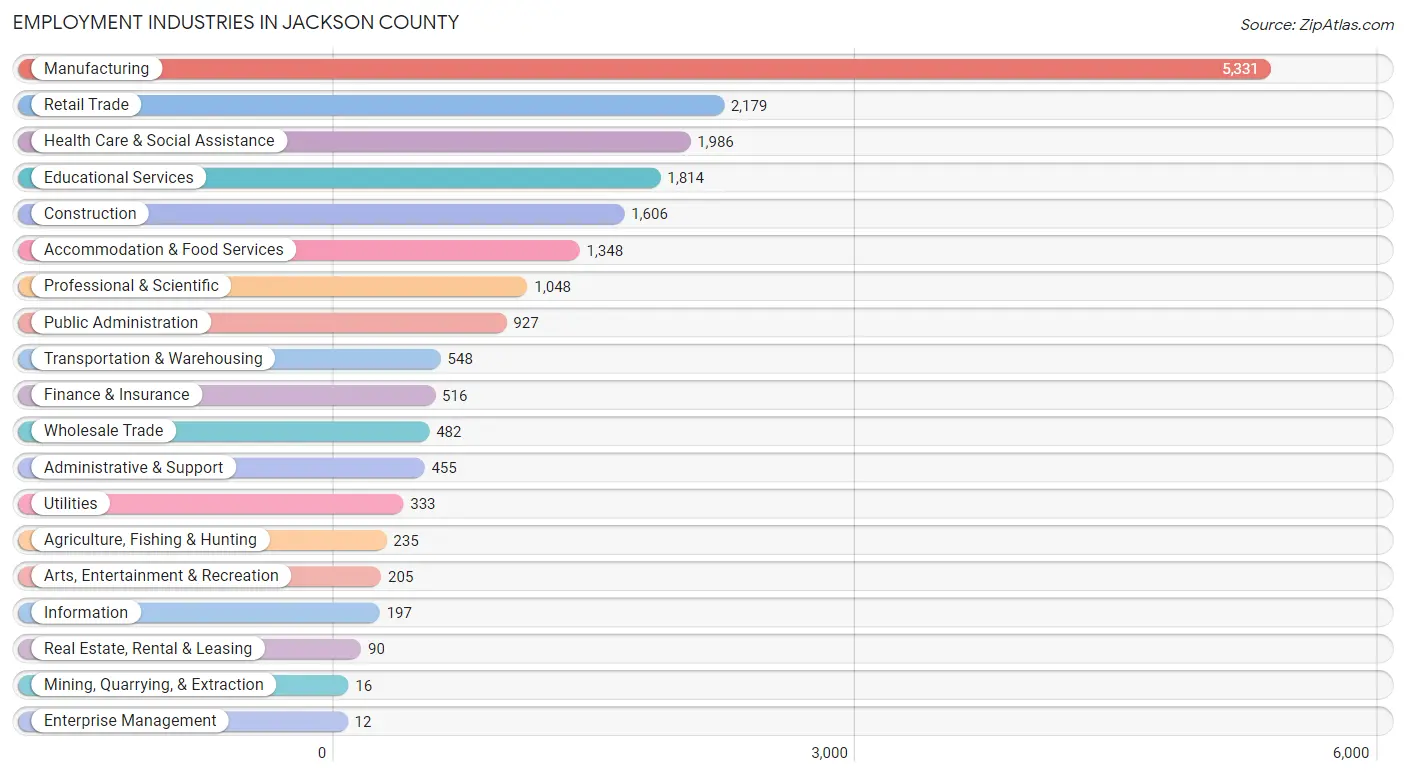
Employment Industries in Jackson County
The major employment industries in Jackson County include Manufacturing (5,331 | 26.1%), Retail Trade (2,179 | 10.7%), Health Care & Social Assistance (1,986 | 9.7%), Educational Services (1,814 | 8.9%), and Construction (1,606 | 7.9%).
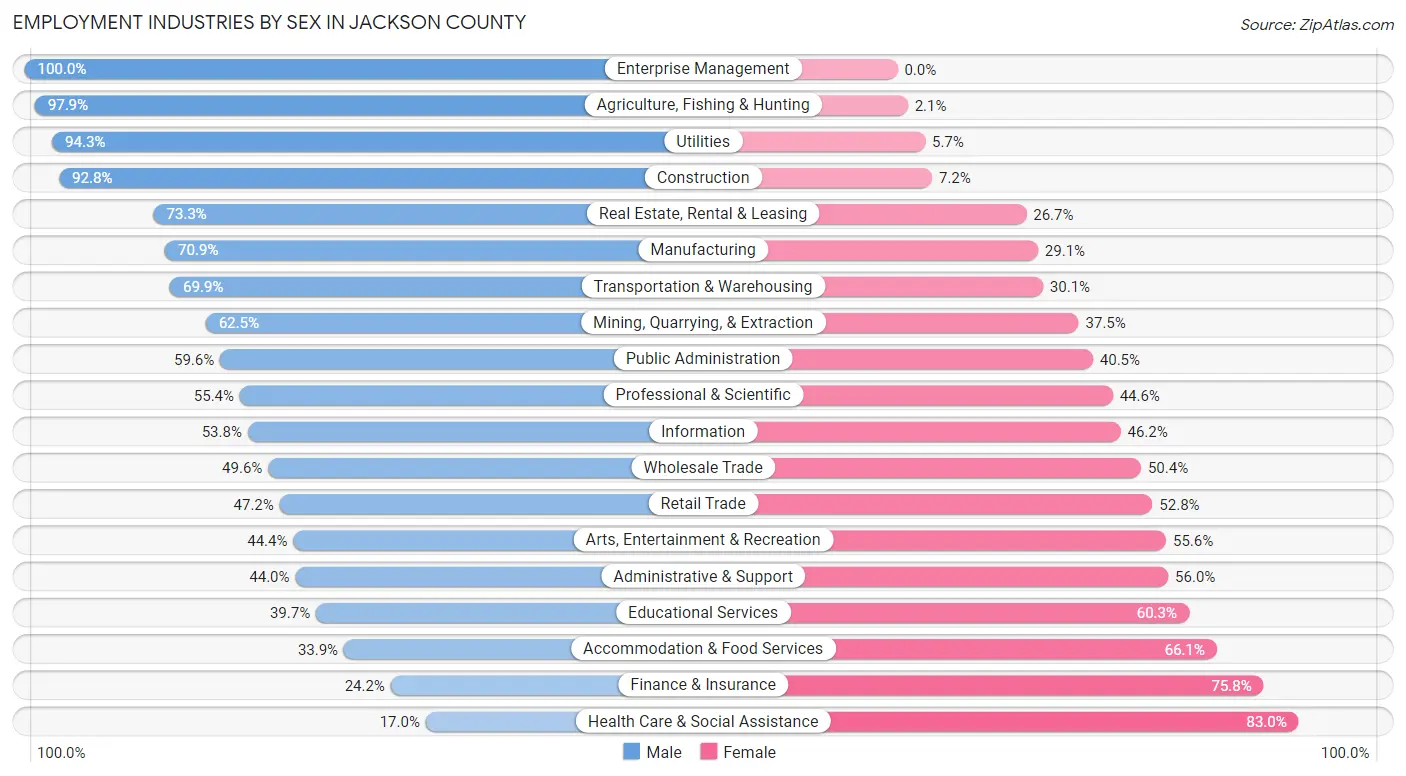
Employment Industries by Sex in Jackson County
The Jackson County industries that see more men than women are Enterprise Management (100.0%), Agriculture, Fishing & Hunting (97.9%), and Utilities (94.3%), whereas the industries that tend to have a higher number of women are Health Care & Social Assistance (83.0%), Finance & Insurance (75.8%), and Accommodation & Food Services (66.1%).
| Industry | Male | Female |
| Agriculture, Fishing & Hunting | 230 (97.9%) | 5 (2.1%) |
| Mining, Quarrying, & Extraction | 10 (62.5%) | 6 (37.5%) |
| Construction | 1,491 (92.8%) | 115 (7.2%) |
| Manufacturing | 3,781 (70.9%) | 1,550 (29.1%) |
| Wholesale Trade | 239 (49.6%) | 243 (50.4%) |
| Retail Trade | 1,029 (47.2%) | 1,150 (52.8%) |
| Transportation & Warehousing | 383 (69.9%) | 165 (30.1%) |
| Utilities | 314 (94.3%) | 19 (5.7%) |
| Information | 106 (53.8%) | 91 (46.2%) |
| Finance & Insurance | 125 (24.2%) | 391 (75.8%) |
| Real Estate, Rental & Leasing | 66 (73.3%) | 24 (26.7%) |
| Professional & Scientific | 581 (55.4%) | 467 (44.6%) |
| Enterprise Management | 12 (100.0%) | 0 (0.0%) |
| Administrative & Support | 200 (44.0%) | 255 (56.0%) |
| Educational Services | 720 (39.7%) | 1,094 (60.3%) |
| Health Care & Social Assistance | 337 (17.0%) | 1,649 (83.0%) |
| Arts, Entertainment & Recreation | 91 (44.4%) | 114 (55.6%) |
| Accommodation & Food Services | 457 (33.9%) | 891 (66.1%) |
| Public Administration | 552 (59.6%) | 375 (40.5%) |
| Total | 11,393 (55.8%) | 9,012 (44.2%) |
Education in Jackson County
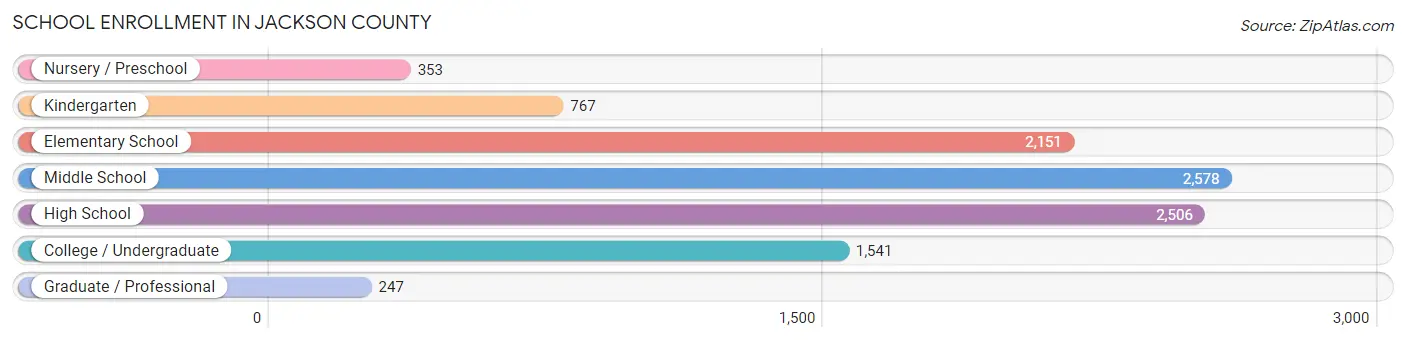
School Enrollment in Jackson County
The most common levels of schooling among the 10,143 students in Jackson County are middle school (2,578 | 25.4%), high school (2,506 | 24.7%), and elementary school (2,151 | 21.2%).
| School Level | # Students | % Students |
| Nursery / Preschool | 353 | 3.5% |
| Kindergarten | 767 | 7.6% |
| Elementary School | 2,151 | 21.2% |
| Middle School | 2,578 | 25.4% |
| High School | 2,506 | 24.7% |
| College / Undergraduate | 1,541 | 15.2% |
| Graduate / Professional | 247 | 2.4% |
| Total | 10,143 | 100.0% |
School Enrollment by Age by Funding Source in Jackson County
Out of a total of 10,143 students who are enrolled in schools in Jackson County, 1,430 (14.1%) attend a private institution, while the remaining 8,713 (85.9%) are enrolled in public schools. The age group of 3 to 4 year olds has the highest likelihood of being enrolled in private schools, with 118 (35.2% in the age bracket) enrolled. Conversely, the age group of 20 to 24 year olds has the lowest likelihood of being enrolled in a private school, with 628 (92.6% in the age bracket) attending a public institution.
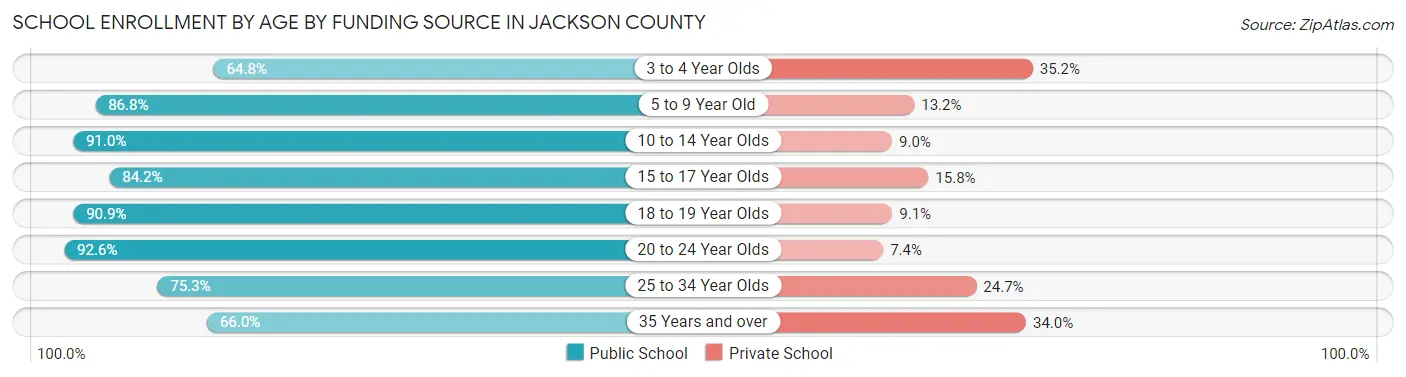
| Age Bracket | Public School | Private School |
| 3 to 4 Year Olds | 217 (64.8%) | 118 (35.2%) |
| 5 to 9 Year Old | 2,355 (86.8%) | 357 (13.2%) |
| 10 to 14 Year Olds | 2,775 (91.0%) | 275 (9.0%) |
| 15 to 17 Year Olds | 1,580 (84.2%) | 296 (15.8%) |
| 18 to 19 Year Olds | 502 (90.9%) | 50 (9.1%) |
| 20 to 24 Year Olds | 628 (92.6%) | 50 (7.4%) |
| 25 to 34 Year Olds | 271 (75.3%) | 89 (24.7%) |
| 35 Years and over | 383 (66.0%) | 197 (34.0%) |
| Total | 8,713 (85.9%) | 1,430 (14.1%) |
Educational Attainment by Field of Study in Jackson County
Education (2,073 | 32.6%), business (1,292 | 20.3%), science & technology (645 | 10.1%), engineering (382 | 6.0%), and arts & humanities (353 | 5.6%) are the most common fields of study among 6,360 individuals in Jackson County who have obtained a bachelor's degree or higher.
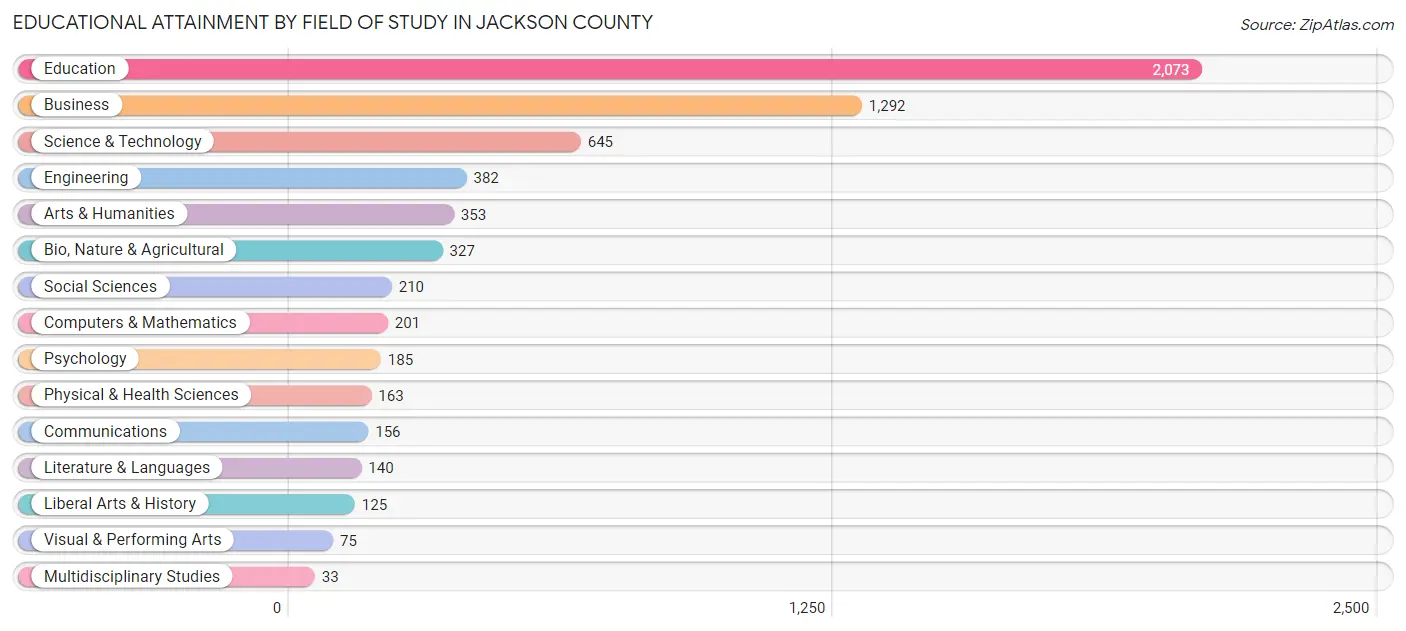
| Field of Study | # Graduates | % Graduates |
| Computers & Mathematics | 201 | 3.2% |
| Bio, Nature & Agricultural | 327 | 5.1% |
| Physical & Health Sciences | 163 | 2.6% |
| Psychology | 185 | 2.9% |
| Social Sciences | 210 | 3.3% |
| Engineering | 382 | 6.0% |
| Multidisciplinary Studies | 33 | 0.5% |
| Science & Technology | 645 | 10.1% |
| Business | 1,292 | 20.3% |
| Education | 2,073 | 32.6% |
| Literature & Languages | 140 | 2.2% |
| Liberal Arts & History | 125 | 2.0% |
| Visual & Performing Arts | 75 | 1.2% |
| Communications | 156 | 2.5% |
| Arts & Humanities | 353 | 5.6% |
| Total | 6,360 | 100.0% |
Transportation & Commute in Jackson County
Vehicle Availability by Sex in Jackson County
The most prevalent vehicle ownership categories in Jackson County are males with 2 vehicles (4,689, accounting for 41.9%) and females with 2 vehicles (3,635, making up 53.2%).
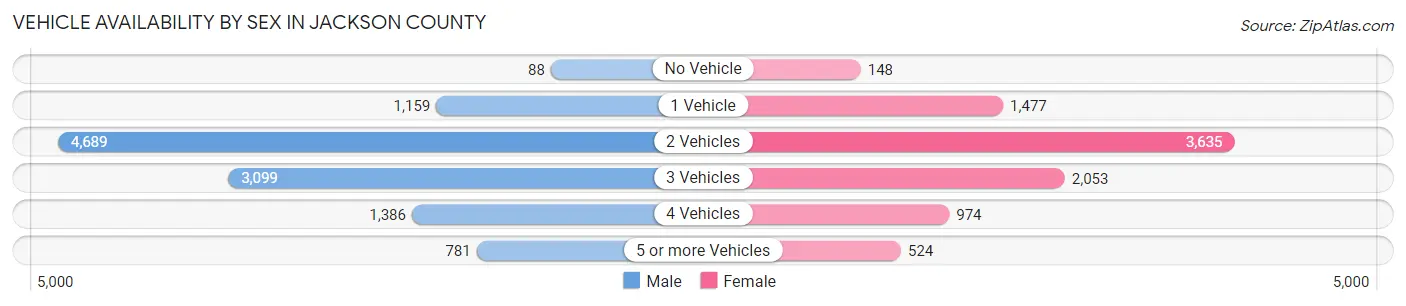
| Vehicles Available | Male | Female |
| No Vehicle | 88 (0.8%) | 148 (1.7%) |
| 1 Vehicle | 1,159 (10.3%) | 1,477 (16.8%) |
| 2 Vehicles | 4,689 (41.9%) | 3,635 (41.3%) |
| 3 Vehicles | 3,099 (27.7%) | 2,053 (23.3%) |
| 4 Vehicles | 1,386 (12.4%) | 974 (11.1%) |
| 5 or more Vehicles | 781 (7.0%) | 524 (5.9%) |
| Total | 11,202 (100.0%) | 8,811 (100.0%) |
Commute Time in Jackson County
The most frequently occuring commute durations in Jackson County are 15 to 19 minutes (2,638 commuters, 13.7%), 5 to 9 minutes (2,470 commuters, 12.8%), and 30 to 34 minutes (2,399 commuters, 12.5%).
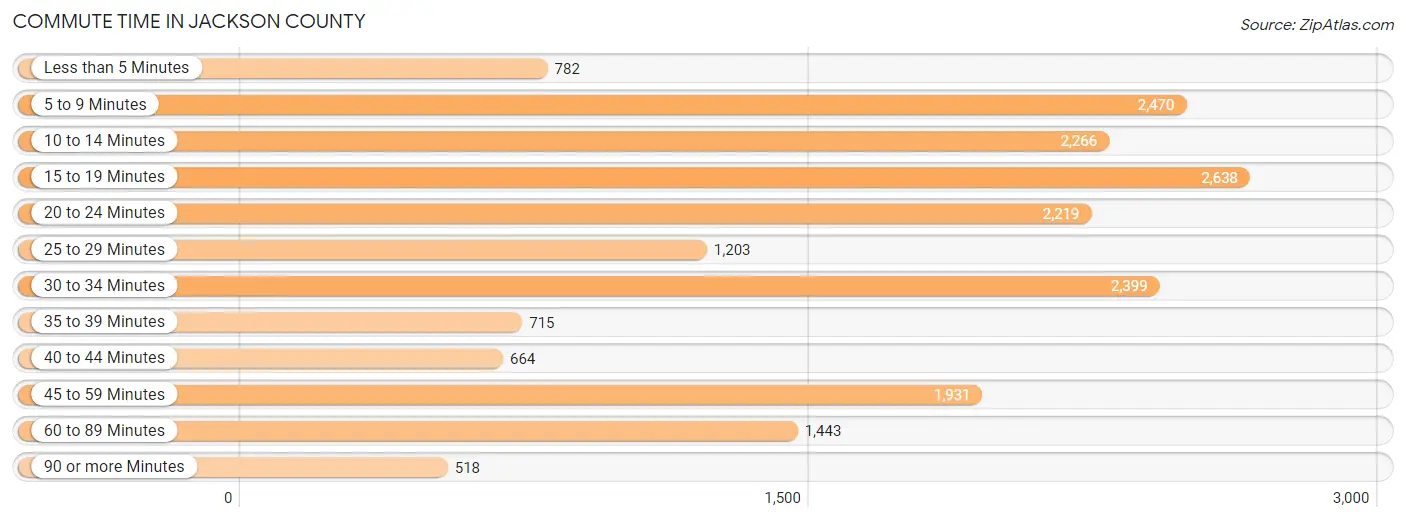
| Commute Time | # Commuters | % Commuters |
| Less than 5 Minutes | 782 | 4.1% |
| 5 to 9 Minutes | 2,470 | 12.8% |
| 10 to 14 Minutes | 2,266 | 11.8% |
| 15 to 19 Minutes | 2,638 | 13.7% |
| 20 to 24 Minutes | 2,219 | 11.5% |
| 25 to 29 Minutes | 1,203 | 6.2% |
| 30 to 34 Minutes | 2,399 | 12.5% |
| 35 to 39 Minutes | 715 | 3.7% |
| 40 to 44 Minutes | 664 | 3.5% |
| 45 to 59 Minutes | 1,931 | 10.0% |
| 60 to 89 Minutes | 1,443 | 7.5% |
| 90 or more Minutes | 518 | 2.7% |
Commute Time by Sex in Jackson County
The most common commute times in Jackson County are 20 to 24 minutes (1,507 commuters, 13.8%) for males and 15 to 19 minutes (1,449 commuters, 17.4%) for females.
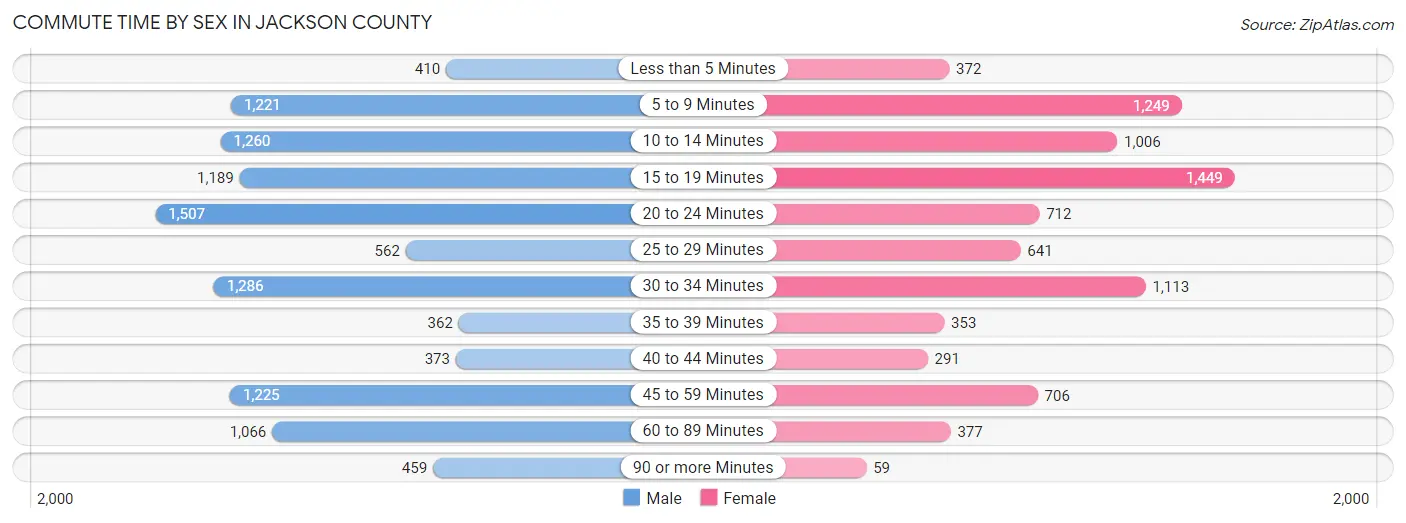
| Commute Time | Male | Female |
| Less than 5 Minutes | 410 (3.7%) | 372 (4.5%) |
| 5 to 9 Minutes | 1,221 (11.2%) | 1,249 (15.0%) |
| 10 to 14 Minutes | 1,260 (11.5%) | 1,006 (12.1%) |
| 15 to 19 Minutes | 1,189 (10.9%) | 1,449 (17.4%) |
| 20 to 24 Minutes | 1,507 (13.8%) | 712 (8.6%) |
| 25 to 29 Minutes | 562 (5.1%) | 641 (7.7%) |
| 30 to 34 Minutes | 1,286 (11.8%) | 1,113 (13.4%) |
| 35 to 39 Minutes | 362 (3.3%) | 353 (4.2%) |
| 40 to 44 Minutes | 373 (3.4%) | 291 (3.5%) |
| 45 to 59 Minutes | 1,225 (11.2%) | 706 (8.5%) |
| 60 to 89 Minutes | 1,066 (9.8%) | 377 (4.5%) |
| 90 or more Minutes | 459 (4.2%) | 59 (0.7%) |
Time of Departure to Work by Sex in Jackson County
The most frequent times of departure to work in Jackson County are 12:00 AM to 4:59 AM (1,472, 13.5%) for males and 7:00 AM to 7:29 AM (1,558, 18.7%) for females.
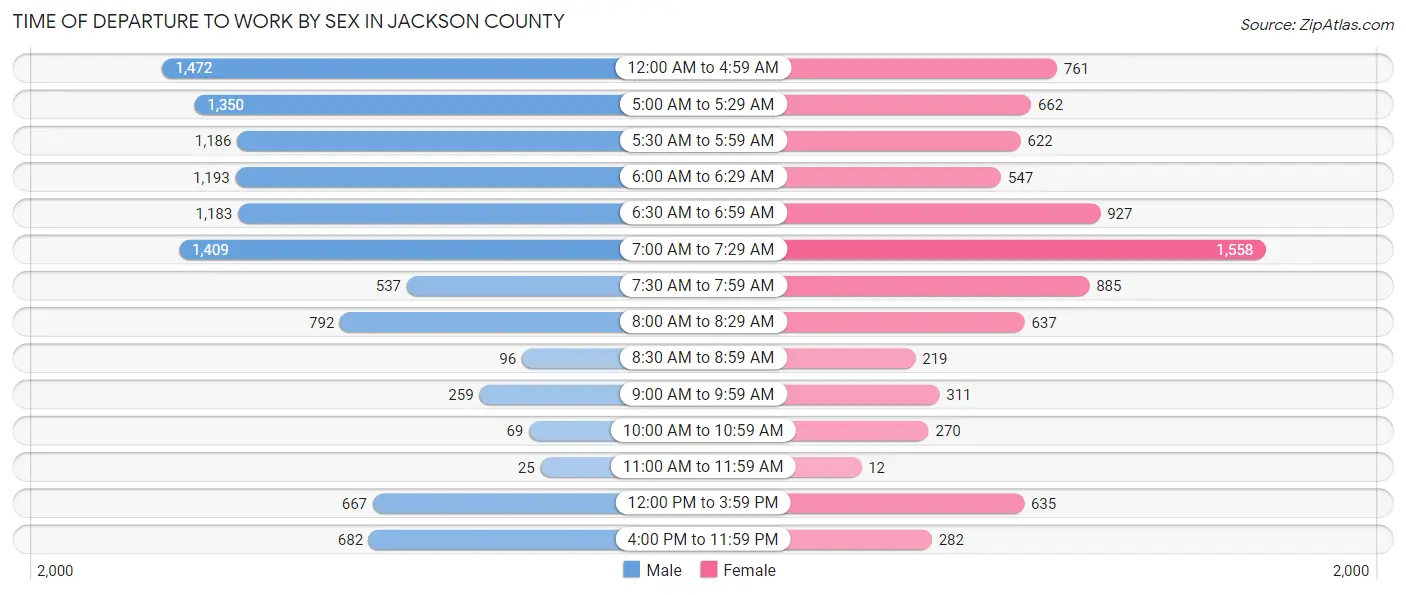
| Time of Departure | Male | Female |
| 12:00 AM to 4:59 AM | 1,472 (13.5%) | 761 (9.1%) |
| 5:00 AM to 5:29 AM | 1,350 (12.4%) | 662 (8.0%) |
| 5:30 AM to 5:59 AM | 1,186 (10.9%) | 622 (7.5%) |
| 6:00 AM to 6:29 AM | 1,193 (10.9%) | 547 (6.6%) |
| 6:30 AM to 6:59 AM | 1,183 (10.8%) | 927 (11.1%) |
| 7:00 AM to 7:29 AM | 1,409 (12.9%) | 1,558 (18.7%) |
| 7:30 AM to 7:59 AM | 537 (4.9%) | 885 (10.6%) |
| 8:00 AM to 8:29 AM | 792 (7.2%) | 637 (7.6%) |
| 8:30 AM to 8:59 AM | 96 (0.9%) | 219 (2.6%) |
| 9:00 AM to 9:59 AM | 259 (2.4%) | 311 (3.7%) |
| 10:00 AM to 10:59 AM | 69 (0.6%) | 270 (3.2%) |
| 11:00 AM to 11:59 AM | 25 (0.2%) | 12 (0.1%) |
| 12:00 PM to 3:59 PM | 667 (6.1%) | 635 (7.6%) |
| 4:00 PM to 11:59 PM | 682 (6.2%) | 282 (3.4%) |
| Total | 10,920 (100.0%) | 8,328 (100.0%) |
Housing Occupancy in Jackson County
Occupancy by Ownership in Jackson County
Of the total 20,670 dwellings in Jackson County, owner-occupied units account for 15,733 (76.1%), while renter-occupied units make up 4,937 (23.9%).
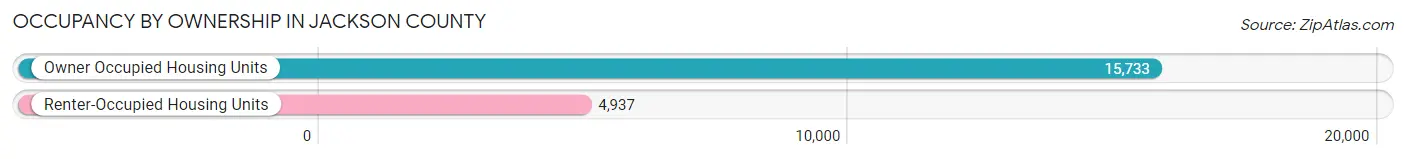
| Occupancy | # Housing Units | % Housing Units |
| Owner Occupied Housing Units | 15,733 | 76.1% |
| Renter-Occupied Housing Units | 4,937 | 23.9% |
| Total Occupied Housing Units | 20,670 | 100.0% |
Occupancy by Household Size in Jackson County
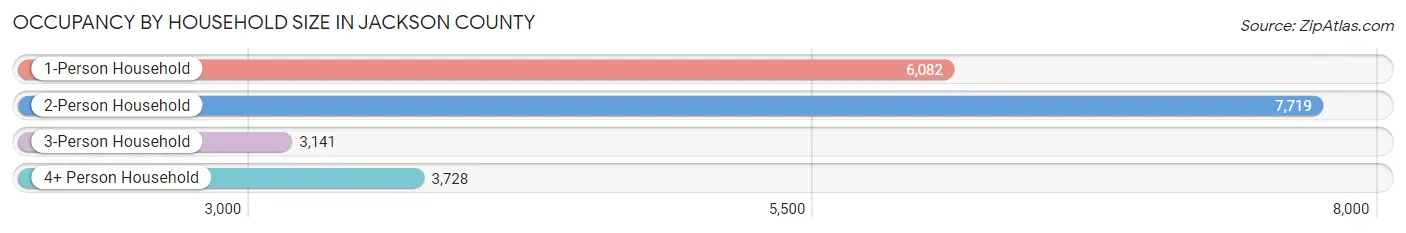
| Household Size | # Housing Units | % Housing Units |
| 1-Person Household | 6,082 | 29.4% |
| 2-Person Household | 7,719 | 37.3% |
| 3-Person Household | 3,141 | 15.2% |
| 4+ Person Household | 3,728 | 18.0% |
| Total Housing Units | 20,670 | 100.0% |
Occupancy by Ownership by Household Size in Jackson County
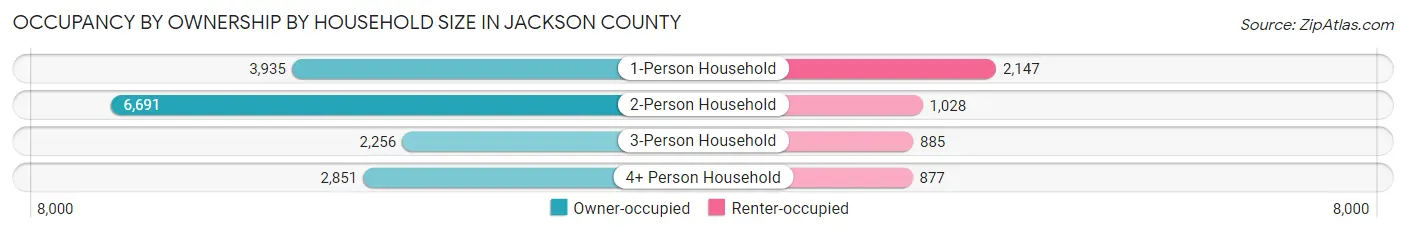
| Household Size | Owner-occupied | Renter-occupied |
| 1-Person Household | 3,935 (64.7%) | 2,147 (35.3%) |
| 2-Person Household | 6,691 (86.7%) | 1,028 (13.3%) |
| 3-Person Household | 2,256 (71.8%) | 885 (28.2%) |
| 4+ Person Household | 2,851 (76.5%) | 877 (23.5%) |
| Total Housing Units | 15,733 (76.1%) | 4,937 (23.9%) |
Occupancy by Educational Attainment in Jackson County
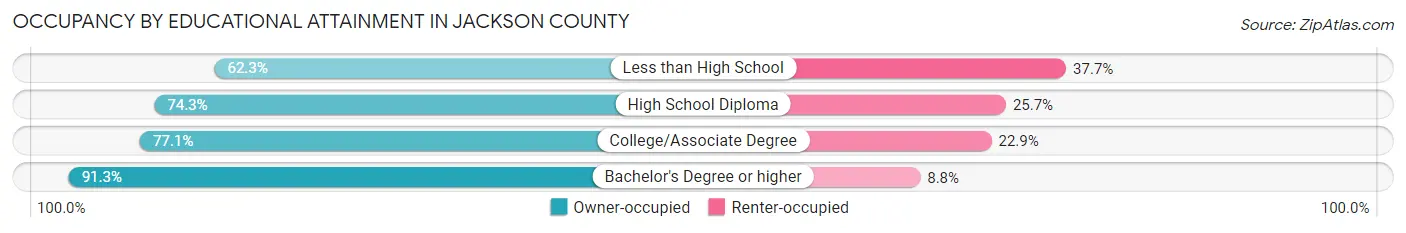
| Household Size | Owner-occupied | Renter-occupied |
| Less than High School | 2,073 (62.3%) | 1,253 (37.7%) |
| High School Diploma | 5,539 (74.3%) | 1,919 (25.7%) |
| College/Associate Degree | 4,910 (77.1%) | 1,457 (22.9%) |
| Bachelor's Degree or higher | 3,211 (91.2%) | 308 (8.7%) |
Occupancy by Age of Householder in Jackson County
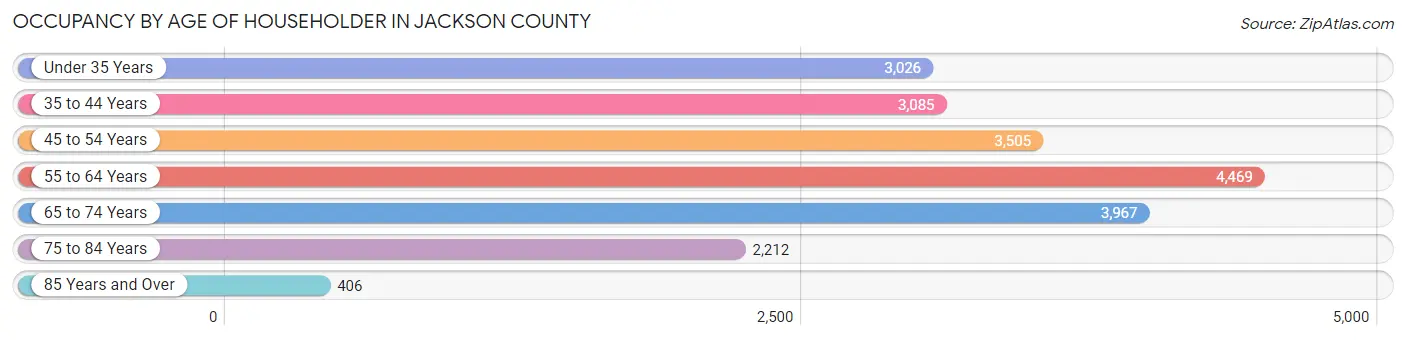
| Age Bracket | # Households | % Households |
| Under 35 Years | 3,026 | 14.6% |
| 35 to 44 Years | 3,085 | 14.9% |
| 45 to 54 Years | 3,505 | 17.0% |
| 55 to 64 Years | 4,469 | 21.6% |
| 65 to 74 Years | 3,967 | 19.2% |
| 75 to 84 Years | 2,212 | 10.7% |
| 85 Years and Over | 406 | 2.0% |
| Total | 20,670 | 100.0% |
Housing Finances in Jackson County
Median Income by Occupancy in Jackson County
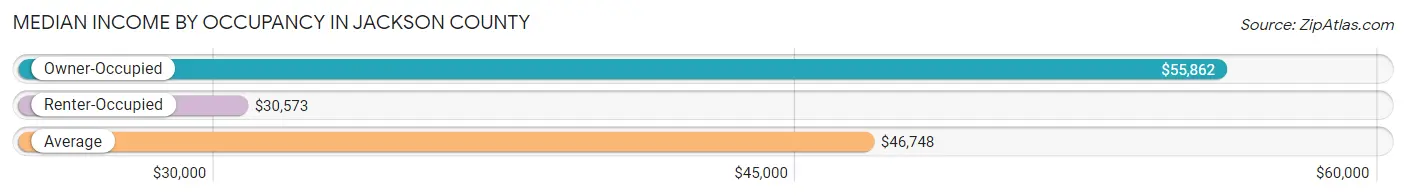
| Occupancy Type | # Households | Median Income |
| Owner-Occupied | 15,733 (76.1%) | $55,862 |
| Renter-Occupied | 4,937 (23.9%) | $30,573 |
| Average | 20,670 (100.0%) | $46,748 |
Occupancy by Householder Income Bracket in Jackson County
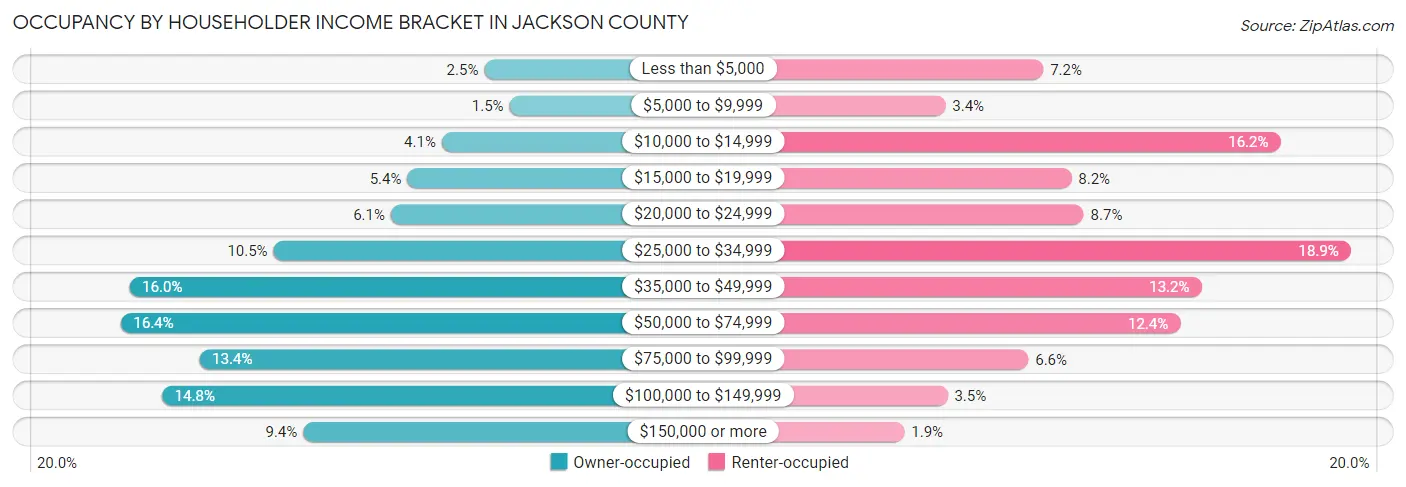
| Income Bracket | Owner-occupied | Renter-occupied |
| Less than $5,000 | 392 (2.5%) | 353 (7.1%) |
| $5,000 to $9,999 | 241 (1.5%) | 169 (3.4%) |
| $10,000 to $14,999 | 646 (4.1%) | 799 (16.2%) |
| $15,000 to $19,999 | 852 (5.4%) | 406 (8.2%) |
| $20,000 to $24,999 | 952 (6.0%) | 429 (8.7%) |
| $25,000 to $34,999 | 1,655 (10.5%) | 931 (18.9%) |
| $35,000 to $49,999 | 2,520 (16.0%) | 650 (13.2%) |
| $50,000 to $74,999 | 2,572 (16.4%) | 610 (12.4%) |
| $75,000 to $99,999 | 2,100 (13.4%) | 325 (6.6%) |
| $100,000 to $149,999 | 2,326 (14.8%) | 173 (3.5%) |
| $150,000 or more | 1,477 (9.4%) | 92 (1.9%) |
| Total | 15,733 (100.0%) | 4,937 (100.0%) |
Monthly Housing Cost Tiers in Jackson County
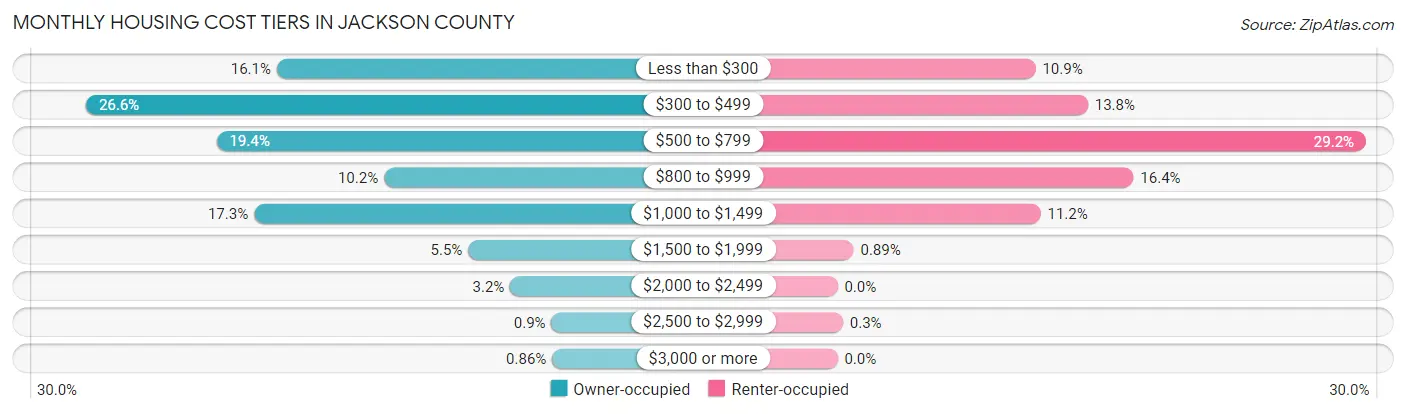
| Monthly Cost | Owner-occupied | Renter-occupied |
| Less than $300 | 2,528 (16.1%) | 540 (10.9%) |
| $300 to $499 | 4,187 (26.6%) | 683 (13.8%) |
| $500 to $799 | 3,052 (19.4%) | 1,441 (29.2%) |
| $800 to $999 | 1,597 (10.2%) | 807 (16.4%) |
| $1,000 to $1,499 | 2,726 (17.3%) | 554 (11.2%) |
| $1,500 to $1,999 | 865 (5.5%) | 44 (0.9%) |
| $2,000 to $2,499 | 501 (3.2%) | 0 (0.0%) |
| $2,500 to $2,999 | 141 (0.9%) | 15 (0.3%) |
| $3,000 or more | 136 (0.9%) | 0 (0.0%) |
| Total | 15,733 (100.0%) | 4,937 (100.0%) |
Physical Housing Characteristics in Jackson County
Housing Structures in Jackson County
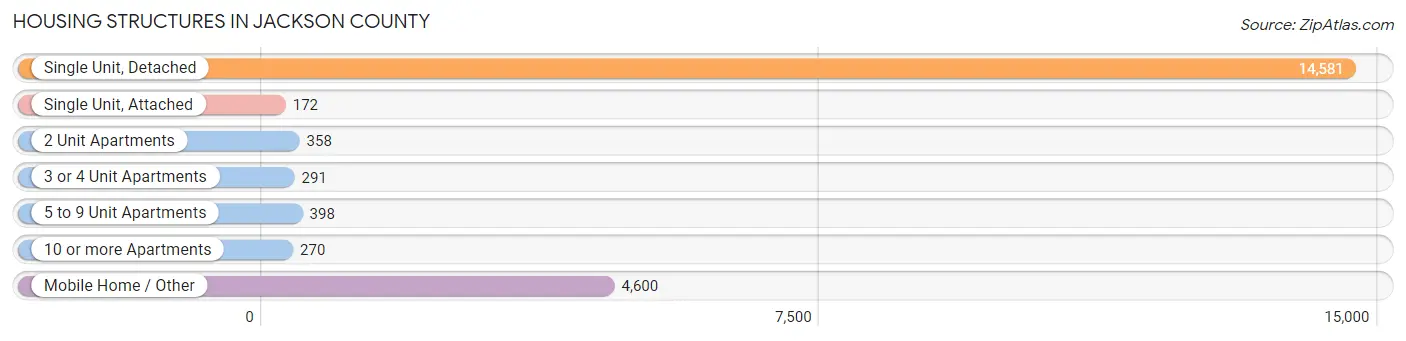
| Structure Type | # Housing Units | % Housing Units |
| Single Unit, Detached | 14,581 | 70.5% |
| Single Unit, Attached | 172 | 0.8% |
| 2 Unit Apartments | 358 | 1.7% |
| 3 or 4 Unit Apartments | 291 | 1.4% |
| 5 to 9 Unit Apartments | 398 | 1.9% |
| 10 or more Apartments | 270 | 1.3% |
| Mobile Home / Other | 4,600 | 22.3% |
| Total | 20,670 | 100.0% |
Housing Structures by Occupancy in Jackson County
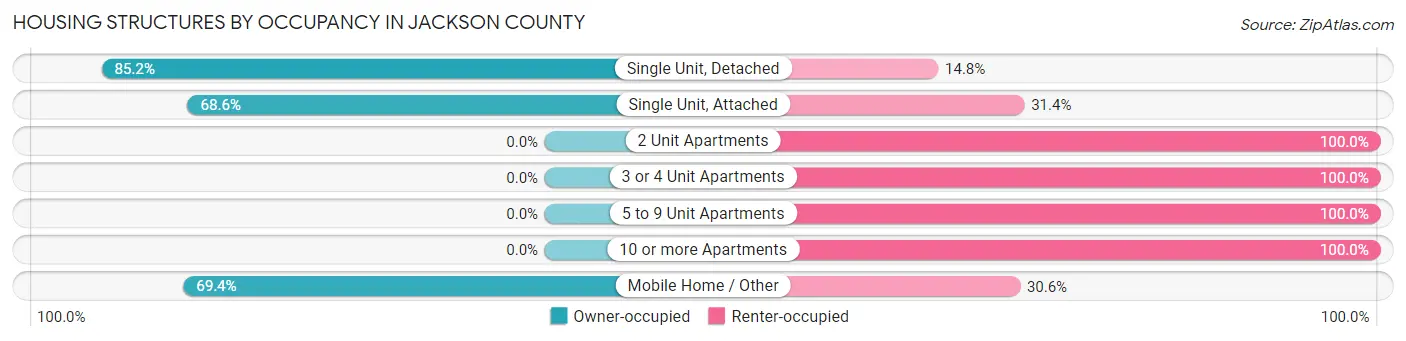
| Structure Type | Owner-occupied | Renter-occupied |
| Single Unit, Detached | 12,421 (85.2%) | 2,160 (14.8%) |
| Single Unit, Attached | 118 (68.6%) | 54 (31.4%) |
| 2 Unit Apartments | 0 (0.0%) | 358 (100.0%) |
| 3 or 4 Unit Apartments | 0 (0.0%) | 291 (100.0%) |
| 5 to 9 Unit Apartments | 0 (0.0%) | 398 (100.0%) |
| 10 or more Apartments | 0 (0.0%) | 270 (100.0%) |
| Mobile Home / Other | 3,194 (69.4%) | 1,406 (30.6%) |
| Total | 15,733 (76.1%) | 4,937 (23.9%) |
Housing Structures by Number of Rooms in Jackson County
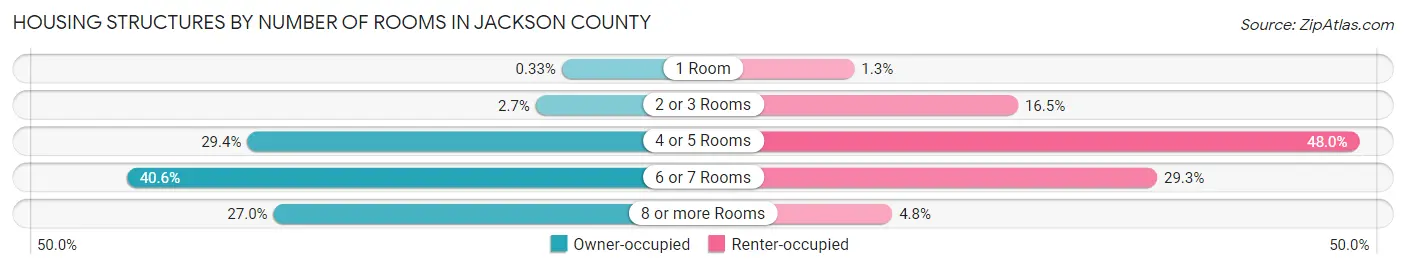
| Number of Rooms | Owner-occupied | Renter-occupied |
| 1 Room | 52 (0.3%) | 66 (1.3%) |
| 2 or 3 Rooms | 429 (2.7%) | 813 (16.5%) |
| 4 or 5 Rooms | 4,627 (29.4%) | 2,371 (48.0%) |
| 6 or 7 Rooms | 6,379 (40.6%) | 1,448 (29.3%) |
| 8 or more Rooms | 4,246 (27.0%) | 239 (4.8%) |
| Total | 15,733 (100.0%) | 4,937 (100.0%) |
Housing Structure by Heating Type in Jackson County
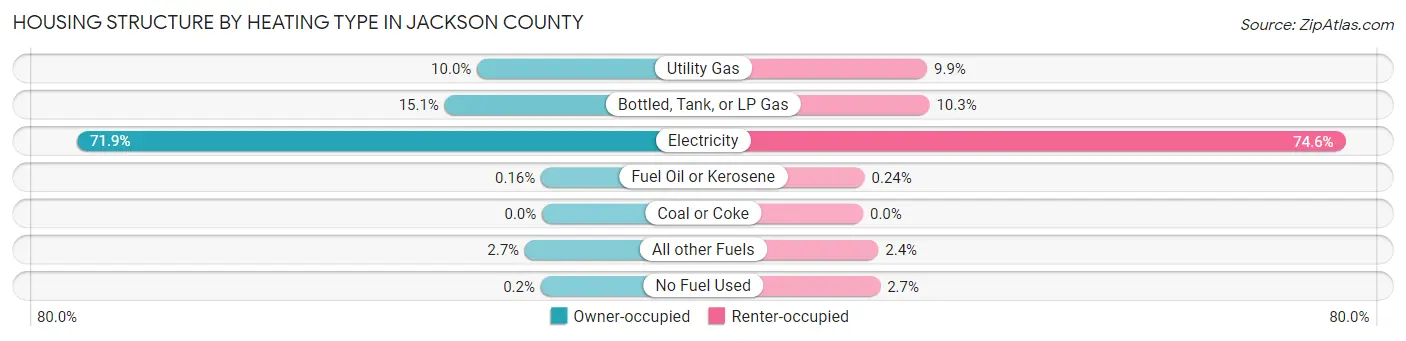
| Heating Type | Owner-occupied | Renter-occupied |
| Utility Gas | 1,580 (10.0%) | 489 (9.9%) |
| Bottled, Tank, or LP Gas | 2,369 (15.1%) | 507 (10.3%) |
| Electricity | 11,309 (71.9%) | 3,681 (74.6%) |
| Fuel Oil or Kerosene | 25 (0.2%) | 12 (0.2%) |
| Coal or Coke | 0 (0.0%) | 0 (0.0%) |
| All other Fuels | 419 (2.7%) | 117 (2.4%) |
| No Fuel Used | 31 (0.2%) | 131 (2.6%) |
| Total | 15,733 (100.0%) | 4,937 (100.0%) |
Household Vehicle Usage in Jackson County
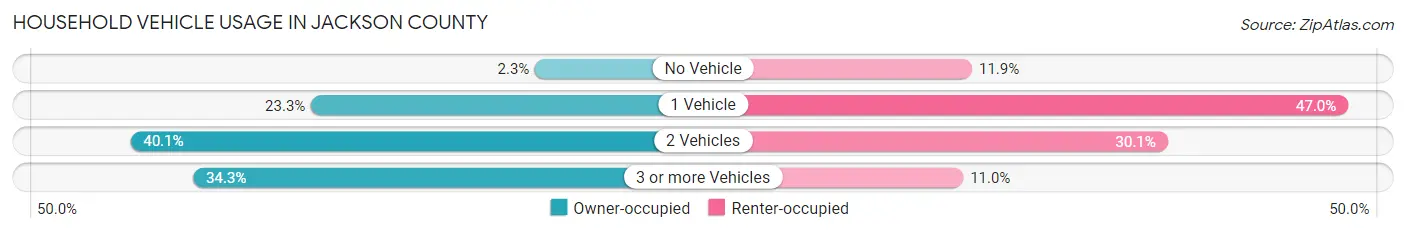
| Vehicles per Household | Owner-occupied | Renter-occupied |
| No Vehicle | 368 (2.3%) | 586 (11.9%) |
| 1 Vehicle | 3,658 (23.3%) | 2,319 (47.0%) |
| 2 Vehicles | 6,314 (40.1%) | 1,487 (30.1%) |
| 3 or more Vehicles | 5,393 (34.3%) | 545 (11.0%) |
| Total | 15,733 (100.0%) | 4,937 (100.0%) |
Real Estate & Mortgages in Jackson County
Real Estate and Mortgage Overview in Jackson County
| Characteristic | Without Mortgage | With Mortgage |
| Housing Units | 9,210 | 6,523 |
| Median Property Value | $108,500 | $159,800 |
| Median Household Income | $45,172 | $901 |
| Monthly Housing Costs | $384 | $136 |
| Real Estate Taxes | $367 | $968 |
Property Value by Mortgage Status in Jackson County
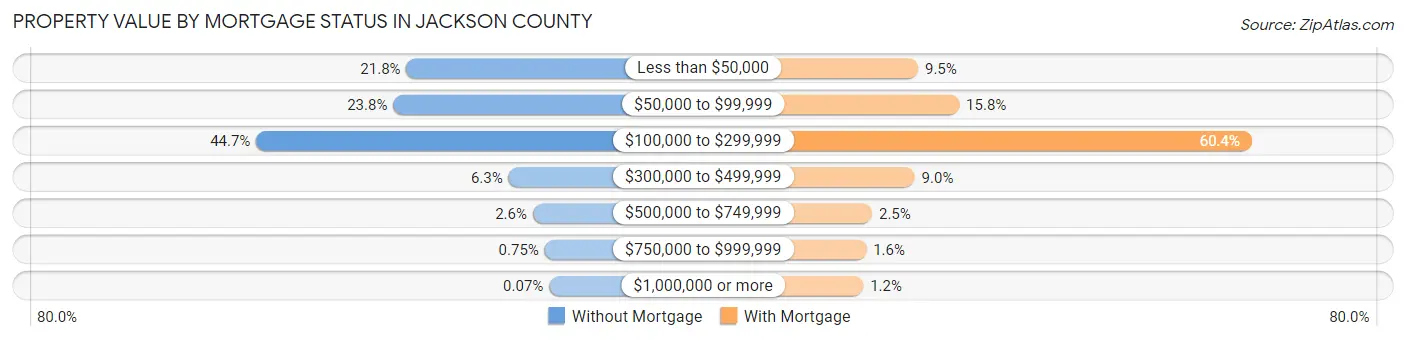
| Property Value | Without Mortgage | With Mortgage |
| Less than $50,000 | 2,010 (21.8%) | 621 (9.5%) |
| $50,000 to $99,999 | 2,195 (23.8%) | 1,030 (15.8%) |
| $100,000 to $299,999 | 4,118 (44.7%) | 3,938 (60.4%) |
| $300,000 to $499,999 | 576 (6.2%) | 588 (9.0%) |
| $500,000 to $749,999 | 236 (2.6%) | 164 (2.5%) |
| $750,000 to $999,999 | 69 (0.7%) | 106 (1.6%) |
| $1,000,000 or more | 6 (0.1%) | 76 (1.2%) |
| Total | 9,210 (100.0%) | 6,523 (100.0%) |
Household Income by Mortgage Status in Jackson County
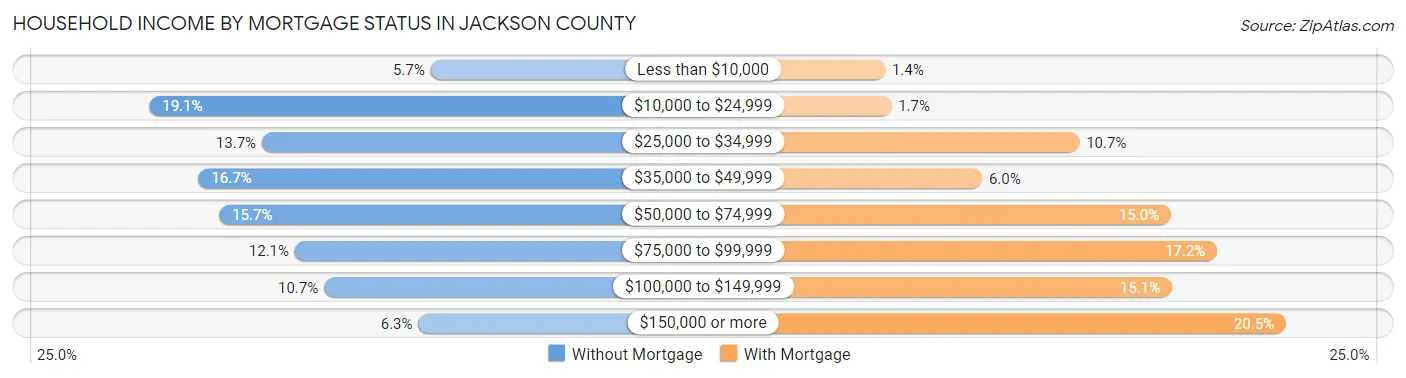
| Household Income | Without Mortgage | With Mortgage |
| Less than $10,000 | 522 (5.7%) | 91 (1.4%) |
| $10,000 to $24,999 | 1,755 (19.1%) | 111 (1.7%) |
| $25,000 to $34,999 | 1,262 (13.7%) | 695 (10.6%) |
| $35,000 to $49,999 | 1,540 (16.7%) | 393 (6.0%) |
| $50,000 to $74,999 | 1,449 (15.7%) | 980 (15.0%) |
| $75,000 to $99,999 | 1,117 (12.1%) | 1,123 (17.2%) |
| $100,000 to $149,999 | 989 (10.7%) | 983 (15.1%) |
| $150,000 or more | 576 (6.2%) | 1,337 (20.5%) |
| Total | 9,210 (100.0%) | 6,523 (100.0%) |
Property Value to Household Income Ratio in Jackson County
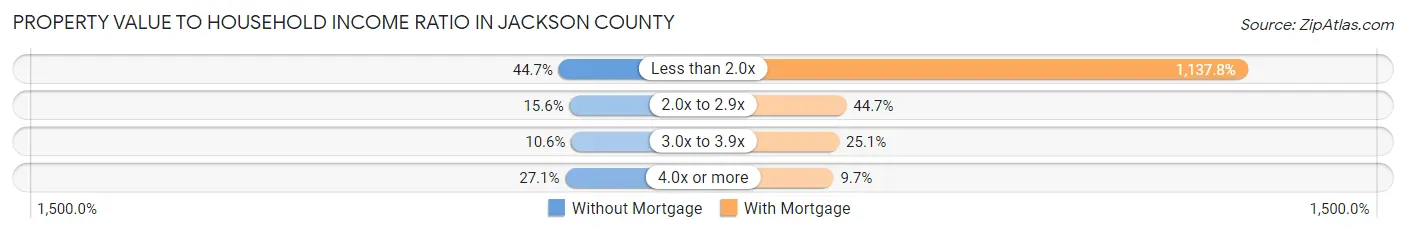
| Value-to-Income Ratio | Without Mortgage | With Mortgage |
| Less than 2.0x | 4,119 (44.7%) | 74,221 (1,137.8%) |
| 2.0x to 2.9x | 1,440 (15.6%) | 2,917 (44.7%) |
| 3.0x to 3.9x | 980 (10.6%) | 1,636 (25.1%) |
| 4.0x or more | 2,492 (27.1%) | 634 (9.7%) |
| Total | 9,210 (100.0%) | 6,523 (100.0%) |
Real Estate Taxes by Mortgage Status in Jackson County
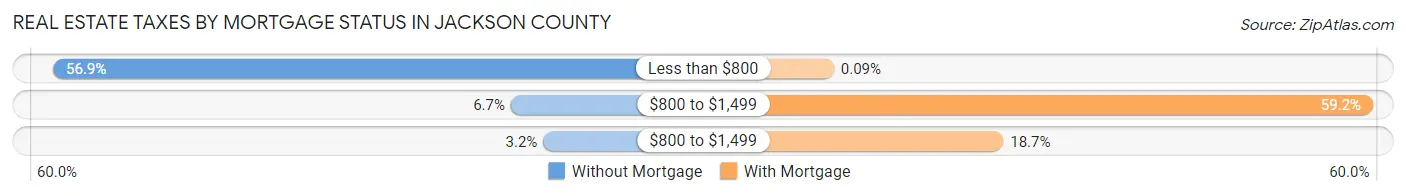
| Property Taxes | Without Mortgage | With Mortgage |
| Less than $800 | 5,239 (56.9%) | 6 (0.1%) |
| $800 to $1,499 | 619 (6.7%) | 3,859 (59.2%) |
| $800 to $1,499 | 292 (3.2%) | 1,217 (18.7%) |
| Total | 9,210 (100.0%) | 6,523 (100.0%) |
Health & Disability in Jackson County
Health Insurance Coverage by Age in Jackson County
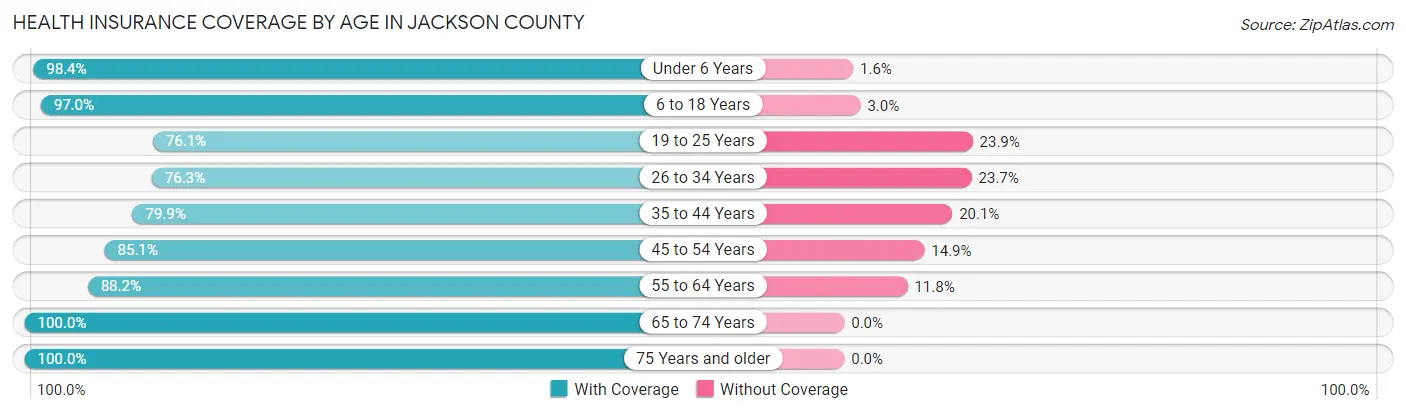
| Age Bracket | With Coverage | Without Coverage |
| Under 6 Years | 3,110 (98.4%) | 52 (1.6%) |
| 6 to 18 Years | 8,051 (97.0%) | 251 (3.0%) |
| 19 to 25 Years | 3,013 (76.1%) | 948 (23.9%) |
| 26 to 34 Years | 4,016 (76.3%) | 1,250 (23.7%) |
| 35 to 44 Years | 5,123 (79.9%) | 1,290 (20.1%) |
| 45 to 54 Years | 5,899 (85.1%) | 1,035 (14.9%) |
| 55 to 64 Years | 6,634 (88.2%) | 886 (11.8%) |
| 65 to 74 Years | 6,382 (100.0%) | 0 (0.0%) |
| 75 Years and older | 4,143 (100.0%) | 0 (0.0%) |
| Total | 46,371 (89.0%) | 5,712 (11.0%) |
Health Insurance Coverage by Citizenship Status in Jackson County
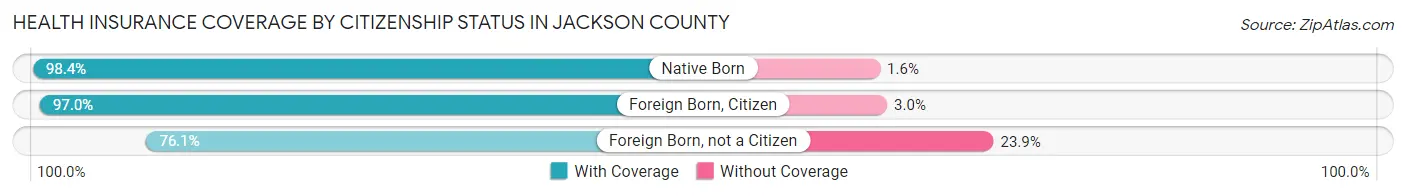
| Citizenship Status | With Coverage | Without Coverage |
| Native Born | 3,110 (98.4%) | 52 (1.6%) |
| Foreign Born, Citizen | 8,051 (97.0%) | 251 (3.0%) |
| Foreign Born, not a Citizen | 3,013 (76.1%) | 948 (23.9%) |
Health Insurance Coverage by Household Income in Jackson County
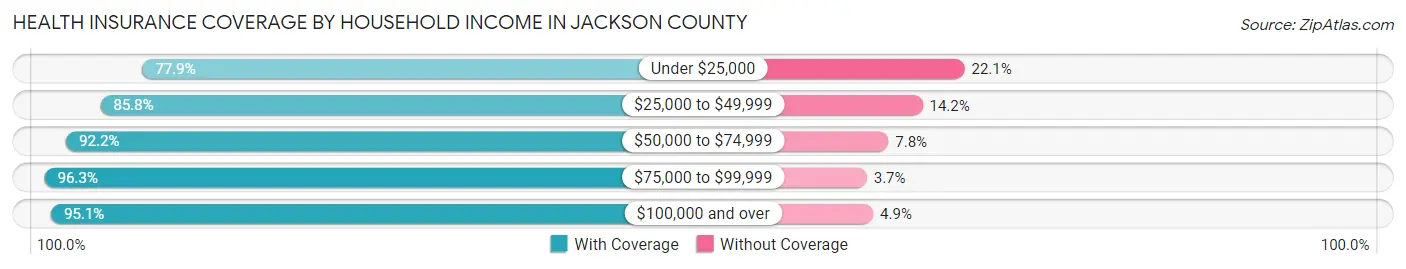
| Household Income | With Coverage | Without Coverage |
| Under $25,000 | 7,679 (77.9%) | 2,174 (22.1%) |
| $25,000 to $49,999 | 11,824 (85.8%) | 1,955 (14.2%) |
| $50,000 to $74,999 | 7,591 (92.2%) | 641 (7.8%) |
| $75,000 to $99,999 | 7,009 (96.3%) | 272 (3.7%) |
| $100,000 and over | 12,135 (95.1%) | 630 (4.9%) |
Public vs Private Health Insurance Coverage by Age in Jackson County
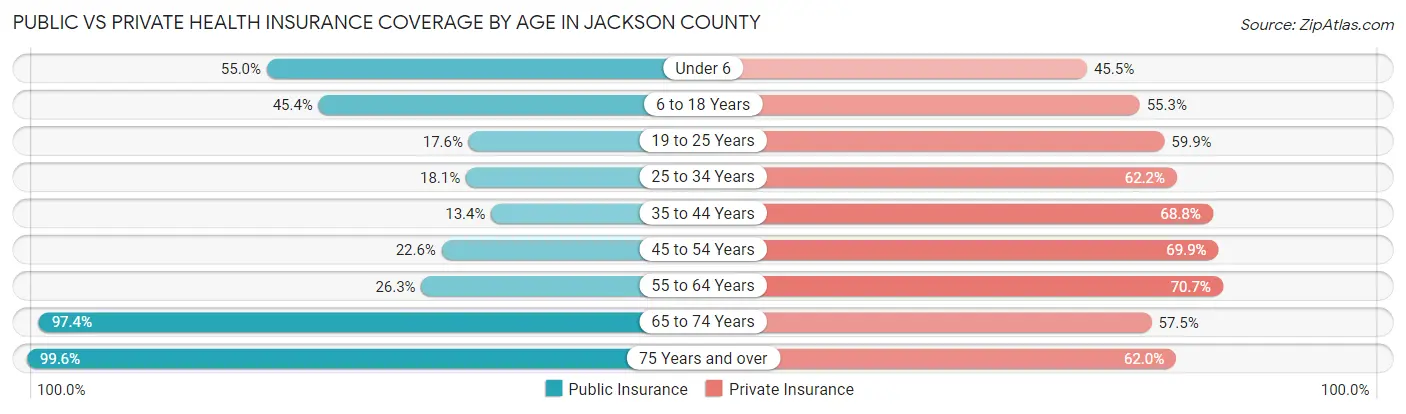
| Age Bracket | Public Insurance | Private Insurance |
| Under 6 | 1,740 (55.0%) | 1,439 (45.5%) |
| 6 to 18 Years | 3,770 (45.4%) | 4,591 (55.3%) |
| 19 to 25 Years | 695 (17.5%) | 2,372 (59.9%) |
| 25 to 34 Years | 951 (18.1%) | 3,275 (62.2%) |
| 35 to 44 Years | 858 (13.4%) | 4,414 (68.8%) |
| 45 to 54 Years | 1,566 (22.6%) | 4,847 (69.9%) |
| 55 to 64 Years | 1,981 (26.3%) | 5,316 (70.7%) |
| 65 to 74 Years | 6,214 (97.4%) | 3,669 (57.5%) |
| 75 Years and over | 4,125 (99.6%) | 2,570 (62.0%) |
| Total | 21,900 (42.0%) | 32,493 (62.4%) |
Disability Status by Sex by Age in Jackson County
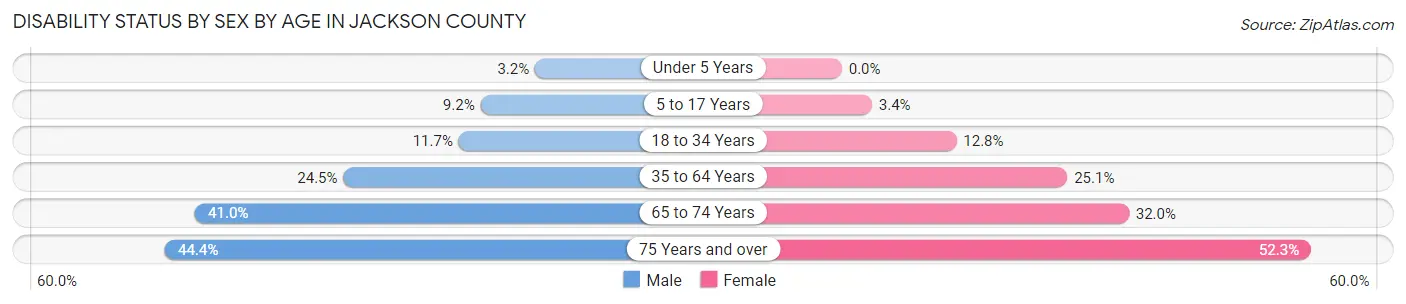
| Age Bracket | Male | Female |
| Under 5 Years | 42 (3.2%) | 0 (0.0%) |
| 5 to 17 Years | 387 (9.2%) | 135 (3.4%) |
| 18 to 34 Years | 576 (11.7%) | 626 (12.8%) |
| 35 to 64 Years | 2,551 (24.5%) | 2,625 (25.1%) |
| 65 to 74 Years | 1,235 (41.0%) | 1,077 (32.0%) |
| 75 Years and over | 762 (44.4%) | 1,267 (52.2%) |
Disability Class by Sex by Age in Jackson County
Disability Class: Hearing Difficulty
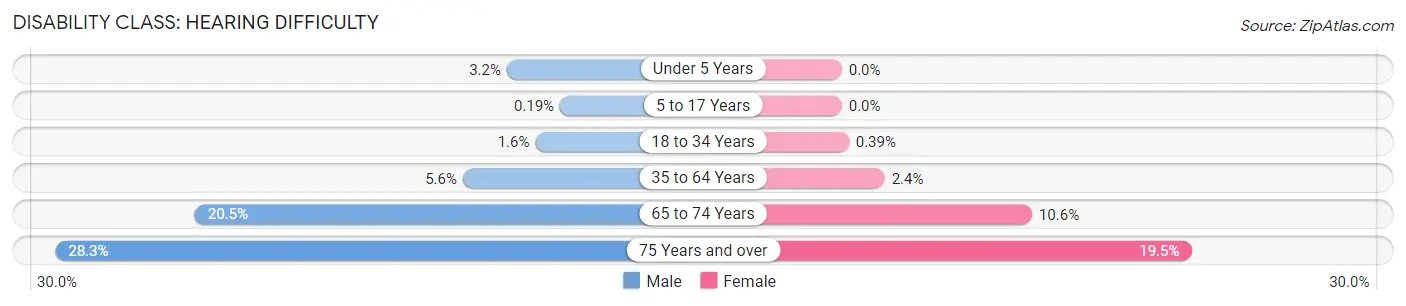
| Age Bracket | Male | Female |
| Under 5 Years | 42 (3.2%) | 0 (0.0%) |
| 5 to 17 Years | 8 (0.2%) | 0 (0.0%) |
| 18 to 34 Years | 77 (1.6%) | 19 (0.4%) |
| 35 to 64 Years | 583 (5.6%) | 250 (2.4%) |
| 65 to 74 Years | 618 (20.5%) | 357 (10.6%) |
| 75 Years and over | 486 (28.3%) | 472 (19.5%) |
Disability Class: Vision Difficulty
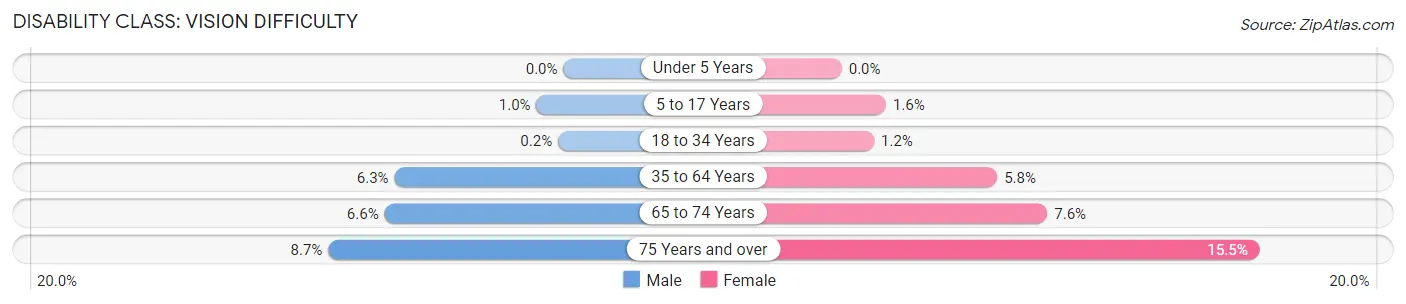
| Age Bracket | Male | Female |
| Under 5 Years | 0 (0.0%) | 0 (0.0%) |
| 5 to 17 Years | 42 (1.0%) | 66 (1.6%) |
| 18 to 34 Years | 10 (0.2%) | 59 (1.2%) |
| 35 to 64 Years | 653 (6.3%) | 603 (5.8%) |
| 65 to 74 Years | 200 (6.6%) | 257 (7.6%) |
| 75 Years and over | 150 (8.7%) | 376 (15.5%) |
Disability Class: Cognitive Difficulty
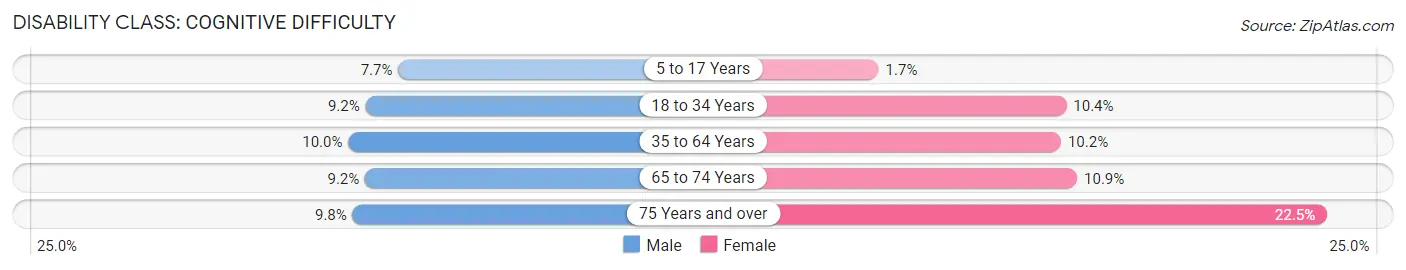
| Age Bracket | Male | Female |
| 5 to 17 Years | 321 (7.7%) | 69 (1.7%) |
| 18 to 34 Years | 454 (9.2%) | 511 (10.4%) |
| 35 to 64 Years | 1,039 (10.0%) | 1,063 (10.2%) |
| 65 to 74 Years | 277 (9.2%) | 368 (10.9%) |
| 75 Years and over | 168 (9.8%) | 546 (22.5%) |
Disability Class: Ambulatory Difficulty
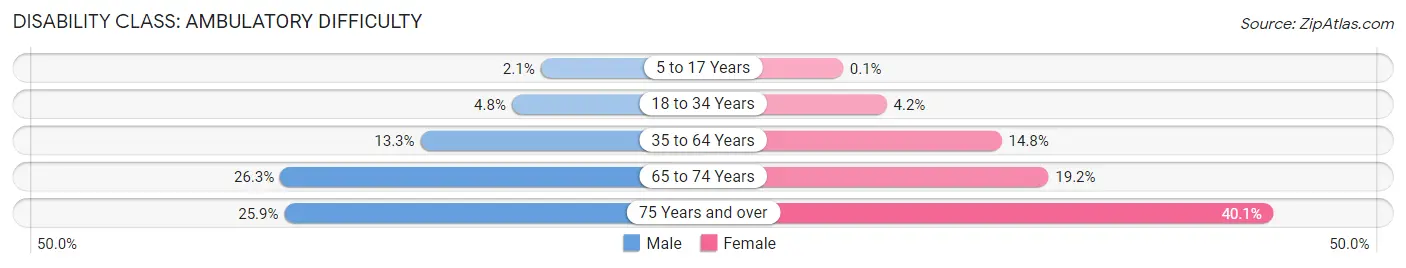
| Age Bracket | Male | Female |
| 5 to 17 Years | 89 (2.1%) | 4 (0.1%) |
| 18 to 34 Years | 237 (4.8%) | 204 (4.2%) |
| 35 to 64 Years | 1,382 (13.3%) | 1,550 (14.8%) |
| 65 to 74 Years | 792 (26.3%) | 646 (19.2%) |
| 75 Years and over | 445 (25.9%) | 972 (40.1%) |
Disability Class: Self-Care Difficulty
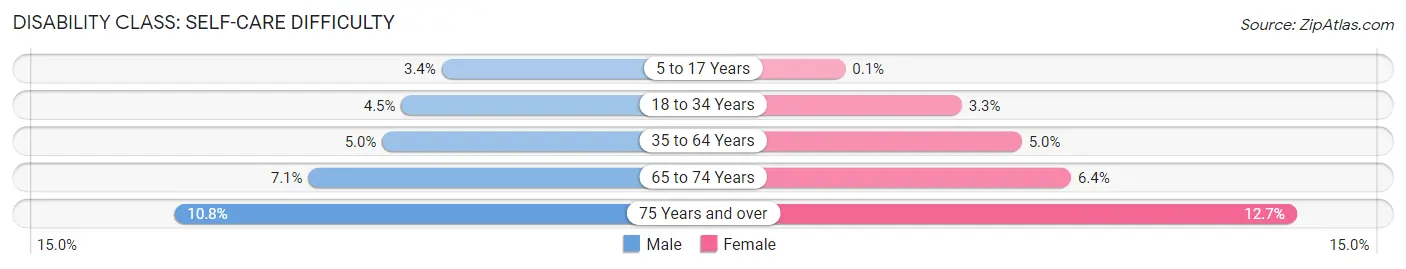
| Age Bracket | Male | Female |
| 5 to 17 Years | 142 (3.4%) | 4 (0.1%) |
| 18 to 34 Years | 223 (4.5%) | 164 (3.3%) |
| 35 to 64 Years | 525 (5.0%) | 524 (5.0%) |
| 65 to 74 Years | 214 (7.1%) | 215 (6.4%) |
| 75 Years and over | 186 (10.8%) | 307 (12.7%) |
Technology Access in Jackson County
Computing Device Access in Jackson County
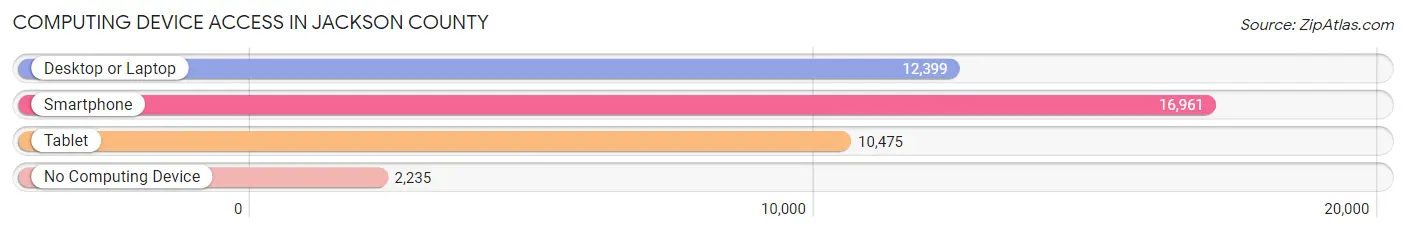
| Device Type | # Households | % Households |
| Desktop or Laptop | 12,399 | 60.0% |
| Smartphone | 16,961 | 82.1% |
| Tablet | 10,475 | 50.7% |
| No Computing Device | 2,235 | 10.8% |
| Total | 20,670 | 100.0% |
Internet Access in Jackson County
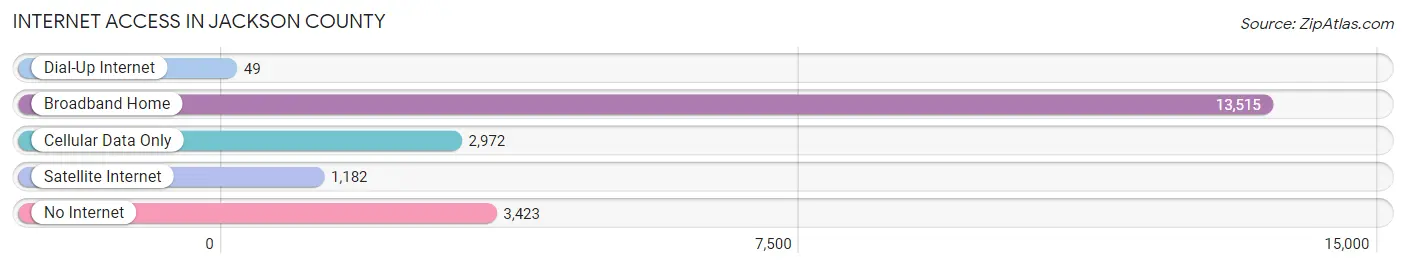
| Internet Type | # Households | % Households |
| Dial-Up Internet | 49 | 0.2% |
| Broadband Home | 13,515 | 65.4% |
| Cellular Data Only | 2,972 | 14.4% |
| Satellite Internet | 1,182 | 5.7% |
| No Internet | 3,423 | 16.6% |
| Total | 20,670 | 100.0% |
Jackson County Summary
Jackson County is located in the northeastern corner of the state of Alabama. It is bordered by DeKalb County to the north, Madison County to the east, Marshall County to the south, and Cherokee County to the west. The county seat is Scottsboro, and the largest city is Bridgeport. The county was created in 1819 and named for Andrew Jackson, the seventh president of the United States.
Geography
Jackson County covers an area of 576 square miles and is located in the Appalachian Mountains. The terrain is mostly hilly and mountainous, with the highest point being Lookout Mountain at 1,841 feet. The county is drained by the Paint Rock River, which flows through the county from north to south. Other major waterways include the Tennessee River, which forms the western border of the county, and the Little River, which flows through the county from east to west.
The climate of Jackson County is humid subtropical, with hot, humid summers and mild winters. The average annual temperature is 64°F, and the average annual precipitation is 52 inches.
Demographics
As of the 2010 census, Jackson County had a population of 53,926. The racial makeup of the county was 91.3% White, 5.3% Black or African American, 0.4% Native American, 0.3% Asian, 0.1% Pacific Islander, 1.2% from other races, and 1.4% from two or more races. Hispanic or Latino of any race were 2.7% of the population.
The median household income in Jackson County was $37,945, and the median family income was $45,945. The per capita income was $19,845. About 17.2% of the population was below the poverty line.
Economy
The economy of Jackson County is largely based on agriculture and manufacturing. The county is home to several large poultry farms, as well as cattle and dairy farms. The county is also home to several manufacturing plants, including a paper mill, a furniture factory, and a plastics plant.
The county is also home to several tourist attractions, including the Unclaimed Baggage Center, the Little River Canyon National Preserve, and the Jackson County Historical Museum.
Conclusion
Jackson County is a rural county located in the northeastern corner of Alabama. It is home to a diverse population and a strong agricultural and manufacturing economy. The county is also home to several tourist attractions, making it a popular destination for visitors.
Common Questions
What is Per Capita Income in Jackson County?
Per Capita income in Jackson County is $27,695.
What is the Median Family Income in Jackson County?
Median Family Income in Jackson County is $59,400.
What is the Median Household income in Jackson County?
Median Household Income in Jackson County is $46,748.
What is Income or Wage Gap in Jackson County?
Income or Wage Gap in Jackson County is 34.8%.
Women in Jackson County earn 65.2 cents for every dollar earned by a man.
What is Family Income Deficit in Jackson County?
Family Income Deficit in Jackson County is $8,952.
Families that are below poverty line in Jackson County earn $8,952 less on average than the poverty threshold level.
What is Inequality or Gini Index in Jackson County?
Inequality or Gini Index in Jackson County is 0.46.
What is the Total Population of Jackson County?
Total Population of Jackson County is 52,618.
What is the Total Male Population of Jackson County?
Total Male Population of Jackson County is 25,883.
What is the Total Female Population of Jackson County?
Total Female Population of Jackson County is 26,735.
What is the Ratio of Males per 100 Females in Jackson County?
There are 96.81 Males per 100 Females in Jackson County.
What is the Ratio of Females per 100 Males in Jackson County?
There are 103.29 Females per 100 Males in Jackson County.
What is the Median Population Age in Jackson County?
Median Population Age in Jackson County is 43.0 Years.
What is the Average Family Size in Jackson County
Average Family Size in Jackson County is 3.1 People.
What is the Average Household Size in Jackson County
Average Household Size in Jackson County is 2.5 People.
How Large is the Labor Force in Jackson County?
There are 21,729 People in the Labor Forcein in Jackson County.
What is the Percentage of People in the Labor Force in Jackson County?
50.5% of People are in the Labor Force in Jackson County.
What is the Unemployment Rate in Jackson County?
Unemployment Rate in Jackson County is 6.0%.