Tuscaloosa County, AL Map & Demographics
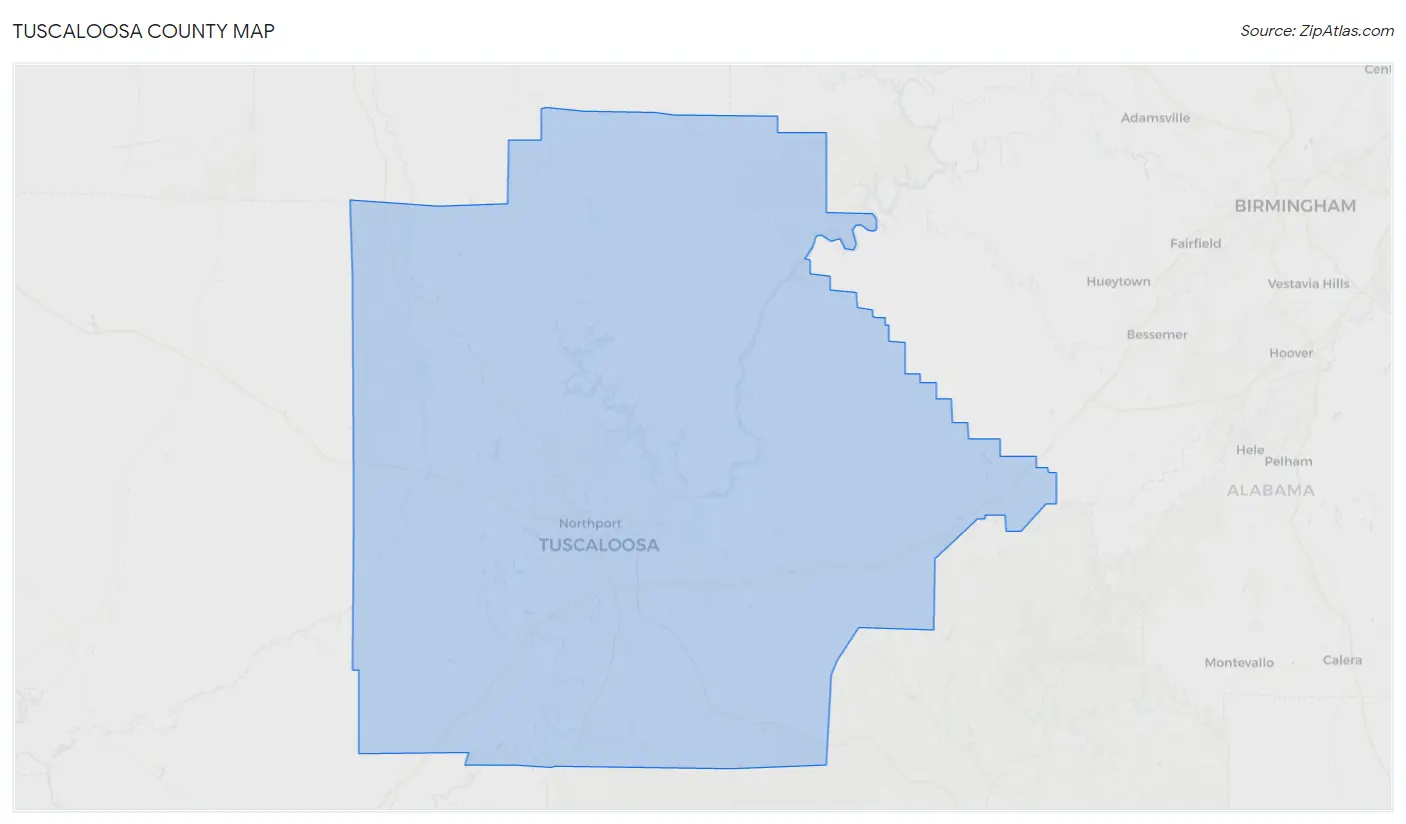
Tuscaloosa County Map
Tuscaloosa County Overview
$32,141
PER CAPITA INCOME
$83,129
AVG FAMILY INCOME
$61,645
AVG HOUSEHOLD INCOME
33.5%
WAGE / INCOME GAP [ % ]
66.5¢/ $1
WAGE / INCOME GAP [ $ ]
$10,489
FAMILY INCOME DEFICIT
0.47
INEQUALITY / GINI INDEX
231,558
TOTAL POPULATION
111,807
MALE POPULATION
119,751
FEMALE POPULATION
93.37
MALES / 100 FEMALES
107.11
FEMALES / 100 MALES
32.8
MEDIAN AGE
3.2
AVG FAMILY SIZE
2.6
AVG HOUSEHOLD SIZE
116,694
LABOR FORCE [ PEOPLE ]
61.6%
PERCENT IN LABOR FORCE
5.5%
UNEMPLOYMENT RATE
Tuscaloosa County Area Codes
Income in Tuscaloosa County
Income Overview in Tuscaloosa County
Per Capita Income in Tuscaloosa County is $32,141, while median incomes of families and households are $83,129 and $61,645 respectively.
| Characteristic | Number | Measure |
| Per Capita Income | 231,558 | $32,141 |
| Median Family Income | 53,530 | $83,129 |
| Mean Family Income | 53,530 | $102,175 |
| Median Household Income | 84,743 | $61,645 |
| Mean Household Income | 84,743 | $82,543 |
| Income Deficit | 53,530 | $10,489 |
| Wage / Income Gap (%) | 231,558 | 33.51% |
| Wage / Income Gap ($) | 231,558 | 66.49¢ per $1 |
| Gini / Inequality Index | 231,558 | 0.47 |
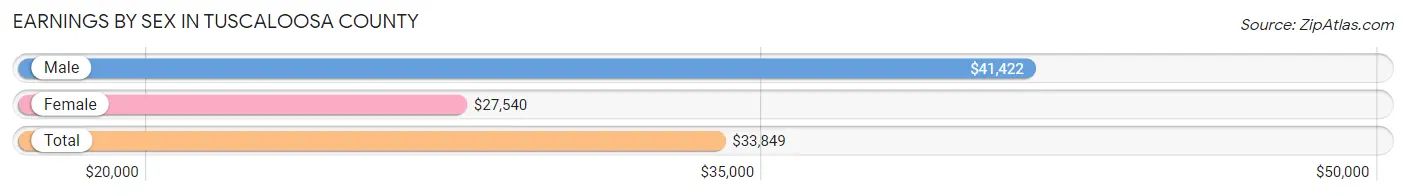
Earnings by Sex in Tuscaloosa County
Average Earnings in Tuscaloosa County are $33,849, $41,422 for men and $27,540 for women, a difference of 33.5%.
| Sex | Number | Average Earnings |
| Male | 65,025 (51.3%) | $41,422 |
| Female | 61,836 (48.7%) | $27,540 |
| Total | 126,861 (100.0%) | $33,849 |
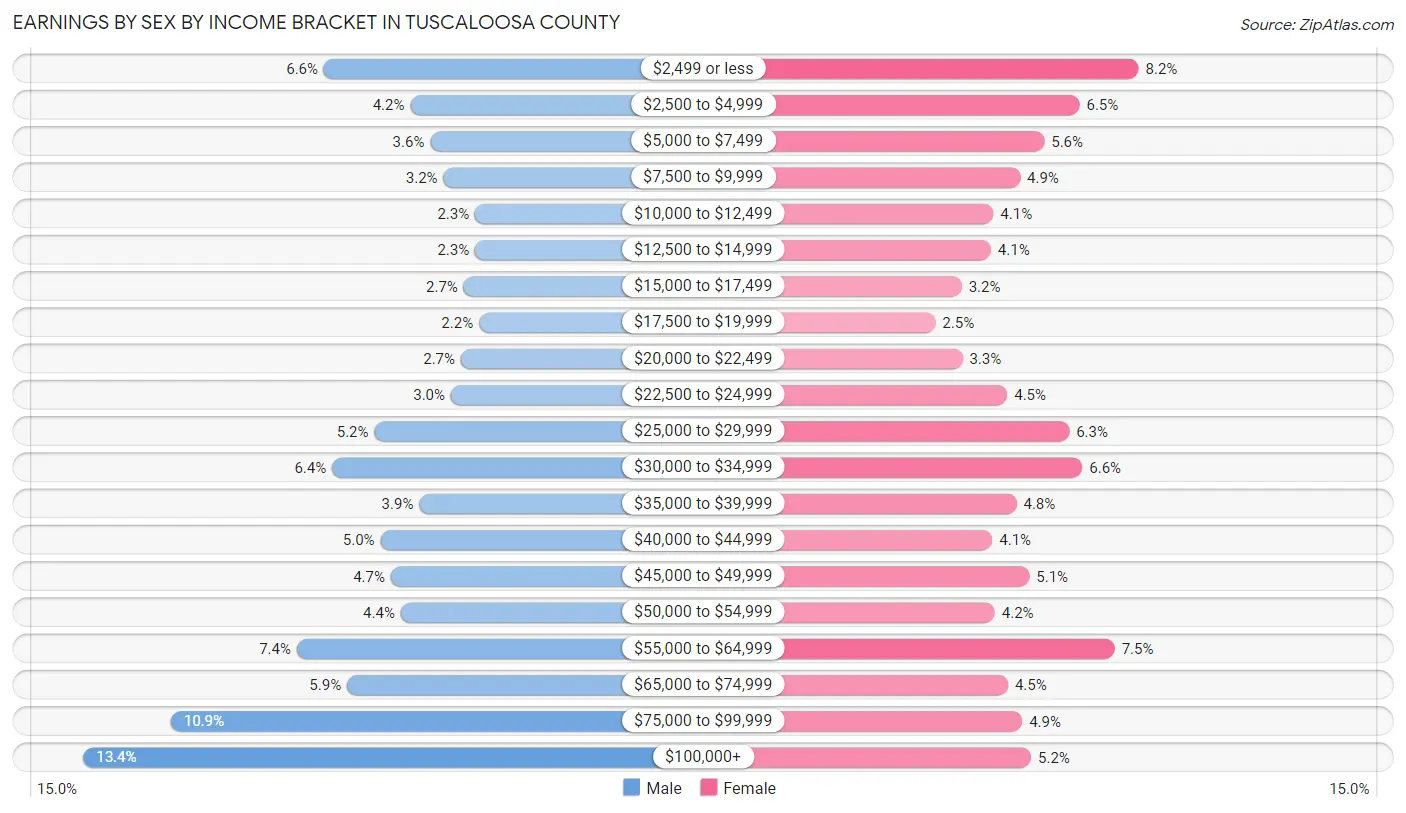
Earnings by Sex by Income Bracket in Tuscaloosa County
The most common earnings brackets in Tuscaloosa County are $100,000+ for men (8,680 | 13.4%) and $2,499 or less for women (5,069 | 8.2%).
| Income | Male | Female |
| $2,499 or less | 4,284 (6.6%) | 5,069 (8.2%) |
| $2,500 to $4,999 | 2,707 (4.2%) | 4,045 (6.5%) |
| $5,000 to $7,499 | 2,340 (3.6%) | 3,431 (5.6%) |
| $7,500 to $9,999 | 2,098 (3.2%) | 3,013 (4.9%) |
| $10,000 to $12,499 | 1,522 (2.3%) | 2,549 (4.1%) |
| $12,500 to $14,999 | 1,519 (2.3%) | 2,503 (4.1%) |
| $15,000 to $17,499 | 1,727 (2.7%) | 1,998 (3.2%) |
| $17,500 to $19,999 | 1,452 (2.2%) | 1,537 (2.5%) |
| $20,000 to $22,499 | 1,780 (2.7%) | 2,012 (3.3%) |
| $22,500 to $24,999 | 1,962 (3.0%) | 2,789 (4.5%) |
| $25,000 to $29,999 | 3,362 (5.2%) | 3,867 (6.2%) |
| $30,000 to $34,999 | 4,136 (6.4%) | 4,093 (6.6%) |
| $35,000 to $39,999 | 2,543 (3.9%) | 2,947 (4.8%) |
| $40,000 to $44,999 | 3,250 (5.0%) | 2,532 (4.1%) |
| $45,000 to $49,999 | 3,061 (4.7%) | 3,171 (5.1%) |
| $50,000 to $54,999 | 2,879 (4.4%) | 2,571 (4.2%) |
| $55,000 to $64,999 | 4,777 (7.3%) | 4,657 (7.5%) |
| $65,000 to $74,999 | 3,863 (5.9%) | 2,804 (4.5%) |
| $75,000 to $99,999 | 7,083 (10.9%) | 3,046 (4.9%) |
| $100,000+ | 8,680 (13.4%) | 3,202 (5.2%) |
| Total | 65,025 (100.0%) | 61,836 (100.0%) |
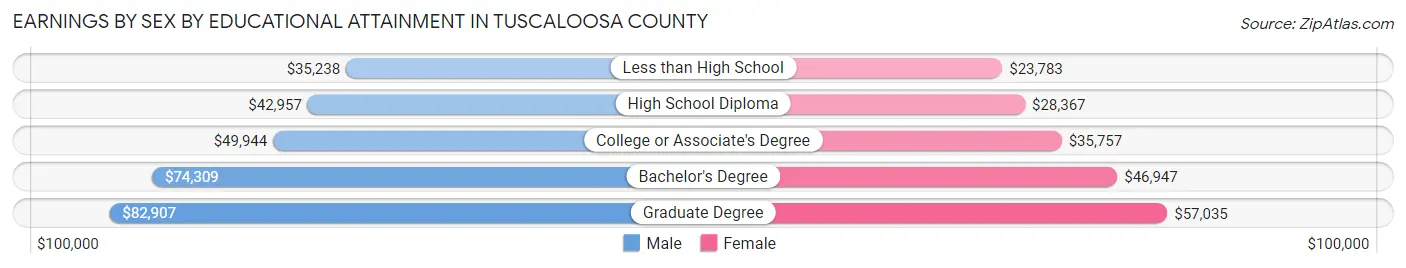
Earnings by Sex by Educational Attainment in Tuscaloosa County
Average earnings in Tuscaloosa County are $52,537 for men and $37,276 for women, a difference of 29.0%. Men with an educational attainment of graduate degree enjoy the highest average annual earnings of $82,907, while those with less than high school education earn the least with $35,238. Women with an educational attainment of graduate degree earn the most with the average annual earnings of $57,035, while those with less than high school education have the smallest earnings of $23,783.
| Educational Attainment | Male Income | Female Income |
| Less than High School | $35,238 | $23,783 |
| High School Diploma | $42,957 | $28,367 |
| College or Associate's Degree | $49,944 | $35,757 |
| Bachelor's Degree | $74,309 | $46,947 |
| Graduate Degree | $82,907 | $57,035 |
| Total | $52,537 | $37,276 |
Family Income in Tuscaloosa County
Family Income Brackets in Tuscaloosa County
According to the Tuscaloosa County family income data, there are 11,562 families falling into the $100,000 to $149,999 income range, which is the most common income bracket and makes up 21.6% of all families. Conversely, the $10,000 to $14,999 income bracket is the least frequent group with only 1,017 families (1.9%) belonging to this category.
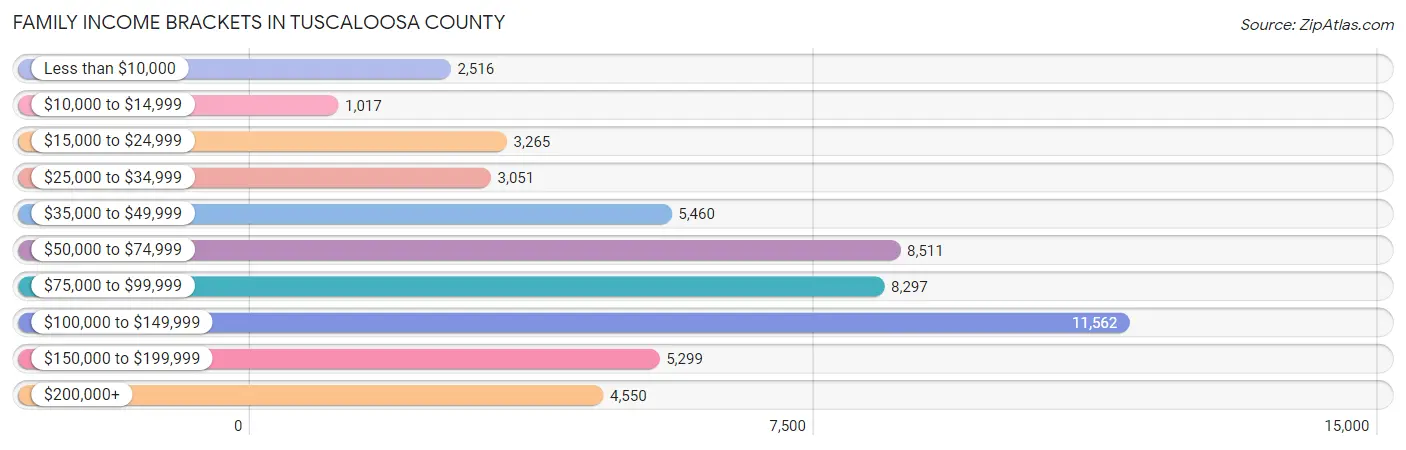
| Income Bracket | # Families | % Families |
| Less than $10,000 | 2,516 | 4.7% |
| $10,000 to $14,999 | 1,017 | 1.9% |
| $15,000 to $24,999 | 3,265 | 6.1% |
| $25,000 to $34,999 | 3,051 | 5.7% |
| $35,000 to $49,999 | 5,460 | 10.2% |
| $50,000 to $74,999 | 8,511 | 15.9% |
| $75,000 to $99,999 | 8,297 | 15.5% |
| $100,000 to $149,999 | 11,562 | 21.6% |
| $150,000 to $199,999 | 5,299 | 9.9% |
| $200,000+ | 4,550 | 8.5% |
Family Income by Famaliy Size in Tuscaloosa County
4-person families (8,953 | 16.7%) account for the highest median family income in Tuscaloosa County with $102,113 per family, while 2-person families (25,310 | 47.3%) have the highest median income of $37,817 per family member.
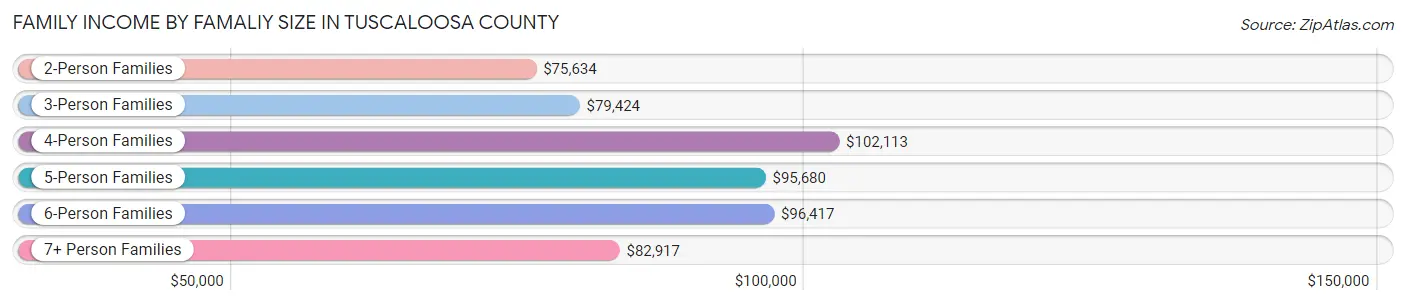
| Income Bracket | # Families | Median Income |
| 2-Person Families | 25,310 (47.3%) | $75,634 |
| 3-Person Families | 12,564 (23.5%) | $79,424 |
| 4-Person Families | 8,953 (16.7%) | $102,113 |
| 5-Person Families | 4,500 (8.4%) | $95,680 |
| 6-Person Families | 1,582 (3.0%) | $96,417 |
| 7+ Person Families | 621 (1.2%) | $82,917 |
| Total | 53,530 (100.0%) | $83,129 |
Family Income by Number of Earners in Tuscaloosa County
The median family income in Tuscaloosa County is $83,129, with families comprising 3+ earners (4,916) having the highest median family income of $142,889, while families with no earners (8,025) have the lowest median family income of $46,322, accounting for 9.2% and 15.0% of families, respectively.
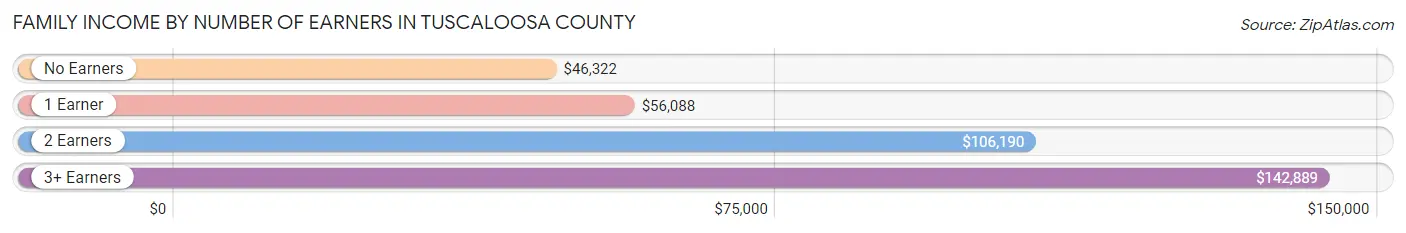
| Number of Earners | # Families | Median Income |
| No Earners | 8,025 (15.0%) | $46,322 |
| 1 Earner | 18,248 (34.1%) | $56,088 |
| 2 Earners | 22,341 (41.7%) | $106,190 |
| 3+ Earners | 4,916 (9.2%) | $142,889 |
| Total | 53,530 (100.0%) | $83,129 |
Household Income in Tuscaloosa County
Household Income Brackets in Tuscaloosa County
With 13,983 households falling in the category, the $50,000 to $74,999 income range is the most frequent in Tuscaloosa County, accounting for 16.5% of all households. In contrast, only 3,644 households (4.3%) fall into the $10,000 to $14,999 income bracket, making it the least populous group.
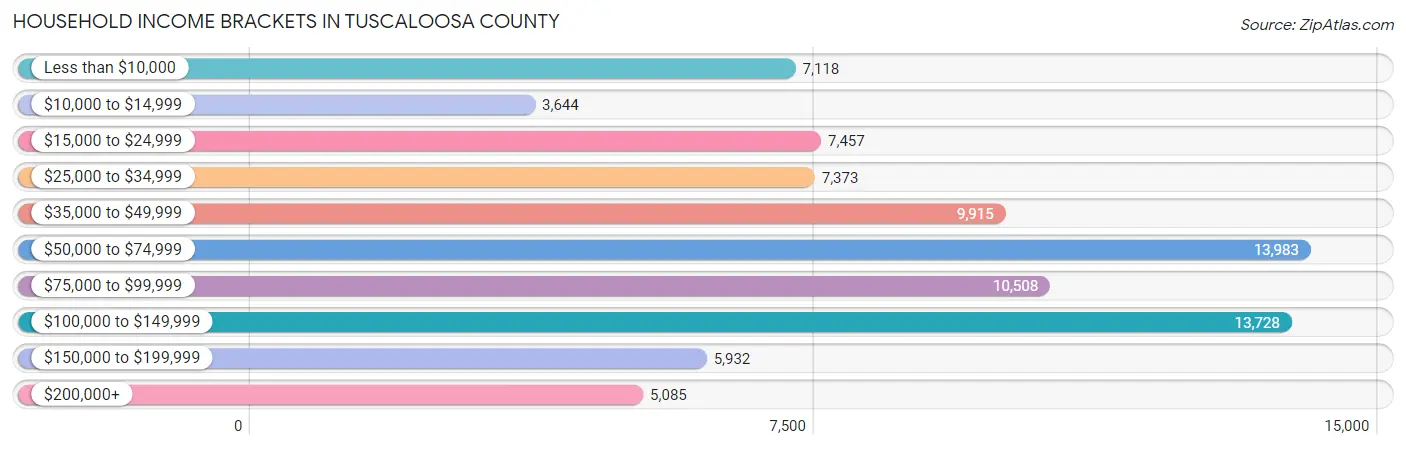
| Income Bracket | # Households | % Households |
| Less than $10,000 | 7,118 | 8.4% |
| $10,000 to $14,999 | 3,644 | 4.3% |
| $15,000 to $24,999 | 7,457 | 8.8% |
| $25,000 to $34,999 | 7,373 | 8.7% |
| $35,000 to $49,999 | 9,915 | 11.7% |
| $50,000 to $74,999 | 13,983 | 16.5% |
| $75,000 to $99,999 | 10,508 | 12.4% |
| $100,000 to $149,999 | 13,728 | 16.2% |
| $150,000 to $199,999 | 5,932 | 7.0% |
| $200,000+ | 5,085 | 6.0% |
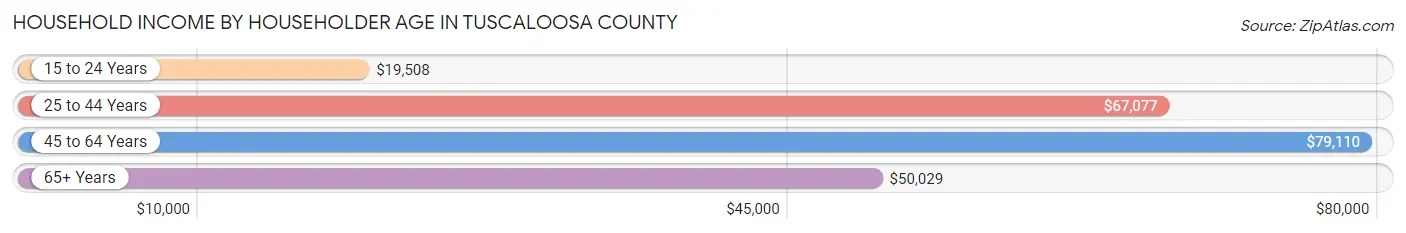
Household Income by Householder Age in Tuscaloosa County
The median household income in Tuscaloosa County is $61,645, with the highest median household income of $79,110 found in the 45 to 64 years age bracket for the primary householder. A total of 28,442 households (33.6%) fall into this category. Meanwhile, the 15 to 24 years age bracket for the primary householder has the lowest median household income of $19,508, with 6,997 households (8.3%) in this group.
| Income Bracket | # Households | Median Income |
| 15 to 24 Years | 6,997 (8.3%) | $19,508 |
| 25 to 44 Years | 29,702 (35.0%) | $67,077 |
| 45 to 64 Years | 28,442 (33.6%) | $79,110 |
| 65+ Years | 19,602 (23.1%) | $50,029 |
| Total | 84,743 (100.0%) | $61,645 |
Poverty in Tuscaloosa County
Income Below Poverty by Sex and Age in Tuscaloosa County
With 15.2% poverty level for males and 18.1% for females among the residents of Tuscaloosa County, 12 to 14 year old males and 18 to 24 year old females are the most vulnerable to poverty, with 1,190 males (29.9%) and 6,012 females (38.0%) in their respective age groups living below the poverty level.
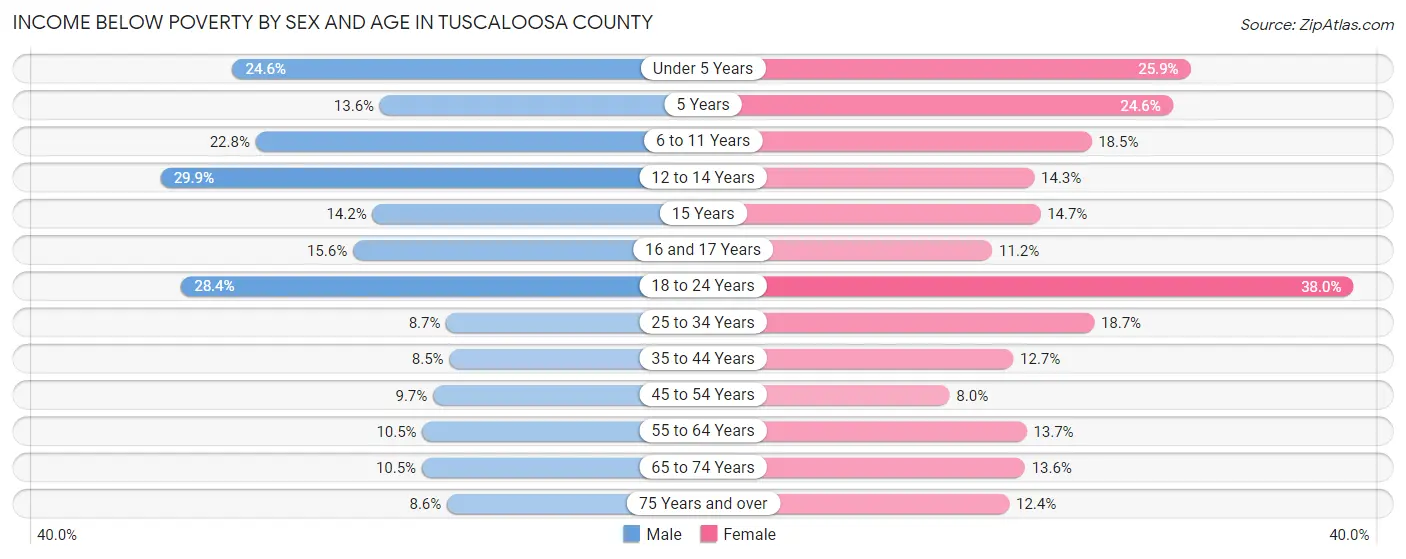
| Age Bracket | Male | Female |
| Under 5 Years | 1,597 (24.5%) | 1,619 (25.9%) |
| 5 Years | 147 (13.6%) | 345 (24.6%) |
| 6 to 11 Years | 1,870 (22.8%) | 1,402 (18.5%) |
| 12 to 14 Years | 1,190 (29.9%) | 548 (14.3%) |
| 15 Years | 220 (14.2%) | 171 (14.7%) |
| 16 and 17 Years | 359 (15.6%) | 260 (11.2%) |
| 18 to 24 Years | 4,489 (28.4%) | 6,012 (38.0%) |
| 25 to 34 Years | 1,399 (8.7%) | 3,051 (18.7%) |
| 35 to 44 Years | 1,116 (8.5%) | 1,787 (12.7%) |
| 45 to 54 Years | 1,163 (9.7%) | 1,031 (8.0%) |
| 55 to 64 Years | 1,266 (10.5%) | 1,785 (13.7%) |
| 65 to 74 Years | 936 (10.5%) | 1,418 (13.6%) |
| 75 Years and over | 379 (8.6%) | 852 (12.4%) |
| Total | 16,131 (15.2%) | 20,281 (18.1%) |
Income Above Poverty by Sex and Age in Tuscaloosa County
According to the poverty statistics in Tuscaloosa County, males aged 35 to 44 years and females aged 45 to 54 years are the age groups that are most secure financially, with 91.5% of males and 92.0% of females in these age groups living above the poverty line.
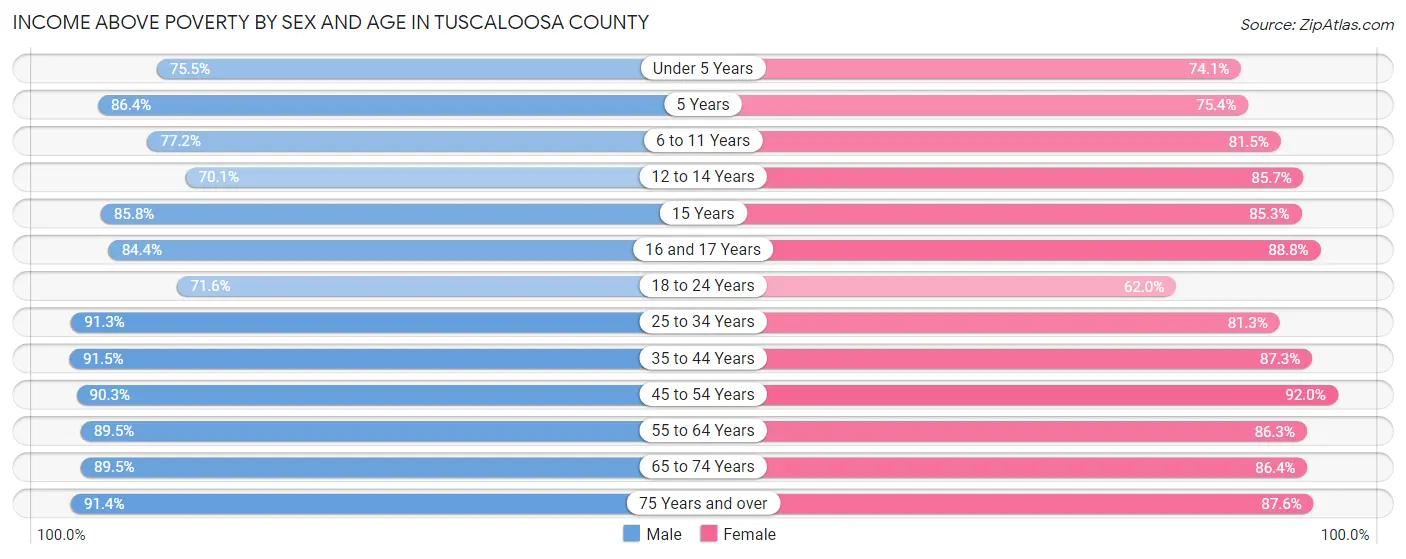
| Age Bracket | Male | Female |
| Under 5 Years | 4,908 (75.4%) | 4,636 (74.1%) |
| 5 Years | 932 (86.4%) | 1,060 (75.4%) |
| 6 to 11 Years | 6,319 (77.2%) | 6,168 (81.5%) |
| 12 to 14 Years | 2,791 (70.1%) | 3,289 (85.7%) |
| 15 Years | 1,333 (85.8%) | 990 (85.3%) |
| 16 and 17 Years | 1,940 (84.4%) | 2,069 (88.8%) |
| 18 to 24 Years | 11,337 (71.6%) | 9,821 (62.0%) |
| 25 to 34 Years | 14,697 (91.3%) | 13,244 (81.3%) |
| 35 to 44 Years | 12,083 (91.5%) | 12,267 (87.3%) |
| 45 to 54 Years | 10,869 (90.3%) | 11,865 (92.0%) |
| 55 to 64 Years | 10,832 (89.5%) | 11,236 (86.3%) |
| 65 to 74 Years | 7,981 (89.5%) | 9,026 (86.4%) |
| 75 Years and over | 4,011 (91.4%) | 6,007 (87.6%) |
| Total | 90,033 (84.8%) | 91,678 (81.9%) |
Income Below Poverty Among Married-Couple Families in Tuscaloosa County
The poverty statistics for married-couple families in Tuscaloosa County show that 5.2% or 2,058 of the total 39,247 families live below the poverty line. Families with 5 or more children have the highest poverty rate of 48.5%, comprising of 160 families. On the other hand, families with 1 or 2 children have the lowest poverty rate of 4.5%, which includes 580 families.
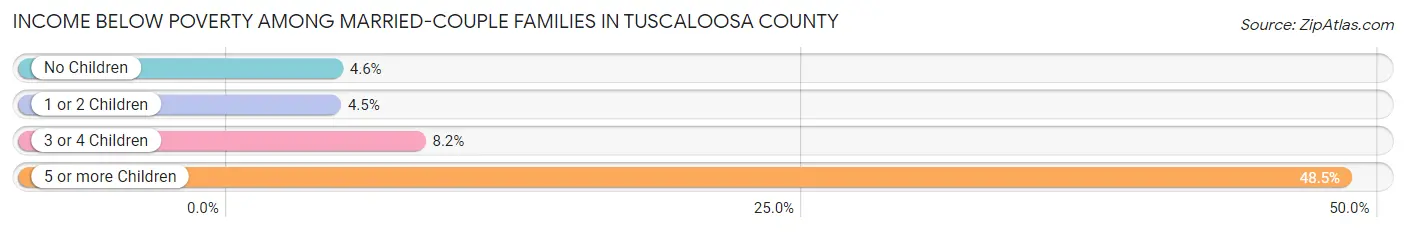
| Children | Above Poverty | Below Poverty |
| No Children | 21,269 (95.4%) | 1,016 (4.6%) |
| 1 or 2 Children | 12,353 (95.5%) | 580 (4.5%) |
| 3 or 4 Children | 3,397 (91.8%) | 302 (8.2%) |
| 5 or more Children | 170 (51.5%) | 160 (48.5%) |
| Total | 37,189 (94.8%) | 2,058 (5.2%) |
Income Below Poverty Among Single-Parent Households in Tuscaloosa County
According to the poverty data in Tuscaloosa County, 13.8% or 392 single-father households and 32.4% or 3,710 single-mother households are living below the poverty line. Among single-father households, those with 1 or 2 children have the highest poverty rate, with 201 households (14.3%) experiencing poverty. Likewise, among single-mother households, those with 5 or more children have the highest poverty rate, with 112 households (83.6%) falling below the poverty line.
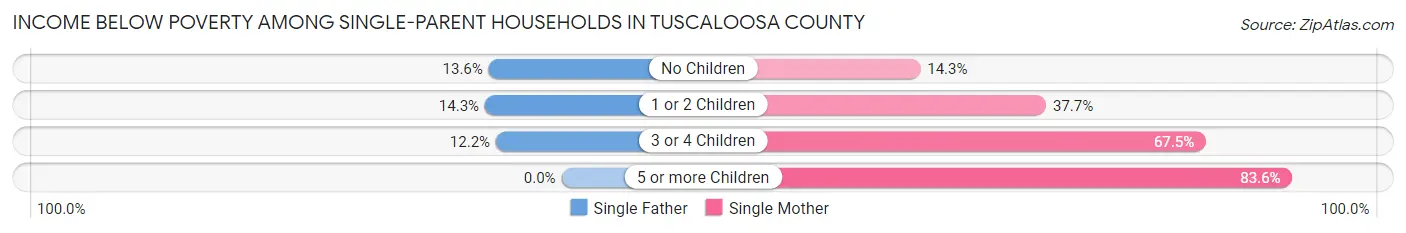
| Children | Single Father | Single Mother |
| No Children | 165 (13.6%) | 629 (14.3%) |
| 1 or 2 Children | 201 (14.3%) | 2,135 (37.7%) |
| 3 or 4 Children | 26 (12.2%) | 834 (67.5%) |
| 5 or more Children | 0 (0.0%) | 112 (83.6%) |
| Total | 392 (13.8%) | 3,710 (32.4%) |
Income Below Poverty Among Married-Couple vs Single-Parent Households in Tuscaloosa County
The poverty data for Tuscaloosa County shows that 2,058 of the married-couple family households (5.2%) and 4,102 of the single-parent households (28.7%) are living below the poverty level. Within the married-couple family households, those with 5 or more children have the highest poverty rate, with 160 households (48.5%) falling below the poverty line. Among the single-parent households, those with 5 or more children have the highest poverty rate, with 112 household (83.6%) living below poverty.
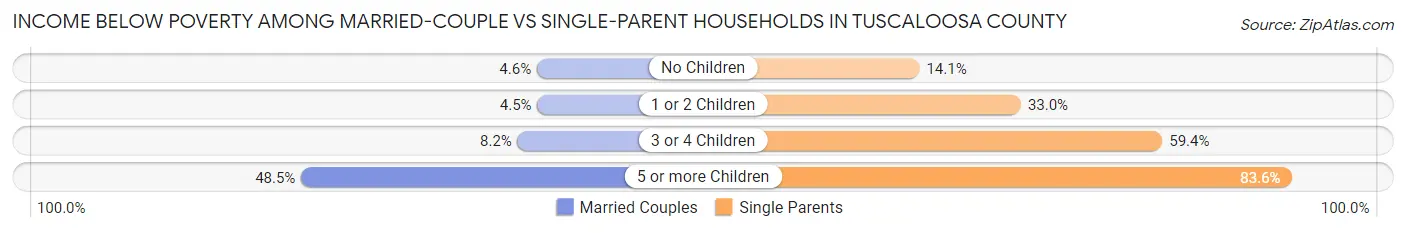
| Children | Married-Couple Families | Single-Parent Households |
| No Children | 1,016 (4.6%) | 794 (14.1%) |
| 1 or 2 Children | 580 (4.5%) | 2,336 (33.0%) |
| 3 or 4 Children | 302 (8.2%) | 860 (59.4%) |
| 5 or more Children | 160 (48.5%) | 112 (83.6%) |
| Total | 2,058 (5.2%) | 4,102 (28.7%) |
Race in Tuscaloosa County
The most populous races in Tuscaloosa County are White / Caucasian (143,889 | 62.1%), Black / African American (74,222 | 32.1%), and Hispanic or Latino (9,261 | 4.0%).
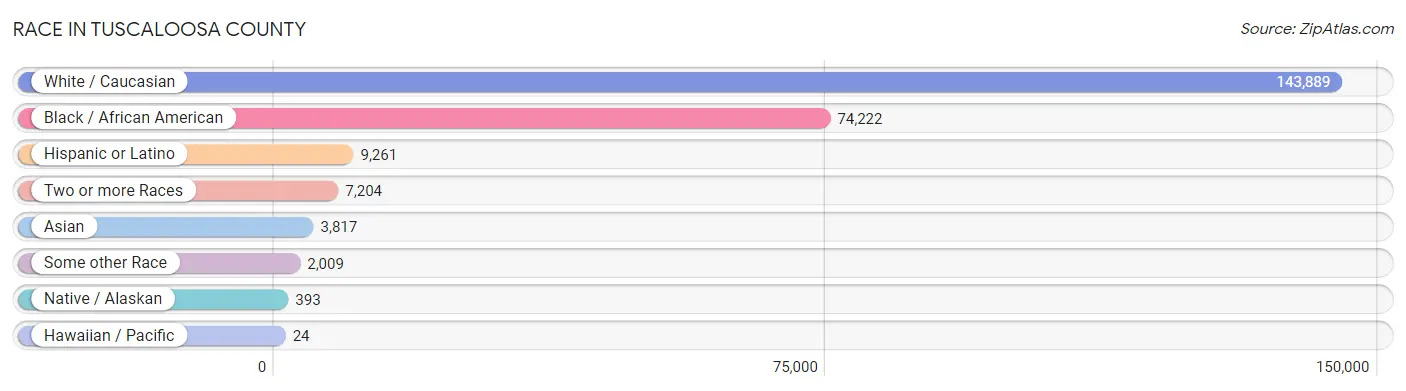
| Race | # Population | % Population |
| Asian | 3,817 | 1.7% |
| Black / African American | 74,222 | 32.1% |
| Hawaiian / Pacific | 24 | 0.0% |
| Hispanic or Latino | 9,261 | 4.0% |
| Native / Alaskan | 393 | 0.2% |
| White / Caucasian | 143,889 | 62.1% |
| Two or more Races | 7,204 | 3.1% |
| Some other Race | 2,009 | 0.9% |
| Total | 231,558 | 100.0% |
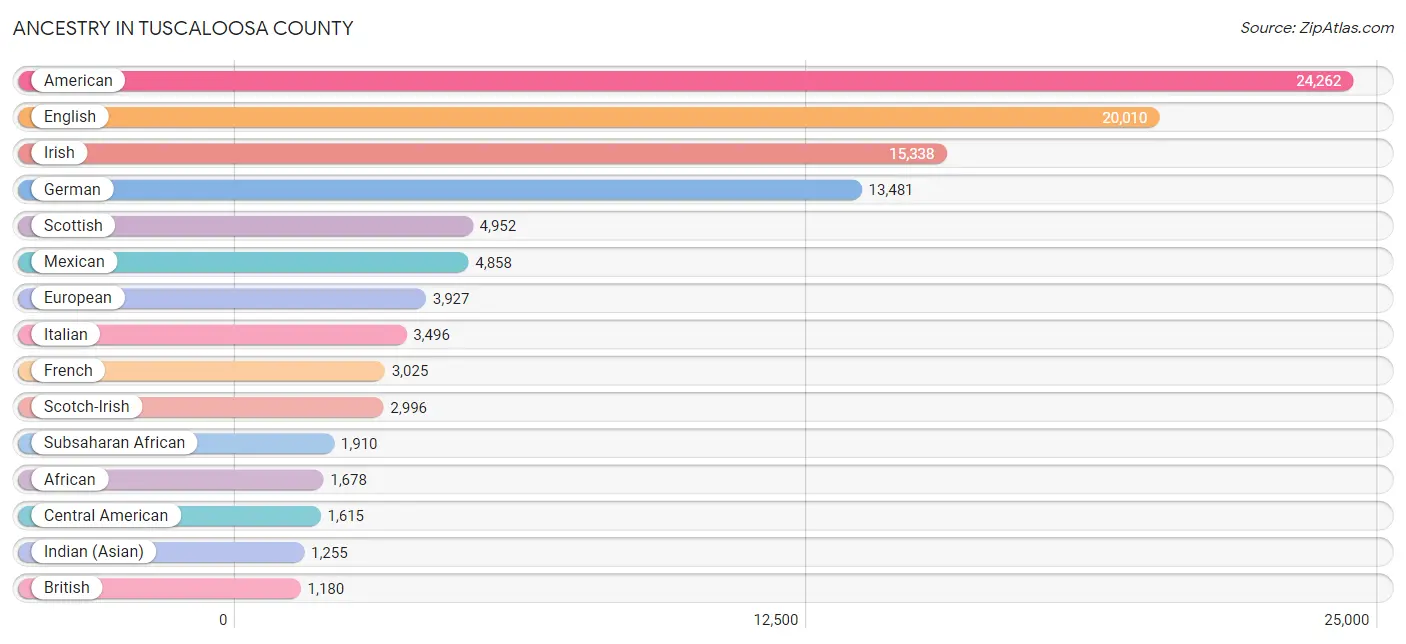
Ancestry in Tuscaloosa County
The most populous ancestries reported in Tuscaloosa County are American (24,262 | 10.5%), English (20,010 | 8.6%), Irish (15,338 | 6.6%), German (13,481 | 5.8%), and Scottish (4,952 | 2.1%), together accounting for 33.7% of all Tuscaloosa County residents.
| Ancestry | # Population | % Population |
| African | 1,678 | 0.7% |
| American | 24,262 | 10.5% |
| Arab | 392 | 0.2% |
| Argentinean | 222 | 0.1% |
| Australian | 12 | 0.0% |
| Austrian | 53 | 0.0% |
| Bahamian | 8 | 0.0% |
| Bangladeshi | 6 | 0.0% |
| Barbadian | 34 | 0.0% |
| Belgian | 37 | 0.0% |
| Bermudan | 5 | 0.0% |
| Bhutanese | 442 | 0.2% |
| Blackfeet | 2 | 0.0% |
| Bolivian | 4 | 0.0% |
| Brazilian | 70 | 0.0% |
| British | 1,180 | 0.5% |
| British West Indian | 20 | 0.0% |
| Bulgarian | 82 | 0.0% |
| Burmese | 353 | 0.2% |
| Cajun | 26 | 0.0% |
| Canadian | 168 | 0.1% |
| Central American | 1,615 | 0.7% |
| Central American Indian | 174 | 0.1% |
| Cherokee | 414 | 0.2% |
| Chickasaw | 64 | 0.0% |
| Choctaw | 25 | 0.0% |
| Colombian | 77 | 0.0% |
| Costa Rican | 18 | 0.0% |
| Creek | 74 | 0.0% |
| Croatian | 25 | 0.0% |
| Cuban | 537 | 0.2% |
| Czech | 158 | 0.1% |
| Czechoslovakian | 7 | 0.0% |
| Danish | 124 | 0.1% |
| Dominican | 257 | 0.1% |
| Dutch | 1,084 | 0.5% |
| Dutch West Indian | 21 | 0.0% |
| Eastern European | 279 | 0.1% |
| Egyptian | 65 | 0.0% |
| English | 20,010 | 8.6% |
| European | 3,927 | 1.7% |
| Filipino | 47 | 0.0% |
| Finnish | 155 | 0.1% |
| French | 3,025 | 1.3% |
| French Canadian | 227 | 0.1% |
| German | 13,481 | 5.8% |
| Ghanaian | 25 | 0.0% |
| Greek | 214 | 0.1% |
| Guatemalan | 1,166 | 0.5% |
| Guyanese | 13 | 0.0% |
| Haitian | 32 | 0.0% |
| Honduran | 207 | 0.1% |
| Hungarian | 228 | 0.1% |
| Icelander | 12 | 0.0% |
| Indian (Asian) | 1,255 | 0.5% |
| Indonesian | 9 | 0.0% |
| Iranian | 274 | 0.1% |
| Irish | 15,338 | 6.6% |
| Iroquois | 32 | 0.0% |
| Israeli | 9 | 0.0% |
| Italian | 3,496 | 1.5% |
| Jamaican | 116 | 0.1% |
| Kenyan | 98 | 0.0% |
| Korean | 599 | 0.3% |
| Lebanese | 152 | 0.1% |
| Lithuanian | 149 | 0.1% |
| Macedonian | 14 | 0.0% |
| Malaysian | 8 | 0.0% |
| Menominee | 9 | 0.0% |
| Mexican | 4,858 | 2.1% |
| Mexican American Indian | 189 | 0.1% |
| Mongolian | 20 | 0.0% |
| Native Hawaiian | 92 | 0.0% |
| Nigerian | 94 | 0.0% |
| Northern European | 138 | 0.1% |
| Norwegian | 653 | 0.3% |
| Pakistani | 27 | 0.0% |
| Palestinian | 50 | 0.0% |
| Panamanian | 14 | 0.0% |
| Pennsylvania German | 25 | 0.0% |
| Peruvian | 130 | 0.1% |
| Polish | 1,105 | 0.5% |
| Portuguese | 272 | 0.1% |
| Puerto Rican | 888 | 0.4% |
| Romanian | 73 | 0.0% |
| Russian | 370 | 0.2% |
| Salvadoran | 210 | 0.1% |
| Scandinavian | 312 | 0.1% |
| Scotch-Irish | 2,996 | 1.3% |
| Scottish | 4,952 | 2.1% |
| Sioux | 4 | 0.0% |
| Slovak | 76 | 0.0% |
| Slovene | 15 | 0.0% |
| South African | 10 | 0.0% |
| South American | 466 | 0.2% |
| Spaniard | 99 | 0.0% |
| Spanish | 156 | 0.1% |
| Spanish American | 30 | 0.0% |
| Spanish American Indian | 19 | 0.0% |
| Sri Lankan | 690 | 0.3% |
| Subsaharan African | 1,910 | 0.8% |
| Swedish | 726 | 0.3% |
| Swiss | 331 | 0.1% |
| Thai | 896 | 0.4% |
| Trinidadian and Tobagonian | 17 | 0.0% |
| Turkish | 7 | 0.0% |
| U.S. Virgin Islander | 13 | 0.0% |
| Ukrainian | 107 | 0.1% |
| Venezuelan | 33 | 0.0% |
| Vietnamese | 80 | 0.0% |
| Welsh | 711 | 0.3% |
| West Indian | 76 | 0.0% |
| Yugoslavian | 40 | 0.0% | View All 113 Rows |
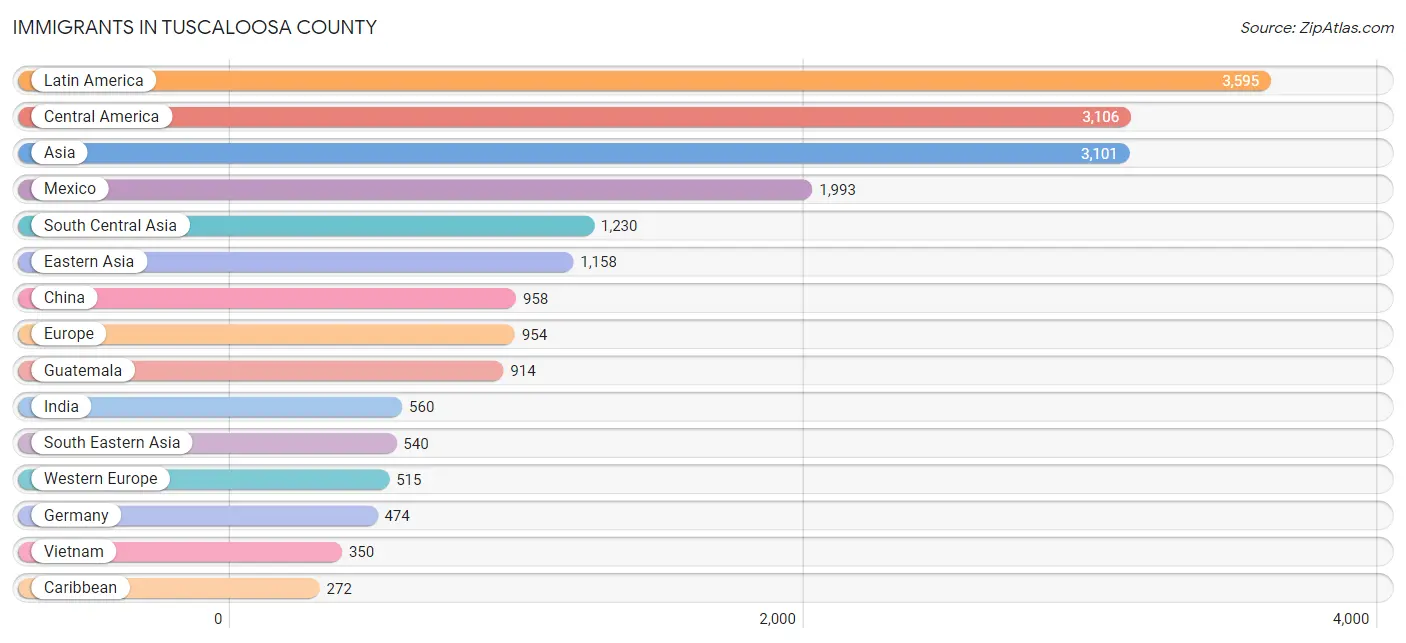
Immigrants in Tuscaloosa County
The most numerous immigrant groups reported in Tuscaloosa County came from Latin America (3,595 | 1.5%), Central America (3,106 | 1.3%), Asia (3,101 | 1.3%), Mexico (1,993 | 0.9%), and South Central Asia (1,230 | 0.5%), together accounting for 5.6% of all Tuscaloosa County residents.
| Immigration Origin | # Population | % Population |
| Afghanistan | 13 | 0.0% |
| Africa | 232 | 0.1% |
| Argentina | 19 | 0.0% |
| Asia | 3,101 | 1.3% |
| Australia | 14 | 0.0% |
| Bahamas | 22 | 0.0% |
| Bangladesh | 119 | 0.1% |
| Barbados | 34 | 0.0% |
| Belgium | 7 | 0.0% |
| Bolivia | 4 | 0.0% |
| Brazil | 98 | 0.0% |
| Bulgaria | 11 | 0.0% |
| Canada | 262 | 0.1% |
| Caribbean | 272 | 0.1% |
| Central America | 3,106 | 1.3% |
| China | 958 | 0.4% |
| Colombia | 55 | 0.0% |
| Costa Rica | 5 | 0.0% |
| Cuba | 131 | 0.1% |
| Dominican Republic | 5 | 0.0% |
| Eastern Africa | 53 | 0.0% |
| Eastern Asia | 1,158 | 0.5% |
| Eastern Europe | 147 | 0.1% |
| El Salvador | 134 | 0.1% |
| England | 75 | 0.0% |
| Europe | 954 | 0.4% |
| France | 18 | 0.0% |
| Germany | 474 | 0.2% |
| Ghana | 33 | 0.0% |
| Guatemala | 914 | 0.4% |
| Haiti | 22 | 0.0% |
| Honduras | 60 | 0.0% |
| India | 560 | 0.2% |
| Iran | 191 | 0.1% |
| Ireland | 13 | 0.0% |
| Israel | 9 | 0.0% |
| Jamaica | 30 | 0.0% |
| Japan | 77 | 0.0% |
| Jordan | 30 | 0.0% |
| Kazakhstan | 55 | 0.0% |
| Kenya | 37 | 0.0% |
| Korea | 123 | 0.1% |
| Laos | 8 | 0.0% |
| Latin America | 3,595 | 1.5% |
| Liberia | 77 | 0.0% |
| Malaysia | 7 | 0.0% |
| Mexico | 1,993 | 0.9% |
| Middle Africa | 13 | 0.0% |
| Nepal | 106 | 0.1% |
| Netherlands | 16 | 0.0% |
| Nigeria | 41 | 0.0% |
| Northern Africa | 10 | 0.0% |
| Northern Europe | 214 | 0.1% |
| Oceania | 22 | 0.0% |
| Pakistan | 161 | 0.1% |
| Peru | 34 | 0.0% |
| Philippines | 144 | 0.1% |
| Poland | 15 | 0.0% |
| Portugal | 26 | 0.0% |
| Romania | 10 | 0.0% |
| Russia | 97 | 0.0% |
| Saudi Arabia | 62 | 0.0% |
| Scotland | 15 | 0.0% |
| Singapore | 10 | 0.0% |
| South America | 217 | 0.1% |
| South Central Asia | 1,230 | 0.5% |
| South Eastern Asia | 540 | 0.2% |
| Southern Europe | 78 | 0.0% |
| Spain | 52 | 0.0% |
| Sri Lanka | 10 | 0.0% |
| Taiwan | 41 | 0.0% |
| Thailand | 12 | 0.0% |
| Trinidad and Tobago | 8 | 0.0% |
| Turkey | 7 | 0.0% |
| Ukraine | 14 | 0.0% |
| Venezuela | 7 | 0.0% |
| Vietnam | 350 | 0.2% |
| Western Africa | 151 | 0.1% |
| Western Asia | 133 | 0.1% |
| Western Europe | 515 | 0.2% |
| Yemen | 11 | 0.0% |
| Zimbabwe | 8 | 0.0% | View All 82 Rows |
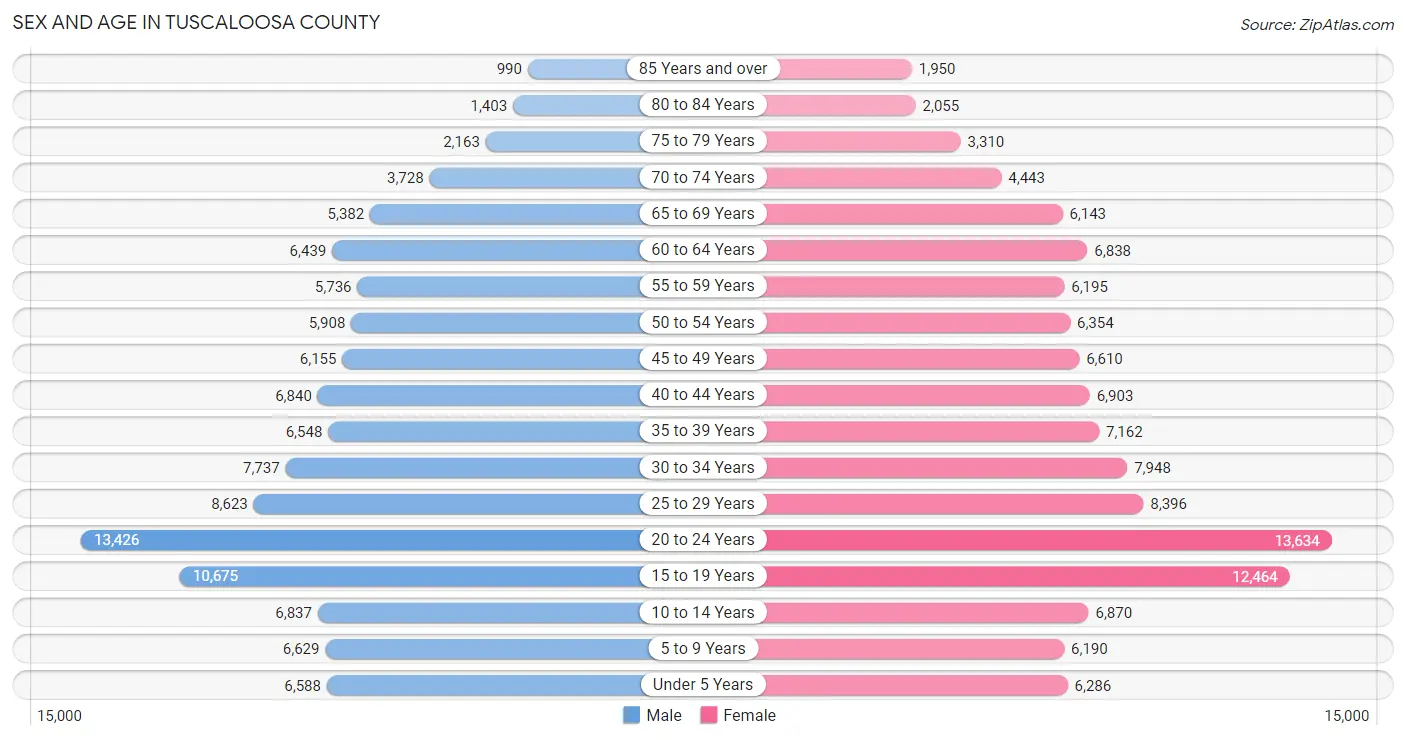
Sex and Age in Tuscaloosa County
Sex and Age in Tuscaloosa County
The most populous age groups in Tuscaloosa County are 20 to 24 Years (13,426 | 12.0%) for men and 20 to 24 Years (13,634 | 11.4%) for women.
| Age Bracket | Male | Female |
| Under 5 Years | 6,588 (5.9%) | 6,286 (5.2%) |
| 5 to 9 Years | 6,629 (5.9%) | 6,190 (5.2%) |
| 10 to 14 Years | 6,837 (6.1%) | 6,870 (5.7%) |
| 15 to 19 Years | 10,675 (9.6%) | 12,464 (10.4%) |
| 20 to 24 Years | 13,426 (12.0%) | 13,634 (11.4%) |
| 25 to 29 Years | 8,623 (7.7%) | 8,396 (7.0%) |
| 30 to 34 Years | 7,737 (6.9%) | 7,948 (6.6%) |
| 35 to 39 Years | 6,548 (5.9%) | 7,162 (6.0%) |
| 40 to 44 Years | 6,840 (6.1%) | 6,903 (5.8%) |
| 45 to 49 Years | 6,155 (5.5%) | 6,610 (5.5%) |
| 50 to 54 Years | 5,908 (5.3%) | 6,354 (5.3%) |
| 55 to 59 Years | 5,736 (5.1%) | 6,195 (5.2%) |
| 60 to 64 Years | 6,439 (5.8%) | 6,838 (5.7%) |
| 65 to 69 Years | 5,382 (4.8%) | 6,143 (5.1%) |
| 70 to 74 Years | 3,728 (3.3%) | 4,443 (3.7%) |
| 75 to 79 Years | 2,163 (1.9%) | 3,310 (2.8%) |
| 80 to 84 Years | 1,403 (1.3%) | 2,055 (1.7%) |
| 85 Years and over | 990 (0.9%) | 1,950 (1.6%) |
| Total | 111,807 (100.0%) | 119,751 (100.0%) |
Families and Households in Tuscaloosa County
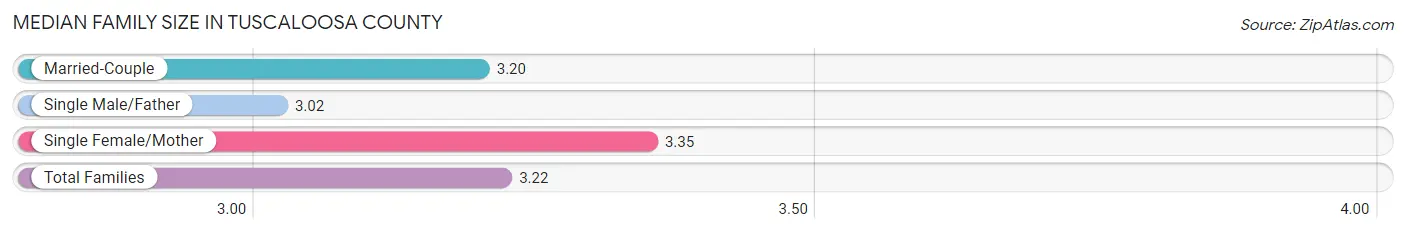
Median Family Size in Tuscaloosa County
The median family size in Tuscaloosa County is 3.22 persons per family, with single female/mother families (11,444 | 21.4%) accounting for the largest median family size of 3.35 persons per family. On the other hand, single male/father families (2,839 | 5.3%) represent the smallest median family size with 3.02 persons per family.
| Family Type | # Families | Family Size |
| Married-Couple | 39,247 (73.3%) | 3.20 |
| Single Male/Father | 2,839 (5.3%) | 3.02 |
| Single Female/Mother | 11,444 (21.4%) | 3.35 |
| Total Families | 53,530 (100.0%) | 3.22 |
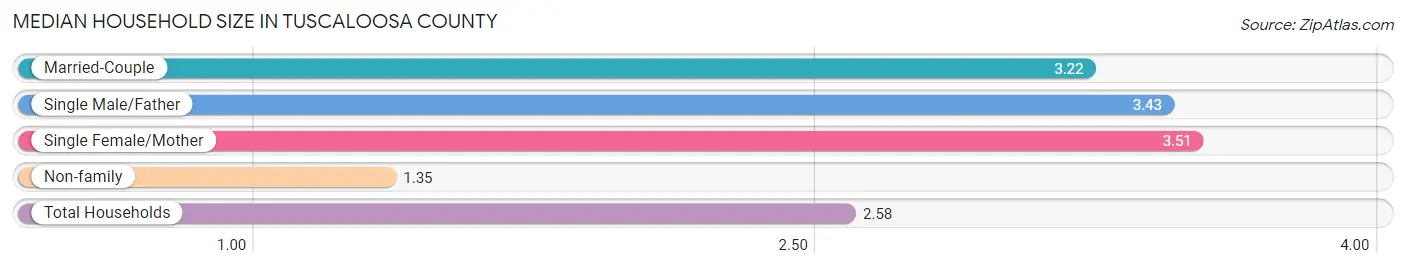
Median Household Size in Tuscaloosa County
The median household size in Tuscaloosa County is 2.58 persons per household, with single female/mother households (11,444 | 13.5%) accounting for the largest median household size of 3.51 persons per household. non-family households (31,213 | 36.8%) represent the smallest median household size with 1.35 persons per household.
| Household Type | # Households | Household Size |
| Married-Couple | 39,247 (46.3%) | 3.22 |
| Single Male/Father | 2,839 (3.4%) | 3.43 |
| Single Female/Mother | 11,444 (13.5%) | 3.51 |
| Non-family | 31,213 (36.8%) | 1.35 |
| Total Households | 84,743 (100.0%) | 2.58 |
Household Size by Marriage Status in Tuscaloosa County
Out of a total of 84,743 households in Tuscaloosa County, 53,530 (63.2%) are family households, while 31,213 (36.8%) are nonfamily households. The most numerous type of family households are 2-person households, comprising 24,185, and the most common type of nonfamily households are 1-person households, comprising 25,161.
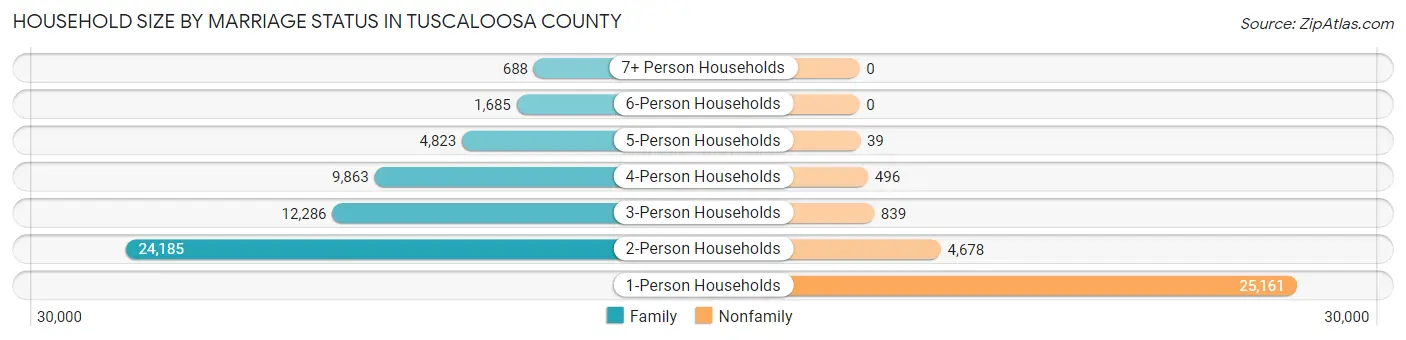
| Household Size | Family Households | Nonfamily Households |
| 1-Person Households | - | 25,161 (29.7%) |
| 2-Person Households | 24,185 (28.5%) | 4,678 (5.5%) |
| 3-Person Households | 12,286 (14.5%) | 839 (1.0%) |
| 4-Person Households | 9,863 (11.6%) | 496 (0.6%) |
| 5-Person Households | 4,823 (5.7%) | 39 (0.1%) |
| 6-Person Households | 1,685 (2.0%) | 0 (0.0%) |
| 7+ Person Households | 688 (0.8%) | 0 (0.0%) |
| Total | 53,530 (63.2%) | 31,213 (36.8%) |
Female Fertility in Tuscaloosa County
Fertility by Age in Tuscaloosa County
Average fertility rate in Tuscaloosa County is 48.0 births per 1,000 women. Women in the age bracket of 20 to 34 years have the highest fertility rate with 88.0 births per 1,000 women. Women in the age bracket of 20 to 34 years acount for 85.5% of all women with births.
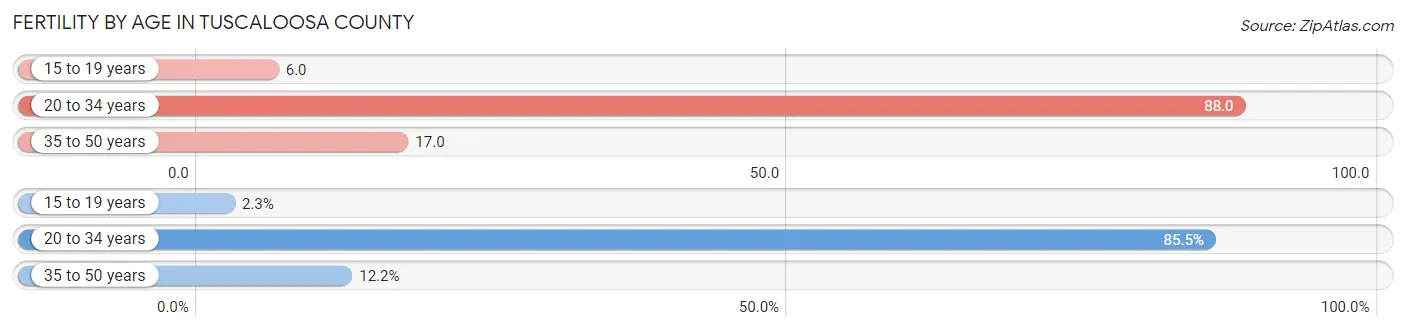
| Age Bracket | Women with Births | Births / 1,000 Women |
| 15 to 19 years | 70 (2.3%) | 6.0 |
| 20 to 34 years | 2,625 (85.5%) | 88.0 |
| 35 to 50 years | 376 (12.2%) | 17.0 |
| Total | 3,071 (100.0%) | 48.0 |
Fertility by Age by Marriage Status in Tuscaloosa County
57.3% of women with births (3,071) in Tuscaloosa County are married. The highest percentage of unmarried women with births falls into 15 to 19 years age bracket with 100.0% of them unmarried at the time of birth, while the lowest percentage of unmarried women with births belong to 35 to 50 years age bracket with 16.0% of them unmarried.
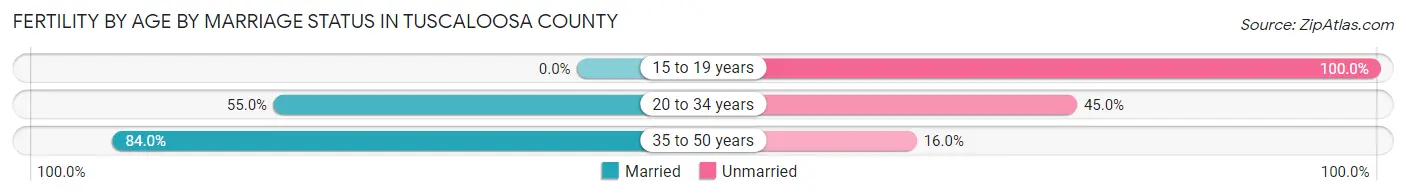
| Age Bracket | Married | Unmarried |
| 15 to 19 years | 0 (0.0%) | 70 (100.0%) |
| 20 to 34 years | 1,444 (55.0%) | 1,181 (45.0%) |
| 35 to 50 years | 316 (84.0%) | 60 (16.0%) |
| Total | 1,760 (57.3%) | 1,311 (42.7%) |
Fertility by Education in Tuscaloosa County
Average fertility rate in Tuscaloosa County is 48.0 births per 1,000 women. Women with the education attainment of bachelor's degree have the highest fertility rate of 81.0 births per 1,000 women, while women with the education attainment of less than high school have the lowest fertility at 29.0 births per 1,000 women. Women with the education attainment of college or associate's degree represent 34.7% of all women with births.
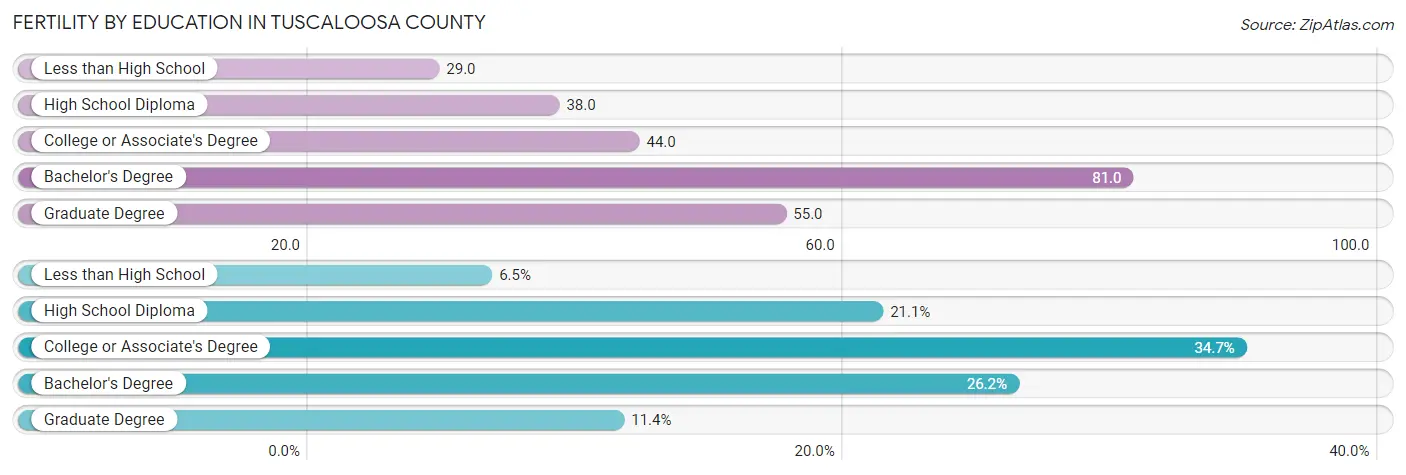
| Educational Attainment | Women with Births | Births / 1,000 Women |
| Less than High School | 199 (6.5%) | 29.0 |
| High School Diploma | 649 (21.1%) | 38.0 |
| College or Associate's Degree | 1,067 (34.7%) | 44.0 |
| Bachelor's Degree | 805 (26.2%) | 81.0 |
| Graduate Degree | 351 (11.4%) | 55.0 |
| Total | 3,071 (100.0%) | 48.0 |
Fertility by Education by Marriage Status in Tuscaloosa County
42.7% of women with births in Tuscaloosa County are unmarried. Women with the educational attainment of graduate degree are most likely to be married with 100.0% of them married at childbirth, while women with the educational attainment of college or associate's degree are least likely to be married with 61.5% of them unmarried at childbirth.
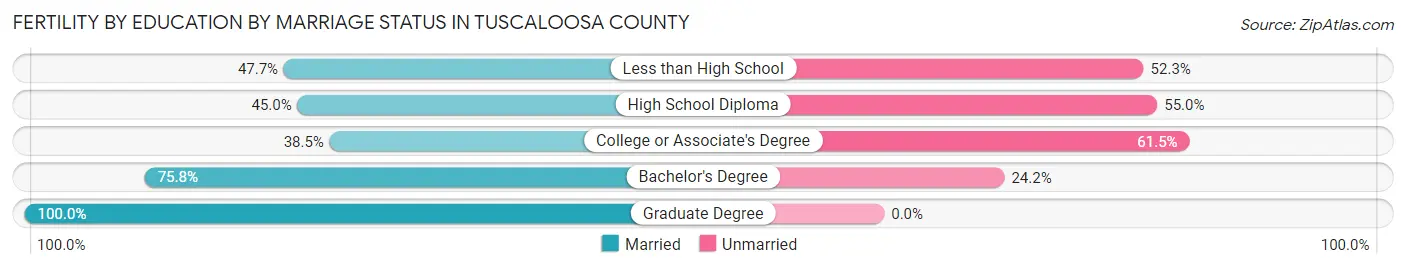
| Educational Attainment | Married | Unmarried |
| Less than High School | 95 (47.7%) | 104 (52.3%) |
| High School Diploma | 292 (45.0%) | 357 (55.0%) |
| College or Associate's Degree | 411 (38.5%) | 656 (61.5%) |
| Bachelor's Degree | 610 (75.8%) | 195 (24.2%) |
| Graduate Degree | 351 (100.0%) | 0 (0.0%) |
| Total | 1,760 (57.3%) | 1,311 (42.7%) |
Employment Characteristics in Tuscaloosa County
Employment by Class of Employer in Tuscaloosa County
Among the 107,697 employed individuals in Tuscaloosa County, private company employees (71,079 | 66.0%), state government employees (10,709 | 9.9%), and not-for-profit organizations (7,838 | 7.3%) make up the most common classes of employment.
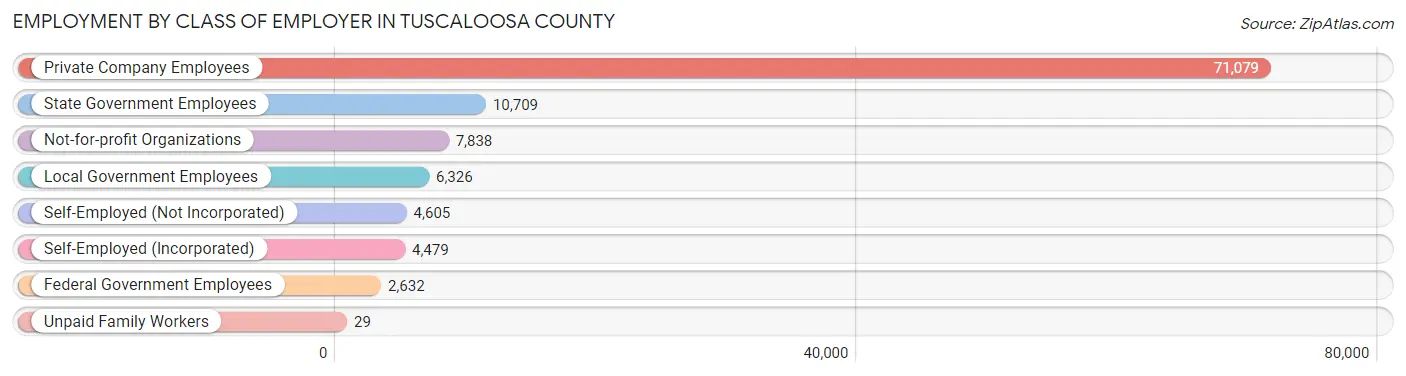
| Employer Class | # Employees | % Employees |
| Private Company Employees | 71,079 | 66.0% |
| Self-Employed (Incorporated) | 4,479 | 4.2% |
| Self-Employed (Not Incorporated) | 4,605 | 4.3% |
| Not-for-profit Organizations | 7,838 | 7.3% |
| Local Government Employees | 6,326 | 5.9% |
| State Government Employees | 10,709 | 9.9% |
| Federal Government Employees | 2,632 | 2.4% |
| Unpaid Family Workers | 29 | 0.0% |
| Total | 107,697 | 100.0% |
Employment Status by Age in Tuscaloosa County
According to the labor force statistics for Tuscaloosa County, out of the total population over 16 years of age (189,439), 61.6% or 116,694 individuals are in the labor force, with 5.5% or 6,418 of them unemployed. The age group with the highest labor force participation rate is 30 to 34 years, with 85.1% or 13,348 individuals in the labor force. Within the labor force, the 16 to 19 years age range has the highest percentage of unemployed individuals, with 21.5% or 1,515 of them being unemployed.
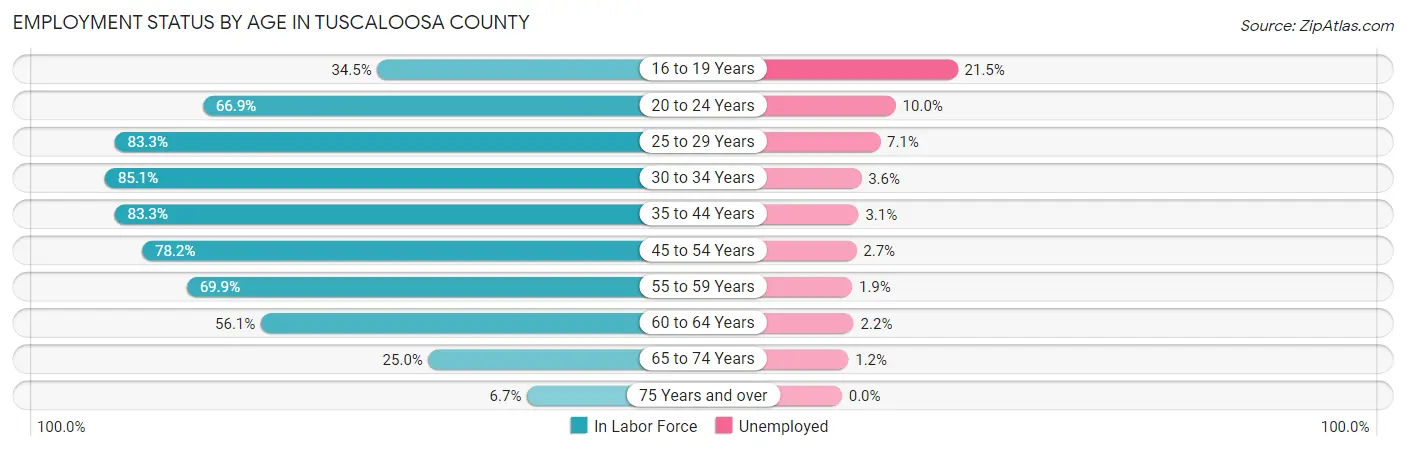
| Age Bracket | In Labor Force | Unemployed |
| 16 to 19 Years | 7,045 (34.5%) | 1,515 (21.5%) |
| 20 to 24 Years | 18,103 (66.9%) | 1,810 (10.0%) |
| 25 to 29 Years | 14,177 (83.3%) | 1,007 (7.1%) |
| 30 to 34 Years | 13,348 (85.1%) | 481 (3.6%) |
| 35 to 44 Years | 22,868 (83.3%) | 709 (3.1%) |
| 45 to 54 Years | 19,571 (78.2%) | 528 (2.7%) |
| 55 to 59 Years | 8,340 (69.9%) | 158 (1.9%) |
| 60 to 64 Years | 7,448 (56.1%) | 164 (2.2%) |
| 65 to 74 Years | 4,924 (25.0%) | 59 (1.2%) |
| 75 Years and over | 795 (6.7%) | 0 (0.0%) |
| Total | 116,694 (61.6%) | 6,418 (5.5%) |
Employment Status by Educational Attainment in Tuscaloosa County
According to labor force statistics for Tuscaloosa County, 77.7% of individuals (85,775) out of the total population between 25 and 64 years of age (110,392) are in the labor force, with 3.6% or 3,088 of them being unemployed. The group with the highest labor force participation rate are those with the educational attainment of bachelor's degree or higher, with 87.7% or 30,610 individuals in the labor force. Within the labor force, individuals with less than high school education have the highest percentage of unemployment, with 13.7% or 745 of them being unemployed.
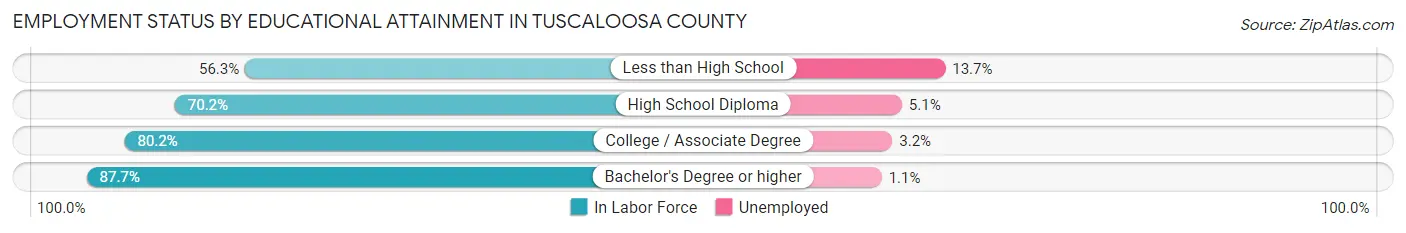
| Educational Attainment | In Labor Force | Unemployed |
| Less than High School | 5,439 (56.3%) | 1,323 (13.7%) |
| High School Diploma | 21,565 (70.2%) | 1,567 (5.1%) |
| College / Associate Degree | 28,157 (80.2%) | 1,123 (3.2%) |
| Bachelor's Degree or higher | 30,610 (87.7%) | 384 (1.1%) |
| Total | 85,775 (77.7%) | 3,974 (3.6%) |
Employment Occupations by Sex in Tuscaloosa County
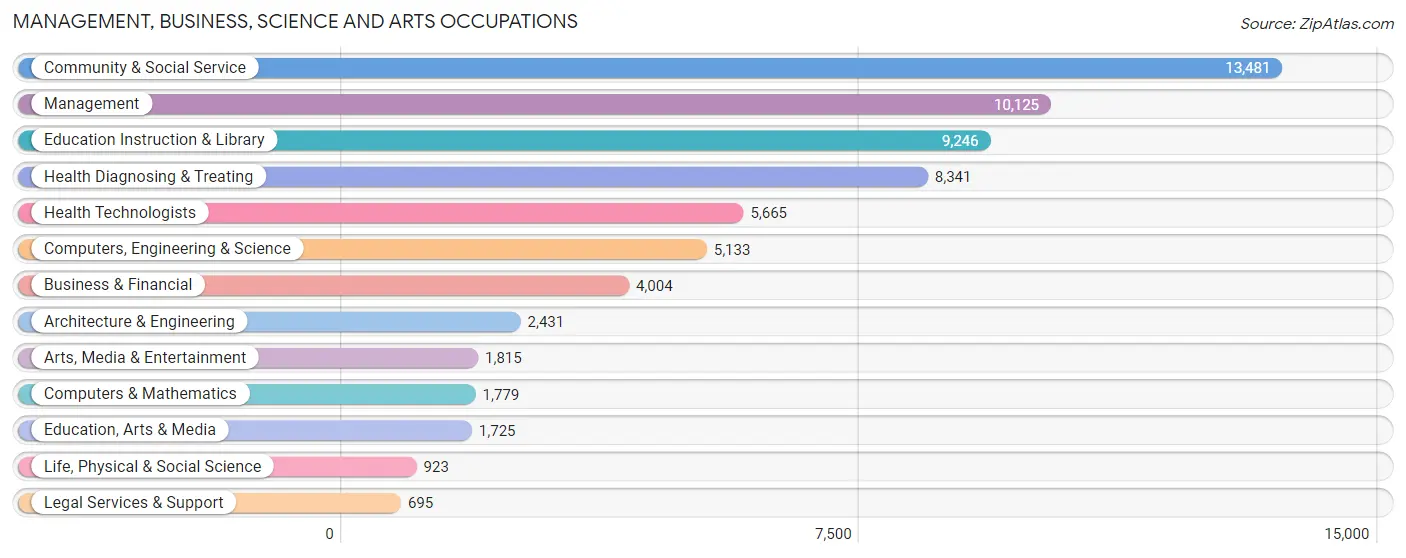
Management, Business, Science and Arts Occupations
The most common Management, Business, Science and Arts occupations in Tuscaloosa County are Community & Social Service (13,481 | 12.3%), Management (10,125 | 9.2%), Education Instruction & Library (9,246 | 8.4%), Health Diagnosing & Treating (8,341 | 7.6%), and Health Technologists (5,665 | 5.1%).
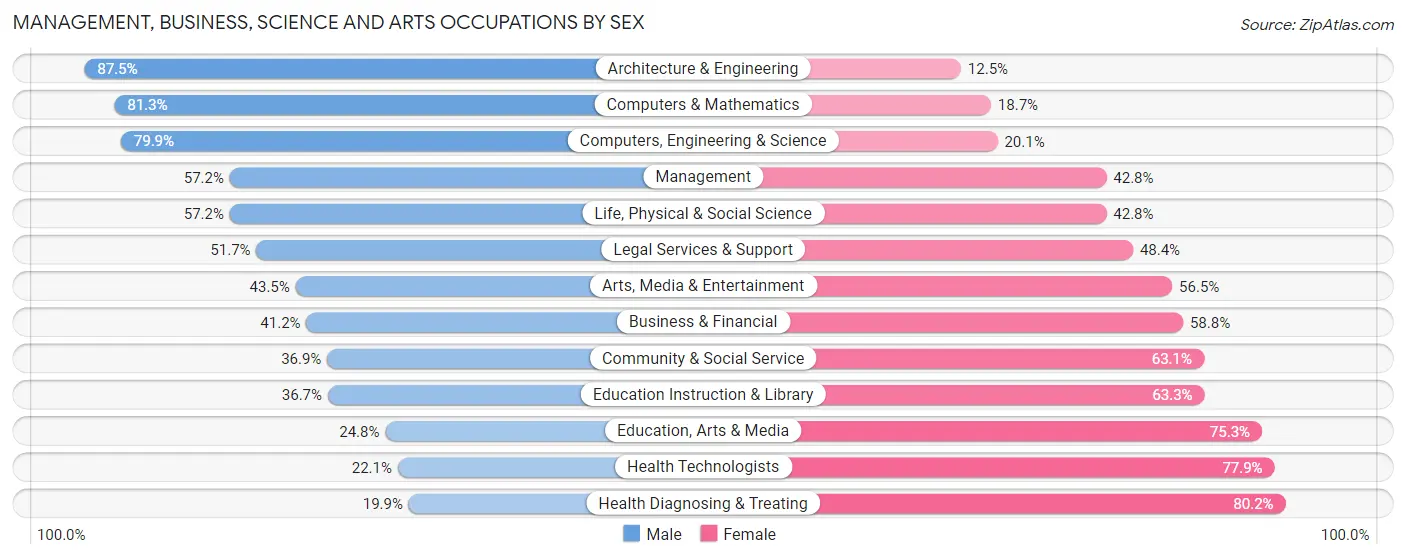
Management, Business, Science and Arts Occupations by Sex
Within the Management, Business, Science and Arts occupations in Tuscaloosa County, the most male-oriented occupations are Architecture & Engineering (87.5%), Computers & Mathematics (81.3%), and Computers, Engineering & Science (79.9%), while the most female-oriented occupations are Health Diagnosing & Treating (80.1%), Health Technologists (77.9%), and Education, Arts & Media (75.2%).
| Occupation | Male | Female |
| Management | 5,792 (57.2%) | 4,333 (42.8%) |
| Business & Financial | 1,650 (41.2%) | 2,354 (58.8%) |
| Computers, Engineering & Science | 4,102 (79.9%) | 1,031 (20.1%) |
| Computers & Mathematics | 1,446 (81.3%) | 333 (18.7%) |
| Architecture & Engineering | 2,128 (87.5%) | 303 (12.5%) |
| Life, Physical & Social Science | 528 (57.2%) | 395 (42.8%) |
| Community & Social Service | 4,972 (36.9%) | 8,509 (63.1%) |
| Education, Arts & Media | 427 (24.7%) | 1,298 (75.2%) |
| Legal Services & Support | 359 (51.6%) | 336 (48.3%) |
| Education Instruction & Library | 3,397 (36.7%) | 5,849 (63.3%) |
| Arts, Media & Entertainment | 789 (43.5%) | 1,026 (56.5%) |
| Health Diagnosing & Treating | 1,656 (19.9%) | 6,685 (80.1%) |
| Health Technologists | 1,254 (22.1%) | 4,411 (77.9%) |
| Total (Category) | 18,172 (44.2%) | 22,912 (55.8%) |
| Total (Overall) | 56,638 (51.5%) | 53,356 (48.5%) |
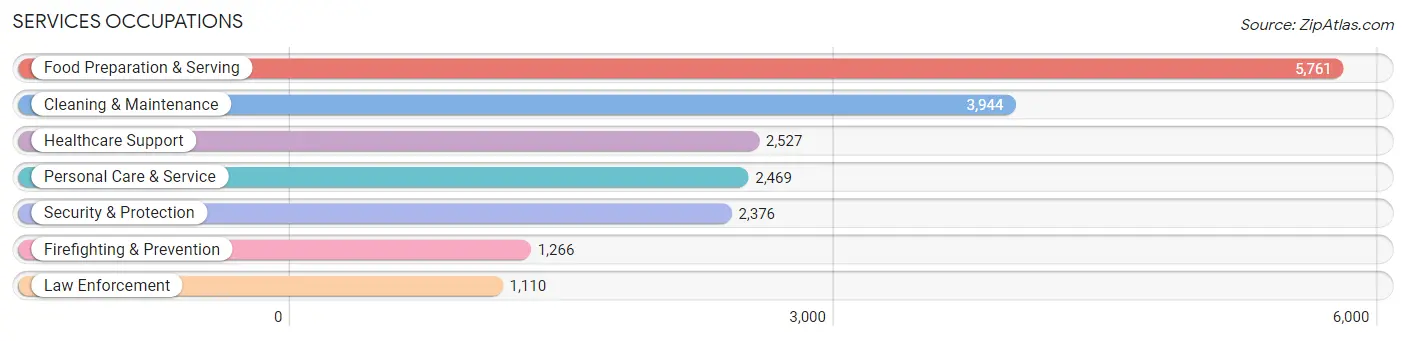
Services Occupations
The most common Services occupations in Tuscaloosa County are Food Preparation & Serving (5,761 | 5.2%), Cleaning & Maintenance (3,944 | 3.6%), Healthcare Support (2,527 | 2.3%), Personal Care & Service (2,469 | 2.2%), and Security & Protection (2,376 | 2.2%).
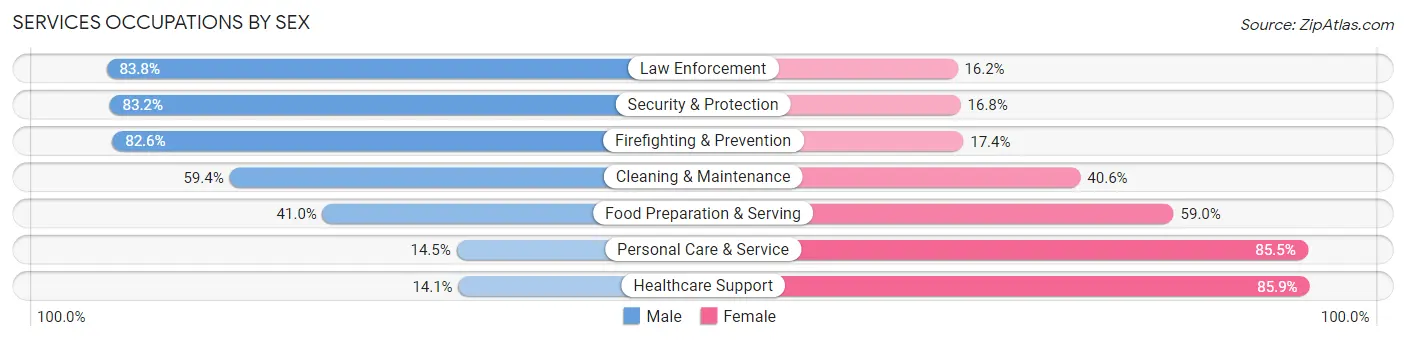
Services Occupations by Sex
Within the Services occupations in Tuscaloosa County, the most male-oriented occupations are Law Enforcement (83.8%), Security & Protection (83.2%), and Firefighting & Prevention (82.6%), while the most female-oriented occupations are Healthcare Support (85.9%), Personal Care & Service (85.5%), and Food Preparation & Serving (59.0%).
| Occupation | Male | Female |
| Healthcare Support | 356 (14.1%) | 2,171 (85.9%) |
| Security & Protection | 1,976 (83.2%) | 400 (16.8%) |
| Firefighting & Prevention | 1,046 (82.6%) | 220 (17.4%) |
| Law Enforcement | 930 (83.8%) | 180 (16.2%) |
| Food Preparation & Serving | 2,361 (41.0%) | 3,400 (59.0%) |
| Cleaning & Maintenance | 2,344 (59.4%) | 1,600 (40.6%) |
| Personal Care & Service | 357 (14.5%) | 2,112 (85.5%) |
| Total (Category) | 7,394 (43.3%) | 9,683 (56.7%) |
| Total (Overall) | 56,638 (51.5%) | 53,356 (48.5%) |
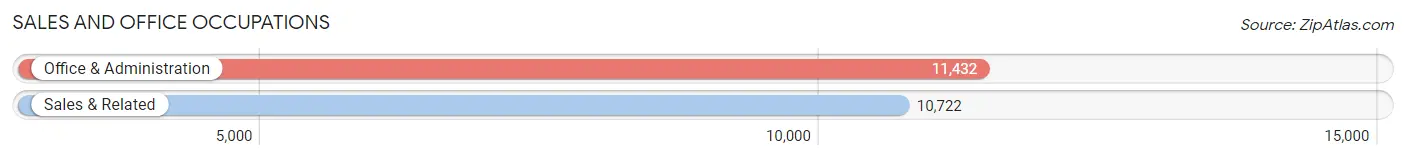
Sales and Office Occupations
The most common Sales and Office occupations in Tuscaloosa County are Office & Administration (11,432 | 10.4%), and Sales & Related (10,722 | 9.8%).
Sales and Office Occupations by Sex
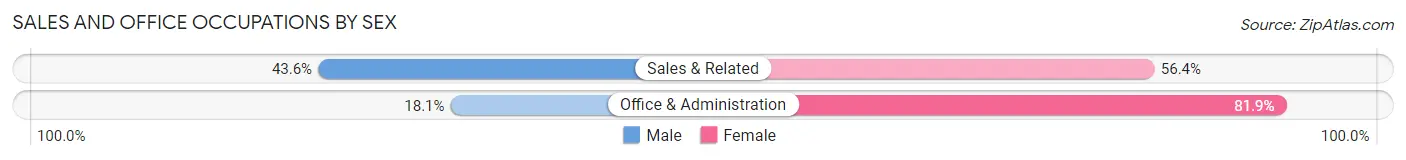
| Occupation | Male | Female |
| Sales & Related | 4,674 (43.6%) | 6,048 (56.4%) |
| Office & Administration | 2,071 (18.1%) | 9,361 (81.9%) |
| Total (Category) | 6,745 (30.4%) | 15,409 (69.6%) |
| Total (Overall) | 56,638 (51.5%) | 53,356 (48.5%) |
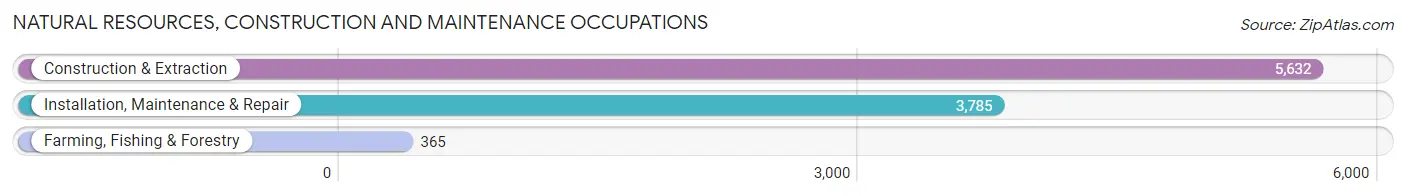
Natural Resources, Construction and Maintenance Occupations
The most common Natural Resources, Construction and Maintenance occupations in Tuscaloosa County are Construction & Extraction (5,632 | 5.1%), Installation, Maintenance & Repair (3,785 | 3.4%), and Farming, Fishing & Forestry (365 | 0.3%).
Natural Resources, Construction and Maintenance Occupations by Sex
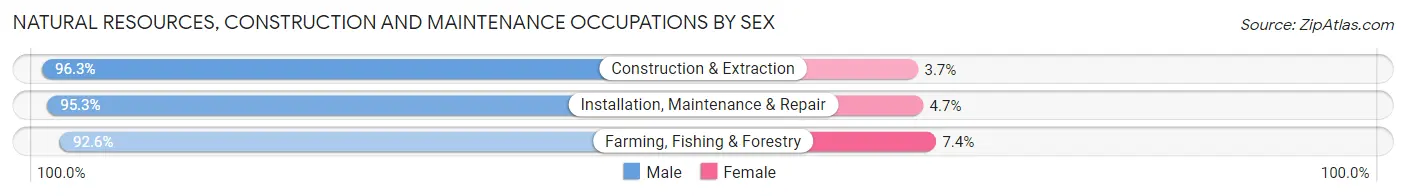
| Occupation | Male | Female |
| Farming, Fishing & Forestry | 338 (92.6%) | 27 (7.4%) |
| Construction & Extraction | 5,426 (96.3%) | 206 (3.7%) |
| Installation, Maintenance & Repair | 3,606 (95.3%) | 179 (4.7%) |
| Total (Category) | 9,370 (95.8%) | 412 (4.2%) |
| Total (Overall) | 56,638 (51.5%) | 53,356 (48.5%) |
Production, Transportation and Moving Occupations
The most common Production, Transportation and Moving occupations in Tuscaloosa County are Production (9,207 | 8.4%), Material Moving (6,954 | 6.3%), and Transportation (3,736 | 3.4%).
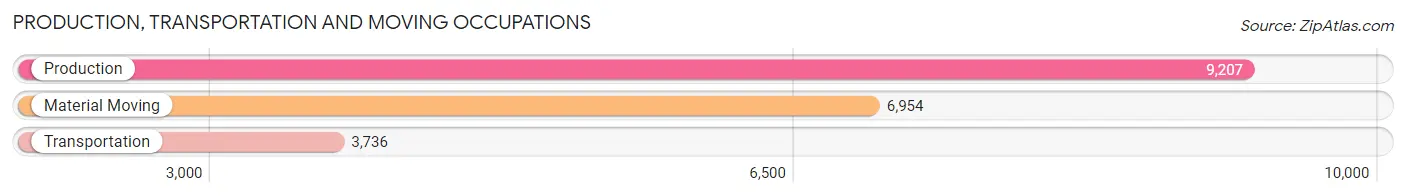
Production, Transportation and Moving Occupations by Sex
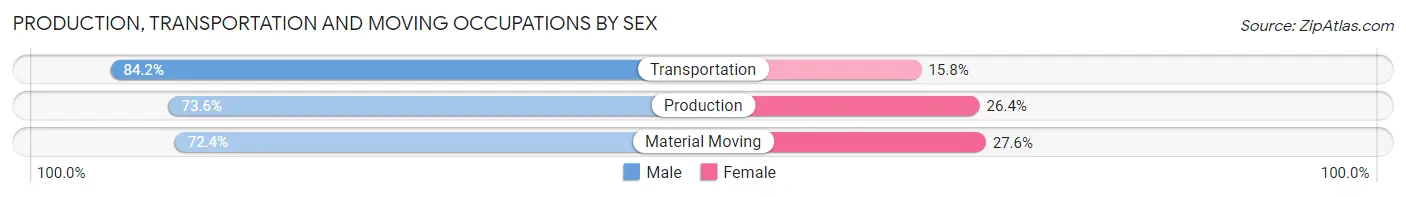
| Occupation | Male | Female |
| Production | 6,773 (73.6%) | 2,434 (26.4%) |
| Transportation | 3,147 (84.2%) | 589 (15.8%) |
| Material Moving | 5,037 (72.4%) | 1,917 (27.6%) |
| Total (Category) | 14,957 (75.2%) | 4,940 (24.8%) |
| Total (Overall) | 56,638 (51.5%) | 53,356 (48.5%) |
Employment Industries by Sex in Tuscaloosa County
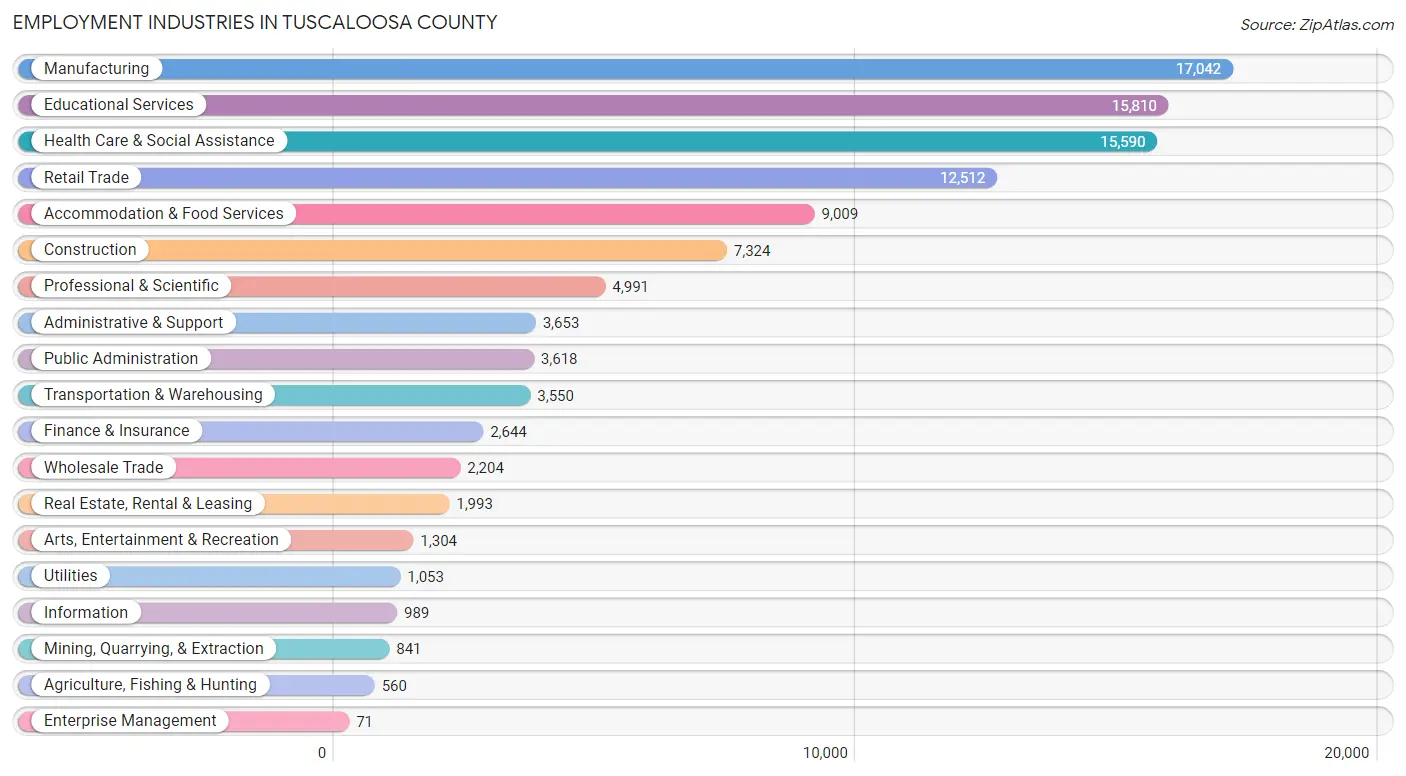
Employment Industries in Tuscaloosa County
The major employment industries in Tuscaloosa County include Manufacturing (17,042 | 15.5%), Educational Services (15,810 | 14.4%), Health Care & Social Assistance (15,590 | 14.2%), Retail Trade (12,512 | 11.4%), and Accommodation & Food Services (9,009 | 8.2%).
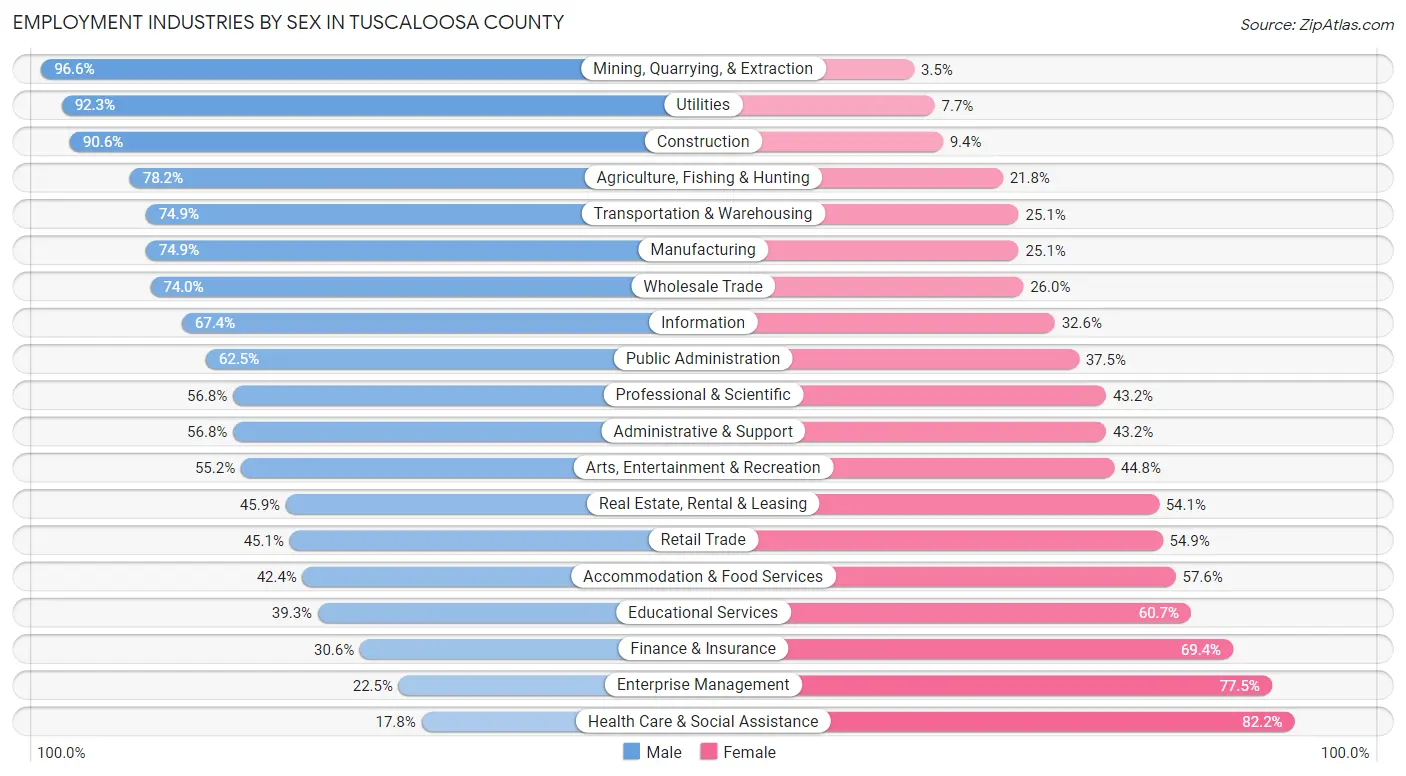
Employment Industries by Sex in Tuscaloosa County
The Tuscaloosa County industries that see more men than women are Mining, Quarrying, & Extraction (96.6%), Utilities (92.3%), and Construction (90.6%), whereas the industries that tend to have a higher number of women are Health Care & Social Assistance (82.2%), Enterprise Management (77.5%), and Finance & Insurance (69.4%).
| Industry | Male | Female |
| Agriculture, Fishing & Hunting | 438 (78.2%) | 122 (21.8%) |
| Mining, Quarrying, & Extraction | 812 (96.6%) | 29 (3.5%) |
| Construction | 6,637 (90.6%) | 687 (9.4%) |
| Manufacturing | 12,767 (74.9%) | 4,275 (25.1%) |
| Wholesale Trade | 1,630 (74.0%) | 574 (26.0%) |
| Retail Trade | 5,645 (45.1%) | 6,867 (54.9%) |
| Transportation & Warehousing | 2,660 (74.9%) | 890 (25.1%) |
| Utilities | 972 (92.3%) | 81 (7.7%) |
| Information | 667 (67.4%) | 322 (32.6%) |
| Finance & Insurance | 808 (30.6%) | 1,836 (69.4%) |
| Real Estate, Rental & Leasing | 915 (45.9%) | 1,078 (54.1%) |
| Professional & Scientific | 2,837 (56.8%) | 2,154 (43.2%) |
| Enterprise Management | 16 (22.5%) | 55 (77.5%) |
| Administrative & Support | 2,076 (56.8%) | 1,577 (43.2%) |
| Educational Services | 6,211 (39.3%) | 9,599 (60.7%) |
| Health Care & Social Assistance | 2,781 (17.8%) | 12,809 (82.2%) |
| Arts, Entertainment & Recreation | 720 (55.2%) | 584 (44.8%) |
| Accommodation & Food Services | 3,823 (42.4%) | 5,186 (57.6%) |
| Public Administration | 2,260 (62.5%) | 1,358 (37.5%) |
| Total | 56,638 (51.5%) | 53,356 (48.5%) |
Education in Tuscaloosa County
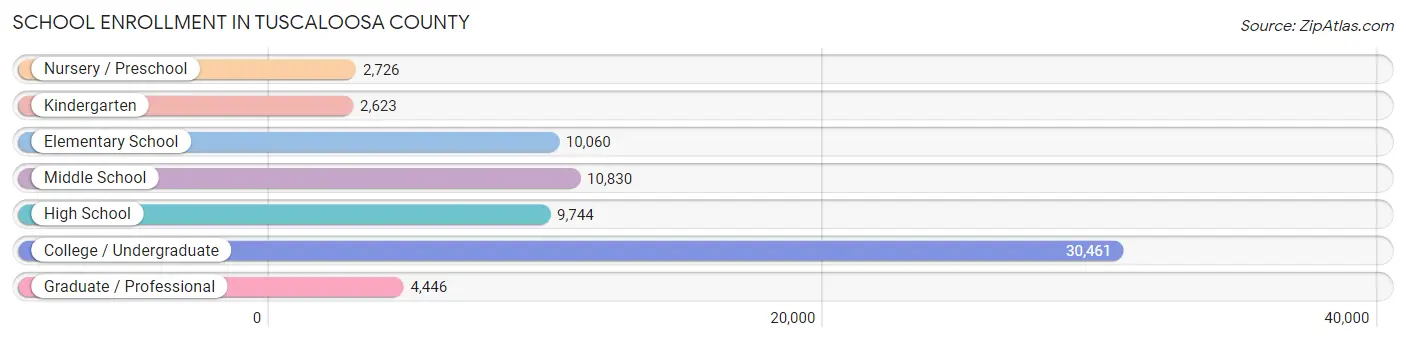
School Enrollment in Tuscaloosa County
The most common levels of schooling among the 70,890 students in Tuscaloosa County are college / undergraduate (30,461 | 43.0%), middle school (10,830 | 15.3%), and elementary school (10,060 | 14.2%).
| School Level | # Students | % Students |
| Nursery / Preschool | 2,726 | 3.8% |
| Kindergarten | 2,623 | 3.7% |
| Elementary School | 10,060 | 14.2% |
| Middle School | 10,830 | 15.3% |
| High School | 9,744 | 13.8% |
| College / Undergraduate | 30,461 | 43.0% |
| Graduate / Professional | 4,446 | 6.3% |
| Total | 70,890 | 100.0% |
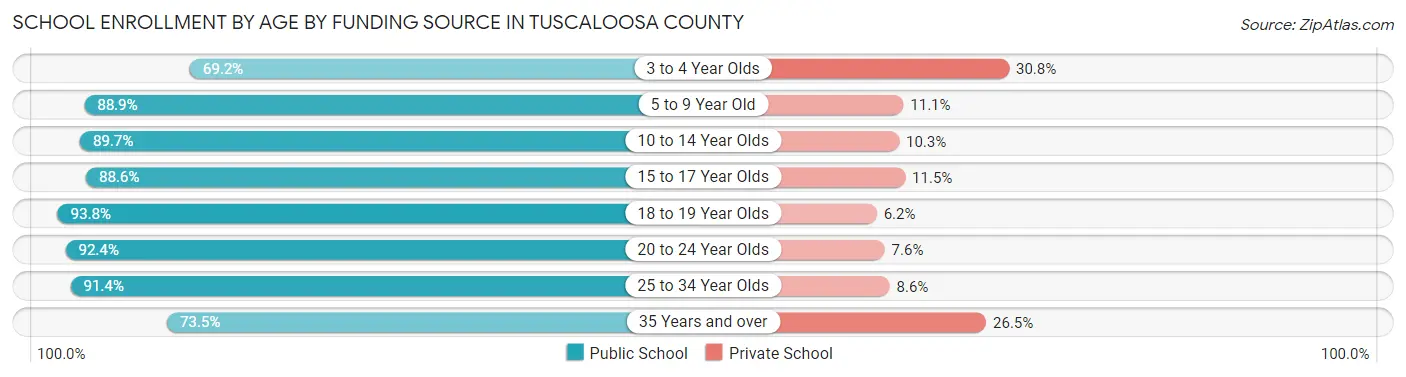
School Enrollment by Age by Funding Source in Tuscaloosa County
Out of a total of 70,890 students who are enrolled in schools in Tuscaloosa County, 7,231 (10.2%) attend a private institution, while the remaining 63,659 (89.8%) are enrolled in public schools. The age group of 3 to 4 year olds has the highest likelihood of being enrolled in private schools, with 620 (30.8% in the age bracket) enrolled. Conversely, the age group of 18 to 19 year olds has the lowest likelihood of being enrolled in a private school, with 12,921 (93.8% in the age bracket) attending a public institution.
| Age Bracket | Public School | Private School |
| 3 to 4 Year Olds | 1,393 (69.2%) | 620 (30.8%) |
| 5 to 9 Year Old | 10,778 (88.9%) | 1,349 (11.1%) |
| 10 to 14 Year Olds | 11,684 (89.7%) | 1,345 (10.3%) |
| 15 to 17 Year Olds | 6,708 (88.5%) | 867 (11.5%) |
| 18 to 19 Year Olds | 12,921 (93.8%) | 848 (6.2%) |
| 20 to 24 Year Olds | 14,196 (92.4%) | 1,172 (7.6%) |
| 25 to 34 Year Olds | 4,327 (91.4%) | 405 (8.6%) |
| 35 Years and over | 1,673 (73.5%) | 604 (26.5%) |
| Total | 63,659 (89.8%) | 7,231 (10.2%) |
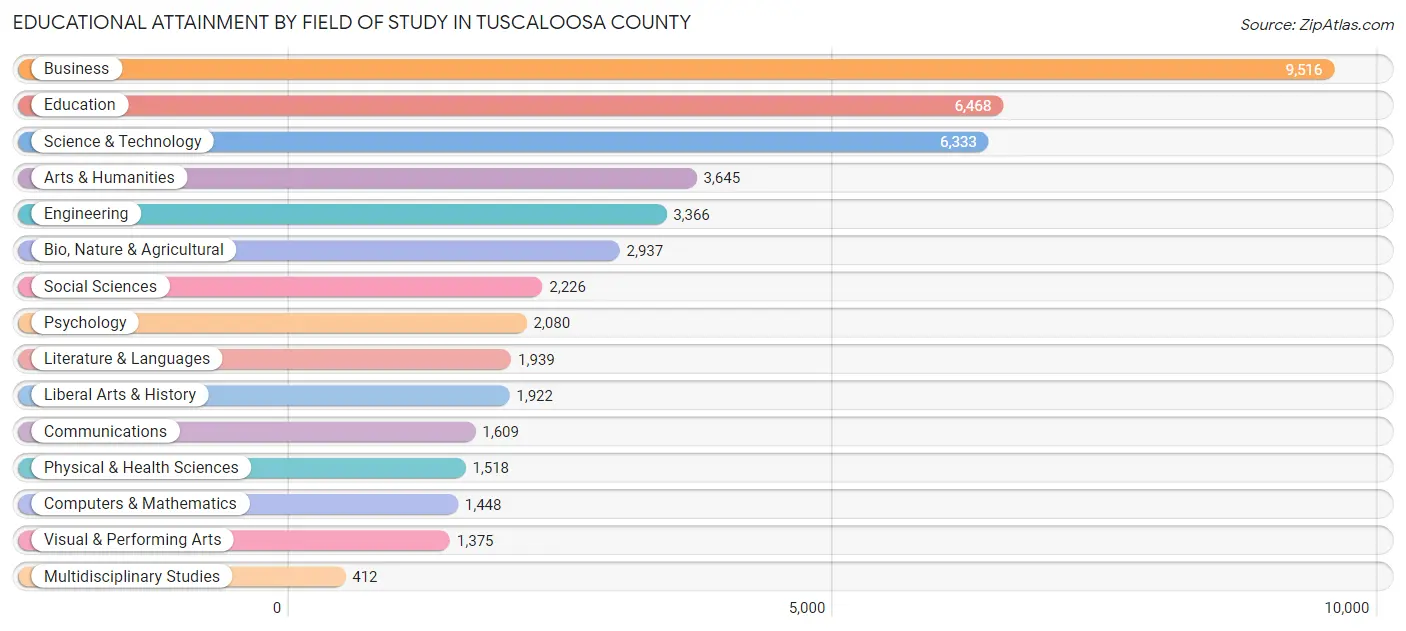
Educational Attainment by Field of Study in Tuscaloosa County
Business (9,516 | 20.3%), education (6,468 | 13.8%), science & technology (6,333 | 13.5%), arts & humanities (3,645 | 7.8%), and engineering (3,366 | 7.2%) are the most common fields of study among 46,794 individuals in Tuscaloosa County who have obtained a bachelor's degree or higher.
| Field of Study | # Graduates | % Graduates |
| Computers & Mathematics | 1,448 | 3.1% |
| Bio, Nature & Agricultural | 2,937 | 6.3% |
| Physical & Health Sciences | 1,518 | 3.2% |
| Psychology | 2,080 | 4.4% |
| Social Sciences | 2,226 | 4.8% |
| Engineering | 3,366 | 7.2% |
| Multidisciplinary Studies | 412 | 0.9% |
| Science & Technology | 6,333 | 13.5% |
| Business | 9,516 | 20.3% |
| Education | 6,468 | 13.8% |
| Literature & Languages | 1,939 | 4.1% |
| Liberal Arts & History | 1,922 | 4.1% |
| Visual & Performing Arts | 1,375 | 2.9% |
| Communications | 1,609 | 3.4% |
| Arts & Humanities | 3,645 | 7.8% |
| Total | 46,794 | 100.0% |
Transportation & Commute in Tuscaloosa County
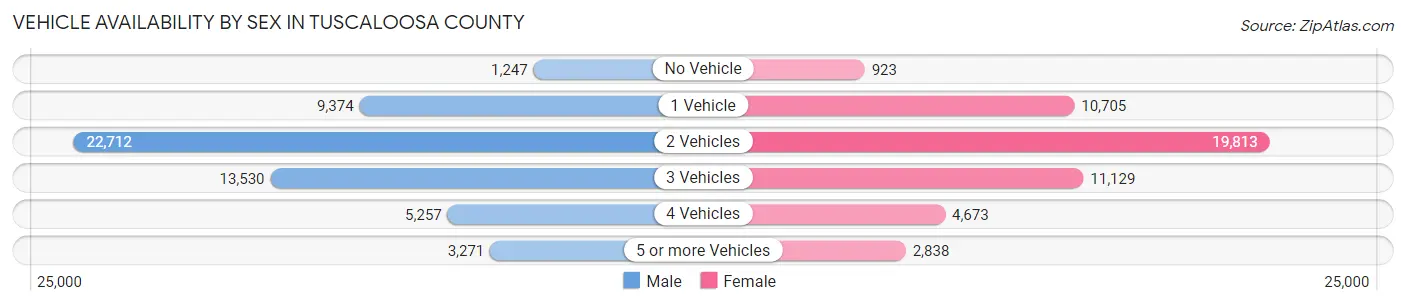
Vehicle Availability by Sex in Tuscaloosa County
The most prevalent vehicle ownership categories in Tuscaloosa County are males with 2 vehicles (22,712, accounting for 41.0%) and females with 2 vehicles (19,813, making up 45.4%).
| Vehicles Available | Male | Female |
| No Vehicle | 1,247 (2.2%) | 923 (1.8%) |
| 1 Vehicle | 9,374 (16.9%) | 10,705 (21.4%) |
| 2 Vehicles | 22,712 (41.0%) | 19,813 (39.6%) |
| 3 Vehicles | 13,530 (24.4%) | 11,129 (22.2%) |
| 4 Vehicles | 5,257 (9.5%) | 4,673 (9.3%) |
| 5 or more Vehicles | 3,271 (5.9%) | 2,838 (5.7%) |
| Total | 55,391 (100.0%) | 50,081 (100.0%) |
Commute Time in Tuscaloosa County
The most frequently occuring commute durations in Tuscaloosa County are 15 to 19 minutes (20,765 commuters, 20.4%), 20 to 24 minutes (17,659 commuters, 17.3%), and 10 to 14 minutes (15,820 commuters, 15.5%).
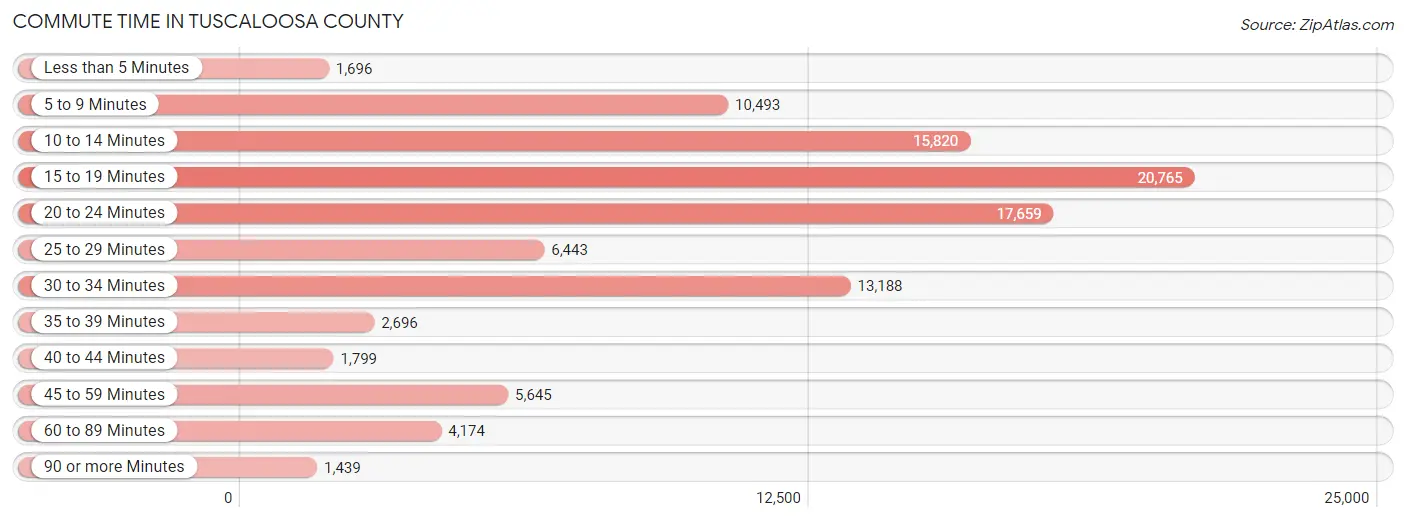
| Commute Time | # Commuters | % Commuters |
| Less than 5 Minutes | 1,696 | 1.7% |
| 5 to 9 Minutes | 10,493 | 10.3% |
| 10 to 14 Minutes | 15,820 | 15.5% |
| 15 to 19 Minutes | 20,765 | 20.4% |
| 20 to 24 Minutes | 17,659 | 17.3% |
| 25 to 29 Minutes | 6,443 | 6.3% |
| 30 to 34 Minutes | 13,188 | 13.0% |
| 35 to 39 Minutes | 2,696 | 2.6% |
| 40 to 44 Minutes | 1,799 | 1.8% |
| 45 to 59 Minutes | 5,645 | 5.5% |
| 60 to 89 Minutes | 4,174 | 4.1% |
| 90 or more Minutes | 1,439 | 1.4% |
Commute Time by Sex in Tuscaloosa County
The most common commute times in Tuscaloosa County are 15 to 19 minutes (11,226 commuters, 21.0%) for males and 15 to 19 minutes (9,539 commuters, 19.7%) for females.
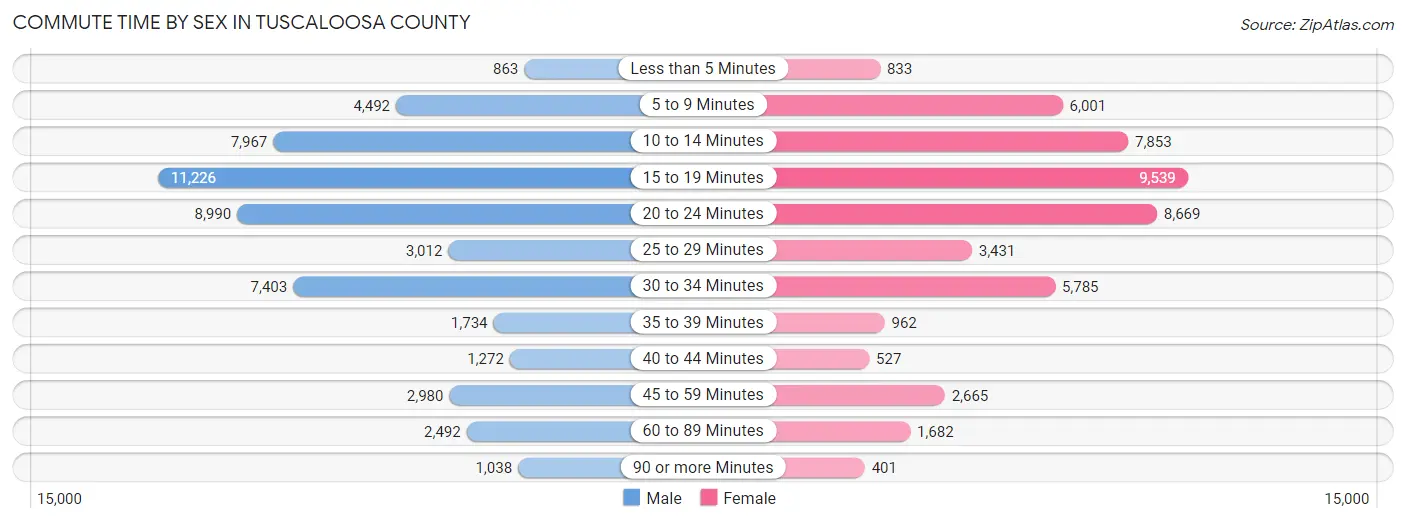
| Commute Time | Male | Female |
| Less than 5 Minutes | 863 (1.6%) | 833 (1.7%) |
| 5 to 9 Minutes | 4,492 (8.4%) | 6,001 (12.4%) |
| 10 to 14 Minutes | 7,967 (14.9%) | 7,853 (16.2%) |
| 15 to 19 Minutes | 11,226 (21.0%) | 9,539 (19.7%) |
| 20 to 24 Minutes | 8,990 (16.8%) | 8,669 (17.9%) |
| 25 to 29 Minutes | 3,012 (5.6%) | 3,431 (7.1%) |
| 30 to 34 Minutes | 7,403 (13.9%) | 5,785 (12.0%) |
| 35 to 39 Minutes | 1,734 (3.2%) | 962 (2.0%) |
| 40 to 44 Minutes | 1,272 (2.4%) | 527 (1.1%) |
| 45 to 59 Minutes | 2,980 (5.6%) | 2,665 (5.5%) |
| 60 to 89 Minutes | 2,492 (4.7%) | 1,682 (3.5%) |
| 90 or more Minutes | 1,038 (1.9%) | 401 (0.8%) |
Time of Departure to Work by Sex in Tuscaloosa County
The most frequent times of departure to work in Tuscaloosa County are 7:00 AM to 7:29 AM (7,231, 13.5%) for males and 7:30 AM to 7:59 AM (9,160, 19.0%) for females.
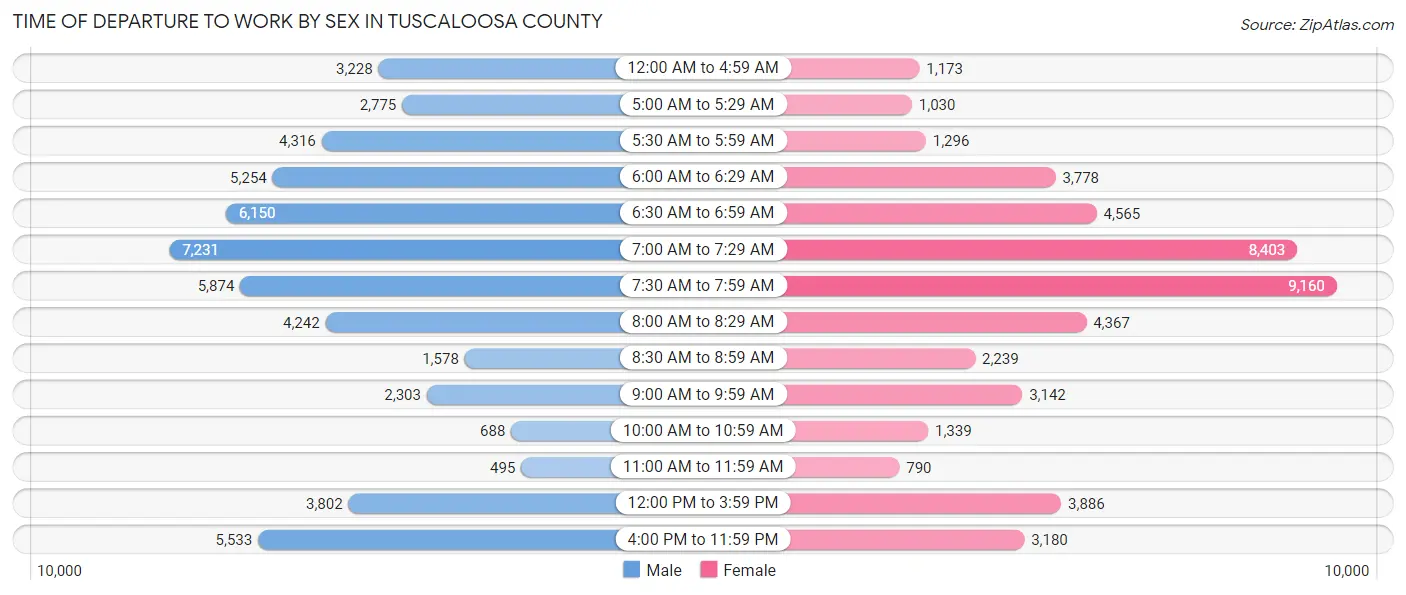
| Time of Departure | Male | Female |
| 12:00 AM to 4:59 AM | 3,228 (6.0%) | 1,173 (2.4%) |
| 5:00 AM to 5:29 AM | 2,775 (5.2%) | 1,030 (2.1%) |
| 5:30 AM to 5:59 AM | 4,316 (8.1%) | 1,296 (2.7%) |
| 6:00 AM to 6:29 AM | 5,254 (9.8%) | 3,778 (7.8%) |
| 6:30 AM to 6:59 AM | 6,150 (11.5%) | 4,565 (9.4%) |
| 7:00 AM to 7:29 AM | 7,231 (13.5%) | 8,403 (17.4%) |
| 7:30 AM to 7:59 AM | 5,874 (11.0%) | 9,160 (19.0%) |
| 8:00 AM to 8:29 AM | 4,242 (7.9%) | 4,367 (9.0%) |
| 8:30 AM to 8:59 AM | 1,578 (2.9%) | 2,239 (4.6%) |
| 9:00 AM to 9:59 AM | 2,303 (4.3%) | 3,142 (6.5%) |
| 10:00 AM to 10:59 AM | 688 (1.3%) | 1,339 (2.8%) |
| 11:00 AM to 11:59 AM | 495 (0.9%) | 790 (1.6%) |
| 12:00 PM to 3:59 PM | 3,802 (7.1%) | 3,886 (8.0%) |
| 4:00 PM to 11:59 PM | 5,533 (10.3%) | 3,180 (6.6%) |
| Total | 53,469 (100.0%) | 48,348 (100.0%) |
Housing Occupancy in Tuscaloosa County
Occupancy by Ownership in Tuscaloosa County
Of the total 84,743 dwellings in Tuscaloosa County, owner-occupied units account for 52,792 (62.3%), while renter-occupied units make up 31,951 (37.7%).
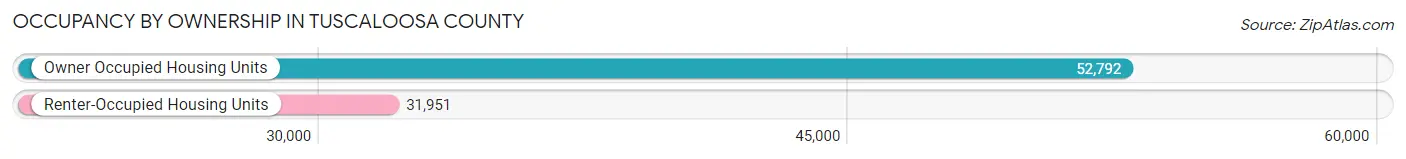
| Occupancy | # Housing Units | % Housing Units |
| Owner Occupied Housing Units | 52,792 | 62.3% |
| Renter-Occupied Housing Units | 31,951 | 37.7% |
| Total Occupied Housing Units | 84,743 | 100.0% |
Occupancy by Household Size in Tuscaloosa County
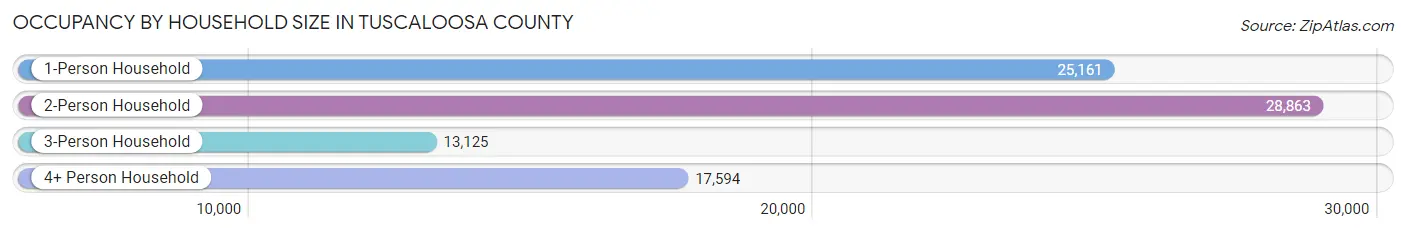
| Household Size | # Housing Units | % Housing Units |
| 1-Person Household | 25,161 | 29.7% |
| 2-Person Household | 28,863 | 34.1% |
| 3-Person Household | 13,125 | 15.5% |
| 4+ Person Household | 17,594 | 20.8% |
| Total Housing Units | 84,743 | 100.0% |
Occupancy by Ownership by Household Size in Tuscaloosa County
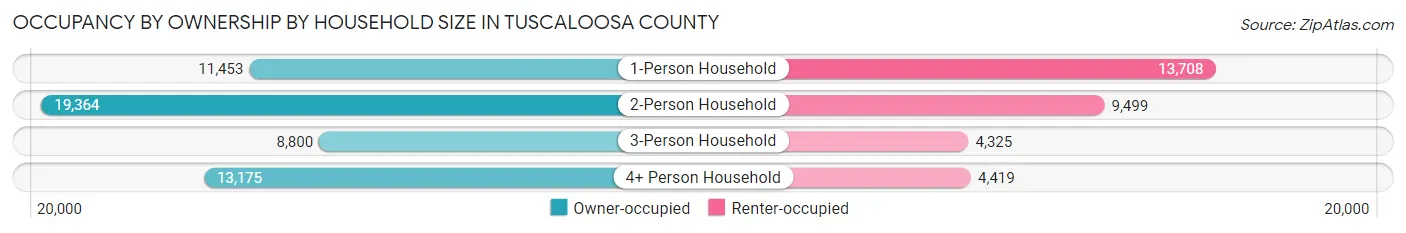
| Household Size | Owner-occupied | Renter-occupied |
| 1-Person Household | 11,453 (45.5%) | 13,708 (54.5%) |
| 2-Person Household | 19,364 (67.1%) | 9,499 (32.9%) |
| 3-Person Household | 8,800 (67.0%) | 4,325 (33.0%) |
| 4+ Person Household | 13,175 (74.9%) | 4,419 (25.1%) |
| Total Housing Units | 52,792 (62.3%) | 31,951 (37.7%) |
Occupancy by Educational Attainment in Tuscaloosa County
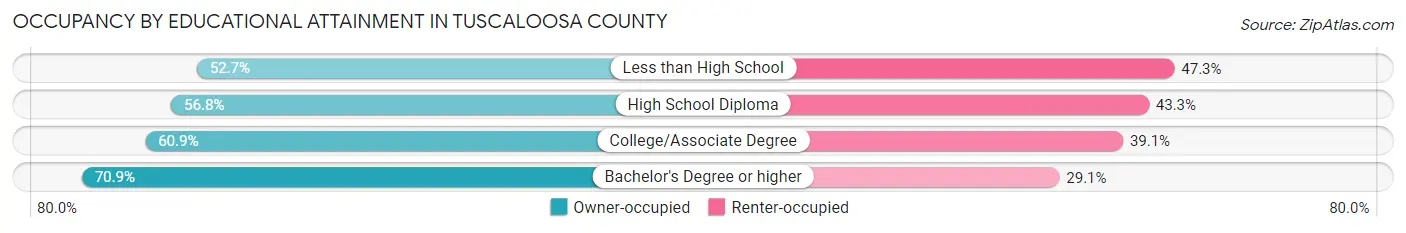
| Household Size | Owner-occupied | Renter-occupied |
| Less than High School | 3,478 (52.7%) | 3,121 (47.3%) |
| High School Diploma | 13,496 (56.8%) | 10,285 (43.2%) |
| College/Associate Degree | 16,583 (60.9%) | 10,664 (39.1%) |
| Bachelor's Degree or higher | 19,235 (70.9%) | 7,881 (29.1%) |
Occupancy by Age of Householder in Tuscaloosa County
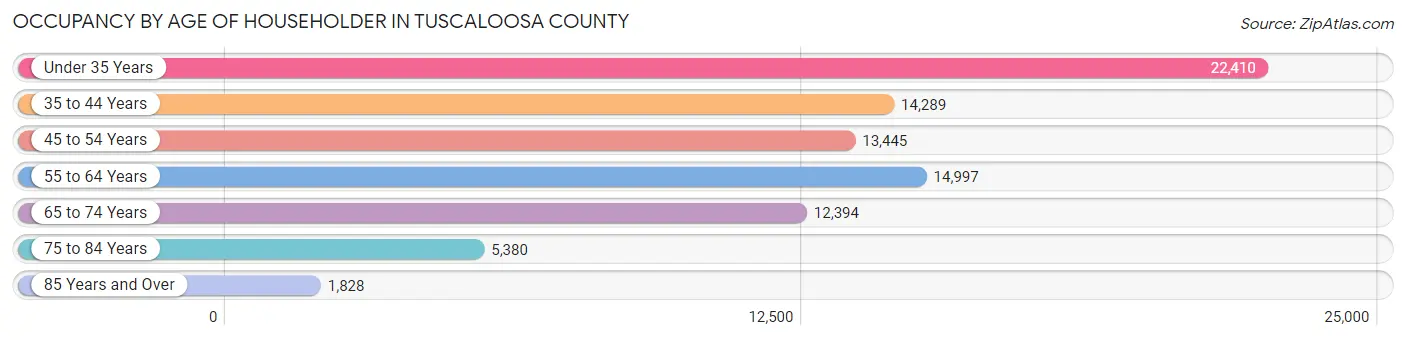
| Age Bracket | # Households | % Households |
| Under 35 Years | 22,410 | 26.4% |
| 35 to 44 Years | 14,289 | 16.9% |
| 45 to 54 Years | 13,445 | 15.9% |
| 55 to 64 Years | 14,997 | 17.7% |
| 65 to 74 Years | 12,394 | 14.6% |
| 75 to 84 Years | 5,380 | 6.4% |
| 85 Years and Over | 1,828 | 2.2% |
| Total | 84,743 | 100.0% |
Housing Finances in Tuscaloosa County
Median Income by Occupancy in Tuscaloosa County
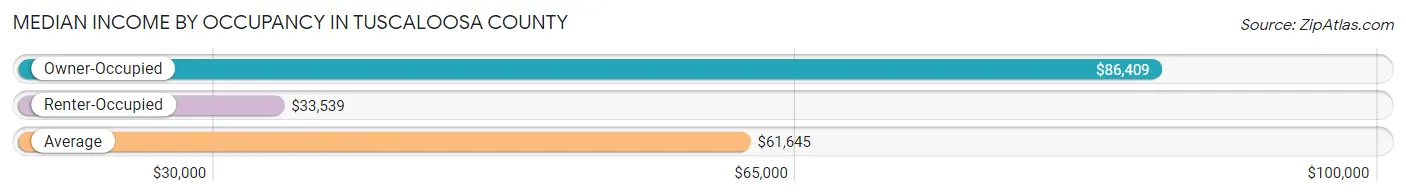
| Occupancy Type | # Households | Median Income |
| Owner-Occupied | 52,792 (62.3%) | $86,409 |
| Renter-Occupied | 31,951 (37.7%) | $33,539 |
| Average | 84,743 (100.0%) | $61,645 |
Occupancy by Householder Income Bracket in Tuscaloosa County
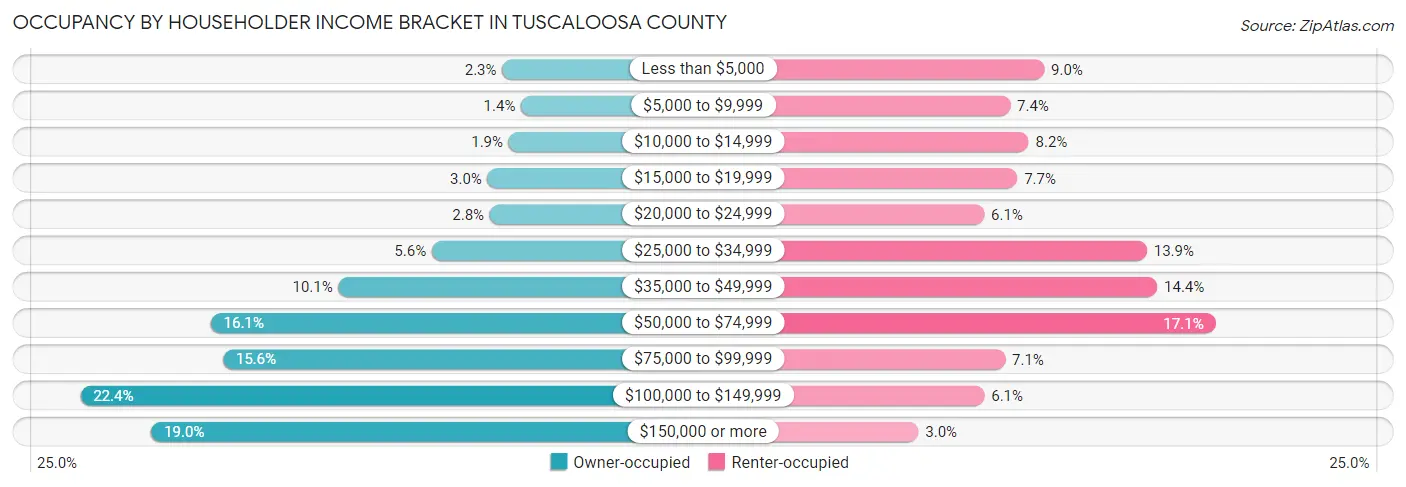
| Income Bracket | Owner-occupied | Renter-occupied |
| Less than $5,000 | 1,188 (2.2%) | 2,870 (9.0%) |
| $5,000 to $9,999 | 713 (1.3%) | 2,352 (7.4%) |
| $10,000 to $14,999 | 1,024 (1.9%) | 2,632 (8.2%) |
| $15,000 to $19,999 | 1,556 (2.9%) | 2,459 (7.7%) |
| $20,000 to $24,999 | 1,501 (2.8%) | 1,955 (6.1%) |
| $25,000 to $34,999 | 2,955 (5.6%) | 4,431 (13.9%) |
| $35,000 to $49,999 | 5,303 (10.1%) | 4,588 (14.4%) |
| $50,000 to $74,999 | 8,519 (16.1%) | 5,475 (17.1%) |
| $75,000 to $99,999 | 8,216 (15.6%) | 2,276 (7.1%) |
| $100,000 to $149,999 | 11,797 (22.4%) | 1,957 (6.1%) |
| $150,000 or more | 10,020 (19.0%) | 956 (3.0%) |
| Total | 52,792 (100.0%) | 31,951 (100.0%) |
Monthly Housing Cost Tiers in Tuscaloosa County
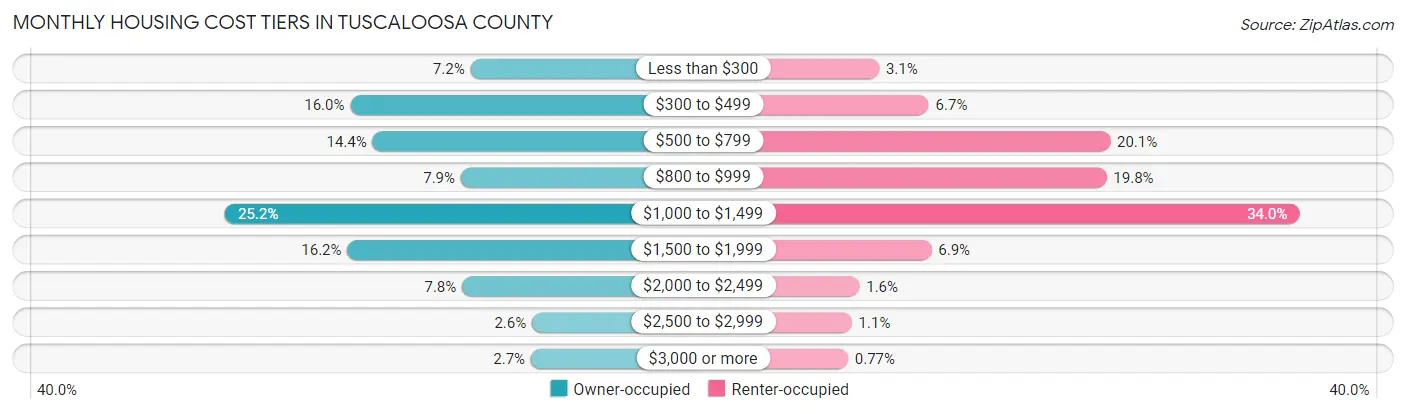
| Monthly Cost | Owner-occupied | Renter-occupied |
| Less than $300 | 3,780 (7.2%) | 979 (3.1%) |
| $300 to $499 | 8,454 (16.0%) | 2,148 (6.7%) |
| $500 to $799 | 7,586 (14.4%) | 6,417 (20.1%) |
| $800 to $999 | 4,154 (7.9%) | 6,330 (19.8%) |
| $1,000 to $1,499 | 13,326 (25.2%) | 10,867 (34.0%) |
| $1,500 to $1,999 | 8,568 (16.2%) | 2,212 (6.9%) |
| $2,000 to $2,499 | 4,108 (7.8%) | 514 (1.6%) |
| $2,500 to $2,999 | 1,386 (2.6%) | 335 (1.1%) |
| $3,000 or more | 1,430 (2.7%) | 247 (0.8%) |
| Total | 52,792 (100.0%) | 31,951 (100.0%) |
Physical Housing Characteristics in Tuscaloosa County
Housing Structures in Tuscaloosa County
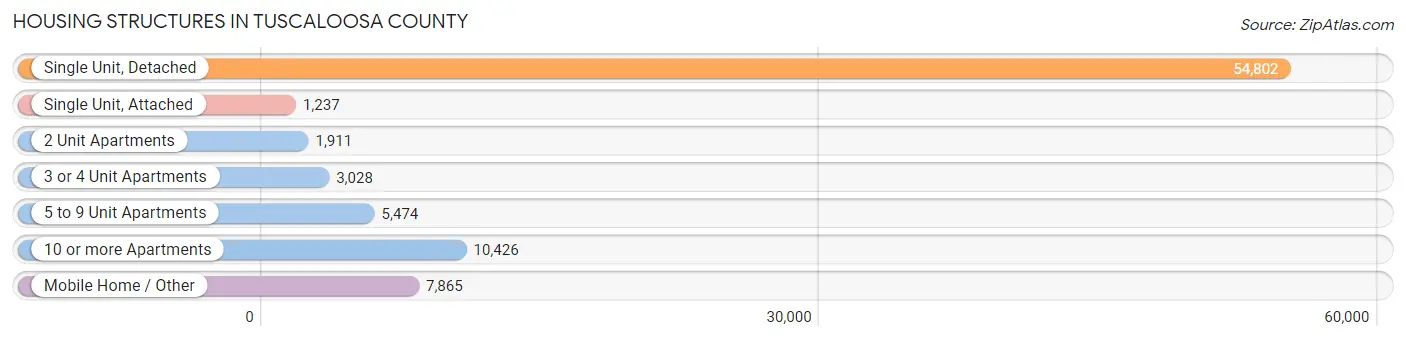
| Structure Type | # Housing Units | % Housing Units |
| Single Unit, Detached | 54,802 | 64.7% |
| Single Unit, Attached | 1,237 | 1.5% |
| 2 Unit Apartments | 1,911 | 2.3% |
| 3 or 4 Unit Apartments | 3,028 | 3.6% |
| 5 to 9 Unit Apartments | 5,474 | 6.5% |
| 10 or more Apartments | 10,426 | 12.3% |
| Mobile Home / Other | 7,865 | 9.3% |
| Total | 84,743 | 100.0% |
Housing Structures by Occupancy in Tuscaloosa County
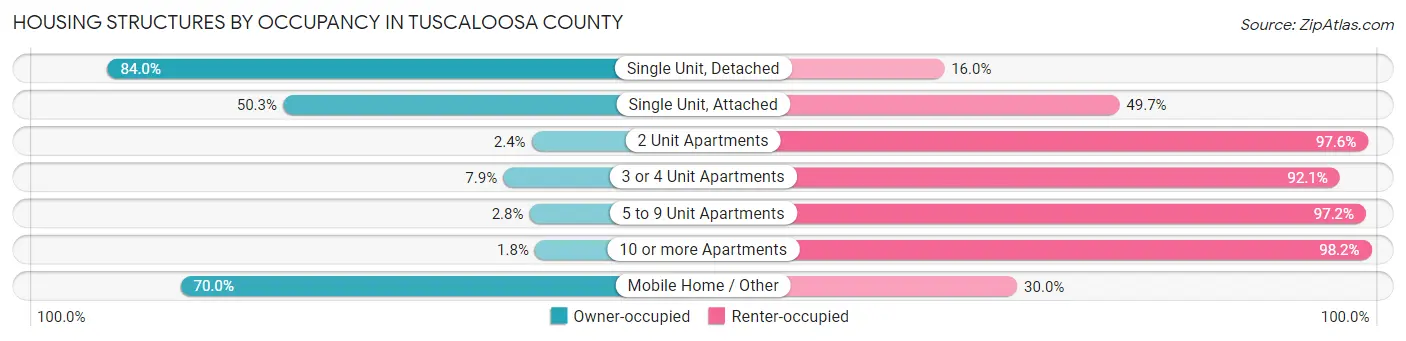
| Structure Type | Owner-occupied | Renter-occupied |
| Single Unit, Detached | 46,041 (84.0%) | 8,761 (16.0%) |
| Single Unit, Attached | 622 (50.3%) | 615 (49.7%) |
| 2 Unit Apartments | 46 (2.4%) | 1,865 (97.6%) |
| 3 or 4 Unit Apartments | 239 (7.9%) | 2,789 (92.1%) |
| 5 to 9 Unit Apartments | 155 (2.8%) | 5,319 (97.2%) |
| 10 or more Apartments | 186 (1.8%) | 10,240 (98.2%) |
| Mobile Home / Other | 5,503 (70.0%) | 2,362 (30.0%) |
| Total | 52,792 (62.3%) | 31,951 (37.7%) |
Housing Structures by Number of Rooms in Tuscaloosa County
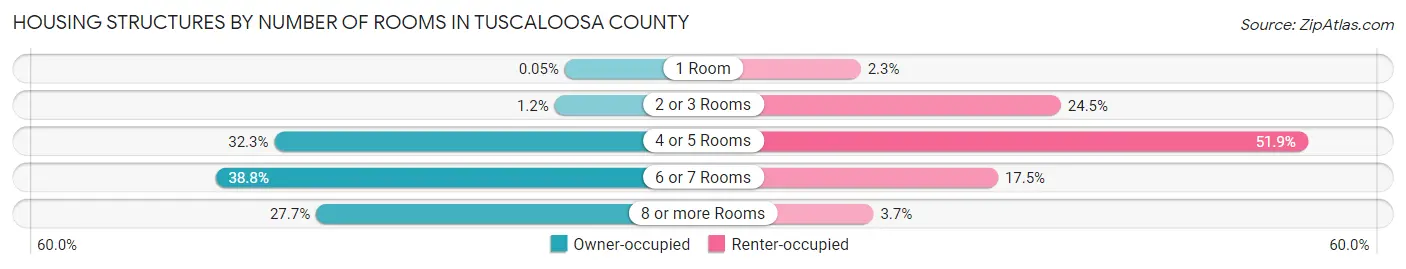
| Number of Rooms | Owner-occupied | Renter-occupied |
| 1 Room | 24 (0.1%) | 738 (2.3%) |
| 2 or 3 Rooms | 629 (1.2%) | 7,835 (24.5%) |
| 4 or 5 Rooms | 17,048 (32.3%) | 16,586 (51.9%) |
| 6 or 7 Rooms | 20,487 (38.8%) | 5,604 (17.5%) |
| 8 or more Rooms | 14,604 (27.7%) | 1,188 (3.7%) |
| Total | 52,792 (100.0%) | 31,951 (100.0%) |
Housing Structure by Heating Type in Tuscaloosa County
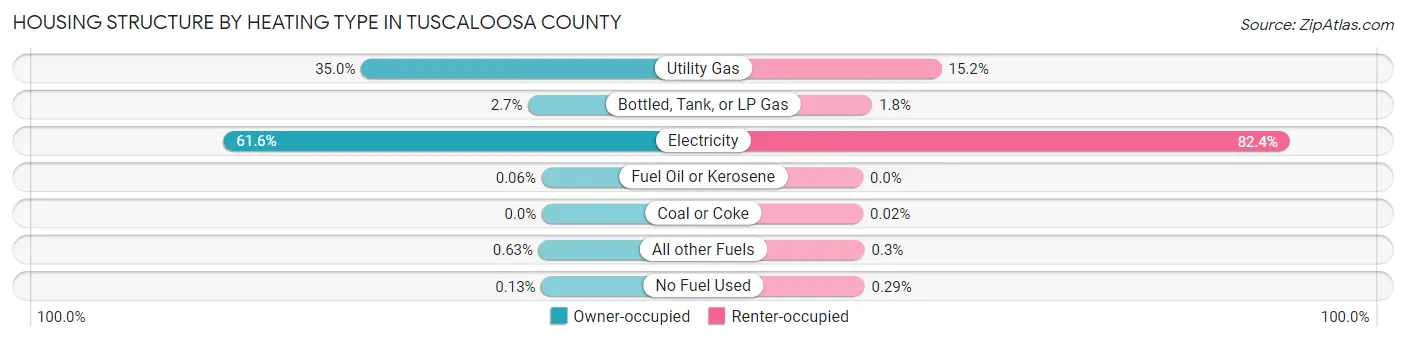
| Heating Type | Owner-occupied | Renter-occupied |
| Utility Gas | 18,450 (34.9%) | 4,847 (15.2%) |
| Bottled, Tank, or LP Gas | 1,401 (2.6%) | 569 (1.8%) |
| Electricity | 32,508 (61.6%) | 26,339 (82.4%) |
| Fuel Oil or Kerosene | 30 (0.1%) | 0 (0.0%) |
| Coal or Coke | 0 (0.0%) | 5 (0.0%) |
| All other Fuels | 334 (0.6%) | 97 (0.3%) |
| No Fuel Used | 69 (0.1%) | 94 (0.3%) |
| Total | 52,792 (100.0%) | 31,951 (100.0%) |
Household Vehicle Usage in Tuscaloosa County
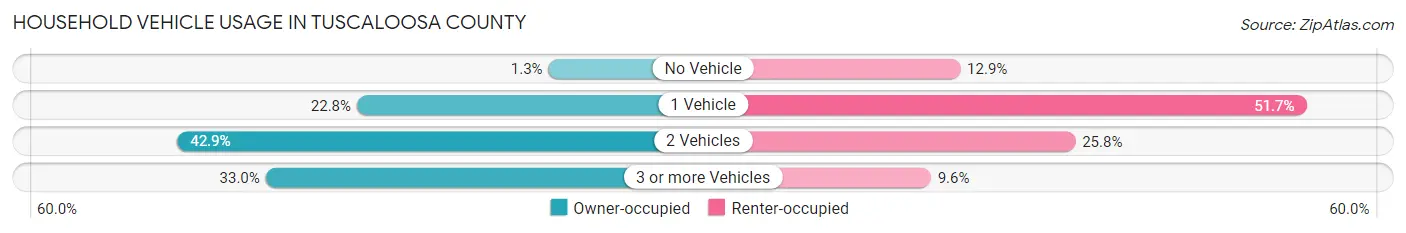
| Vehicles per Household | Owner-occupied | Renter-occupied |
| No Vehicle | 696 (1.3%) | 4,125 (12.9%) |
| 1 Vehicle | 12,028 (22.8%) | 16,512 (51.7%) |
| 2 Vehicles | 22,645 (42.9%) | 8,243 (25.8%) |
| 3 or more Vehicles | 17,423 (33.0%) | 3,071 (9.6%) |
| Total | 52,792 (100.0%) | 31,951 (100.0%) |
Real Estate & Mortgages in Tuscaloosa County
Real Estate and Mortgage Overview in Tuscaloosa County
| Characteristic | Without Mortgage | With Mortgage |
| Housing Units | 19,129 | 33,663 |
| Median Property Value | $201,200 | $228,700 |
| Median Household Income | $59,871 | $7,805 |
| Monthly Housing Costs | $438 | $1,408 |
| Real Estate Taxes | $644 | $4,251 |
Property Value by Mortgage Status in Tuscaloosa County
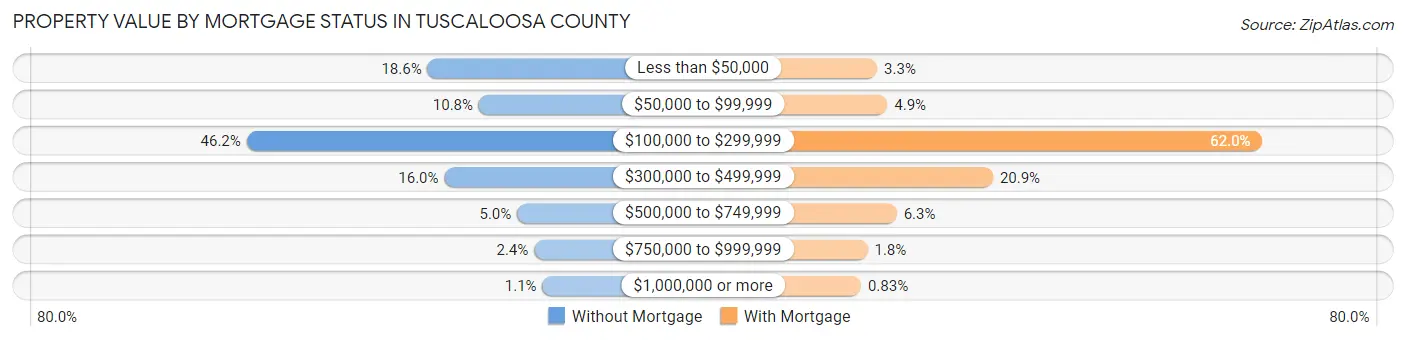
| Property Value | Without Mortgage | With Mortgage |
| Less than $50,000 | 3,560 (18.6%) | 1,107 (3.3%) |
| $50,000 to $99,999 | 2,062 (10.8%) | 1,631 (4.9%) |
| $100,000 to $299,999 | 8,832 (46.2%) | 20,869 (62.0%) |
| $300,000 to $499,999 | 3,068 (16.0%) | 7,050 (20.9%) |
| $500,000 to $749,999 | 947 (5.0%) | 2,112 (6.3%) |
| $750,000 to $999,999 | 451 (2.4%) | 615 (1.8%) |
| $1,000,000 or more | 209 (1.1%) | 279 (0.8%) |
| Total | 19,129 (100.0%) | 33,663 (100.0%) |
Household Income by Mortgage Status in Tuscaloosa County
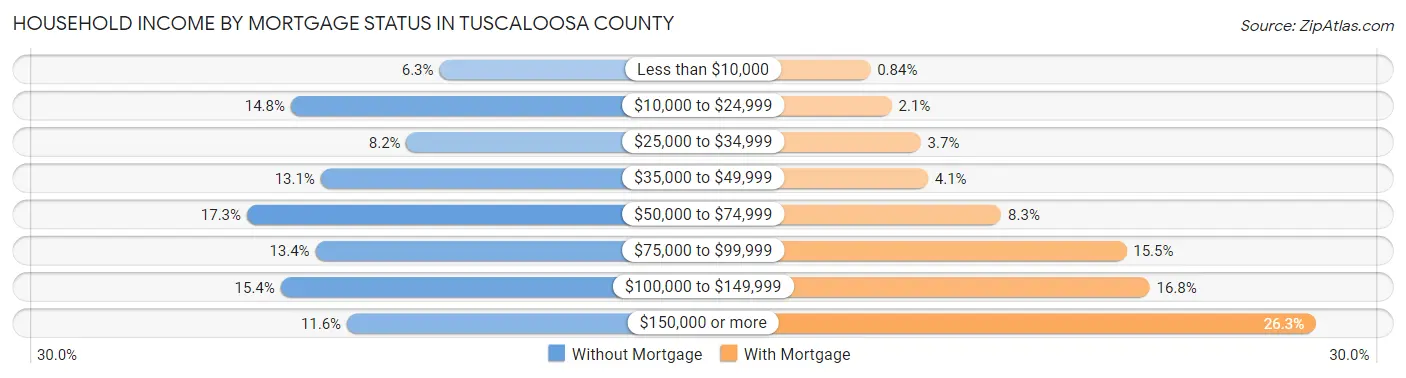
| Household Income | Without Mortgage | With Mortgage |
| Less than $10,000 | 1,206 (6.3%) | 284 (0.8%) |
| $10,000 to $24,999 | 2,830 (14.8%) | 695 (2.1%) |
| $25,000 to $34,999 | 1,565 (8.2%) | 1,251 (3.7%) |
| $35,000 to $49,999 | 2,503 (13.1%) | 1,390 (4.1%) |
| $50,000 to $74,999 | 3,310 (17.3%) | 2,800 (8.3%) |
| $75,000 to $99,999 | 2,559 (13.4%) | 5,209 (15.5%) |
| $100,000 to $149,999 | 2,941 (15.4%) | 5,657 (16.8%) |
| $150,000 or more | 2,215 (11.6%) | 8,856 (26.3%) |
| Total | 19,129 (100.0%) | 33,663 (100.0%) |
Property Value to Household Income Ratio in Tuscaloosa County
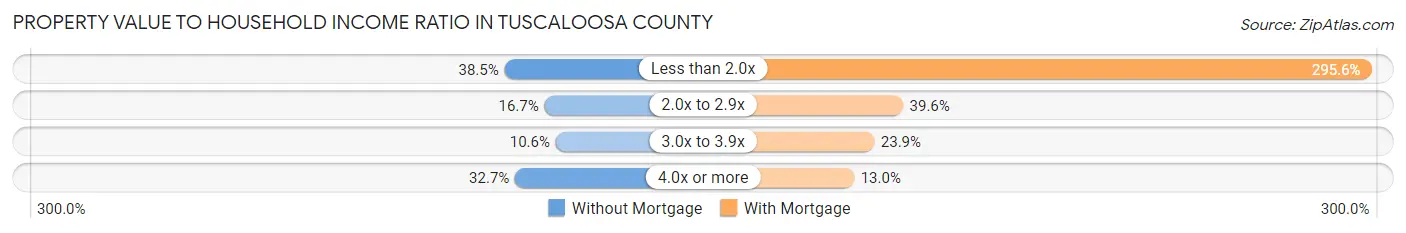
| Value-to-Income Ratio | Without Mortgage | With Mortgage |
| Less than 2.0x | 7,363 (38.5%) | 99,493 (295.6%) |
| 2.0x to 2.9x | 3,197 (16.7%) | 13,329 (39.6%) |
| 3.0x to 3.9x | 2,023 (10.6%) | 8,058 (23.9%) |
| 4.0x or more | 6,260 (32.7%) | 4,366 (13.0%) |
| Total | 19,129 (100.0%) | 33,663 (100.0%) |
Real Estate Taxes by Mortgage Status in Tuscaloosa County
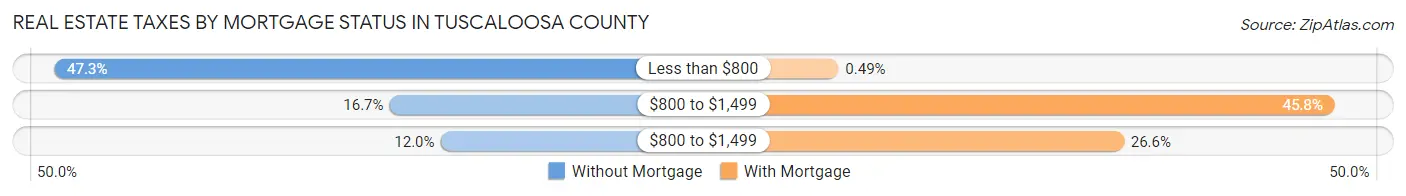
| Property Taxes | Without Mortgage | With Mortgage |
| Less than $800 | 9,050 (47.3%) | 164 (0.5%) |
| $800 to $1,499 | 3,192 (16.7%) | 15,426 (45.8%) |
| $800 to $1,499 | 2,302 (12.0%) | 8,937 (26.6%) |
| Total | 19,129 (100.0%) | 33,663 (100.0%) |
Health & Disability in Tuscaloosa County
Health Insurance Coverage by Age in Tuscaloosa County
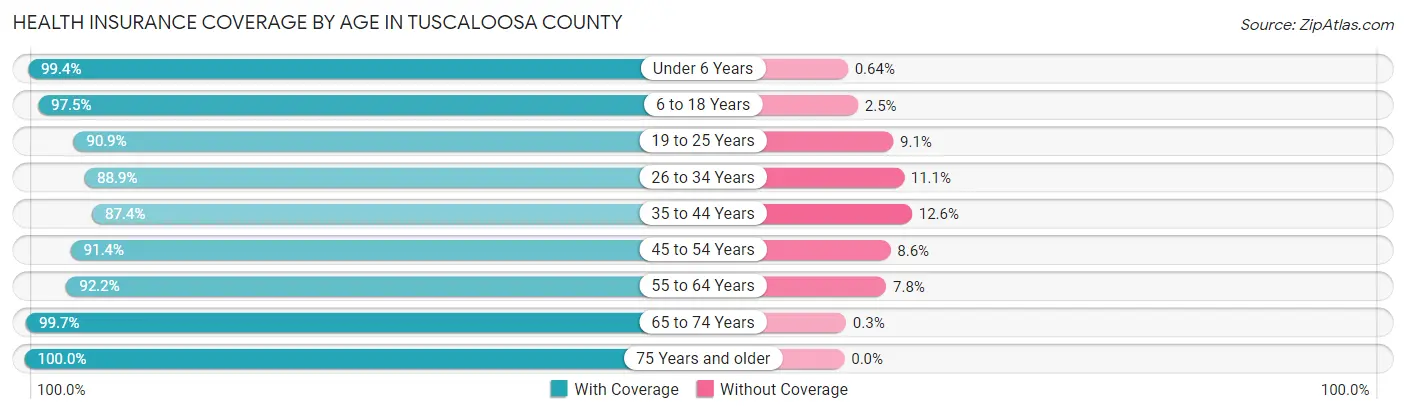
| Age Bracket | With Coverage | Without Coverage |
| Under 6 Years | 15,268 (99.4%) | 99 (0.6%) |
| 6 to 18 Years | 38,138 (97.5%) | 989 (2.5%) |
| 19 to 25 Years | 35,593 (90.9%) | 3,563 (9.1%) |
| 26 to 34 Years | 24,990 (88.9%) | 3,119 (11.1%) |
| 35 to 44 Years | 23,774 (87.4%) | 3,425 (12.6%) |
| 45 to 54 Years | 22,719 (91.4%) | 2,135 (8.6%) |
| 55 to 64 Years | 23,140 (92.2%) | 1,956 (7.8%) |
| 65 to 74 Years | 19,303 (99.7%) | 58 (0.3%) |
| 75 Years and older | 11,249 (100.0%) | 0 (0.0%) |
| Total | 214,174 (93.3%) | 15,344 (6.7%) |
Health Insurance Coverage by Citizenship Status in Tuscaloosa County
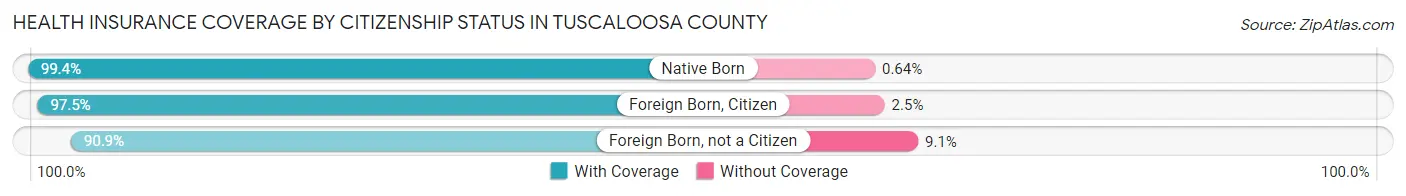
| Citizenship Status | With Coverage | Without Coverage |
| Native Born | 15,268 (99.4%) | 99 (0.6%) |
| Foreign Born, Citizen | 38,138 (97.5%) | 989 (2.5%) |
| Foreign Born, not a Citizen | 35,593 (90.9%) | 3,563 (9.1%) |
Health Insurance Coverage by Household Income in Tuscaloosa County
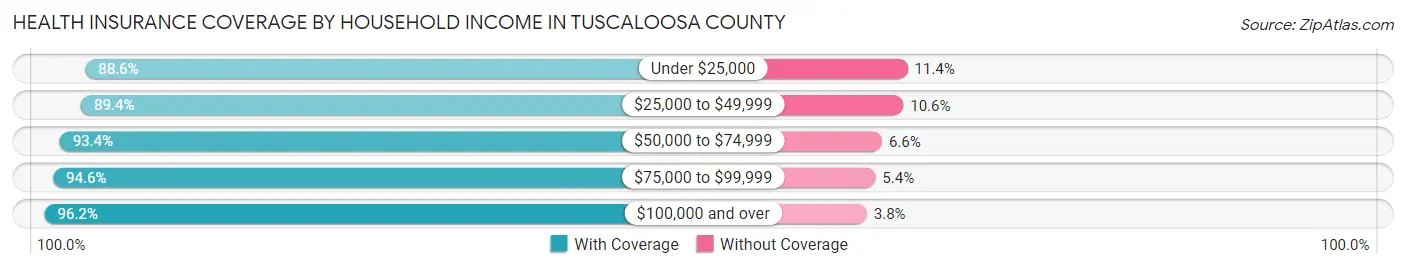
| Household Income | With Coverage | Without Coverage |
| Under $25,000 | 30,293 (88.6%) | 3,895 (11.4%) |
| $25,000 to $49,999 | 35,539 (89.4%) | 4,207 (10.6%) |
| $50,000 to $74,999 | 31,725 (93.4%) | 2,239 (6.6%) |
| $75,000 to $99,999 | 28,937 (94.6%) | 1,640 (5.4%) |
| $100,000 and over | 76,653 (96.2%) | 2,994 (3.8%) |
Public vs Private Health Insurance Coverage by Age in Tuscaloosa County
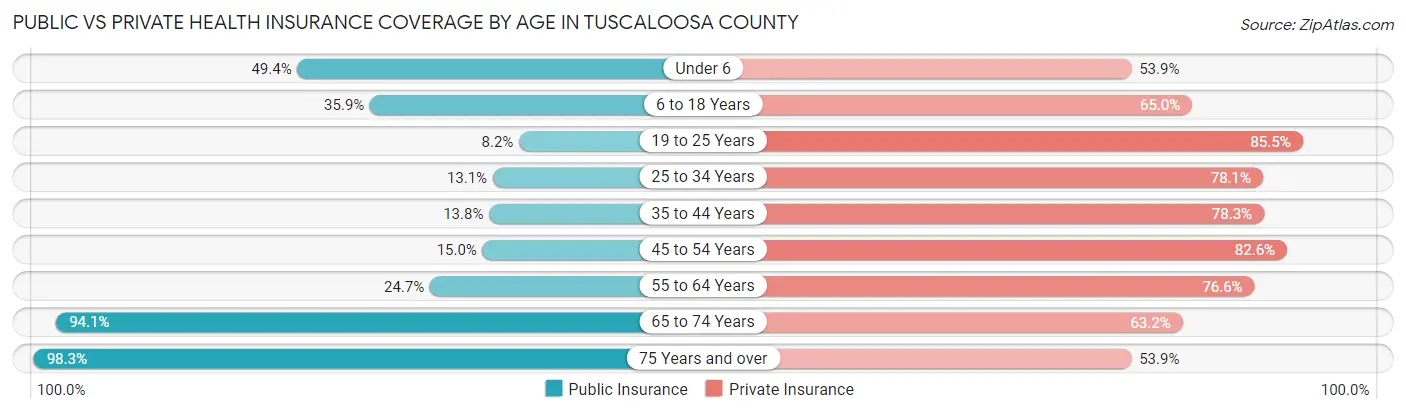
| Age Bracket | Public Insurance | Private Insurance |
| Under 6 | 7,583 (49.3%) | 8,285 (53.9%) |
| 6 to 18 Years | 14,032 (35.9%) | 25,431 (65.0%) |
| 19 to 25 Years | 3,211 (8.2%) | 33,478 (85.5%) |
| 25 to 34 Years | 3,675 (13.1%) | 21,964 (78.1%) |
| 35 to 44 Years | 3,742 (13.8%) | 21,307 (78.3%) |
| 45 to 54 Years | 3,721 (15.0%) | 20,531 (82.6%) |
| 55 to 64 Years | 6,208 (24.7%) | 19,222 (76.6%) |
| 65 to 74 Years | 18,225 (94.1%) | 12,241 (63.2%) |
| 75 Years and over | 11,058 (98.3%) | 6,064 (53.9%) |
| Total | 71,455 (31.1%) | 168,523 (73.4%) |
Disability Status by Sex by Age in Tuscaloosa County
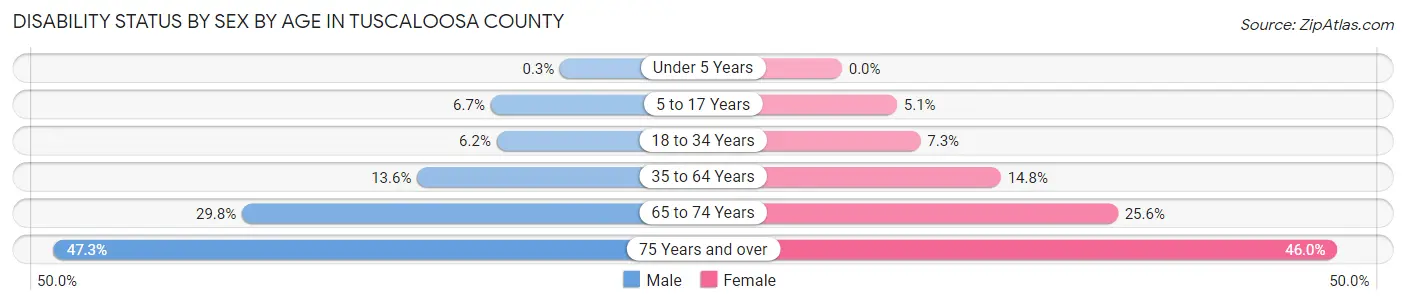
| Age Bracket | Male | Female |
| Under 5 Years | 20 (0.3%) | 0 (0.0%) |
| 5 to 17 Years | 1,175 (6.7%) | 861 (5.1%) |
| 18 to 34 Years | 2,229 (6.2%) | 2,810 (7.3%) |
| 35 to 64 Years | 5,043 (13.6%) | 5,895 (14.7%) |
| 65 to 74 Years | 2,659 (29.8%) | 2,675 (25.6%) |
| 75 Years and over | 2,076 (47.3%) | 3,154 (46.0%) |
Disability Class by Sex by Age in Tuscaloosa County
Disability Class: Hearing Difficulty
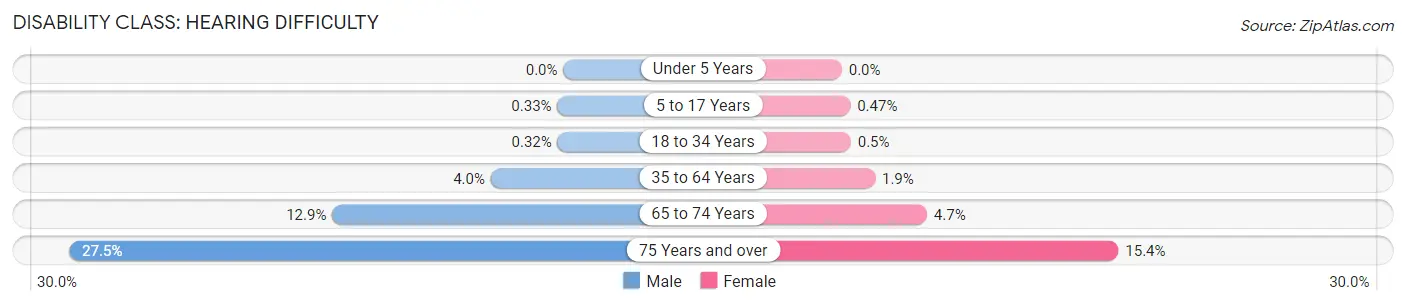
| Age Bracket | Male | Female |
| Under 5 Years | 0 (0.0%) | 0 (0.0%) |
| 5 to 17 Years | 58 (0.3%) | 80 (0.5%) |
| 18 to 34 Years | 115 (0.3%) | 192 (0.5%) |
| 35 to 64 Years | 1,501 (4.0%) | 739 (1.8%) |
| 65 to 74 Years | 1,148 (12.9%) | 495 (4.7%) |
| 75 Years and over | 1,208 (27.5%) | 1,056 (15.4%) |
Disability Class: Vision Difficulty
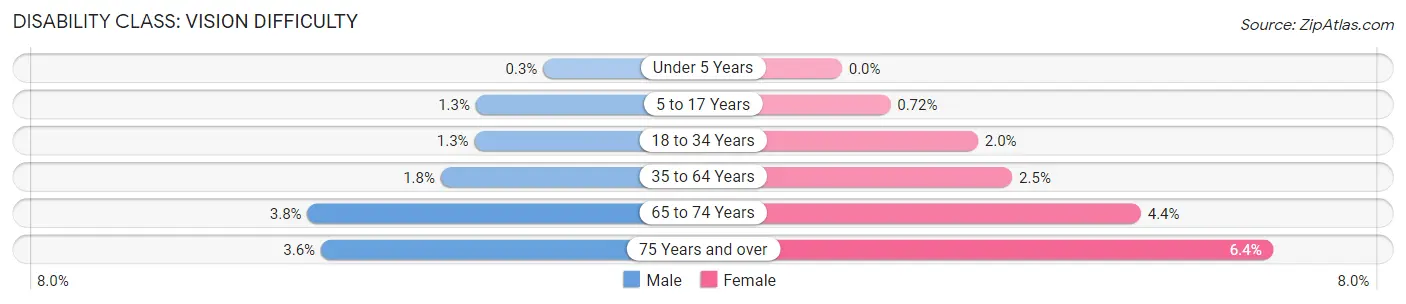
| Age Bracket | Male | Female |
| Under 5 Years | 20 (0.3%) | 0 (0.0%) |
| 5 to 17 Years | 226 (1.3%) | 122 (0.7%) |
| 18 to 34 Years | 476 (1.3%) | 779 (2.0%) |
| 35 to 64 Years | 676 (1.8%) | 1,010 (2.5%) |
| 65 to 74 Years | 339 (3.8%) | 464 (4.4%) |
| 75 Years and over | 158 (3.6%) | 440 (6.4%) |
Disability Class: Cognitive Difficulty

| Age Bracket | Male | Female |
| 5 to 17 Years | 969 (5.6%) | 658 (3.9%) |
| 18 to 34 Years | 1,488 (4.1%) | 1,691 (4.4%) |
| 35 to 64 Years | 1,865 (5.0%) | 2,305 (5.8%) |
| 65 to 74 Years | 397 (4.4%) | 535 (5.1%) |
| 75 Years and over | 502 (11.4%) | 885 (12.9%) |
Disability Class: Ambulatory Difficulty
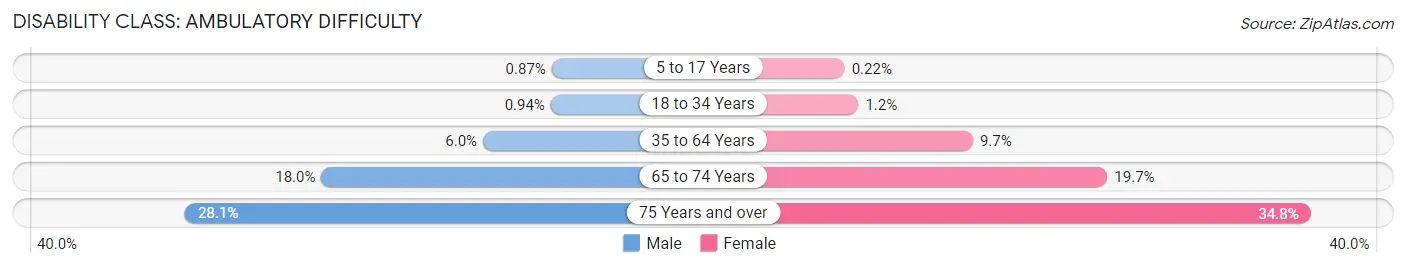
| Age Bracket | Male | Female |
| 5 to 17 Years | 151 (0.9%) | 37 (0.2%) |
| 18 to 34 Years | 338 (0.9%) | 476 (1.2%) |
| 35 to 64 Years | 2,218 (6.0%) | 3,894 (9.7%) |
| 65 to 74 Years | 1,602 (18.0%) | 2,060 (19.7%) |
| 75 Years and over | 1,233 (28.1%) | 2,387 (34.8%) |
Disability Class: Self-Care Difficulty
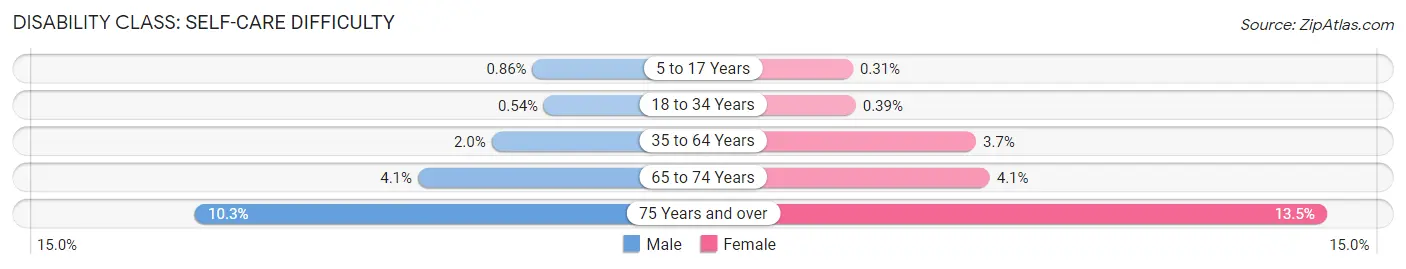
| Age Bracket | Male | Female |
| 5 to 17 Years | 150 (0.9%) | 53 (0.3%) |
| 18 to 34 Years | 196 (0.5%) | 152 (0.4%) |
| 35 to 64 Years | 745 (2.0%) | 1,493 (3.7%) |
| 65 to 74 Years | 361 (4.1%) | 430 (4.1%) |
| 75 Years and over | 450 (10.2%) | 926 (13.5%) |
Technology Access in Tuscaloosa County
Computing Device Access in Tuscaloosa County
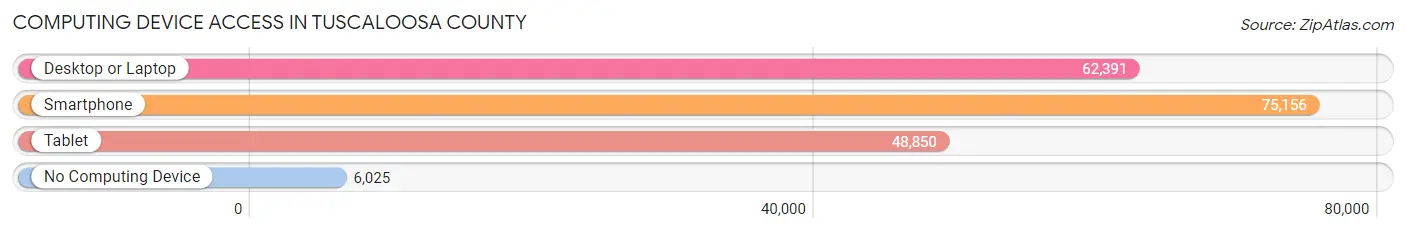
| Device Type | # Households | % Households |
| Desktop or Laptop | 62,391 | 73.6% |
| Smartphone | 75,156 | 88.7% |
| Tablet | 48,850 | 57.6% |
| No Computing Device | 6,025 | 7.1% |
| Total | 84,743 | 100.0% |
Internet Access in Tuscaloosa County
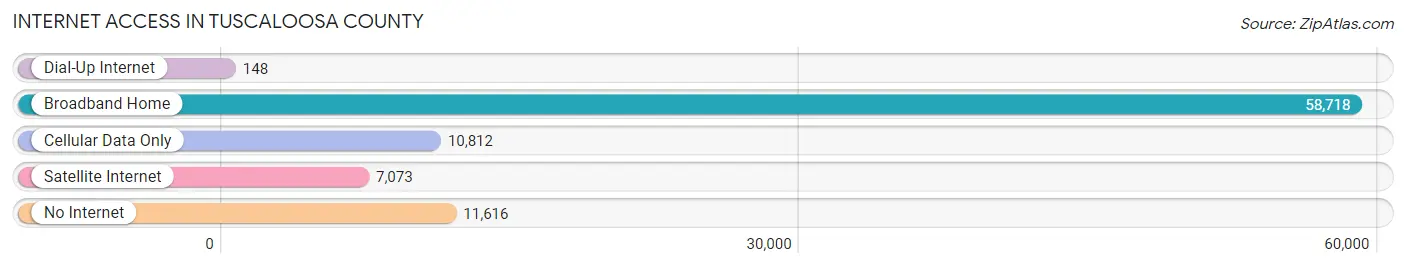
| Internet Type | # Households | % Households |
| Dial-Up Internet | 148 | 0.2% |
| Broadband Home | 58,718 | 69.3% |
| Cellular Data Only | 10,812 | 12.8% |
| Satellite Internet | 7,073 | 8.4% |
| No Internet | 11,616 | 13.7% |
| Total | 84,743 | 100.0% |
Tuscaloosa County Summary
Tuscaloosa County is located in the west-central part of the state of Alabama, in the United States. It is bordered by the counties of Fayette, Walker, Jefferson, Bibb, Hale, and Pickens. The county seat is Tuscaloosa, which is also the state’s fifth-largest city. The county has a total area of 1,351 square miles, of which 1,340 square miles is land and 11 square miles is water.
History
Tuscaloosa County was established on February 6, 1818, from lands ceded by the Choctaw Nation. It was named for the Choctaw chief Tuskaloosa, who was killed in the Battle of Burnt Corn in 1813. The county was originally part of the Mississippi Territory, and later became part of the Alabama Territory in 1817.
Tuscaloosa County was the site of several battles during the Civil War, including the Battle of Tuscaloosa in April 1865. The county was also the site of the infamous Tuskegee Syphilis Study, which ran from 1932 to 1972.
Geography
Tuscaloosa County is located in the west-central part of the state of Alabama. It is bordered by the counties of Fayette, Walker, Jefferson, Bibb, Hale, and Pickens. The county has a total area of 1,351 square miles, of which 1,340 square miles is land and 11 square miles is water.
The county is located in the Black Warrior River watershed, and is home to several rivers and creeks, including the Black Warrior, Mulberry, and Sipsey rivers. The county is also home to several lakes, including Lake Tuscaloosa, Lake Lurleen, and Lake Nicol.
The terrain of the county is mostly rolling hills, with some flat areas in the northern and eastern parts of the county. The highest point in the county is Mount Tuscaloosa, which has an elevation of 1,067 feet.
Economy
Tuscaloosa County’s economy is largely based on manufacturing, with the automotive industry being the largest employer. Other major employers include the University of Alabama, the Mercedes-Benz U.S. International plant, and the Honda Manufacturing of Alabama plant.
The county is also home to several large retail centers, including the Midtown Village shopping center, the University Mall, and the Tuscaloosa Galleria.
Demographics
As of the 2010 census, Tuscaloosa County had a population of 194,656. The racial makeup of the county was 68.3% White, 28.7% Black or African American, 0.3% Native American, 1.2% Asian, 0.1% Pacific Islander, 0.7% from other races, and 1.9% from two or more races. Hispanic or Latino of any race were 2.3% of the population.
The median income for a household in the county was $41,824, and the median income for a family was $51,817. The per capita income for the county was $21,845. About 17.2% of families and 22.2% of the population were below the poverty line, including 33.2% of those under age 18 and 11.2% of those age 65 or over.
Common Questions
What is Per Capita Income in Tuscaloosa County?
Per Capita income in Tuscaloosa County is $32,141.
What is the Median Family Income in Tuscaloosa County?
Median Family Income in Tuscaloosa County is $83,129.
What is the Median Household income in Tuscaloosa County?
Median Household Income in Tuscaloosa County is $61,645.
What is Income or Wage Gap in Tuscaloosa County?
Income or Wage Gap in Tuscaloosa County is 33.5%.
Women in Tuscaloosa County earn 66.5 cents for every dollar earned by a man.
What is Family Income Deficit in Tuscaloosa County?
Family Income Deficit in Tuscaloosa County is $10,489.
Families that are below poverty line in Tuscaloosa County earn $10,489 less on average than the poverty threshold level.
What is Inequality or Gini Index in Tuscaloosa County?
Inequality or Gini Index in Tuscaloosa County is 0.47.
What is the Total Population of Tuscaloosa County?
Total Population of Tuscaloosa County is 231,558.
What is the Total Male Population of Tuscaloosa County?
Total Male Population of Tuscaloosa County is 111,807.
What is the Total Female Population of Tuscaloosa County?
Total Female Population of Tuscaloosa County is 119,751.
What is the Ratio of Males per 100 Females in Tuscaloosa County?
There are 93.37 Males per 100 Females in Tuscaloosa County.
What is the Ratio of Females per 100 Males in Tuscaloosa County?
There are 107.11 Females per 100 Males in Tuscaloosa County.
What is the Median Population Age in Tuscaloosa County?
Median Population Age in Tuscaloosa County is 32.8 Years.
What is the Average Family Size in Tuscaloosa County
Average Family Size in Tuscaloosa County is 3.2 People.
What is the Average Household Size in Tuscaloosa County
Average Household Size in Tuscaloosa County is 2.6 People.
How Large is the Labor Force in Tuscaloosa County?
There are 116,694 People in the Labor Forcein in Tuscaloosa County.
What is the Percentage of People in the Labor Force in Tuscaloosa County?
61.6% of People are in the Labor Force in Tuscaloosa County.
What is the Unemployment Rate in Tuscaloosa County?
Unemployment Rate in Tuscaloosa County is 5.5%.